

Analysis of Modern vs. Conventional Development Technologies in Transportation—The Case Study of a Last-Mile Delivery Process


Abstract
1. Introduction
1.1. A Sense of the Study
1.2. Literature Review
- Platooning: A method of driving in which several trucks employ autonomous capabilities to follow a leading vehicle. Only under specific circumstances do the trailing truck drivers assume control.
- Human–drone platooning: A scenario that closely resembles the first, except that the trailing trucks are driverless autonomous vehicles. With autonomous capabilities that allow them to make judgments in certain situations, the trailing trucks precisely mimic the behaviors of a leading vehicle that is piloted by a person.
- Exit-to-exit autonomous trucks with remote operation: In this scenario, autonomous vehicles are remotely controlled by operation centers in challenging environments such as small cities. However, trucks employ their autonomous technology to move freight unassisted on smooth surfaces such as motorways. This situation may present several difficulties, such as a loss of connections.
- Autopilot scenario: The American Trucking Association (ATA) prefers the scenario in which a driver and a vehicle alternately handle the driving process utilizing autonomous autopilot capabilities that regulate the speed and position of a truck in its lane.
- Exit-to-exit autonomous trucks: In this scenario, level 4 fully autonomous trucks are employed in transportation on interstates or highways without drivers. Only while moving cargo to and from these autonomous vehicles in urban and rural locations do human drivers interfere.
- Facility-to-facility trucking: In this scenario, driverless autonomous trucks handle all aspects of facility-to-facility transportation. Without human assistance, trucks should be able to maneuver through small spaces.
2. Materials and Methods
- Logistics processes of delivery are investigated for a small urban area.
- The US laws and regulations are applied in the scenarios.
- Using American manufacturers of modern technologies.
- The logistics processes have the purpose of delivering 10 or 20 small packages at a time with an average weight of 1.5 kgs per package and traveling 16 km or 45 km.
- RQ1: Which of the preliminary defined optimization criteria (given in Section 3) support the most decisions related to choosing a means of transport in terms of the presented modern and conventional technologies?
- RQ2: How do the experts’ opinions influence the results of MCDA application?
3. Results
3.1. Identifying Criteria
3.2. Scoring Solutions
- Second scenario (S2)—20 package deliveries per day for one year and a distance per package of 16 km (scenario is set with double the deliveries to be satisfied at the same distance).
- Third scenario (S3)—10 package deliveries per day for one year and a distance per package of 45 km (scenario with a longer distance of delivery and the same number of packages to be delivered as in S1; in this scenario, it was decided to take into account the size of megacities, and it was proposed to consider delivering of parcels at a distance determined by the span of the currently largest megacity in the world, namely the Tokyo Megalopolis Region [79]; the distance was assumed based on [80], where a radius of Tokyo Megalopolis Region area is given as ca. 45 km).
- TCD—total cost of delivery;
- ACP—average cost per package;
- ECM—energy cost per kilometer;
- i—distance of a delivery (16 km);
- j—number of packages in a delivery (10 packages);
- k—total duration of deliveries (365 days);
- CC—capital costs;
- CE—cost of equipment;
- MC—maintenance costs per year;
- EC—economy costs.
3.3. Weighting Criteria
3.4. Combining Scores and Weights
4. Results Discussion
5. Conclusions
Author Contributions
Funding
Institutional Review Board Statement
Informed Consent Statement
Data Availability Statement
Conflicts of Interest
References
- Sarder, M.D. Logistics Transportation Systems, 1st ed.; Elsevier: Amsterdam, The Netherlands, 2020. [Google Scholar]
- Kenton, W. Logistics Definition. 2022. Available online: https://www.investopedia.com/terms/l/logistics.asp (accessed on 26 February 2022).
- Freight Transport Demand—European Environment Agency. Available online: https://www.eea.europa.eu/data-and-maps/indicators/freight-transport-demandversion-2/assessment-7 (accessed on 26 February 2022).
- Freight Transport Demand—European Environment Agency, Version 2. Available online: https://www.eea.europa.eu/data-and-maps/indicators/freight-transport-demand-version-2/assessment-5 (accessed on 26 February 2022).
- Passenger and Freight Transport Demand in Europe. Available online: https://www.eea.europa.eu/data-and-maps/indicators/passenger-and-freight-transport-demand/assessment-1 (accessed on 18 July 2022).
- Murphy, J.A. An Analysis of the Financial Crisis of 2008: Causes and Solutions. Available online: https://doi.org/10.2139/ssrn.1295344 (accessed on 26 February 2022).
- Kagermann, H.; Wahlster, W.; Helbig, J. Recommendations for Implementing the Strategic Initiative INDUSTRIE 4.0. Final Report of the Industrie 4.0 Working Group; Acatech–National Academy of Science and Engineering: Munich, Germany, 2013. [Google Scholar]
- Crawford, M. 7 Top Trends in Transportation Technology. Available online: https://www.asme.org/topics-resources/content/7-top-trends-in-transportation-technology (accessed on 18 July 2022).
- Anderson, J.M.; Kalra, N.; Stanley, K.D.; Sorensen, P.; Samaras, C.; Oluwatola, T.A. Autonomous Vehicle Technology: A Guide for Policymakers; RAND Corporation: Santa Monica, CA, USA, 2016. [Google Scholar] [CrossRef]
- Bagloee, S.; Tavana, M.; Asadi, M.; Oliver, T. Autonomous Vehicles: Challenges, Opportunities and Future Implications for Transportation Policies. J. Mod. Transp. 2016, 24, 284–303. [Google Scholar] [CrossRef]
- Simpson, J.R.; Mishra, S.; Talebian, A.; Golias, M.M. An estimation of the future adoption rate of autonomous trucks by freight organizations. Res. Transp. Econ. 2019, 76, 100737. [Google Scholar] [CrossRef]
- Chottani, A.; Hastings, G.; Murnane, J.; Neuhaus, F. Distraction or Disruption? Autonomous Trucks Gain Ground in US Logistics. Available online: https://pavecampaign.org/distraction-or-disruption-autonomous-trucks-gain-ground-in-us-logistics-pdf/ (accessed on 18 July 2022).
- Viscelli, S. Driverless? Autonomous Trucks and the Future of the American Trucker. Available online: http://driverlessreport.org (accessed on 18 July 2022).
- Gujarathi, A.; Kulkarni, A.; Patil, U.; Phalak, Y.; Deotalu, R.; Jain, A.; Panchi, N.; Dhabale, A.; Chiddarwar, S. Design and Development of Autonomous Delivery Robot. Bachelor’s Thesis, Visvesvaraya National Institute of Technology, Nagpur, India, 2020. [Google Scholar] [CrossRef]
- Flämig, H. Autonomous Vehicles and Autonomous Driving in Freight Transport. In Autonomous Driving; Maurer, M., Gerdes, J., Lenz, B., Winner, H., Eds.; Springer: Berlin/Heidelberg, Germany, 2016. [Google Scholar] [CrossRef]
- Jennings, D.; Figliozzi, M. Study of Road Autonomous Delivery Robots and Their Potential Effects on Freight Efficiency and Travel. Transp. Res. Rec. 2020, 2674, 1019–1029. [Google Scholar] [CrossRef]
- Nier, R.D.J.; Wahab, S.N.; Daud, D. A Qualitative Case Study on the Use of Drone Technology for Stock Take Activity in a Third-Party Logistics Firm in Malaysia. IOP Conf. Ser. Mater. Sci. Eng. 2020, 780, 062014. [Google Scholar] [CrossRef]
- Fernández-Caramés, T.M.; Blanco-Novoa, O.; Froiz-Míguez, I.; Fraga-Lamas, P. Towards an Autonomous Industry 4.0 Warehouse: A UAV and Blockchain-Based System for Inventory and Traceability Applications in Big Data-Driven Supply Chain Management. Sensors 2019, 19, 2394. [Google Scholar] [CrossRef]
- Wawrla, L.; Maghazei, O.; Netland, T. Applications of Drones in Warehouse Operations; Whitepaper; ETH Zurich, D-MTEC, Chair of Production and Operations Management: Zurich, Switzerland, 2019. [Google Scholar]
- Sullivan, J. The Future of Drones in the Supply Chain. Kuebix TMS Software. 2021. Available online: https://www.kuebix.com/the-future-of-drones-in-the-supply-chain/ (accessed on 18 July 2022).
- Aurambout, J.P.; Gkoumas, K.; Ciuffo, B. Last mile delivery by drones: An estimation of viable market potential and access to citizens across European cities. Eur. Transp. Res. Rev. 2019, 11, 30. [Google Scholar] [CrossRef]
- Moadab, A.; Farajzadeh, F.; Fatahi Valilai, O. Drone routing problem model for last-mile delivery using the public transportation capacity as moving charging stations. Sci. Rep. 2022, 12, 636. [Google Scholar] [CrossRef]
- Schmidt, S. Drones for Last Mile Parcel Delivery: Investigating Consumer Acceptance in Germany. Master’s Thesis, Maastricht University, School of Business and Economics, Venlo, The Netherlands, 2021. [Google Scholar]
- Borghetti, F.; Caballini, C.; Carboni, A.; Grossato, G.; Maja, R.; Barabino, B. The Use of Drones for Last-Mile Delivery: A Numerical Case Study in Milan, Italy. Sustainability 2022, 14, 1766. [Google Scholar] [CrossRef]
- Müller, S.; Rudolph, C.; Janke, C. Drones for last mile logistics: Baloney or part of the solution? Transp. Res. Procedia 2019, 41, 73–87. [Google Scholar] [CrossRef]
- Zubin, I.; van Arem, B.; Wiegmans, B.; van Duin, R. Using drones in the last-mile logistics processes of medical product delivery: A feasibility case study in Rotterdam. In Proceedings of the 99th Annual Meeting TRB, Washington, DC, USA, 12–16 January 2020; Transportation Research Board: Washington, DC, USA, 2022; pp. 1–17. [Google Scholar]
- Lee, C.W.; Wong, W.P. Last-mile drone delivery combinatorial double auction model using multi-objective evolutionary algorithms. Soft Comput. 2022, 26, 12355–12384. [Google Scholar] [CrossRef]
- Cvitanic, D. Drone applications in transportation. In Proceedings of the 5th International Conference on Smart and Sustainable Technologies, SpliTech 2020, Split, Croatia, 23–26 September 2020; pp. 1–4. [Google Scholar] [CrossRef]
- Mokter, H. Autonomous Drones: A Game Changer in Lightweight Delivery Services. Calif. Manag. Rev. 2020. Available online: https://cmr.berkeley.edu/2022/03/autonomous-drones-a-game-changer-in-lightweight-delivery-services/ (accessed on 21 July 2022).
- Chen, T.; Shan, J.; Liu, H.H.T. Cooperative Transportation of a Flexible Payload Using Two Quadrotors. J. Guid. Control. Dyn. 2021, 44, 2099–2107. [Google Scholar] [CrossRef]
- Baldisseri, A.; Siragusa, C.; Seghezzi, A.; Mangiaracina, R.; Tumino, A. Truck-based drone delivery system: An economic and environmental assessment. Transp. Res. Part D Transp. Environ. 2022, 107, 103296. [Google Scholar] [CrossRef]
- Pedersen Aasen, K.C. Developing a Vans-and-Drones System for Last-Mile Delivery. Master’s Thesis, The Arctic University of Norway, Department of Industrial Engineering, Tromsø, Norway, 2021. [Google Scholar]
- Choi, Y.; Schonfeld, P.M. A comparison of optimized deliveries by drone and truck. Transp. Plan. Technol. 2021, 44, 319–336. [Google Scholar] [CrossRef]
- Huang, H.; Savkin, A.V.; Huang, C. Scheduling of a Parcel Delivery System Consisting of an Aerial Drone Interacting with Public Transportation Vehicles. Sensors 2020, 20, 2045. [Google Scholar] [CrossRef]
- Murray, C.C.; Chu, A.G. The flying sidekick traveling salesman problem: Optimization of drone-assisted parcel delivery. Transp. Res. Part C Emerg. Technol. 2015, 54, 86–109. [Google Scholar] [CrossRef]
- Curnlander, J.C.; Gilboa-Amir, A.; Kisser, L.M.; Robert Arthur Koch, R.A.; Welsh, R.D. Multi-Level Fulfilment Center for Unmanned Aerial Vehicles. Patent US20170175413A1, 3 November 2017. Available online: https://patents.google.com/patent/US20170175413A1/en (accessed on 21 July 2022).
- Wang, Z.; Chen, C.-H.; Zheng, P.; Li, X.; Khoo, L.P. A novel data-driven graph-based requirement elicitation framework in the smart product-service system context. Adv. Eng. Inform. 2019, 42, 100983. [Google Scholar] [CrossRef]
- Lee, Y.; Jeong, J. Design and Implementation of Monitoring System Architecture for Smart Bicycle Platform. Procedia Comput. Sci. 2018, 134, 464–469. [Google Scholar] [CrossRef]
- Kapousizis, G.; Ulak, M.B.; Geurs, K.; Havinga, P.J.M. A review of state-of-the-art bicycle technologies affecting cycling safety: Level of smartness and technology readiness. Transp. Rev. 2022, 1–23. [Google Scholar] [CrossRef]
- Chen, L.-W.; Cho, C.-Y. BiLight: A Smart Bicycle Monitoring and Finding System for Rider Safety Based on IoT Technologies. In Proceedings of the 2022 IEEE International Conference on Pervasive Computing and Communications Workshops and other Affiliated Events (PerCom Workshops), Pisa, Italy, 21–25 March 2022; pp. 100–102. [Google Scholar]
- Melo, S.; Baptista, P. Evaluating the impacts of using cargo cycles on urban logistics: Integrating traffic, environmental and operational boundaries. Eur. Transp. Res. Rev. 2017, 9, 30. [Google Scholar] [CrossRef]
- Pei, J.; Deng, L.; Song, S.; Zhao, M.; Zhang, Y.; Wu, S.; Wang, H.; Zou, Z.; Wu, Z.; He, W.; et al. Towards artificial general intelligence with hybrid Tianjic chip architecture. Nature 2019, 572, 106–124. [Google Scholar] [CrossRef] [PubMed]
- Llorca, C.; Moeckel, R. Assesment of the potential of cargo bikes and electrification for last-mile parcel delivery by means of simulation of urban freight flows. Eur. Transp. Res. Rev. 2021, 13, 1–14. [Google Scholar] [CrossRef]
- Ranaiefar, F.; Monteiro, H.; Smith, D.; Hayes, J.; Contreras, S.D. Freight Autonomous Vehicle Deployment Scenarios and Preliminary Implications for Public Agency Autonomous Vehicle Planning. In Proceedings of the Transportation Research Board 100th Annual Meeting, Washington, DC, USA, 5–29 January 2021; Transportation Research Board: Washington, DC, USA, 2021. TRBAM-21-02480. [Google Scholar]
- Lemardelé, C.; Estrada, M.; Pagès, L.; Bachofner, M. Potentialities of drones and ground autonomous delivery devices for last-mile logistics. Transp. Res. Part E Logist. Transp. Rev. 2021, 149, 102325. [Google Scholar] [CrossRef]
- The Evolving Relationship between Drones, Mobile Robots, Autonomous Vehicles and Logistics. Available online: https://www.globaltrademag.com/the-evolving-relationship-between-drones-mobile-robots-autonomous-vehicles-and-logistics/ (accessed on 18 July 2022).
- Afrianto, I.; Khumaidi, A.; Adriyendi, A. Model of Autonomous Unmanned On-Road and Aerial Vehicle Carriers for Precision Agricultural Transport 4.0: A Literature Review. IOP Conf. Ser. Mater. Sci. Eng. 2020, 879, 012019. [Google Scholar] [CrossRef]
- Multi-Criteria Analysis: A Manual. Department for Communities and Local Government: London, UK. 2009. Available online: https://eprints.lse.ac.uk/12761/1/Multi-criteria_Analysis.pdf (accessed on 18 January 2022).
- Jędrzejczak, Z.; Kukuła, K.; Skrzypek, J.; Walkosz, A. Badania Operacyjne w Przykładach i Zadaniach (Operational Research in Examples and Tasks), 7th ed.; PWN: Warsaw, Poland, 2016. [Google Scholar]
- Belton, V.; Stewart, T.J. Multiple Criteria Decision Analysis: An Integrated Approach; Springer: New York, NY, USA, 2002. [Google Scholar] [CrossRef]
- Pham, T.N.; Tran, P.P.; Le, M.-H.; Vo, H.N.; Pham, C.D.; Nguyen, H.-D. The Effects of ESG Combined Score on Business Performance of Enterprises in the Transportation Industry. Sustainability 2022, 14, 8354. [Google Scholar] [CrossRef]
- Kamali Saraji, M.; Streimikiene, D.; Kyriakopoulos, G.L. Fermatean Fuzzy CRITIC-COPRAS Method for Evaluating the Challenges to Industry 4.0 Adoption for a Sustainable Digital Transformation. Sustainability 2021, 13, 9577. [Google Scholar] [CrossRef]
- Ozdemir, Y.S. A Spherical Fuzzy Multi-Criteria Decision-Making Model for Industry 4.0 Performance Measurement. Axioms 2022, 11, 325. [Google Scholar] [CrossRef]
- Arnal, Á.J.; Díaz-Ramírez, M.; Acevedo, L.; Ferreira, V.J.; García-Armingol, T.; López-Sabirón, A.M.; Ferreira, G. Multicriteria Analysis for Retrofitting of Natural Gas Melting and Heating Furnaces for Sustainable Manufacturing and Industry 4.0. J. Energy Resour. Technol. 2020, 142, 022203. [Google Scholar] [CrossRef]
- Rao, R.; Rajesh, T. Software Selection in Manufacturing Industries Using a Fuzzy Multiple Criteria Decision Making Method, PROMETHEE. Intell. Inf. Manag. 2009, 1, 159–165. [Google Scholar] [CrossRef]
- van der Heijden, K.; Bradfield, R.; Burt, G.; Cairns, G.; Wright, G. The Sixth Sense: Accelerating Organizational Learning with Scenarios; John Wiley & Sons: Hoboken, NJ, USA, 2009. [Google Scholar]
- Worthington, W.J.; Collins, J.D.; Hitt, M.A. Beyond risk mitigation: Enhancing corporate innovation with scenario planning. Bus. Horiz. 2009, 52, 441–450. [Google Scholar] [CrossRef]
- Halldórsson, Á.; Wehner, J. Last-mile logistics fulfilment: A framework for energy efficiency. Res. Transp. Bus. Manag. 2020, 37, 100481. [Google Scholar] [CrossRef]
- Bosona, T. Urban Freight Last Mile Logistics—Challenges and Opportunities to Improve Sustainability: A Literature Review. Sustainability 2020, 12, 8769. [Google Scholar] [CrossRef]
- Lauenstein, S.; Schank, C. Design of a Sustainable Last Mile in Urban Logistics—A Systematic Literature Review. Sustainability 2022, 14, 5501. [Google Scholar] [CrossRef]
- Odu, G.O. Weighting methods for multi-criteria decision making technique. J. Appl. Sci. Environ. Manag. 2019, 23, 1449. [Google Scholar] [CrossRef]
- Joshi, A.; Kale, S.; Chandel, S.; Pal, D. Likert Scale: Explored and Explained. Br. J. Appl. Sci. Technol. 2015, 7, 396–403. [Google Scholar] [CrossRef]
- Gkoumas, K.; van Balen, M.; Tsakalidis, A.; Pekar, F. Evaluating the development of transport technologies in European research and innovation projects between 2007 and 2020. Res. Transp. Econ. 2022, 92, 101113. [Google Scholar] [CrossRef]
- Premsagar, S.; Kenworthy, J. A Critical Review of Hyperloop (Ultra-High Speed Rail) Technology: Urban and Transport Planning, Technical, Environmental, Economic, and Human Considerations. Front. Sustain. Cities 2022, 4, 842245. [Google Scholar] [CrossRef]
- Malevich, Y.V.; Plastunyak, I.A.; Aitova, K.A. Current issues of development of modern transport-logistics and customs technologies in the conditions of economic integration. In Proceedings of the ACM International Conference Proceeding Series, 3rd International Scientific and Practical Conference, DEFIN 2020, Saint Petersburg, Russia, 19–20 March 2020; p. 160416. [Google Scholar] [CrossRef]
- Xiao, S.L.; Sun, Y.; Shi, S.Q. Study on modern logistics cost management. In Proceedings of the 16th International Conference on Industrial Engineering and Engineering Management, Beijing, China, 21–23 October 2009; Curran Associates, Inc.: Red Hook, NY, USA, 2010; pp. 514–518. [Google Scholar] [CrossRef]
- Chen, C.; Demir, E.; Huang, Y.; Qiu, R. The adoption of self-driving delivery robots in last mile logistics. Transp. Res. Part E: Logist. Transp. Rev. 2021, 146, 102214. [Google Scholar] [CrossRef]
- Thornton, S.; Gallasch, G.E. Swarming logistics for tactical last-mile delivery. In Proceedings of the International Conference on Science and Innovation for Land Power 2018 (ICSILP 2018), Adelaide, SA, USA, 5–6 September 2018; Available online: https://www.dst.defence.gov.au/sites/default/files/basic_pages/documents/ICSILP18_IntSes-Thornton_Gallasch-Swarming_Logistics_for_Last-Mile_Logistics.pdf (accessed on 21 July 2022).
- Tucker, M.; Polikakhina, C.; Lyon, P.; Figliozzi, F.A. Drone Deliveries Logistics, Efficiency, Safety and Last Mile Trade-offs Last Mile Trade-offs, Efficiency, Safety and Last Mile Trade-offs. In Proceedings of the 7th International Conference on Information Systems, Logistics and Supply Chain, ILS Conference, Lyon, France, 8–11 July 2018; Available online: http://web.cecs.pdx.edu/~maf/Conference_Proceedings/2018_Drone_Deliveries_Logistics_Efficiency_Safety_Last_Mile_Trade-offs.pdf (accessed on 21 July 2022).
- Elsayed, M.; Mohamed, M. The impact of airspace regulations on unmanned aerial vehicles in last-mile operation. Transp. Res. Part D Transp. Environ. 2020, 87, 102480. [Google Scholar] [CrossRef]
- Clarke, R.; Moses, L.B. The regulation of civilian drones’ impacts on public safety. Comput. Law Secur. Rev. 2014, 30, 263–285. [Google Scholar] [CrossRef]
- Li, B.; Liu, S.; Tang, J.; Gaudiot, J.-L.; Zhang, L.; Kong, Q. Autonomous Last-Mile Delivery Vehicles in Complex Traffic Environments. Computer 2020, 53, 26–35. [Google Scholar] [CrossRef]
- Pia, P. Safety of a logistics chain: A case-study. Logist. Res. 2010, 2, 159–163. [Google Scholar] [CrossRef]
- Figliozzi, M.; Jennings, D. Autonomous delivery robots and their potential impacts on urban freight energy consumption and emissions. Transp. Res. Procedia 2020, 46, 21–28. [Google Scholar] [CrossRef]
- Last-Mile Emissions Set to Climb by 30 Percent-Inside Logistics. 2021. Available online: https://www.insidelogistics.ca/features/last-mile-emissions-set-to-climb-by-30-percent/ (accessed on 21 July 2022).
- The Environmental Challenges of Last-Mile Delivery. 2021. Available online: https://www.techtarget.com/searcherp/feature/The-environmental-challenges-of-last-mile-delivery (accessed on 21 July 2022).
- Figliozzi, M.A. Lifecycle modeling and assessment of unmanned aerial vehicles (Drones) CO2e emissions. Transp. Res. Part D Transp. Environ. 2017, 57, 251–261. [Google Scholar] [CrossRef]
- Hema Latha, K. Design and Development of Solar Powered Vehicle. Int. J. Eng. Res. Technol. 2019, 8, 608–615. [Google Scholar] [CrossRef]
- Megacity. 2022. Available online: https://www.designingbuildings.co.uk/wiki/Megacity (accessed on 1 December 2022).
- Tokyo–Distances. Available online: https://upload.wikimedia.org/wikipedia/commons/2/21/Tokyo-distances.jpg (accessed on 1 December 2022).
- Abdelatty, Y. Analysis of Modern Technologies Development in Transportation and Logistics. Master’s Thesis, Faculty of Transport, Warsaw University of Technology, Warsaw, Poland, 2022. [Google Scholar]
- O’Brien, R.; Bair, E.F.; Venkataramani, A.S. Death by Robots? Automation and Working-Age Mortality in the United States. Demography 2022, 59, 607–628. [Google Scholar] [CrossRef]
- Sumagaysay, L. Nuro’s Self-Driving Delivery Offers Contactless Groceries-Protocol. 2020. Available online: https://www.protocol.com/dave-ferguson-nuro-coronavirus-interview (accessed on 21 July 2022).
- Figliozzi, M.A. Carbon emissions reductions in last mile and grocery deliveries utilizing air and ground autonomous vehicles. Transp. Research. Part D Transp. Environ. 2020, 85, 102443. [Google Scholar] [CrossRef]
- National Highway Traffic Safety Administration. Available online: https://www.nhtsa.gov/ (accessed on 19 July 2022).
- Hoffmann, T.; Prause, G. On the Regulatory Framework for Last-Mile Delivery Robots. Machines 2018, 6, 33. [Google Scholar] [CrossRef]
- Udelv. Available online: https://udelv.com (accessed on 19 July 2022).
- Holdway, A.; Williams, A.; Inderwildi, O.; King, S. Indirect emissions from electric vehicles: Emissions from electricity generation. Energy Environ. Sci. 2010, 3, 1825–1832. [Google Scholar] [CrossRef]
- Nuro. Available online: https://www.nuro.ai/vehicle (accessed on 19 July 2022).
- Sudbury, A.W.; Hutchinson, E.B. A cost analysis of amazon prime air (drone delivery). J. Econ. Educ. 2016, 16, 1–12. [Google Scholar]
- Orozco, J.C. Analysis of Energy Efficiency in Truck-Drone “Last Mile” Delivery Systems. Master’s Thesis, Purdue University Graduate School, West Lafayette, IN, USA, 2019. [Google Scholar] [CrossRef]
- Federal Aviation Authority. Available online: https://www.faa.gov/ (accessed on 19 July 2022).
- Wing. Available online: https://www.wing.com/ (accessed on 19 July 2022).
- Alkouz, B.; Shahzaad, B.; Bouguettaya, A. Service-Based Drone Delivery. In Proceedings of the 2021 IEEE 7th International Conference on Collaboration and Internet Computing (CIC), Virtual, 13–15 December 2021; pp. 68–76. [Google Scholar] [CrossRef]
- UPS Truck Accident Lawyer-Pascoe Law Firm. Available online: https://www.johndpascoe.com/ups-truck-accident/ (accessed on 24 March 2022).
- OptimoRoute. Last Mile Delivery: Costs, Definition & How to Optimize. 2021. Available online: https://optimoroute.com/last-mile-delivery/ (accessed on 24 March 2022).
- Fleet GPS Telematics Tracking. What is the Most Fuel Efficient Cargo Van? 2020. Available online: https://momentumiot.com/what-is-the-most-fuel-efficient-cargo-van/ (accessed on 21 July 2022).
- Birren, J. 12 Best Work Cargo Vans [w/Comparison Table–2021 Edition]. 2021. Available online: https://www.merchantsfleet.com/industry-insights/best-cargo-vans-for-business/ (accessed on 21 July 2022).
- FedEx. Same Day City Delivery Service Near Me. Available online: https://www.fedex.com/en-us/shipping/same-day/city.html (accessed on 24 March 2022).
- Ritchie, H. Cars, Planes, Trains: Where Do CO2 Emissions from Transport Come from? Our World in Data: 2020. Available online: https://ourworldindata.org/co2-emissions-from-transport (accessed on 21 July 2022).
- Vansdirect. The 5 Best Large Vans for Payload. 2021. Available online: https://www.vansdirect.co.uk/5-best-large-vans-payload/ (accessed on 21 July 2022).
- National Highway Traffic Safety Administration. Bicycle Safety. Available online: https://www.nhtsa.gov/book/countermeasures/countermeasures-work/bicycle-safety (accessed on 13 October 2022).
- von Sawitzky, T.; Grauschopf, T.; Riener, A. “Attention! A Door Could Open.”—Introducing Awareness Messages for Cyclists to Safely Evade Potential Hazards. Multimodal Technol. Interact. 2022, 6, 3. [Google Scholar] [CrossRef]
- Santhanakrishnan, N.; Constantinos, A. 2022. Electric cargo cycles–A comprehensive review. Transp. Policy 2022, 116, 278–303. [Google Scholar] [CrossRef]
- Jeon, W.; Xie, Z.; Craig, C.; Achtemeier, J.; Alexander, L.; Morris, N.; Donath, M.; Rajamani, R. A Smart Bicycle That Protects Itself: Active Sensing and Estimation for Car-Bicycle Collision Prevention. IEEE Control. Syst. 2021, 41, 9438011. [Google Scholar] [CrossRef]
- eBikesHQ. Available online: https://ebikeshq.com/cost-of-an-ebike/ (accessed on 12 October 2022).
- Evtimov, I.; Ivanov, R.; Staneva, G.; Kadikyanov, G. A study on electric bicycle energy efficiency. Transp. Probl. 2015, 10, 131–140. [Google Scholar] [CrossRef]
- Aiello, G.; Quaranta, S.; Certa, A.; Inguanta, R. Optimization of Urban Delivery Systems Based on Electric Assisted Cargo Bikes with Modular Battery Size, Taking into Account the Service Requirements and the Specific Operational Context. Energies 2021, 14, 4672. [Google Scholar] [CrossRef]
- Johnson, G. How Much Does an Electric Bike Cost? Available online: https://biketoworkday.us/electric-bike-cost/ (accessed on 13 October 2022).
- eBike Generation. Ebike Maintenance 101: From Brakes to Costs. Available online: https://ebikegeneration.com/blogs/news/ebike-maintenance-101-from-brakes-to-costs#:~:text=On%20average%2C%20eBike%20owners%20spend,lot%20of%20the%20work%20yourself (accessed on 13 October 2022).
- Wood, J.; Hamidi, S. Regulating the Ride: Lessons on the Evolution of Dockless Bikeshare Policy in American Cities; Center for Transportation, Equity, Decisions and Dollars (CTEDD): Arlington, TX, USA. Available online: https://rosap.ntl.bts.gov/view/dot/54007/dot_54007_DS1.pdf (accessed on 12 October 2022).
- Pembina Institute for Appropriate Development. Cargo e-Bikes for Urban Deliveries-Regulatory Approaches and Standards-Mark Stout; Pembina Institute: Canada, 2021; Available online: https://policycommons.net/artifacts/2125837/cargo-e-bikes-for-urban-deliveries/2881135/ (accessed on 14 October 2022).
- Available online: https://www.bikelockwiki.com/average-cycling-speed/ (accessed on 12 October 2022).
- Toll, M. 2021. Available online: https://electrek.co/2021/08/13/electric-cargo-bikes-faster-at-deliveries-than-delivery-vans/ (accessed on 12 October 2022).
- Philips, I.; Anable, J.; Chatterton, T. E-bikes and their capability to reduce car CO2 emissions. Transp. Policy 2022, 116, 11–23. [Google Scholar] [CrossRef]
- Vasiutina, H.; Szarata, A.; Rybicki, S. Evaluating the Environmental Impact of Using Cargo Bikes in Cities: A Comprehensive Review of Existing Approaches. Energies 2021, 14, 6462. [Google Scholar] [CrossRef]
- Bikes at Work. How Much Weight Can a Bicycle Carry. Available online: https://www.bikesatwork.com/blog/how-much-weight-can-a-bicycle-carry (accessed on 13 October 2022).
- Pursuit, E. Do Bicycles Have a Weight Limit? (And How Much?). Available online: https://ebikepursuits.com/do-bicycles-have-a-weight-limit/ (accessed on 13 October 2022).
- KBO. Available online: https://kbobike.com/products/electric-cargo-bike-ranger-2 (accessed on 13 October 2022).
- Makarova, I.; Pashkevichb, A.; Shubenkovaa, K.; Mukhametdinova, E. Ways to Increase Population Mobility through the Transition to Sustainable Transport. Procedia Eng. 2017, 187, 756–762. [Google Scholar] [CrossRef]
- Makarova, I.; Buyvol, P.; Shubenkova, K.; Tsybunov, E.; Boyko, A. Development of Intelligent Smart Bicycle Control System. In Proceedings of the 2018 IEEE East-West Design and Test Symposium, EWDTS 2018, Kazan, Russia, 14–17 September 2018; p. 8524649. [Google Scholar] [CrossRef]


| Symbol | Criteria | Sub-Criteria | Aim |
|---|---|---|---|
| K1 | Safety | - | Maximize |
| K2 | Economy | Capital costs/spending | Minimize |
| Average delivery | |||
| Energy costs | |||
| K3 | Laws and Regulations | - | Maximize |
| K4 | Time for Delivery | - | Minimize |
| K5 | Environment | - | Maximize |
| K6 | Payload | - | Maximize |
| Criteria | Score | Description | References | |
|---|---|---|---|---|
| K1 | Safety | 3 (scale 1 to 5) | Low weight means fewer dangerous accidents. Robots operate at low speeds. Avoids human error. Reduces death due to crashes by 60%. | [81,82] |
| K2 | Economy | USD 28,995 S2: USD 53,523 S3: USD 33,466 | Average cost per pack, ACP = USD 5.950 Energy per kilometer, ECM = USD 0.035 Average cost of RADR, CE = USD 5000 Maintenance, MC = USD 1000 | [16,83,84] |
| K3 | Laws and Regulations | 3 (scale 1 to 5) | National Highway Traffic Safety Administration (NHTSA) updates regulations in USA. High insurance costs are imposed. | [62,85], S2: [86] |
| K4 | Time | 15.00 min S2: 16.50 min S3: 45.75 min | The speed of delivery depends on the distance and traffic; this is an average by a manufacturer. | [87], S2: [16] |
| K5 | Environment | 4 (Scale 1 to 5) | RADRs have low emissions; however, generating electricity emits greenhouse gases and harmful elements, whose emissions can be calculated according to the source of generating electricity. | [88], S2: [16] |
| K6 | Payload | 215.5 kg | Average payload | [89] |
| Criteria | Score | Description | References | |
|---|---|---|---|---|
| K1 | Safety | 4 (scale 1 to 5) | High-end technology for sensing and avoiding obstacles. Safety precaution systems by some manufacturers, such as releasing threads and deploying parachutes in case of falling. The drones still pose risks of falling on pedestrians and causing injuries. | [81] |
| K2 | Economy | USD 7442 S2: USD 11,160 S3: USD 8247 | Average cost per pack, ACP =USD 0.8800 Energy per kilometer, ECM = USD 0.0063 Average cost of drone, CE = USD 2000 Maintenance, MC = USD 2000 | [90,91] |
| K3 | Laws and Regulations | 2 (scale 1 to 5) | Federal Aviation Authority (FAA) started allowing for the testing of drones under certain conditions such as specific altitudes and areas. To be certified in some states of the USA, licensed pilots should be included in the operations. | [90,92], |
| K4 | Time | 15 min S2: less than 30 min S3: 85 min | Speed of delivery depends on the distance and flying time; this is an average by manufacturers. | [90,93], S2: [94] |
| K5 | Environment | 4 (scale 1 to 5) | Drones have low emissions; however, generating electricity emits greenhouse gases and harmful elements, whose emissions can be calculated according to the source of generating electricity. | [89], S2: [94] |
| K6 | Payload | 2.27 kg | Average payload. | [90] |
| Criteria | Score | Description | References | |
|---|---|---|---|---|
| K1 | Safety | 2 (scale 1 to 5) | Since 2016, there have been 2180 crashes caused by one delivery service. Delivery vans and trucks are heavy, and their incidents are fatal. Moreover, they lack safety features and technology. | [95] |
| K2 | Economy | USD 73,292 S2: USD 156,320 S3: USD 127,777 | Average cost per pack, ACP = USD 8.08 Energy per kilometer, ECM = USD 0.02 Average cost of van, CE = USD 30,000 Maintenance, MC = USD 65,000 | [96,97,98] |
| K3 | Laws and Regulations | 5 (scale 1 to 5) | Laws and regulations are already developed and updated for conventional vehicles. | [81] |
| K4 | Time | 240 min S2: within 240 min S3: within 240 min | Speed of delivery depends on the distance and traffic; this is an average deduced from FedEx. | [99] |
| K5 | Environment | 1 (scale 1 to 5) | Vans and trucks produce almost 29.4% of the greenhouse gas emissions in the transportation system. | [100] |
| K6 | Payload | 1595 kg | Average payload from the data of 5 vans used in delivery. | [101] |
| Criteria | Score | Description | References | |
|---|---|---|---|---|
| K1 | Safety | 4 (scale 1 to 5) | The number of fatalities involving bicyclists was slightly higher than 2% in 2009 and less than 3% in 2018 [102]. These numbers are expected to be lower when smart bicycles are used. E-assist bikes are often ridden more quickly. Consequently, there can be elevated safety hazards. E-bike incidents can simply be prevented if human error can be reduced. Some researchers, such as the authors of [103], considered helmets that display awareness messages. | [102,103,104] |
| K2 | Economy | USD 9676 S2: USD 15,043 S3: USD 15,372 | Average cost per pack, ACP = USD 0.56 (based on values of equipment given in [105]) Energy per kilometer, ECM = USD 0.05 Average cost of smart bicycle, CE = USD 4000 (assessed based on 80% of smart bikes compilation given in [106] Maintenance, MC = USD 1115 (based on [106]) | [105,106,107,108,109,110] |
| K3 | Laws and Regulations | 4 (scale 1 to 5) | Laws and regulations are being developed and updated for smart bikes. | [111,112] |
| K4 | Time | 43 min S2: 43 min S3: 120 min | Speed of delivery depends on the distance and traffic; this is an average deduced based on distance and the mean value of bicycle speed based on [113]. According to a new study, e-cargo bikes make deliveries 60% faster than delivery vehicles in urban areas. | [41,108,113,114] |
| K5 | Environment | 5 (scale 1 to 5) | Smart bicycles emit greenhouse gases as well as other vehicle types in the transportation system. However, these emissions are significantly lower in comparison with other vehicle types. This is for example due to the fact that a smart bike battery is only 1–2% of the size of an electric car battery (reduced energy consumption) [115]. The authors of [115] suggested that CO2 emissions would be reduced by 15 million tons yearly if everyone used bikes. | [108,114,115,116] |
| K6 | Payload | 150 kg | Average payload including a person. | [108,114,117,118,119] |
| Solution/ Criteria | ||||
|---|---|---|---|---|
| Safety | 3 | 4 | 2 | 4 |
| Economy | S1: 28,995 S2: 53,523 S3: 33,466 | S1: 7442 S2: 11,160 S3: 8247 | S1: 73,292 S2: USD 156,320 S3: USD 127,777 | S1: 9676 S2: USD 15,043 S3: USD 15,372 |
| Laws and Regulations | 3 | 2 | 5 | 4 |
| Time for Delivery | S1: 15.00 S2: 16.50 S3: 45.75 | S1: 15.00 S2: 30.00 S3: 85.00 | 240.00 | S1, S2: 43.00 S3: 120.00 |
| Environment | 4 | 4 | 1 | 5 |
| Payload | 215.5 | 2.27 | 1595 | 150 |
| Solution/ Criteria | ||||||||||||
|---|---|---|---|---|---|---|---|---|---|---|---|---|
| S1 | S2 | S3 | S1 | S2 | S3 | S1 | S2 | S3 | S1 | S2 | S3 | |
| Safety | 0.50 | 0.50 | 0.50 | 1.00 | 1.00 | 1.00 | 0.00 | 0.00 | 0.00 | 1.00 | 1.00 | 1.00 |
| Economy | 0.67 | 0.71 | 0.79 | 1.00 | 1.00 | 1.00 | 0.00 | 0.00 | 0.00 | 0.97 | 0.97 | 0.94 |
| Laws and Regulations | 0.33 | 0.33 | 0.33 | 0.00 | 0.00 | 0.00 | 1.00 | 1.00 | 1.00 | 0.67 | 0.67 | 0.67 |
| Time for Delivery | 1.00 | 1.00 | 1.00 | 1.00 | 0.00 | 0.80 | 0.00 | 1.00 | 0.00 | 0.88 | 1.00 | 0.62 |
| Environment | 0.75 | 0.75 | 0.75 | 0.75 | 0.75 | 0.75 | 0.00 | 0.00 | 0.00 | 1.00 | 1.00 | 1.00 |
| Payload | 0.13 | 0.13 | 0.13 | 0.00 | 0.00 | 0.00 | 1.00 | 1.00 | 1.00 | 0.04 | 0.04 | 0.04 |
| Weighting Method | Point Allocation Method | Rank Sum Method |
|---|---|---|
| Formula | Total weight of criteria is equal to 100 |
| Method | Point Allocation Method |
|---|---|
| How is it used? | 100 points are allocated for the weights |
| Criteria | Weight wk |
| Safety | 35 |
| Economy | 20 |
| Laws and Regulations | 15 |
| Time for Delivery | 15 |
| Environment | 10 |
| Payload | 5 |
| Method | Rank Sum Method | ||
|---|---|---|---|
| How Is It Used? | Rank Sum Formula Section 3.2 | ||
| Criteria | Rank | Weight wk | Norm. weight |
| Safety | 1 | 6 | 0.286 |
| Economy | 2 | 5 | 0.238 |
| Laws and Regulations | 3 | 4 | 0.190 |
| Time for Delivery | 4 | 3 | 0.143 |
| Environment | 5 | 2 | 0.095 |
| Payload | 6 | 1 | 0.048 |
| Weight wk | Solution/Criteria | Autonomous Delivery Robots | Civil Delivery Drones | Conventional Delivery Trucks/Vans | Smart Bicycles | ||||||||
|---|---|---|---|---|---|---|---|---|---|---|---|---|---|
| S1 | S2 | S3 | S1 | S2 | S3 | S1 | S2 | S3 | S1 | S2 | S3 | ||
| 35 | Safety | 17.50 | 17.50 | 17.50 | 35.00 | 35.00 | 35.00 | 0.00 | 0.00 | 0.00 | 35.00 | 35.00 | 35.00 |
| 20 | Economy | 13.45 | 14.16 | 15.78 | 20.00 | 20.00 | 20.00 | 0.00 | 0.00 | 0.00 | 19.32 | 19.47 | 18.81 |
| 15 | Laws and Regulations | 5.00 | 5.00 | 5.00 | 0.00 | 0.00 | 0.00 | 15.00 | 15.00 | 15.00 | 10.00 | 10.00 | 10.00 |
| 15 | Time for Delivery | 15.00 | 15.00 | 15.00 | 15.00 | 0.000 | 11.97 | 0.00 | 14.98 | 0.00 | 13.13 | 15.00 | 9.27 |
| 10 | Environment | 7.50 | 7.50 | 7.50 | 7.50 | 7.50 | 7.50 | 0.00 | 0.00 | 0.00 | 10.00 | 10.00 | 10.00 |
| 5 | Payload | 0.67 | 0.67 | 0.67 | 0.00 | 0.00 | 0.00 | 5.00 | 5.00 | 5.00 | 0.21 | 0.21 | 0.21 |
| Total | 59.00 | 60.00 | 61.00 | 77.50 | 62.50 | 74.47 | 20.00 | 34.98 | 20.00 | 87.66 | 89.67 | 83.28 | |
| Weight | Solution/Criteria | Autonomous Delivery Robots | Civil Delivery Drones | Conventional Delivery Trucks/Vans | Smart Bicycles |
|---|---|---|---|---|---|
| 0.286 | Safety | 0.1429 | 0.2857 | 0.0000 | 0.2857 |
| 0.238 | Economy | 0.1602 | 0.2381 | 0.0000 | 0.2300 |
| 0.190 | Laws and Regulations | 0.0635 | 0.0000 | 0.1905 | 0.1270 |
| 0.143 | Time for Delivery | 0.1429 | 0.1429 | 0.0000 | 0.1251 |
| 0.095 | Environment | 0.0714 | 0.0714 | 0.0000 | 0.0952 |
| 0.048 | Payload | 0.0064 | 0.0000 | 0.0476 | 0.0020 |
| Total | 0.5872 | 0.7381 | 0.2381 | 0.8650 | |
| Weight | Solution/Criteria | Autonomous Delivery Robots | Civil Delivery Drones | Conventional Delivery Trucks/Vans | Smart Bicycles |
|---|---|---|---|---|---|
| 0.286 | Safety | 0.1429 | 0.2857 | 0.0000 | 0.2857 |
| 0.238 | Economy | 0.1686 | 0.2381 | 0.0000 | 0.2317 |
| 0.190 | Laws and Regulations | 0.0635 | 0.0000 | 0.1905 | 0.1270 |
| 0.143 | Time for Delivery | 0.1429 | 0.0000 | 0.1427 | 0.1428 |
| 0.095 | Environment | 0.0714 | 0.0714 | 0.0000 | 0.0952 |
| 0.048 | Payload | 0.0064 | 0.0000 | 0.0476 | 0.0020 |
| Total | 0.5956 | 0.5952 | 0.3807 | 0.8845 | |
| Weight | Solution/Criteria | Autonomous Delivery Robots | Civil Delivery Drones | Conventional Delivery Trucks/Vans | Smart Bicycles |
|---|---|---|---|---|---|
| 0.286 | Safety | 0.1429 | 0.2857 | 0.0000 | 0.2857 |
| 0.238 | Economy | 0.1879 | 0.2381 | 0.0000 | 0.2239 |
| 0.190 | Laws and Regulations | 0.0635 | 0.0000 | 0.1905 | 0.1270 |
| 0.143 | Time for Delivery | 0.1429 | 0.1140 | 0.0000 | 0.0883 |
| 0.095 | Environment | 0.0714 | 0.0714 | 0.0000 | 0.0952 |
| 0.048 | Payload | 0.0064 | 0.0000 | 0.0476 | 0.0020 |
| Total | 0.6149 | 0.7092 | 0.2381 | 0.8221 | |
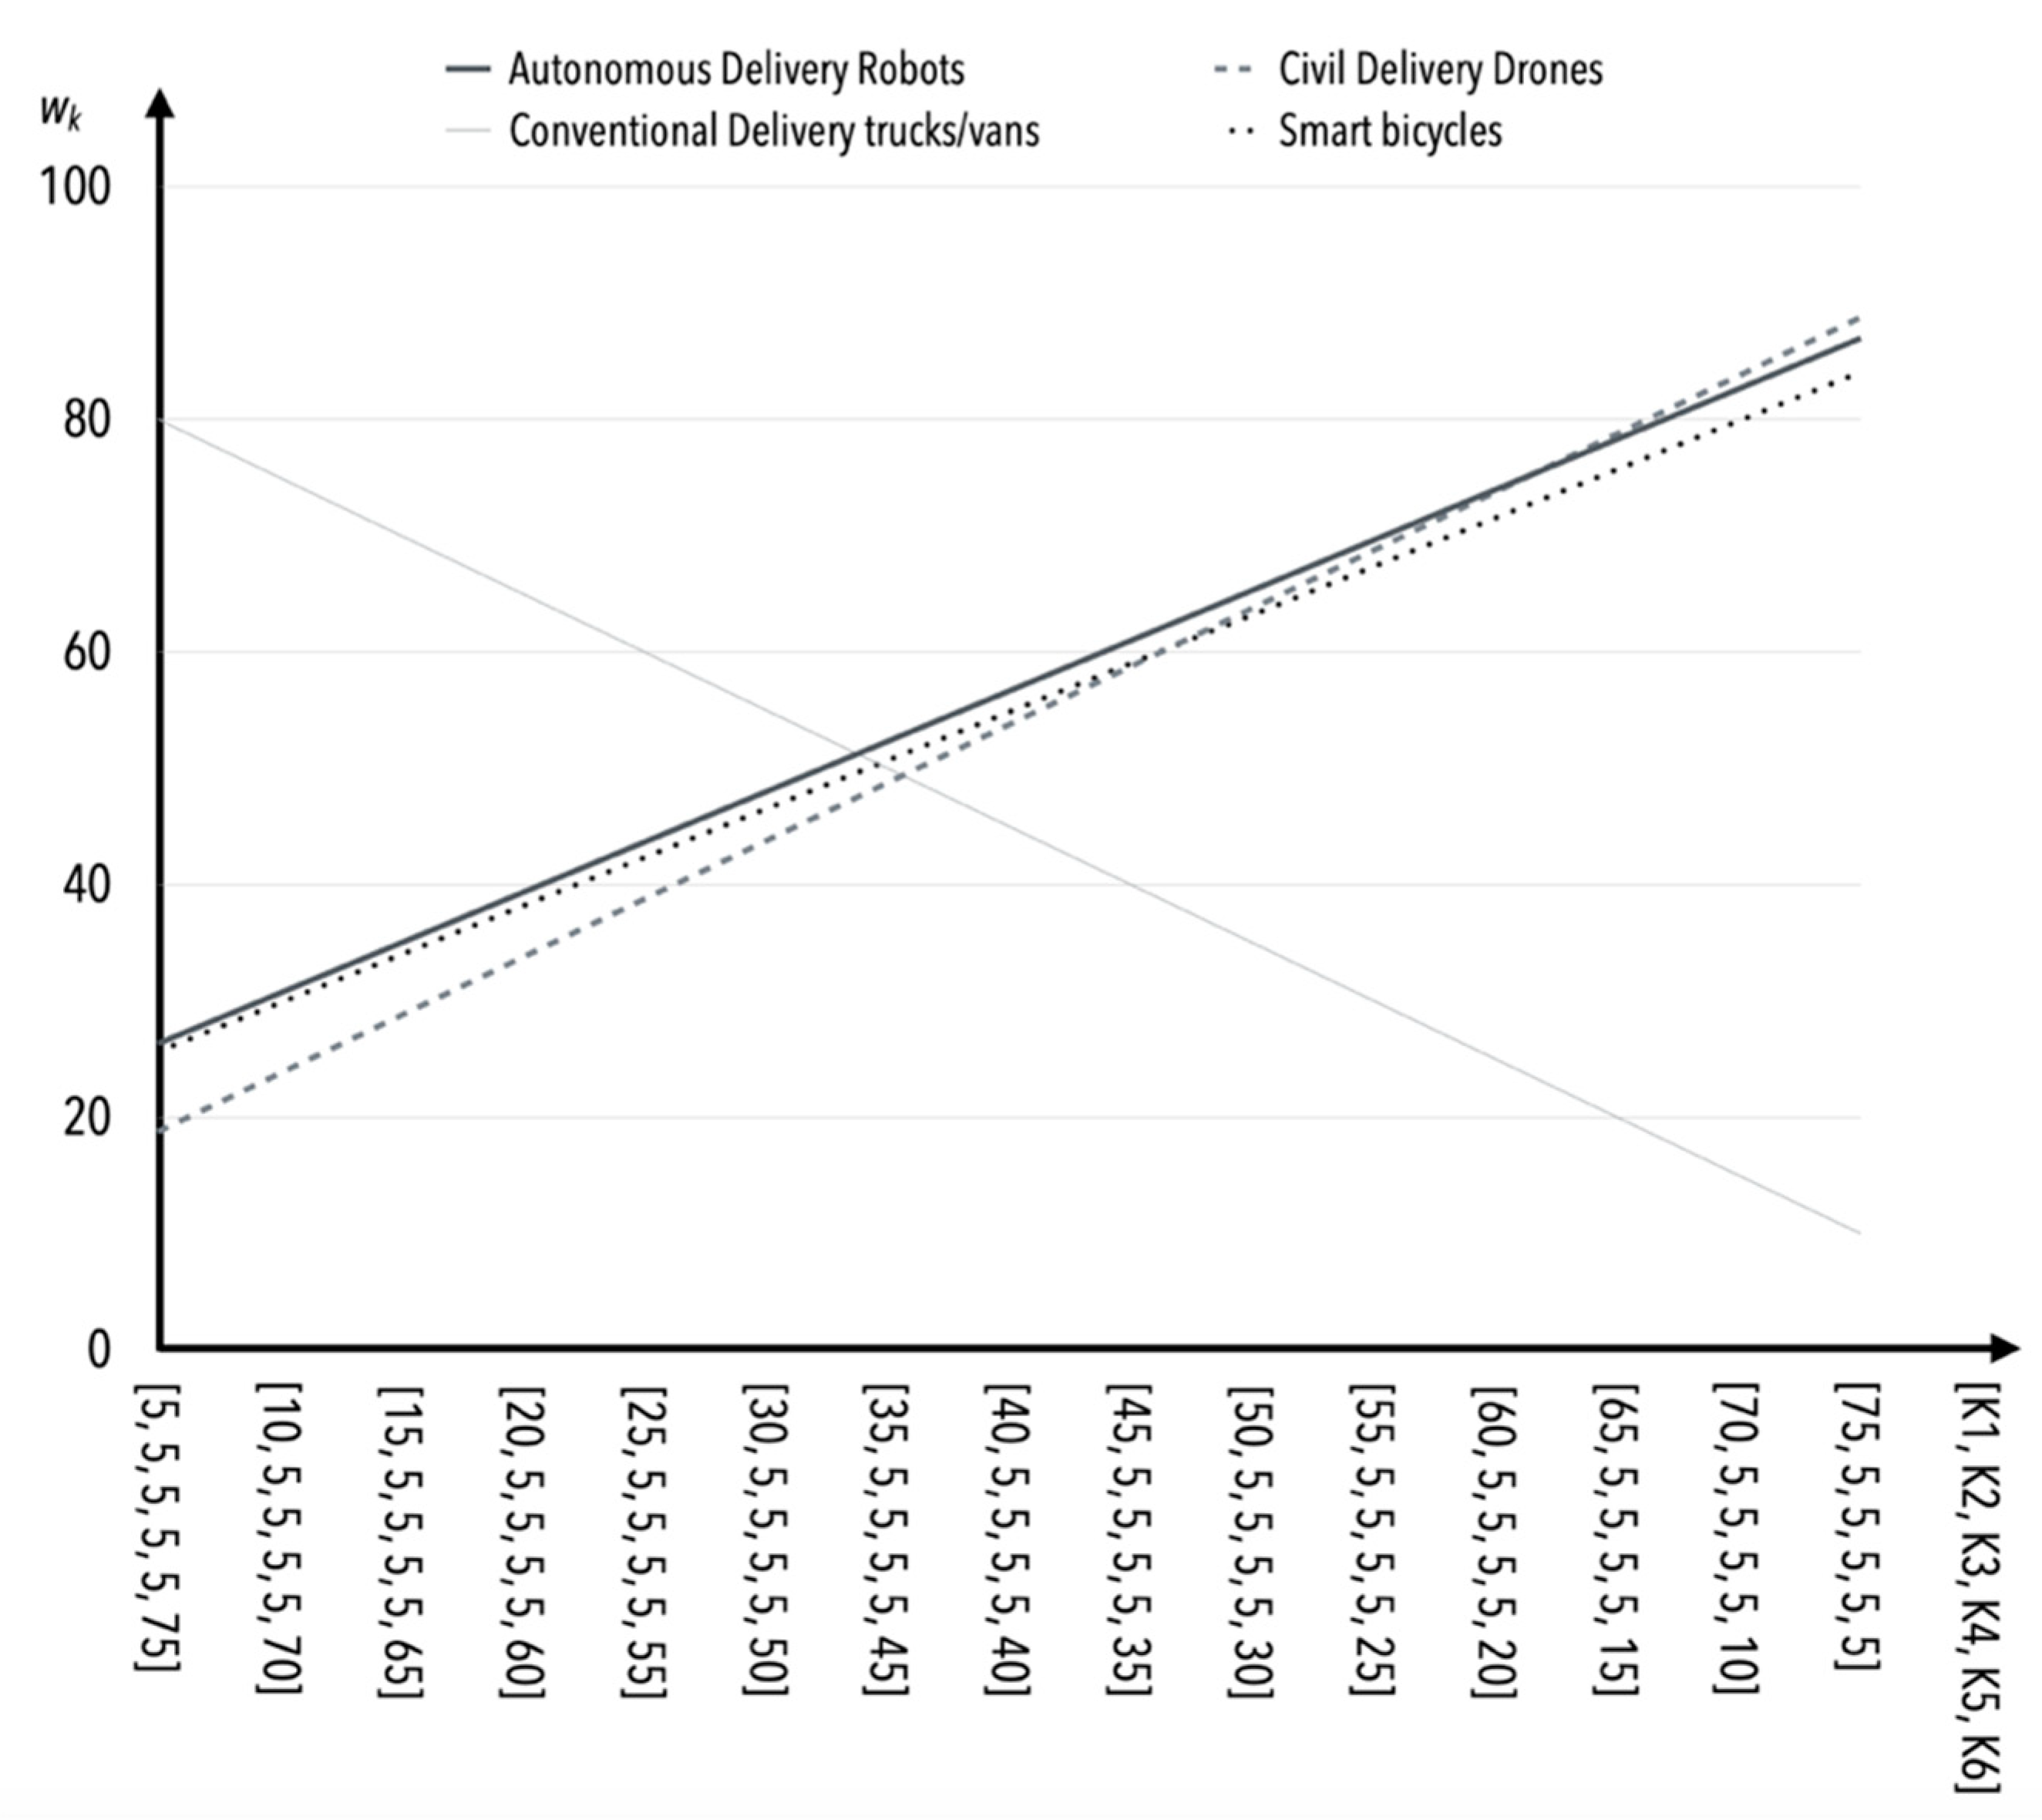
| Criteria | k1 | 5 | 10 | 15 | 20 | 25 | 30 | 35 | 40 | 45 | 50 | 55 | 60 | 65 | 70 | 75 |
| k2 | 5 | 5 | 5 | 5 | 5 | 5 | 5 | 5 | 5 | 5 | 5 | 5 | 5 | 5 | 5 | |
| k3 | 5 | 5 | 5 | 5 | 5 | 5 | 5 | 5 | 5 | 5 | 5 | 5 | 5 | 5 | 5 | |
| k4 | 5 | 5 | 5 | 5 | 5 | 5 | 5 | 5 | 5 | 5 | 5 | 5 | 5 | 5 | 5 | |
| k5 | 5 | 5 | 5 | 5 | 5 | 5 | 5 | 5 | 5 | 5 | 5 | 5 | 5 | 5 | 5 | |
| k6 | 75 | 70 | 65 | 60 | 55 | 50 | 45 | 40 | 35 | 30 | 25 | 20 | 15 | 10 | 5 | |
| Vehicle Type | RADR | 26.32 | 28.15 | 29.98 | 31.81 | 33.64 | 35.47 | 37.30 | 39.13 | 40.97 | 42.80 | 44.63 | 46.46 | 48.29 | 50.12 | 51.95 |
| CDD | 18.75 | 23.75 | 28.75 | 33.75 | 38.75 | 43.75 | 48.75 | 53.75 | 58.75 | 63.75 | 68.75 | 73.75 | 78.75 | 83.75 | 88.75 | |
| T/V | 80.00 | 75.00 | 70.00 | 65.00 | 60.00 | 55.00 | 50.00 | 45.00 | 40.00 | 35.00 | 30.00 | 25.00 | 20.00 | 15.00 | 10.00 | |
| SB | 25.64 | 30.43 | 35.22 | 40.02 | 44.81 | 49.61 | 54.40 | 59.19 | 63.99 | 68.78 | 73.57 | 78.37 | 83.16 | 87.95 | 92.75 | |
| Criteria | k1 | 5 | 5 | 5 | 5 | 5 | 5 | 5 | 5 | 5 | 5 | 5 | 5 | 5 | 5 | 5 |
| k2 | 5 | 10 | 15 | 20 | 25 | 30 | 35 | 40 | 45 | 50 | 55 | 60 | 65 | 70 | 75 | |
| k3 | 5 | 5 | 5 | 5 | 5 | 5 | 5 | 5 | 5 | 5 | 5 | 5 | 5 | 5 | 5 | |
| k4 | 5 | 5 | 5 | 5 | 5 | 5 | 5 | 5 | 5 | 5 | 5 | 5 | 5 | 5 | 5 | |
| k5 | 5 | 5 | 5 | 5 | 5 | 5 | 5 | 5 | 5 | 5 | 5 | 5 | 5 | 5 | 5 | |
| k6 | 75 | 70 | 65 | 60 | 55 | 50 | 45 | 40 | 35 | 30 | 25 | 20 | 15 | 10 | 5 | |
| Vehicle Type | RADR | 26.32 | 29.01 | 31.71 | 34.40 | 37.10 | 39.79 | 42.48 | 45.18 | 47.87 | 50.57 | 53.26 | 55.96 | 58.65 | 61.34 | 64.04 |
| CDD | 18.75 | 23.75 | 28.75 | 33.75 | 38.75 | 43.75 | 48.75 | 53.75 | 58.75 | 63.75 | 68.75 | 73.75 | 78.75 | 83.75 | 88.75 | |
| T/V | 80 | 75 | 70 | 65 | 60 | 55 | 50 | 45 | 40 | 35 | 30 | 25 | 20 | 15 | 10 | |
| SB | 25.64 | 30.26 | 34.89 | 39.51 | 44.13 | 48.76 | 53.38 | 58.01 | 62.63 | 67.25 | 71.88 | 76.50 | 81.12 | 85.75 | 90.37 | |
| Criteria | k1 | 5 | 5 | 5 | 5 | 5 | 5 | 5 | 5 | 5 | 5 | 5 | 5 | 5 | 5 | 5 |
| k2 | 5 | 5 | 5 | 5 | 5 | 5 | 5 | 5 | 5 | 5 | 5 | 5 | 5 | 5 | 5 | |
| k3 | 5 | 10 | 15 | 20 | 25 | 30 | 35 | 40 | 45 | 50 | 55 | 60 | 65 | 70 | 75 | |
| k4 | 5 | 5 | 5 | 5 | 5 | 5 | 5 | 5 | 5 | 5 | 5 | 5 | 5 | 5 | 5 | |
| k5 | 5 | 5 | 5 | 5 | 5 | 5 | 5 | 5 | 5 | 5 | 5 | 5 | 5 | 5 | 5 | |
| k6 | 75 | 70 | 65 | 60 | 55 | 50 | 45 | 40 | 35 | 30 | 25 | 20 | 15 | 10 | 5 | |
| Vehicle Type | RADR | 26.32 | 27.32 | 28.31 | 29.31 | 30.31 | 31.31 | 32.30 | 33.30 | 34.30 | 35.30 | 36.29 | 37.29 | 38.29 | 39.29 | 40.28 |
| CDD | 18.75 | 18.75 | 18.75 | 18.75 | 18.75 | 18.75 | 18.75 | 18.75 | 18.75 | 18.75 | 18.75 | 18.75 | 18.75 | 18.75 | 18.75 | |
| T/V | 80 | 80 | 80 | 80 | 80 | 80 | 80 | 80 | 80 | 80 | 80 | 80 | 80 | 80 | 80 | |
| SB | 25.64 | 28.77 | 31.89 | 35.02 | 38.15 | 41.27 | 44.40 | 47.53 | 50.65 | 53.78 | 56.91 | 60.03 | 63.16 | 66.29 | 69.41 | |
| Criteria | k1 | 5 | 5 | 5 | 5 | 5 | 5 | 5 | 5 | 5 | 5 | 5 | 5 | 5 | 5 | 5 |
| k2 | 5 | 5 | 5 | 5 | 5 | 5 | 5 | 5 | 5 | 5 | 5 | 5 | 5 | 5 | 5 | |
| k3 | 5 | 5 | 5 | 5 | 5 | 5 | 5 | 5 | 5 | 5 | 5 | 5 | 5 | 5 | 5 | |
| k4 | 5 | 10 | 15 | 20 | 25 | 30 | 35 | 40 | 45 | 50 | 55 | 60 | 65 | 70 | 75 | |
| k5 | 5 | 5 | 5 | 5 | 5 | 5 | 5 | 5 | 5 | 5 | 5 | 5 | 5 | 5 | 5 | |
| k6 | 75 | 70 | 65 | 60 | 55 | 50 | 45 | 40 | 35 | 30 | 25 | 20 | 15 | 10 | 5 | |
| Vehicle type | RADR | 26.32 | 30.65 | 34.98 | 39.31 | 43.64 | 47.97 | 52.30 | 56.63 | 60.97 | 65.30 | 69.63 | 73.96 | 78.29 | 82.62 | 86.95 |
| CDD | 18.75 | 23.75 | 28.75 | 33.75 | 38.75 | 43.75 | 48.75 | 53.75 | 58.75 | 63.75 | 68.75 | 73.75 | 78.75 | 83.75 | 88.75 | |
| T/V | 80 | 75 | 70 | 65 | 60 | 55 | 50 | 45 | 40 | 35 | 30 | 25 | 20 | 15 | 10 | |
| SB | 25.64 | 29.81 | 33.98 | 38.15 | 42.32 | 46.50 | 50.67 | 54.84 | 59.01 | 63.18 | 67.35 | 71.52 | 75.69 | 79.87 | 84.04 | |
| Criteria | k1 | 5 | 5 | 5 | 5 | 5 | 5 | 5 | 5 | 5 | 5 | 5 | 5 | 5 | 5 | 5 |
| k2 | 5 | 5 | 5 | 5 | 5 | 5 | 5 | 5 | 5 | 5 | 5 | 5 | 5 | 5 | 5 | |
| k3 | 5 | 5 | 5 | 5 | 5 | 5 | 5 | 5 | 5 | 5 | 5 | 5 | 5 | 5 | 5 | |
| k4 | 5 | 5 | 5 | 5 | 5 | 5 | 5 | 5 | 5 | 5 | 5 | 5 | 5 | 5 | 5 | |
| k5 | 5 | 10 | 15 | 20 | 25 | 30 | 35 | 40 | 45 | 50 | 55 | 60 | 65 | 70 | 75 | |
| k6 | 75 | 70 | 65 | 60 | 55 | 50 | 45 | 40 | 35 | 30 | 25 | 20 | 15 | 10 | 5 | |
| Vehicle Type | RADR | 26.32 | 29.40 | 32.48 | 35.56 | 38.64 | 41.72 | 44.80 | 47.88 | 50.97 | 54.05 | 57.13 | 60.21 | 63.29 | 66.37 | 69.45 |
| CDD | 18.75 | 22.50 | 26.25 | 30.00 | 33.75 | 37.50 | 41.25 | 45.00 | 48.75 | 52.50 | 56.25 | 60.00 | 63.75 | 67.50 | 71.25 | |
| T/V | 80 | 75 | 70 | 65 | 60 | 55 | 50 | 45 | 40 | 35 | 30 | 25 | 20 | 15 | 10 | |
| SB | 25.64 | 30.43 | 35.23 | 40.02 | 44.81 | 49.61 | 54.40 | 59.19 | 63.99 | 68.78 | 73.57 | 78.37 | 83.16 | 87.95 | 92.75 |
| Method | Trucks/Vans | Civil Drones | Autonomous Robots | Smart Bicycles | |||
|---|---|---|---|---|---|---|---|
| - | Score | Score | % Higher | Score | % Higher | Score | % Higher |
| S1: Point S2: S3: | 20.00 34.98 20.00 | 77.50 62.50 74.47 | 74.2% 44.0% 73.4% | 59.00 60.00 61.00 | 64.2% 41.7% 67.2% | 87.66 89.67 83.28 | 77.2% 61.0% 76.0% |
| S1: Rank S2: S3: | 0.2381 0.3807 0.2381 | 0.7381 0.5952 0.7092 | 67.8% 36.4% 66.4% | 0.5872 0.5956 0.6149 | 59.5% 59.4% 61.3% | 0.8650 0.8845 0.8221 | 72.5% 57.0% 71.0% |
Publisher’s Note: MDPI stays neutral with regard to jurisdictional claims in published maps and institutional affiliations. |
© 2022 by the authors. Licensee MDPI, Basel, Switzerland. This article is an open access article distributed under the terms and conditions of the Creative Commons Attribution (CC BY) license (https://creativecommons.org/licenses/by/4.0/).
Share and Cite
Kostrzewski, M.; Abdelatty, Y.; Eliwa, A.; Nader, M. Analysis of Modern vs. Conventional Development Technologies in Transportation—The Case Study of a Last-Mile Delivery Process. Sensors 2022, 22, 9858. https://doi.org/10.3390/s22249858
Kostrzewski M, Abdelatty Y, Eliwa A, Nader M. Analysis of Modern vs. Conventional Development Technologies in Transportation—The Case Study of a Last-Mile Delivery Process. Sensors. 2022; 22(24):9858. https://doi.org/10.3390/s22249858
Chicago/Turabian StyleKostrzewski, Mariusz, Yahya Abdelatty, Ahmed Eliwa, and Mirosław Nader. 2022. "Analysis of Modern vs. Conventional Development Technologies in Transportation—The Case Study of a Last-Mile Delivery Process" Sensors 22, no. 24: 9858. https://doi.org/10.3390/s22249858
APA StyleKostrzewski, M., Abdelatty, Y., Eliwa, A., & Nader, M. (2022). Analysis of Modern vs. Conventional Development Technologies in Transportation—The Case Study of a Last-Mile Delivery Process. Sensors, 22(24), 9858. https://doi.org/10.3390/s22249858