1. Introduction
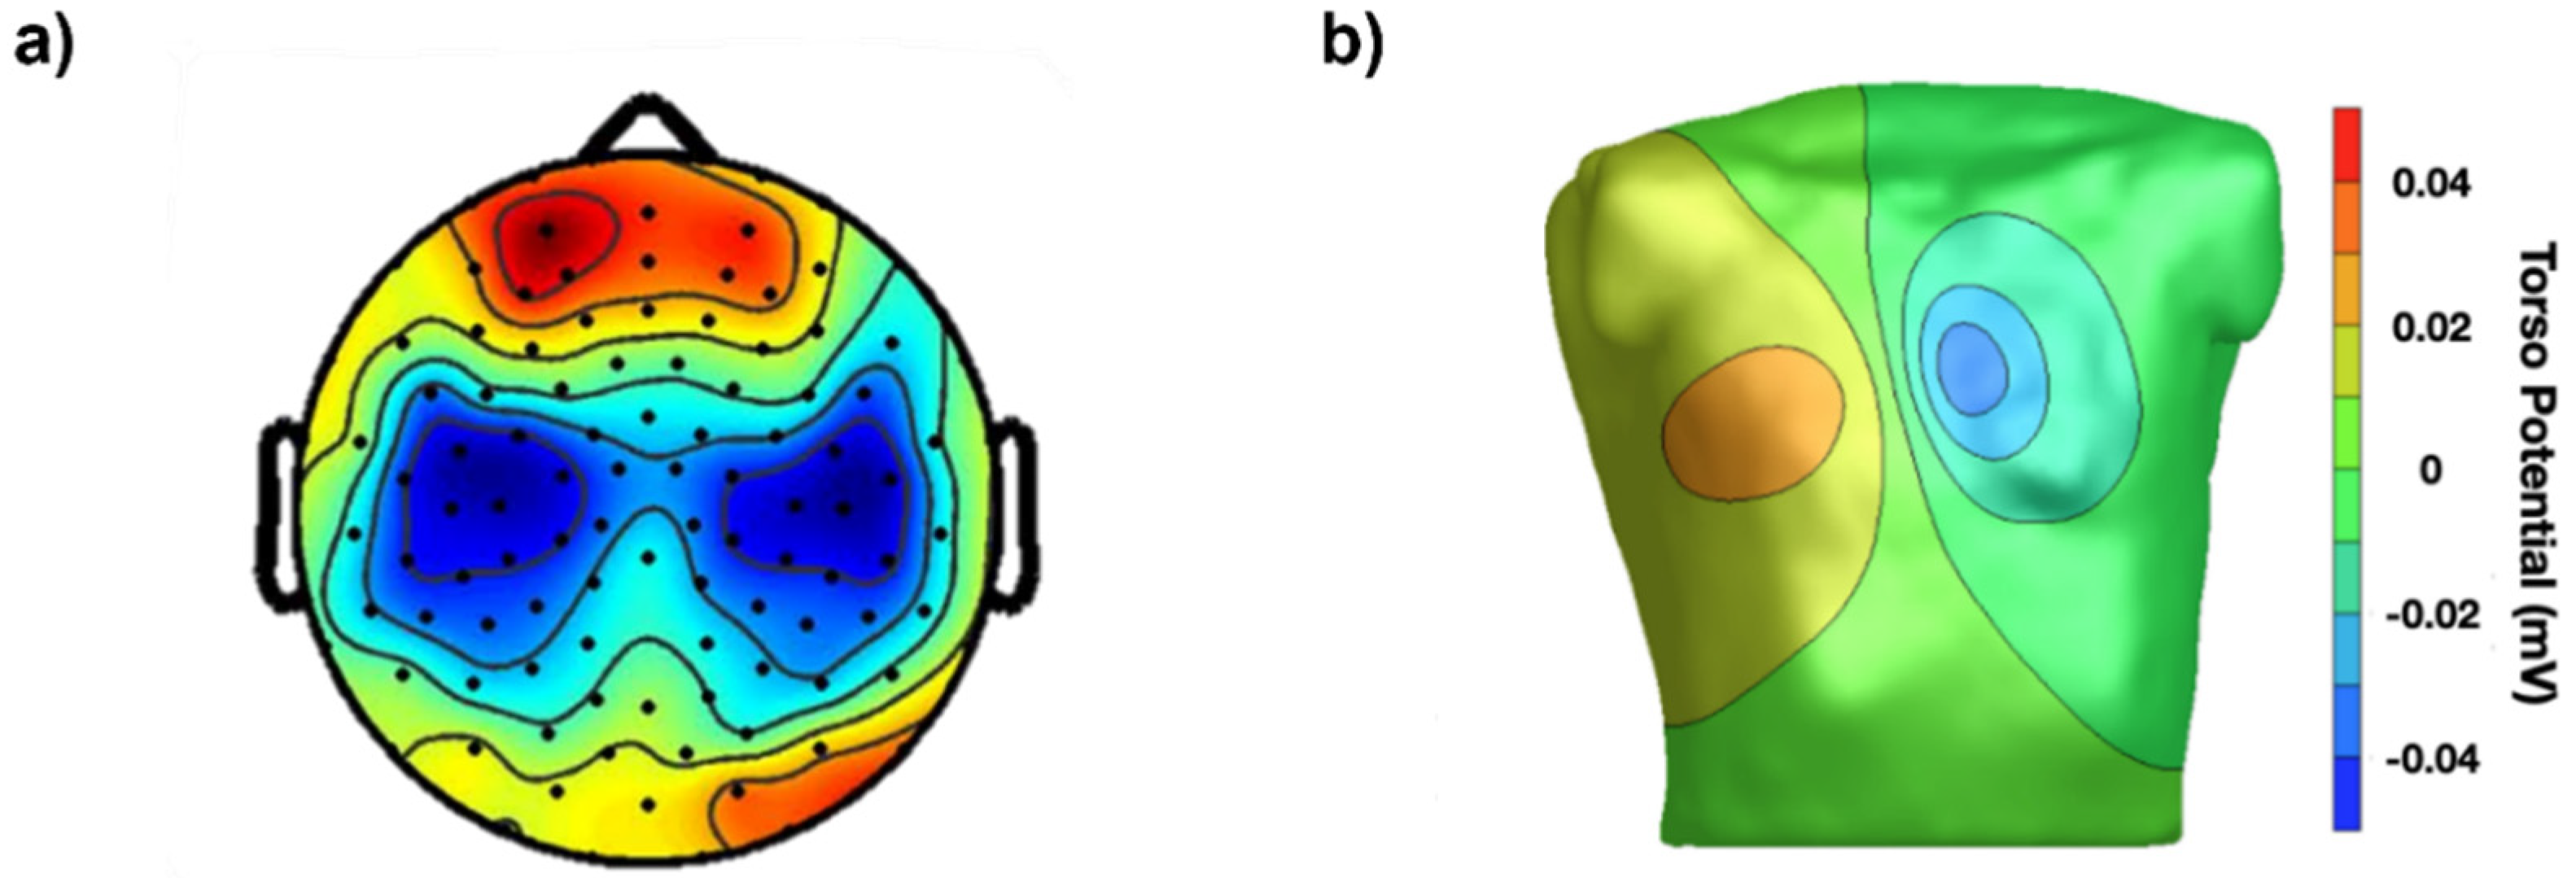
Bioelectric signals are the results of the activity of organs that are made of excitable cells, such as the brain, the heart or a muscle. Electrical currents flow through the membranes of these cells and generate action potentials that travel along axons or muscle fibers, triggering other events within or between the cells (e.g., the release of neurotransmitters and the contraction of a muscle fiber). The electric fields generated by these action potentials produce a distribution of electric potential in space, on the skin, that evolves over time, as with a movie.
Our eyes cannot see these distributions of voltage or their time evolution on the scalp (electroencephalogram, EEG), on the chest (electrocardiogram, ECG) or on a muscle (surface electromyogram, sEMG), but instruments can and they can visualize them as colored images that we can see and interpret in the same way as thermal images describing temperature distributions over surfaces. To obtain images of voltage distribution, grids of contact points (electrodes) are applied to the chest, scalp or on a muscle, as indicated in
Figure 1 and
Figure 2. Alternatively, an individual electrode (or a single electrode pair) detects local monopolar voltage with respect to a reference (or a differential voltage), providing a time-varying trace (as with ECG).
Bioelectric signals and images provide an extraordinary opportunity to discover and quantify a wealth of physiological and pathological phenomena that are associated with the organs that generate them. In addition, they provide valuable information to clinicians for functional diagnosis, treatment planning, and the evaluation of the effectiveness of interventions and patient recovery. The role of EEG mapping for studying brain rhythms, the spatial distribution of evoked potentials, epilepsy foci, etc., and the role of ECG mapping in studying atrio-ventricular conduction problems, arrhythmias, etc., are both well known to specialists. The role of sEMG in clinical medicine is less recognized, despite the potential benefits it may offer, mostly because of limited academic teaching [
3]. Surface EMG signals are very rich in information about the muscle and neuromuscular system control strategies and can be easily detected by a number of different electrode configurations, with each having advantages, disadvantages, and specific applications.
The purpose of this work is to illustrate in a simple way several fundamental concepts that should be understood and recommendations that should be followed concerning the detection modalities of sEMG (electrode size, interelectrode distance (IED), electrode locations, etc.) in order to (a) be able to extract the information of interest and (b) apply it clinically. The applications of interest range from gait analysis in neurorehabilitation (
Section 4.5) to the location of the innervation zone (IZ) for the targeted injection of botulinum toxin (
Section 4.3) [
4,
5], from the estimation of load sharing among muscles [
6] to the estimation of muscle fiber conduction velocity to monitor channelopathies and Cushing’s syndrome (
Section 2.2) [
7,
8,
9,
10], from monitor motor unit (MU) rate modulation and involuntary muscle activity in acute stroke [
11,
12,
13] to study cramps [
14], from comparing the ergonomics of chairs (
Section 4.6) [
15] to detecting when and which muscles are active and which are not [
16], along with many other applications in sport and obstetric and rehabilitation medicine.
This work does not aim to present or discuss advances in sEMG technology. Its goal is to illustrate the current technology, in terms of teaching material, tutorials, and consensus papers, concerning the detection and interpretation of sEMG. This work is aimed at teachers, clinical tutors, and students with the objectives of:
- (a)
overcoming some of the barriers that currently limit the widespread application of sEMG in the clinical world [
17,
18];
- (b)
responding to the persistent demand for the simplification of teaching these concepts;
- (c)
making users aware of the tutorials and teaching materials that are available.
Teaching tools and models are illustrated for this purpose. Some of them were derived from published tutorials [
19,
20] or modified from the free teaching website
https://www.robertomerletti.it/en/emg/material/teaching, where further details can be found. They are presented with the intention of promoting teaching and outlining the improper or incorrect acquisition/interpretation of sEMG.
This paper is structured in six sections with the following purposes:
Section 1 introduces the work and its motivations;
Section 2 reviews a few basic physiological and technical concepts;
Section 3 addresses the issue of sEMG detection using the basic spatial filters;
Section 4 addresses the teaching of some clinical applications, focusing on the incorrect use of bipolar and high-density sEMG (HDsEMG);
Section 5 and
Section 6 discuss the current situation and present conclusions.
2. Teaching Basic Physiological and Technical Concepts
Fundamental physiological concepts about sEMG signals, events, and phenomena are reviewed here, together with sEMG modeling techniques that are suitable for teaching, as well as demonstrations.
2.1. The Concept of Motor Unit Action Potential (MUAP)
The sEMG voltage distribution on the skin is the sum of the propagating MU action potentials (MUAPs) produced by the recruited MUs. The MU is the basic muscle building block, consisting of one motor neuron and all of the muscle fibers that it innervates. Every time an axonal action potential reaches the neuromuscular junction (NMJ), acetylcholine is released and a muscle fiber action potential is triggered.
Figure 2 and
Figure 3 illustrate the concept of MU and the concept of propagating MUAP as a voltage distribution moving on the skin under a fixed grid of electrodes or under a pair of electrodes that are sampling it.
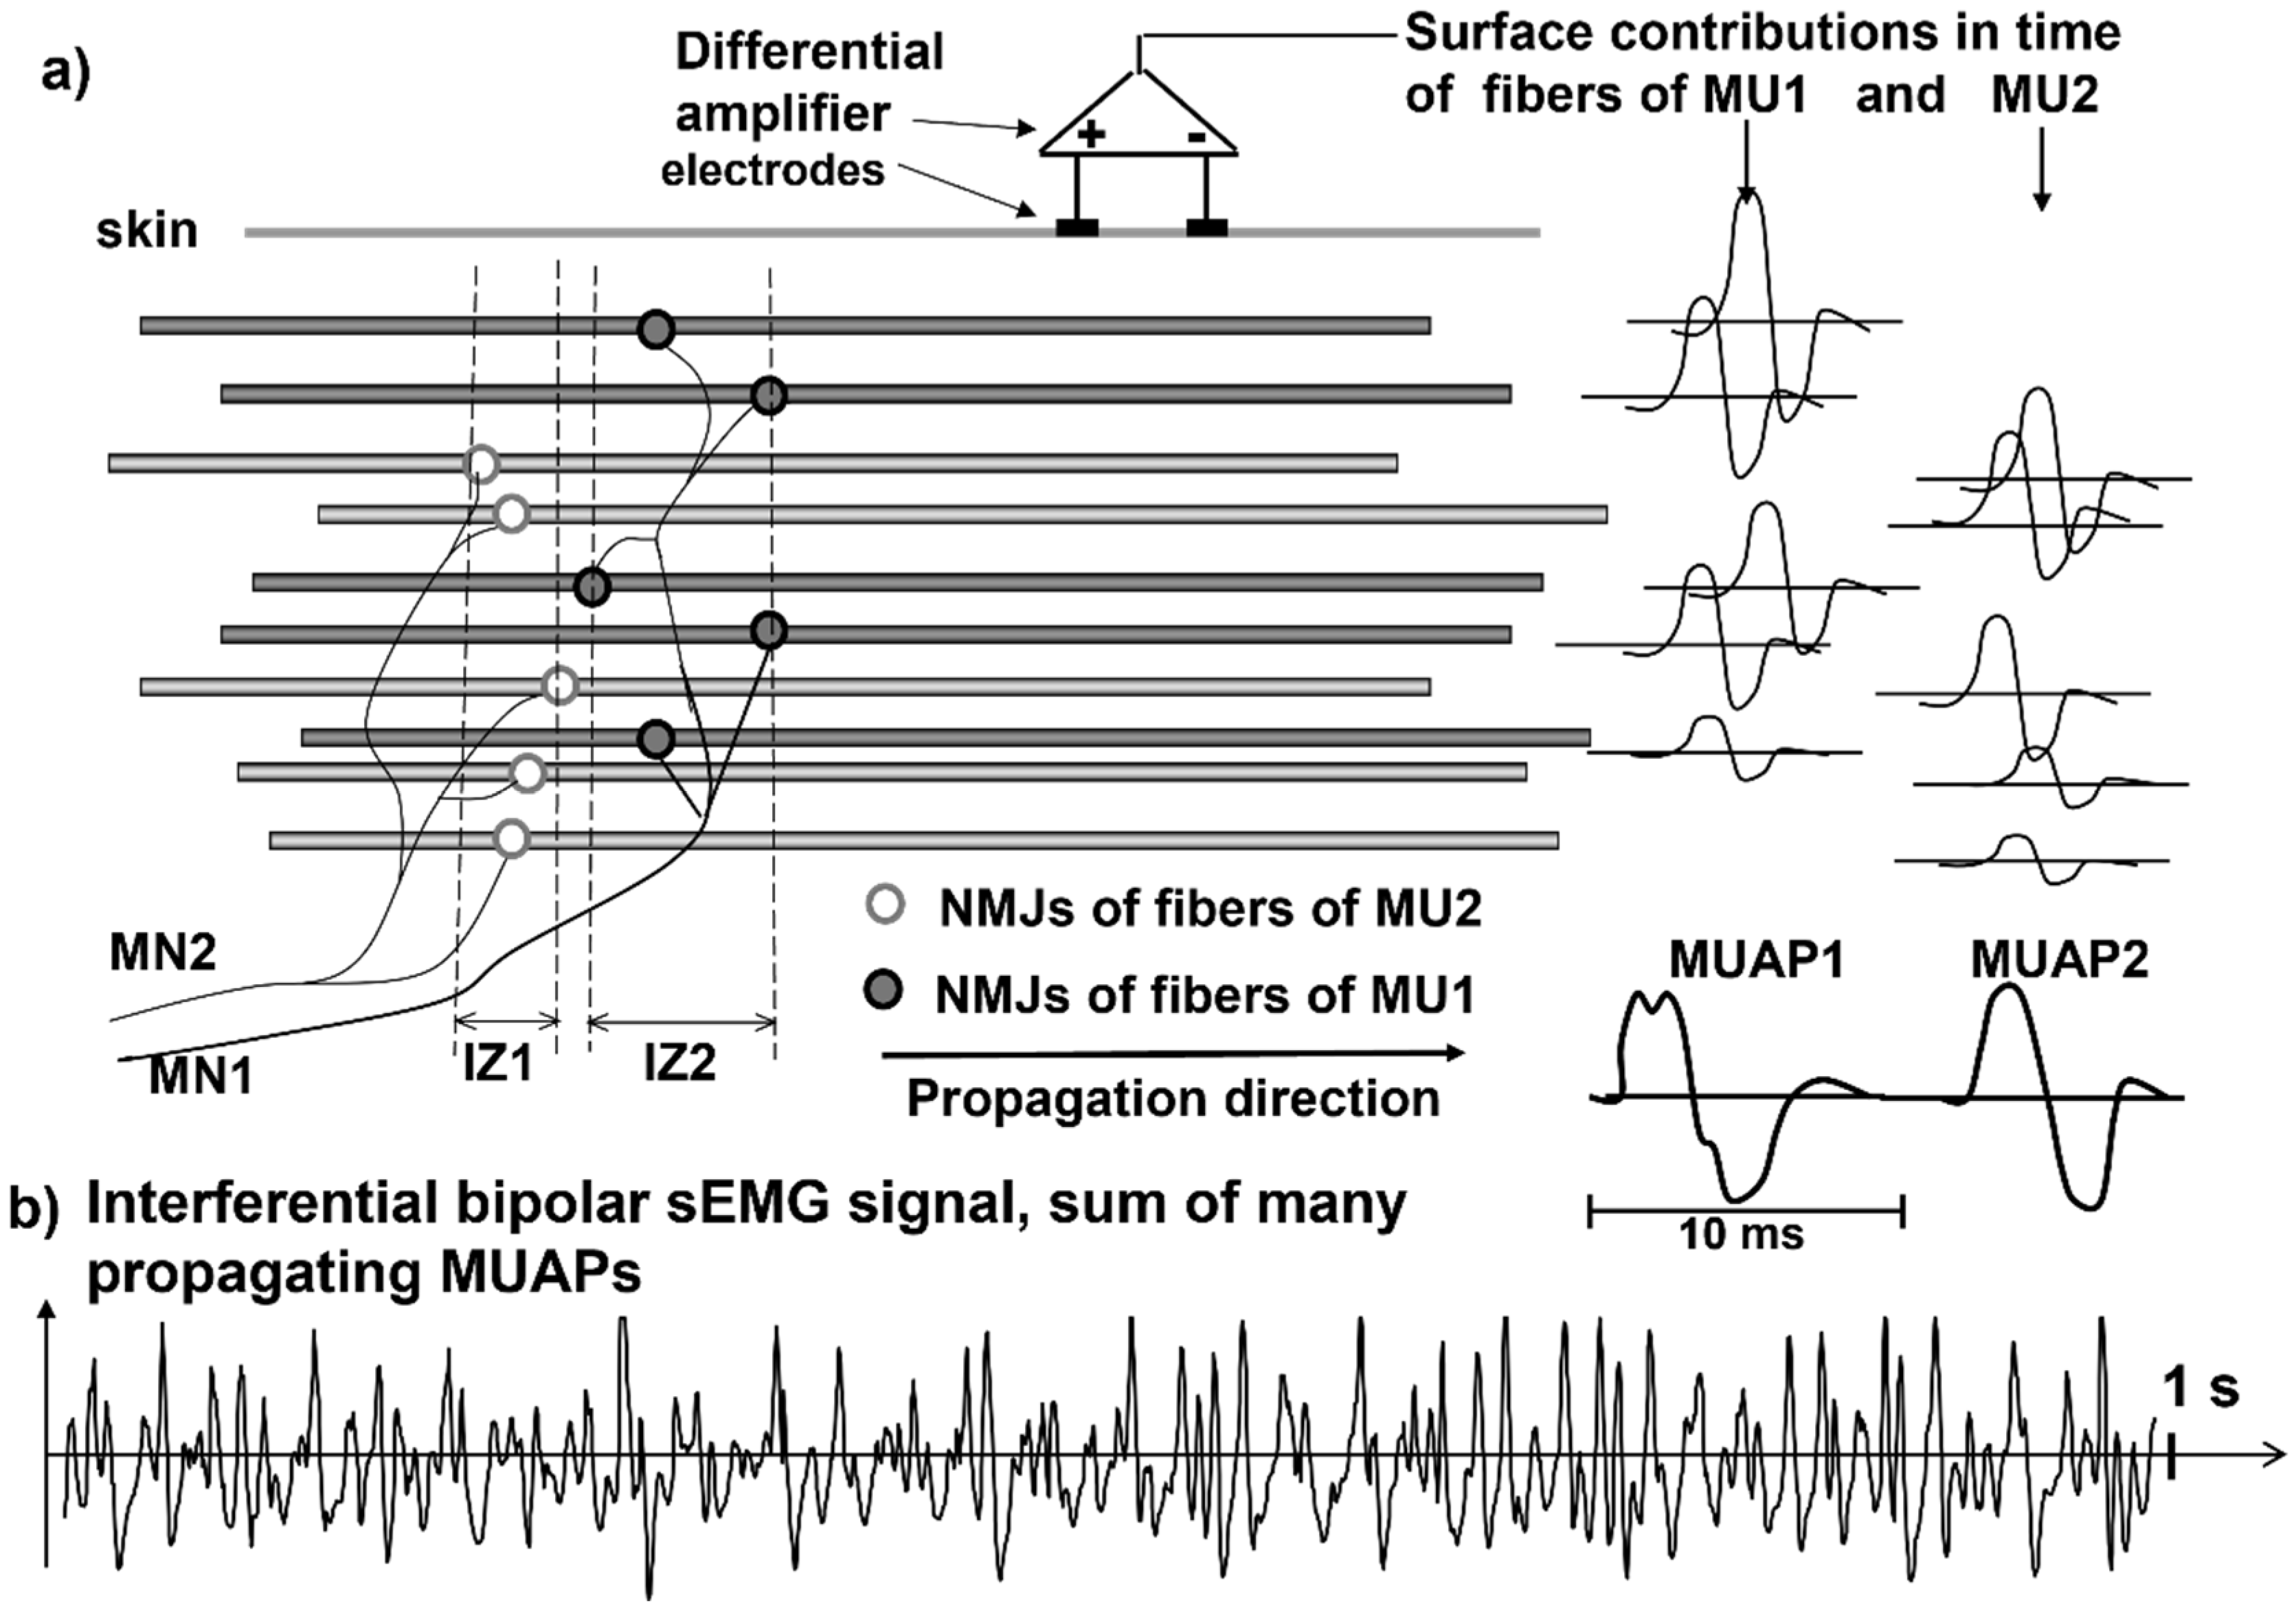
As indicated in
Figure 3, each MUAP is the sum of the propagating surface action potentials produced by the single fibers of each MU and the sEMG is the sum of these MUAPs. Force, as well as the features of the sEMG, depends on many factors, including the number of recruited MUs and the discharge rate of each MU, which are both controlled by the central nervous system [
21]. The propagation (or conduction) velocity (CV) of the action potentials from the NMJ (or end plate) to the tendon endings depends on the dynamics of the fiber membrane ionic channels.
A fundamental difference between sEMG and ECG or EEG is that electrodes placed on the skin, parallel to the muscle fibers, detect the MUAPs that are propagating bidirectionally from the IZs of the MUs to the muscle–tendon junctions. Since the fibers of an MU are of the same histological type and have about the same diameter, their action potentials travel at the same velocity (CV) along the fibers and their contributions add up, on the skin, as MUAPs that provide a “signature” or “fingerprint” for each MU.
These MUAPs are the basic building blocks of the sEMG. Understanding sEMG implies the understanding of its generation mechanisms. For this reason, our explanations of the physiological concepts focus mostly on single fiber action potentials and/or on single MUAPs whose sum is the sEMG.
Figure 3 shows how the contributions of the single fiber action potentials of the MUs add up on the skin to form the MUAPs and how the MUAP contributions add up on the skin to form the sEMG that is detected by one electrode pair.
It should be noted that with progressively stronger voluntary contractions of a muscle, the information about the individual MUAPs becomes progressively more difficult to extract [
23].
Although this may seem a simple and straightforward mechanism that is easy to describe and to teach students, a much deeper analysis is needed to fully understand its details. This is necessary to properly pose and answer the following questions: “What information about the MU properties and their central control strategy can be obtained from the sEMG?” and “When can this information be useful?”.
2.2. The Concept of Propagating Action Potentials and Their Velocity and Diffusion
2.2.1. Conduction Velocity
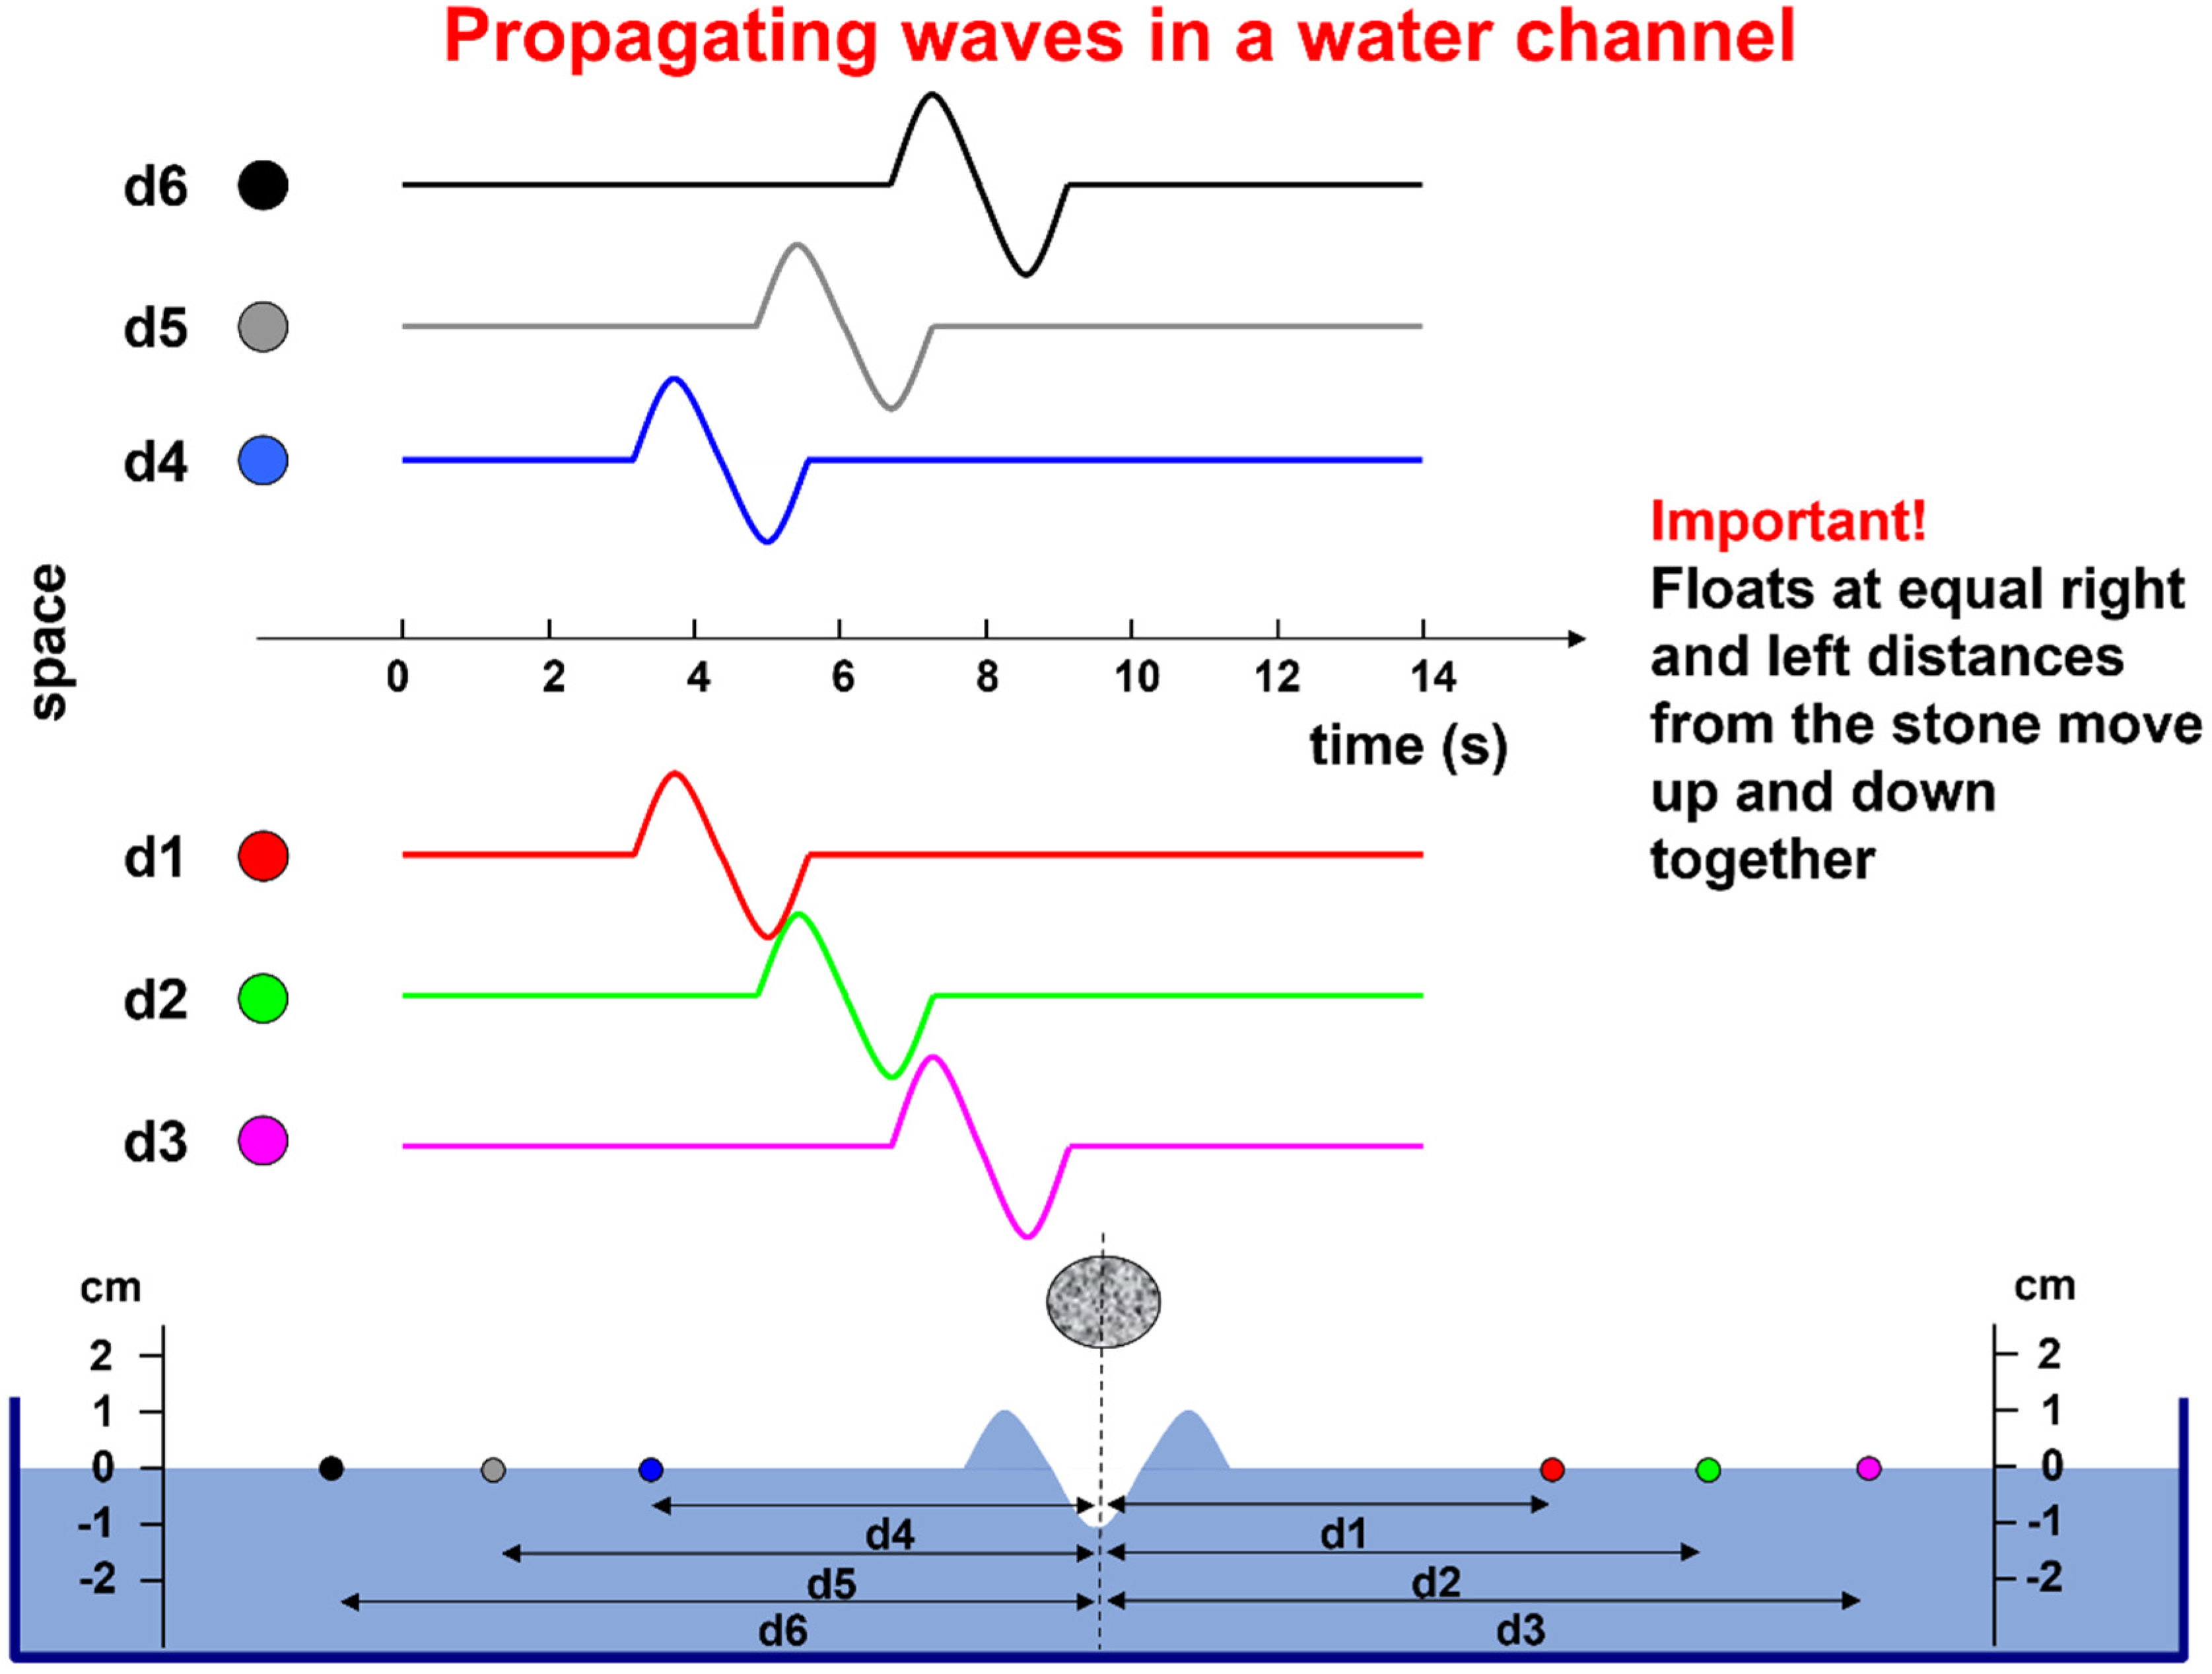
For teaching purposes, simple metaphors and examples may be appropriate. One such example is provided in
Figure 4. The water channel represents a muscle fiber, the falling stone represents the activation of the NMJ, the wave represents the propagating action potential, the floats represent the electrodes, and their displacement with respect to the resting water level represents the action potential that is detected by each electrode, considering that the wave is as wide as the water channel.
In practice, each muscle fiber can be considered as a line and an action potential moving along it can be approximated by three point-like current sources (a tripole), as described in detail in [
24,
25,
26] and on
https://www.robertomerletti.it/en/emg/material/teaching/module9. As is indicated also in Figure 10, the central arrow of the tripole represents positive ions entering the fiber through the open channels and the two lateral arrows represent the positive ions exiting the fiber or negative ions entering it. For the ease of representation and calculation, these ionic currents are modeled as concentrated at three specific points (the tripole).
Figure 5 shows the two MUAPs propagating to the right and left of the IZ of a three-fiber motor unit. The volume conductor is layered (muscle, subcutaneous tissues, and skin). The red bars represent the single-fiber depolarized regions. Three detection points (P1, P2, and P3) are placed on the skin to detect the MUAP traveling to the right. The animation (
Supplementary Materials, Sup3) shows the concept of propagation in time and space, as well as how the MUAP CV can be estimated by placing a series of electrodes along the muscle fiber direction. The electrode pair P4 and P5 detects a differential signal near zero because of the symmetrical position of P4 and P5 with respect to the IZ.
A single fiber action potential, or MUAP, produces a two-dimensional wave of electric potential over the skin that moves along the muscle (
Figure 2 and
Figure 5). To summarize, MUAPs produce waves of monopolar potential across the skin over a muscle. Similar to water waves, these potentials travel on the skin from the region above the NMJ toward the tendons. During travel, they are detected by the electrodes. Electrode pairs are connected to a probe that contains a circuit, called a differential amplifier, that computes the difference between the two potentials that are present, instant by instant, below the two electrodes. Since the sEMG potentials are traveling along muscle fibers, the wave of potential of each MU reaches the electrodes at different times. This process is illustrated in
Figure 5 and Figures 7–9.
2.2.2. The Concepts of Volume Conductor and Crosstalk
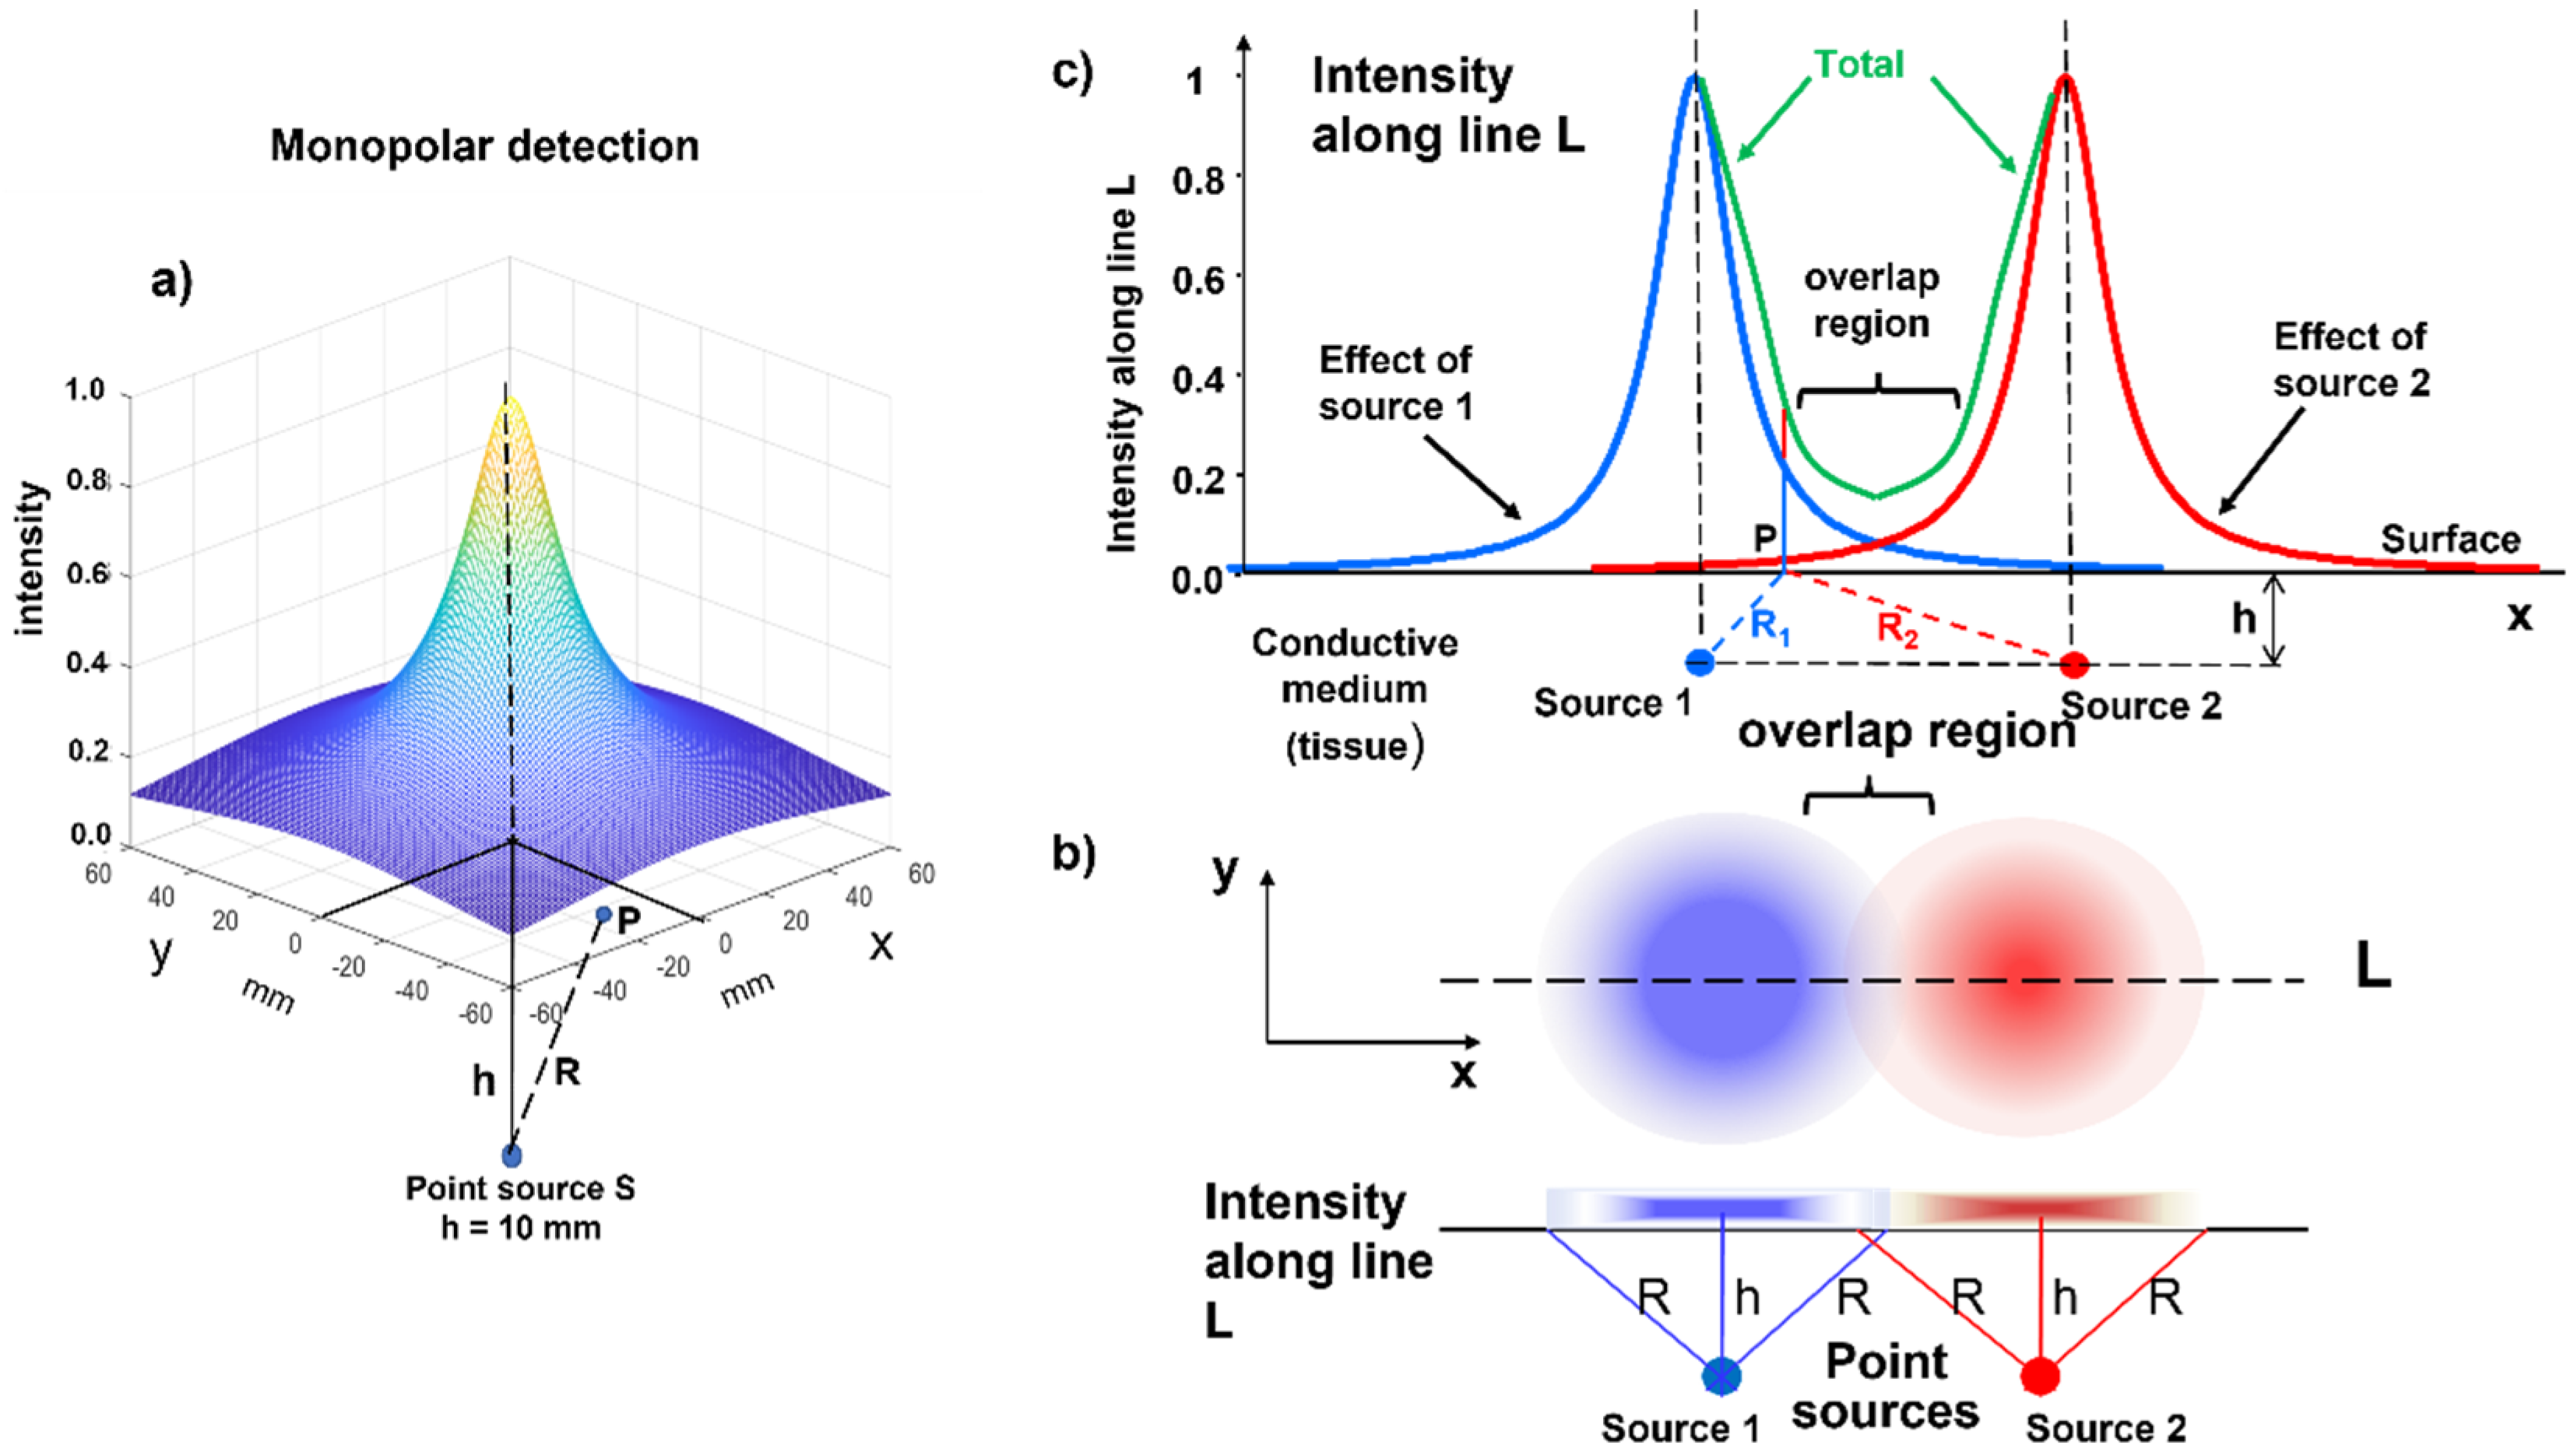
We now look at the skin from above as the surface of a liquid containing light sources. For simplicity, we now consider a point-like light source that is at some depth in this liquid, which causes a halo to appear on the surface. In the same way, the source of an electric field at some depth below the skin produces a voltage distribution on the skin surface due to diffusion in the “conductive volume” (or “volume conductor”) of the tissue, as indicated in
Figure 6a. This effect is known as the “spatial low-pass filter effect”, which is introduced by the volume conductor and means that MUs that have a greater distance from the detection system generate smaller, but spatially more extended, potential distributions.
Two point-like light sources (one blue and one red) produce the two partially overlapping halos, as represented in
Figure 6b,c. The same happens for MUAPs belonging to different muscles: their surface representations can reach nearby muscles. This phenomenon is called “crosstalk”, i.e., the presence of potentials on a target muscle that are produced by a different muscle. This may happen because of the blurring effect that is produced by the subcutaneous tissues and by a further phenomenon called the end-of-fiber (EOF) effect, which is discussed later. The following section explains the detection modalities that have been developed to partially compensate for this blurring effect, thus providing “spatial selectivity” to the sEMG measurement, which is often a pre-requisite for clinical application.
2.3. Teaching Differential/Bipolar Detection, Innervation Zones, and the End-of-Fiber Effect
The electrical image describing the instantaneous distribution of the sEMG voltage is called “monopolar” when the voltage of each point is referred to a remote reference taken as zero (i.e., the resting water level in
Figure 4). This image is “sampled” in a number of points in space (electrodes), whose voltages can be combined and manipulated to achieve specific purposes.
Figure 7 shows a set of the simplest of these manipulations, called “spatial filters” (see
Section 2.3.1 and
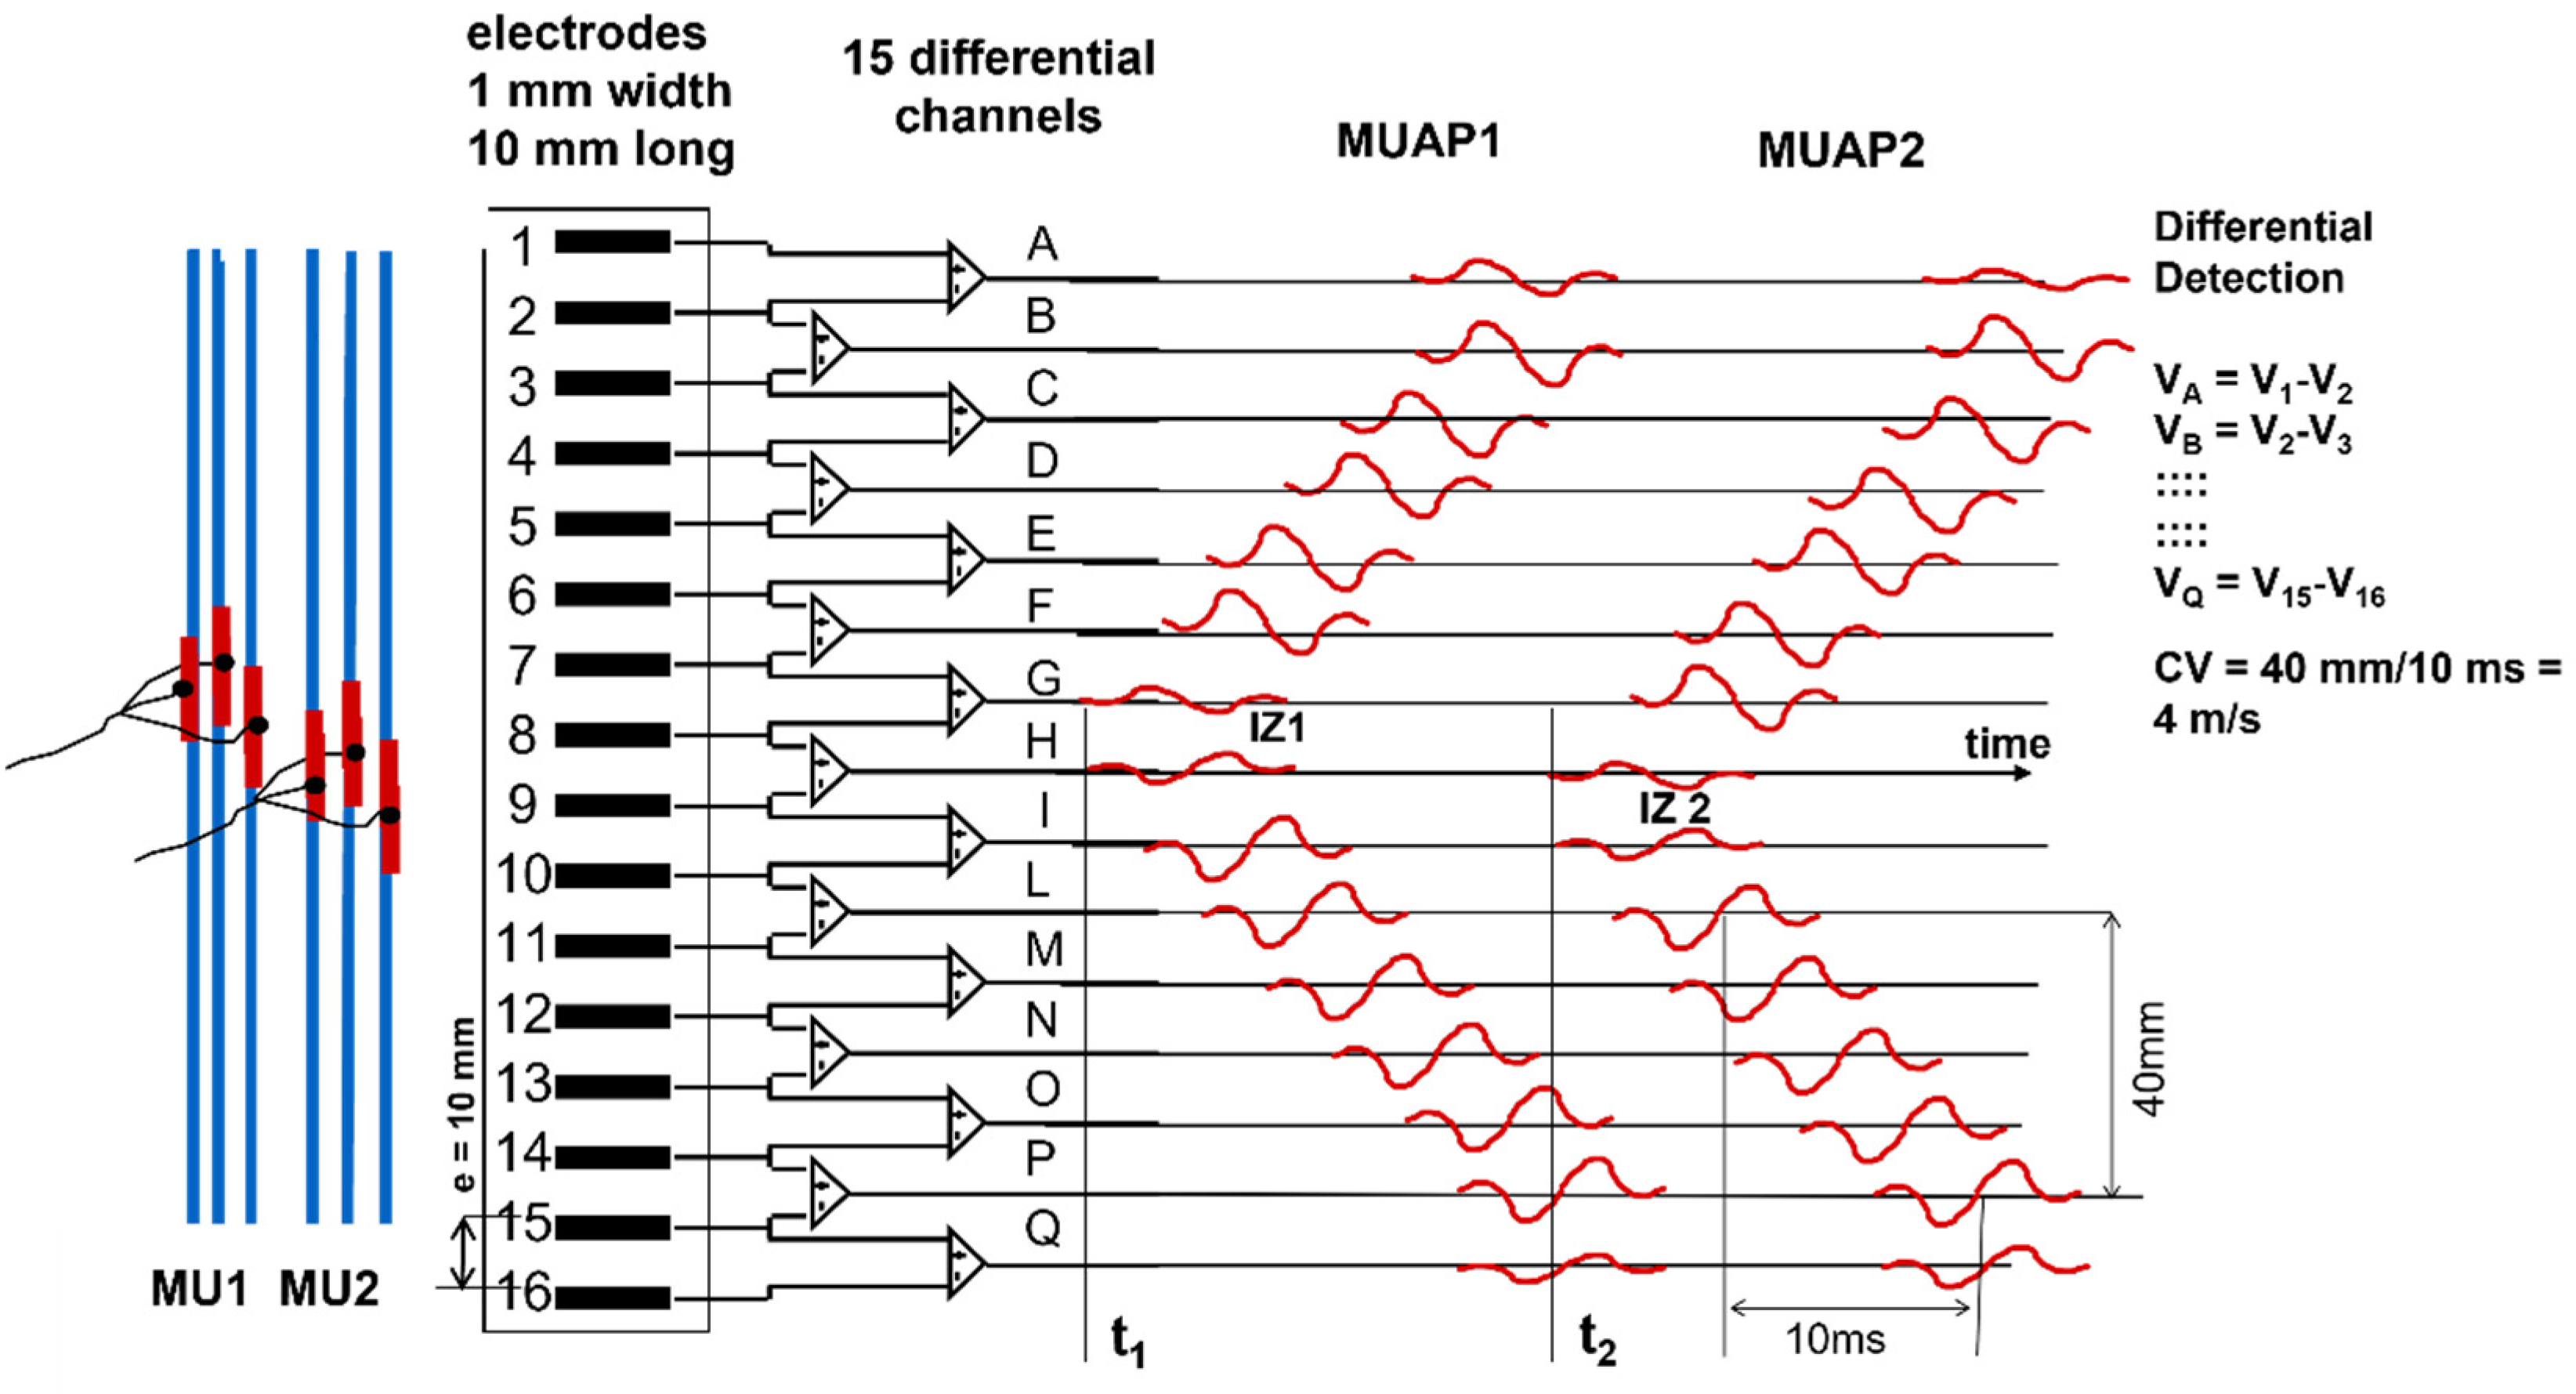
Section 2.3.2). The time-varying image generated by the firing of MU1 and MU2 is sampled in space, along a line, by a 16-electrode linear array and the differences
VA = V1 − V2,
VB = V2 − V3, … up to
VQ = V15 − V16 are presented as output signals. Note that these differences are calculated by the 15 differential amplifiers that compute
V+ − V−. If the linear electrode array were inverted (with Electrode 16 at the top and Electrode 1 at the bottom), the polarity of all signals would be inverted. Note that the two MUs have different IZs, located below Electrodes 7–8 (Channel G) and Electrodes 8–9 (Channel H), and their fibers terminate under the two ends of the linear electrode array. Therefore, it is possible to estimate the MU fiber length, as well as the CVs and the IZs. Note, for MU1, the lack of propagation in the action potentials that are detected by Amplifier A (compared to B) and Amplifier Q (compared to P). This lack of propagation indicates the end of the fibers (better defined later in this subsection) and, therefore, their length spans the distance between Amplifiers B and P. Additionally, note that the channels on one side of the IZ have a polarity while those on the other side have the opposite polarity. The amplitudes of the single differential (SD) signals detected above the IZs are near zero.
Note that signals from double (or multiple) IED values may be obtained either by taking the difference between the corresponding monopolar signals or by adding adjacent SD signals, since V1 − V3 = (V1 − V2) + (V2 − V3). Double differential (DD) signals can be obtained from the difference between adjacent SD signals.
These are useful properties of differential detection and allow for the easy identification of the IZ of an MU as the region where the action potentials change polarity. This information can have clinical applications (see
Section 4.4).
Figure 8 and
Figure 9 depict experimental differential recordings from two biceps brachii, both obtained with linear electrode arrays. Nine MUAPs can be identified in
Figure 8 within a 100-ms time window. It is evident that all of the detected MUs are innervated under Channel 8 and have about the same length. Minor differences between their conduction velocities cannot be detected visually and require calculations using software.
Figure 9 shows three MUAPs generated by different MUs within a 45-ms time window. Two MUs are innervated between Channels 8 and 9 and one is innervated under Channel 4. Note that (a) the MU fibers are longer than the array and (b) the MUAP propagation is monodirectional upward from Channel 9 to 11 and downward from Channel 3 to 1 and bidirectional between Channels 8 and 4 (downward for MU1 and MU2, upward for MU3). The average value of the muscle fiber CV (global CV) cannot be estimated using Channels 4 to 8. The decomposition of the sEMG into the constituent MUAP trains is necessary to estimate the CVs of individual MUs [
23].
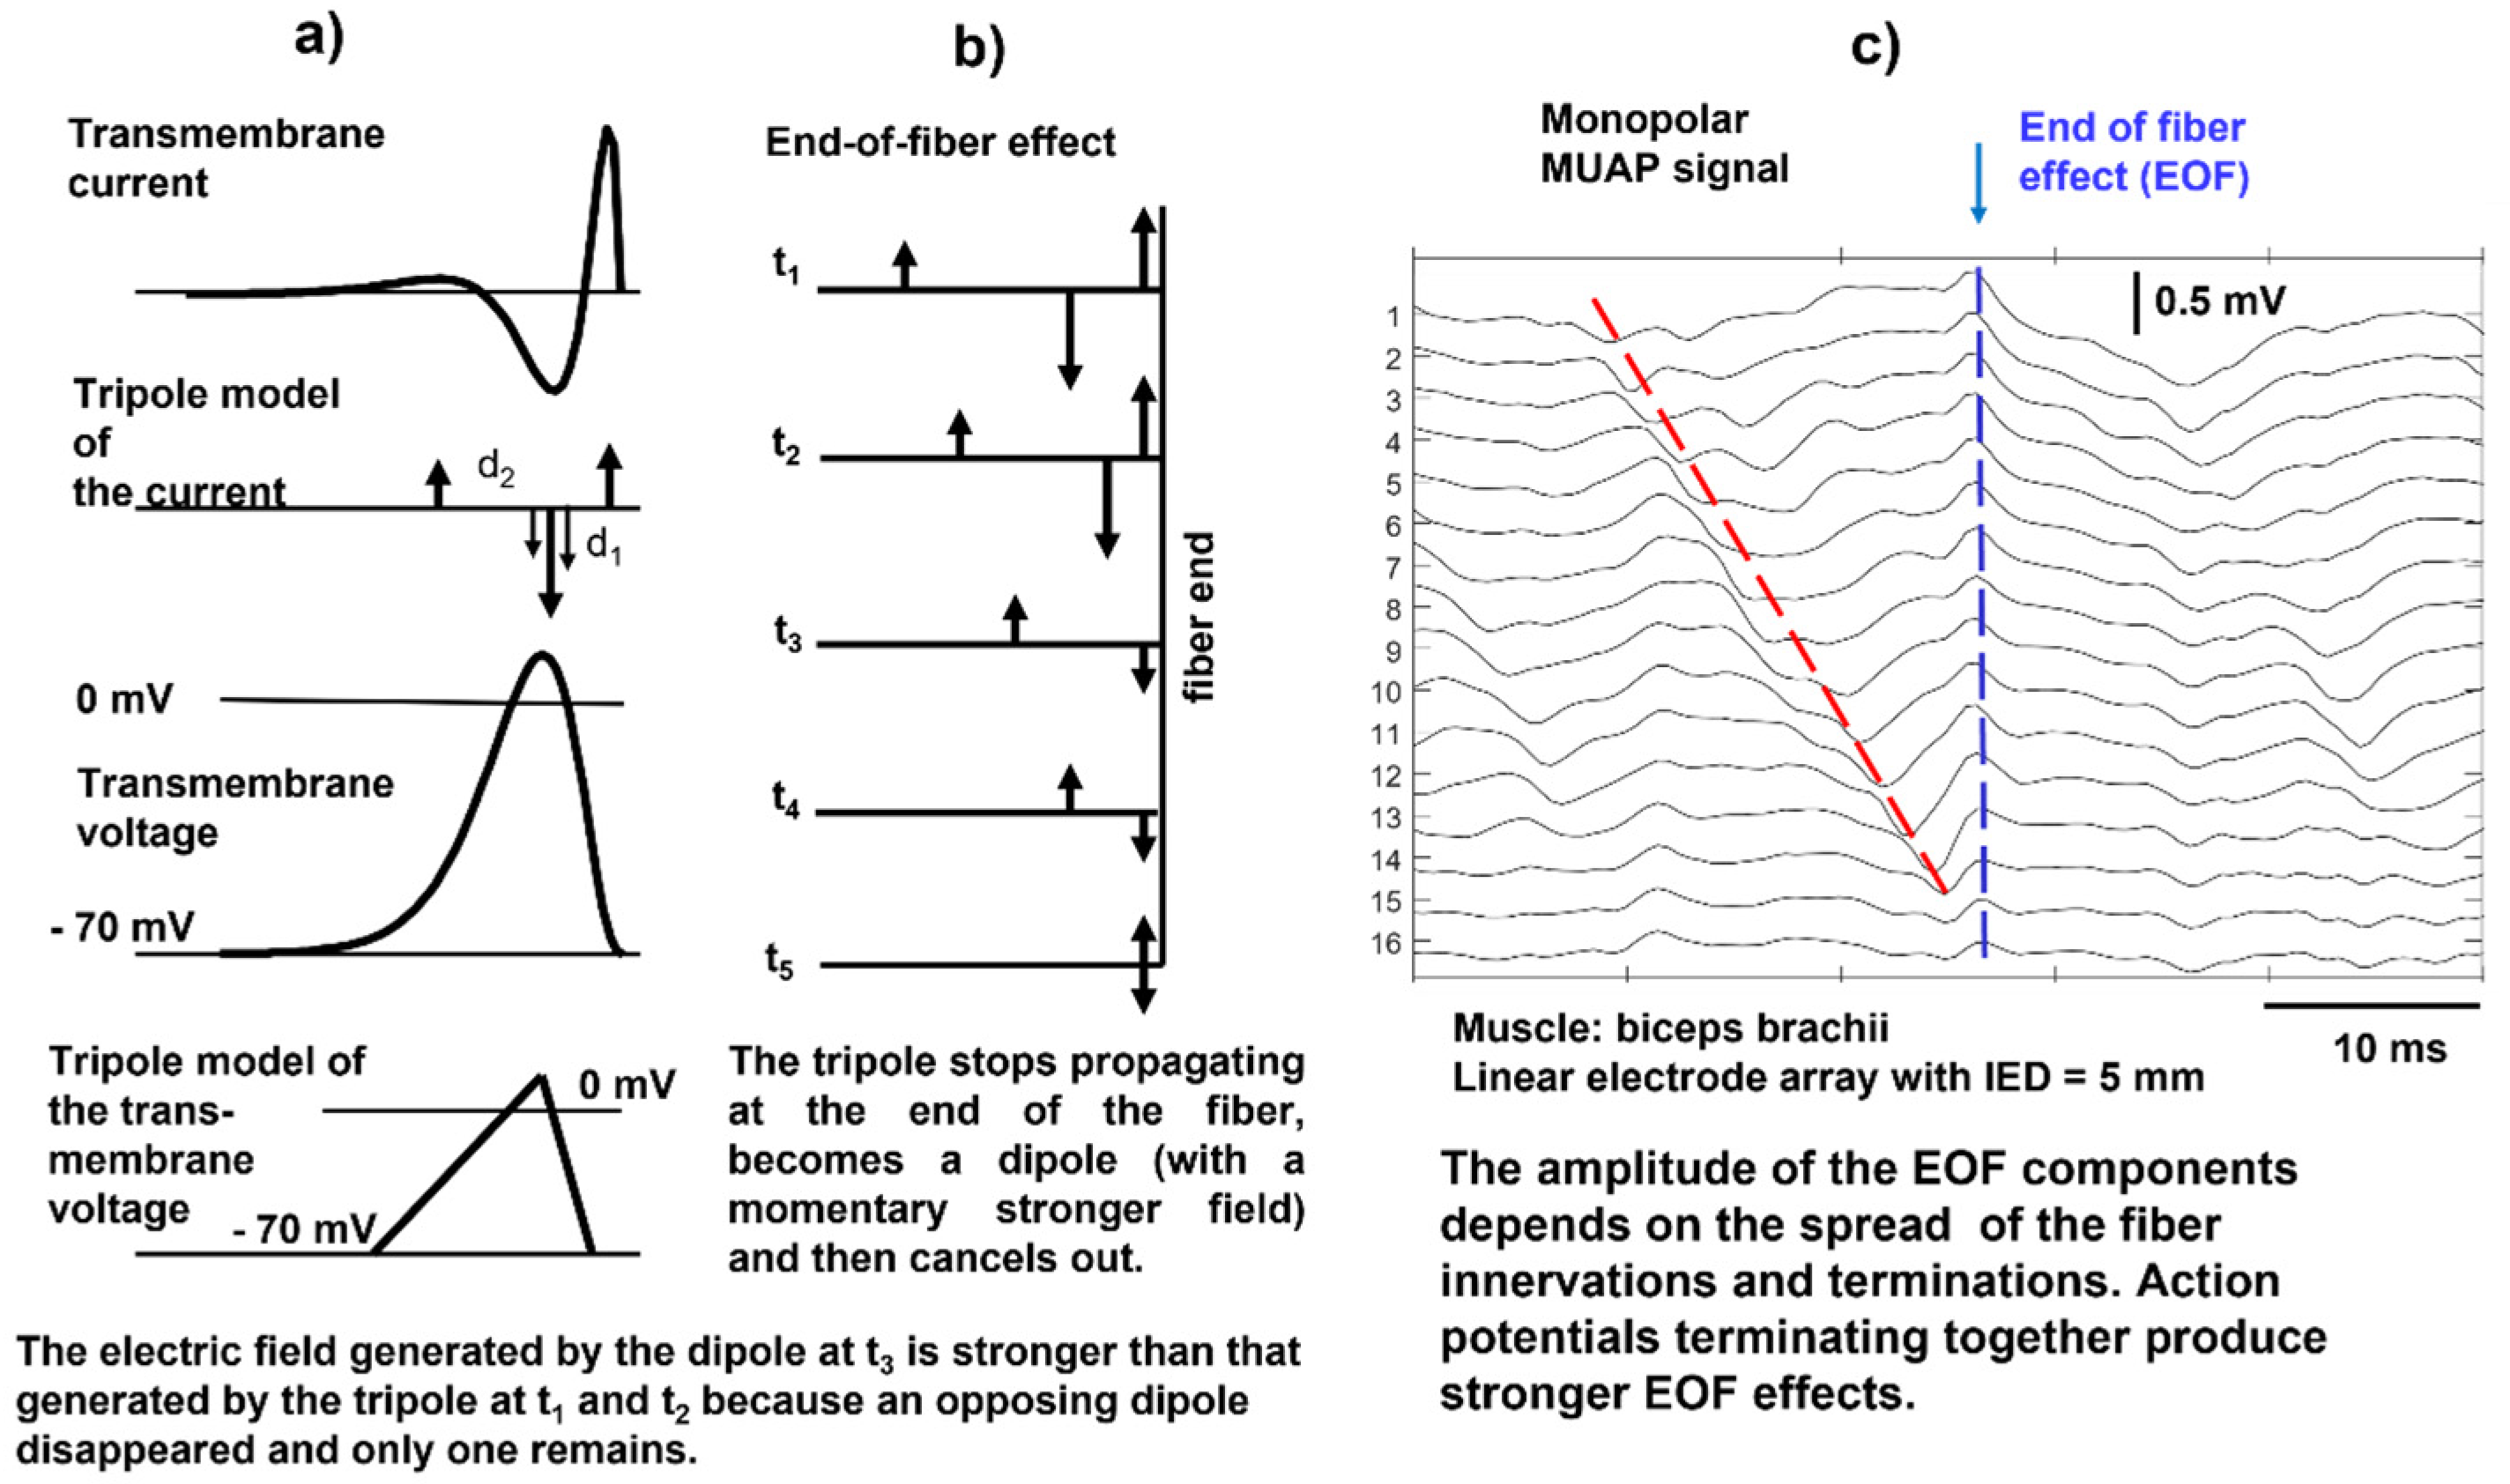
When the action potential reaches the end of a muscle fiber, it stops generating a transient signal; this is referred to as the end-of-fiber (EOF) effect, which is described in detail in
https://www.robertomerletti.it/en/emg/material/teaching/module5 and
https://www.robertomerletti.it/en/emg/material/teaching/module9. This phenomenon is modeled by describing the transmembrane current distribution with a tripole that is made of two opposing dipoles (d
1 and d
2), as indicated in
Figure 10a. When the tripole reaches the end of the fiber, the first dipole shrinks (
Figure 10b, times t
1 and t
2) and disappears (
Figure 10b, time t
3), leaving the second dipole d
2 whose field is stronger because it is no longer partially canceled by d
1. In turn, d
2 shrinks (
Figure 10b, time t
4) and disappears (
Figure 10b, time t
5). This model explains the presence of non-traveling waves in the monopolar signals, as indicated in
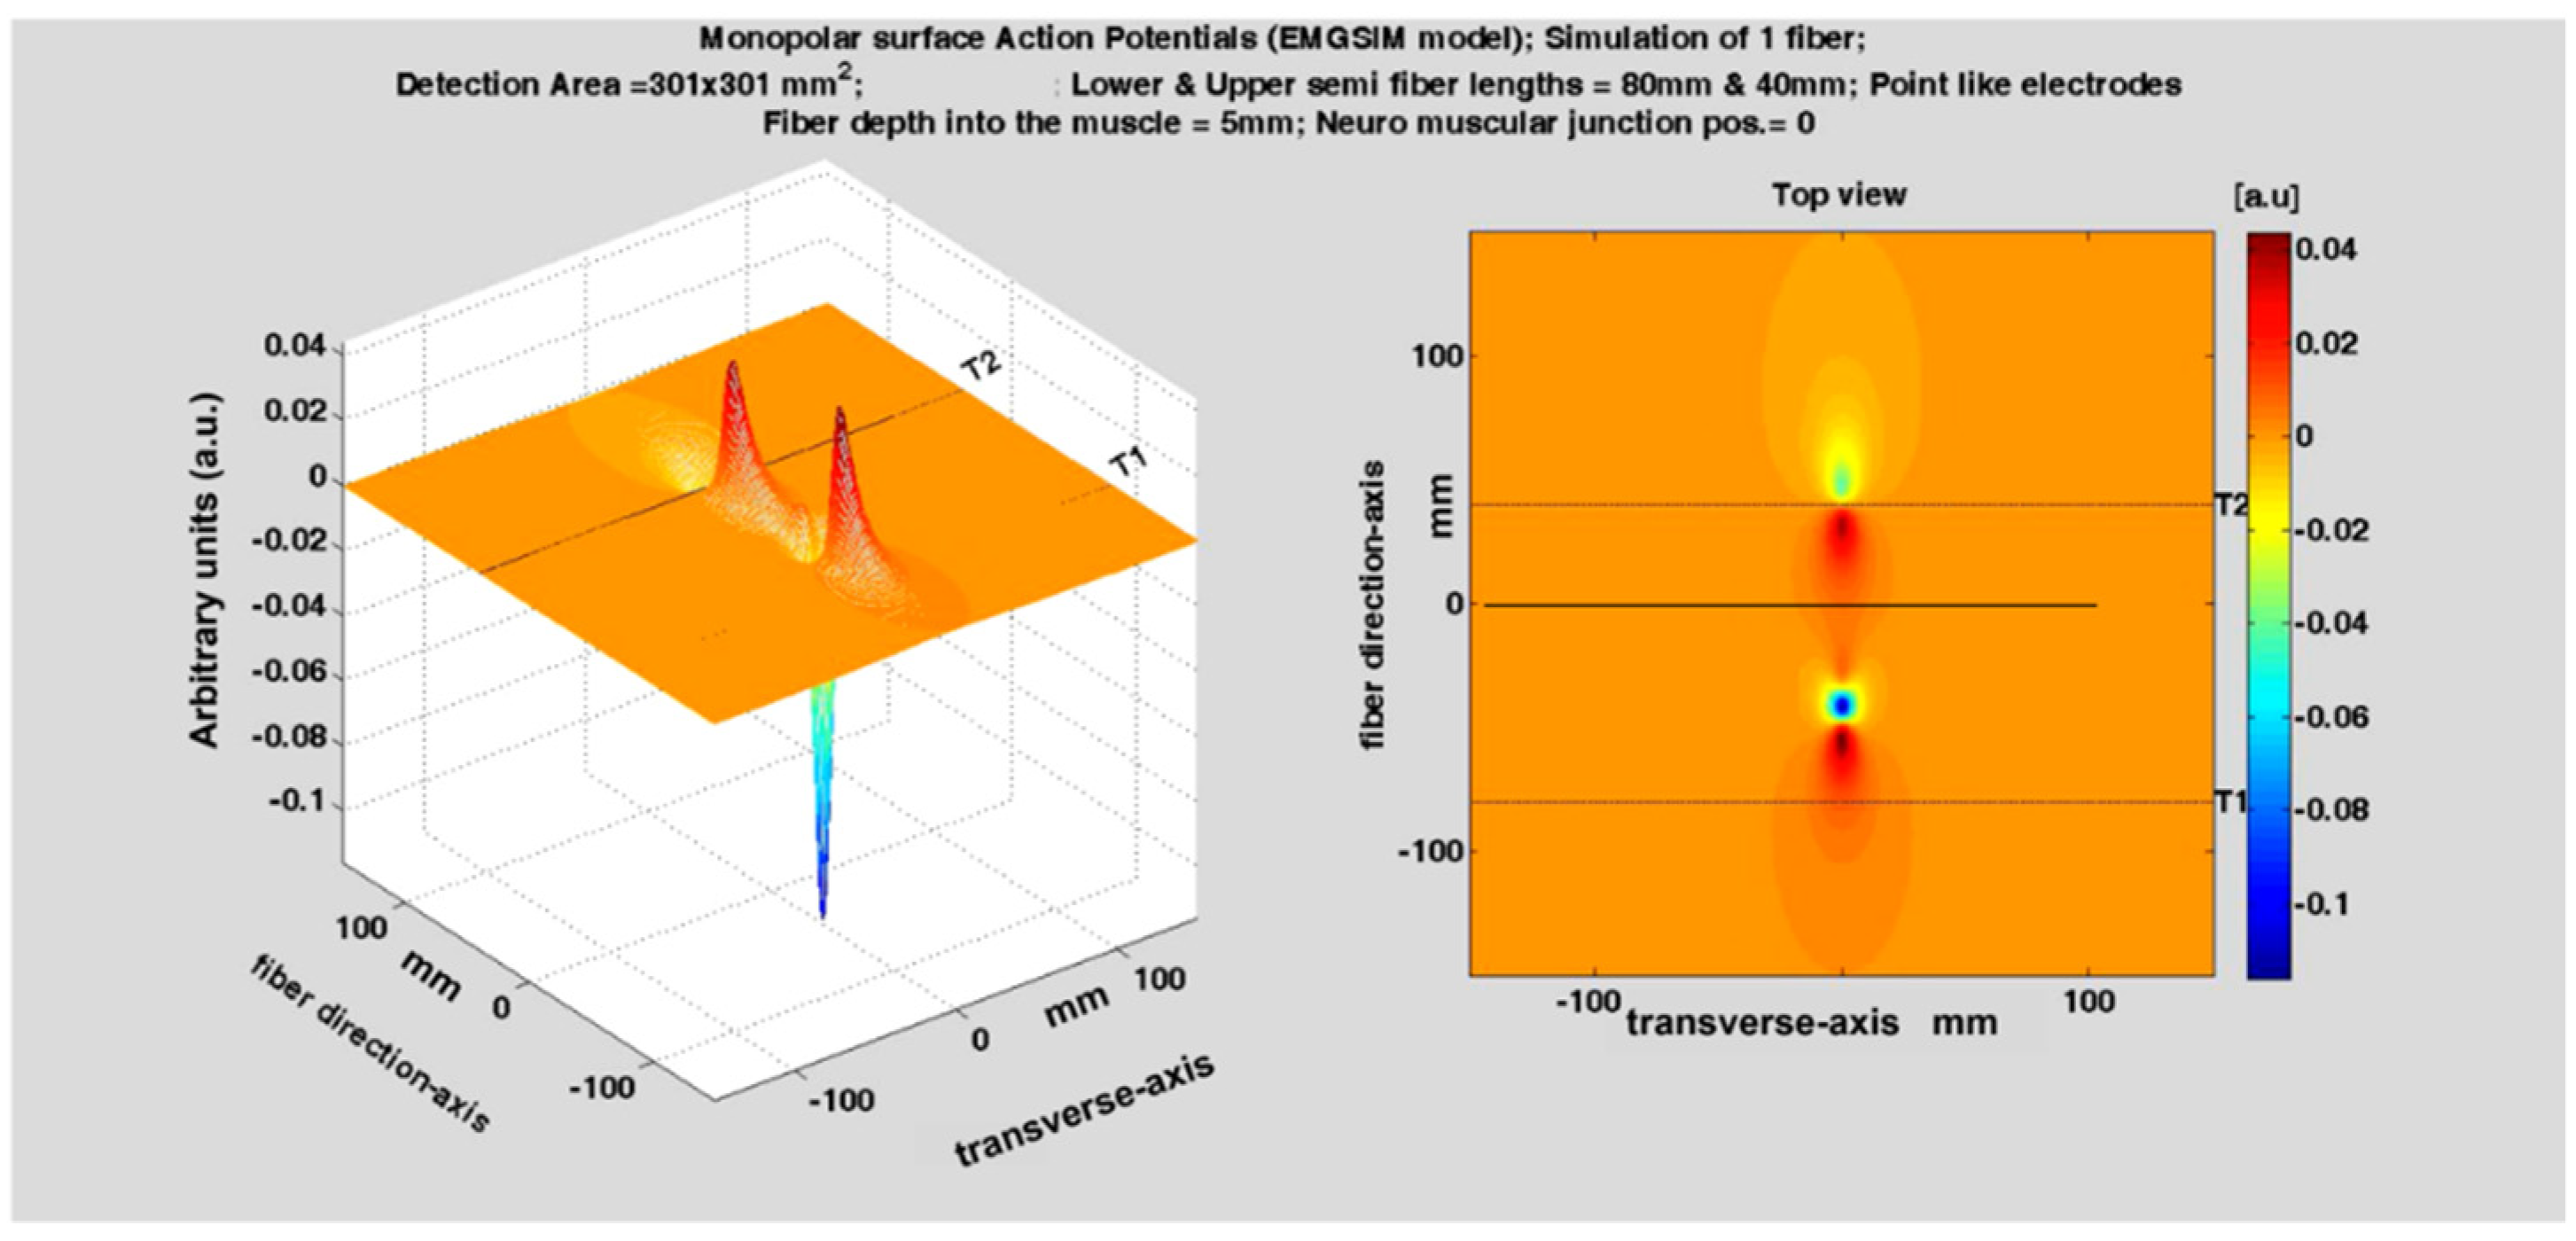
Figure 10c, but the exact mechanism is not known. Non-propagating signal components are often observed in monopolar sEMG signals and are reduced by bipolar (SD) detection, as well as other “common mode” signals. An example of the EOF effect is provided in the simulation video of
Figure 11.
2.3.1. Teaching Action Potentials through Modeling
Despite their many limitations, models of sEMG are powerful teaching tools because they can show, with some approximation, the effects that changing individual fiber (or MU) parameters have on the sEMG signal [
24,
25,
27,
28]. Additional examples of this use of models for teaching muscle electrophysiology and interpreting sEMG features are provided in
https://www.robertomerletti.it/en/emg/material/teaching/module9.
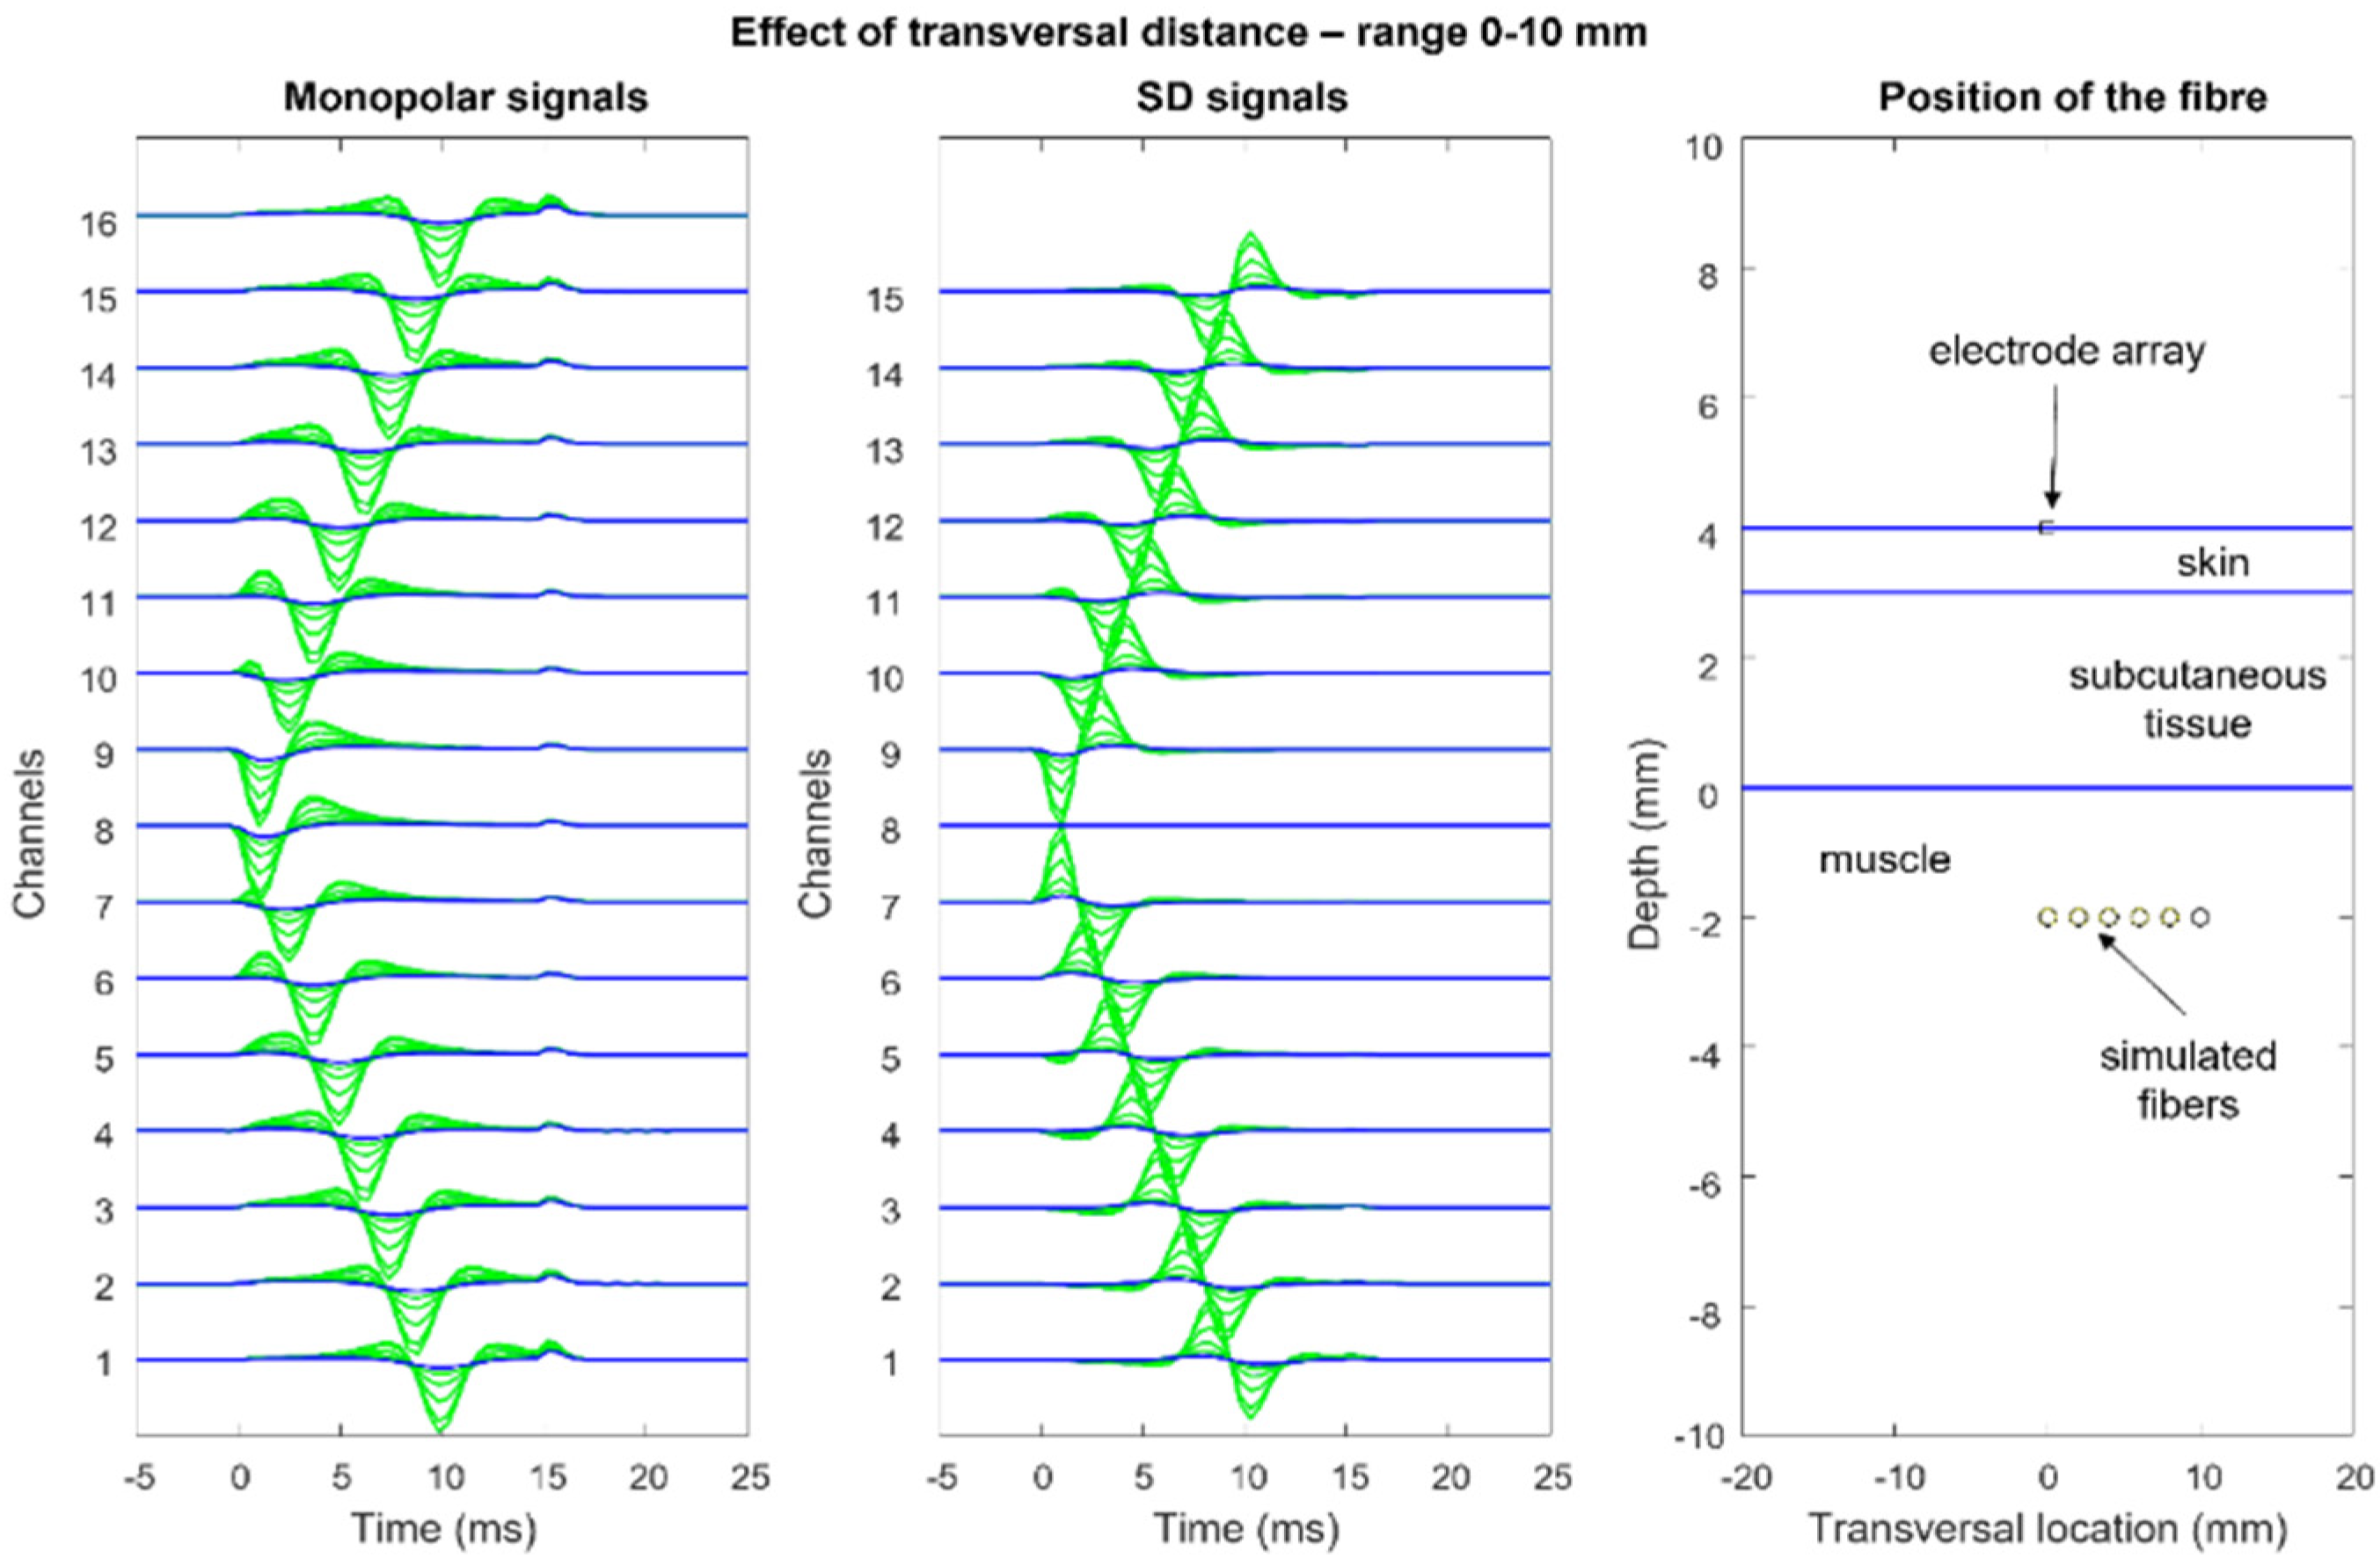
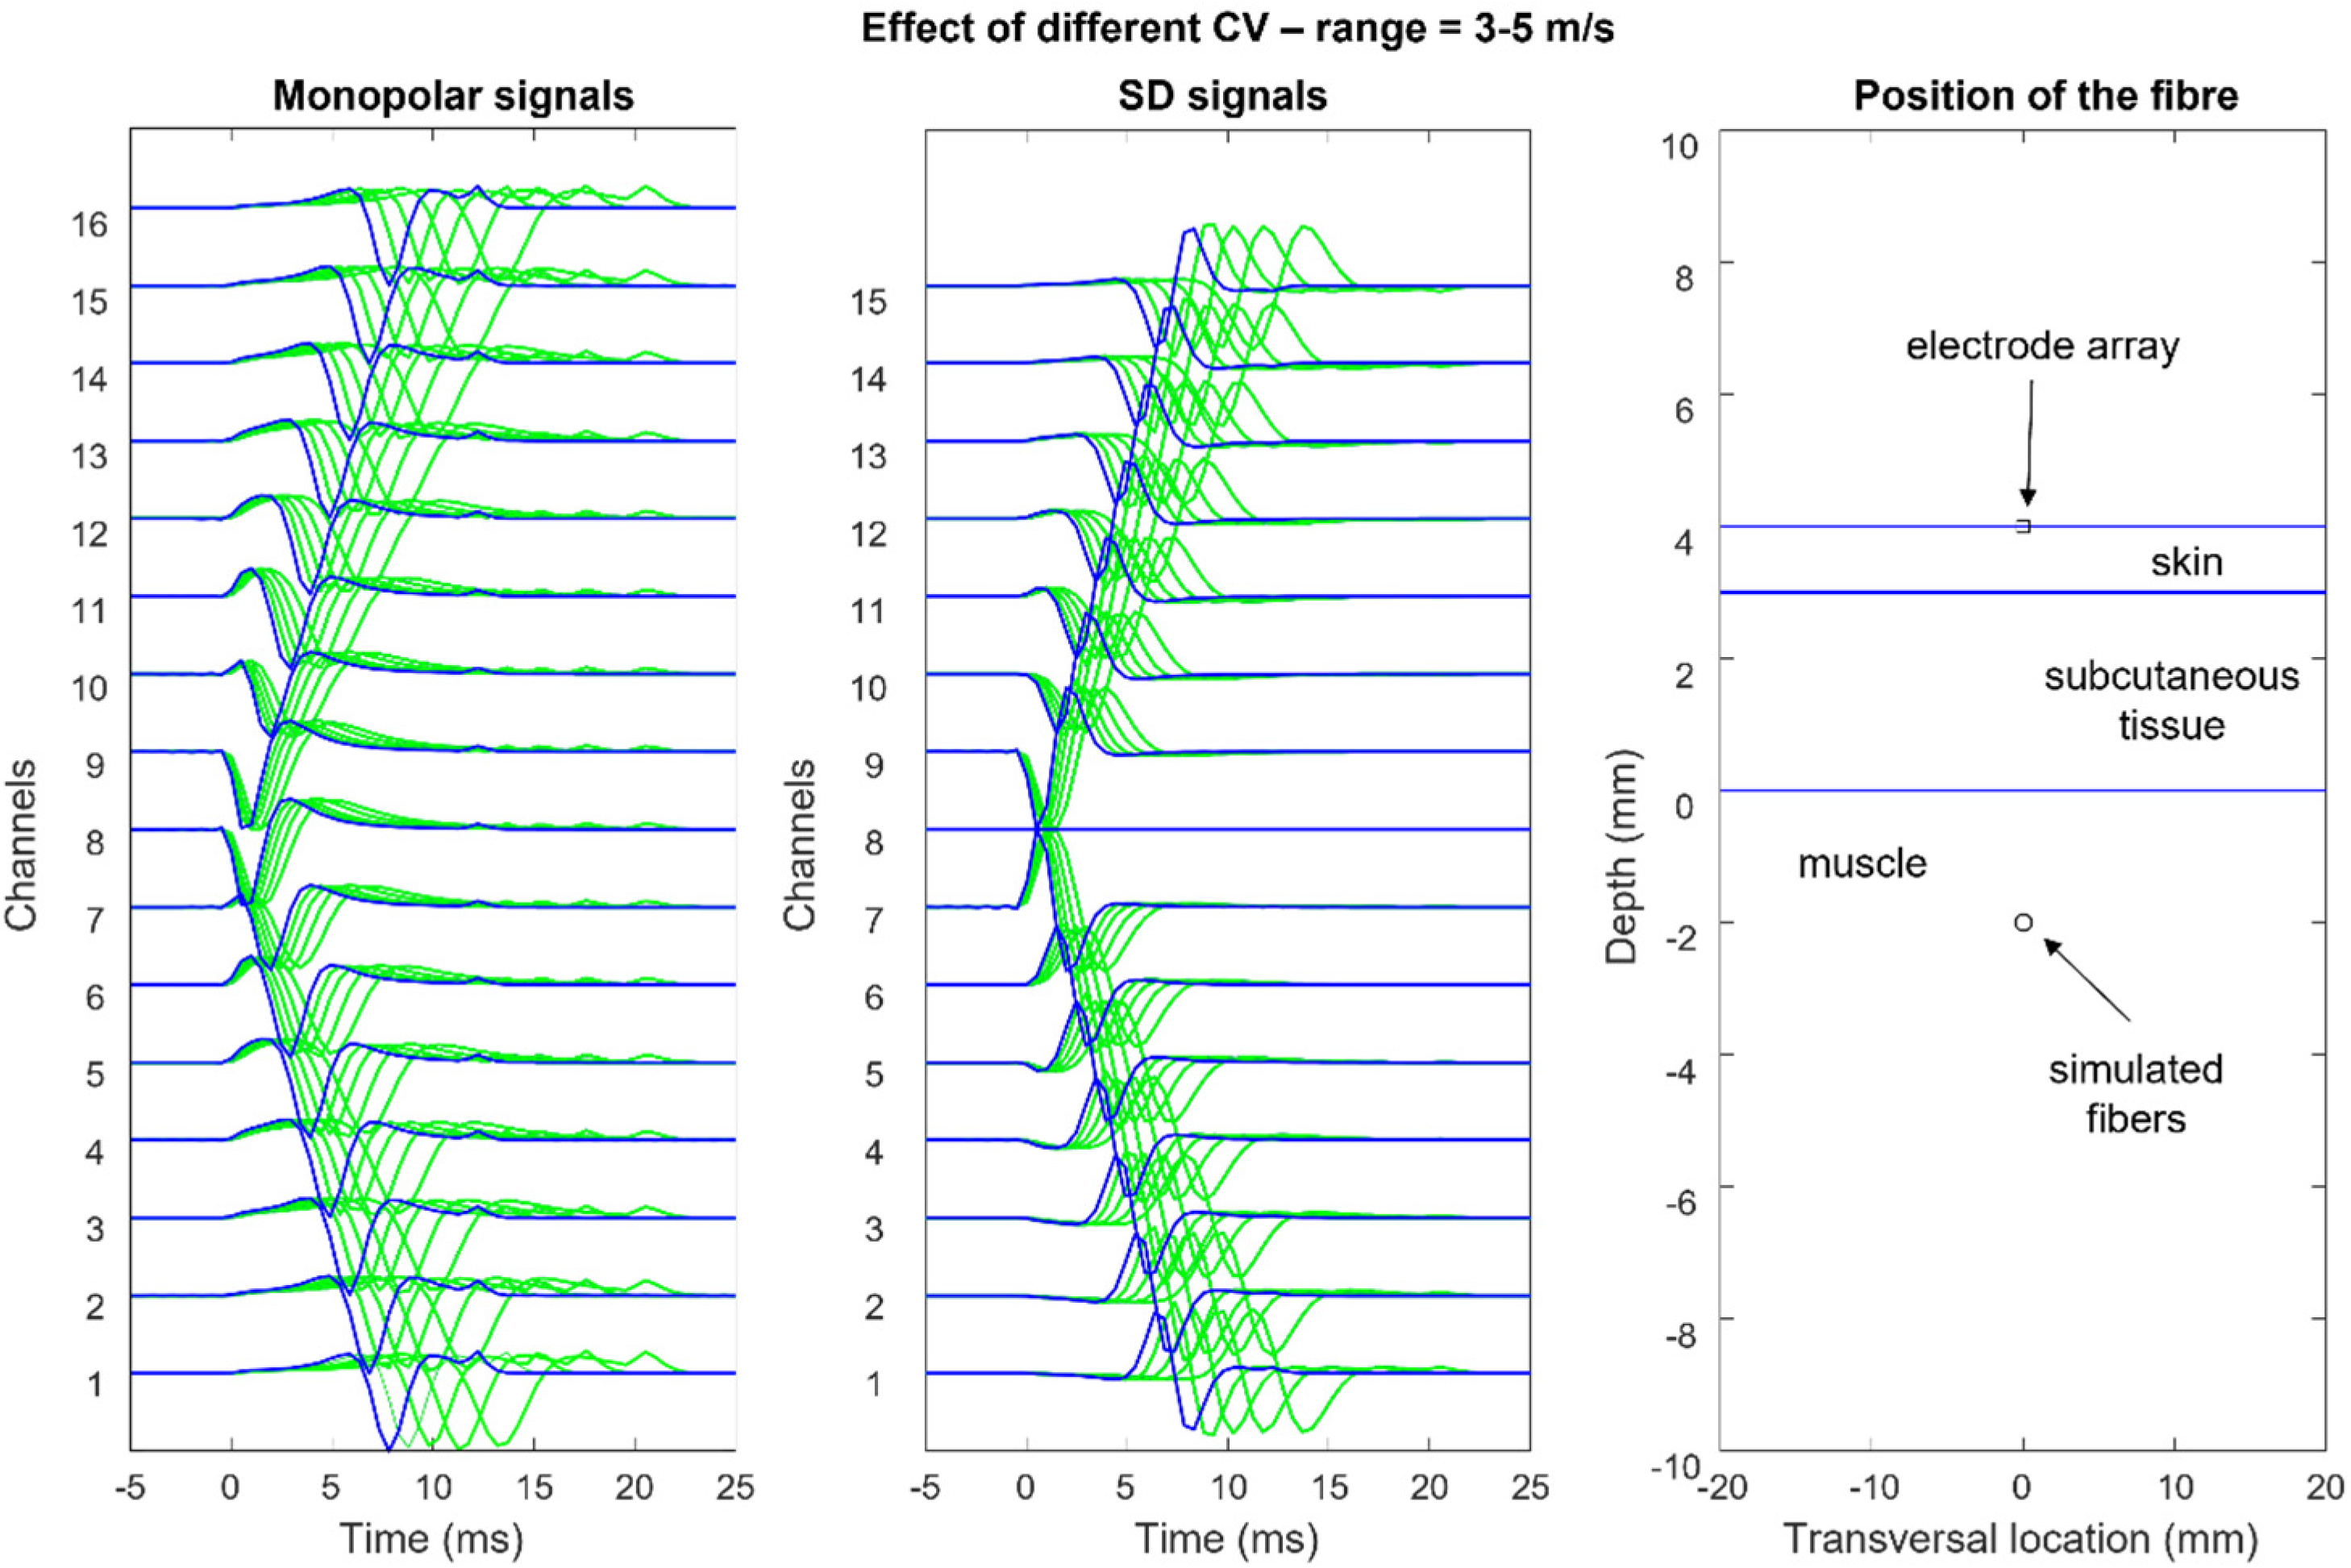
Figure 12,
Figure 13,
Figure 14 and
Figure 15 show the simulation of an action potential propagating along a single fiber that is innervated in the middle and detected by a 16-point-like-electrode array with an IED of 5 mm. The monopolar and SD signals are presented. The effects of fiber depth, lateral displacement with respect to the electrode array, the misalignment angle between the fiber and the electrode array, and conduction velocity are depicted. The effects are about the same for an MUAP when the IZ of the MU is narrow.
According to the model, the decrement of sEMG amplitude (root mean square, RMS) with increasing depth within the muscle is similar to that due to the increasing thickness of subcutaneous tissue. Experimental findings from obese subjects have indicated that sEMG is still detectable with subcutaneous tissue thicknesses of 20–30 mm [
30]. The lowering of the electrode–skin interface noise may increase detectability at greater distances in the future [
31].
Simulations of pathological fibers and MU alterations are lacking in the literature and provide an interesting research field for clinical application, the improvement of the available models, and application in the teaching and clinical interpretation of sEMG signals. A review of the use of sEMG in neuromuscular pathologies is provided by Hogrel [
32].
2.3.2. Spatial Filters
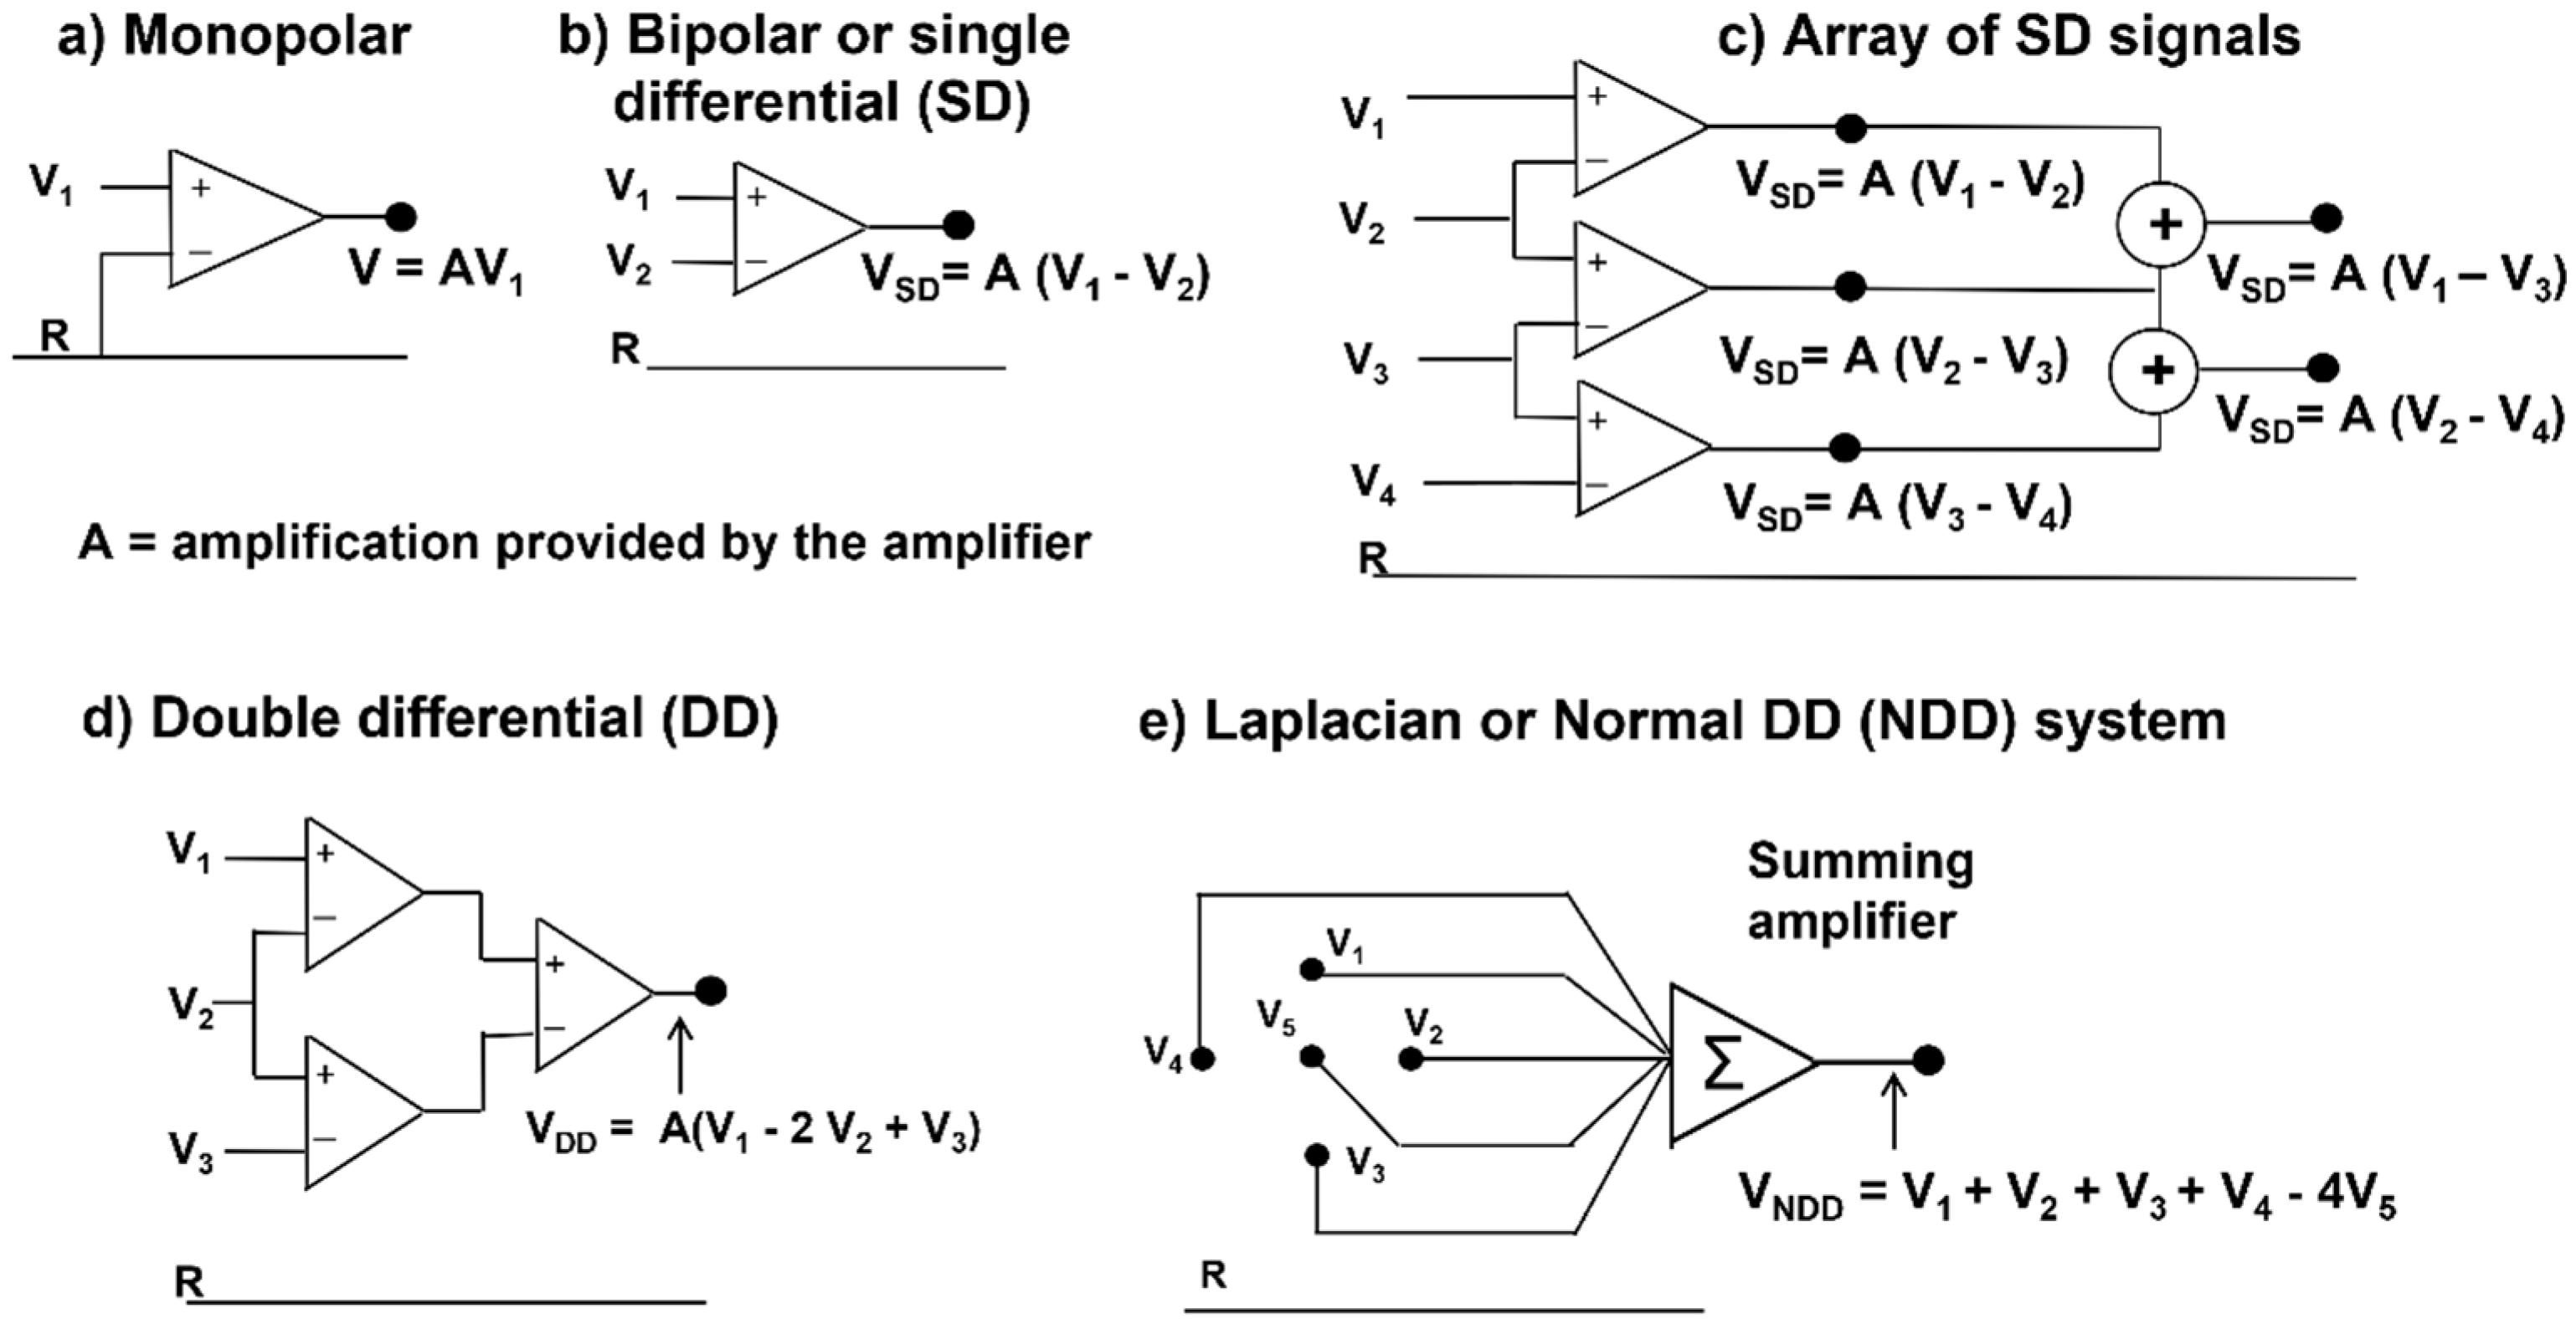
The only potential map that is generated on the skin by a biological signal is the monopolar map. Other maps may be obtained using analogue or numerical combinations of monopolar electrode potentials, as indicated in
Figure 16. These combinations, or montages, are usually “differential” and have different properties, with the main difference being the reduction in the detection volume, i.e., greater spatial selectivity. However, “low-pass spatial filters” may be obtained using larger electrodes or averaging blocks of monopolar signals to simulate larger electrodes.
2.4. Two-Dimensional (2D) sEMG Representation and sEMG Images
With respect to linear electrode arrays, bi-dimensional electrode arrays or grids provide additional information in the muscle fiber transversal direction and allows for the better discrimination between MU “signatures” and orientation, thereby facilitating the decomposition of the sEMG into the constituent MUAPs, as well as the localization of the active MUs in space and the size of the MU territory (i.e., the spatial distribution of the muscle fibers belonging to an MU).
Figure 17a shows a 2D grid of 8 × 4 electrodes. Two of these grids are applied to the right erector spinae and two are applied to the left, as in
Figure 17b,c, which shows the values (see the color scale) of the RMS of the differential voltage that is detected by each longitudinal pair of electrodes of the two grids placed from proximal to distal, on the right side, over a time window of 1 s.
Figure 17d shows the interpolated version of the map and the direction of the fibers. The orientation of the fibers is outlined. It is also evident that the quality (and correctness) of the interpolated map is strongly dependent on the IED. In the case of sEMG images, an IED of 10 mm is a borderline value [
33] and provides an image reconstruction that has minor inaccuracies (see
Section 4).
The concepts presented in this section raise a number of practical questions, such as “What should the size (i.e., the electrical contact area) of the electrodes and the IED be to allow for the correct reconstruction of a sampled image by interpolation?”, “Are there optimal values for the size and IED for maximal information extraction?”, “How big should an electrode grid be?”, “Where should it be located?”, “What are the advantages and disadvantages of monopolar versus SD images?”, and “When is a single electrode pair preferable to HDsEMG?”. These and many other issues are addressed in
Section 3 and
Section 4 and in sEMG textbooks and articles [
22,
33,
34] (see
https://www.robertomerletti.it/en/emg/material/books/ for a more complete list), which provide a comprehensive mathematical analysis of these problems.
Section 3 and
Section 4 attempt to answer these questions in a simple way.
3. The Role of Electrode Size and Interelectrode Distance in Bipolar sEMG
Electrodes that are applied to the skin are not point-like, as is often assumed in modeling. From the theoretical signal processing point of view, the full information that is contained in the superficial distribution of EMG potential can only be obtained when proper sampling in space is performed (and when spatial aliasing and smoothing are avoided, see [
33] for more details). This implies the need for small electrode sizes and small IEDs (a) to avoid the substantial filtering that is introduced by the transfer function of the electrode pair and (b) to reduce crosstalk. In turn, this implies the need for the selective detection of the most superficial MUs.
However, in many clinical applications, only a portion of this information is useful and greater detection volumes may be desirable, which provide larger signals at the price of lower selectivity and possible crosstalk from nearby muscles [
35,
36]. This also applies to single electrode pairs, in which small EEG electrodes (e.g.,
http://www.gereonics.com/eegelectrodes.html may be preferable to the larger pediatric ECG electrodes that are often used. Commercially available active sEMG sensors that carry two parallel silver bars, 10 mm long and 10 mm apart, also provide a good solution (e.g.,
https://delsys.com/sensors.
A pair of large electrodes (diameter = 10 mm) and a large IED (e.g., 20 mm) introduce the attenuation of the highest harmonics in the signal (see Figures 2.5 and 3.11 of [
35]), as explained in the following subsections. For most clinical applications of bipolar sEMG, this low-pass filtering is acceptable. Conversely, the reduced selectivity, i.e., the risk of crosstalk, may be critical and lead to misinterpretations. Thus, miniaturized electrodes should be used when assessing muscles with small cross-sectional areas, such as forearm muscles and children’s muscles.
In sport applications, sEMG can be used to compute the so-called localized myoelectric manifestations of muscle fatigue. Since this indicator is based on the spectral features of the signals, the filtering effect of the detection system (i.e., electrode size and IED) cannot be ignored. Users must be aware that their results depend on the electrode configuration and cannot be compared to those obtained using different electrode geometries, e.g., in the literature. The user must also be aware that the electrode size is the electrical contact area (possibly mediated by gel) and does not include the surface of the external adhesive disks that keep the electrode in place when present.
3.1. Electrode Size and Its Filtering Effect
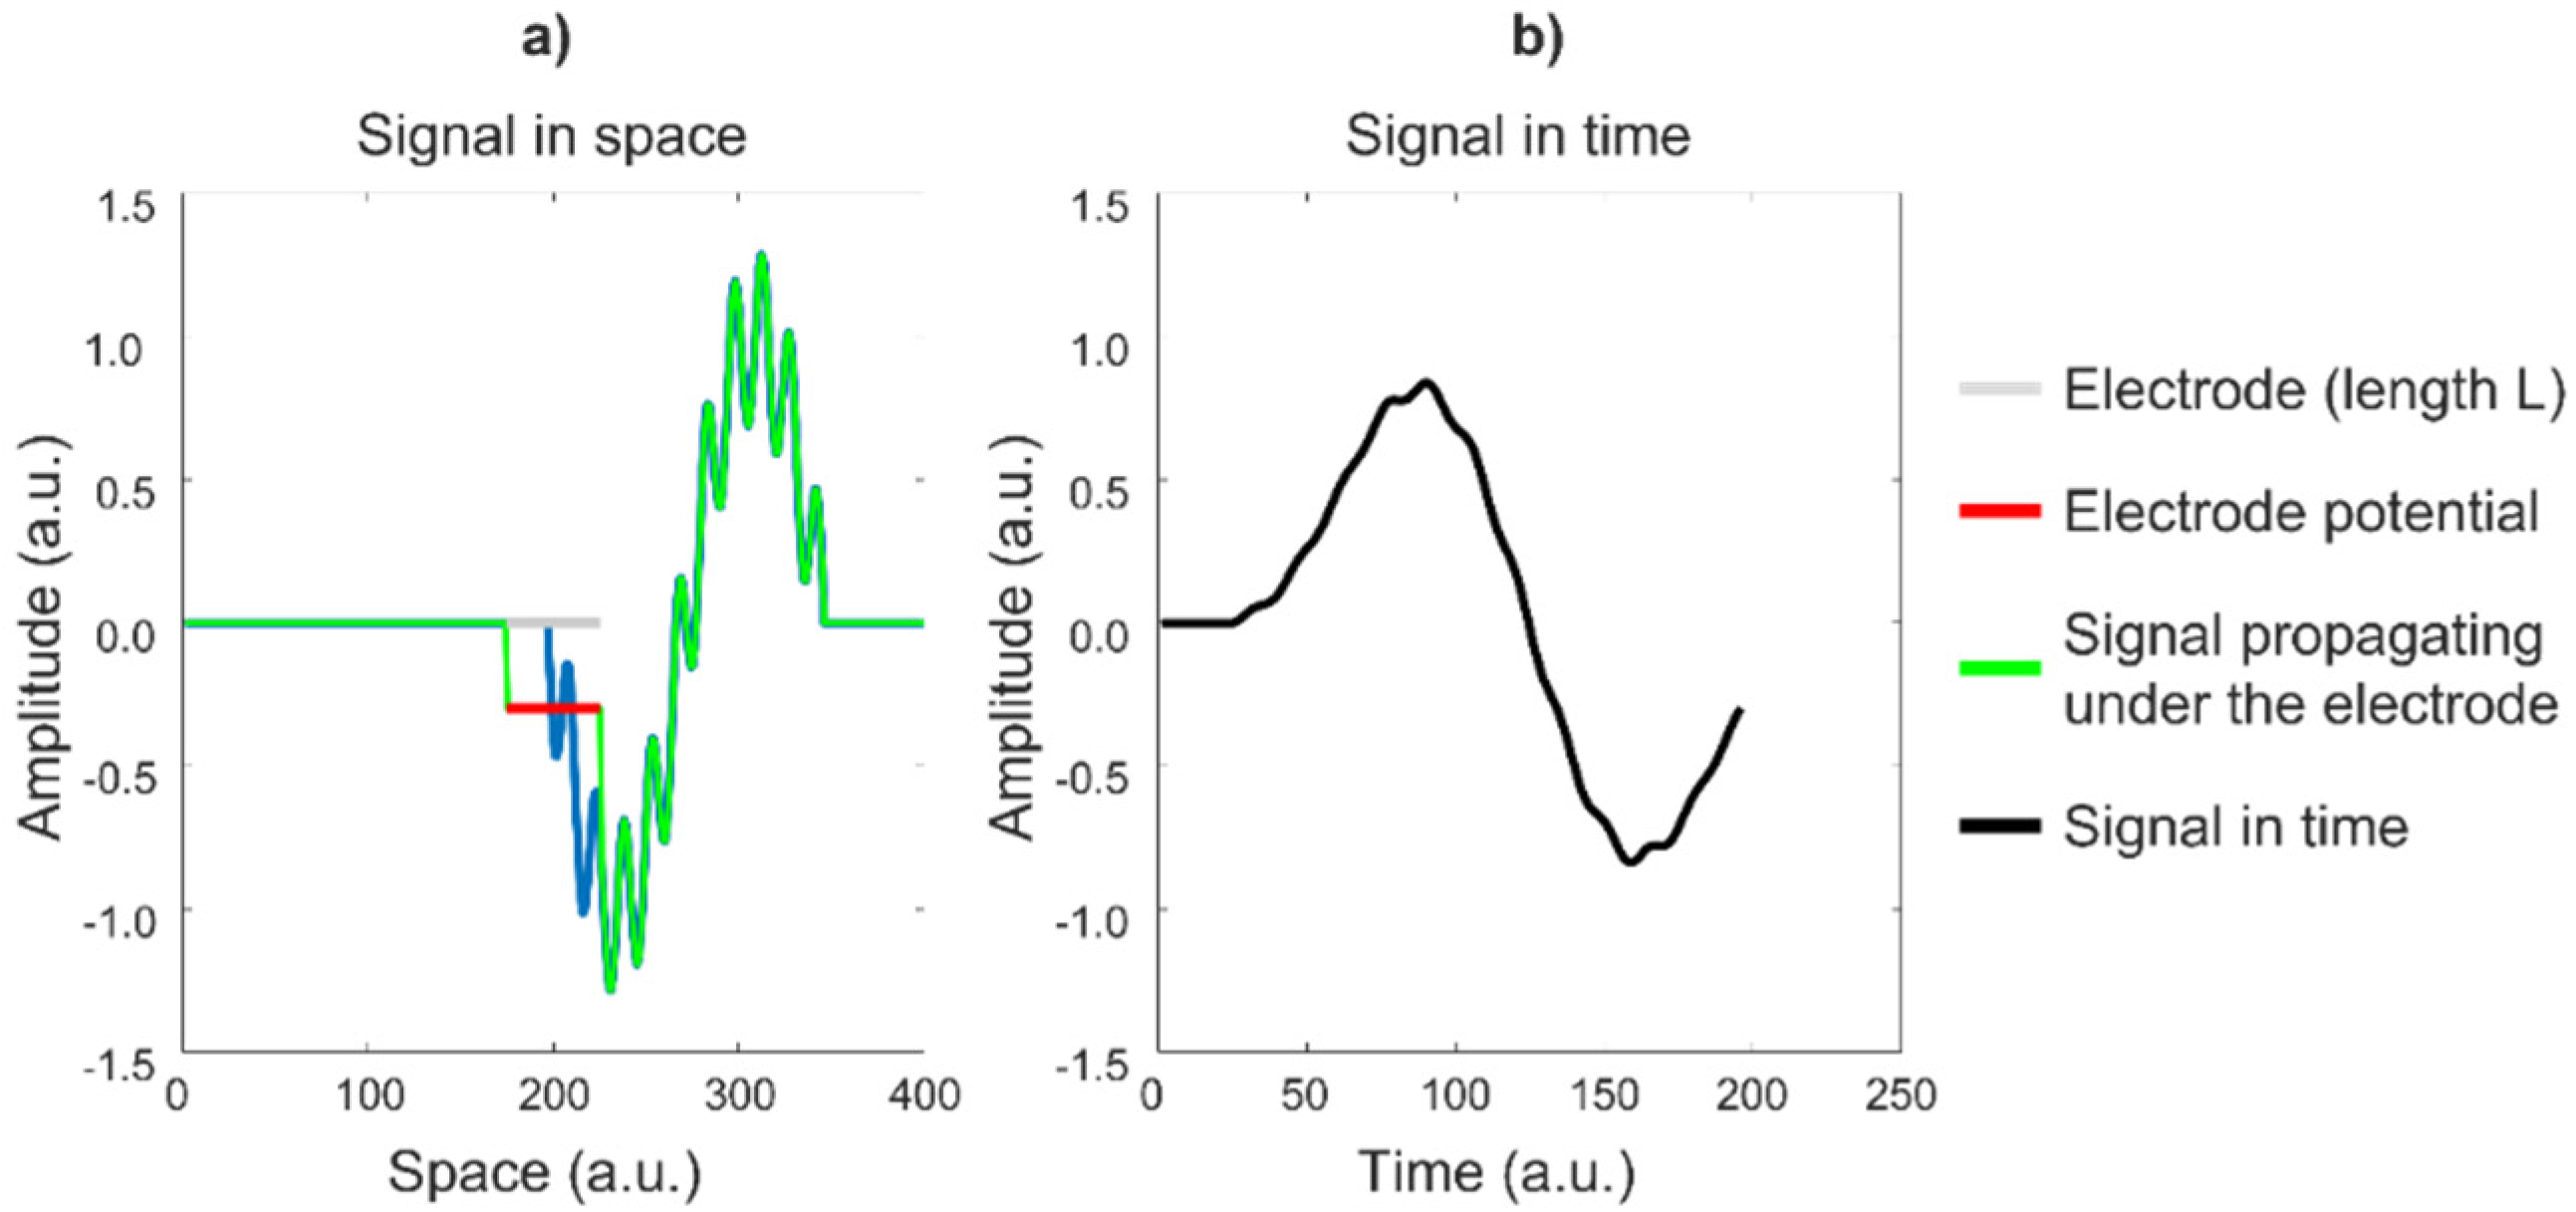
An electrode has a highly conductive surface, which forces all of the points below it to have the same voltage. This voltage is approximately the mean value of the voltages at the points below the electrode surface (without the electrode). This averaging effect is a form of low-pass filtering, which reduces the “sharpness”, or high-frequency content, of the detected voltage. To understand the relevance of this effect using a simple example, consider the animation in
Figure 18a, in which a signal propagates under an electrode of length L, which provides the average value of the signal over L in the direction of propagation versus time (
Figure 18b). The electrode attenuates and smooths the signal, thereby introducing low-pass filtering. Observe the cancelation of the periodic signal, which has a period in space (wavelength) that is equal to L/2.
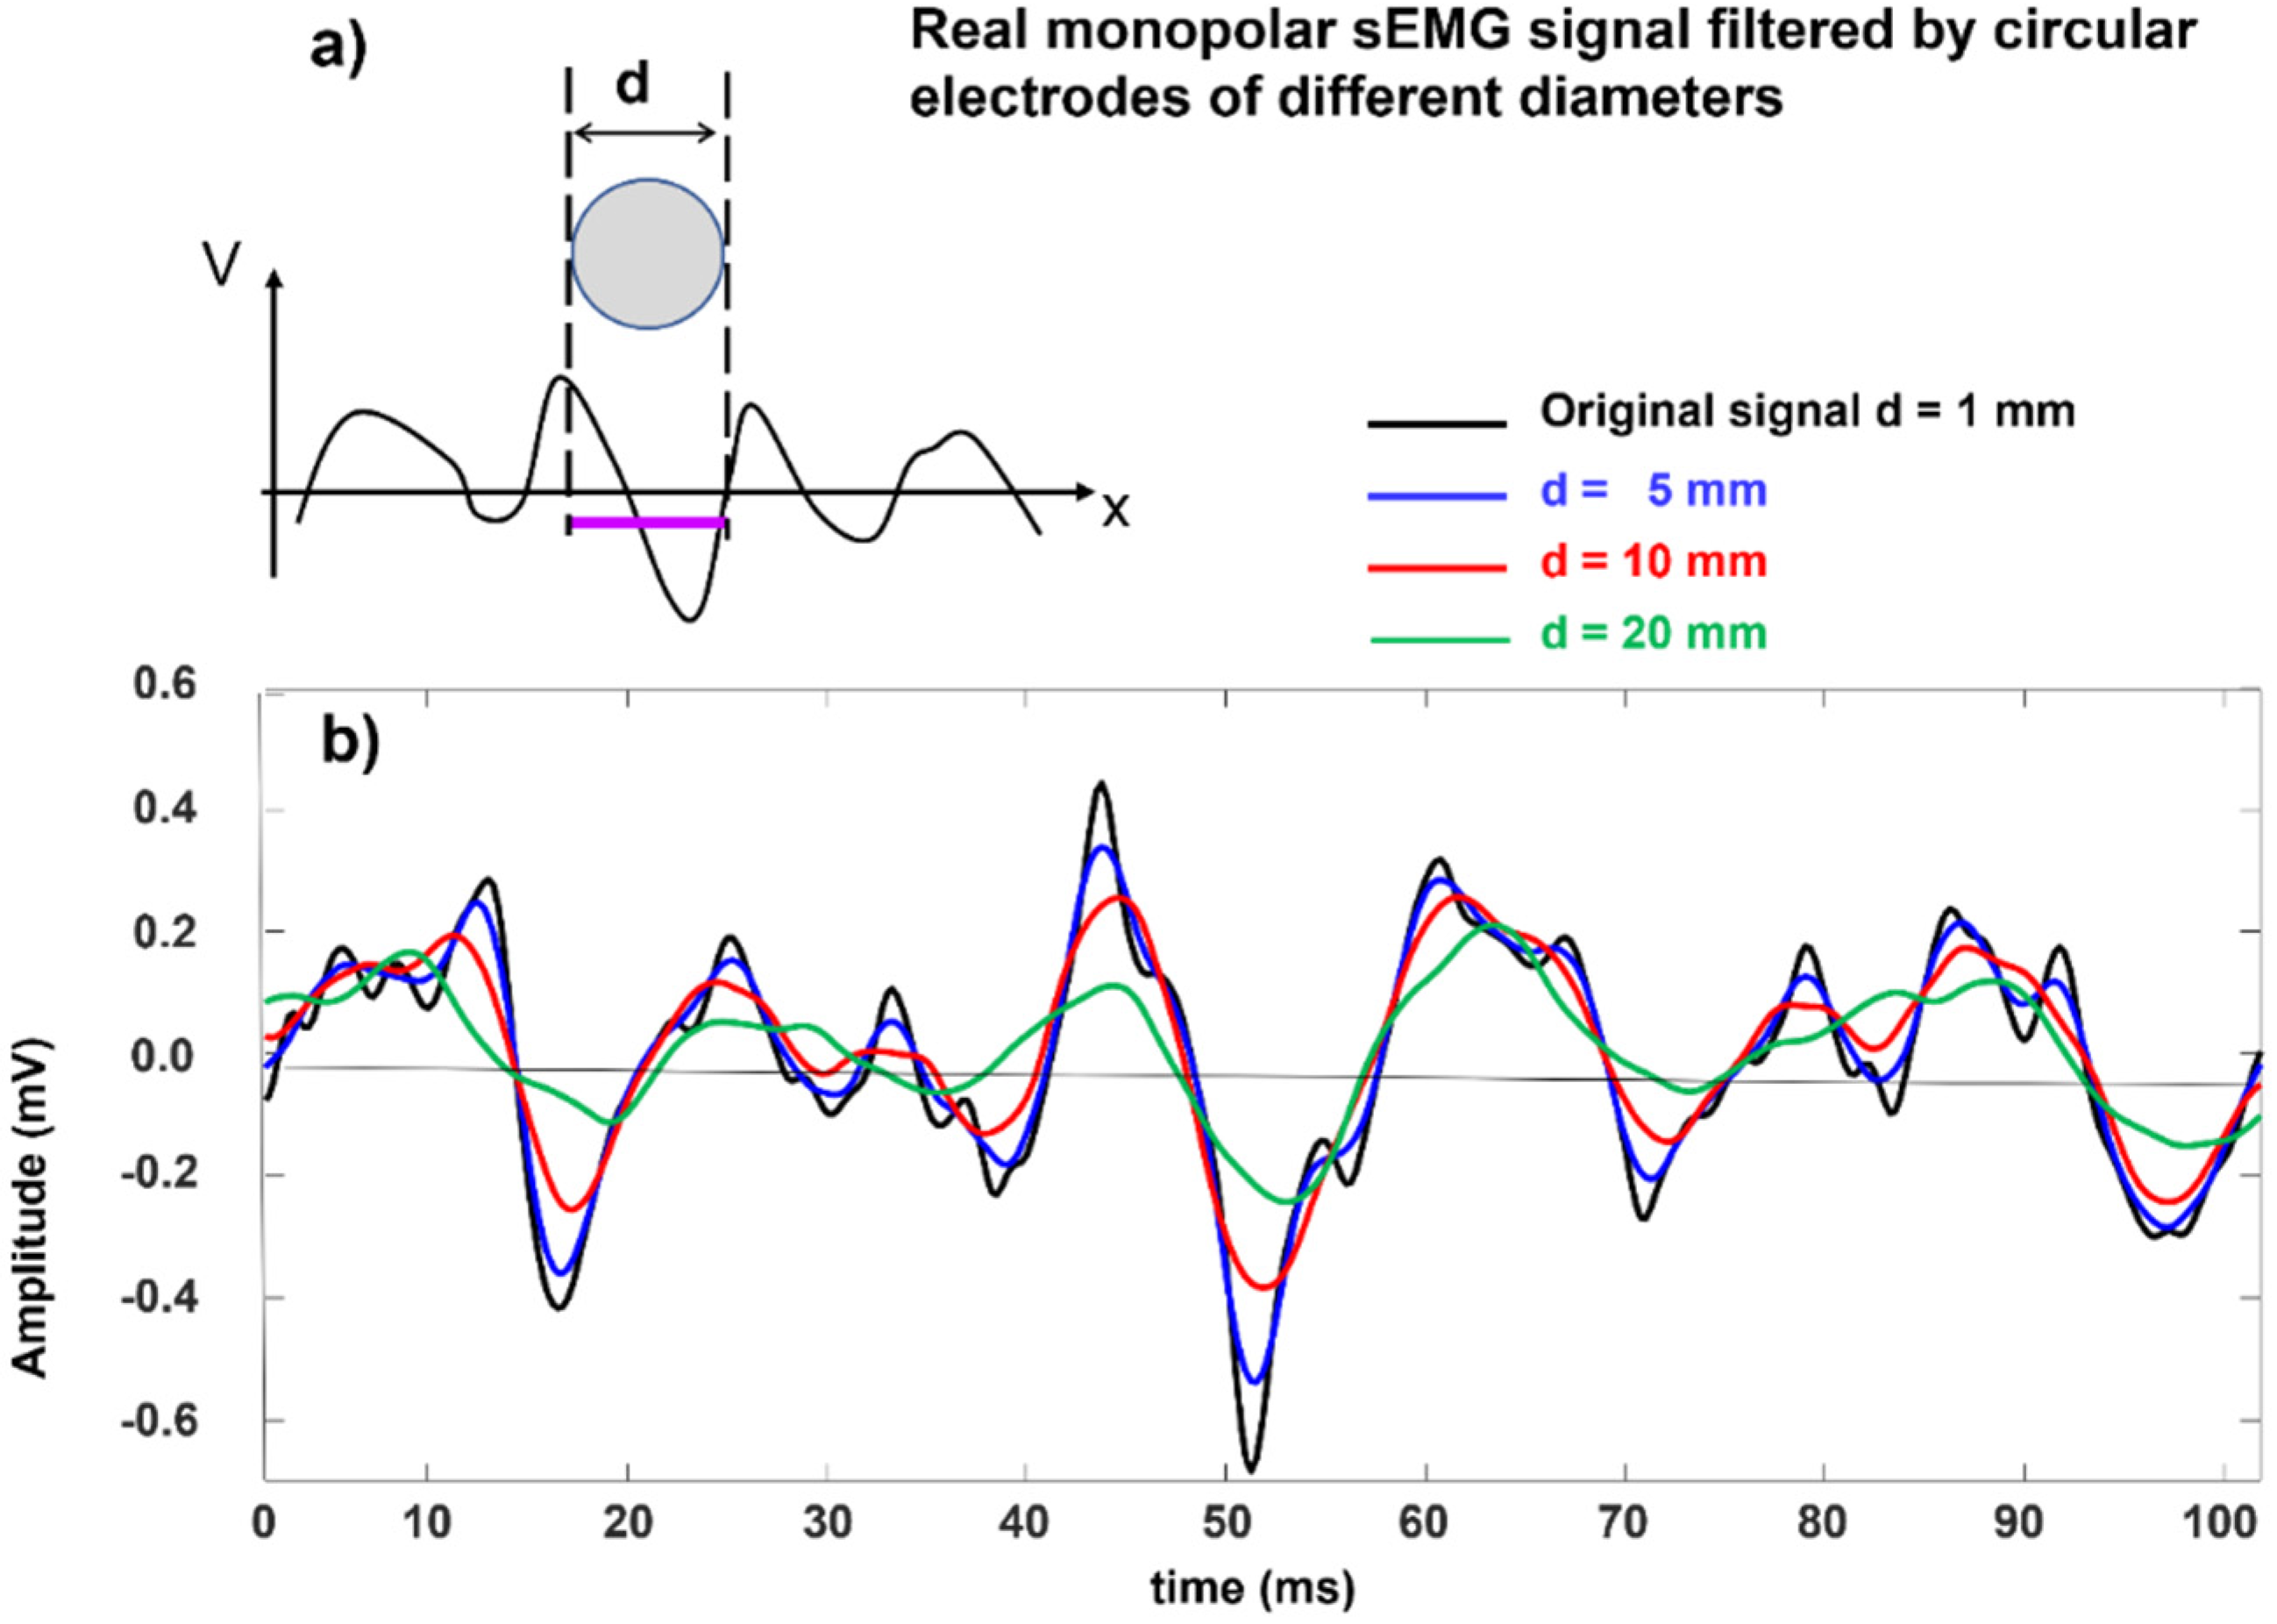
Figure 19 shows this effect on a real monopolar sEMG signal. In practice, since a larger electrode increases the detection volume, the amplitude may not be reduced (it may actually increase because a larger number of MUs is covered by the electrode) but the spectral alteration (smoothing) remains.
As indicated in the literature [
33], sEMG electrodes with diameters of up to 3 mm are acceptable, while diameters greater than 5 mm modify the shape and the spectral features of the MUAPs of the most superficial Mus, thereby making these MUAPs more similar to those of deeper MUs.
Again, it is clear that electrodes that have diameters of 5 mm are barely acceptable, while electrodes that have diameters of ≥10 mm introduce substantial filtering and modify the waveshape, amplitude, and spectral features of the MUAPs and, with that, the interferential sEMG signal, particularly in lean subjects with many MUs that are located close to the skin surface (see
Section 3.2). Nevertheless, these alterations may be acceptable or irrelevant for a number of applications whose objectives are little affected by these factors, such as the analysis of gait or studies on coordination with one, properly positioned, electrode pair per muscle.
3.2. Interelectrode Distance and Its Filtering Effect
The ubiquitous differential detection (SD) provides the voltage difference (versus time) between two electrodes that are spaced by an IED in the fiber direction.
Figure 20 demonstrates how the IED affects the detected SD waveform and, consequently, the sEMG features. A simple triangular waveform propagating under the two electrodes systems A–B, spaced by an IED of e
1, and C–D, spaced by an IED of e
2, is provided as a teaching example. The results in time are very different. If e
2 were equal to the wavelength of the propagating signal, the output in time would be zero at all times, thereby generating an artificial “dip” in the amplitude and power spectrum of the time signal for that particular frequency. For this reason, the IED must be smaller than half of the shortest wavelength that contributes to the sEMG signal, which is about 10 mm (corresponding to 100 cycles/m) for MUs that are close to the skin surface [
33]. According to mathematical theory (Nyquist sampling theorem, not discussed here), the spacing between two electrodes should therefore be less than 5 mm. However, due to the spatial low-pass filtering effect of the volume conductor, the minimum wavelength that contributes to the potential distribution is muscle- and subject-dependent. Deeper muscles show skin potential distributions with longer wavelengths. The potential distributions of people with a higher body mass index have longer wavelengths than those of people with a lower body mass index. Therefore, in practice, values of up to 8–10 mm may be acceptable, with minor signal alterations because of the small and long “tails” of the sEMG power spectrum. The effects of electrode size could be added to the simulation in
Figure 20 using wider slots and taking the average value of the signal within each slot. See also
Figure 18.
In clinical practice, SD (bipolar) sEMG detection is often performed using electrodes that have diameters of 10 mm or more and an IED of 20 mm or more. The combined effect of these values has been discussed in a tutorial and a textbook (see Figures 13 and 14 of [
19,
35]). Of course, a signal may be obtained using any combination of electrode size and IED and two signals that are detected by different detection systems may look visually alike but have different spectral features because of the electrode low-pass filtering effect and the “dip” effect, which strongly modify the signal spectrum [
19,
33]. Large IED values (IED > 10 mm) are often preferred because they detect sources from a larger volume and provide larger signals. However, they are more sensitive (a) to crosstalk from neighboring muscles and (b) to the effect of MUAP generation at the IZ and MUAP extinction at the muscle–tendon junction (EOF effect). In addition, for the reasons presented above, large IED values (IED > 10 mm) are not suitable for estimating muscle fiber CV, for which at least four electrodes on the same side of the IZ are usually required as well as the most suitable DD derivation. Finally, the features of different sEMG signals cannot be compared when the signals are collected with electrodes of different sizes, distances, and locations with respect to the IZ(s). The effects of these factors on the amplitude and spectral sEMG features of the upper trapezius and knee extensors are clearly explained in [
37,
38].
The above considerations apply in general and also specifically in the case of muscles that are located very close to the skin surface with thin skin and subcutaneous tissue. In the case of more distantly located muscles or subjects with a higher body mass index, these considerations may be somewhat relaxed because of the low-pass filtering effect introduced by the increased distance between the source and detection points. This factor reduces the bandwidth of the sEMG signal in space and time. This issue has been investigated by Minetto et al. [
30], who concluded that because of the relevance of non-propagating components (due to the EOF effect and crosstalk), muscle fiber CV (when of interest) cannot be reliably estimated in these cases: “Interelectrode distance greater than 10 mm is not only recommended but required in sEMG detection from the vastus medialis and lateralis (VM and VL) of obese subjects to counteract the sEMG amplitude attenuation due to the increased thickness of the subcutaneous layer.” Since, in these cases, the sEMG power spectrum is narrower and the shortest wavelength in space is longer, it can then be concluded that IEDs of 5–10 mm should be used to investigate the superficial muscles of lean subjects while IEDs of 10–20 mm could be used in studies concerning muscles that are located more distantly, especially in subjects with a greater body mass index.
Similar considerations apply to the issue of electrode size. The option to select IED implies adjustable selectivity, which is not possible with coaxial needles. The issue of electrode location, size, and IED becomes particularly important when electrode grids are used, spatial interpolation is applied or individual MUAPs are to be analyzed.
4. Factors That Can Affect sEMG and Its Physiological Interpretation
The distribution of sEMG potential is a time-evolving monopolar image (a movie) whose full information content can only be recovered and used when the image is properly sampled in space and time. However, most current clinical applications are based on traditional bipolar (SD) readings since the obtained information is, in general, appropriate for answering clinical questions with an adequate compromise between the in-field feasibility of the activity detection of many muscles and the reduction in information on the active MUs.
It is important to understand that a bipolar recording is nothing more than taking two samples in space out of the monopolar map and plotting their instantaneous voltage difference versus time. When using bipolar detection, some of the strict requirements concerning the electrode size and IED of an electrode grid can be somewhat relaxed in favor of a larger detection volume and lower noise, at the price of lower selectivity and a greater risk of crosstalk. Electrodes that are located improperly or have large sizes and distances cause waveform changes (
Figure 18,
Figure 19 and
Figure 20) and an often-undetected sensitivity to crosstalk, as shown for the brachioradialis muscle by Merlo et al. in Special Issue [
39].
In addition, during dynamic contractions, the muscle moves under the electrodes and this may cause changes in the sEMG amplitude that are only due to the changes in the relative IZ position. These issues are rarely discussed in the clinical literature or addressed in schools or courses and sEMG users seem not to be aware of them. Consequently, incorrect conclusions may be reached by unaware users.
4.1. Skin Treatment
Proper skin treatment is important for both bipolar and HDsEMG recordings. In HDsEMG, the relatively large number of electrodes increases the likelihood of bad contact and requires the accurate treatment of the skin (e.g., shaving, rubbing with peeling cream, and then cleaning with a damp cloth), preferably without using alcohol, which leaves skin dry [
31]. This requires some training in skin treatment and proper grid application, with uniform pressure on each electrode and no wrinkles. When conductive paste or gel is applied to arrays or pairs of electrodes, gel bridges between the electrodes must be avoided. The performance and repeatability of results rely on proper electrode choice, placement, and management, keeping in mind that small electrodes are noisier and more selective than large electrodes but introduce less signal filtering, as discussed above and indicated in
Figure 18 and
Figure 19. It is also important to point out that the two electrode–skin impedances of an electrode pair must be small and similar to reduce power line interference [
20].
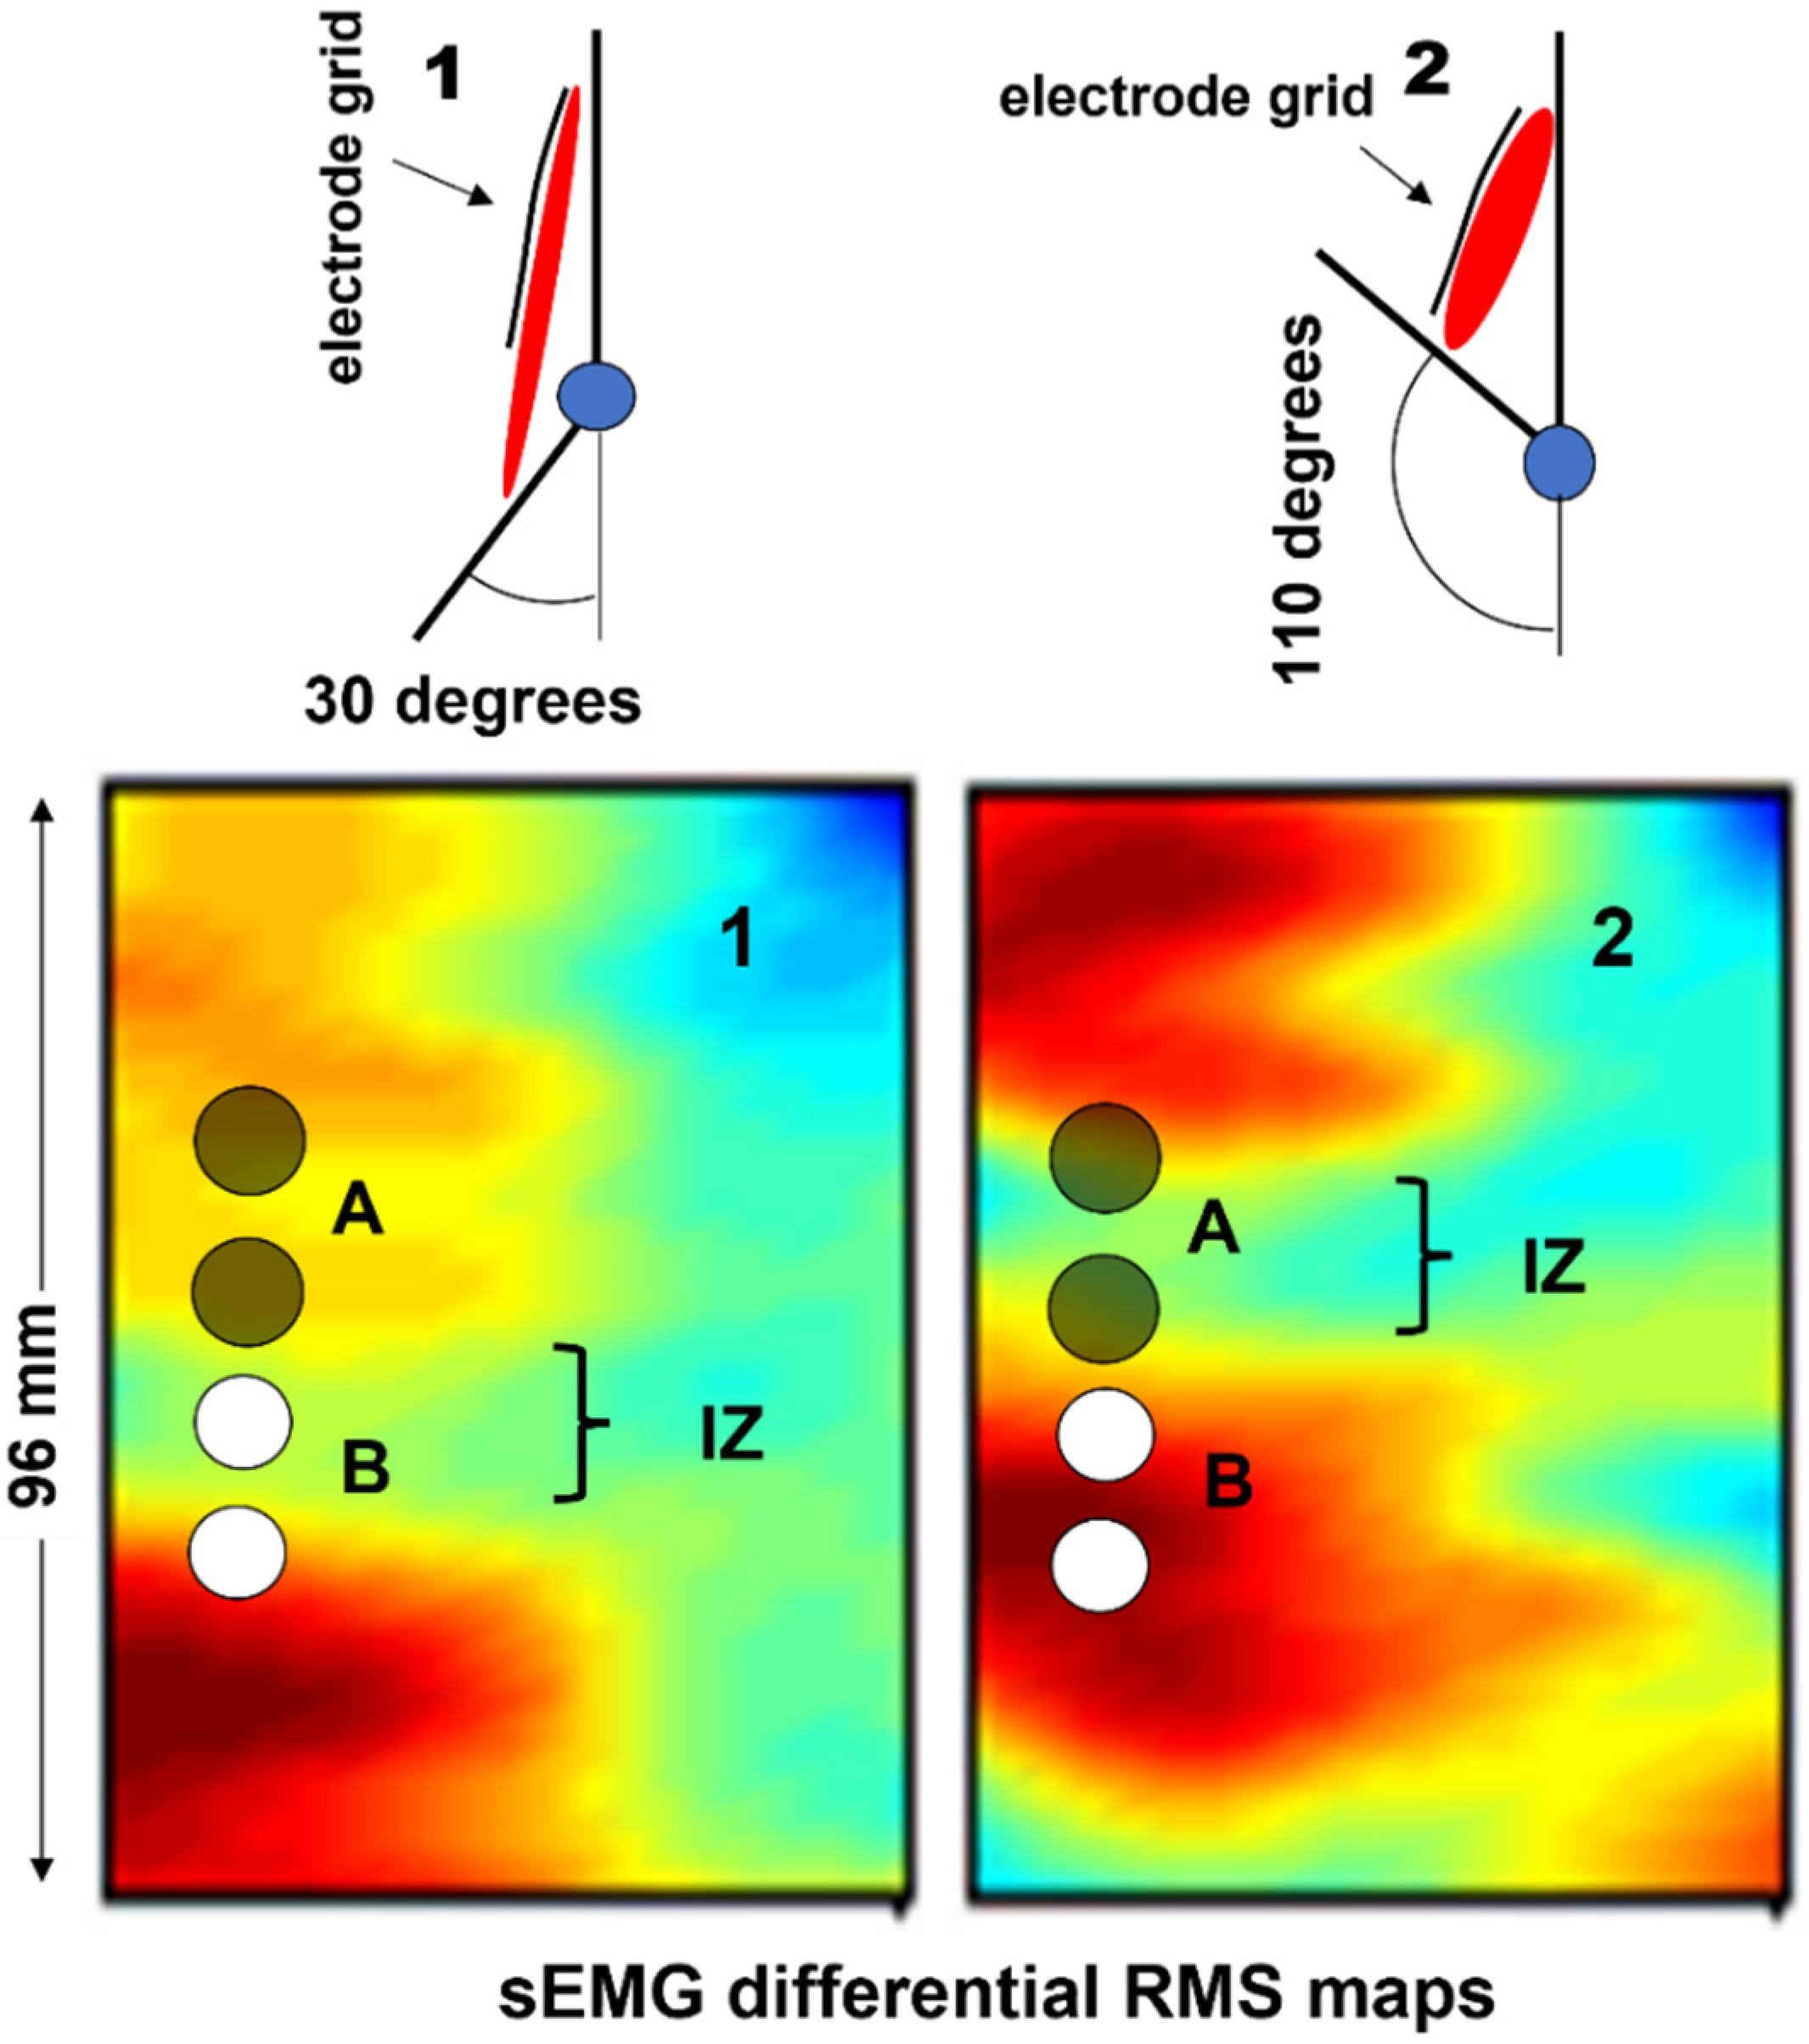
4.2. Movement of the Muscle under the Electrodes
Figure 21 addresses the important problem of muscles sliding under the skin during dynamic contractions. The example shows two interpolated images obtained using an electrode grid that is placed on a biceps brachii. When the forearm flexes from 150° to 70° (internal angle between arm and forearm), the biceps muscle shortens under the array and the EMG amplitude map changes from Map 1 to Map 2. Considering one operator placing the white pair of electrodes and another operator placing the black pair, the first would conclude that elbow flexion increases the sEMG amplitude but the second would conclude the opposite. The change in sEMG amplitude that is detected by the two electrode pairs when the elbow flexes is due to the change in geometry, not the change in muscle electrical activity. This is an important issue to consider during dynamic contractions and is likely to be one of the reasons for the lack of uniform results reported in the literature, in addition to electrode size and IED. Users should be aware of this phenomenon, which takes place in long fusiform muscle-spanning joints with large angle variations. Although only examples from biceps brachii have been reported, other muscles may show the same phenomenon. An atlas for proper electrode placement should always be used when dealing with bipolar sEMG. It should also be verified that the electrode pair remains on the same side of the muscle IZ(s) during the entire range of movement. Since this is impossible when using bipolar electrodes, atlases that indicate the regions where electrodes should not be placed have been made available [
22].
4.3. Identification of Innervation Zones
The identification of the IZ by means of linear electrode arrays or HDsEMG, as reported in
Section 2.3, has more potential clinical applications other than being useful for supporting the proper positioning (or selection) of a pair of electrodes [
40] (far from IZs and on minimum crosstalk areas), including the targeted injection of the botulinum neurotoxin, which is commonly used to treat disorders such as cerebral palsy, spasticity, and cervical dystonia [
4,
5,
41].
When the toxin is applied to the IZ, a lower dose can be highly effective [
4,
5,
42]. The use of HDsEMG to target the IZ could reduce the amount of injected toxin and, consequently, limit the treatment cost [
43]. An atlas of muscle innervation zones is available for most superficial muscles [
22].
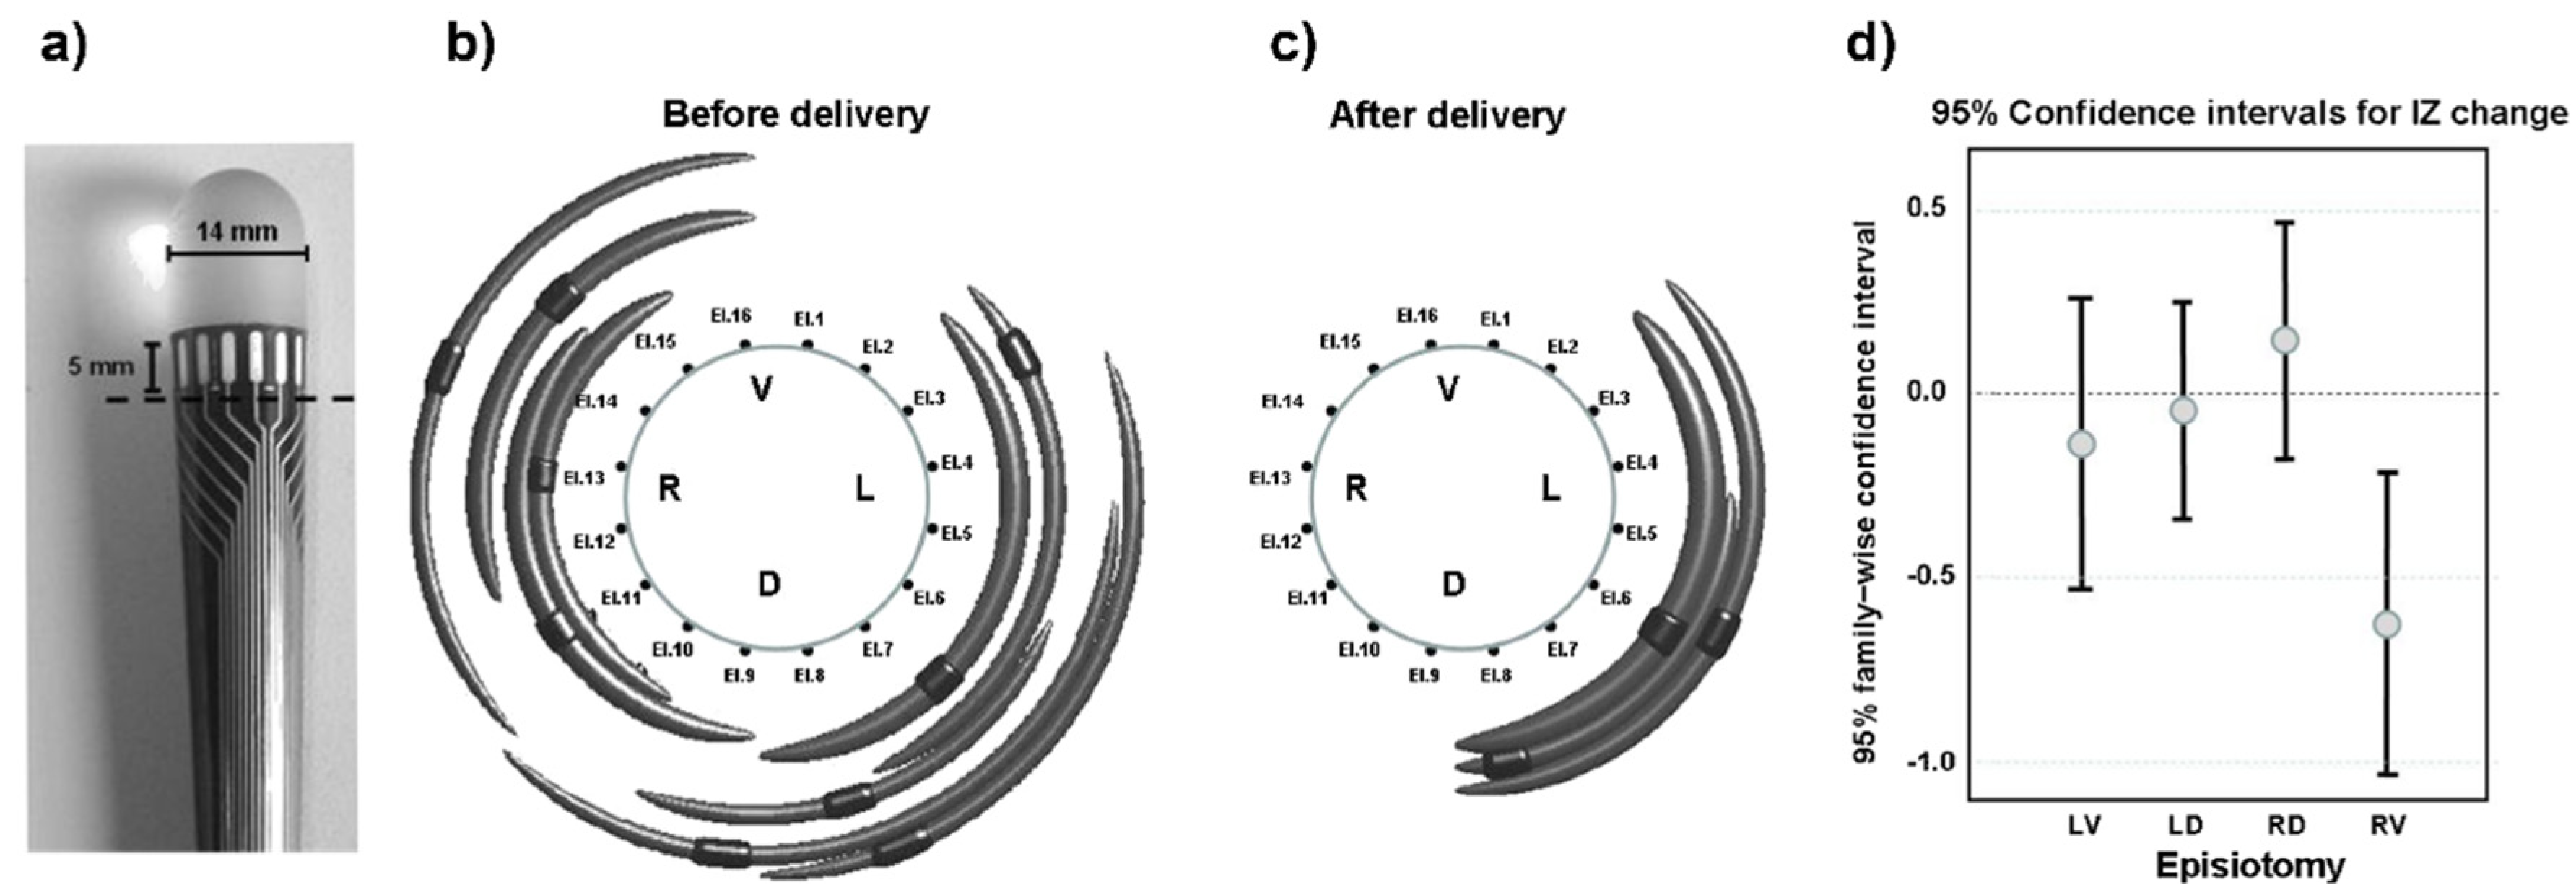
The identification of the IZ is also a useful tool for planning surgery, for example, in the case of episiotomy during child delivery. The innervation to the external anal sphincter muscle may be damaged due to episiotomy, thereby increasing the chances of future fecal incontinence [
44]. The European project OASIS and the multicenter study TASI exploited multichannel sEMG probes to identify changes in the external anal sphincter innervation in women who underwent episiotomy during labor. It was found that (a) the distribution of IZs is highly variable across individuals [
45] but can be identified in a repeatable way across days [
46] and (b) the number of IZs significantly decreases in the quadrant where the episiotomy was performed [
45]. Therefore, the identification of the IZs prior to delivery could be a preventive measure to guide the episiotomy incision (when necessary) and to suggest the ways or sides with the least risk.
Figure 22 depicts the probe that was used, one significant result, and the statistical results from 82 cases of episiotomy.
Despite the literature in this field [
45,
46,
47], the clinical use of sEMG is still absent because of the lack of information and teaching for obstetricians, midwives, and pelvic floor therapists.
4.4. Examples of HDsEMG Applications in Neurophysiology
A comprehensive overview of all of the clinically possible applications of single channel and HDsEMG in neurology exceeds the purpose of this paper. Therefore, only a few relevant examples are highlighted in the following section to underline the need for training with a view to future applications. For a more comprehensive analysis, refer to the systematic reviews in [
7,
9,
32].
HDsEMG was already being used in the early 1990s to differentiate the pathologies of neuronal origin from those of muscular origin. Ramerkers et al. [
48] were able to show that when using HDsEMG with the NDD detection system (
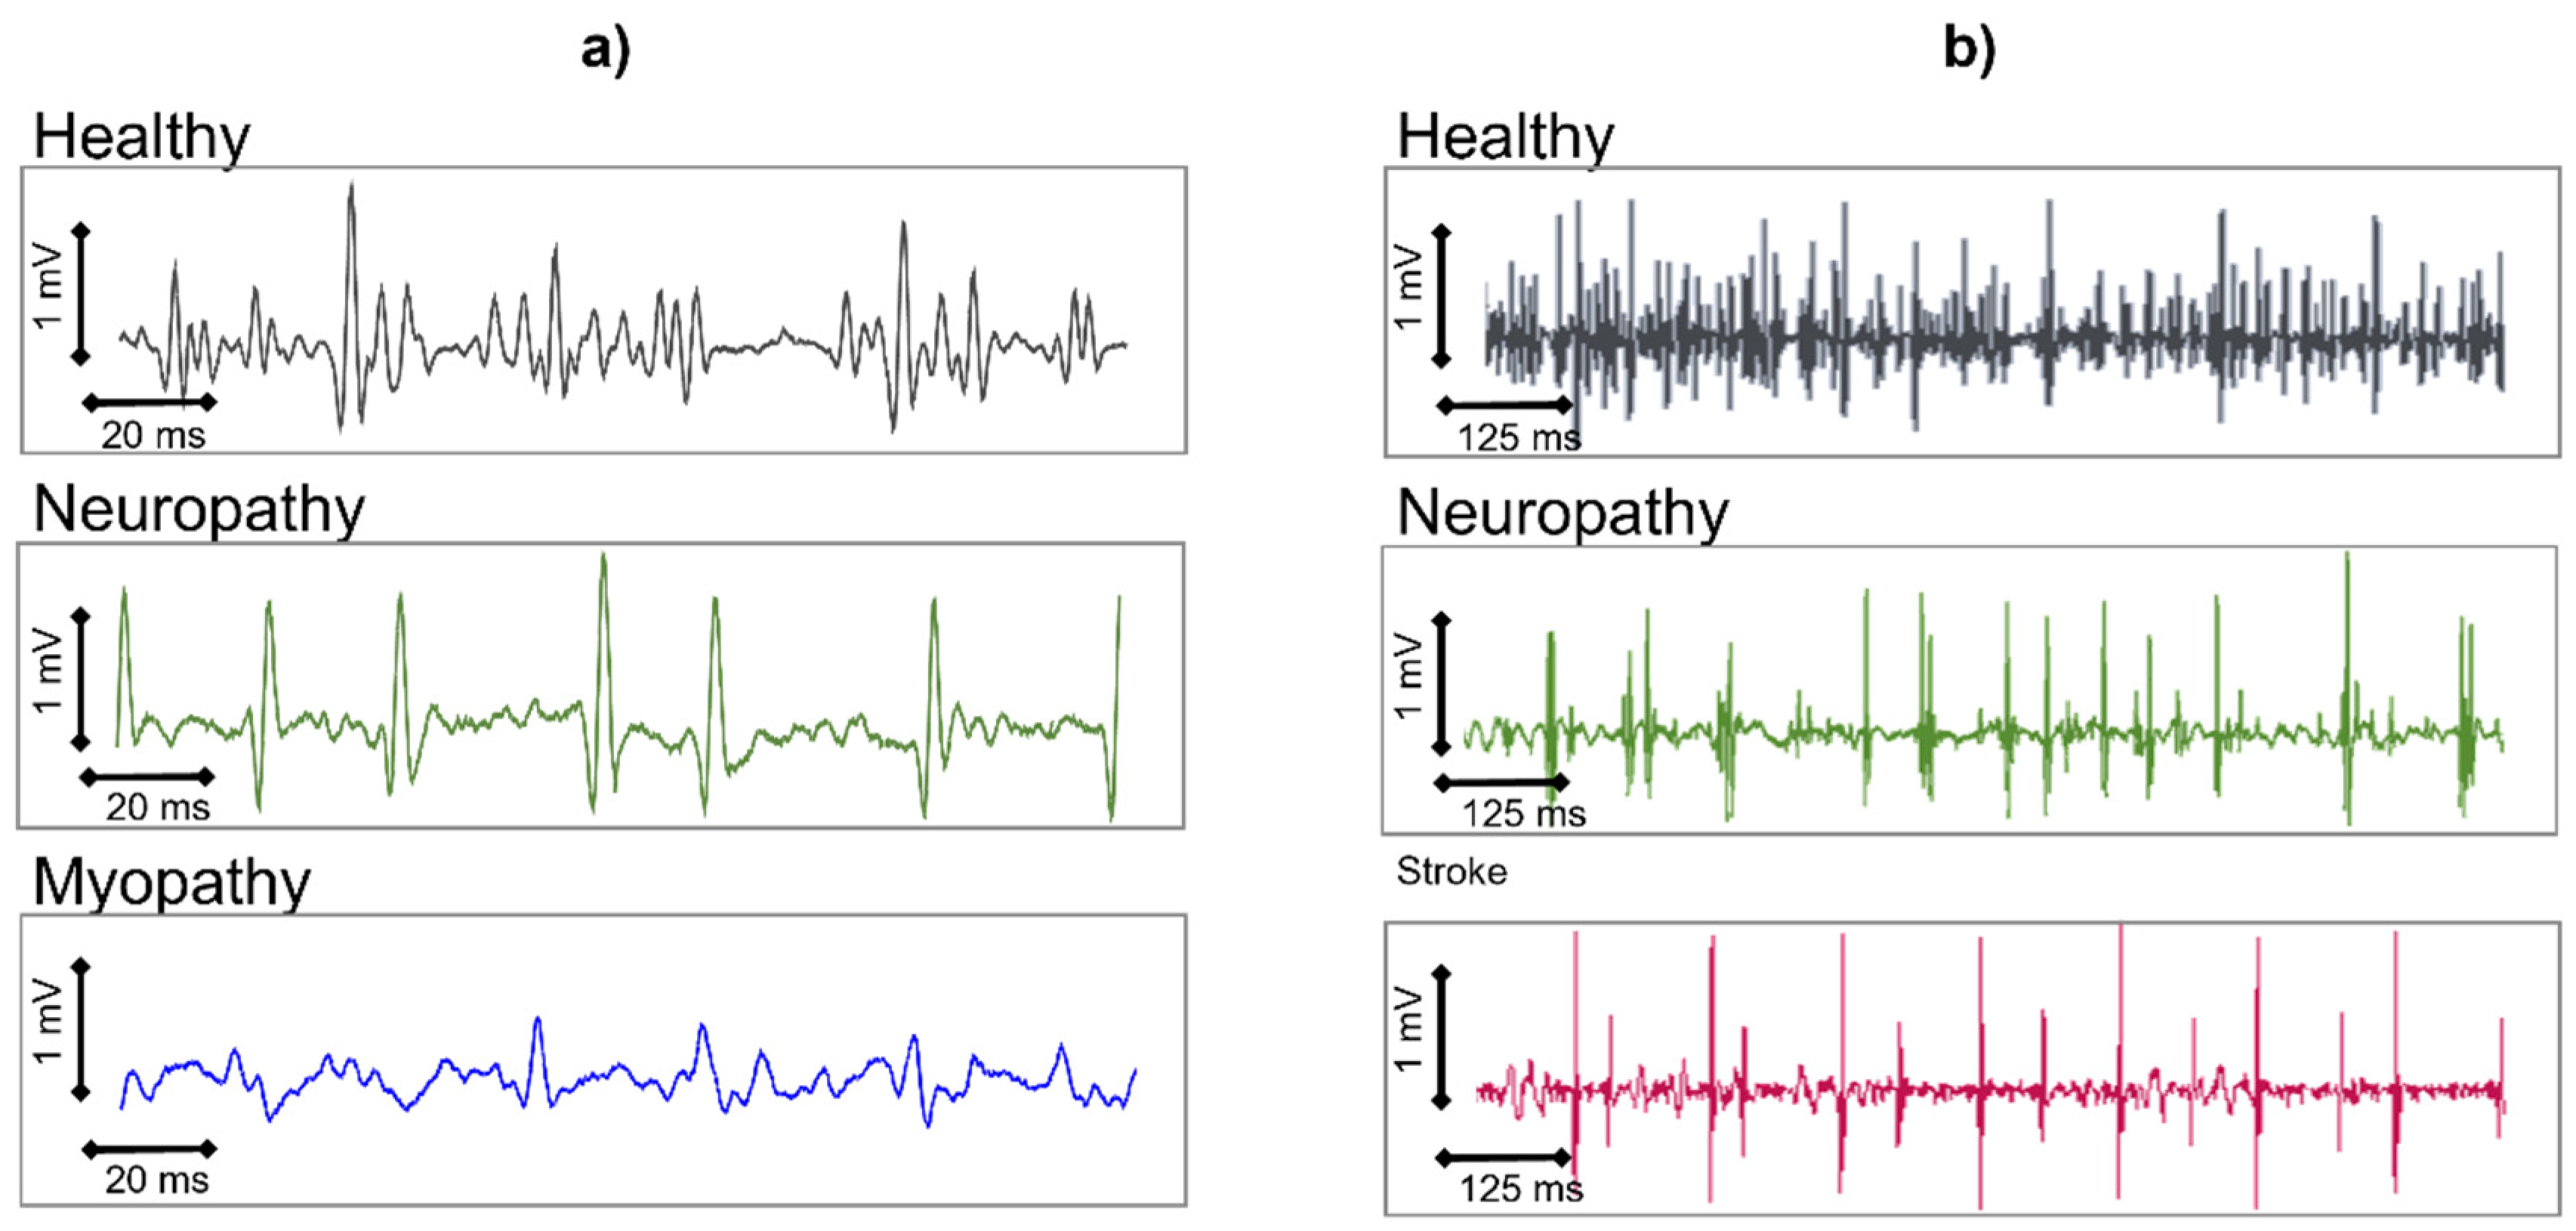
Figure 16), the resulting signals that are derived from patients with muscular or neuronal disorders exhibit disease-specific features.
Figure 23a shows the NDD spatially filtered signal as it manifests in neuropathies or myopathies. While myopathies are mainly characterized by a change in the shape of the MUAPs, neuropathies show a decrease in the detected number of active MUs. Simulation studies have indicated that in the case of myopathies, the degeneration of muscle fibers is responsible for the changes in the signal, whereas a loss of Mus leads to the characteristic changes found in neuropathies [
26]. These typical changes in the spatially filtered HDsEMG signal that characterize muscular or neuronal pathologies can be described by seven parameters and enable correct diagnostic conclusions with an average accuracy of 97% [
49]. This means that the possible diagnostic yield of the non-invasive HDsEMG technique, for superficial muscles, is in the range of needle electromyography [
50,
51]. Other applications refer to the MU number estimation, the quantification of fasciculations [
52], HDsEMG changes in the muscle structure, and MU recruitment of stroke patients in pathophysiology studies [
53].
As HDsEMG is a non-invasive method, it is particularly useful for monitoring the progress of neuromuscular disorders in children. Furthermore, for superficial muscles, HDsEMG provides additional information about the MUs and their recruitment, which is not accessible through needle EMG but could be relevant for diagnostic purposes. This includes information about the CVs of MUAPs along the muscle fibers, as well as the spatial distribution of excitation within a muscle.
Figure 24 indicates how the MUAP CV changes as children develop. The most significant age-related change in MUAP CV occurs at an age of up to 5 years. From an approximate age of 15 years, the MUAP CV remains constant. The CVs of the MUAPs are significantly reduced in patients with Duchenne muscular dystrophy, compared to healthy children [
55], and in patients suffering from carpal tunnel syndrome [
56].
Many other neurological applications of HDsEMG are clinically relevant. Among these are hypokalemic periodic paralysis, pathological fatigue, and MU size estimation, presented in the reviews by Zwarts et al. [
7], Drost et al. [
9], and Hogrel [
32], along with a discussion of the advantages and limitations of HDsEMG.
Numerous applications of HDsEMG are being developed in research labs to decode the neural drive to muscles by means of the decomposition of the sEMG into the constituent MUAP trains. These methods are based on the early work of Holobar and Zazula [
23] and are ready for clinical evaluation.
Finally, it is fair to say that medical devices can only be used within their “intended use” (what can and cannot be carried out with that device), which is indicated by the producer in the first pages of their user manual. Any diagnostic tool requires a class II medical device certification in Europe, an FDA approval in the USA or a similar certification in other countries. Users and researcher should verify the certification level before buying or using sEMG devices for specific applications.
4.5. Issues of Bipolar sEMG Detection in Neurorehabilitation Applications
In neurorehabilitation, the use of motion analysis with sEMG clearly influences treatment planning in multiple patient populations and can lead to better outcomes when properly used [
57]. Gait analysis is a functional evaluation that provides a quantification of the observed performance and identifies motor deficits and the underlying causes of the observed pathological patterns [
58,
59,
60]. This evaluation allows for the formulation of a precise and targeted therapeutic plan, such as surgical, pharmacological, orthotics or physiotherapy plans [
57,
58,
61,
62,
63,
64]. In the study of muscle activation during the gait of neurological patients, it is of paramount importance to avoid common errors that could possibly lead to incorrect clinical decisions [
39,
65,
66]. The literature provides guidance on how to properly perform an examination so that it can be reliable and used for functional assessments and clinical evaluations [
67].
The main errors in the use of sEMG for the evaluation of neurological patients are attributable to the type of electrodes, the placement protocol, and the presentation of the data that are chosen. The traditionally used SENIAM recommendations for electrode placement [
68] may not consider the problem of crosstalk, as indicated in
Figure 25 and
Figure 26. In order for the evaluation to be clinically usable, it is necessary for the chosen electrode placement protocol to guarantee the selectivity of the analyzed muscle activation, with small electrodes placed on the so-called minimum crosstalk areas [
39,
69,
70,
71] and on the same side as (and far away from) the IZs [
22].
The width of the electrodes and the IED can also play a crucial role, especially when recording the activity of small muscles, such those as in children. The disposable ECG pre-gelled electrodes that are normally used in clinical evaluations are often too large. When the electrode contact area is wider than the target muscle, it can cover more than one muscle, thus reporting an incorrect activation time due to crosstalk.
Finally, it is important that the reports of the examinations carried out contain raw traces to distinguish the sEMG signal from other possible artifacts [
73] that are very frequent in the study of neurological patients with movement alterations. In fact, the representation of the sEMG signal in the gait cycle through the envelope, although more synthetic, can be dangerous and misleading. It is important to always visually verify the quality of the raw sEMG signals since after the computation of the amplitude envelope, artifacts and interferences are no longer detectable and cannot be eliminated [
74].
The issue of proper signal representation and scaling (of the electrodes and not the output of the amplifier) may seem obvious and trivial, but it is not [
73].
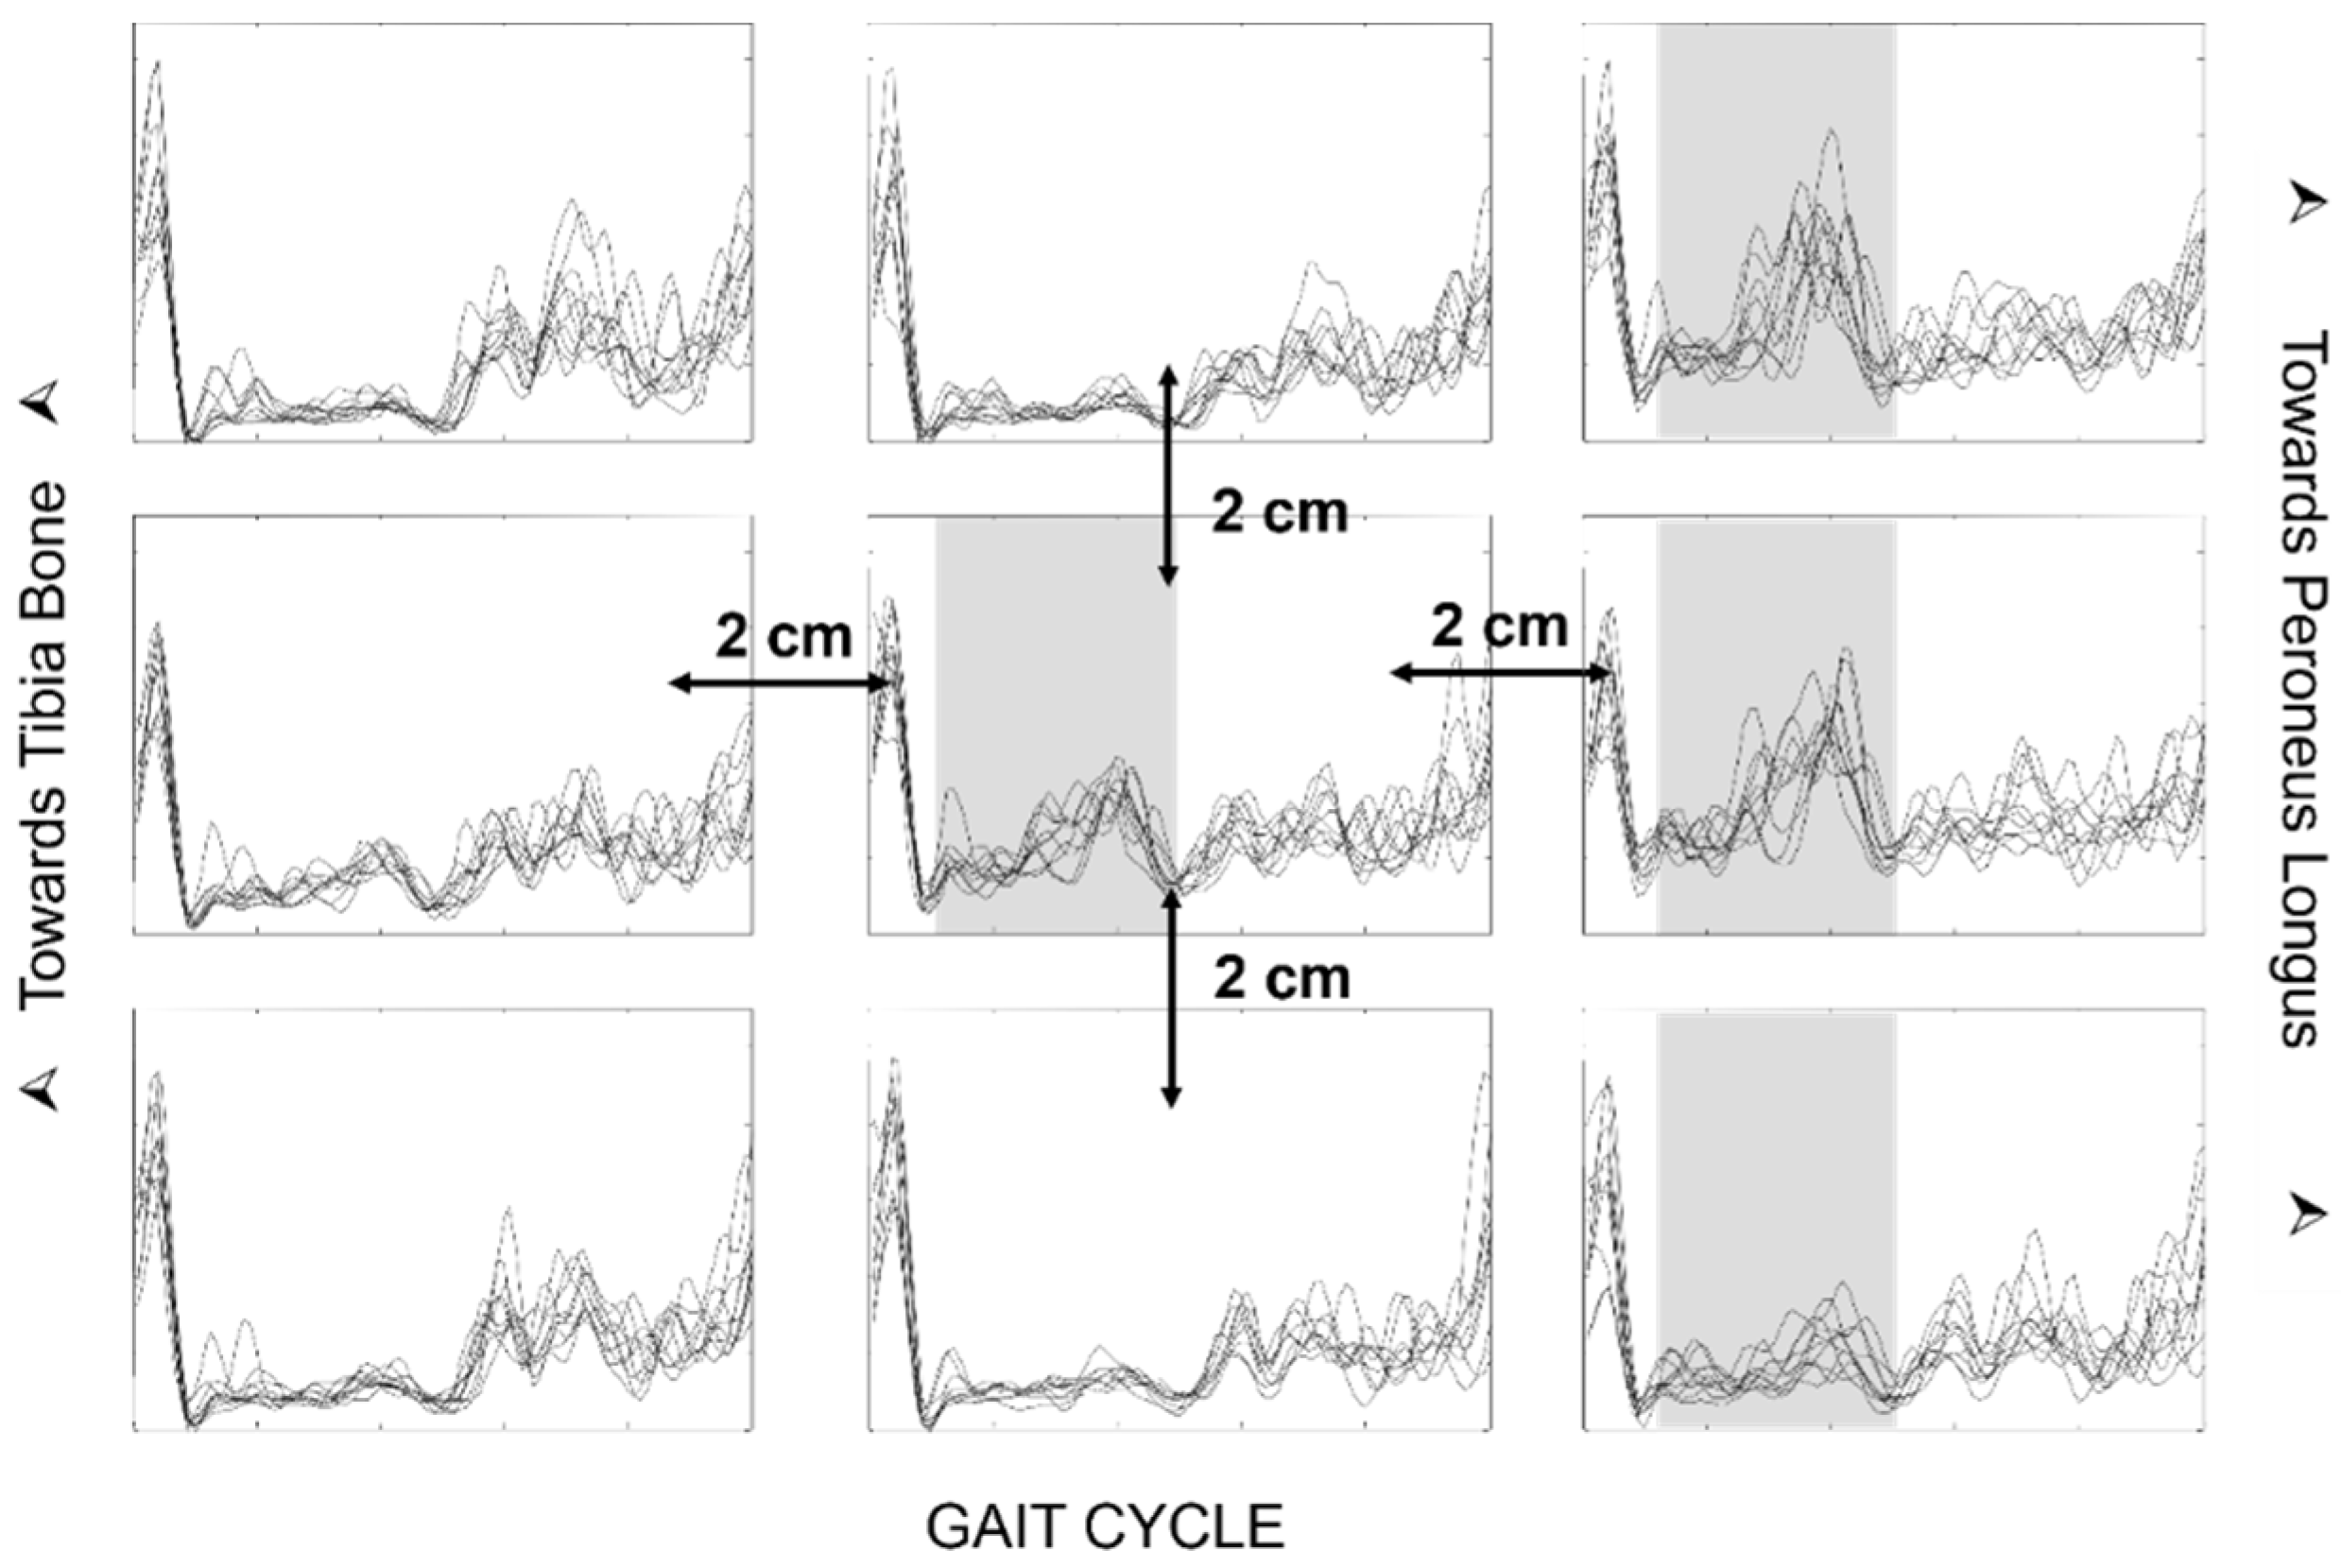
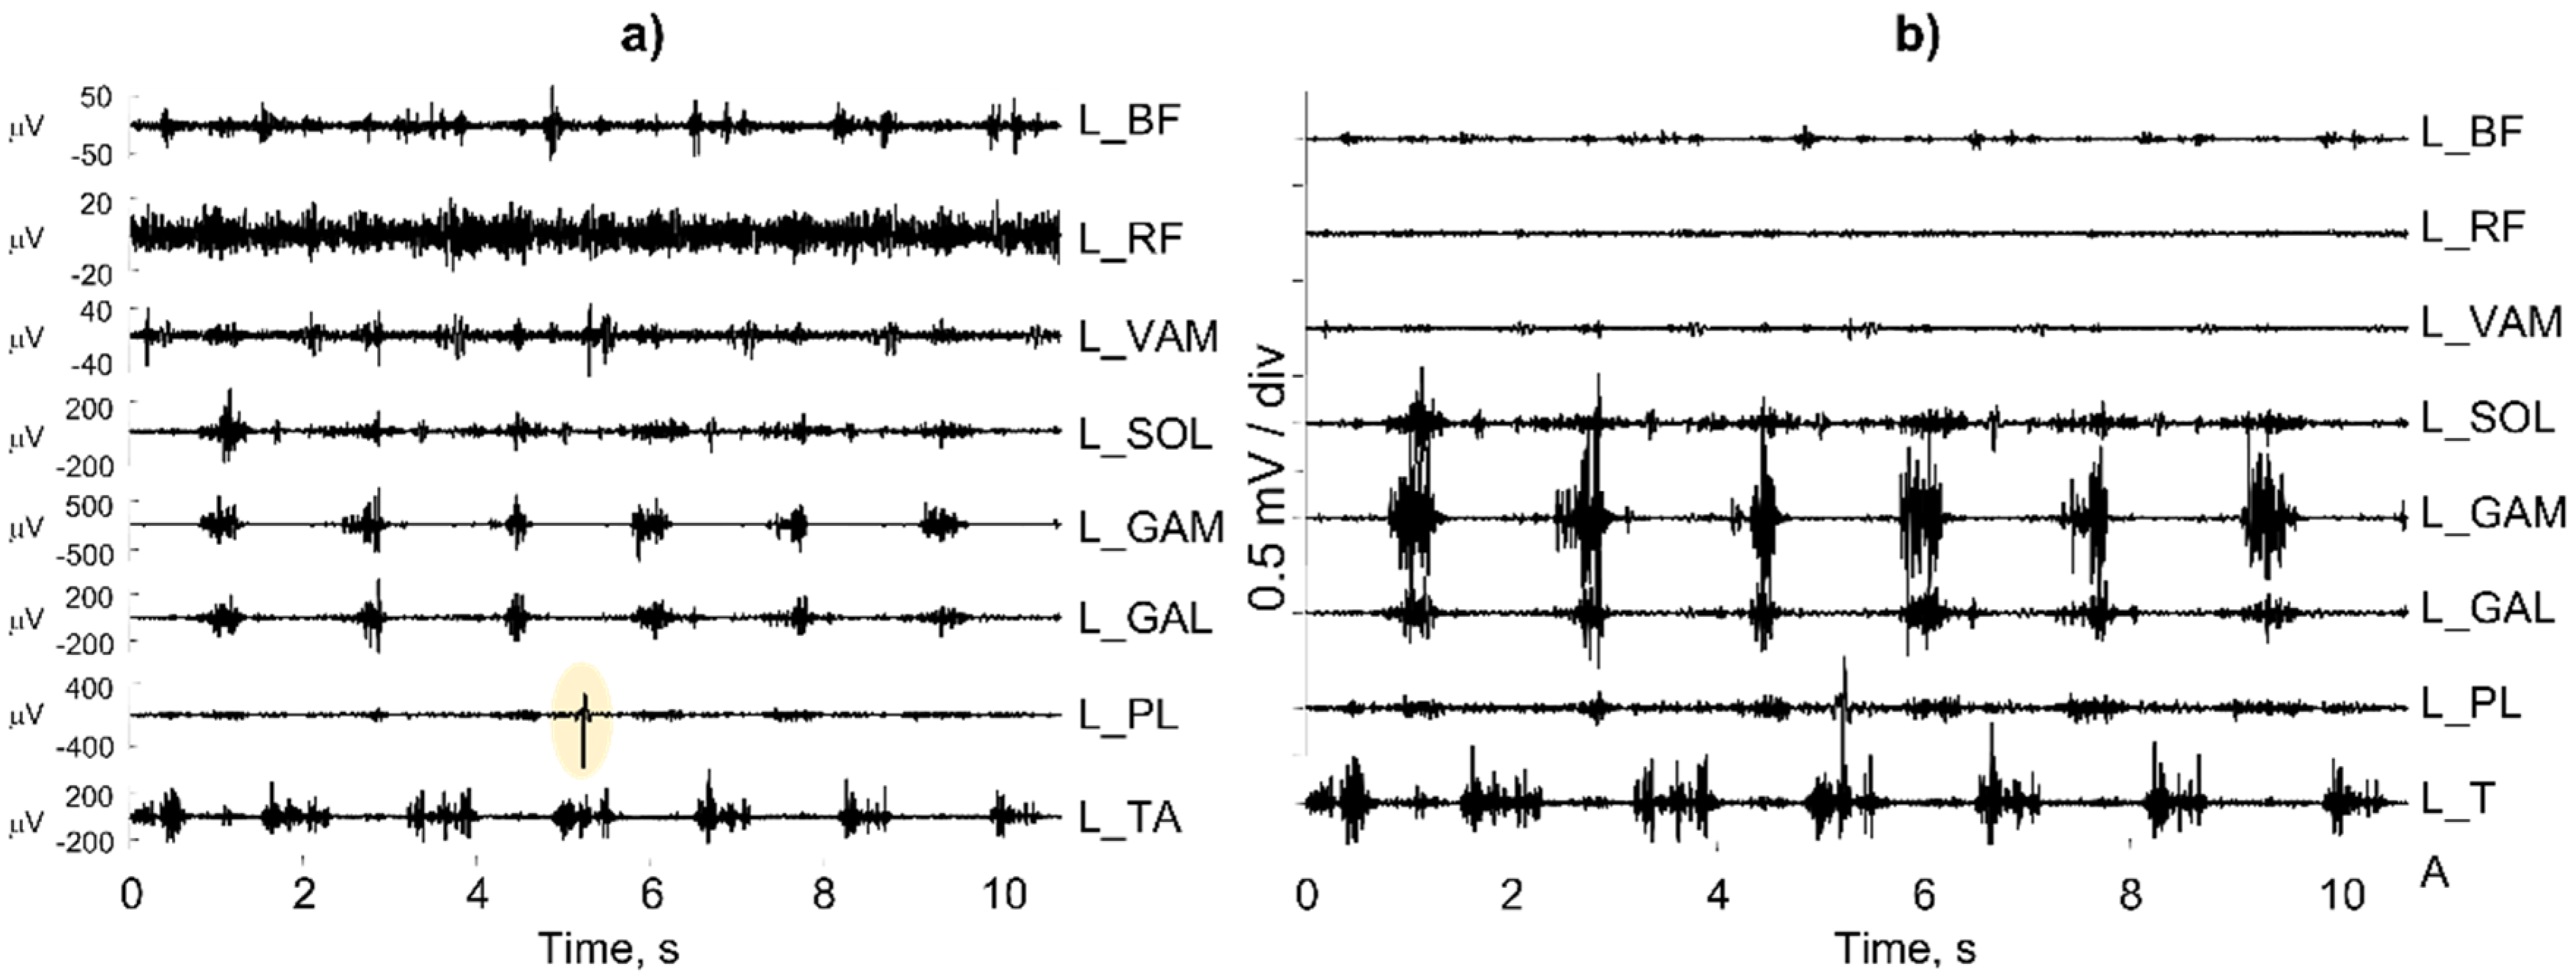
Figure 27a shows a number of individual sEMG bipolar channels recorded from muscles in the left leg of a subject with a continuous activity of the rectus femoris (L_RF). A more careful analysis reveals that the operator selected the “autoscale” option of the software instead of the “fixed scale” option.
Figure 27b shows the same channels with the same scale (0.5 mV/div for the input signal), but the picture is very different. In addition, the “autoscale” option automatically selects the scale of the L_PL muscle on the basis of the artifact outlined in yellow.
4.6. Issues in Ergonomics, Occupational Medicine, and Sport Sciences Applications
Surface EMG is fundamental for the proper design of workstations and chairs, the planning of sport training, and the understanding and prevention of neck, shoulder, and back pain [
15,
75,
76,
77].
Ergonomics, occupational medicine, and sport sciences require specific competencies and training in sEMG. These areas are affected by the barriers and difficulties that have been discussed elsewhere [
78]. The early NIOSH publication by Soderberg [
79], the book by Kumar and Mital [
80], the review by Marras [
81], and the recent works of Gazzoni et al. [
82] and Varecchia et al. [
83], among many other contributions, underline the importance of teaching the proper use of sEMG in ergonomics and occupational medicine. Similarly, the early work of Clarys [
84], Chapter 9 of
Electrodiagnosis in New Frontiers of Clinical Research [
85], and the recent work of Felici [
77], among many other works, outline 30 years of efforts in the field of sEMG use in sports and exercise. Following this long history of research, “There is a critical need to … instruct teachers across the disciplines of these fundamentals… and give access of these developments to the current generation of students, which would improve the translation in order to potentially predict and cure pathologies of the neuromuscular function. This has an impact, for example, on the student awareness level of some very simple points related to the correct collection of sEMG data. Issues such as electrode location, IZ detection, skin preparation, movement artifacts and sweating are very often ignored.” [
77].
In addition, Martin and Acosta-Sojo [
78] indicated that “The application of sEMG requires knowledge (e.g., EMG theory, signal processing, and neurophysiology), experience (e.g., electrode placement and signal morphology), and time (e.g., experimental design and procedure). These essential components may be deepened in doctoral studies but are not provided in clinical curricula such as physiotherapy and occupational therapy. Hence, broadening or amending the educational programs of physiotherapists, occupational therapists, movement scientists, and ergonomists (as future clinical users of sEMG) should prove useful.”
Further considerations for sEMG applications in sports and ergonomics are relevant and discussed in the extensive literature [
83,
86] but exceed the purpose of this work. In all studies, the proper acquisition of sEMG is fundamental to reaching consistent conclusions.
The published literature [
19,
20,
36,
87] contains summary tables of all of the main factors that may affect correct signal estimation and the basic guidelines to follow for proper EMG recording.
5. Discussion and Limitations of the Work
As indicated in the introduction, this work does not present innovative research results concerning sEMG hardware, processing techniques or applications. Rather, it presents (a) a number of the “first level” fundamental concepts of sEMG detection and interpretation that clinical operators should be familiar with and (b) some model-based teaching tools that could be useful to teach these concepts. All of these concepts can be found in textbooks and tutorials, in which they are presented within the mathematical framework that engineers are familiar with. This framework is unacceptable to most clinical operators, who have neither the need nor the background required to understand it. This work provides material and suggestions concerning the teaching of these concepts and their transfer into the educational curricula of clinical figures.
The same applies to other “second level” technical concepts, such as the spectral analysis of sEMG, the myoelectric manifestations of muscle fatigue, image segmentation and the definition of regions of muscle activity, the decomposition of interferential EMG into the constituent MUAP trains, the association between sEMG and biomechanical variables, sEMG in dynamic conditions, etc. These concepts are not discussed in this work, which is focused mostly on the fundamental issues of sEMG detection and simple model-based interpretation and teaching.
Surface EMG is very rich in information that can be extracted to draw conclusions about the coordination between muscles and muscle groups [
88] and the anatomy, physiology, and pathology of a muscle and to monitor muscle changes following pathologies, training or therapeutic interventions. The proper understanding of sEMG generation and detection processes, as well as the visual understanding of the raw signals and the verification of good quality, is a fundamental preliminary step for the subsequent computer-assisted extraction of features (e.g., muscle fiber CV, amplitude and spectral variables, etc.) of sEMG to avoid the GIGO (garbage in, garbage out) effect.
A number of textbooks, recommendations, tutorials, consensus papers, and editorial projects have been published concerning these issues [
17,
19,
20,
22,
34,
35,
36,
89,
90]. They include indications of the procedures to follow in order to (a) allow other researchers to reproduce the published work, (b) indicate whether or not results may be compared to those of others, and (c) promote the preparation of standards that account for clinical experiences. Despite the extensive literature concerning these recommendations, the published articles discuss a great variety of sEMG electrode sizes, distances, and locations. Sometimes, this information is not even reported or incorrectly reported, as indicated in the recent review by Merlo et al. in Special Issue [
39]. A greater awareness of the problem is required by reviewers, journals, and schools, as well as by scientific and professional societies within the field.
A fundamental issue is the technology transfer from research labs to professional and medical schools, as well as to healthcare institutions. The simplification of concepts (as is often demanded by clinical operators and attempted here) and the availability of free teaching materials and recommendations are by far insufficient. As Rogers [
91] notes, innovations are initially perceived as uncertain and even potentially negative. To overcome this uncertainty, most people seek out colleagues who have already adopted the new idea. Thus, the diffusion process is initiated by a few individuals who see the advantages in adopting an innovation and then spread the word among their colleagues or acquaintances, which is a process that takes years, regardless of the availability of textbooks, recommendations, publications, and teaching materials (which is often disregarded) [
92]. Every change requires intellectual and learning efforts by the user and the view of such effort as a social, as well as economical, process [
86,
88,
93] (see the EMG Reporting Standards of the International Society of Electrophysiology and Kinesiology, available online:
https://isek.org/emg-standards,
https://www.tudelft.nl/en/education/programmes/bachelors/kt/bachelor-of-clinical-technology/, and
https://www.tudelft.nl/onderwijs/opleidingen/masters/technical-medicine/msc-technical-medicine/).
As in the case of other bioelectric signals, it is up to the clinical operator to promote and use newly available technical information that is suitable for properly answering clinical questions. Learning about this in school is important; however, the fields of rehabilitation technology and neuromuscular instrumentation are becoming so extensive that it is hard to fit even the basic concepts discussed in this work into the few academic years that lead to a degree in physiotherapy, sport and movement sciences or ergonomics. To some extent, this is true in other healthcare fields as well and has justified the training of new interdisciplinary professional health figures, such as the “clinical technologist” that trains at the Technical University of Delft (NL) (
https://www.tudelft.nl/en/education/programmes/bachelors/kt/bachelor-of-clinical-technology/, and
https://www.tudelft.nl/onderwijs/opleidingen/masters/technical-medicine/msc-technical-medicine/) within the BS and MS curricula for courses on “advanced signal acquisition”, “sensing neurophysiological signals”, and the “electrostimulation of the neurophysiological system”. These new figures may solve the problem of the lack of time to teach measurement techniques, such as sEMG, to strictly clinical operators. This issue of the lack of time has been pointed out repeatedly in a number of surveys [
17,
94]. These new interdisciplinary figures may help to address problems that can be solved by technology that are not yet perceived as important by clinicians.
6. Conclusions
Surface EMG technology is undergoing very fast development, which allows for the non-invasive investigation of movement, muscle function, and nervous system control strategies. This progress is much faster than the process of knowledge transfer, meaning that the knowledge gap is widening [
3,
32,
92,
95,
96]. The correction of this situation requires the broadening of educational programs and the competence of the clinical users of sEMG, such as physiotherapists, occupational therapists, movement scientists, ergonomists, physical medicine and rehabilitation physicians, and clinical neurologists. This work indicates some options, tutorials, and tools that are available for motivating and training teachers, students, and clinicians for the challenges that they may face within the sEMG field. Existing tools and tutorials are mostly open-access and others are in preparation.
Many more materials should be developed, based on the experience of teachers and clinicians in the field, to provide explanations and descriptions of sEMG features (not discussed in this work) using analogies and user-friendly models.
The success of any future hardware/software technology to extract information from sEMG fundamentally depends on the ability of the operator to collect “good” sEMG signals from the desired muscles that are free from artifacts and power line interference and have minimal crosstalk from other muscles. The proper training and academic education of operators is a necessary condition for the success of the available, as well as future, technologies within this field.


 ,
, 
