
Body Temperature—Indoor Condition Monitor and Activity Recognition by MEMS Accelerometer Based on IoT-Alert System for People in Quarantine Due to COVID-19


Abstract
1. Introduction
2. Material and Methods
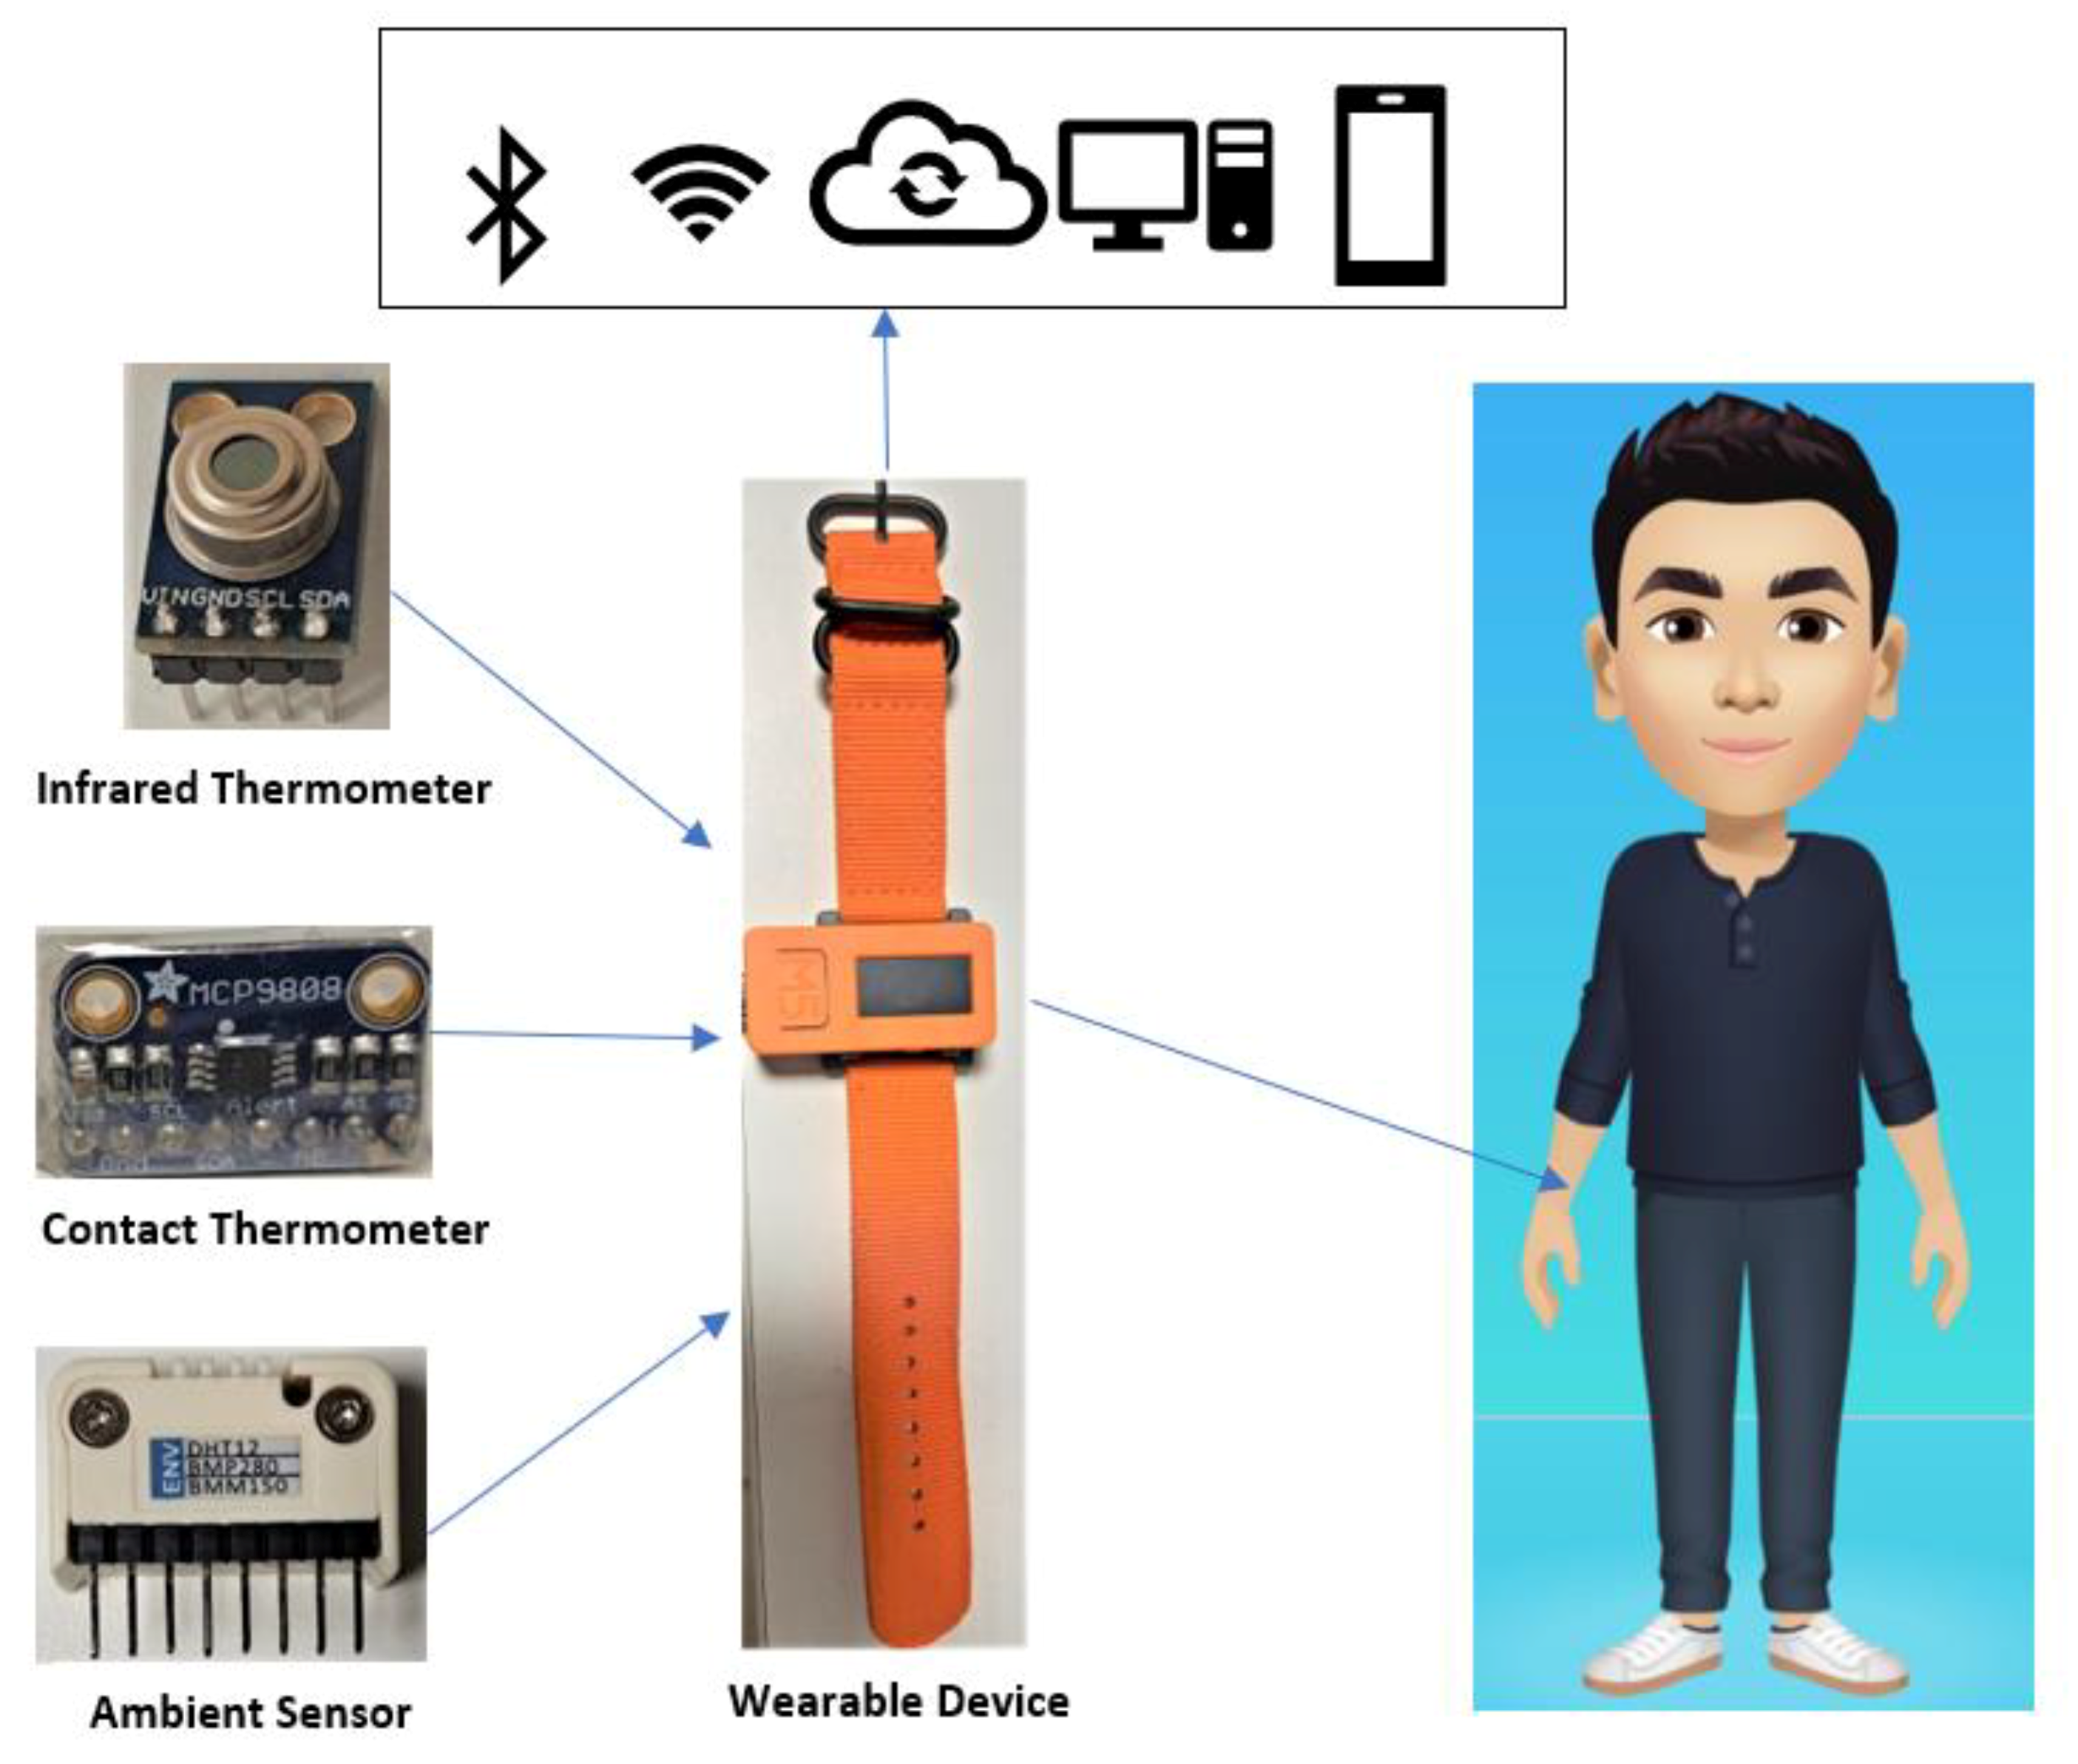
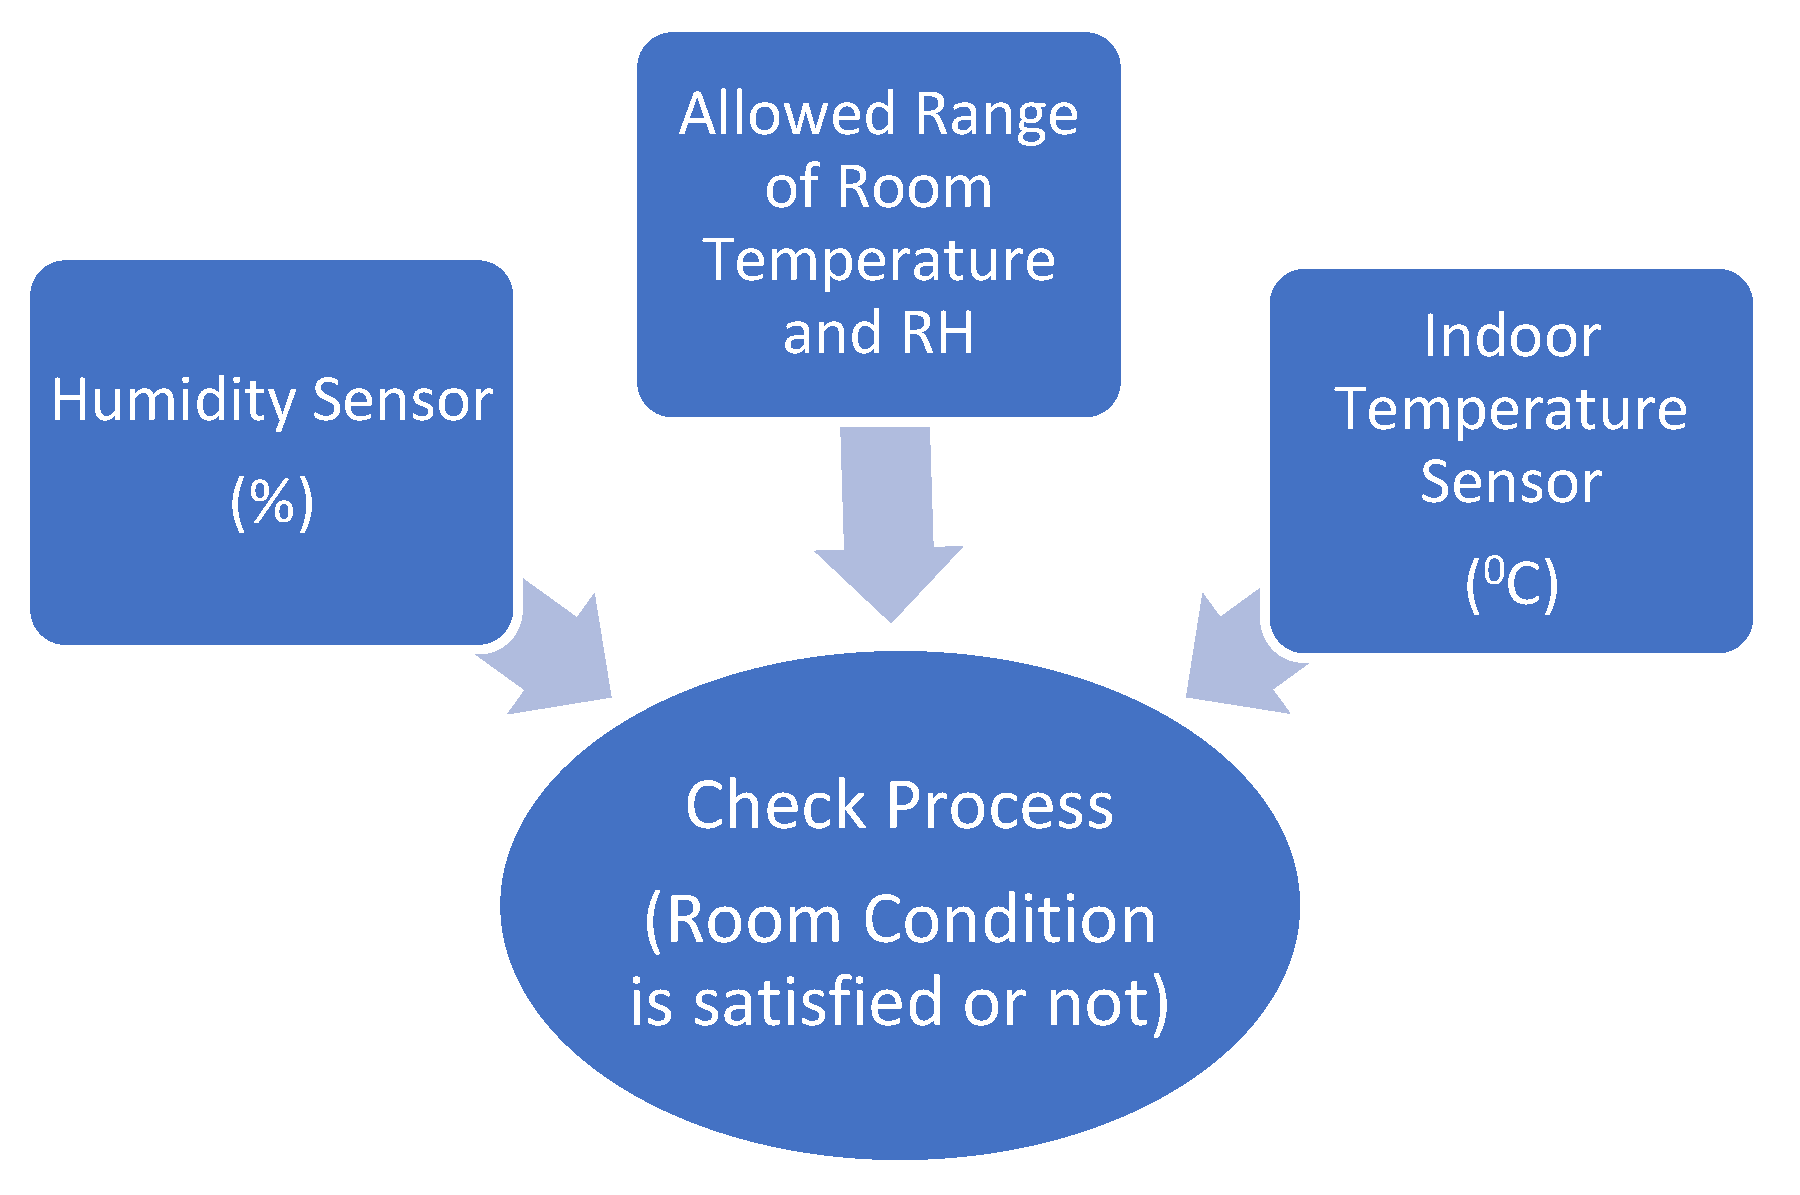
2.1. Room Condition Sensor
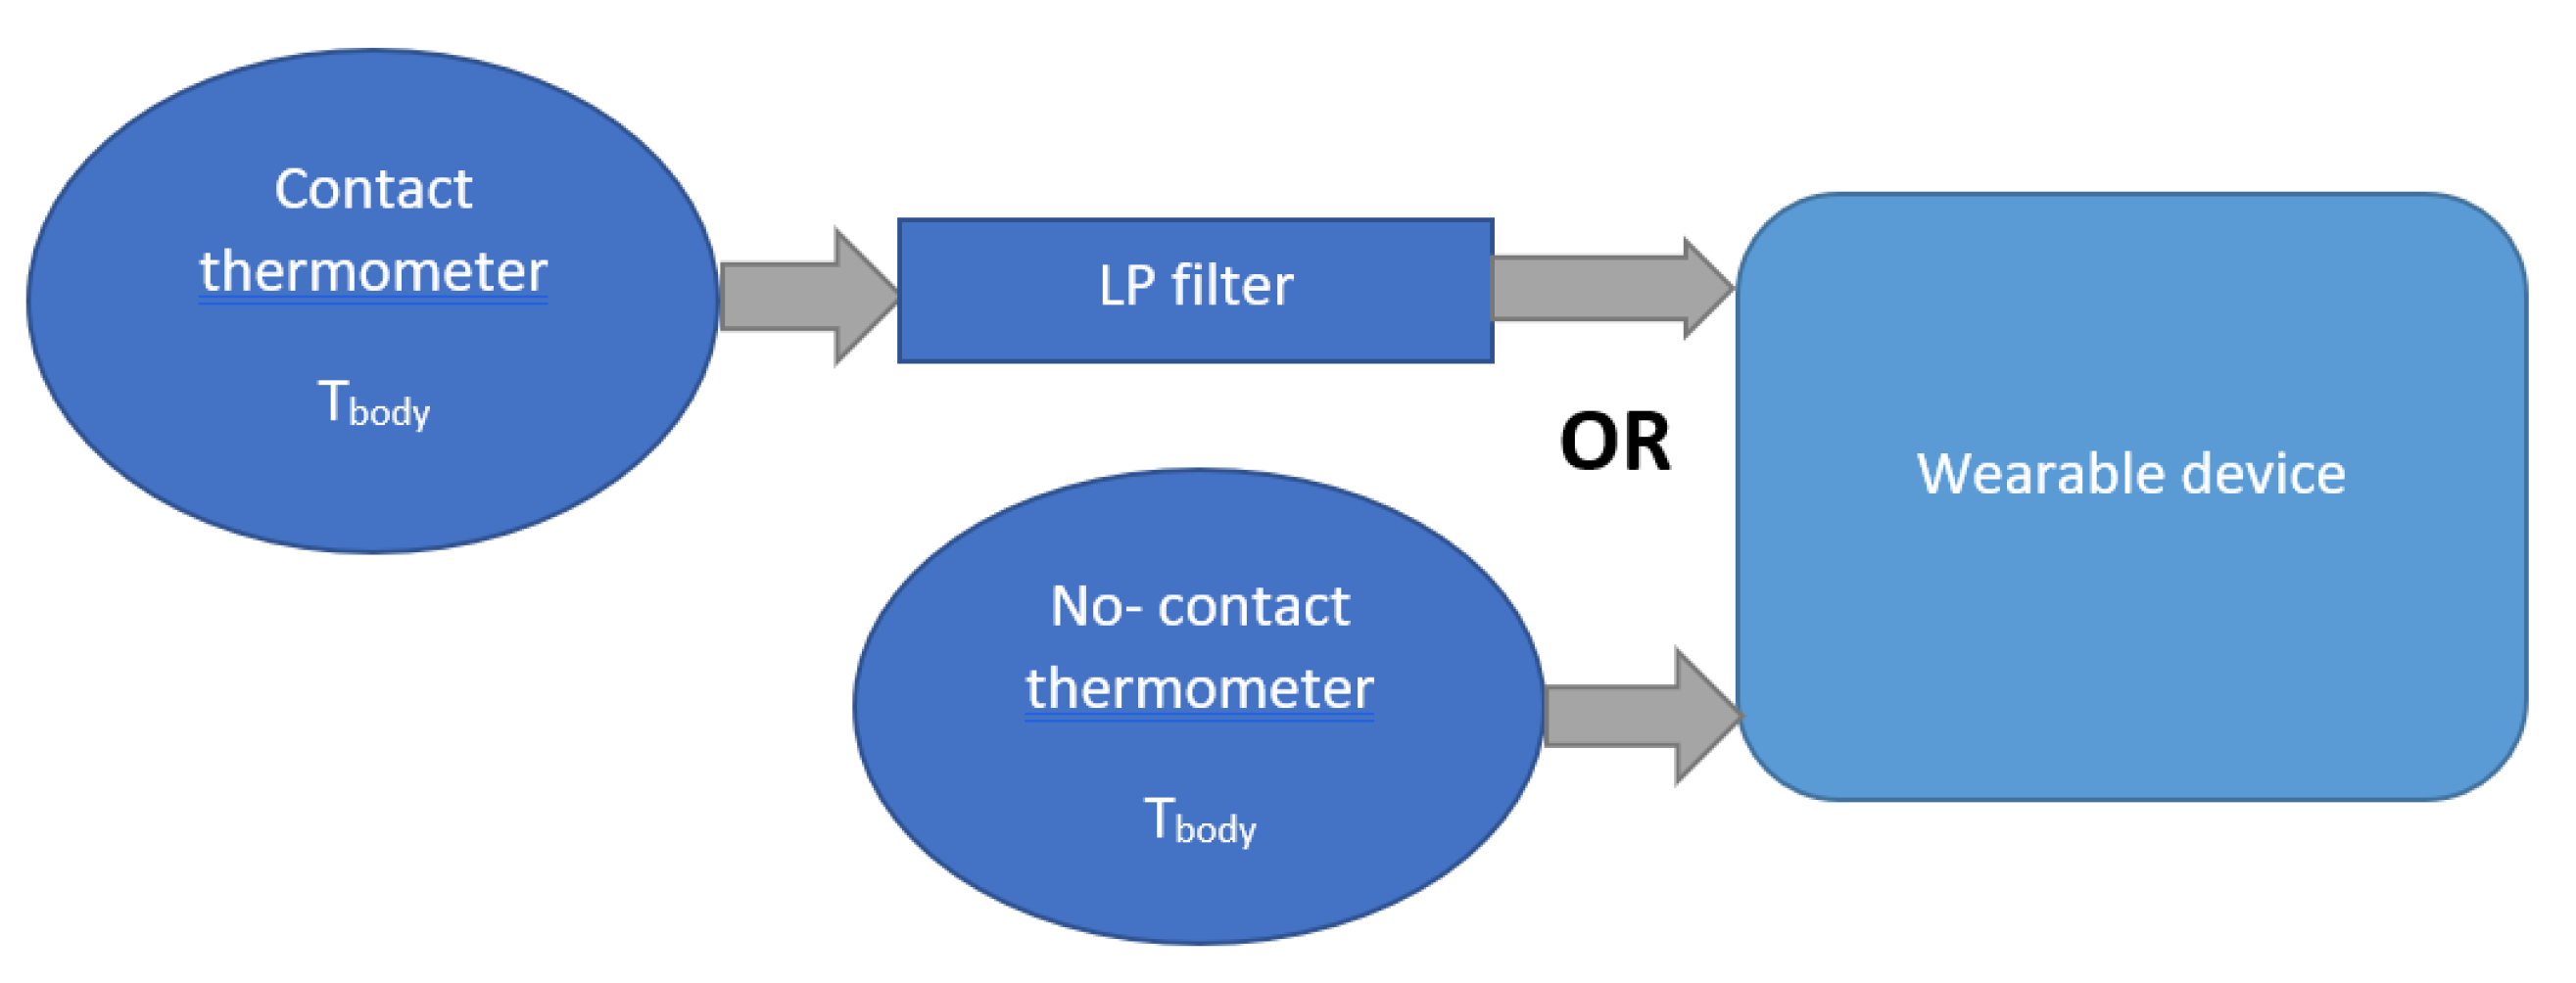
2.2. Body Temperature Sensor
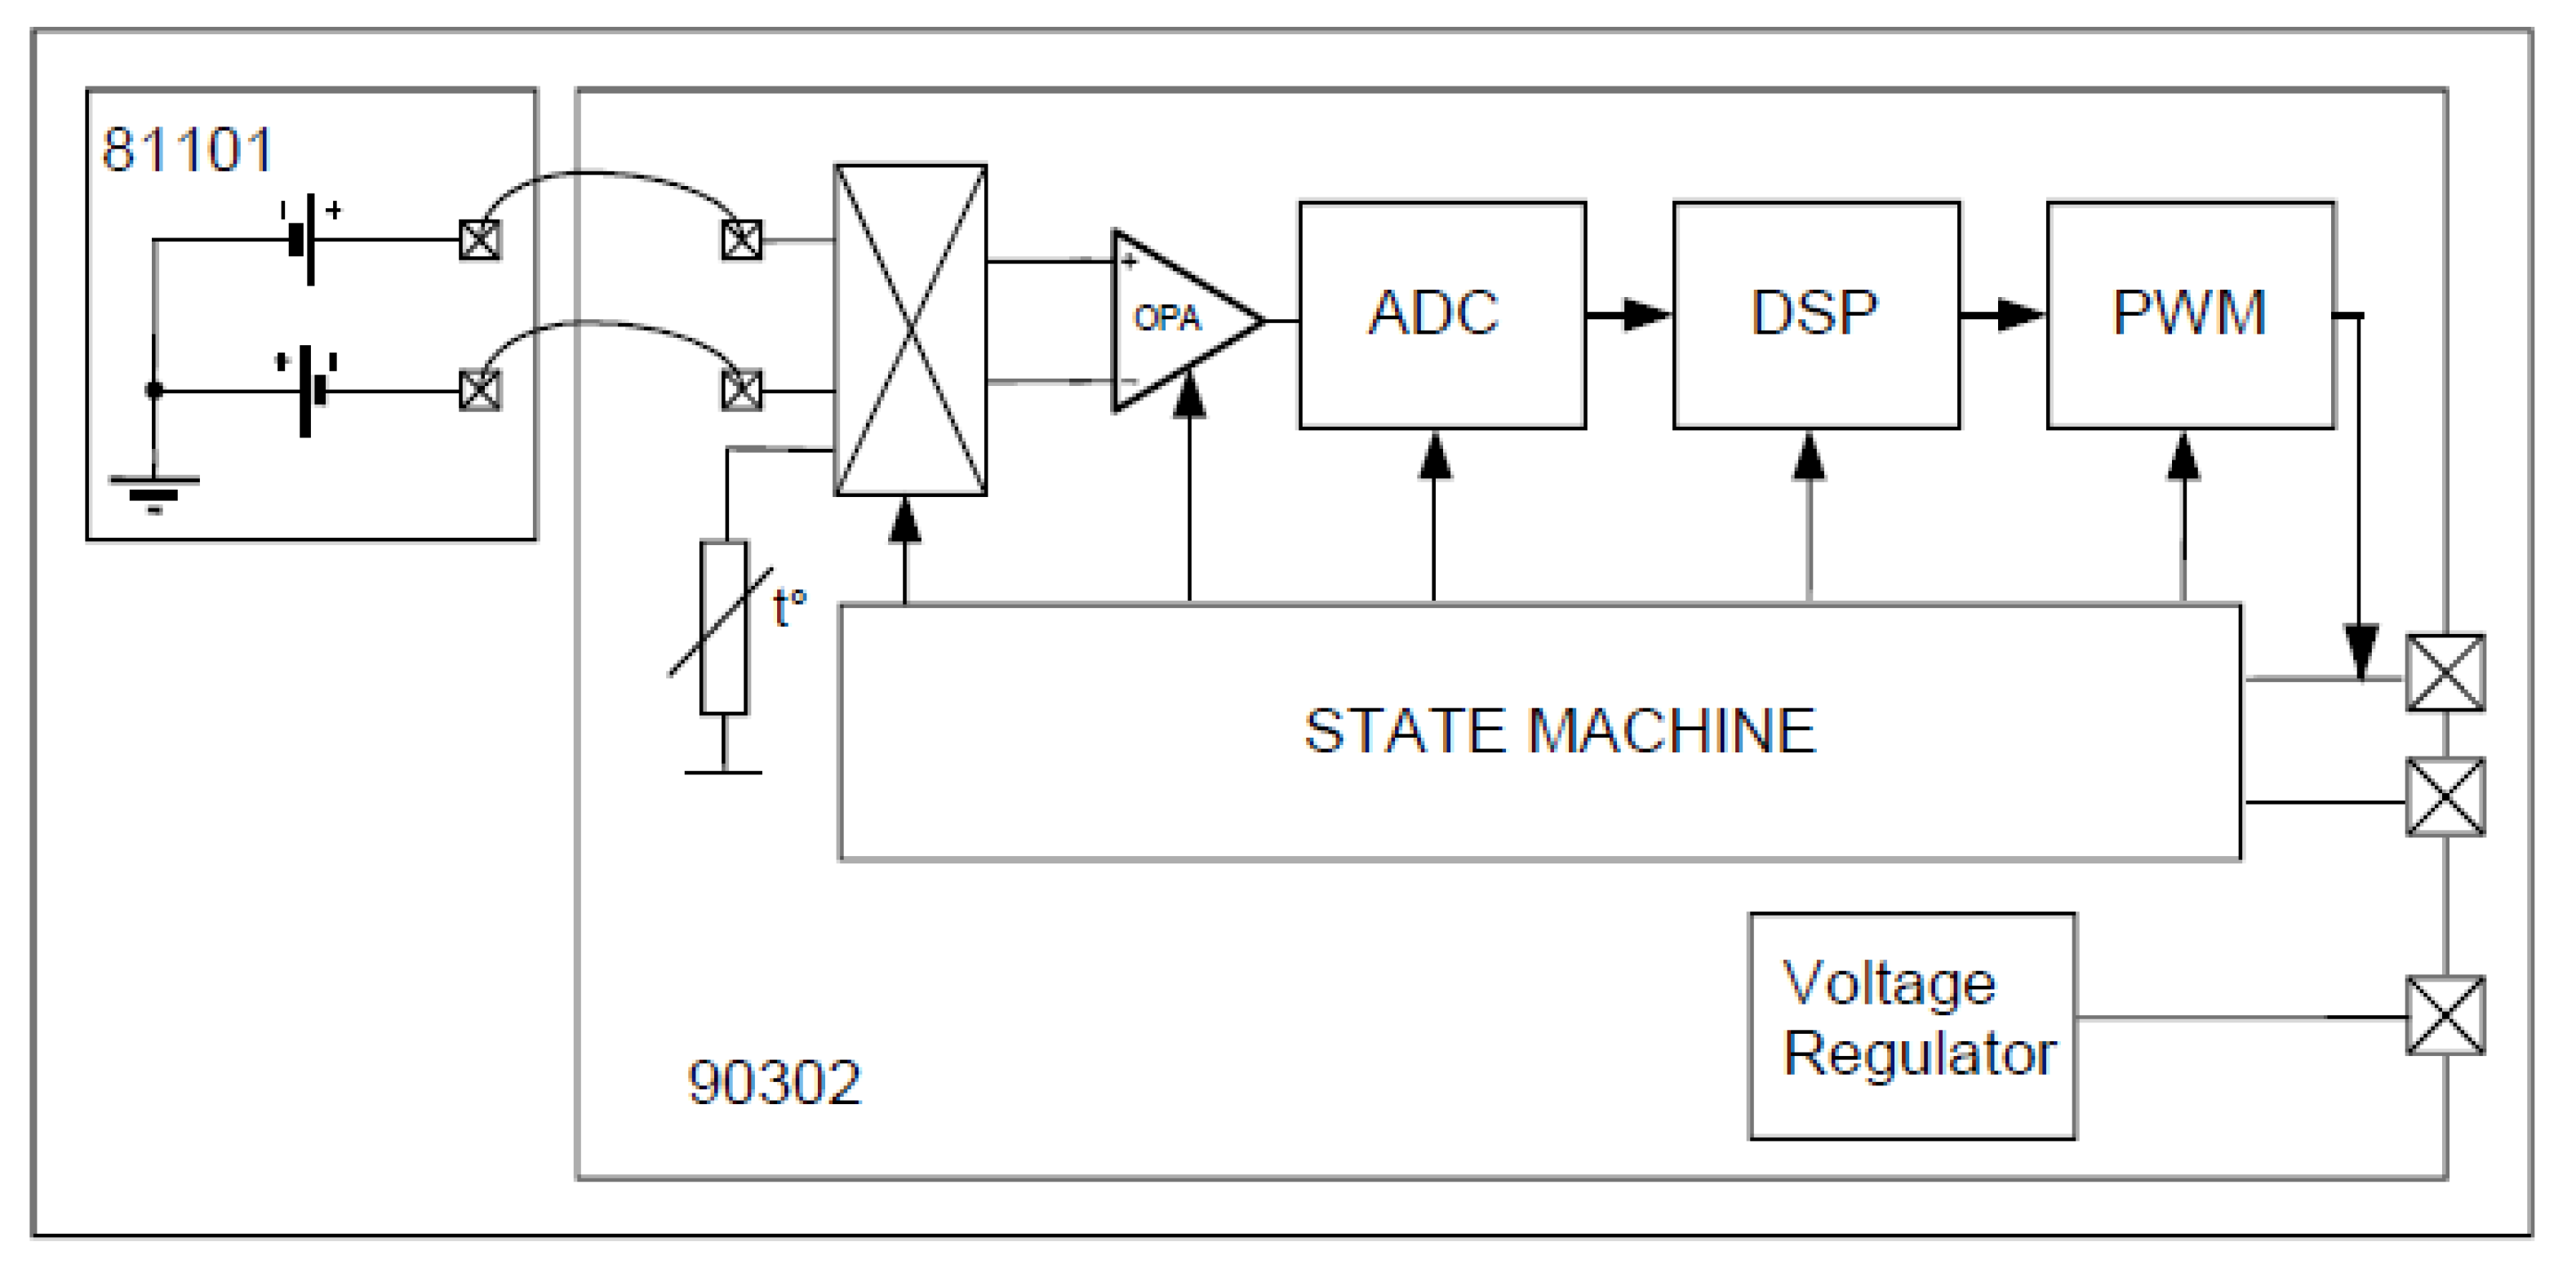
2.2.1. Infrared Thermometer
- The MLX90614 operation is controlled by an internal state machine, which calculates the object temperatures, then postprocesses the signal through the pulse width modulation (PWM).
- The output of the IR sensors is amplified by a low-noise chopper amplifier (OPA) with programmable gain, converted by a high-resolution Analog–Digital Converter (ADC) to a single bitstream and fed to a digital signal processing for further processing.
- At the next stage, the signal passes through the low pass filter to remove the high-frequency signal and refresh rate. Finally, the measurement result is available in the internal random-access memory.
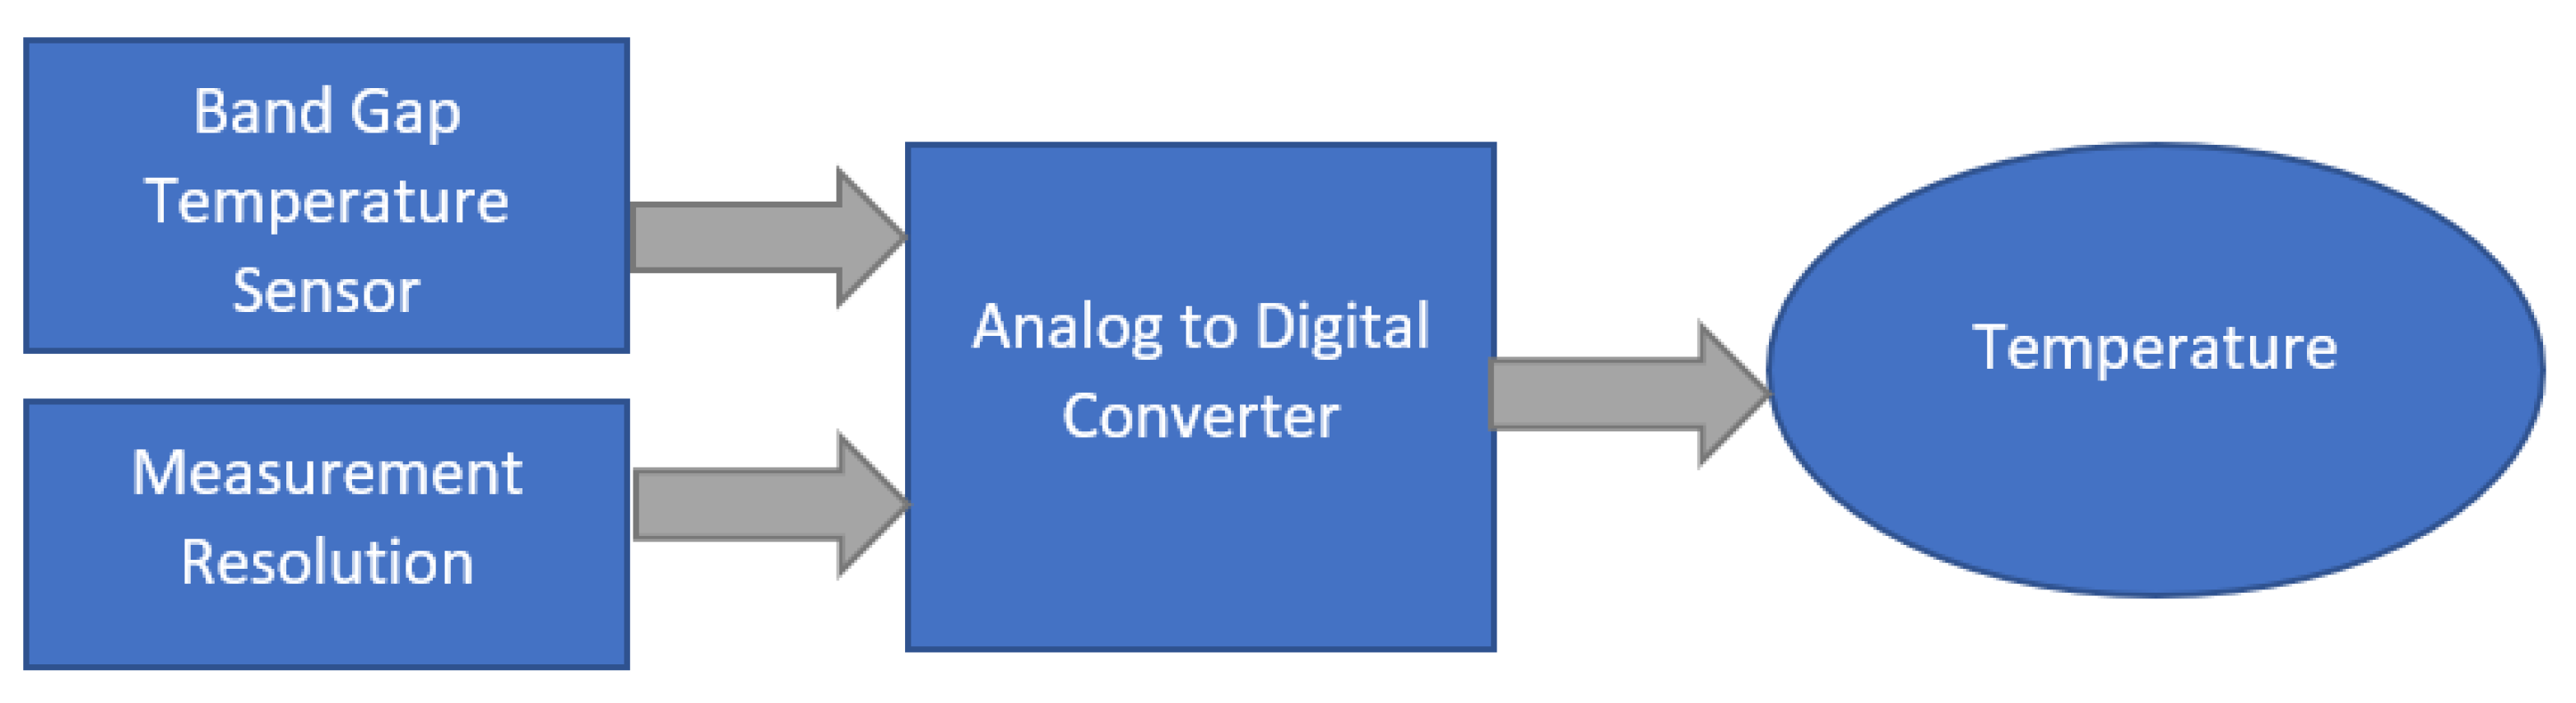
2.2.2. Digital Temperature Sensor
- Tout is the output of the LP filter.
- Ti and Ti − 1 are the temperature input from the thermometer.
- The coefficient β represents the degree of weighting decrease, a constant smoothing, β ∈ [0, 1). If β = 1, the output is equal to the input without any filtered signal. A smaller value of β makes the filtering effect stronger, but it increases the filter’s time constant. In this work, the selected β is 0.5 to guarantee sufficient filtering capability and still maintain a good dynamic response.
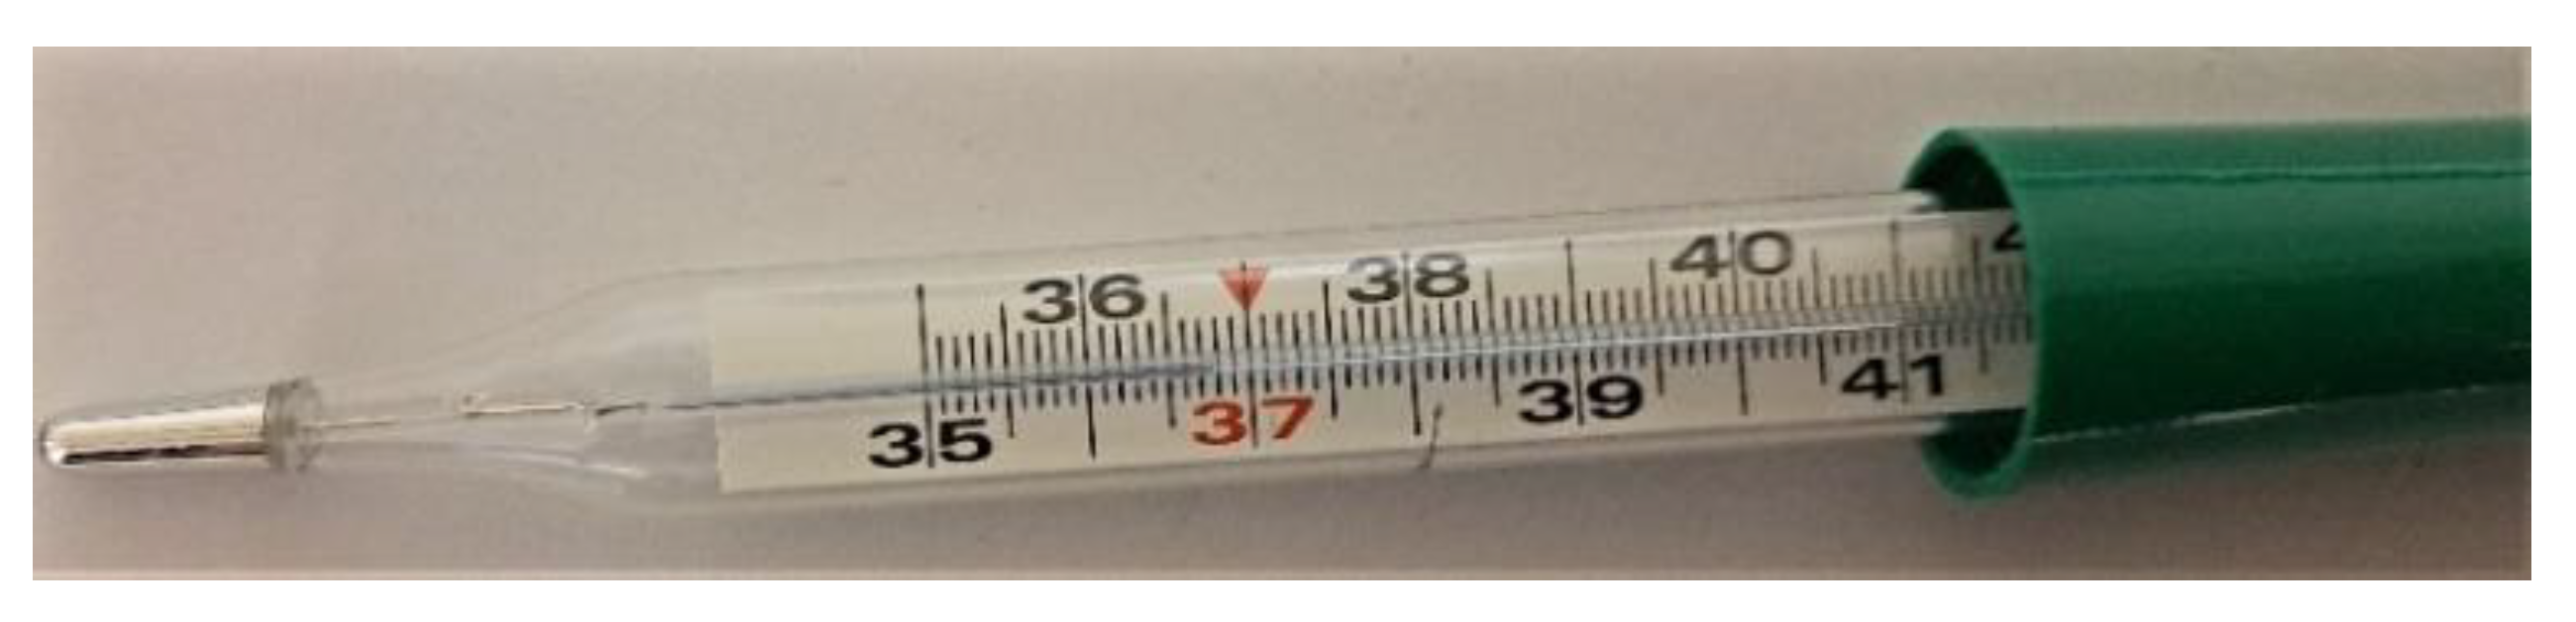
2.2.3. Thermometer Calibration
- At the first process, the digital sensor is equipped on the wrist and the glass thermometer is placed inside the body simultaneously. After 10 min, the glass thermometer reaches the proper value and becomes the temperature reference (Tref).
- At this stage, the digital thermometer already receives the heat of user skin and acquires the stable measurement. Since this moment, the calibration procedure for digital thermometer is carried out by averaging N samples from raw data (Traw). This average result (Tavg) contains any bias such as skin heat. Now, the difference between Tref and Tavg is calculated as bias to be removed from Traw.
- Tavg is the average result from N sample number of the digital thermometer. In this calibration, N = 50 for average calculation.
- Ti is the digital temperature data.
- Tbias is the temperature difference between wrist and the inside body part such as armpit.
- Tcal is the calibrated temperature measurement which is output of the sensor device.
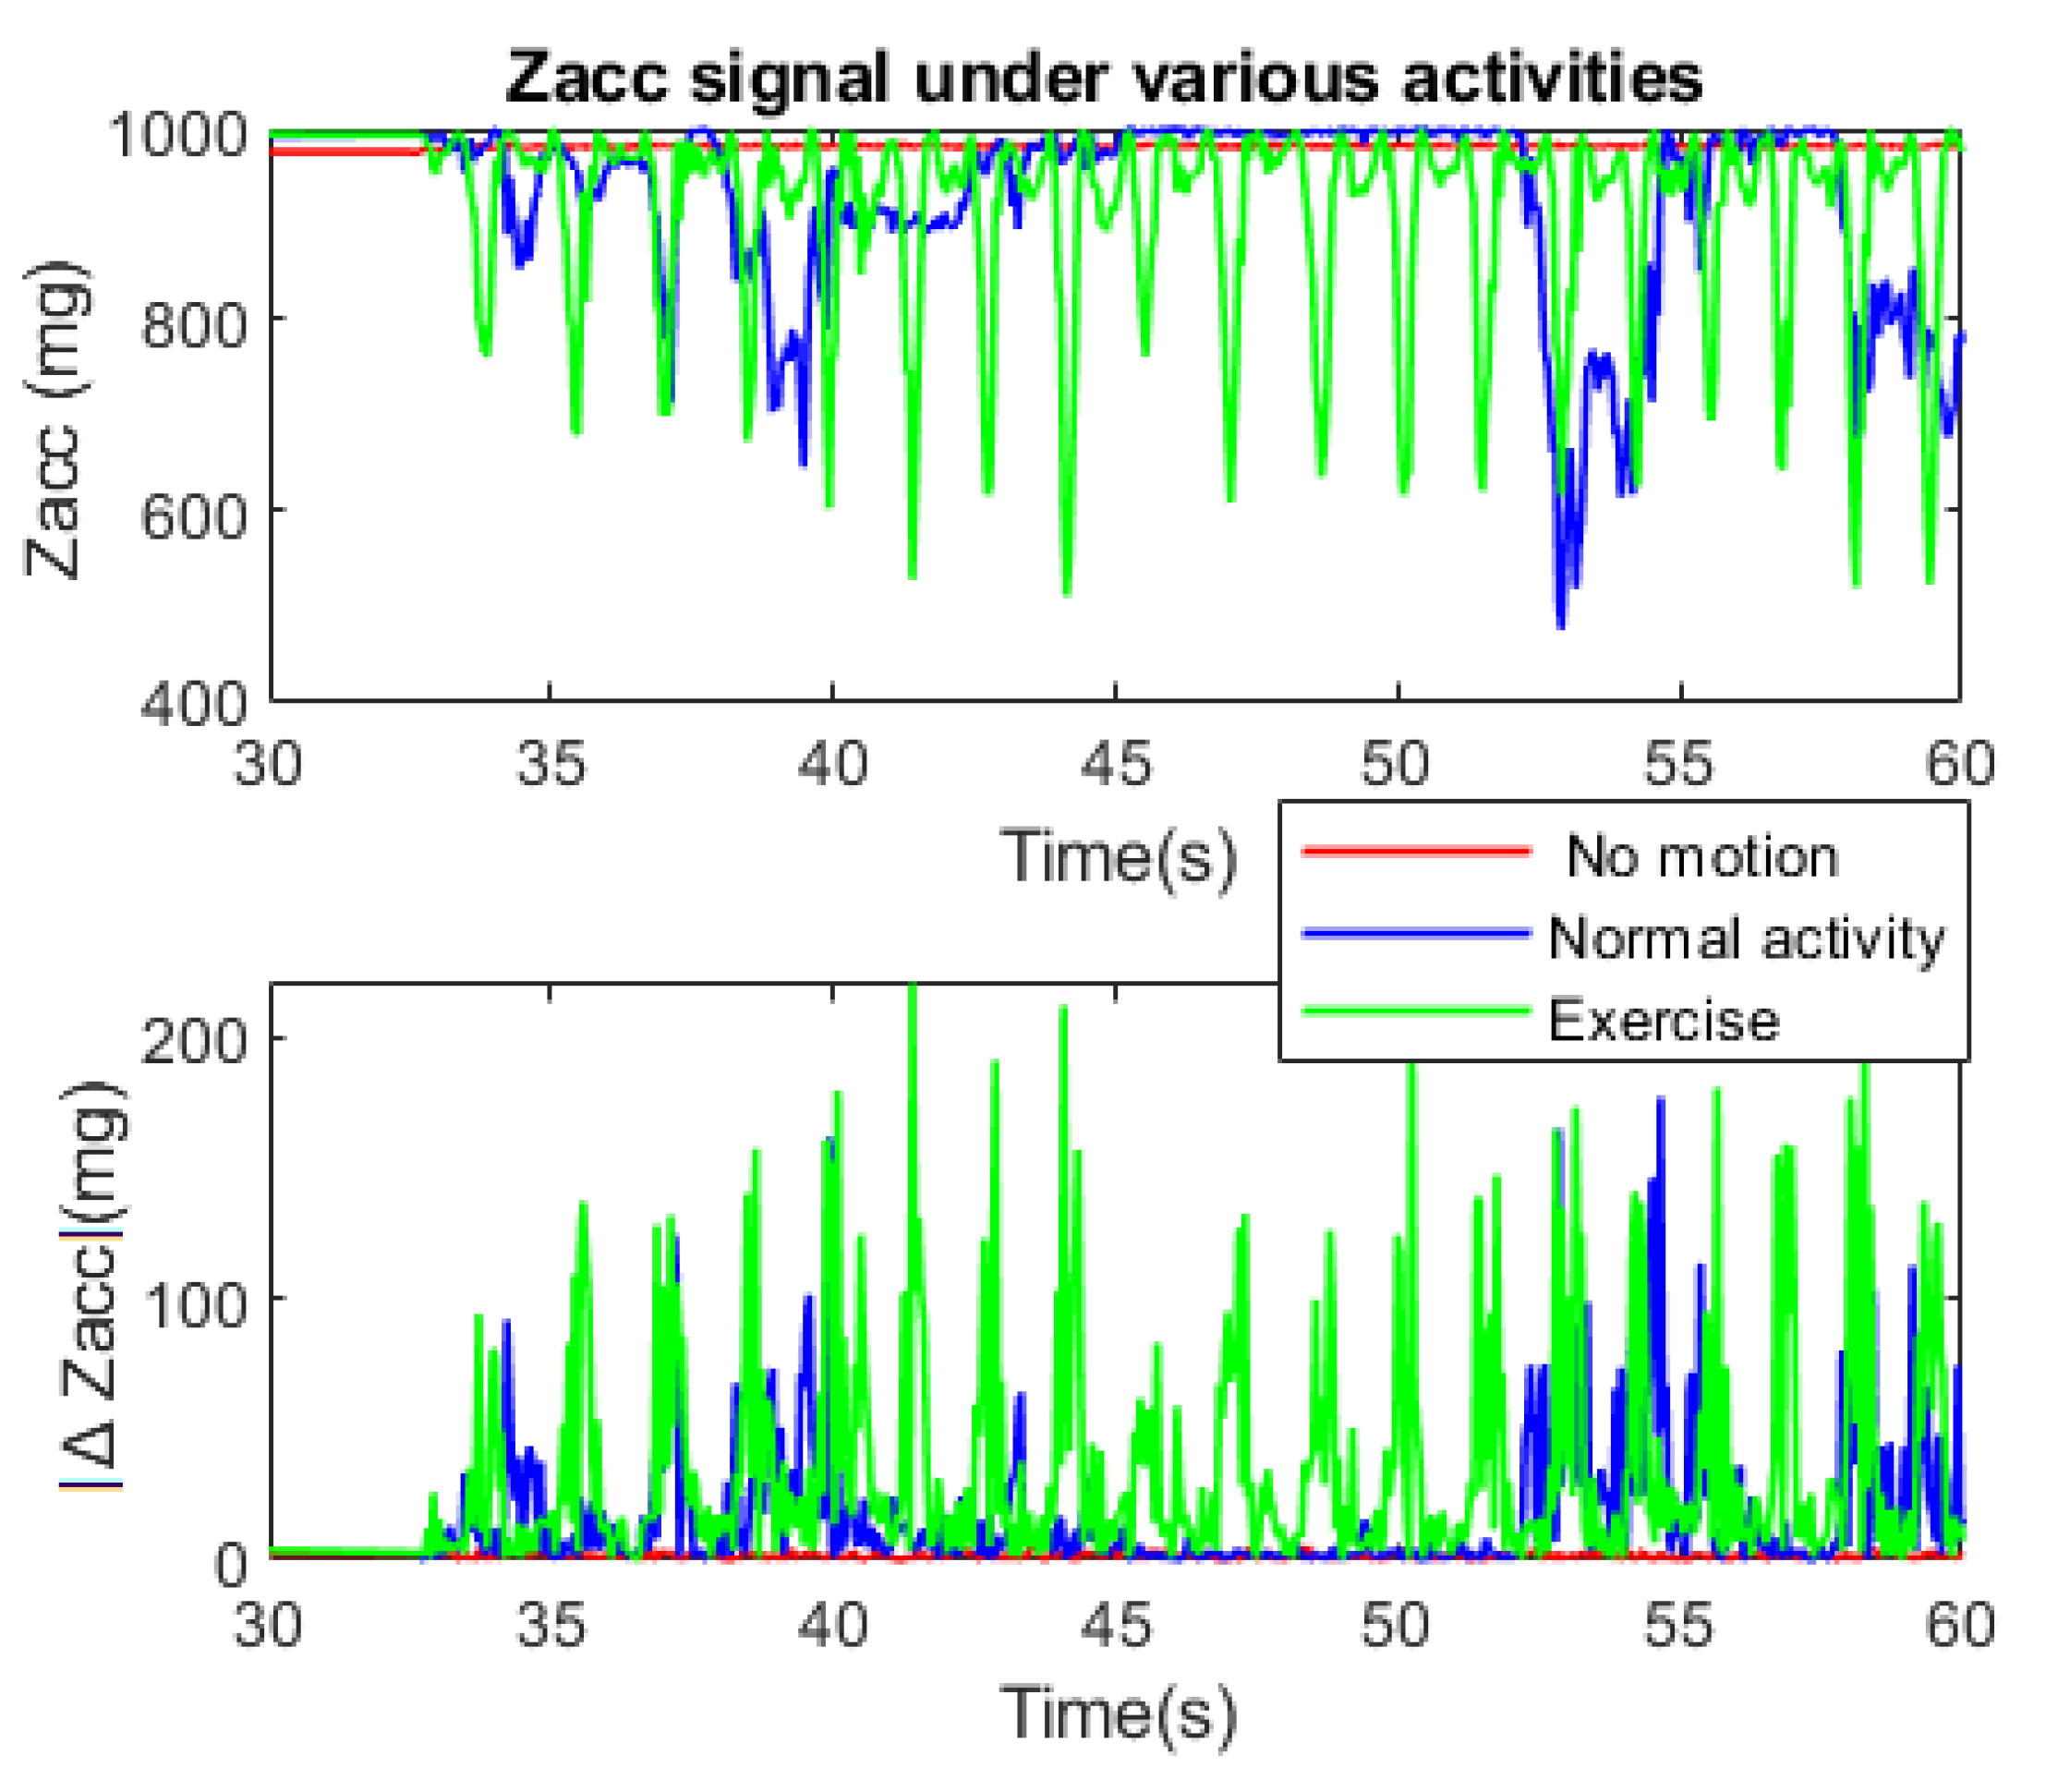
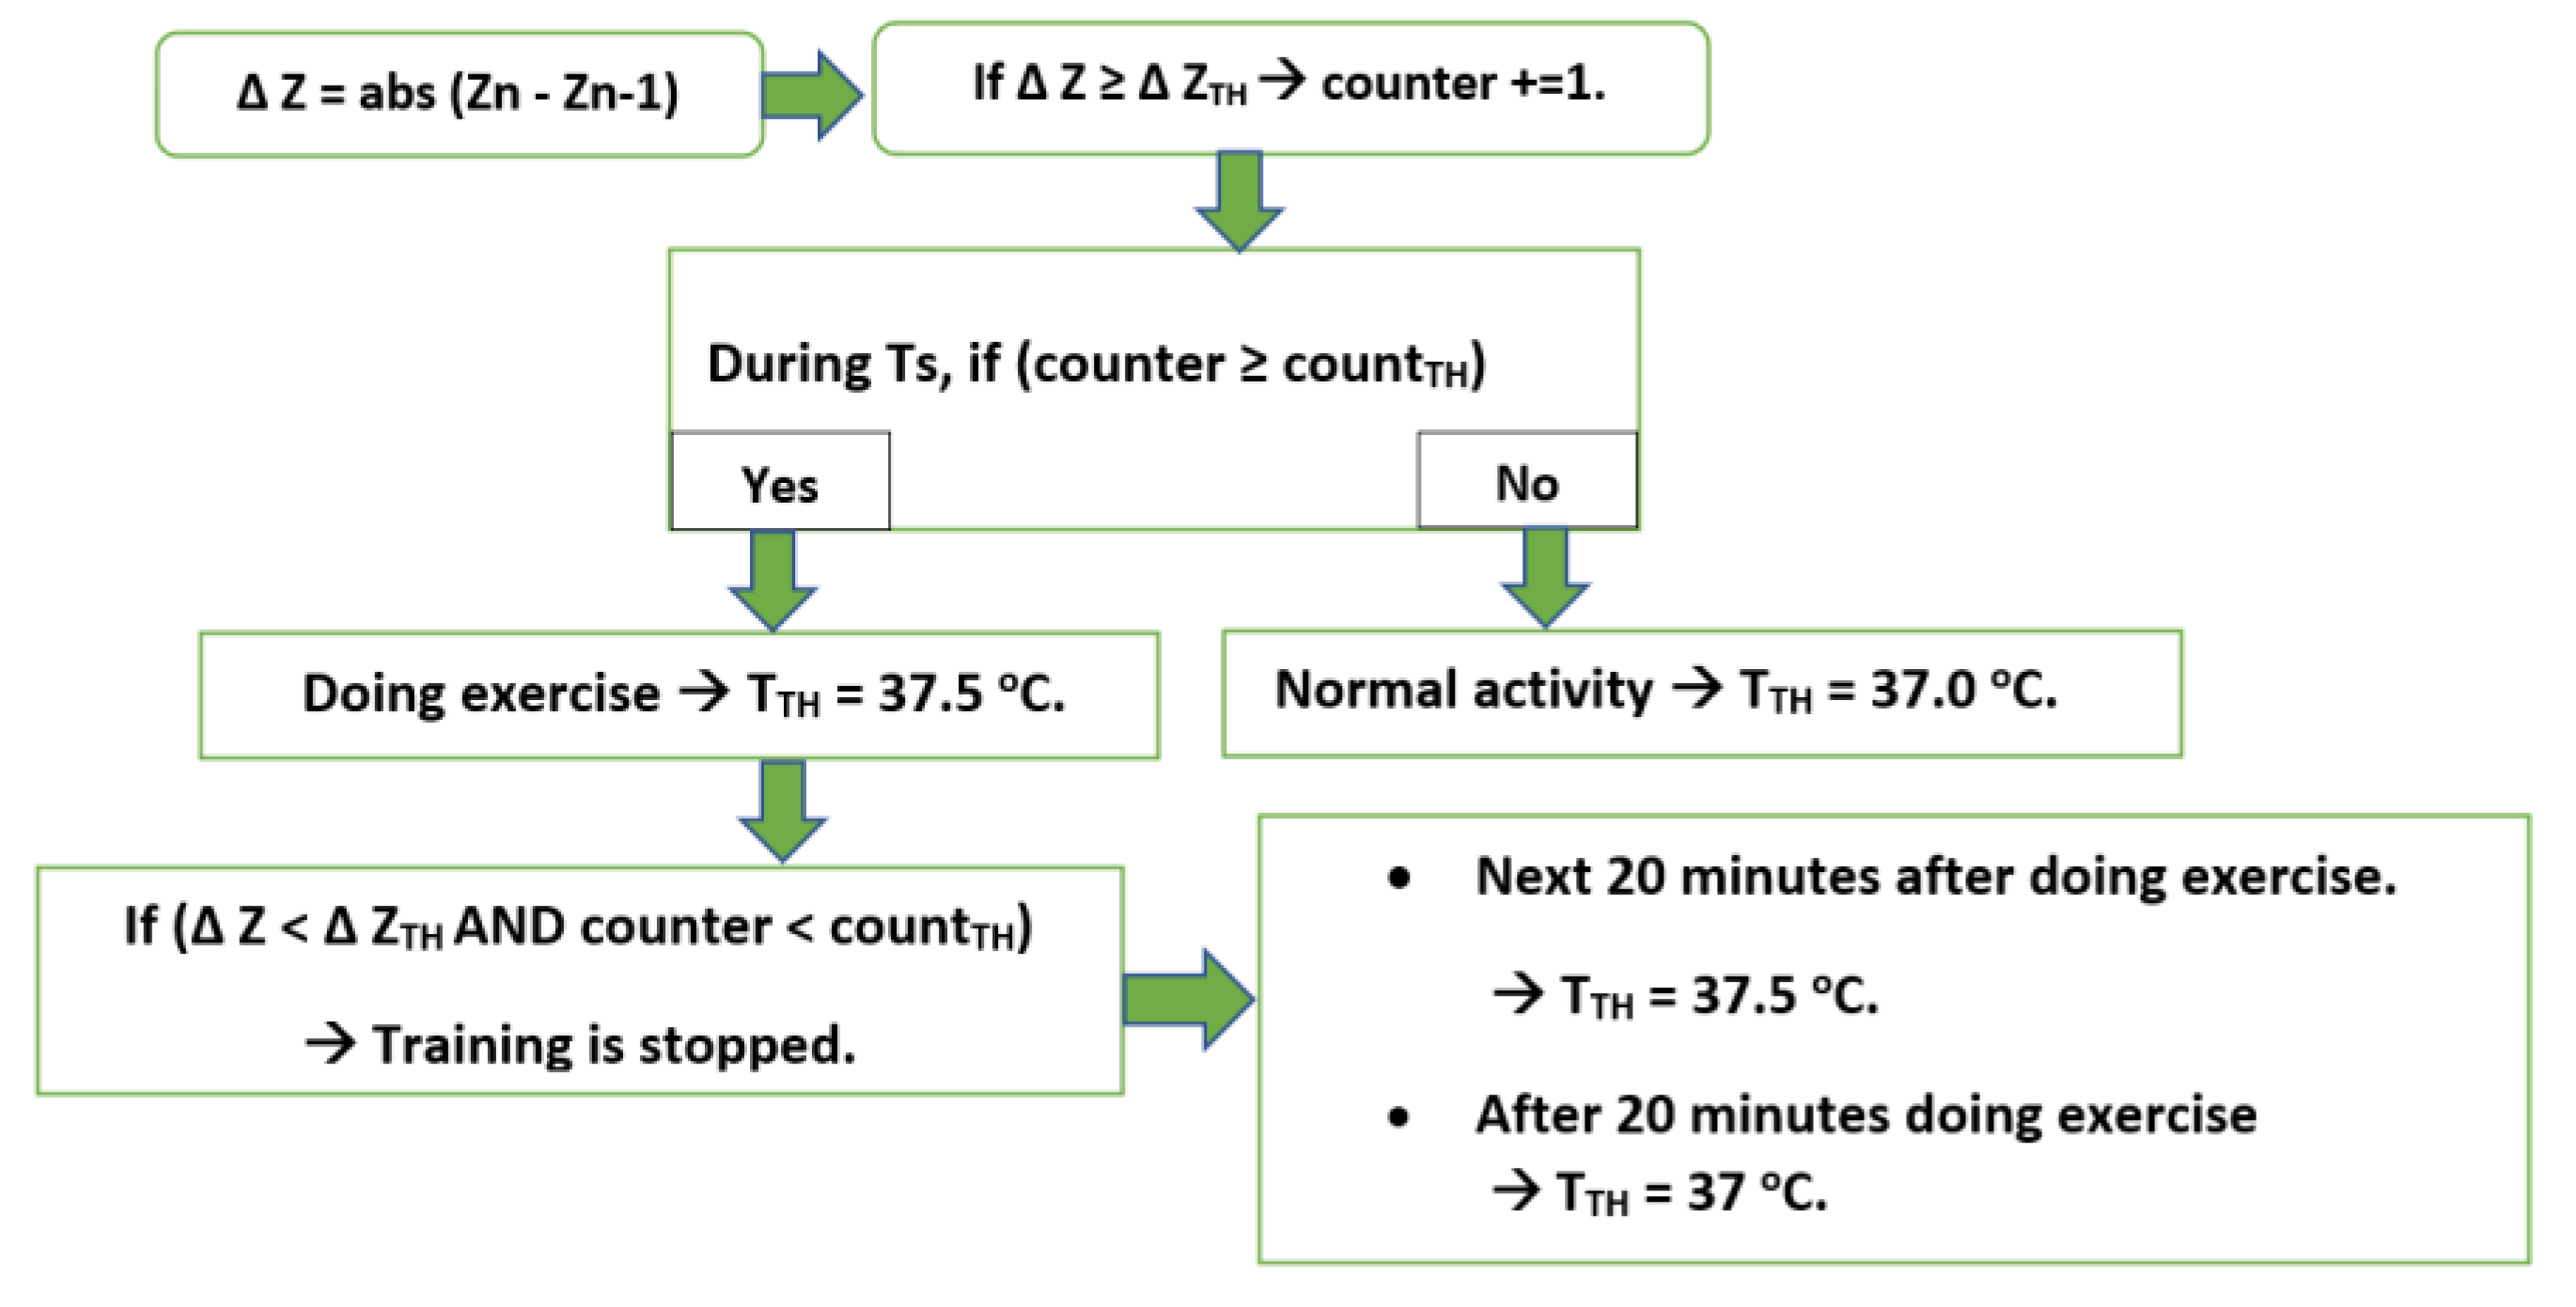
2.3. RSC Based on MEM Accelerometer
- No motion (sleep, sit at one place, etc.).
- Normal activity (stands up, normal behavior, etc.).
- Doing exercise.
- Number of spikes per Ts (counter)
- The ΔZacc value which is considered as spikes (ΔZTH).
- Threshold of spike number per Ts, which is considered as doing exercise (countTH).
- Temperature threshold for body (TTH)
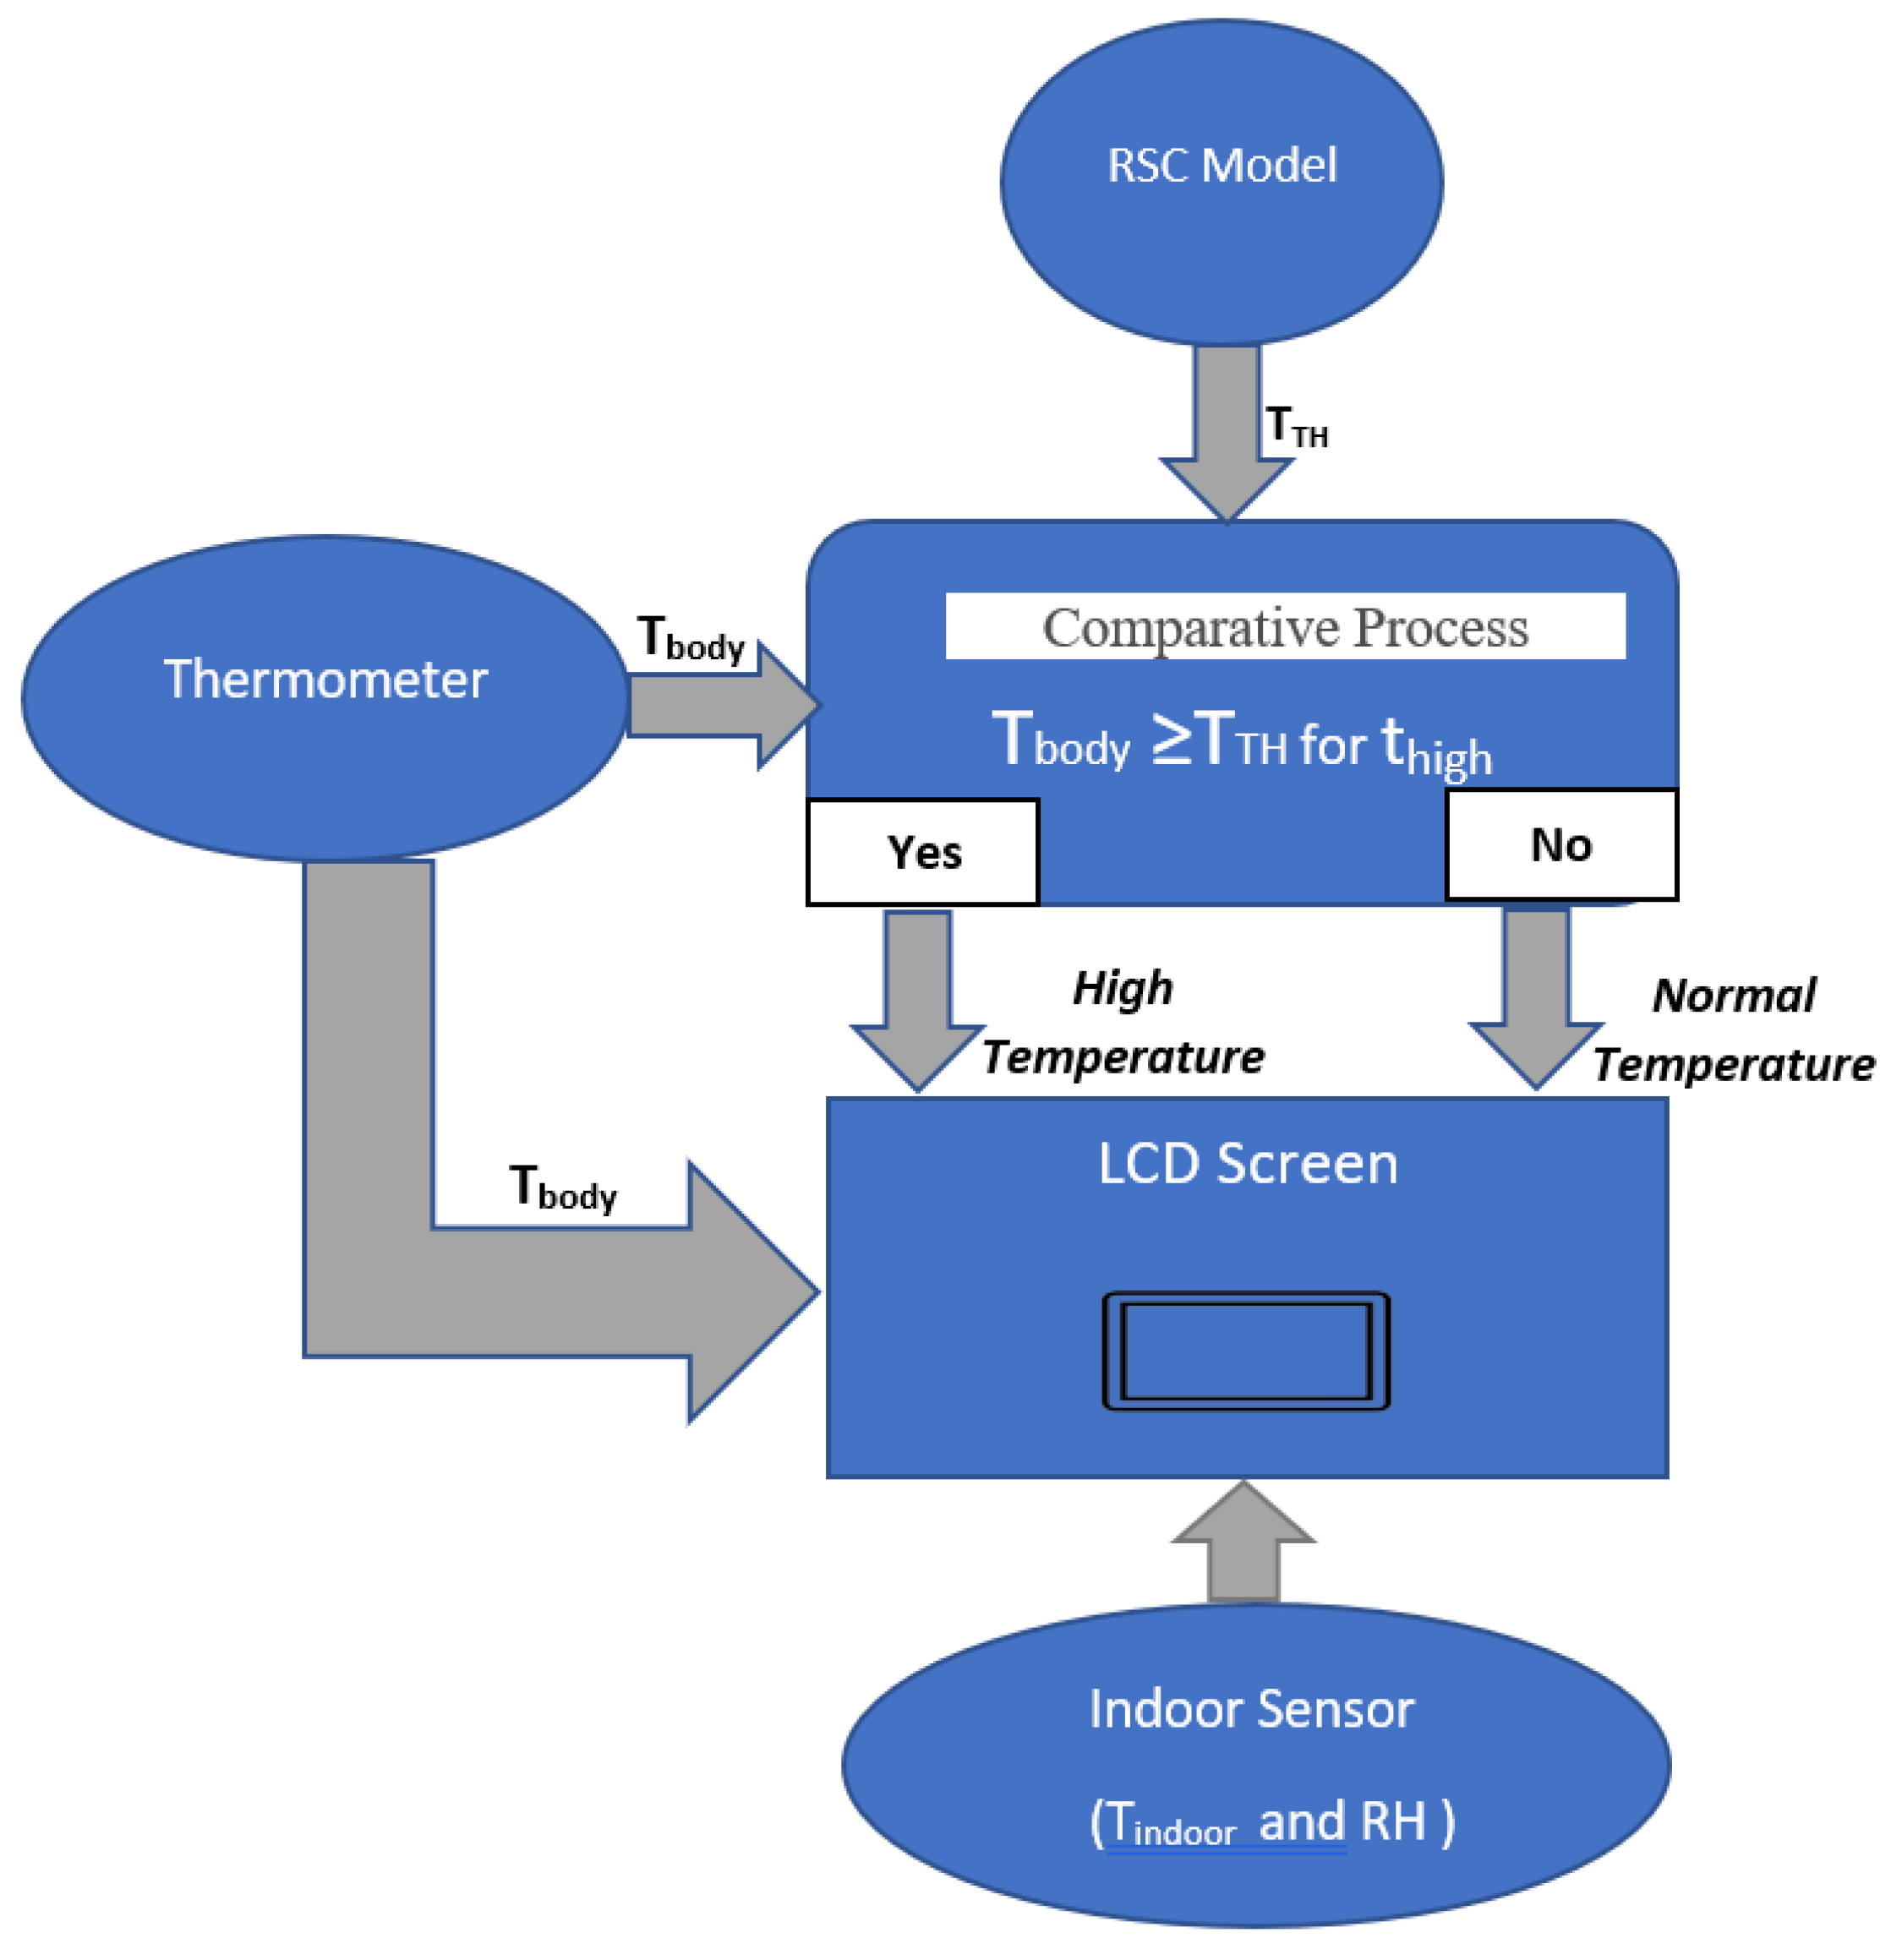
2.4. Output System
2.4.1. A liquid-Crystal Display (LCD)
- If Tbody < TTH → Normal condition
- If Tbody ≥ TTH → Warning message
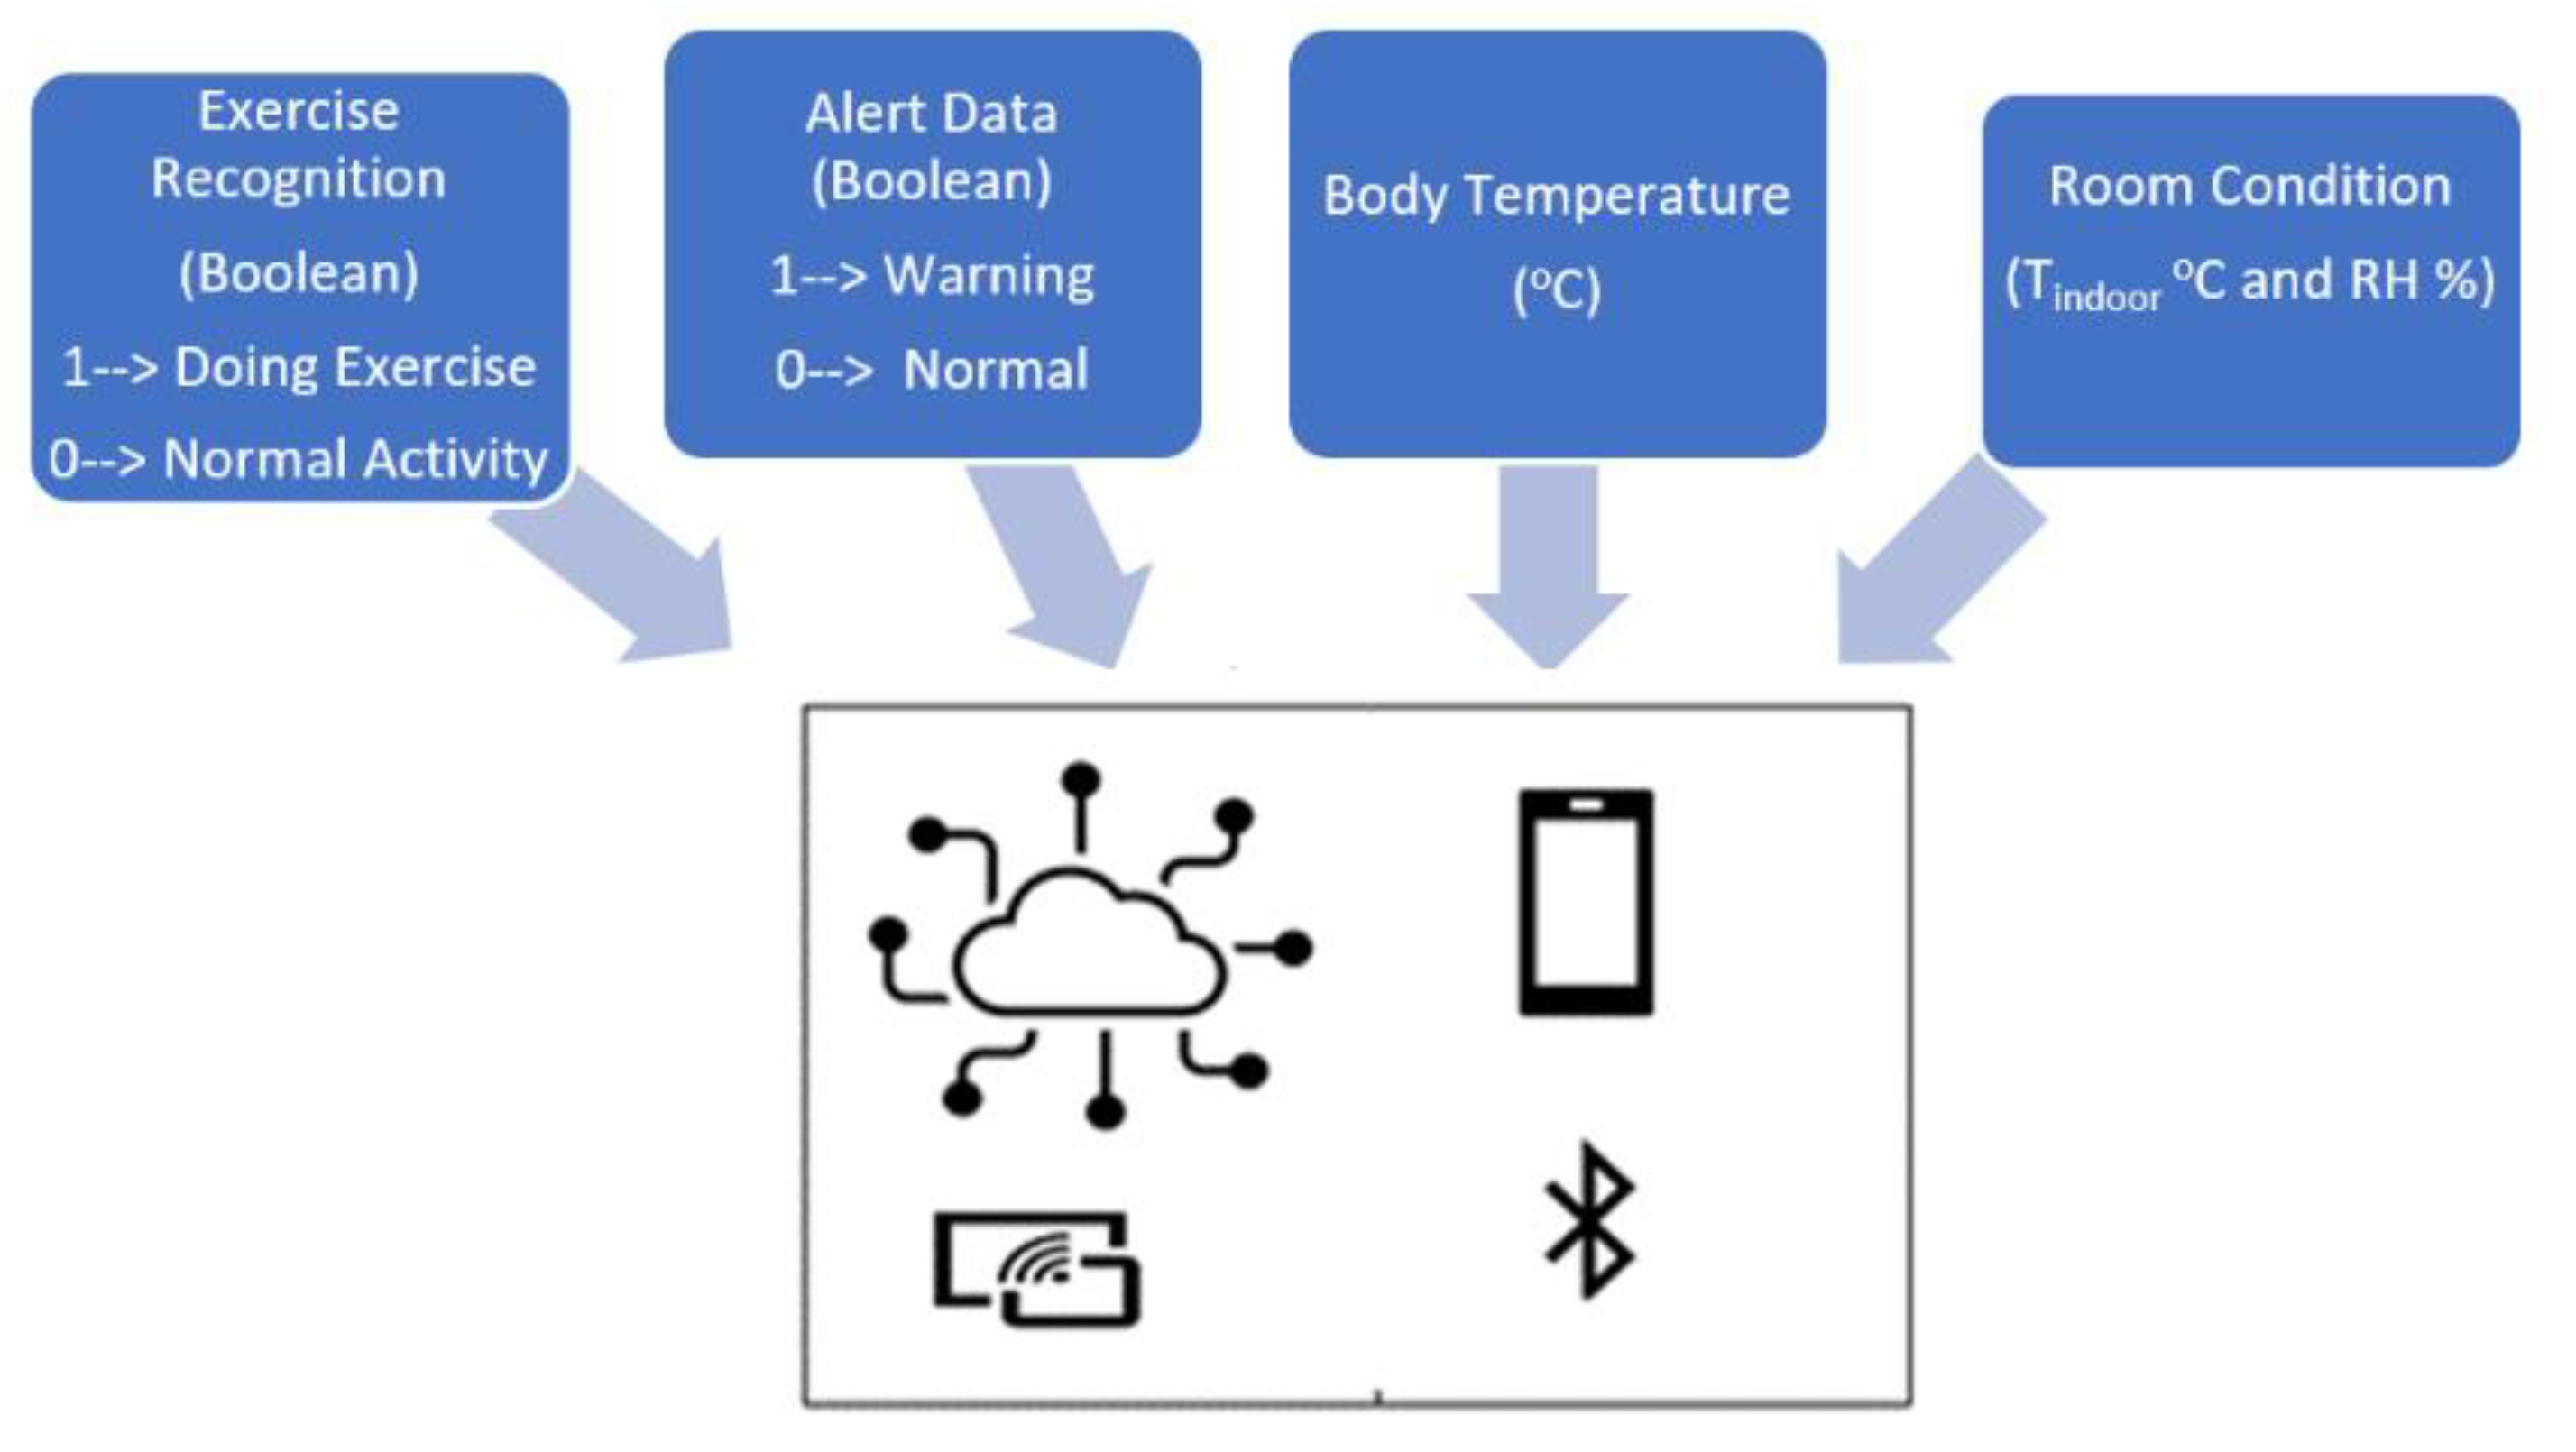
2.4.2. IoT Solution
- Alert message is demonstrated under Boolean: 1 means the warning. The red light will be shown on the display of the watching system. 0 indicates the typical condition of body thermal.
- Body temperature: Tbody (°C)
- Room Condition (Tindoor °C and RH %)
- Exercise Recognition (Boolean): 1—Doing Exercise; 0—Normal Activity. This info helps the observers to follow and understand the activity and body thermal clearly.
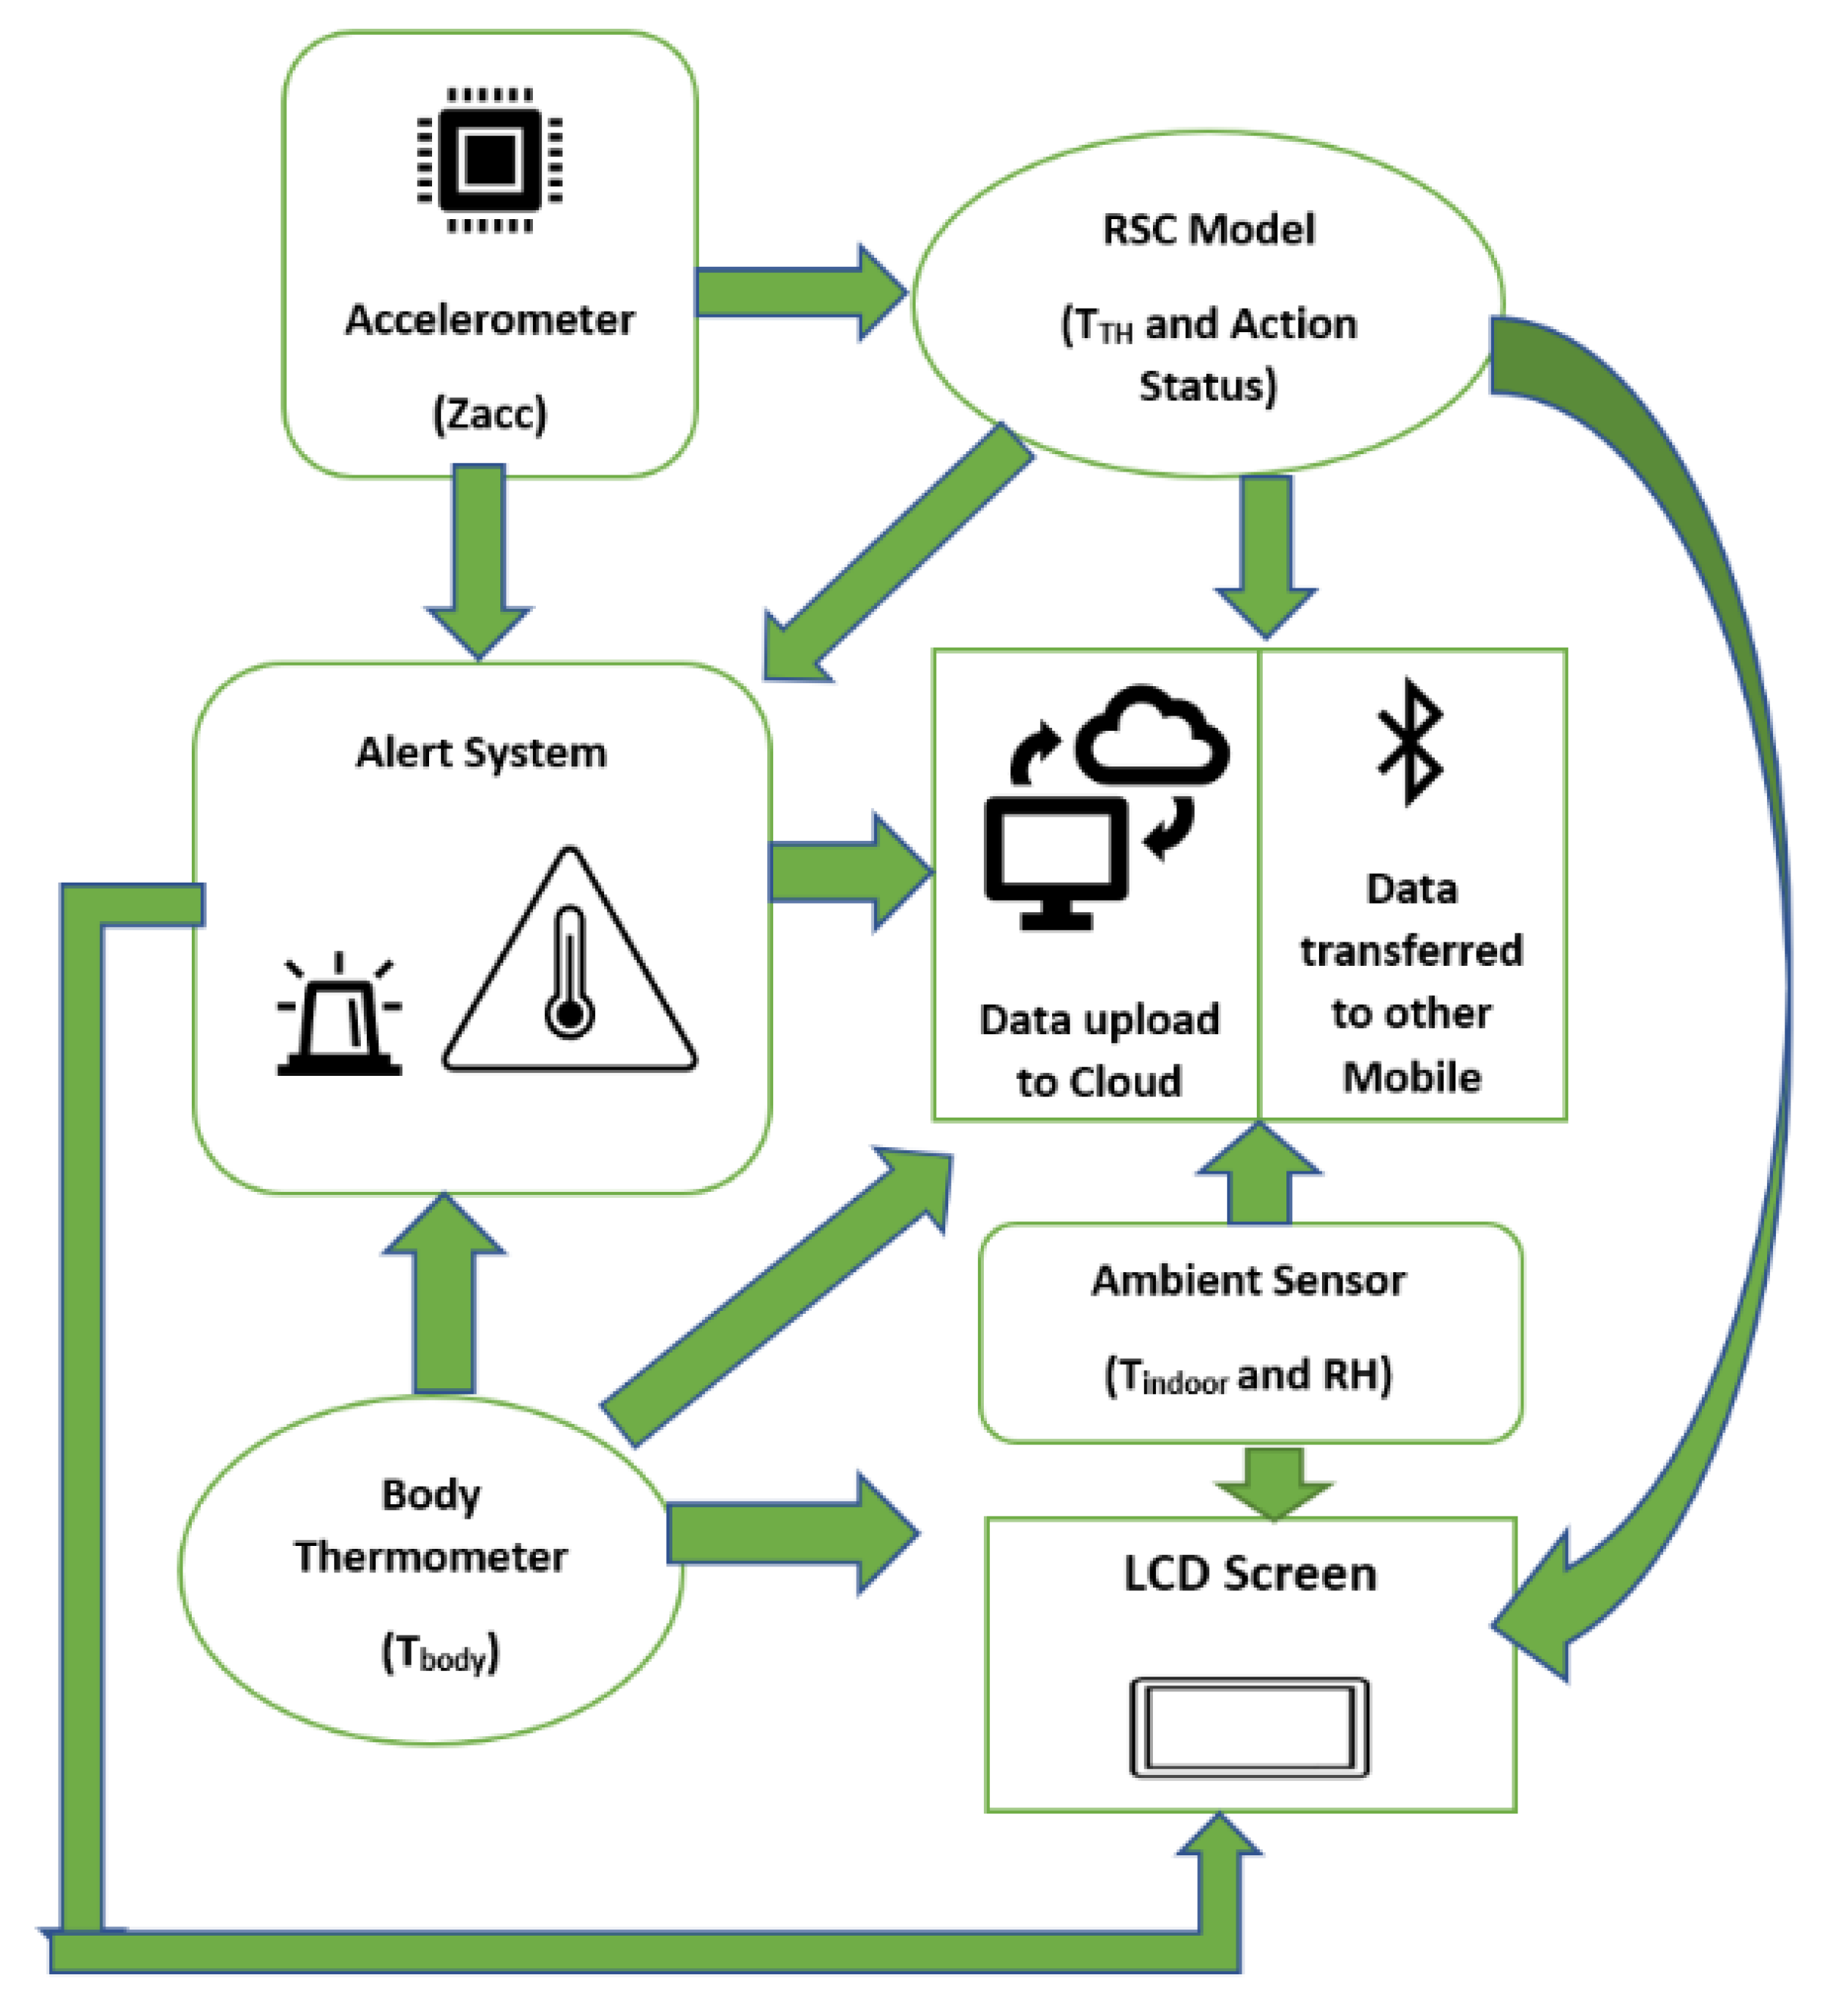
2.5. System Overview
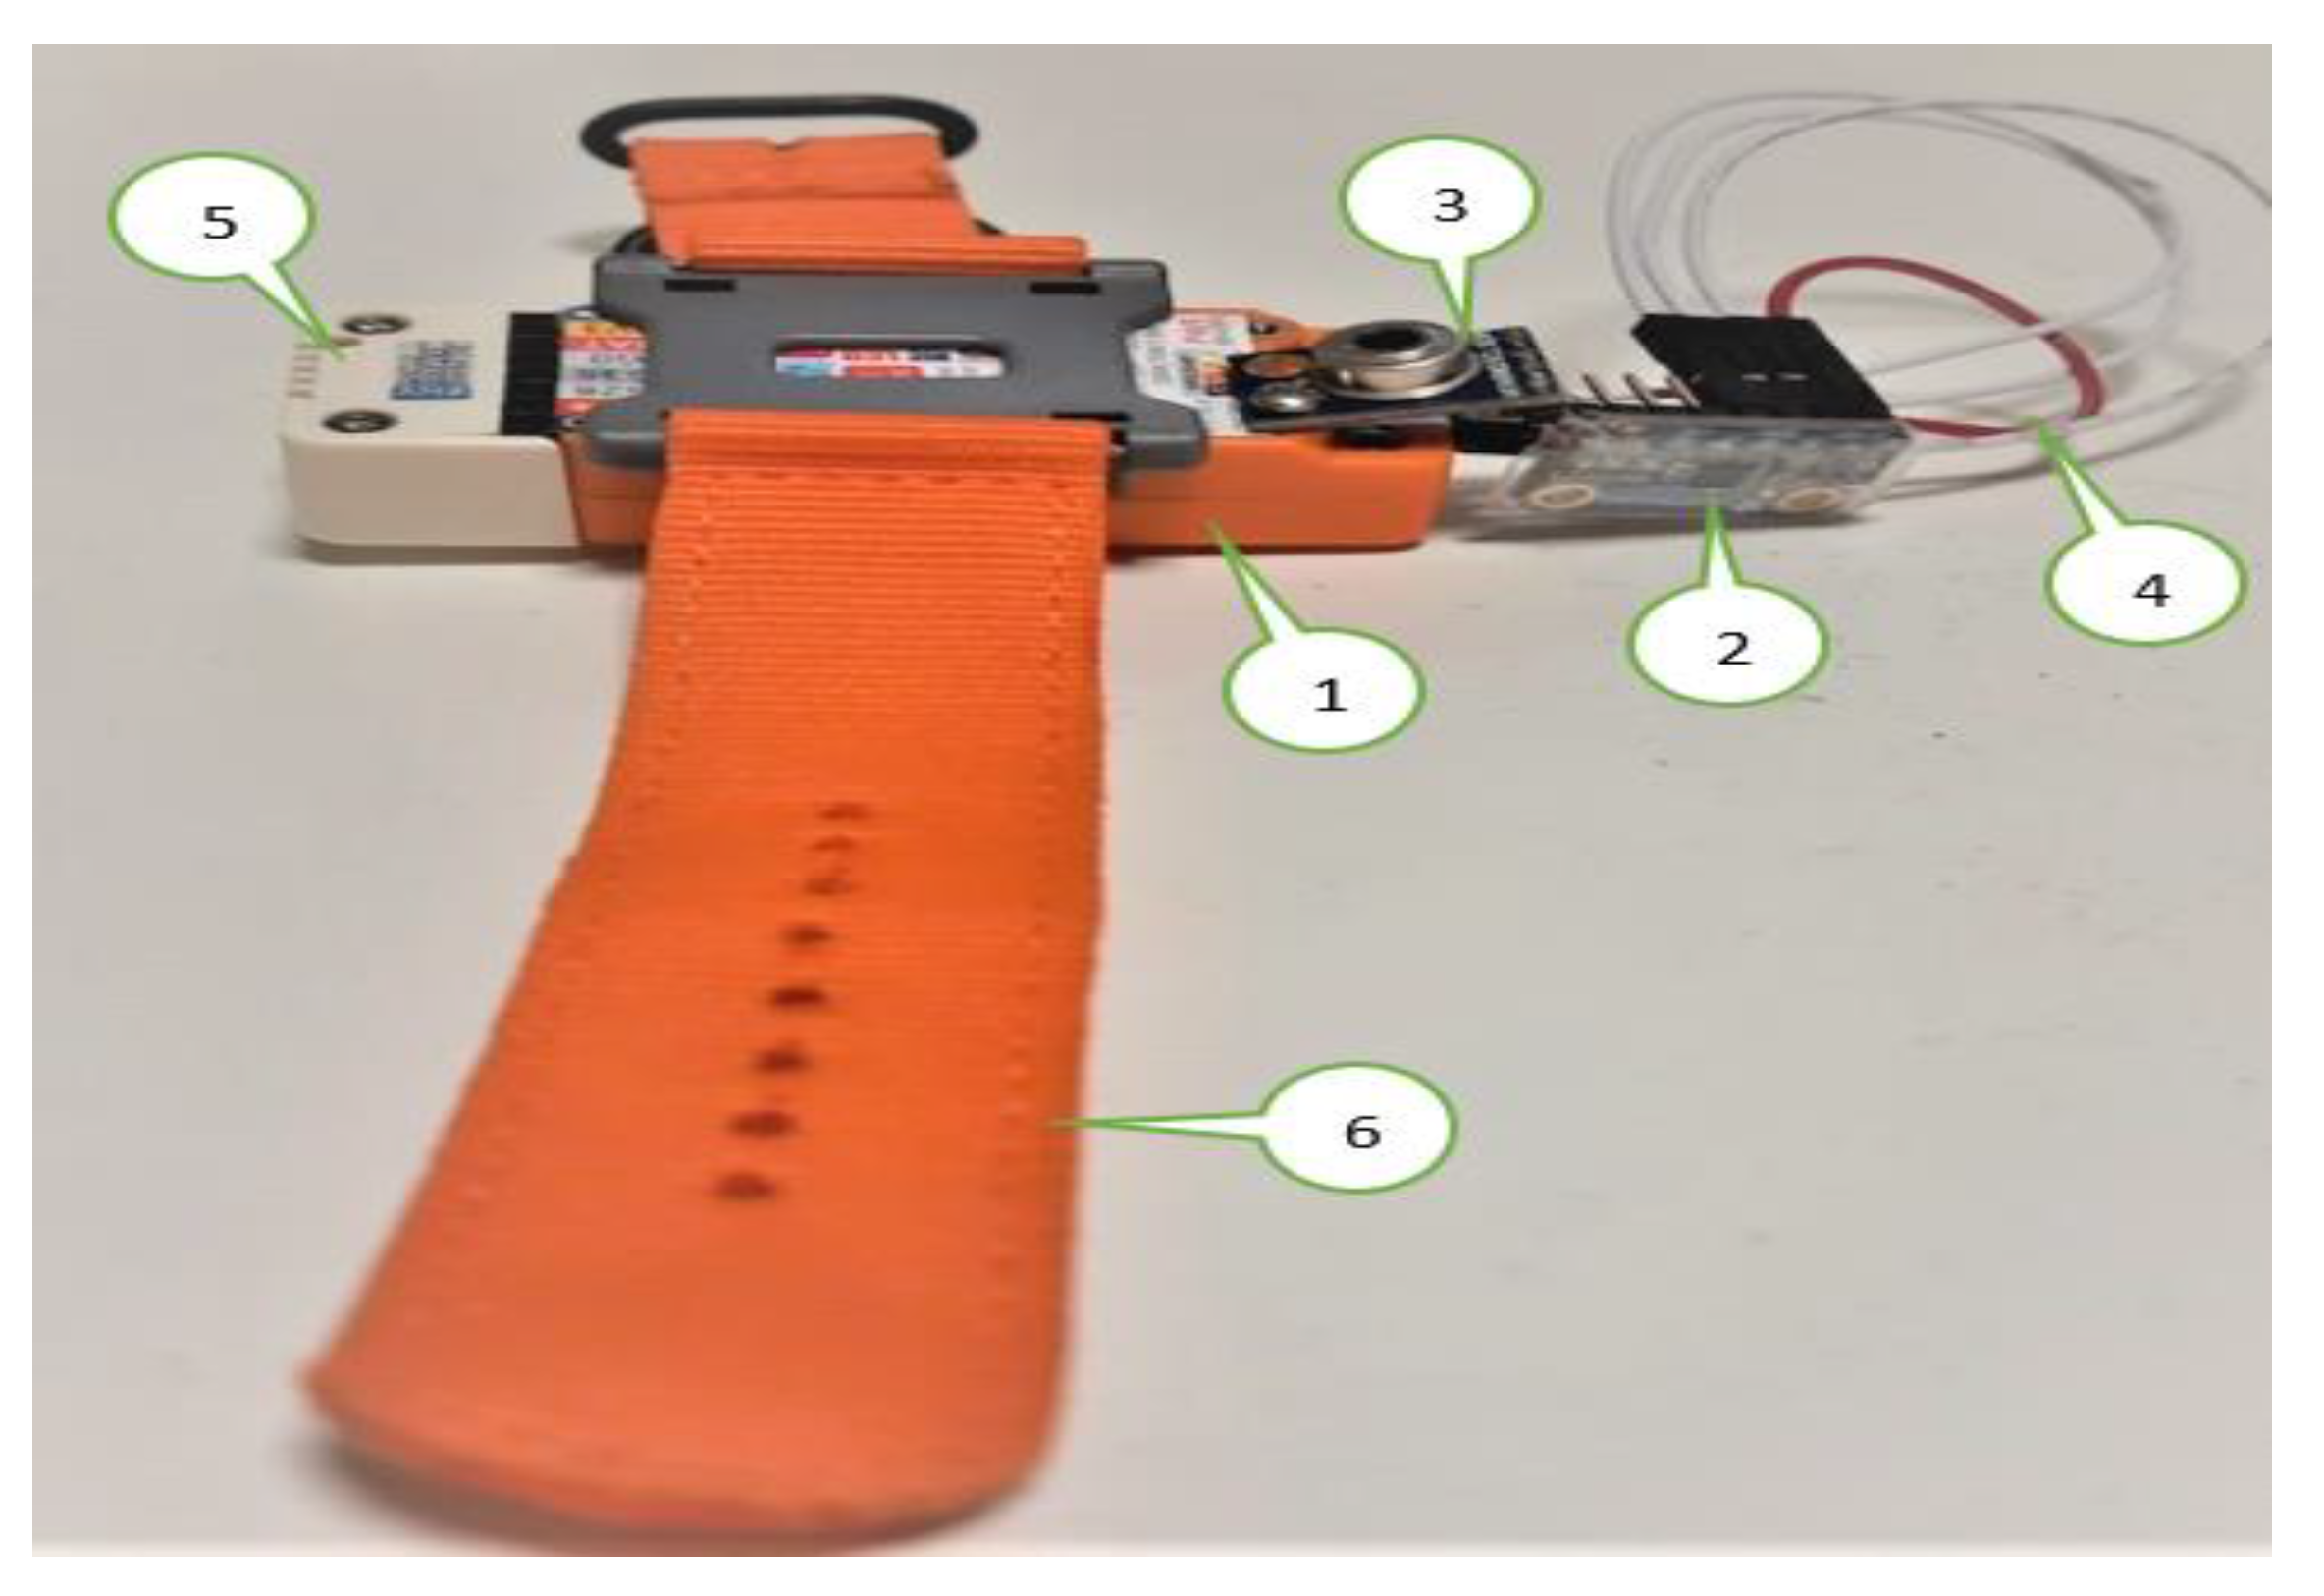
2.6. Experimental Setup
- The M5stickC is a development platform, which includes flash memory 4 MB and a Lipo-battery of 95 mA-3.7 V, which the IDE can program. This board contains the MEMS 3-axis accelerometer MPU6886. In this application, the acceleration range is ±2 g and the acquired frequency is 20 Hz after the low-pass filter.
- DHT12 [45] measures the ambient temperature and humidity sensor, connected to the Arduino Uno board via I2C (Inter-Integrated Circuit) as the serial communication protocol. DHT12 is embedded in the ENV HAT to be compatible with M5stickC.
- The thermal body sensor MLX90614 is connected to M5stickC via I2C serial communication.
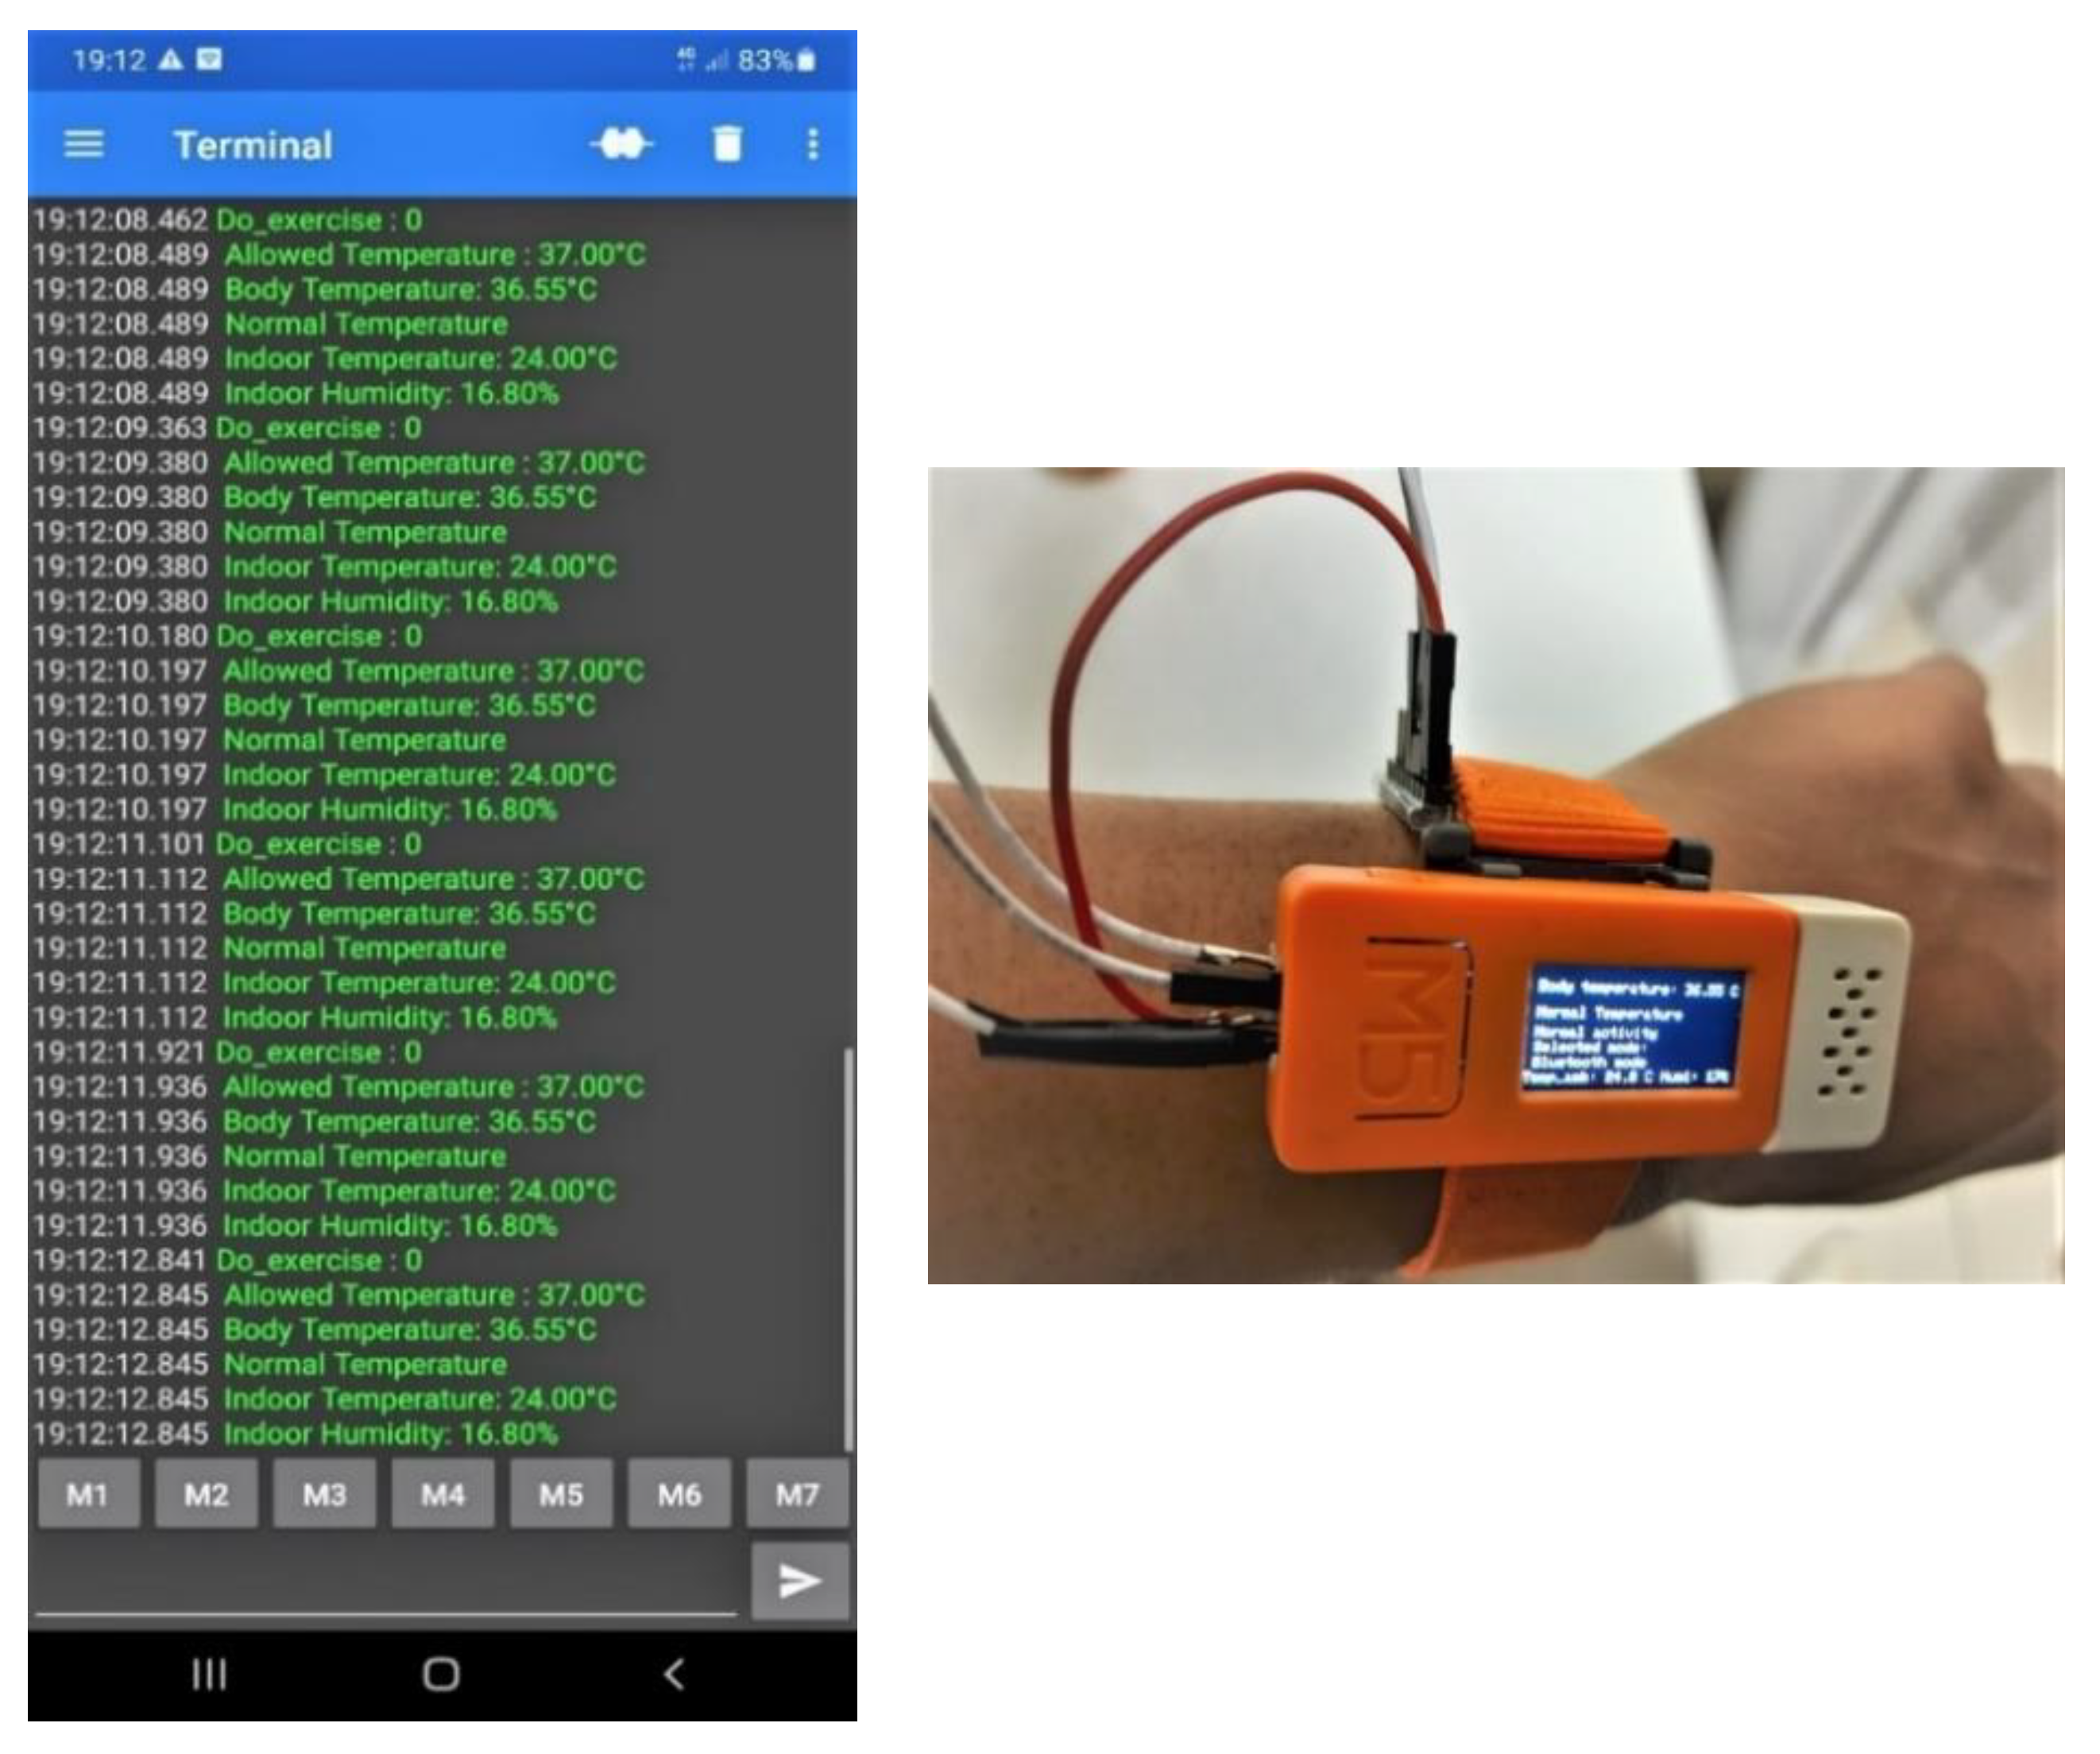
- The LCD screen displays the essential information: body temperature, thermal condition, and user activity.
- The data are sent to the cloud via MQTT broker [46]. This method is advantageous for saving battery, network band, and enhancing the real-time experience. In this work, the data are hosted by the Ubidots [47], which is an IoT data analytics and visualization company. The transferred data can be observed by anyone who is allowed by the user.
- Although the accuracy can increase after a long time of contact with the body, the measurement uncertainty of the contact thermometer is unavoidable. Therefore, once the Tbody exceeds TTH for 12 min continuously, the infrared thermometer should be activated to guarantee the data precision. If both sensors indicate the high temperature, the fever symptom is truly considerable in this situation.
3. Results
3.1. Result and Analysis
- Overview system interaction
- The 1st part examines all the transferred data to the cloud in detail of the last quarantine day.
- The 2nd part summarizes all the most important during the whole quarantined period. From these statistics, the temperature comportment, as well as the alert situation, are investigated.
3.2. Wireless System Interaction
- Data on the web server via Wi-Fi
- Data on the shared Smartphone via Serial Bluetooth Terminal
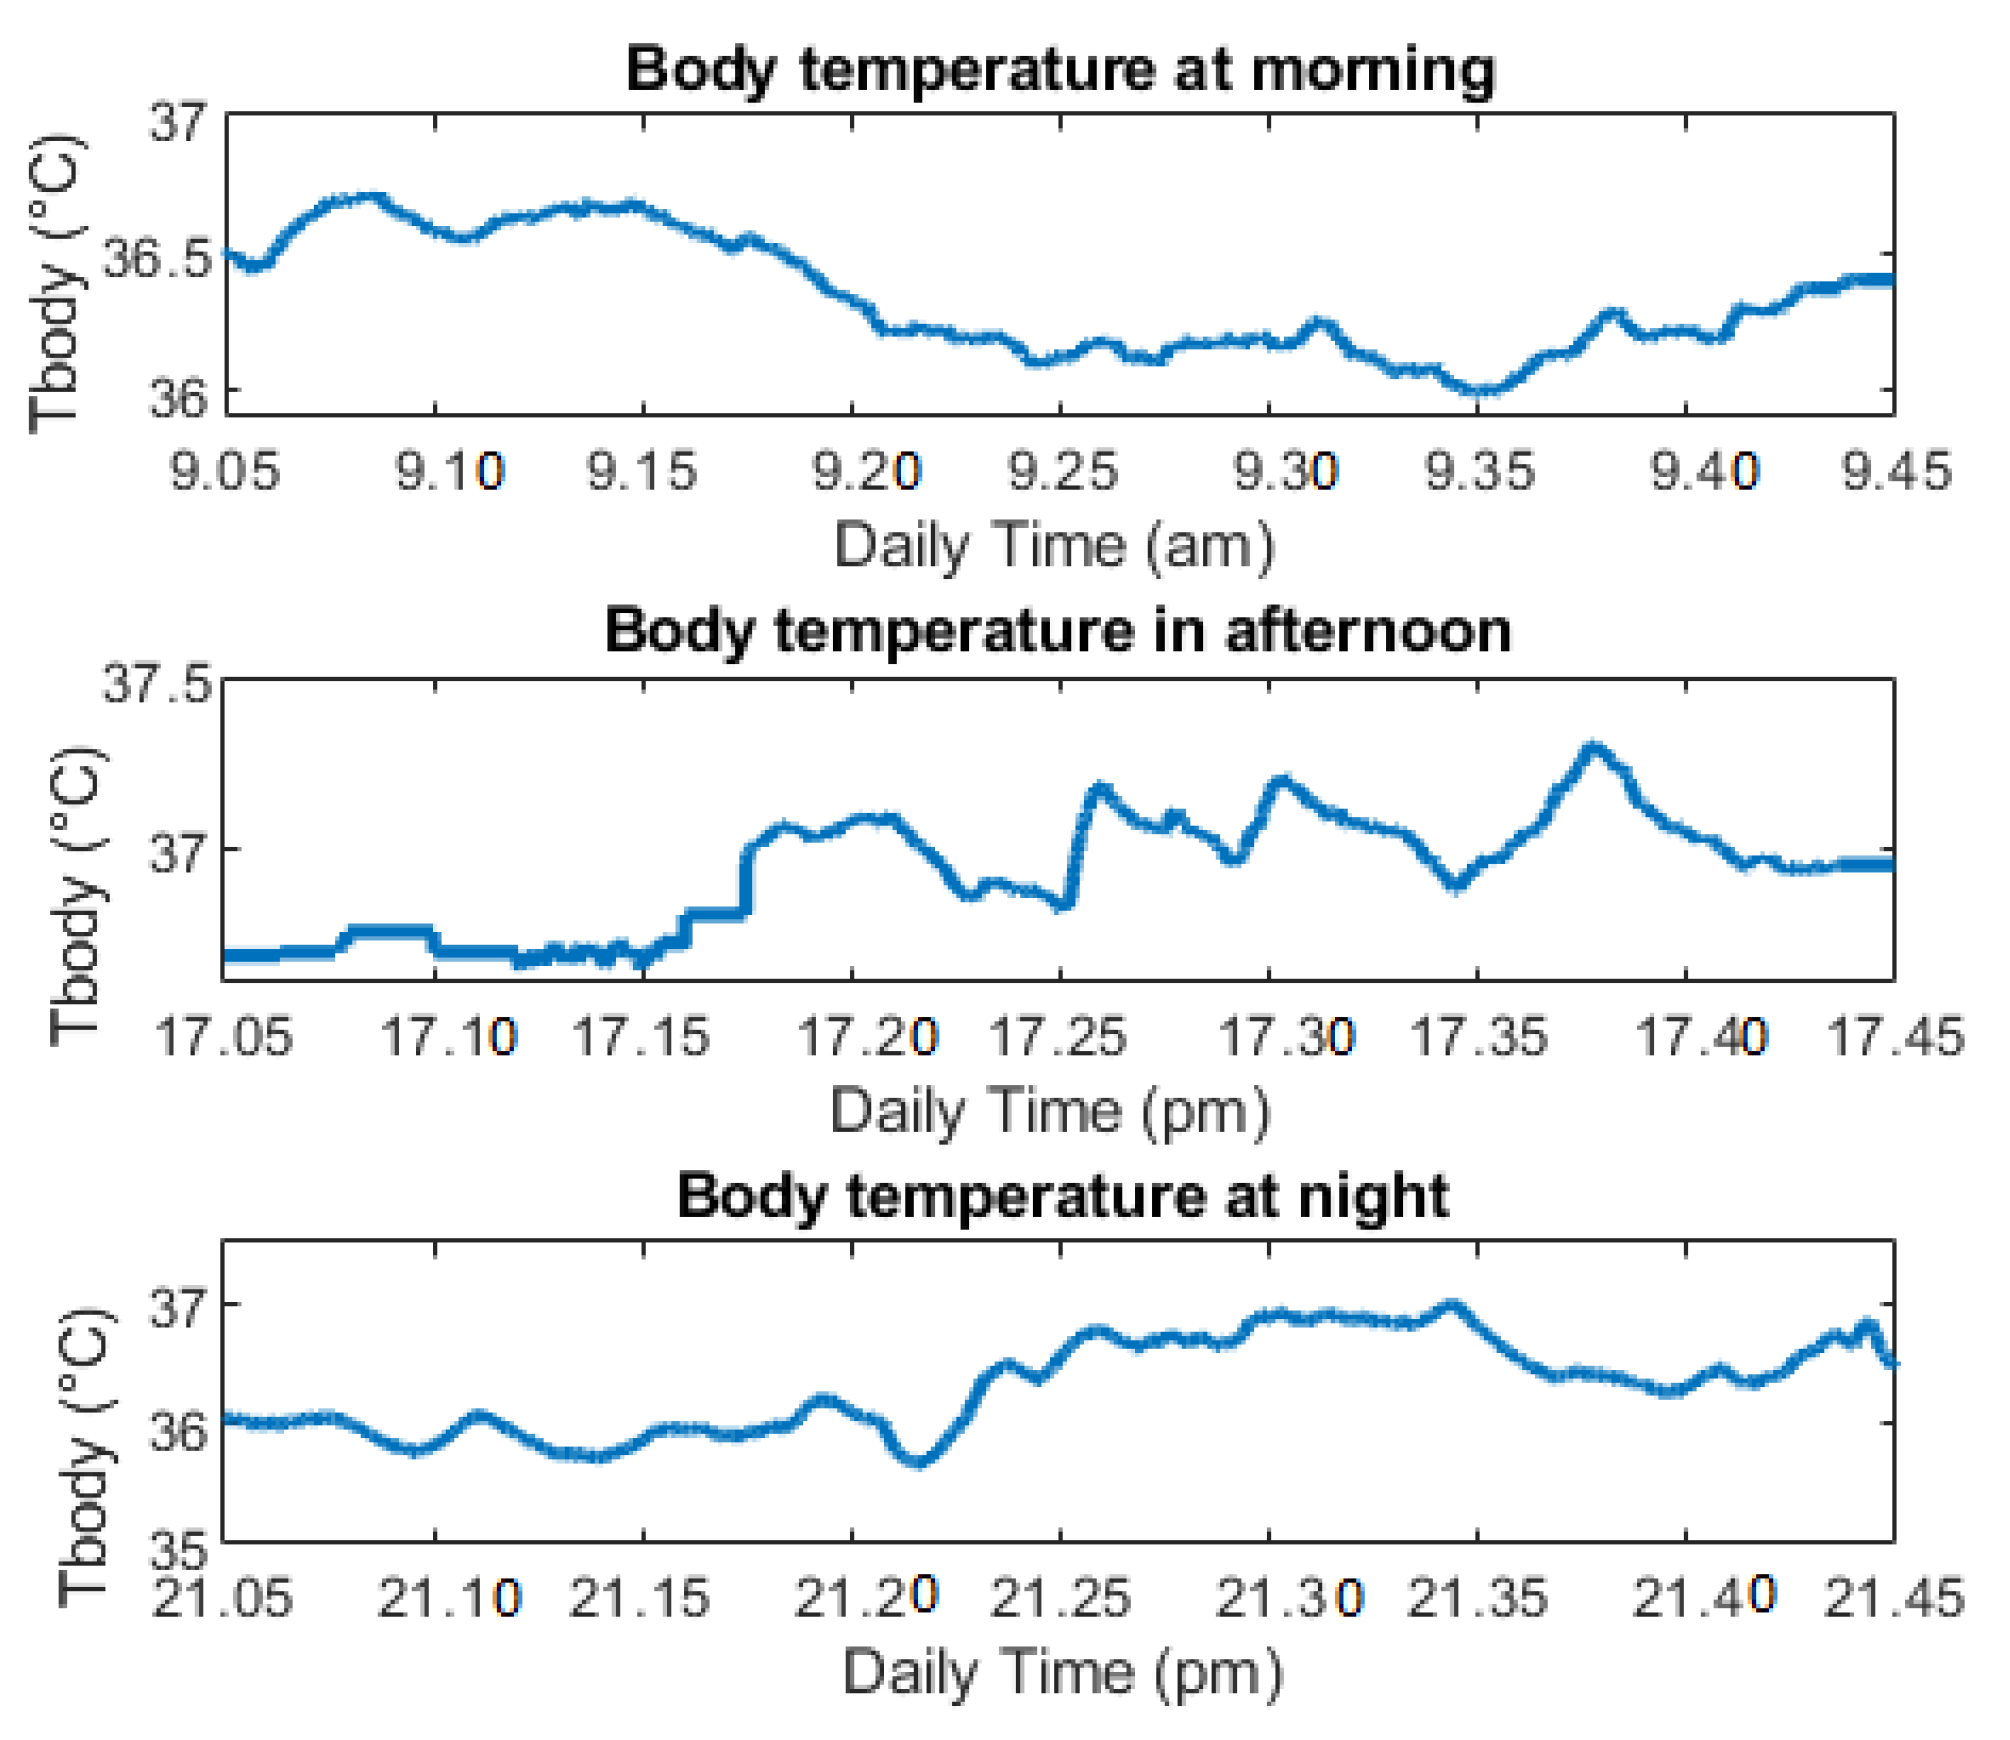
3.3. Data Analysis of Last Quarantine Day
- In the morning: from 9:00 a.m. to 9:45 a.m.
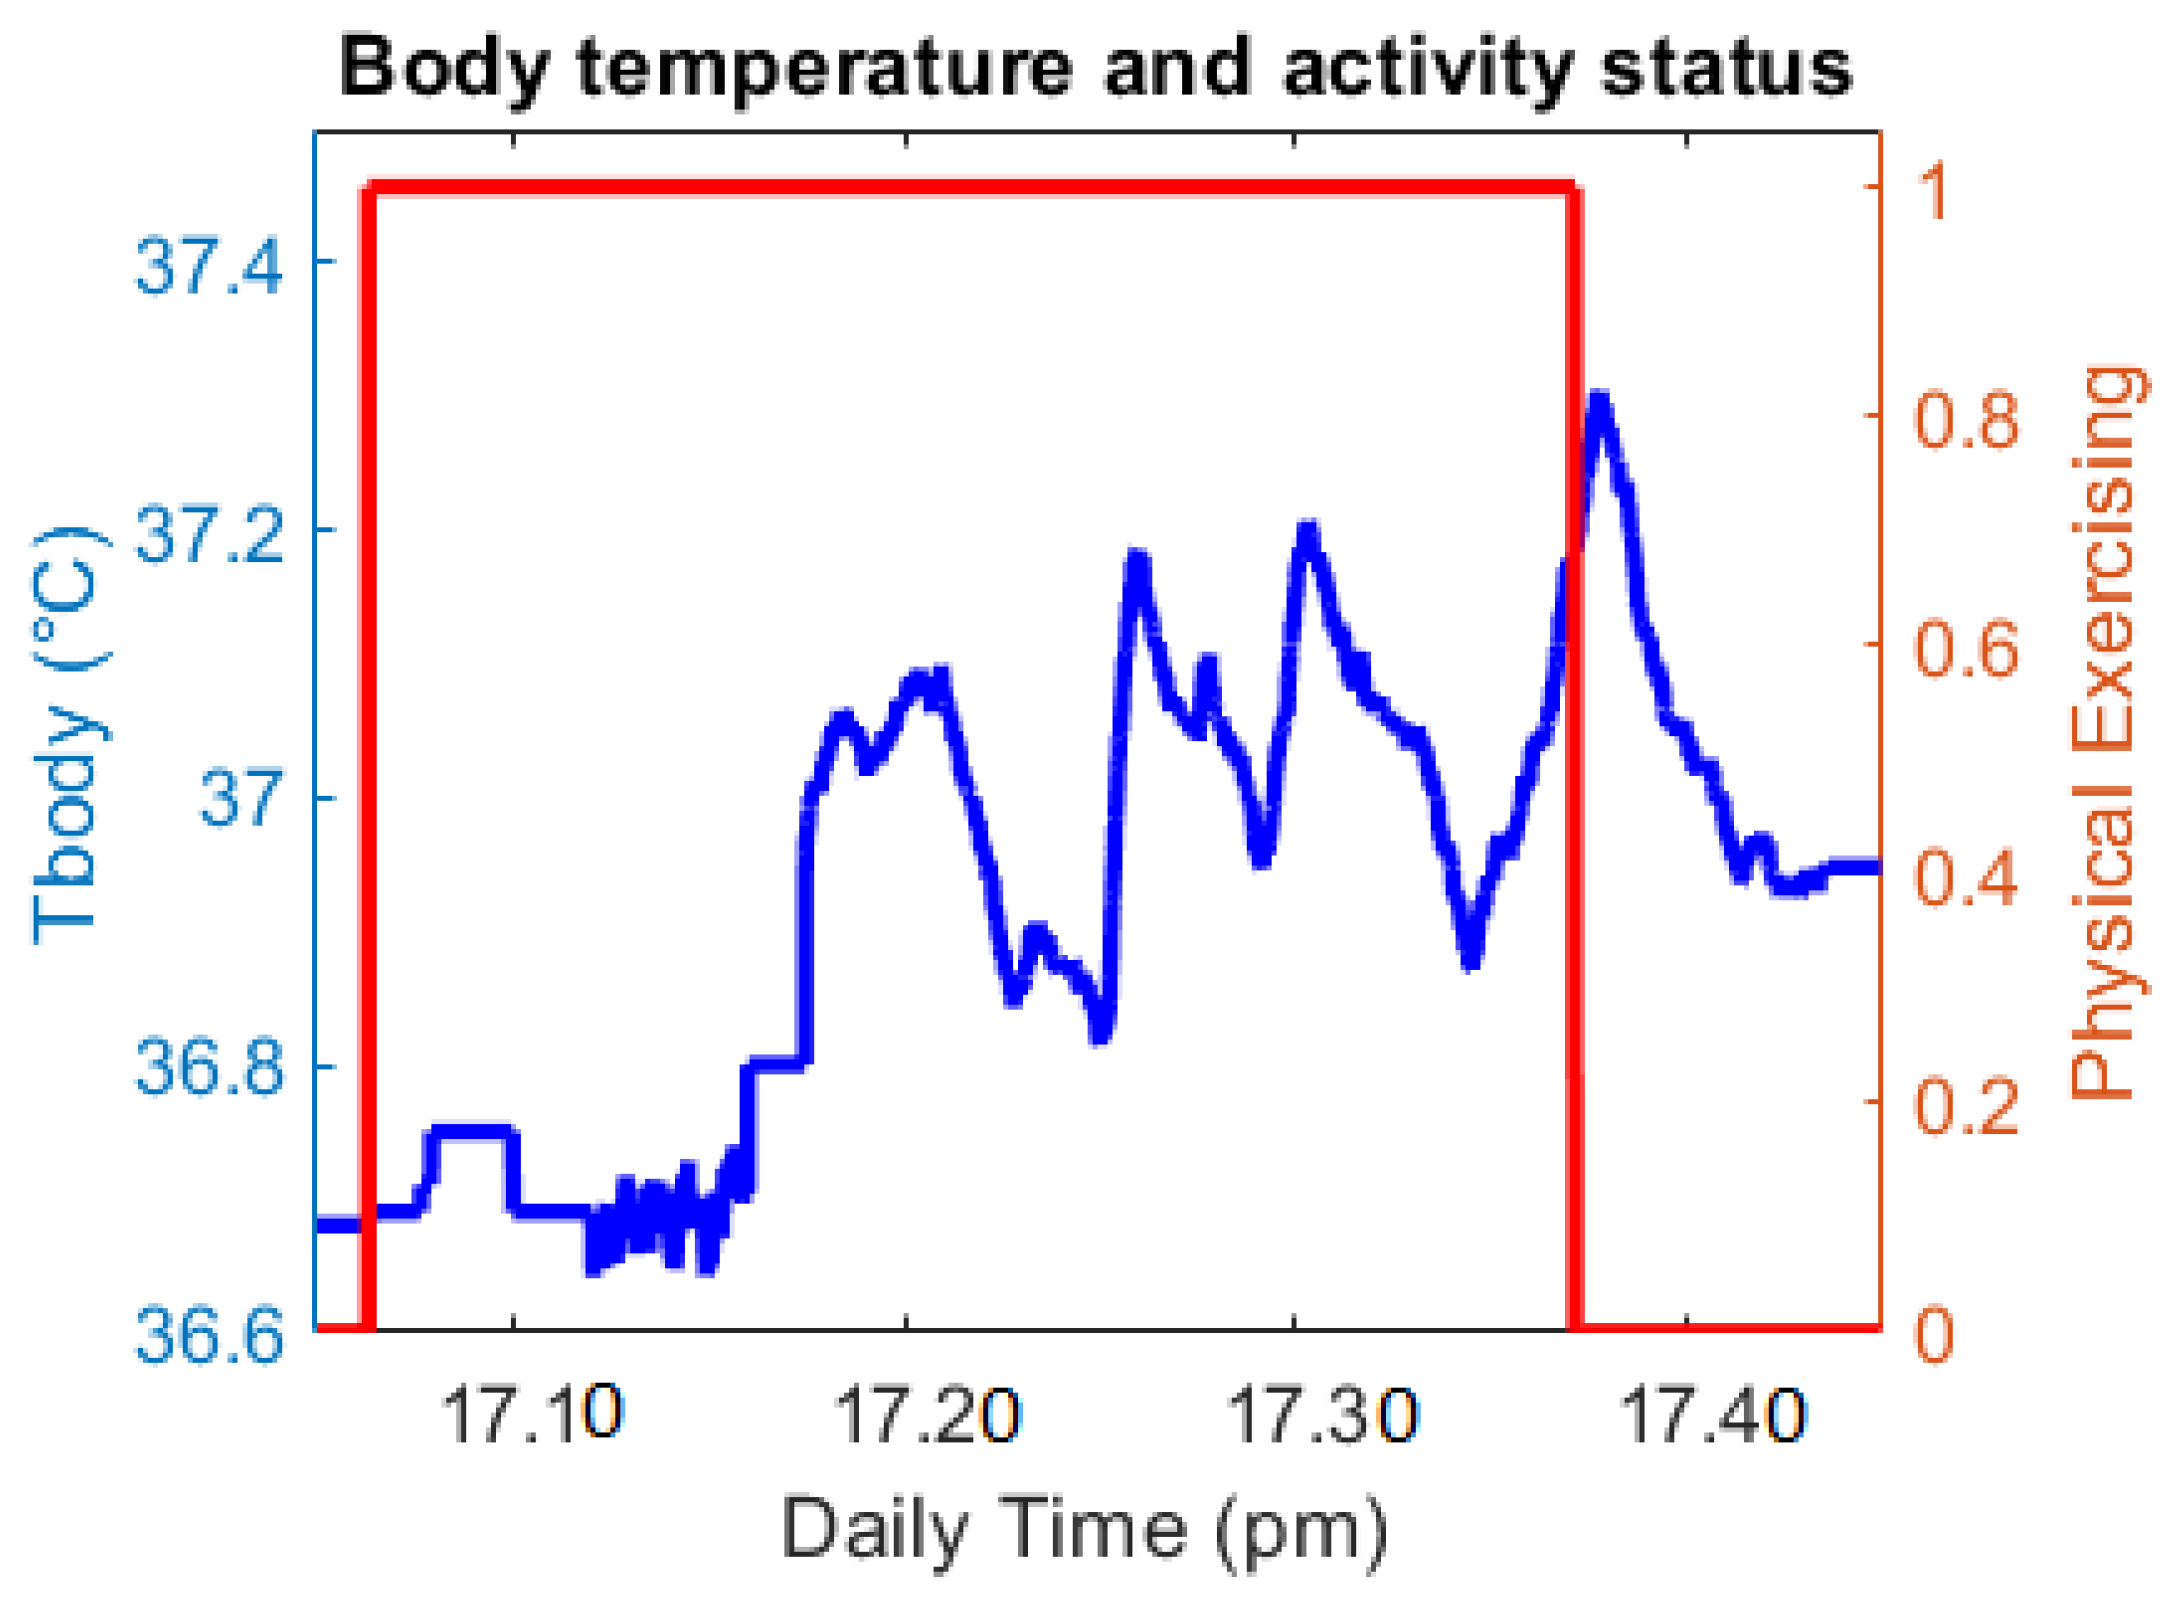
- In the afternoon, the user wears while doing physical exercise for approximately 35 min.
- At night, the user holds from 9:00 p.m.to 9:45 p.m.
- Exercise analysis:
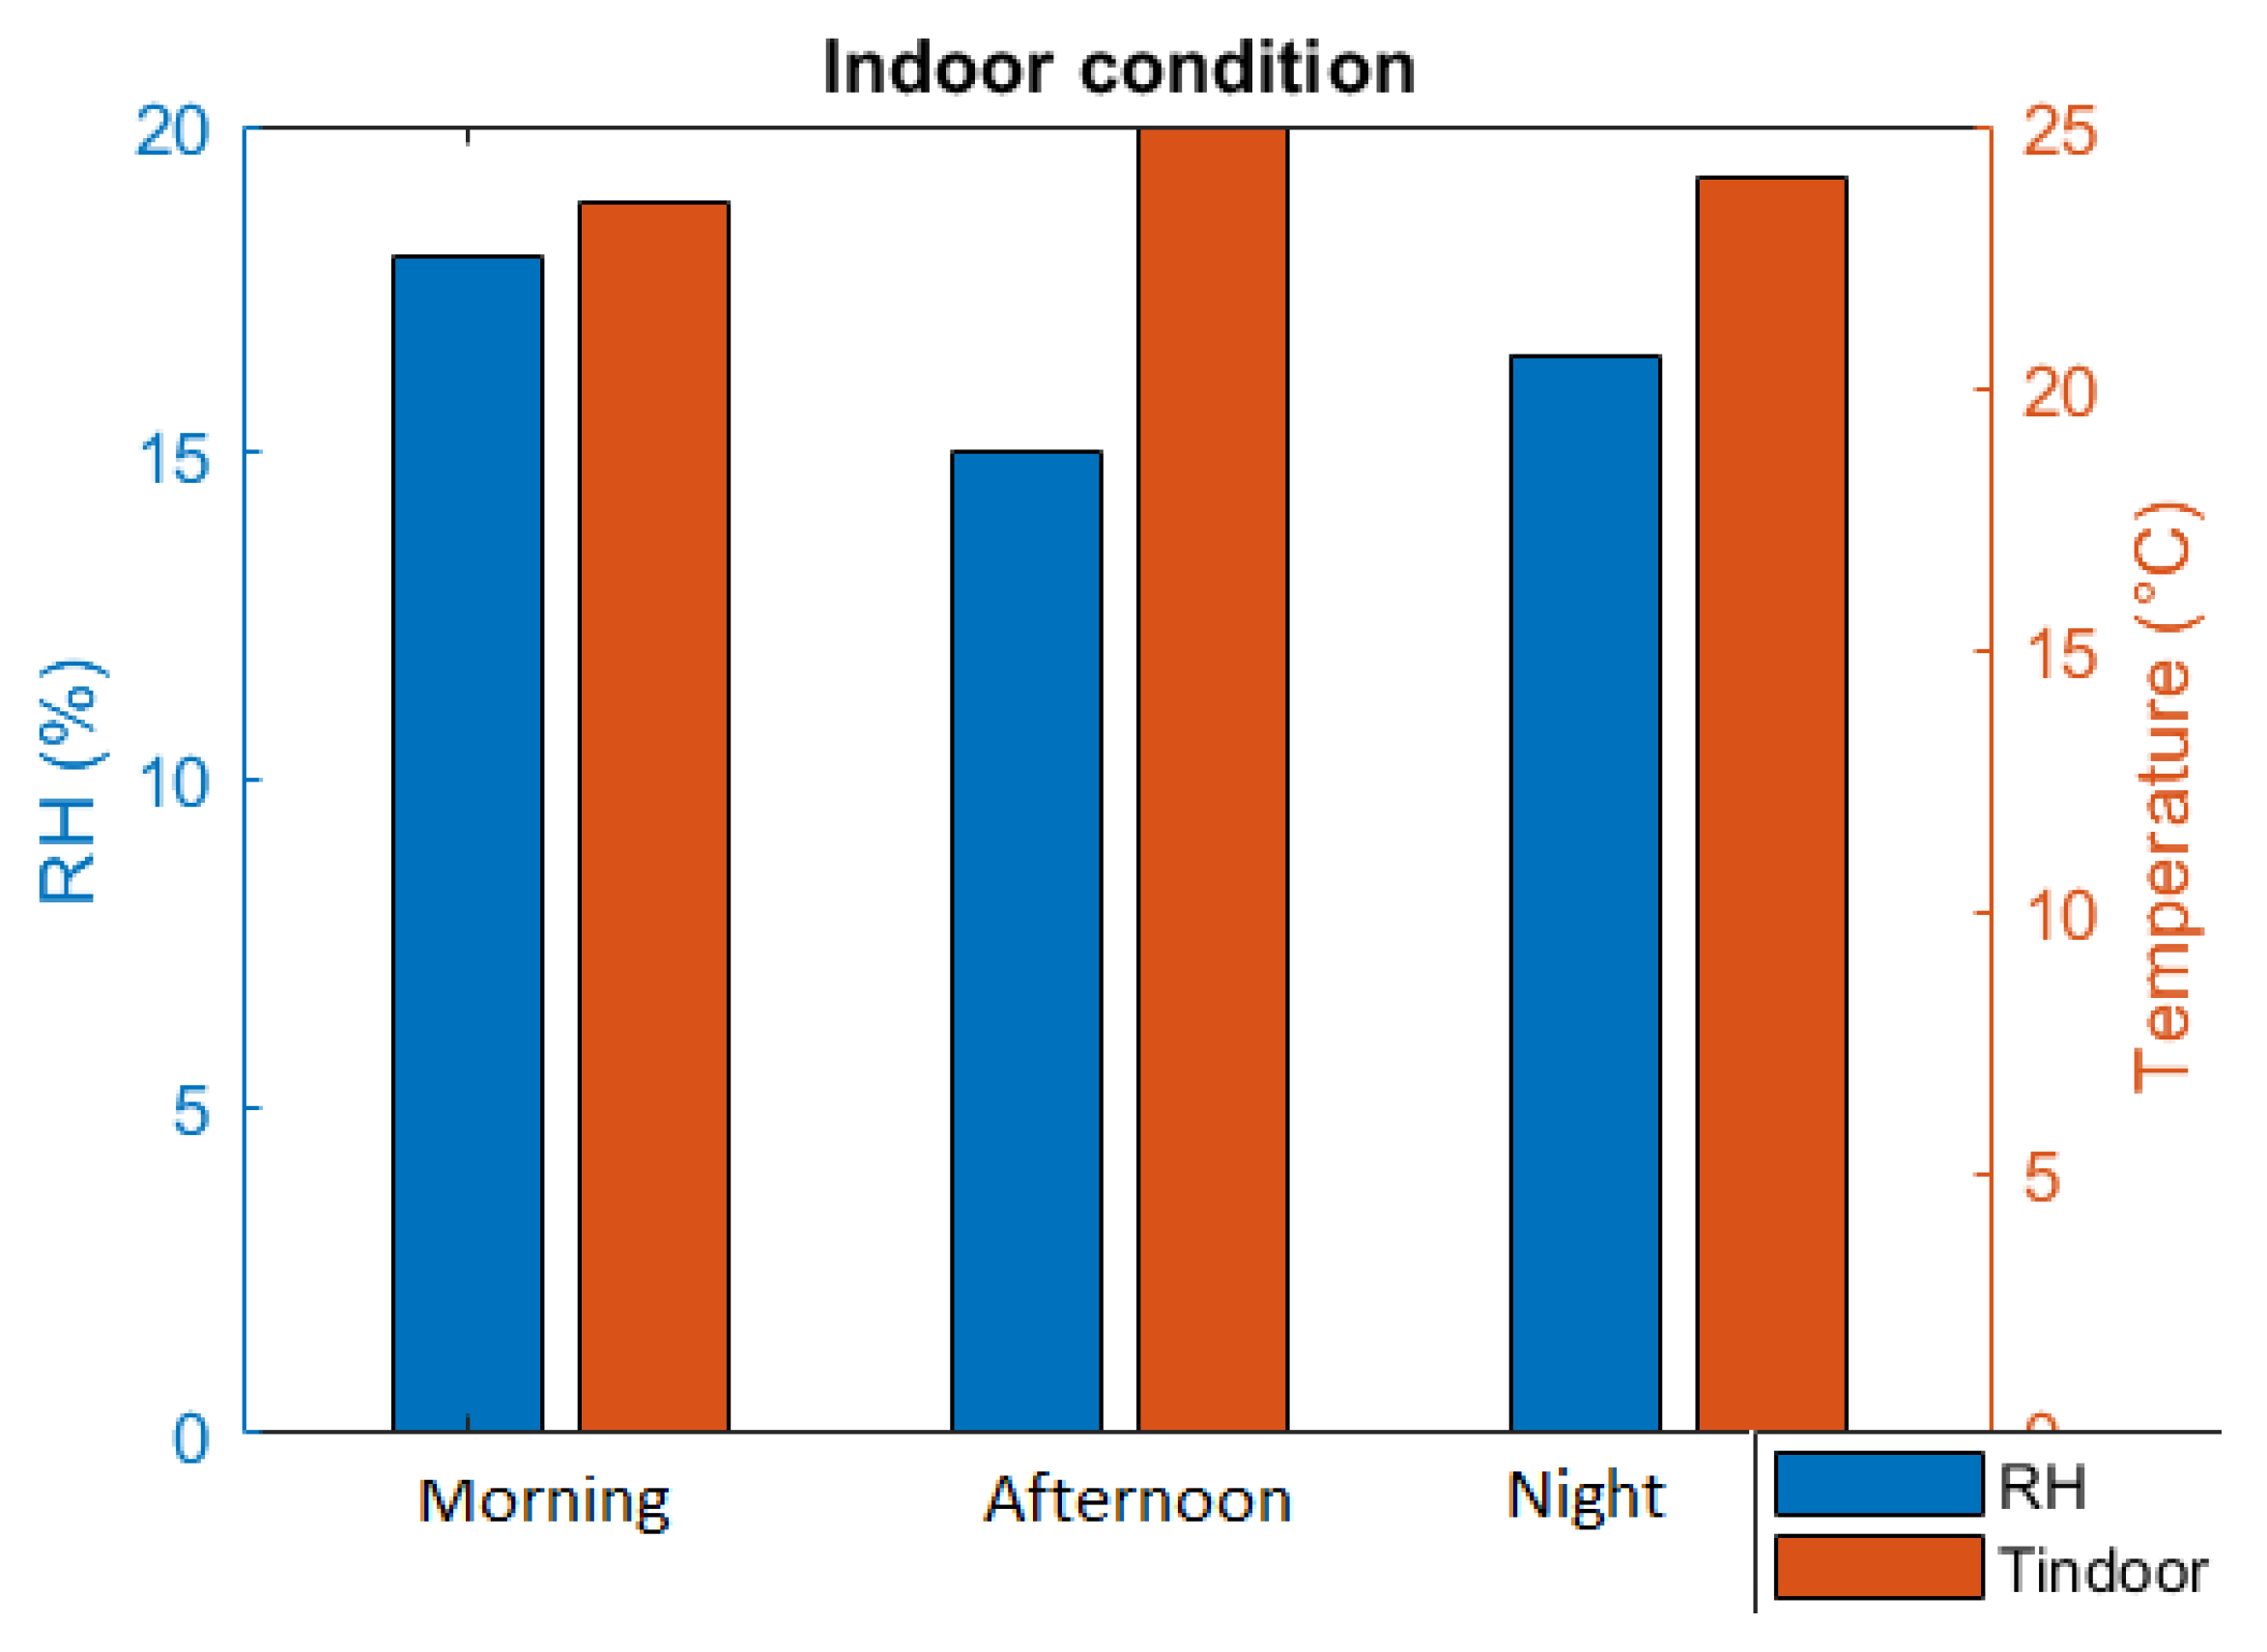
- Indoor condition
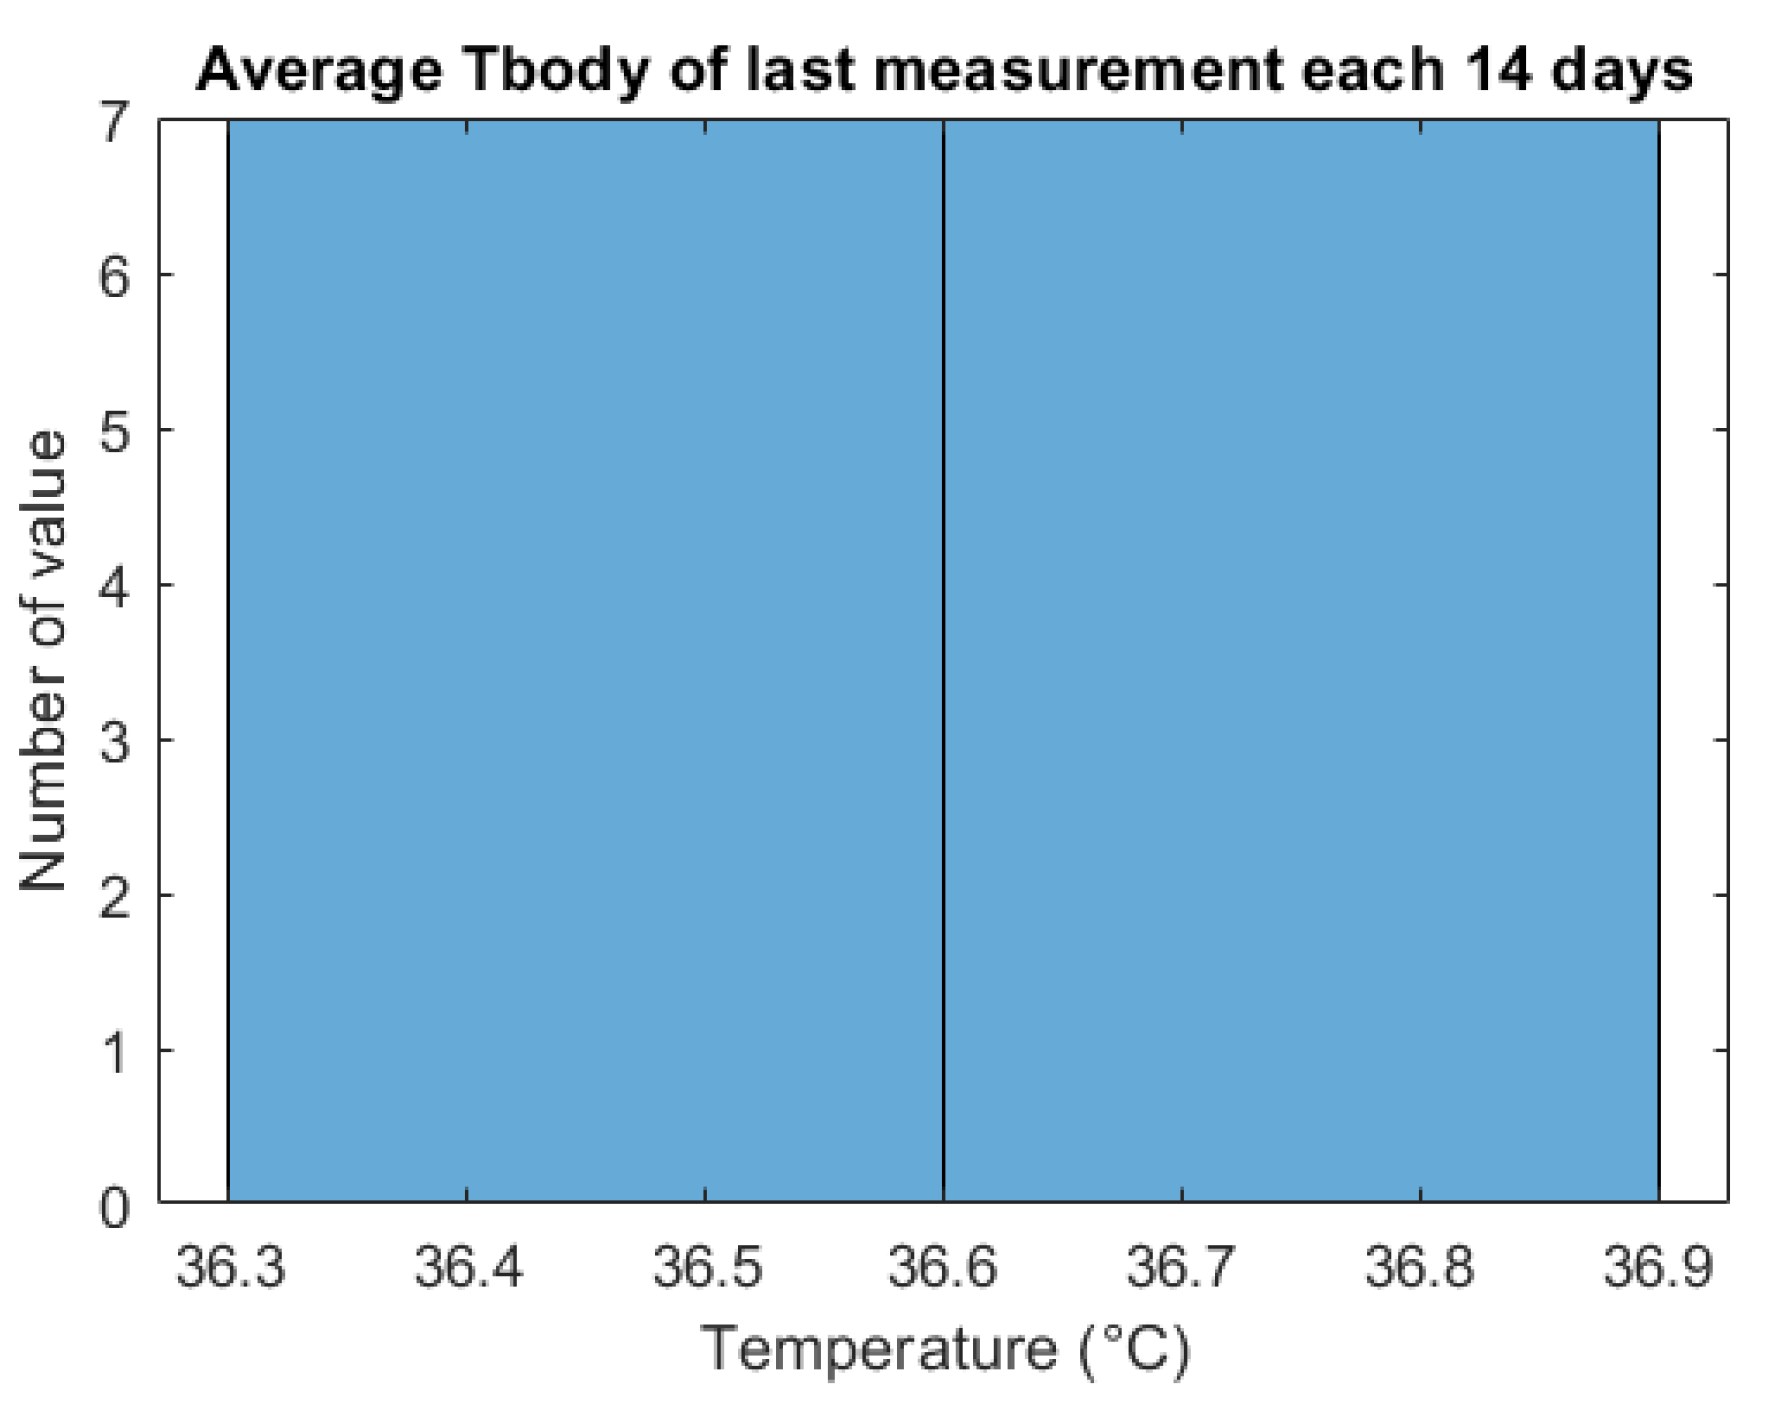
3.4. Data Overview of Quarantine Period
4. Conclusions
Author Contributions
Funding
Conflicts of Interest
References
- World Health Organization. Coronavirus Disease (COVID-19). Available online: https://www.who.int/emergencies/diseases/novel-coronavirus-2019 (accessed on 11 November 2020).
- Home Quarantine Instructions-Los Angeles County Department of Public Health. Available online: http://publichealth.lacounty.gov/acd/docs/COVHomeQuarantine.pdf (accessed on 11 November 2020).
- Symptoms of Coronavirus. Centers for Disease Control and Prevention. Available online: https://www.cdc.gov/coronavirus/2019-ncov/symptoms-testing/symptoms.html (accessed on 2 October 2020).
- Vedaei, S.S.; Fotovvat, A.; Mohebbian, M.R.; Rahman, G.M.E.; Wahid, K.A.; Babyn, P.; Marateb, H.R.; Mansourian, M.; Sami, R. COVID-SAFE: An IoT-Based System for Automated Health Monitoring and Surveillance in Post-Pandemic Life. IEEE Access 2020, 8, 188538–188551. [Google Scholar] [CrossRef]
- Smarr, B.L.; Aschbacher, K.; Fisher, S.M.; Chowdhary, A.; Dilchert, S.; Puldon, K.; Rao, A.; Hecht, F.M.; Mason, A.E. Feasibility of continuous fever monitoring using wearable devices. Sci. Rep. 2020, 10, 21640. [Google Scholar] [CrossRef] [PubMed]
- Nachiar, C.C.; Ambika, N.; Moulika, R.; Poovendran, R. Design of Cost-Effective Wearable Sensors with Integrated Health Monitoring System. In Proceedings of the 2020 Fourth International Conference on I-SMAC (IoT in Social, Mobile, Analytics and Cloud) (I-SMAC), Palladam, India, 7–9 October 2020. [Google Scholar] [CrossRef]
- World Health Organization (WHO). Available online: https://www.euro.who.int/en/health-topics/health-emergencies/coronavirus-covid-19/publications-and-technical-guidance/noncommunicable-diseases/stay-physically-active-during-self-quarantine (accessed on 5 November 2020).
- Gleeson, M. Temperature Regulation during Exercise. Int. J. Sports Med. 1998, 19, S96–S99. [Google Scholar] [CrossRef] [PubMed]
- Jobanputra, C.; Bavishi, J.; Doshi, N. Human Activity Recognition: A Survey. Procedia Comput. Sci. 2019, 155, 698–703. [Google Scholar] [CrossRef]
- Subasi, A.; Khateeb, K.; Brahimi, T.; Sarirete, A. Chapter 5-Human activity recognition using machine learning methods in a smart healthcare environment. In Next Gen Tech Driven Personalized Med&Smart Healthcare, Innovation in Health Informatics; Academic Press: Cambridge, MA, USA, 2020; pp. 123–144. [Google Scholar]
- Thapa, K.; Al, Z.M.A.; Lamichhane, B.; Yang, S.-H. A Deep Machine Learning Method for Concurrent and Interleaved Human Activity Recognition. Sensors 2020, 20, 5770. [Google Scholar] [CrossRef] [PubMed]
- Yasin, H.; Hussain, M.; Weber, A. Keys for Action: An Efficient Keyframe-Based Approach for 3D Action Recognition Using a Deep Neural Network. Sensors 2020, 20, 2226. [Google Scholar] [CrossRef] [PubMed]
- Long, H.M.; Pietrosanto, A. A Robust Orientation System for Inclinometer with Full-Redundancy in Heavy Industry. IEEE Sens. J. 2020. [Google Scholar] [CrossRef]
- Long, H.M.; Iacono, S.D.; Paciello, V.; Pietrosanto, A. Measurement Optimization for Orientation Tracking Based on No Motion No Integration Technique. IEEE Trans. Instrum. Meas. 2021, 70, 1–10. [Google Scholar] [CrossRef]
- Long, H.M.; Carratu, M.; Ugwiri, M.A.; Paciello, V.; Pietrosanto, A. A New Technique for Optimization of Linear Displacement Measurement Based on MEMS Accelerometer. In Proceedings of the 2020 International Semiconductor Conference (CAS), Sinaia, Romania, 7–9 October 2020. [Google Scholar] [CrossRef]
- The Corona Virus. Medicare Health. Available online: https://medicarehealth.co.za/the-corona-virus/ (accessed on 2 December 2020).
- So, What’s the Ideal Body Temperature during Exercise? 37.5® Technology, 18 August 2017. Available online: https://www.thirtysevenfive.com/uncategorized/blog/so-whats-the-ideal-body-temperature-during-exercise/ (accessed on 15 November 2020).
- Quraishi, S.A.; Berra, L.; Nozari, A. Indoor temperature and relative humidity in hospitals: Workplace considerations during the novel coronavirus pandemic. Occup. Environ. Med. 2020, 77, 508. [Google Scholar] [CrossRef] [PubMed]
- Fairfax, R.E. OSHA Policy on Indoor Air Quality: Office Temperature/Humidity and Environmental Tobacco Smoke; Occupational Safety and Health Administration: Washington, DC, USA, 2003; Available online: https://www.osha.gov/laws-regs/standardinterpretations/2003-02-24 (accessed on 5 January 2021).
- Casanova, L.M.; Jeon, S.; Rutala, W.A.; Weber, D.J.; Sobsey, M.D. Effects of Air Temperature and Relative Humidity on Corona-Virus Survival on Surfaces. Applied and Environmental Microbiology. U.S. National Library of Medicine. Available online: https://pubmed.ncbi.nlm.nih.gov/20228108/ (accessed on 2 November 2020).
- Liu, J.; Zhou, J.; Yao, J.; Zhang, X.; Li, L.; Xu, X.; He, X.; Wang, B.; Fu, S.; Niu, T.; et al. Impact of meteorological factors on the COVID-19 transmission: A multi-city study in China. Sci. Total Environ. 2020, 726, 138513. [Google Scholar] [CrossRef] [PubMed]
- Hackster.io. M5Stack M5StickC ESP32-PICO Mini IoT Development Board Projects. Available online: https://m5stack.hackster.io/products/m5stickc-esp32-pico-mini-iot-development-board (accessed on 4 September 2020).
- MLX90614 Family, Single and Dual Zone Infra-Red Thermometer in TO-39. 29 June 2015. Available online: http://www.haierxikj.com/UploadFile/Photo/2015-7/2015072312121571160.pdf (accessed on 14 August 2020).
- m5stack. M5StickC ENV Hat (DHT12, BMP280, BMM150). Available online: https://m5stack.com/products/m5stickc-env-hat?variant=17266544214106 (accessed on 2 February 2021).
- Craig, L.; Fumagalli, A. Internet of Things Security-Multilayered Method for End to End Data Communi-cations over Cellular Networks. In Proceedings of the 2019 IEEE 5th World Forum on Internet of Things (WF-IoT), Limerick, Ireland, 15–18 April 2019. [Google Scholar] [CrossRef]
- Ndiaye, M.; Oyewobi, S.S.; Abu-Mahfouz, A.M.; Hancke, G.P.; Kurien, A.M.; Djouani, K. IoT in the Wake of COVID-19: A Survey on Contributions, Challenges and Evolution. IEEE Access 2020, 8, 186821–186839. [Google Scholar] [CrossRef]
- Vinay, C.; Hassija, V.; Gupta, V.; Guizani, M. A Comprehensive Review of the COVID-19 Pan-demic and the Role of IoT, Drones, AI, Blockchain, and 5G in Managing Its Impact. IEEE Access 2020, 8, 90225–90265. [Google Scholar] [CrossRef]
- Long, H.M.; Pietrosanto, A. Yaw/Heading optimization by drift elimination on MEMS gyroscope. Sens. Actuators A Phys. 2021, 325, 112691. [Google Scholar] [CrossRef]
- Yin, Y.; Zeng, Y.; Chen, X.; Fan, Y. The internet of things in healthcare: An overview. J. Ind. Inf. Integr. 2016, 1, 3–13. [Google Scholar] [CrossRef]
- Priyamvadaa, R. Temperature and Saturation Level Monitoring System Using MQTT for COVID-19. In Proceedings of the 2020 International Conference on Recent Trends on Electronics, Information, Communication & Technology (RTEICT), Bangalore, India, 12–13 November 2020. [Google Scholar] [CrossRef]
- Yuan, H.; Wang, Z.; Xia, L. Design of Temperature and Humidity Detection System for a Material Warehouse Based on GM. In Proceedings of the 2020 IEEE 4th Information Technology, Networking, Electronic and Automation Control Conference (ITNEC), Chongqing, China, 12–14 June 2020. [Google Scholar] [CrossRef]
- Espressif Systems (Shanghai) Co., Ltd. ESP32 Series Datasheet, Version 3.4; Espressif Systems (Shanghai) Co., Ltd.: Shanghai, China, 2020. [Google Scholar]
- Arduino Team. “Software.” Arduino. Available online: https://www.arduino.cc/en/software (accessed on 15 August 2020).
- Ates, H.C.; Yetisen, A.K.; Güder, F.; Dincer, C. Wearable devices for the detection of COVID-19. Nat. Electron. 2021, 4, 13–14. [Google Scholar] [CrossRef]
- Islam, M.; Mahmud, S.; Muhammad, L.J.; Islam, R.; Nooruddin, S.; Ayon, S.I. Wearable Technology to Assist the Patients Infected with Novel Coronavirus (COVID-19). SN Comput. Sci. 2020, 1, 1–9. [Google Scholar] [CrossRef] [PubMed]
- Zheng, L.; Cai, Y.; Lin, Z.; Tang, W.; Zheng, H.; Shi, H.; Liao, B.; Wang, J. A Novel Activity Recognition Approach Based on Mobile Phone. In Multimedia and Ubiquitous Engineering. Lecture Notes in Electrical Engineering; Park, J., Chen, S.C., Gil, J.M., Yen, N., Eds.; Springer: Berlin/Heidelberg, Germany, 2014; Volume 308. [Google Scholar] [CrossRef]
- Dell’Isola, G.B.; Cosentini, E.; Canale, L.; Ficco, G.; Dell’Isola, M. Noncontact Body Temperature Measurement: Uncertainty Evaluation and Screening Decision Rule to Prevent the Spread of COVID-19. Sensors 2021, 21, 346. [Google Scholar] [CrossRef] [PubMed]
- Costanzo, S.; Flores, A. A Non-Contact Integrated Body-Ambient Temperature Sensors Platform to Contrast COVID-19. Electronics 2020, 9, 1658. [Google Scholar] [CrossRef]
- McCluney, R. Radiometry and Photometry. In Encyclopedia of Physical Science and Technology, 3rd ed.; Meyers, R.A., Ed.; Academic Press: Cambridge, MA, USA, 2003; pp. 731–758. ISBN 9780122274107. [Google Scholar] [CrossRef]
- OMEGA Engineering. Available online: https://www.omega.co.uk/prodinfo/infrared-thermometers.html (accessed on 2 November 2020).
- Microchip Technology Inc. MCP9808 Datasheet; Microchip Technology Inc.: Chandler, AZ, USA, 2011. [Google Scholar]
- Hoang, M.L.; Pietrosanto, A. A New Technique on Vibration Optimization of Industrial Inclinometer for MEMS Accelerometer Without Sensor Fusion. IEEE Access 2021, 9, 20295–20304. [Google Scholar] [CrossRef]
- Long, H.M.; Pietrosanto, A. An Effective Method on Vibration Immunity for Inclinometer Based on MEMS Accelerometer. In Proceedings of the 2020 International Semiconductor Conference (CAS), Sinaia, Romania, 7–9 October 2020. [Google Scholar] [CrossRef]
- Ptdirect. Body Temperature Responses to Exercise. Available online: www.ptdirect.com/training-design (accessed on 10 September 2020).
- Aosong, Digital Temperature, DHT12 Product Datasheet. Available online: https://robototehnika.ru/file/DHT12.pdf (accessed on 10 September 2020).
- (EN) MQ Telemetry Transport (MQTT) V3.1 Protocol Specification. 19 August 2010. Available online: https://public.dhe.ibm.com/software/dw/webservices/ws-mqtt/mqtt-v3r1.html (accessed on 8 September 2020).
- Ubidots. Data Drives Decisions. Available online: https://ubidots.com/ (accessed on 2 February 2021).


| Parameter of Tbody | Morning (Normal Activity) | Afternoon (Exercise Activity) | Night (Before Sleep) |
|---|---|---|---|
| Minimum (°C) | 35.99 | 36.64 | 35.72 |
| Maximum (°C) | 36.70 | 36.71 | 36.90 |
| Average (°C) | 36.34 | 36.90 | 36.33 |
| Std (°C) | 0.16 | 0.21 | 0.19 |
| TTH (°C) | 37 | 37.5 | 37 |
| Alert | No | No | No |
| Daily Time | Tbody (°C) | Alert |
|---|---|---|
| 11:18 a.m. | 36.51 | 0 |
| 2:25 p.m. | 36.49 | 0 |
| 4:07 p.m. | 36.70 | 0 |
| 7:58 p.m. | 36.68 | 0 |
| Average Value | Morning | Afternoon | Night |
|---|---|---|---|
| RH (%) | 18 | 15 | 16.5 |
| Tindoor (°C) | 23.5 | 25 | 24 |
| Index Day | Average Tbody (°C) | Alert |
|---|---|---|
| 1 | 36.82 | 0 |
| 2 | 36.70 | 0 |
| 3 | 36.70 | 0 |
| 4 | 36.45 | 0 |
| 5 | 36.70 | 0 |
| 6 | 36.58 | 0 |
| 7 | 36.33 | 0 |
| 8 | 36.70 | 0 |
| 9 | 36.78 | 0 |
| 10 | 36.33 | 0 |
| 11 | 36.69 | 0 |
| 12 | 36.45 | 0 |
| 13 | 36.58 | 0 |
| 14 | 36.33 | 0 |
Publisher’s Note: MDPI stays neutral with regard to jurisdictional claims in published maps and institutional affiliations. |
© 2021 by the authors. Licensee MDPI, Basel, Switzerland. This article is an open access article distributed under the terms and conditions of the Creative Commons Attribution (CC BY) license (http://creativecommons.org/licenses/by/4.0/).
Share and Cite
Hoang, M.L.; Carratù, M.; Paciello, V.; Pietrosanto, A. Body Temperature—Indoor Condition Monitor and Activity Recognition by MEMS Accelerometer Based on IoT-Alert System for People in Quarantine Due to COVID-19. Sensors 2021, 21, 2313. https://doi.org/10.3390/s21072313
Hoang ML, Carratù M, Paciello V, Pietrosanto A. Body Temperature—Indoor Condition Monitor and Activity Recognition by MEMS Accelerometer Based on IoT-Alert System for People in Quarantine Due to COVID-19. Sensors. 2021; 21(7):2313. https://doi.org/10.3390/s21072313
Chicago/Turabian StyleHoang, Minh Long, Marco Carratù, Vincenzo Paciello, and Antonio Pietrosanto. 2021. "Body Temperature—Indoor Condition Monitor and Activity Recognition by MEMS Accelerometer Based on IoT-Alert System for People in Quarantine Due to COVID-19" Sensors 21, no. 7: 2313. https://doi.org/10.3390/s21072313
APA StyleHoang, M. L., Carratù, M., Paciello, V., & Pietrosanto, A. (2021). Body Temperature—Indoor Condition Monitor and Activity Recognition by MEMS Accelerometer Based on IoT-Alert System for People in Quarantine Due to COVID-19. Sensors, 21(7), 2313. https://doi.org/10.3390/s21072313