Abstract
Speed is an essential parameter in biomechanical analysis and general locomotion research. It is possible to estimate the speed using global positioning systems (GPS) or inertial measurement units (IMUs). However, GPS requires a consistent signal connection to satellites, and errors accumulate during IMU signals integration. In an attempt to overcome these issues, we have investigated the possibility of estimating the horse speed by developing machine learning (ML) models using the signals from seven body-mounted IMUs. Since motion patterns extracted from IMU signals are different between breeds and gaits, we trained the models based on data from 40 Icelandic and Franches-Montagnes horses during walk, trot, tölt, pace, and canter. In addition, we studied the estimation accuracy between IMU locations on the body (sacrum, withers, head, and limbs). The models were evaluated per gait and were compared between ML algorithms and IMU location. The model yielded the highest estimation accuracy of speed (RMSE = 0.25 m/s) within equine and most of human speed estimation literature. In conclusion, highly accurate horse speed estimation models, independent of IMU(s) location on-body and gait, were developed using ML.
1. Introduction
Speed is a key variable to analyze horse locomotion and assess performance [1,2]. Effects of speed on kinematic and kinetic parameters as well as health indicators have been studied in a variety of equine-related areas [3,4,5], including injury prevention during exercise [6], lameness detection [7,8], fitness level evaluation [9,10], and genomics analyses [1,11]. Therefore, equine speed assessment is important as it assists clinicians and equestrians to have a comprehensive view of a horse health and fitness level.
In general, the speed has been estimated by observation and labeling in relative terms (e.g., slow and fast) [12]. Describing locomotion parameters relatively might be influenced by expectation bias [13] and the precision is dependant on the assessor’s expertise [14,15]. As a solution, the speed should be measured quantitatively to become comparable.
There are different horse speed measuring methods using devices in literature. Conventionally, high-speed cameras have been used for this purpose [16,17]. However, a camera should be fixed on a wall or ground, requires scaling, and only captures a limited area. Three-dimensional optical motion capture has also been employed for speed assessment [18]. This method is seen as the ‘gold standard’ for measuring gait kinematics [19]. Although motion capture systems can measure the speed precisely, they are expensive and their use is limited to the laboratory environment [20].
In contrast to the limitations of the above methods, inertial measurement units (IMUs) can quantify movement patterns indoor and outdoor. This technology has been utilized for human and animal motion analysis and is capable of accurately measuring acceleration and angular velocity. Fundamentally, integrating acceleration signal results in velocity. In practice however, the aggregation of errors during the integration process can appear as an accumulated drift from the real value over time [21,22,23,24].
Another portable device for speed measurement is the global positioning system (GPS). This device has been validated for accurate speed measurement [2,25,26,27,28] in human [29] and equine studies [6,11,30,31,32,33,34,35,36]. The advantage of using GPS is portability and low price. However, it cannot be used indoors due to the lack of received signals from satellites. The accuracy might also be affected outdoors if large obstacles hinder the connection.
By using GPS speed as ground-truth and IMUs for portability, estimating horse speed would be feasible. However, IMU data is high dimensional, which complicates the possible connection to one-dimension scalar speed data. Machine learning (ML) can overcome this issue by processing non-linear and high dimensional data to an optimized model [37]. Therefore, this study aims to estimate horse speed using body-attached IMUs and ML methods. To achieve an accurate and complete model, the effects of the number and location of IMUs, ML approaches, gaits, and breeds (with distinct movement patterns) on the estimation model were studied and compared.
2. Methods
The proposed estimation model is summarized in Figure 1. The body-mounted IMUs and GPS data from two different breeds were collected, time-synchronized, and preprocessed. Subsequently, data was split in windows for Time- and frequency-domain feature extraction. Then, “feature set”s were defined as the extracted features from an IMU or a combination of IMUs. To decrease the number of features used in the estimation model, the optimal group of features was identified using a feature selection method for each feature set. Next, estimation models were trained using popular ML techniques in the literature [38,39], which were support-vector machine (SVM) [40], Gaussian progress regression (GPR) [41], decision tree (DT) [42], boosted trees (BT) [43,44], and random forest [45]. Finally, accuracy of the models were compared.
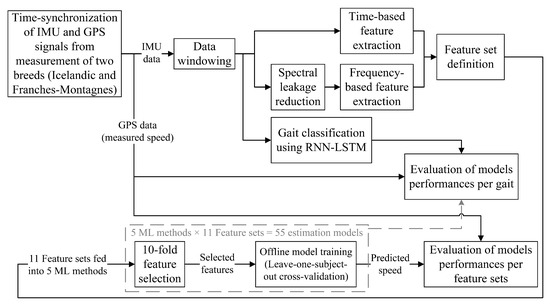
Figure 1.
A summary of the model training procedure.
2.1. Data
Since horse breeds are biomechanically distinct and present different motion patterns between gaits [46,47,48], we used motion data from two different breeds and various gaits (walk, trot, tölt, pace, and canter) to provide a complete estimation model. The data used in this study was collected from different research projects. In one study, data was collected from fifteen Icelandic horses, ridden at walk, trot, tölt, pace, and canter to study the normal biomechanical properties of different gaits [49]. In another study, twenty-five Franches-Montagnes (FM) horses were walked and trotted in hand to study gaits and phenotype-genotype associations (study not published yet). In both studies, horses were equipped with the same gait analysis system (EquiMoves®-www.equimoves.nl) consisting of seven ProMove-mini IMUs (Inertia Technology B.V., Enschede, The Netherlands) (tri-axial accelerometer and tri-axial gyroscope) [50,51] on poll, withers, sacrum, and the lateral aspect of all four limbs (cannon bone). IMU sensors were set to a sampling rate of 200 Hz. Figure 2 demonstrates the IMU locations and orientations on horse body. Horses with known history of lameness or presenting any clear sign of lameness during the measurements were excluded from this study.
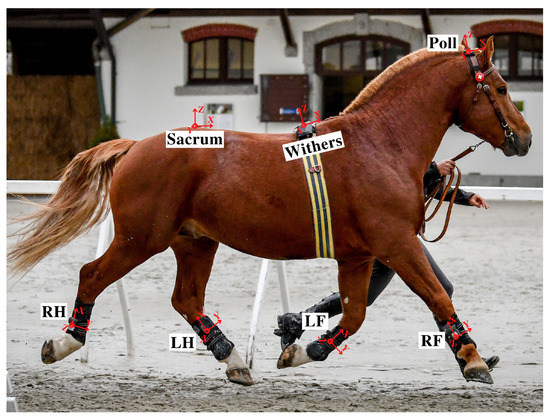
Figure 2.
IMUs locations and orientations on horse body. RF: right front limb, LF: left front limb, RH: right hindlimb, LH: left hindlimb. Photographed by Christelle Althaus.
The sacrum IMU contained a GPS module (Hornet ORG14xx, OriginGPS Ltd., Airport City, Israel) for the measurement of Icelandic horses, while for FM horses, the GPS module was embedded in the withers IMU. The sacrum and withers were selected for GPS placement since they are the clearest point of the horse’s body for receiving satellites signals. Therefore, the measurement were performed outdoors. The GPS sampling configuration was set to 5 Hz.
The GPS module has been designed to accurately measure the speed (less than 0.01 m/s error for speed value of 30 m/s) using the Doppler shift method [52]. To confirm the accuracy, the module was tested and validated for outdoor speed measurement prior to this study. A detailed description of the validation method and results is provided as Supplementary File S1.
As demonstrated in Figure 2, the three axes of rotation for the sacrum, withers, and poll IMUs were x, y, and z, which were defined in the order as longitudinal axis, mediolateral axis, and vertical axis. For limbs, x, y, and z-axis were aligned to limb (longitudinally), retraction/protraction angle axis, and abduction/adduction angle axis, respectively [50].
2.2. Features and Feature Sets
The signals derived from the IMU (x, y, and z axes of acceleration and angular velocity) were low-pass filtered (fourth-order Butterworth filter and 30 Hz cut-off frequency) for noise reduction [50]. Then, the filtered signals were windowed into 256 timesteps windows. The middle of each window was time-synchronized with the corresponding speed data. Since the speed data from GPS were collected every 0.2 s (5 Hz) and the IMU data frequency was 200 Hz, the windows overlapped.
Based on the most chosen features in related literature [53,54,55,56], 23 time and frequency-domain features were selected (Table 1), which later were extracted from the windows. Before the computation of frequency-domain parameters, we used a Hann window to reduce spectral leakage and to enhance the outcome [57].

Table 1.
Time- and frequency-domain features.
In total, the dimensionality of the feature vector for each IMU was features. Eleven feature sets were defined from the combination of IMU(s) extracted features (Table 2). The feature sets were defined to compare the accuracy of estimation models in terms of different IMU locations.
Table 2.
Feature sets definition.
2.3. Feature Selection
The implementation of a feature selection method has several advantages. It prevents the model from overfitting, decreases training effort, and increases the model performance [55,58]. Therefore, the features of each feature set were used as input for a k-fold sequential Forward floating Selection method (SFFS) [59]. The criteria for adding a new feature in each SFFS step was more than 0.01 point decrease of estimated versus measured speed root mean square error ().
2.4. Model Training and Performance Evaluation
To be certain that the dataset from each subject has been used at least one time as training and testing data, all the mentioned ML methods were executed with leave-one-subject-out cross-validation [60]. The estimation models were trained by tuning the hyperparameters and using the selected features in each feature set.
The performance of each model was quantified by calculating the following parameters, mean absolute error (MAE), RMSE, and normalized root mean square error (nRMSE). MAE and nRMSE were defined as follows:
The measured speed was derived from GPS, while the estimated speed was computed using the trained models. For evaluation of the model performance per gait, the signals from All feature set was applied to a gait classification model [61]. The results of the models (11 feature sets × 5 ML techniques = 55 models) are compared in the next section. Matlab R2020a (MathWorks Inc., Natick, MA, USA) was used for all the computations.
3. Results
Approximately 130,000 speed datapoints (26,000 s) have been extracted from the dataset. The estimation performances of the trained models are presented visually in Figure 3 and in details in Table 3. The range of accuracy parameters were 0.14–0.36 m/s for MAE and 0.25–0.58 m/s for RMSE. The performance results of feature sets and methods are compared in the following sections.

Figure 3.
Comparison of models performances using MAE (m/s) and RMSE (m/s).
Table 3.
Accuracy of the models- MAE(m/s) and RMSE (m/s).
3.1. Selected Features
According to Table 4, the first-ranked feature of upper body feature sets (sacrum, withers, poll, and Sac/Wth) was extracted from the z-axis of accelerometer signal. The second-ranked feature was also from acceleration signals, which were derived from x and z axes. For the limb feature sets, the z-axis of angular velocity signal ranked the highest. Moreover, the second-ranked feature for both front limbs feature sets were obtained from x-axis of acceleration signal, while for both hindlimbs and Limbs feature sets were selected from z-axis of gyroscope output. Furthermore, all the selected features of limbs feature set were from z-axis of angular velocity.
Table 4.
The highest ranked (first to sixth) selected features using SFFS based on random forest method.
3.2. Feature Set
It can be inferred from Figure 3 and Table 3 that All feature set provided the best performance (RMSE = 0.25–0.33 m/s). In addition, the feature sets from both hindlimbs IMU signals were labeled as the lowest RMSE and MAE among the individual IMU feature sets in estimating the speed (RMSE = 0.28 and MAE = 0.16 m/s). It should be noted that the accuracy of models except the model trained with poll features (RMSE = 0.45–0.58 m/s) were approximately as high as the model based on All feature set.
3.3. Machine Learning Technique
Similar to the performance comparison of the feature sets, the differences between performances of models based on SVM, GPR, and random forest methods were insignificant. Nonetheless, considering the small differences, the best ML method in terms of accuracy was random forest. Conversely, models based on DT and BT methods had the worst performance among the ML techniques used in this study.
3.4. Gait
As shown in Table 5, the RMSE and nRMSE increased and decreased respectively as the model estimated the faster gaits. The lowest RMSE (0.20 m/s) was obtained during walk, which was lower than the total RMSE (0.25 m/s). During pace, the model was indicated the lowest nRMSE (4.12%) among other gaits.
Table 5.
Performance of model (based on “All” feature set and Random forest method) per gait type.
4. Discussion
The main goal of this paper was to develop an accurate model for estimating the speed of horses using IMUs. The derived speed from GPS was used as ground-truth to compare the performances of models trained on five ML methods. Each ML method was trained on eleven feature sets to compare the estimation accuracy in terms of the number and placement of IMUs on the horse body. The feature sets consisted of time- and frequency-domain features extracted from the output of seven IMUs, which was an extensive database of acceleration and angular velocity signals.
The selected features from the angular velocity signal in limb-related feature sets (Table 4) can be explained by the fact that equine limbs move in reciprocating motion. This motion influences the stride frequency, and stride frequency amplifies the locomotion speed. Therefore, a feature extracted from rotation around the z-axis of limb IMU can be an indicator of change in stride frequency [62,63,64]. In addition, the sacrum, withers, and poll feature sets had z-axis acceleration signal extracted features as their highest rank features. The explanation can be similar to the limbs since by using vertical acceleration of the mentioned IMUs, it is possible to determine the periodical pattern of their vertical displacements. Thus, the vertical displacement is affected by the hoof-on and hoof-off rate, i.e., stride frequency [50,65].
To analyze the relation of stride frequency and speed in the dataset, hoof-on moments of the right front limb were detected using a validated method from another study [65]. Then, stride frequency was calculated using the timing of detected hoof-ons, time-synchronized with speed values. According to the result shown in Figure 4, as speed increases, the stride frequency also increases. To investigate the possibility of estimating speed using stride frequency, we fitted second- and third-degree polynomials to the data and computed the accuracy. However, the accuracy was low compared to the results of the ML models (2nd-degree polynomial: MAE = 0.51 m/s, RMSE = 0.8 m/s and = 0.74; 3rd-degree polynomial: MAE = 0.52 m/s, RMSE = 1.36 m/s, and = 0.73), which is concurrent with the outcome of other studies [66,67]. Therefore, it requires a more complex model to estimate speed accurately, which has been done successfully in this study.
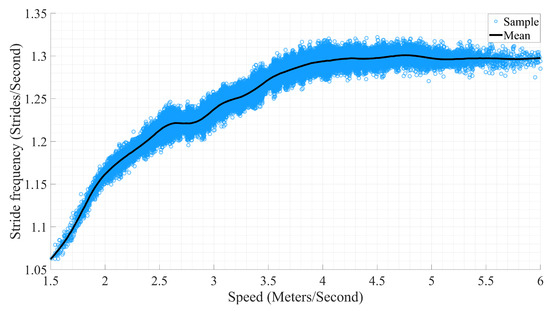
Figure 4.
Stride frequency versus speed.
The performance of all the models per gait had a similar pattern in the means of RMSE and nRMSE. To present this pattern, the performance of the model based on All feature set was demonstrated in Table 5. As the horses switched to faster gaits- from walking to cantering- the RMSE of models increased while their nRMSE slightly decreased. It should be noted that RMSE indicates the actual differences from the mean while nRMSE shows the differences relative to mean. Therefore, these alteration suggests that the model maintains its high accuracy on different speeds regardless of the gait.
Random forest, GPR, and SVM models obtained better results compared to DT and BT. Moreover, the performance of models trained with random forest algorithms was the best and the training and testing duration were significantly shorter compared to the models based on SVM and GPR. Therefore, this method not only has an advantage in accuracy but also reduces computational time.
The model in this study is more accurate than the only other speed estimation model in equine literature (average RMSE = 0.43 m/s) [68]. Moreover, our model is able to estimate the speed of two distinct breeds and five gaits by attaching an IMU to one of the seven body locations in contrast to the mentioned model, which estimates the speed of one breed during canter by attaching an IMU to the saddle. In addition, five ML techniques were compared for choosing the best performing while only SVM was used in [68]. Therefore, our model is the most complete in terms of accuracy, IMU placement options, and different motion patterns (breed and gait) support in the equine literature.
Despite the scarcity of speed estimation studies in equine literature, various studies investigated human speed estimation using IMU. For instance, linear regression was applied to the output of a single IMU to estimate older adults’ walking speed, where the model yielded RMSE ≈ 0.069 m/s accuracy [69]. Another study also developed a walking speed estimation model using GPR, which achieved an accuracy (RMSE) of 0.066–0.095 m/s [70]. By comparing the results of the present model and the mentioned studies, we can conclude that our model is more general than the models from human studies in terms of multiple motion patterns support and different IMU placements, while others focused only on estimating the walking speed [24]. As shown in Table 5, the nRMSE range of the model was 4.12–11.76%. By calculating the nRMSE range of [70] (5.4–10%) and [69] (6.6–14.7%), it can be derived that the model in this study can estimate the speed more accurately than aforementioned studies.
It is more attractive to predict the speed with only one sensor since it is cheaper and the deployment on a subject’s body is simpler. However, according to the results, the model based on Sacrum/RF feature set showed better accuracy than models based on single IMU. During the training and competition, the sacrum IMU may fall off, since it is attached to the horse with double-sided tape without a strap. Therefore, it might limit the usability of the sacrum-based models to research purposes. In contrast, the limbs IMUs can be fixed around the tendon boots. Finally, the accuracy differences between the Sacrum/RF model and individual limb-based models (especially hindlimbs) are negligible. Considering the easier deployment, using only one limb IMU for estimation is nearly as accurate while being more applicable during training and competitions.
5. Conclusions
In this study, three novel outcomes were achieved. First, our investigation for the optimal IMU placement concluded that placing only one IMU on any limb, withers, or sacrum will result in high speed estimation accuracy. Second, our model can estimate the speed during distinct motion patterns from two different breeds and five gaits. Finally, the performances of five prevalent ML techniques on estimating the horse speed were compared.
In total, 55 ML estimation models were trained, validated, and evaluated. Models based on random forest method performed better than SVM, GPR, DT, and BT methods. Moreover, the model can accurately estimate the speed during all gaits using the output signals of only one IMU (limb, sacrum, or withers). Therefore, this robust model offers flexibility to researchers, equestrians, and breeders in terms of IMU location on the horse’s body, and thus, they can benefit from accurate speed estimation in training and competition. In future studies, model capability might be explored by adding data from different breeds or age-specific horses measurements. Performance of the model can also be investigated by training it on novel deep learning methods.
Supplementary Materials
The following are available online at https://www.mdpi.com/1424-8220/21/3/798/s1, Supplementary File S1.
Author Contributions
H.D. contributed to the algorithm development, data analysis, and writing of the manuscript. F.S.B. contributed to data analysis and revised the manuscript. B.J.v.d.Z. provided insights in algorithm development and the revision of the manuscript. J.V. contributed with designing of the experiments and revision of the manuscript. A.I.G. and E.H.H. collected parts of the data and contributed to the revision of the manuscript. P.H. provided crucial insights in data analysis and provided significant revisions to the paper. All authors have read and agreed to the published version of the manuscript.
Funding
This study was partly funded by EFRO OP-Oost (project “Paardensprong”), and the Swiss Federal Office for Agriculture (contract number 627001325).
Institutional Review Board Statement
The study was conducted according to the guidelines of the Declaration of Helsinki, and approved by the Ethics Committee of The Icelandic Food and Veterinary Authority MAST and Animal Health and Welfare Commission of the Canton of Vaud (under animal testing permit number VD 3527).
Data Availability Statement
The data that support the findings of this study are available from the corresponding authors upon reasonable request.
Acknowledgments
The authors wish to thank Sigridur Bjornsdottir and Víkingur Gunnarsson from Hólar University College, Elin Hernlund and Marie Rhodin from Swedish University of Agricultural Sciences, Michael Weishaupt and Marie-Theres Dittmann from University of Zurich, and all the animal caretakers that helped with the data collection.
Conflicts of Interest
The authors declare no conflict of interest.
References
- Meira, C.T.; Fortes, M.R.; Farah, M.M.; Porto-Neto, L.R.; Kelly, M.; Moore, S.S.; Pereira, G.L.; Chardulo, L.A.L.; Curi, R.A. Speed Index in the Racing Quarter Horse: A Genome-wide Association Study. J. Equine Vet. Sci. 2014, 34, 1263–1268. [Google Scholar] [CrossRef]
- Witte, T.; Wilson, A. Accuracy of non-differential GPS for the determination of speed over ground. J. Biomech. 2004, 37, 1891–1898. [Google Scholar] [CrossRef] [PubMed]
- Robert, C.; Valette, J.P.; Pourcelot, P.; Audigie, F.; Denoix, J.M. Effects of trotting speed on muscle activity and kinematics in saddlehorses. Equine Vet. J. 2002, 34, 295–301. [Google Scholar] [CrossRef] [PubMed]
- Weishaupt, M.A.; Hogg, H.P.; Auer, J.A.; Wiestner, T. Velocity-dependent changes of time, force and spatial parameters in Warmblood horses walking and trotting on a treadmill. Equine Vet. J. 2010, 42, 530–537. [Google Scholar] [CrossRef] [PubMed]
- Allen, K.J.; Young, L.E.; Franklin, S.H. Evaluation of heart rate and rhythm during exercise. Equine Vet. Educ. 2015, 28, 99–112. [Google Scholar] [CrossRef]
- Williams, J.; Kenworth, K.; Jones, T. The role of heart rate monitoring to assess workload during maintenance interval training in national hunt racehorses. J. Vet. Behav. 2019, 29, 150. [Google Scholar] [CrossRef]
- Moorman, V.J.; Frisbie, D.D.; Kawcak, C.E.; McIlwraith, C.W. The Effect of Horse Velocity on the Output of an Inertial Sensor System. J. Equine Vet. Sci. 2017, 58, 34–39. [Google Scholar] [CrossRef]
- Yigit, T.; Han, F.; Rankins, E.; Yi, J.; McKeever, K.; Malinowski, K. Wearable IMU-based Early Limb Lameness Detection for Horses using Multi-Layer Classifiers. In Proceedings of the 2020 IEEE 16th International Conference on Automation Science and Engineering (CASE), Hong Kong, China, 20–21 August 2020; pp. 955–960. [Google Scholar] [CrossRef]
- Witte, T.H.; Hirst, C.V.; Wilson, A.M. Effect of speed on stride parameters in racehorses at gallop in field conditions. J. Exp. Biol. 2006, 209, 4389–4397. [Google Scholar] [CrossRef]
- Munsters, C.C.; van Iwaarden, A.; van Weeren, R.; Sloet van Oldruitenborg-Oosterbaan, M.M. Exercise testing in Warmblood sport horses under field conditions. Vet. J. 2014, 202, 11–19. [Google Scholar] [CrossRef]
- Farries, G.; Gough, K.F.; Parnell, A.C.; McGivney, B.A.; McGivney, C.L.; McGettigan, P.A.; MacHugh, D.E.; Katz, L.M.; Hill, E.W. Analysis of genetic variation contributing to measured speed in Thoroughbreds identifies genomic regions involved in the transcriptional response to exercise. Anim. Genet. 2019, 50, 670–685. [Google Scholar] [CrossRef]
- Enschede, I.B. KWPN Lineair Scoring. Available online: https://www.kwpn.org/events/empty/studbook-inspections/lineair-scoring (accessed on 20 April 2020).
- König von Borstel, U.; Pasing, S.; Gauly, M. Towards a more objective assessment of equine personality using behavioural and physiological observations from performance test training. Appl. Anim. Behav. Sci. 2011, 135, 277–285. [Google Scholar] [CrossRef]
- Starke, S.; Oosterlinck, M. Reliability of equine visual lameness classification as a function of expertise, lameness severity and rater confidence. Vet. Rec. 2018, 184. [Google Scholar] [CrossRef] [PubMed]
- Gmel, A.I.; Gmel, G.; von Niederhäusern, R.; Weishaupt, M.A.; Neuditschko, M. Should We Agree to Disagree? An Evaluation of the Inter-Rater Reliability of Gait Quality Traits in Franches-Montagnes Stallions. J. Equine Vet. Sci. 2020, 88, 102932. [Google Scholar] [CrossRef] [PubMed]
- Fredricson, I.; Drevemo, S.; Dalin, G.; Hjerten, G.; Björne, K. The application of high-speed cinematography for the quantitative analysis of equine locomotion. Equine Vet. J. 1980, 12, 54–59. [Google Scholar] [CrossRef] [PubMed]
- Ratzlaff, M.H.; Shindell, R.M.; White, K.K. The interrelationships of stride lengths and stride times to velocities of galloping horses. J. Equine Vet. Sci. 1985, 5, 279–283. [Google Scholar] [CrossRef]
- Ericson, C.; Stenfeldt, P.; Hardeman, A.; Jacobson, I. The Effect of Kinesiotape on Flexion-Extension of the Thoracolumbar Back in Horses at Trot. Animals 2020, 10, 301. [Google Scholar] [CrossRef]
- Pfau, T. A method for deriving displacement data during cyclical movement using an inertial sensor. J. Exp. Biol. 2005, 208, 2503–2514. [Google Scholar] [CrossRef]
- Nguyen, K.D.; Chen, I.; Luo, Z.; Yeo, S.H.; Duh, H.B. A Wearable Sensing System for Tracking and Monitoring of Functional Arm Movement. IEEE/ASME Trans. Mechatron. 2011, 16, 213–220. [Google Scholar] [CrossRef]
- Fasel, B.; Duc, C.; Dadashi, F.; Bardyn, F.; Savary, M.; Farine, P.A.; Aminian, K. A wrist sensor and algorithm to determine instantaneous walking cadence and speed in daily life walking. Med. Biol. Eng. Comput. 2017, 55, 1773–1785. [Google Scholar] [CrossRef]
- Feigl, T.; Kram, S.; Woller, P.; Siddiqui, R.H.; Philippsen, M.; Mutschler, C. RNN-aided human velocity estimation from a single IMU. Sensors 2020, 20, 3656. [Google Scholar] [CrossRef]
- Brzostowski, K. Novel approach to human walking speed enhancement based on drift estimation. Biomed. Signal Process. Control. 2018, 42, 18–29. [Google Scholar] [CrossRef]
- Díez, L.E.; Bahillo, A.; Otegui, J.; Otim, T. Step Length Estimation Methods Basedon Inertial Sensors: A Review. IEEE Sens. J. 2018, 18, 6908–6926. [Google Scholar] [CrossRef]
- Varley, M.C.; Fairweather, I.H.; Aughey, R.J. Validity and reliability of GPS for measuring instantaneous velocity during acceleration, deceleration, and constant motion. J. Sports Sci. 2012, 30, 121–127. [Google Scholar] [CrossRef] [PubMed]
- Borresen, J.; Ian Lambert, M. The Quantification of Training Load, the Training Response and the Effect on Performance. Sports Med. 2009, 39, 779–795. [Google Scholar] [CrossRef]
- Roe, G.; Darrall-Jones, J.; Black, C.; Shaw, W.; Till, K.; Jones, B. Validity of 10-HZ GPS and Timing Gates for Assessing Maximum Velocity in Professional Rugby Union Players. Int. J. sports Physiol. Perform. 2017, 12, 836–839. [Google Scholar] [CrossRef]
- Beato, M.; Devereux, G.; Stiff, A. Validity and Reliability of Global Positioning System Units (STATSports Viper) for Measuring Distance and Peak Speed in Sports. J. Strength Cond. Res. 2018, 32, 2831–2837. [Google Scholar] [CrossRef]
- Scott, M.T.; Scott, T.J.; Kelly, V.G. The Validity and Reliability of Global Positioning Systems in Team Sport. J. Strength Cond. Res. 2016, 30, 1470–1490. [Google Scholar] [CrossRef]
- Kingston, J.K.; Soppet, G.M.; Rogers, C.W.; firth, E.C. Use of a global positioning and heart rate monitoring system to assess training load in a group of Thoroughbred racehorses. Equine Vet. J. 2006, 38, 106–109. [Google Scholar] [CrossRef]
- Bazzano, M.; Giudice, E.; Rizzo, M.; Congiu, F.; Zumbo, A.; Arfuso, F.; Di Pietro, S.; Bruschetta, D.; Piccione, G. Application of a combined global positioning and heart rate monitoring system in jumper horses during an official competition—A preliminary study. Acta Vet. Hung. 2016, 64, 189–200. [Google Scholar] [CrossRef]
- Fonseca, R.G.; Kenny, D.A.; Hill, E.W.; Katz, L.M. The association of various speed indices to training responses in Thoroughbred flat racehorses measured with a global positioning and heart rate monitoring system. Equine Vet. J. 2010, 42, 51–57. [Google Scholar] [CrossRef]
- Parkes, R.S.V.; Weller, R.; Pfau, T.; Witte, T.H. The Effect of Training on Stride Duration in a Cohort of Two-Year-Old and Three-Year-Old Thoroughbred Racehorses. Animals 2019, 9, 466. [Google Scholar] [CrossRef] [PubMed]
- Vermeulen, A.D.; Evans, D.L. Measurements of fitness in Thoroughbred racehorses using field studies of heart rate and velocity with a global positioning system. Equine Vet. J. 2006, 38, 113–117. [Google Scholar] [CrossRef] [PubMed]
- Han, H.; McGivney, B.A.; Farries, G.; Katz, L.M.; MacHugh, D.E.; Randhawa, I.A.S.; Hill, E.W. Selection in Australian Thoroughbred horses acts on a locus associated with early two-year old speed. PLoS ONE 2020, 15, e0227212. [Google Scholar] [CrossRef] [PubMed]
- Best, R.; Standing, R. The Spatiotemporal Characteristics of 0–24-Goal Polo. Animals 2019, 9, 446. [Google Scholar] [CrossRef]
- Phinyomark, A.; Petri, G.; Ibáñez-Marcelo, E.; Osis, S.T.; Ferber, R. Analysis of big data in gait biomechanics: Current trends and future directions. J. Med. Biol. Eng. 2018, 38, 244–260. [Google Scholar] [CrossRef]
- Bouwman, A.; Savchuk, A.; Abbaspourghomi, A.; Visser, B. Automated Step Detection in Inertial Measurement Unit Data From Turkeys. Front. Genet. 2020, 11, 207 . [Google Scholar] [CrossRef]
- Zhou, Y.; Romijnders, R.; Hansen, C.; Campen, J.; Maetzler, W.; Hortobágyi, T.; Lamoth, C. The detection of age groups by dynamic gait outcomes using machine learning approaches. Sci. Rep. 2020, 10, 4426. [Google Scholar] [CrossRef]
- Cortes, C.; Vapnik, V. Support-vector networks. Mach. Learn. 1995, 20, 273–297. [Google Scholar] [CrossRef]
- Rasmussen, C.E.; Williams, C.K.I. Gaussian Processes for Machine Learning; MIT Press: Cambridge, MA, USA, 2008. [Google Scholar]
- Quinlan, J.R. Induction of decision trees. Mach. Learn. 1986, 1, 81–106. [Google Scholar] [CrossRef]
- Friedman, J.H. Stochastic gradient boosting. Comput. Stat. Data Anal. 2002, 38, 367–378. [Google Scholar] [CrossRef]
- Sut, N.; Simsek, O. Comparison of regression tree data mining methods for prediction of mortality in head injury. Expert Syst. Appl. 2011, 38, 15534–15539. [Google Scholar] [CrossRef]
- Breiman, L. Random forests. Mach. Learn. 2001, 45, 5–32. [Google Scholar] [CrossRef]
- Faber, M.; Johnston, C.; van Weeren, P.R.; Barneveld, A. Repeatability of back kinematics in horses during treadmill locomotion. Equine Vet. J. 2002, 34, 235–241. [Google Scholar] [CrossRef] [PubMed]
- Cano, M.; Vivo, J.; MirÓ, F.; Morales, J.; Galisteo, A. Kinematic characteristics of Andalusian, Arabian and Anglo-Arabian horses: A comparative study. Res. Vet. Sci. 2001, 71, 147–153. [Google Scholar] [CrossRef]
- Robilliard, J.J.; Pfau, T.; Wilson, A.M. Gait characterisation and classification in horses. J. Exp. Biol. 2007, 210, 187–197. [Google Scholar] [CrossRef]
- Gunnarsson, V.; Tijssen, M.; Bjornsdottir, S.; Voskamp, J.; Van Weeren, P.; Back, W.; Rhodin, M.; Persson-Sjodin, E.; Serra Braganca, F. Objective evaluation of stride parameters in the five-gaited Icelandic horse. Comp. Exerc. Physiol. 2018, 14, S52. [Google Scholar] [CrossRef]
- Bosch, S.; Braganca, F.; Marin-Perianu, M.; Marin-Perianu, R.; van der Zwaag, B.J.; Voskamp, J.; Back, W.; van Weeren, P.; Havinga, P. EquiMoves: A Wireless Networked Inertial Measurement System for Objective Examination of Horse Gait. Sensors 2018, 18, 850. [Google Scholar] [CrossRef]
- Glowinski, S.; Łosiński, K.; Kowianski, P.; Waśkow, M.; Bryndal, A.; Grochulska, A. Inertial Sensors as a Tool for Diagnosing Discopathy Lumbosacral Pathologic Gait: A Preliminary Research. Diagnostics 2020, 10, 342. [Google Scholar] [CrossRef]
- OriginGPS-Hornet. Available online: https://origingps.com/product-category/hornet/ (accessed on 25 September 2020).
- Ahmed, N.; Rafiq, J.I.; Islam, M.R. Enhanced Human Activity Recognition Based on Smartphone Sensor Data Using Hybrid Feature Selection Model. Sensors 2020, 20, 317. [Google Scholar] [CrossRef]
- Barwick, J.; Lamb, D.; Dobos, R.; Schneider, D.; Welch, M.; Trotter, M. Predicting Lameness in Sheep Activity Using Tri-Axial Acceleration Signals. Animals 2018, 8, 12. [Google Scholar] [CrossRef]
- Rehman, R.Z.U.; Del Din, S.; Guan, Y.; Yarnall, A.J.; Shi, J.Q.; Rochester, L. Selecting Clinically Relevant Gait Characteristics for Classification of Early Parkinson’s Disease: A Comprehensive Machine Learning Approach. Sci. Rep. 2019, 9, 17269. [Google Scholar] [CrossRef] [PubMed]
- Kamminga, J.W.; Le, D.V.; Meijers, J.P.; Bisby, H.; Meratnia, N.; Havinga, P.J. Robust Sensor-Orientation-Independent Feature Selection for Animal Activity Recognition on Collar Tags. Proc. Acm Interact. Mob. Wearable Ubiquitous Technol. 2018, 2, 1–27. [Google Scholar] [CrossRef]
- Smith, S.W. The Scientist and Engineer’s Guide to Digital Signal Processing; Technical Publishing: San Francisco, CA, USA, 1997. [Google Scholar]
- Peng, J.; Ferguson, S.; Rafferty, K.; Kelly, P. An efficient feature selection method for mobile devices with application to activity recognition. Neurocomputing 2011, 74, 3543–3552. [Google Scholar] [CrossRef]
- Pudil, P.; Novovičová, J.; Kittler, J. Floating search methods in feature selection. Pattern Recognit. Lett. 1994, 15, 1119–1125. [Google Scholar] [CrossRef]
- Mannini, A.; Sabatini, A.M. Walking speed estimation using foot-mounted inertial sensors: Comparing machine learning and strap-down integration methods. Med. Eng. Phys. 2014, 36, 1312–1321. [Google Scholar] [CrossRef]
- Braganca, F.; Broomé, S.; Rhodin, M.; Bjornsdottir, S.; Gunnarsson, V.; Voskamp, J.; Persson-Sjodin, E.; Back, W.; Lindgren, G.; Novoa-Bravo, M.; et al. Improving gait classification in horses by using inertial measurement unit (IMU) generated data and machine learning. Sci. Rep. 2020, 10, 17785. [Google Scholar] [CrossRef]
- Pfau, T.; Boultbee, H.; Davis, H.; Walker, A.; Rhodin, M. Agreement between two inertial sensor gait analysis systems for lameness examinations in horses. Equine Vet. Educ. 2016, 28, 203–208. [Google Scholar] [CrossRef]
- Thompson, R.; Kyriazakis, I.; Holden, A.; Olivier, P.; Ploetz, T. Dancing with Horses: Automated Quality Feedback for Dressage Riders. In Proceedings of the 2015 ACM International Joint Conference on Pervasive and Ubiquitous Computing, Umeda, Osaka, Japan, 9–11 September 2015; pp. 325–336. [Google Scholar] [CrossRef]
- Keegan, K.G.; Kramer, J.; Yonezawa, Y.; Maki, H.; Pai, P.F.; Dent, E.V.; Kellerman, T.E.; Wilson, D.A.; Reed, S.K. Assessment of repeatability of a wireless, inertial sensor-based lameness evaluation system for horses. Am. J. Vet. Res. 2011, 72, 1156–1163. [Google Scholar] [CrossRef]
- Bragança, F.M.; Bosch, S.; Voskamp, J.P.; Marin-Perianu, M.; Van der Zwaag, B.J.; Vernooij, J.C.M.; van Weeren, P.R.; Back, W. Validation of distal limb mounted inertial measurement unit sensors for stride detection in Warmblood horses at walk and trot. Equine Vet. J. 2017, 49, 545–551. [Google Scholar] [CrossRef]
- Clayton, H. Comparison of the stride kinematics of the collected, medium, and extended walks in horses. Am. J. Vet. Res. 1995, 56, 849–852. [Google Scholar]
- Clayton, H.M. Comparison of the stride kinematics of the collected, working, medium and extended trot in horses. Equine Vet. J. 1994, 26, 230–234. [Google Scholar] [CrossRef] [PubMed]
- Schmutz, A.; Chèze, L.; Jacques, J.; Martin, P. A method to estimate horse speed per stride from one IMU with a machine learning method. Sensors 2020, 20, 518. [Google Scholar] [CrossRef] [PubMed]
- Byun, S.; Lee, H.J.; Han, J.W.; Kim, J.S.; Choi, E.; Kim, K.W. Walking-speed estimation using a single inertial measurement unit for the older adults. PLoS ONE 2019, 14, e0227075. [Google Scholar] [CrossRef] [PubMed]
- Zihajehzadeh, S.; Park, E.J. Regression model-based walking speed estimation using wrist-worn inertial sensor. PLoS ONE 2016, 11, e0165211. [Google Scholar] [CrossRef] [PubMed]
Publisher’s Note: MDPI stays neutral with regard to jurisdictional claims in published maps and institutional affiliations. |
© 2021 by the authors. Licensee MDPI, Basel, Switzerland. This article is an open access article distributed under the terms and conditions of the Creative Commons Attribution (CC BY) license (http://creativecommons.org/licenses/by/4.0/).