Brain Asymmetry Detection and Machine Learning Classification for Diagnosis of Early Dementia †


Abstract
1. Introduction
2. Background of the Study
3. Materials and Methods
3.1. Data Repositories and Participants
3.2. Research Methods
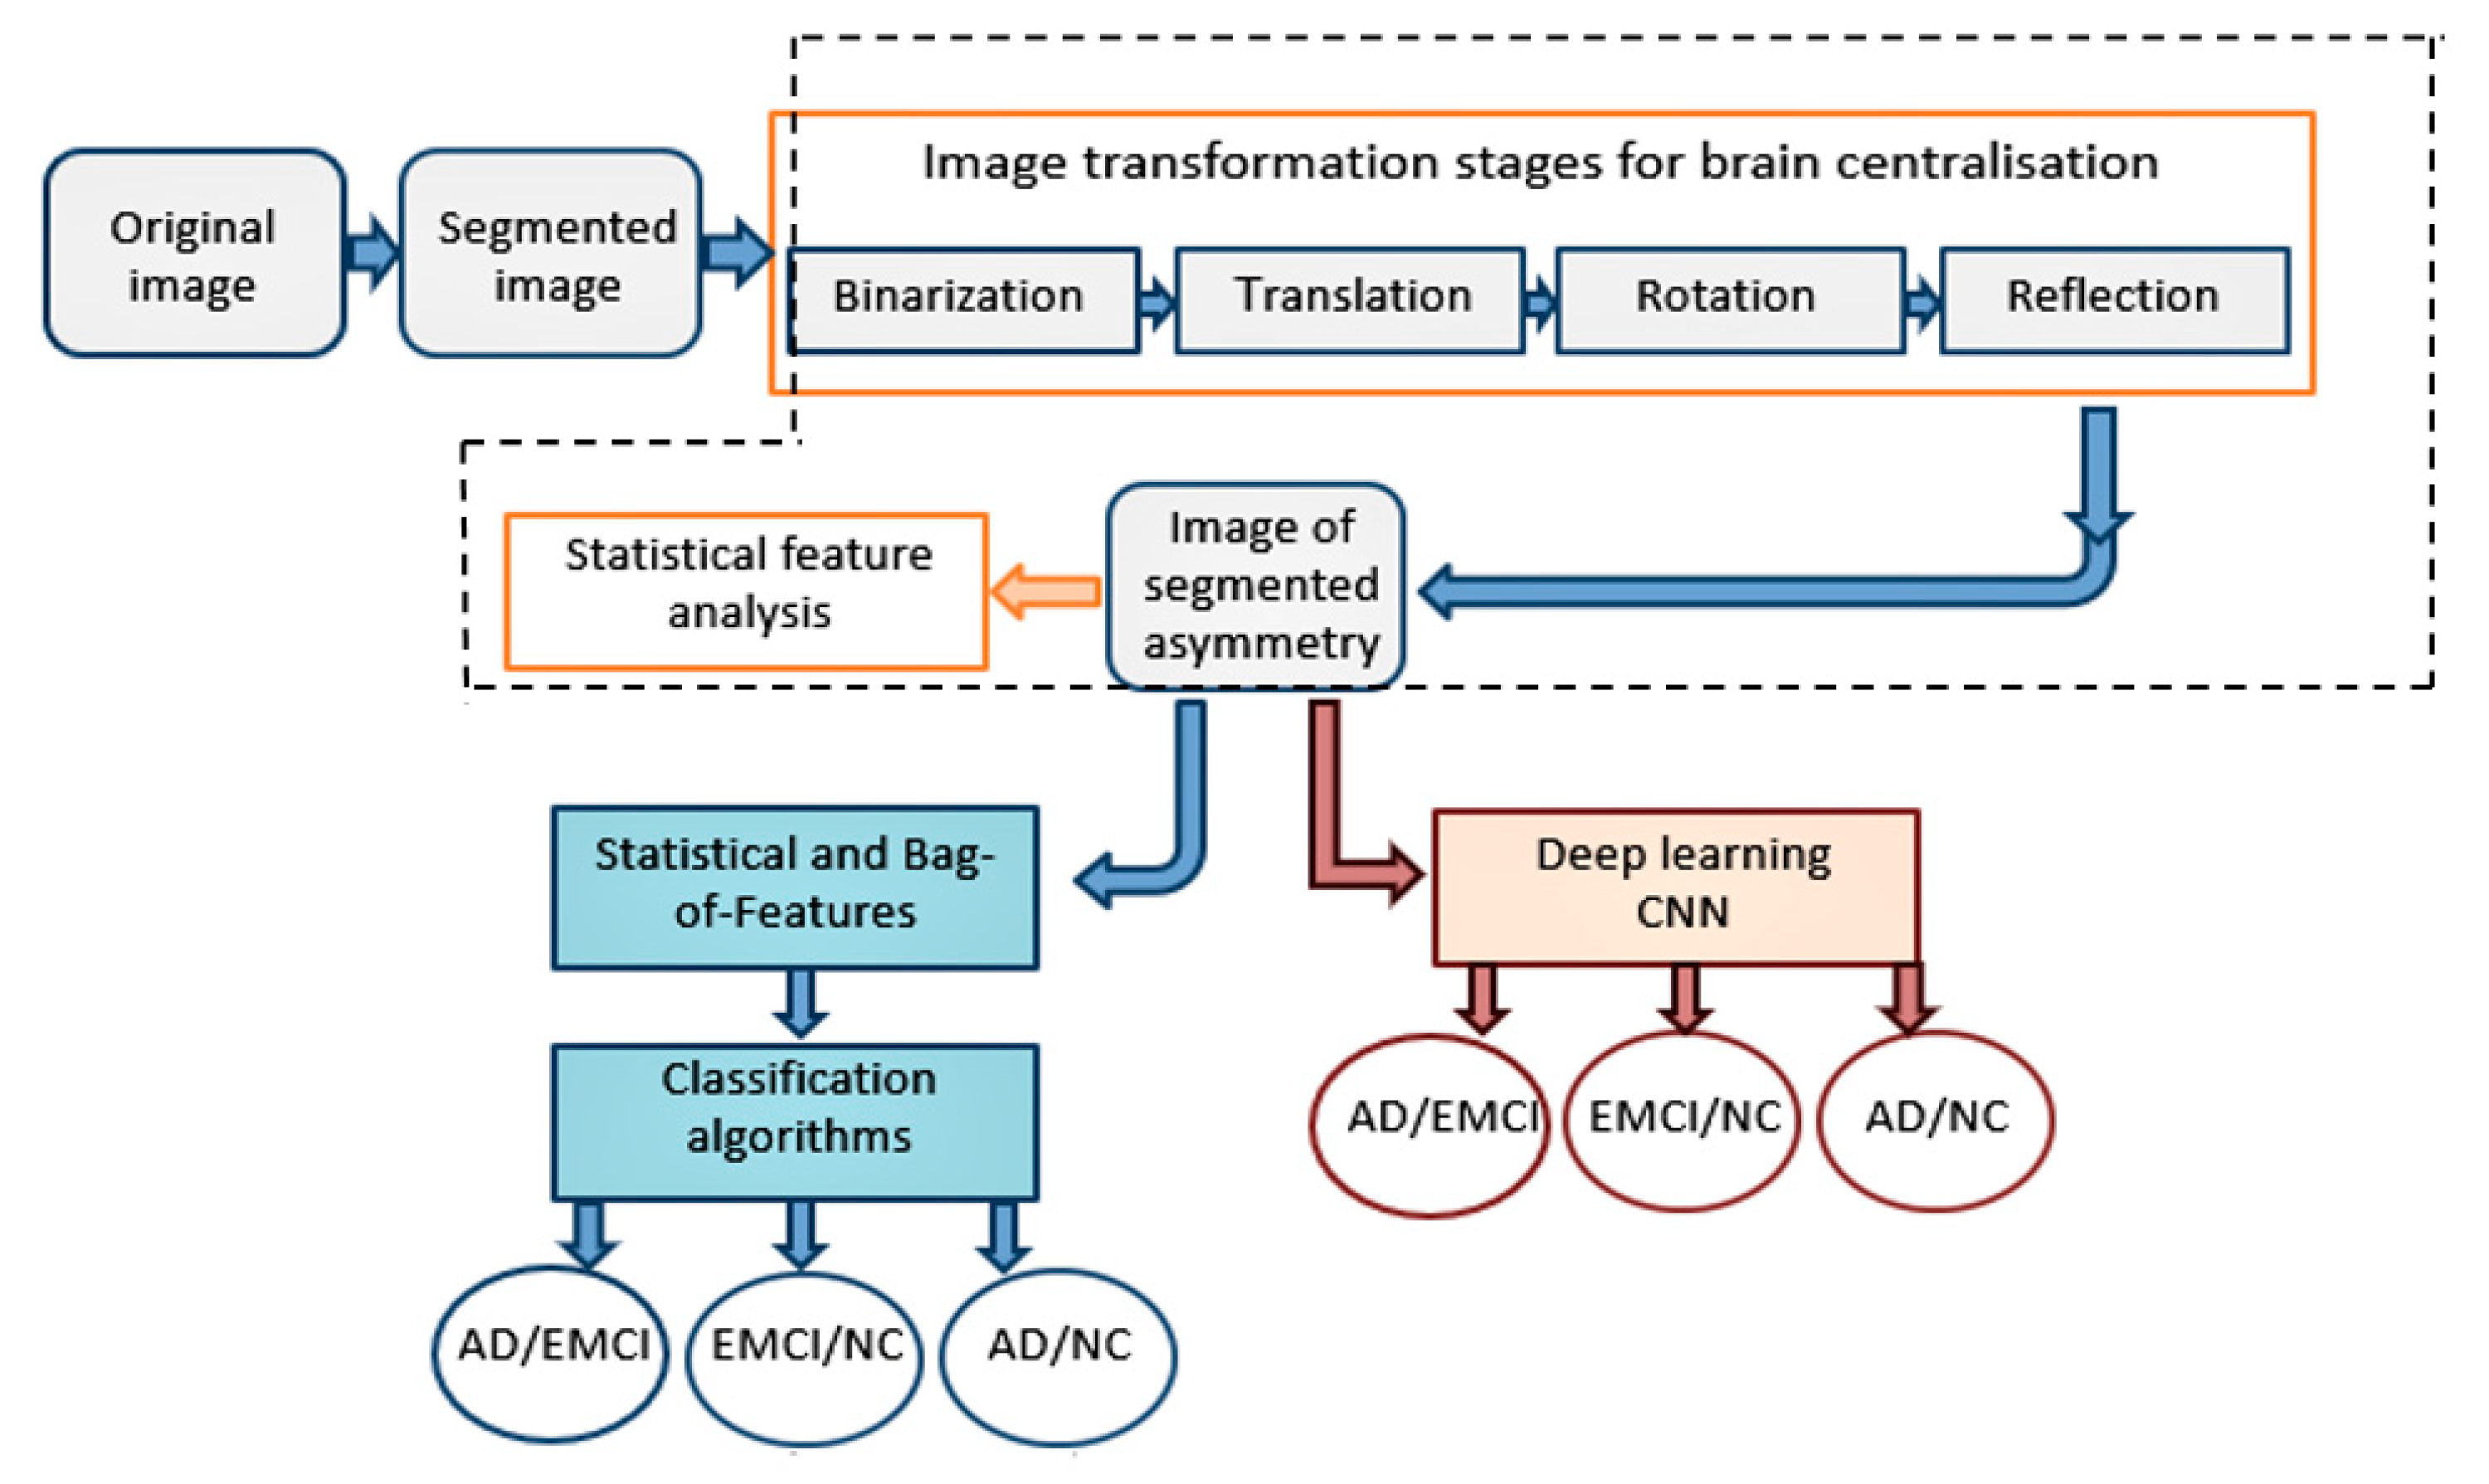
3.2.1. Image Preprocessing
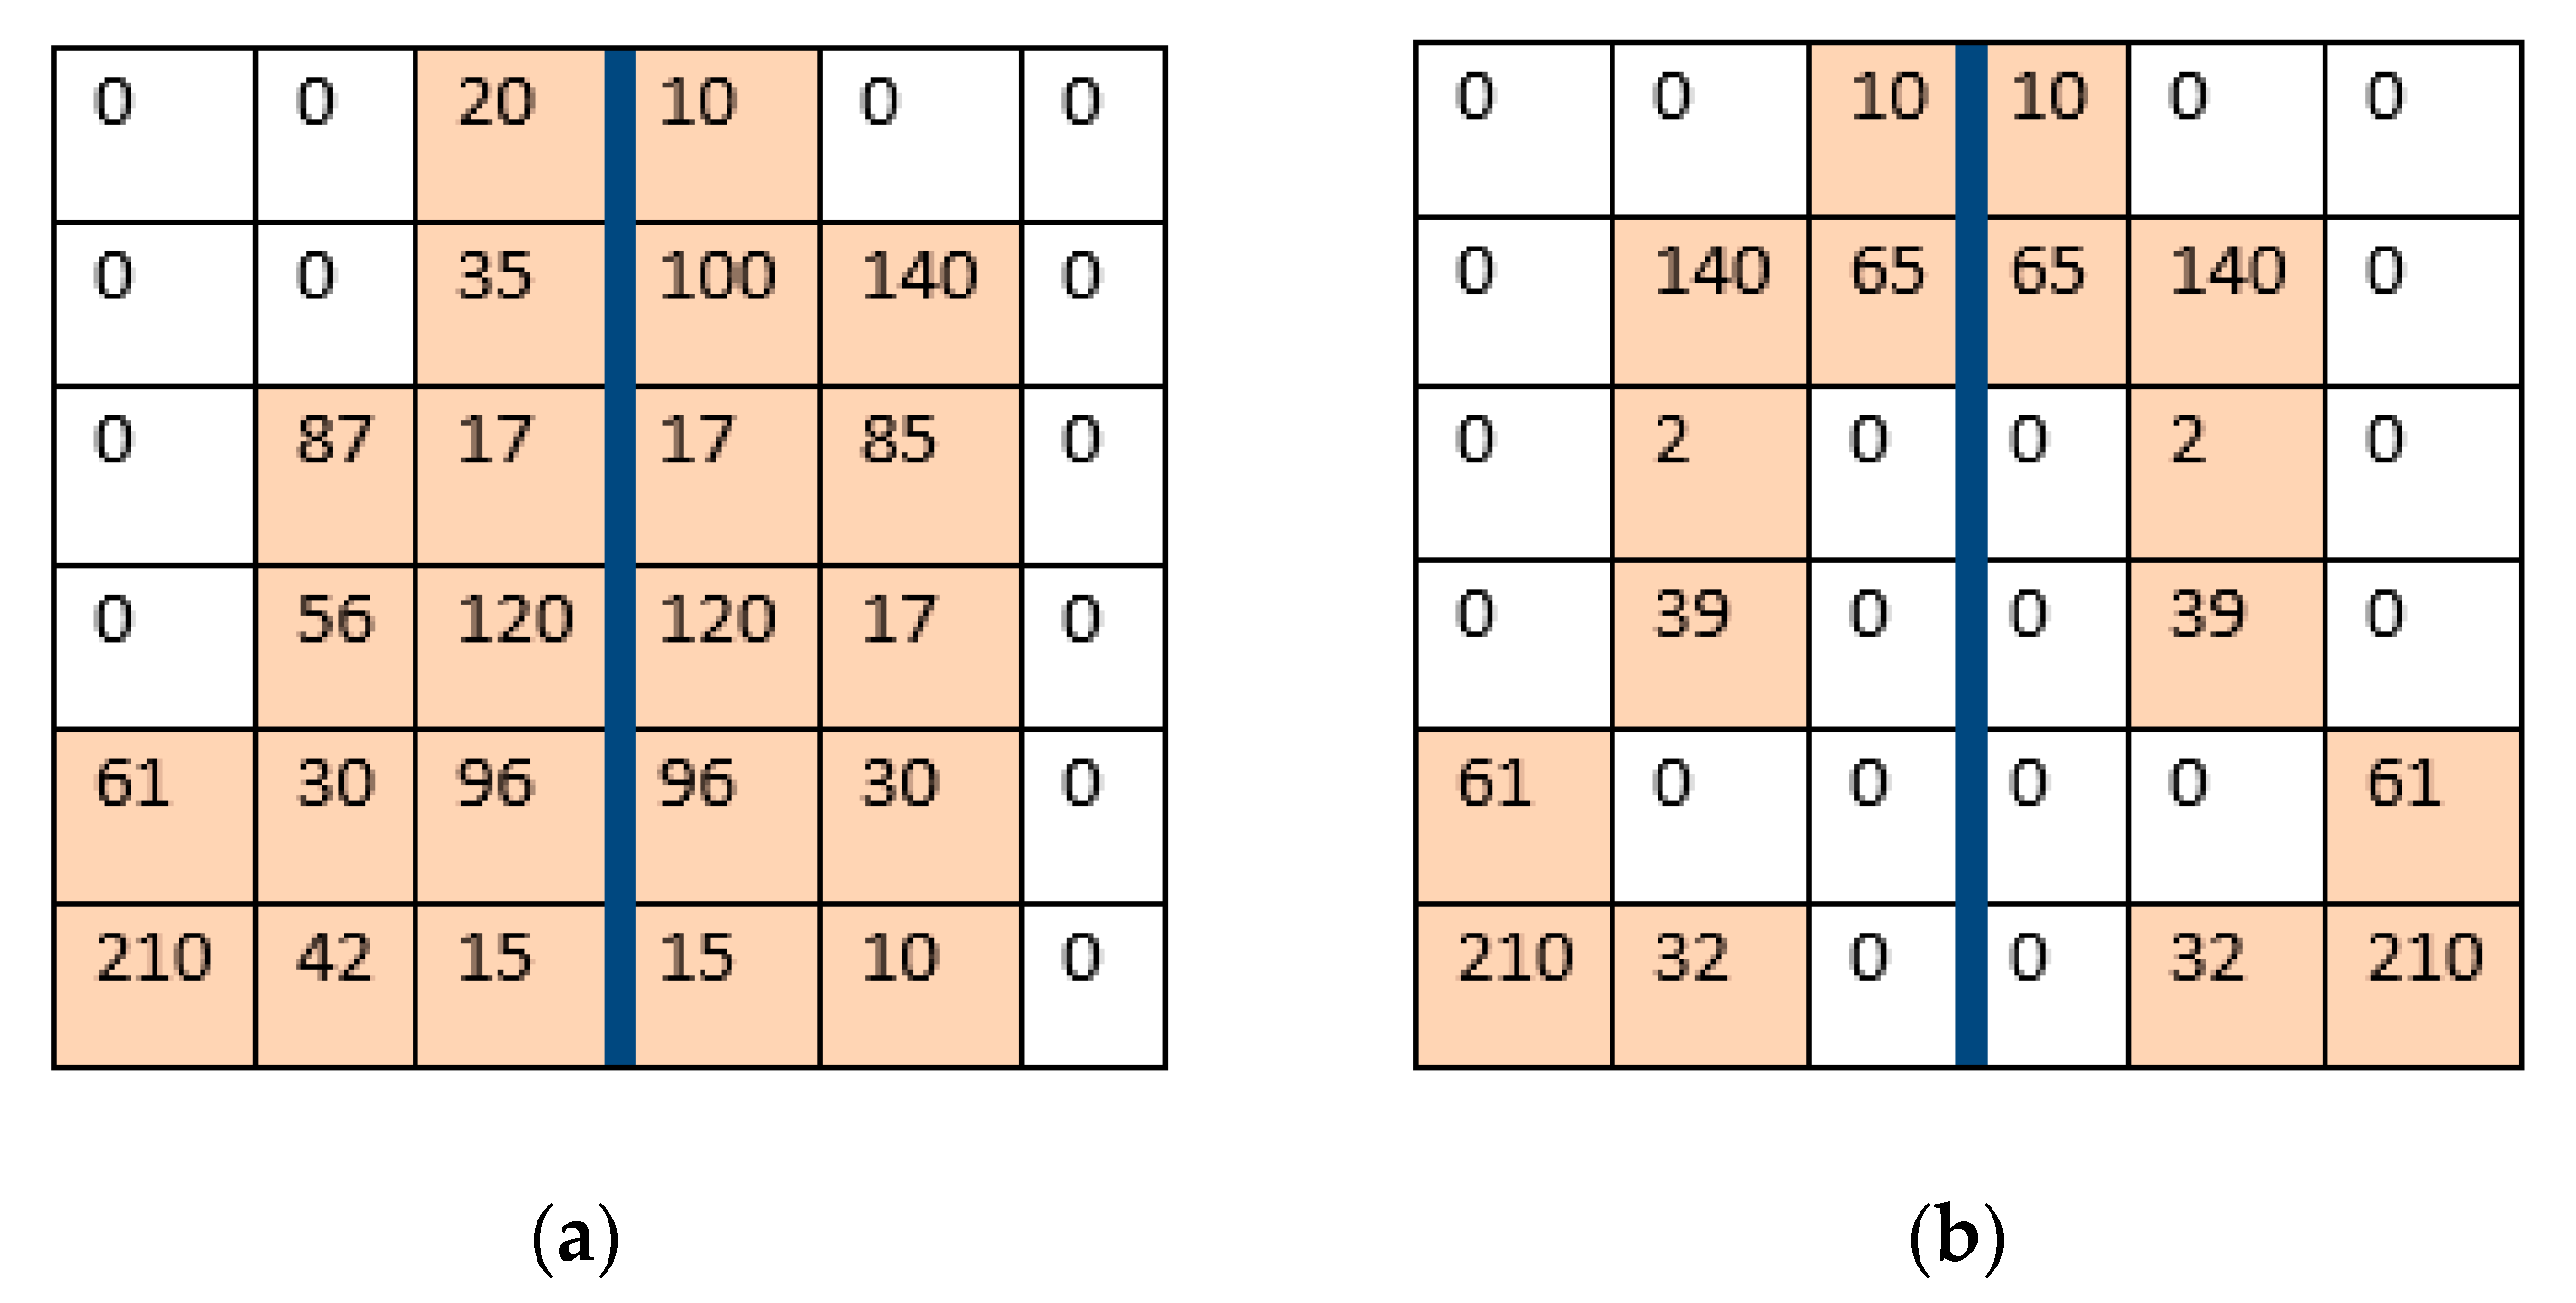
3.2.2. Detection of Image Asymmetry
3.2.3. Generating Asymmetry Features
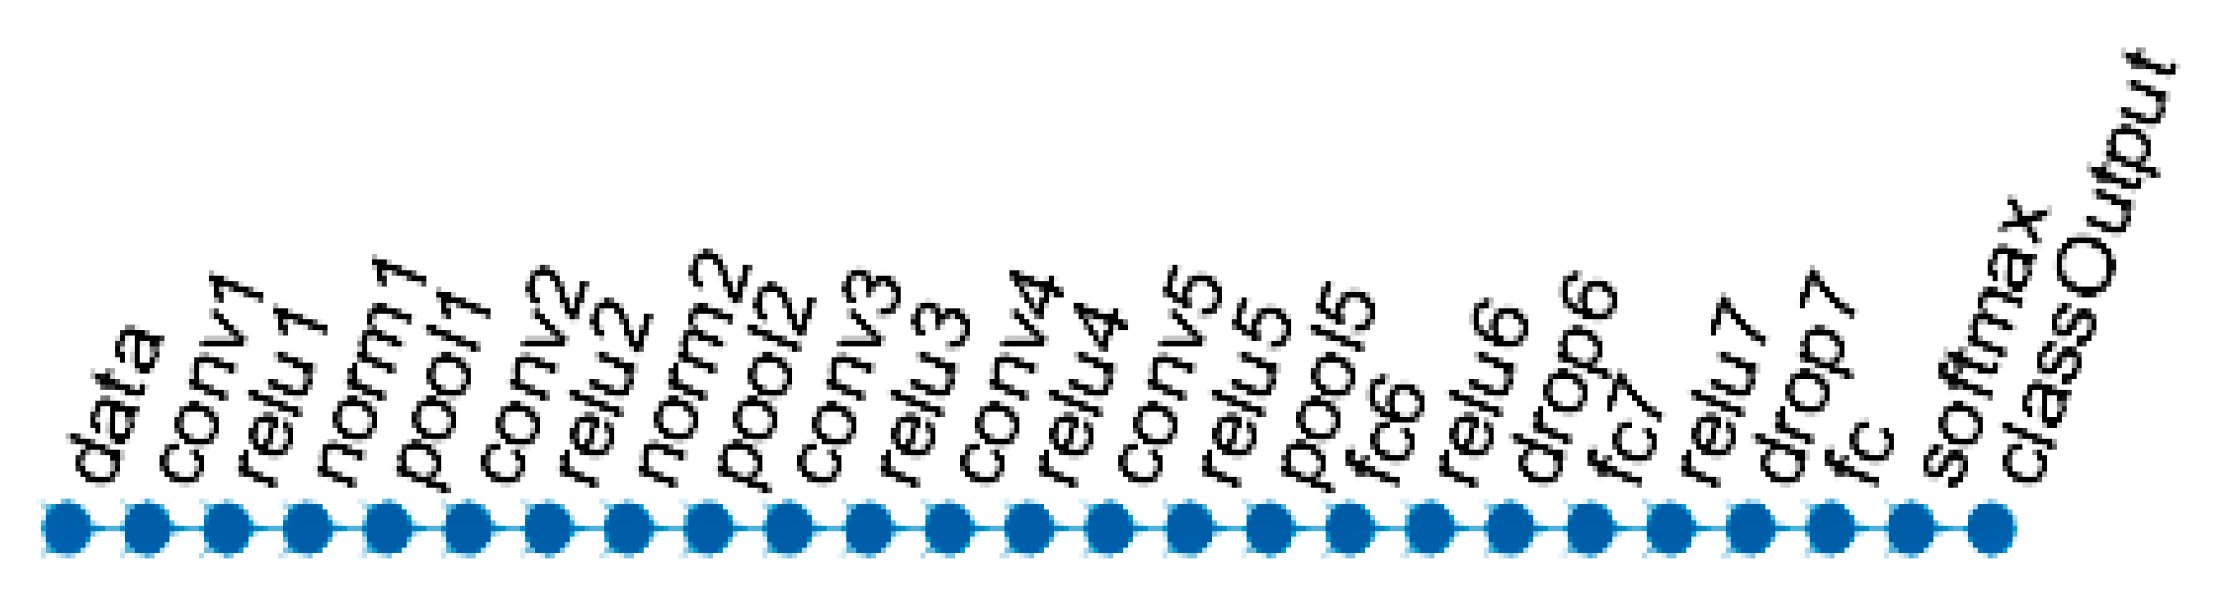
3.2.4. Classification Using Machine Learning
4. Experiments and Results
5. Discussion and Conclusions
Supplementary Materials
Author Contributions
Funding
Institutional Review Board Statement
Informed Consent Statement
Data Availability Statement
Acknowledgments
Conflicts of Interest
References
- Thabtah, F.; Mampusti, E.; Peebles, D.; Herradura, R. A mobile-based screening system for data analyses of early dementia traits detection. J. Med. Syst. 2020, 44, 24. [Google Scholar] [CrossRef] [PubMed]
- Yanase, J.; Triantaphyllou, E. A systematic survey of computer-aided diagnosis in medicine: Past and present developments. Expert Syst. Appl. 2019, 138, 112821. [Google Scholar] [CrossRef]
- Lazli, L.; Boukadoum, M.; Mohamed, O.A. A Survey on Computer-Aided Diagnosis of Brain Disorders through MRI Based on Machine Learning and Data Mining Methodologies with an Emphasis on Alzheimer Disease Diagnosis and the Contribution of the Multimodal Fusion. Appl. Sci. 2020, 10, 1894. [Google Scholar] [CrossRef]
- Toga, A.W.; Thompson, P.M. Mapping brain asymmetry. Nat. Rev. Neurosci. 2003, 4, 37. [Google Scholar] [CrossRef] [PubMed]
- McManus, C. Half a century of handedness research: Myths, truths; fictions, facts; backwards, but mostly forwards. Brain Neurosci. Adv. 2019, 3. [Google Scholar] [CrossRef] [PubMed]
- Bitar, M.; Barry, G. Multiple innovations in genetic and epigenetic mechanisms cooperate to underpin human brain evolution. Mol. Biol. Evol. 2018, 35, 263–268. [Google Scholar] [CrossRef]
- Isles, A.R. Epigenetics, chromatin and brain development and function. Brain Neurosci. Adv. 2018, 2. [Google Scholar] [CrossRef]
- Tomasi, D.; Volkow, N.D. Laterality patterns of brain functional connectivity: Gender effects. Cereb. Cortex 2012, 22, 1455–1462. [Google Scholar] [CrossRef]
- Cabeza, R. Hemispheric asymmetry reduction in older adults: The HAROLD model. Psychol. Aging 2002, 17, 85. [Google Scholar] [CrossRef]
- Cabeza, R.; Daselaar, S.M.; Dolcos, F.; Prince, S.E.; Budde, M.; Nyberg, L. Task-independent and task-specific age effects on brain activity during working memory, visual attention and episodic retrieval. Cereb. Cortex 2004, 14, 364–375. [Google Scholar] [CrossRef]
- Kalavathi, P.; Senthamilselvi, M.; Prasath, V.B. Review of computational methods on brain symmetric and asymmetric analysis from neuroimaging techniques. Technologies 2017, 5, 16. [Google Scholar] [CrossRef]
- Yang, C.; Zhong, S.; Zhou, X.; Wei, L.; Wang, L.; Nie, S. The abnormality of topological asymmetry between hemispheric brain white matter networks in Alzheimer’s disease and mild cognitive impairment. Front. Aging Neurosci. 2017, 9, 261. [Google Scholar] [CrossRef] [PubMed]
- Liu, H.; Zhang, L.; Xi, Q.; Zhao, X.; Wang, F.; Wang, X.; Men, W.; Lin, Q. Changes in brain lateralization in patients with mild cognitive impairment and Alzheimer’s disease: A resting-state functional magnetic resonance study from Alzheimer’s disease neuroimaging initiative. Front. Neurol. 2018, 9, 3. [Google Scholar] [CrossRef] [PubMed]
- Kim, J.H.; Lee, J.W.; Kim, G.H.; Roh, J.H.; Kim, M.J.; Seo, S.W.; Kim, S.T.; Jeon, S.; Lee, J.M.; Heilman, K.M.; et al. Cortical asymmetries in normal, mild cognitive impairment, and Alzheimer’s disease. Neurobiol. Aging 2012, 33, 1959–1966. [Google Scholar] [CrossRef] [PubMed]
- Wachinger, C.; Salat, D.H.; Weiner, M.; Reuter, M. Alzheimer’s Disease Neuroimaging Initiative. Whole-brain analysis reveals increased neuroanatomical asymmetries in dementia for hippocampus and amygdala. Brain 2016, 139, 3253–3266. [Google Scholar] [CrossRef] [PubMed]
- Wachinger, C.; Golland, P.; Kremen, W.; Fischl, B.; Reuter, M. Alzheimer’s Disease Neuroimaging Initiative. BrainPrint: A discriminative characterization of brain morphology. NeuroImage 2015, 109, 232–248. [Google Scholar] [CrossRef] [PubMed]
- Despotović, I.; Goossens, B.; Philips, W. MRI segmentation of the human brain: Challenges, methods, and applications. Comput. Math. Methods Med 2015. [Google Scholar] [CrossRef] [PubMed]
- Zheng, A.; Casari, A. Feature Engineering for Machine Learning: Principles and Techniques for Data Scientists; O’Reilly Media, Inc.: Newton, MA, USA, 2018. [Google Scholar]
- García, S.; Ramírez-Gallego, S.; Luengo, J.; Benítez, J.M.; Herrera, F. Big data preprocessing: Methods and prospects. Big Data Anal. 2016, 1, 9. [Google Scholar] [CrossRef]
- Zhou, K.; He, W.; Xu, Y.; Xiong, G.; Cai, J. Feature selection and transfer learning for Alzheimer’s disease clinical diagnosis. Appl. Sci. 2018, 8, 1372. [Google Scholar] [CrossRef]
- Beheshti, I.; Demirel, H.; Matsuda, H.; Alzheimer’s Disease Neuroimaging Initiative. Classification of Alzheimer’s disease and prediction of mild cognitive impairment-to-Alzheimer’s conversion from structural magnetic resource imaging using feature ranking and a genetic algorithm. Comput. Biol. Med. 2017, 83, 109–119. [Google Scholar] [CrossRef]
- Ijaz, M.F.; Attique, M.; Son, Y. Data-Driven Cervical Cancer Prediction Model with Outlier Detection and Over-Sampling Methods. Sensors 2020, 20, 2809. [Google Scholar] [CrossRef] [PubMed]
- Ali, F.; El-Sappagh, S.; Islam, S.R.; Ali, A.; Attique, M.; Imran, M.; Kwak, K.S. An intelligent healthcare monitoring framework using wearable sensors and social networking data. Future Gener. Comput. Syst. 2020, 114, 23–43. [Google Scholar] [CrossRef]
- Khoshgoftaar, T.; Dittman, D.; Wald, R.; Fazelpour, A. First order statistics based feature selection: A diverse and powerful family of feature seleciton techniques. In Proceedings of the 2012 11th International Conference on Machine Learning and Applications (ICMLA 2012), Boca Raton, FL, USA, 12–15 December 2012; Volume 2, pp. 151–157. [Google Scholar]
- Welling, M. Fisher Linear Discriminant Analysis|| University of Toronto. Technical Note. 2005. Available online: https://www.cs.huji.ac.il/~csip/Fisher-LDA.pdf (accessed on 23 April 2019).
- Lama, R.K.; Gwak, J.; Park, J.S.; Lee, S.W. Diagnosis of Alzheimer’s disease based on structural MRI images using a regularized extreme learning machine and PCA features. J. Healthc. Eng. 2017, 1, 1–11. [Google Scholar] [CrossRef] [PubMed]
- Abdi, H.; Williams, L.J. Principal Component Analysis. Wiley Interdiscip. Rev. Comput. Stat. 2010, 2, 433–459. [Google Scholar] [CrossRef]
- Glozman, T.; Le, R.K. Classification of Alzheimer’s Disease Based on White Matter Architecture. 2014. Available online: http://cs229.stanford.edu/proj2014/Tanya%20Glozman,%20Rosemary%20Le,%20Classification%20of%20Alzheimer%27s%20Disease%20Based%20on%20White%20Matter%20Attributes.pdf (accessed on 23 April 2019).
- Le, N.Q.K.; Do, D.T.; Hung, T.N.K.; Lam, L.H.T.; Huynh, T.T.; Nguyen, N.T.K. A computational framework based on ensemble deep neural networks for essential genes identification. Int. J. Mol. Sci. 2020, 21, 9070. [Google Scholar] [CrossRef]
- Moradi, E.; Pepe, A.; Gaser, C.; Huttunen, H.; Tohka, J.; Alzheimer’s Disease Neuroimaging Initiative. Machine learning framework for early MRI-based Alzheimer’s conversion prediction in MCI subjects. Neuroimage 2015, 104, 398–412. [Google Scholar] [CrossRef]
- Breiman, L. Random forests. Mach. Learn. 2001, 45, 5–32. [Google Scholar] [CrossRef]
- Grassi, M.; Rouleaux, N.; Caldirola, D.; Loewenstein, D.; Schruers, K.; Perna, G.; Dumontier, M. A Novel Ensemble-Based Machine Learning Algorithm to Predict the Conversion from Mild Cognitive Impairment to Alzheimer’s Disease Using Socio-demographic Characteristics, Clinical Information and Neuropsychological Measures. Front. Neurol. 2019, 10, 756. [Google Scholar] [CrossRef]
- Basaia, S.; Agosta, F.; Wagner, L.; Canu, E.; Magnani, G.; Santangelo, R.; Filippi, M.; Alzheimer’s Disease Neuroimaging Initiative. Automated classification of Alzheimer’s disease and mild cognitive impairment using a single MRI and deep neural networks. Neuroimage Clin. 2019, 21, 101645. [Google Scholar] [CrossRef]
- Stamate, D.; Smith, R.; Tsygancov, R.; Vorobev, R.; Langham, J.; Stahl, D.; Reeves, D. Applying Deep Learning to Predicting Dementia and Mild Cognitive Impairment. In Proceedings of the AIAI International Conference on Artificial Intelligence Applications and Innovations, Halkidiki, Greece, 5–7 June 2020; Springer: Cham, Switzerland, 2020; pp. 308–319. [Google Scholar]
- AnalyzeDirect. Available online: https://analyzedirect.com/analyze14/ (accessed on 15 December 2020).
- FreeSurfer. Available online: https://surfer.nmr.mgh.harvard.edu/ (accessed on 15 December 2020).
- Ruppert, G.C.; Teverovskiy, L.; Yu, C.P.; Falcao, A.X.; Liu, Y. A new symmetry-based method for mid-sagittal plane extraction in neuroimages. In Proceedings of the 2011 IEEE International Symposium on Biomedical Imaging: From Nano to Macro (ISBI 2011), Chicago, IL, USA, 30 March–2 April 2011; pp. 285–288. [Google Scholar]
- Liu, Y.; Collins, R.T.; Rothfus, W.E. Robust midsagittal plane extraction from normal and pathological 3-D neuroradiology images. IEEE Trans. Med. Imaging 2001, 20, 175–192. [Google Scholar]
- Teverovskiy, L.; Li, Y. Truly 3D midsagittal plane extraction for robust neuroimage registration. In Proceedings of the 3rd IEEE International Symposium on Biomedical Imaging: From Nano to Macro, Arlington, VA, USA, 6–9 April 2006; pp. 860–863. [Google Scholar]
- Michalak, H.; Okarma, K. Improvement of image binarization methods using image preprocessing with local entropy filtering for alphanumerical character recognition purposes. Entropy 2019, 21, 562. [Google Scholar] [CrossRef] [PubMed]
- Di Ruberto, C.; Fodde, G. Evaluation of Statistical Features for Medical Image Retrieval. In Proceedings of the International Conference on Image Analysis and Processing—ICIAP 2013, Naples, Italy, 9–13 September 2013; Springer: Berlin/Heidelberg, Germany, 2013; pp. 552–561. [Google Scholar]
- Wang, Z.; Bovik, A.C.; Sheikh, H.R.; Simoncelli, E.P. Image quality assessment: From error measurement to structural similarity. IEEE Trans. Image Process. 2004, 13, 600–612. [Google Scholar] [CrossRef] [PubMed]
- Kumar, V.; Gupta, P. Importance of statistical measures in digital image processing. Int. J. Emerg. Technol. Adv. Eng. 2012, 2, 56–62. [Google Scholar]
- Esmael, B.; Arnaout, A.; Fruhwirth, R.K.; Thonhauser, G. A statistical feature-based approach for operations recognition in drilling time series. Int. J. Comput. Inf. Syst. Ind. Manag. Appl. 2015, 5, 454–461. [Google Scholar]
- Yang, X.; Tridandapani, S.; Beitler, J.J.; Yu, D.S.; Yoshida, E.J.; Curran, W.J.; Liu, T. Ultrasound GLCM texture analysis of radiation-induced parotid-gland injury in head-and-neck cancer radiotherapy: An in vivo study of late toxicity. Med. Phys. 2012, 39, 5732–5739. [Google Scholar] [CrossRef]
- Lee, C.; Zhang, A.; Yu, B.; Park, S. Comparison study between RMS and edge detection image processing algorithms for a pulsed laser UWPI (Ultrasonic wave propagation imaging)-based NDT technique. Sensors 2017, 17, 1224. [Google Scholar] [CrossRef]
- Malik, F.; Baharudin, B. The statistical quantized histogram texture features analysis for image retrieval based on median and laplacian filters in the dct domain. Int. Arab J. Inf. Technol. 2013, 10, 1–9. [Google Scholar]
- Ho, A.D.; Yu, C.C. Descriptive statistics for modern test score distributions: Skewness, kurtosis, discreteness, and ceiling effects. Educ. Psychol. Meas. 2015, 75, 365–388. [Google Scholar] [CrossRef]
- Kalaiselvi, T.; Nagaraja, P. An automatic segmentation of brain tumor from MRI scans through wavelet transformations. Int. J. Image Graph. Signal Process. 2016, 8, 59. [Google Scholar]
- Usman, K.; Rajpoot, K. Brain tumor classification from multi-modality MRI using wavelets and machine learning. Pattern Anal. Appl. 2017, 20, 871–881. [Google Scholar] [CrossRef]
- O’Hara, S.; Draper, B.A. Introduction to the bag of features paradigm for image classification and retrieval. arXiv 2011, arXiv:1101.3354. [Google Scholar]
- Rueda, A.; Arevalo, J.; Cruz, A.; Romero, E.; González, F.A. Bag of features for automatic classification of Alzheimer’s disease in magnetic resonance images. In Proceedings of the CIARP 2012 17th Iberoamerican Congress on Pattern Recognition, Buenos Aires, Argentina, 3–6 September 2012; Springer: Berlin/Heidelberg, Germany, 2012; pp. 559–566. [Google Scholar]
- Le, X.; Gonzalez, R. Pattern-based corner detection algorithm. In Proceedings of the 2009 6th International Symposium on Image and Signal Processing and Analysis, Salzburg, Austria, 16–18 September 2009; pp. 238–243. [Google Scholar]
- Bay, H.; Ess, A.; Tuytelaars, T.; Van Gool, L. Speeded-up robust features (SURF). Comput. Vis. Image Underst. 2008, 110, 346–359. [Google Scholar] [CrossRef]
- Bair, E. Semi-supervised clustering methods. Wiley Interdiscip. Rev. Comput. Stat. 2013, 5, 349–361. [Google Scholar] [CrossRef]
- Lindholm, A.; Wahlström, N.; Lindsten, F.; Schön, T.B. Supervised Machine Learning. Lecture Notes for the Statistical Machine Learning Course. Available online: https://mwns.co/blog/wp-content/uploads/2020/01/Supervised-Machine-Learning.pdf (accessed on 15 December 2020).
- Ghojogh, B.; Crowley, M. Linear and quadratic discriminant analysis: Tutorial. arXiv 2019, arXiv:1906.02590. [Google Scholar]
- Evgeniou, T.; Pontil, M. Support vector machines: Theory and applications. In Machine Learning and Its Applications, Proceedings of the ACAI 1999 Advanced Course on Artificial Intelligence; Springer: Berlin/Heidelberg, Germany, 1999; pp. 249–257. [Google Scholar]
- Jakkula, V. Tutorial on Support Vector Machine (SVM); School of EECS, Washington State University: Washington, DC, USA, 2006. [Google Scholar]
- Zeidat, N.; Eick, C.F.; Zhao, Z. Supervised Clustering: Algorithms and Applications; University of Houston: Houston, TX, USA, 2005. [Google Scholar]
- Alom, M.Z.; Taha, T.M.; Yakopcic, C.; Westberg, S.; Sidike, P.; Nasrin, M.S.; Van Esesn, B.C.; Awwal, A.A.S.; Asari, V.K. The history began from alexnet: A comprehensive survey on deep learning approaches. arXiv 2018, arXiv:1803.01164. [Google Scholar]
- Krizhevsky, A.; Sutskever, I.; Hinton, G.E. Imagenet classification with deep convolutional neural networks. Commun. ACM 2017, 60, 84–90. [Google Scholar] [CrossRef]
- Yang, S.; Berdine, G. The receiver operating characteristic (ROC) curve. Southwest Respir. Crit. Care Chron. 2017, 5, 34–36. [Google Scholar] [CrossRef]


| Authors | Methods | Results |
|---|---|---|
| Lama et al. [26] | PCA Features + Regularized Extreme Learning Machine (unsupervised classification learning algorithm based on single hidden-layer feedforward neural networks) of MRI (AD, MCI, NC). | Accuracy: 80.32% (for binary classification), 76.61% (for multiclass.) |
| Zhou et al. [20] | Transfer Learning Method (includes Transfer AdaBoost algorithm) + C4.5 classifier of MRI (AD, MCI, NC.) | Accuracy: 85.4% (improves with optimized feature selection). |
| Beheshti et al. [21] | Feature-ranking + genetic algorithm + SVM classifier of MRI (AD, MCI). | Accuracy: 93.01% (stable MCI), 75% (progressive MCI), 78.94% (without feature selection), 94.73% (with feature selection). |
| Moradi et al. [30] | Logic regression + MRI biomarker (based on low-density separation) + SVM + neuropsychological test results + random forest classifier of MRI (AD, MCI, NC). | MRI + cognitive test improves the accuracy by 5.5% (from 76.5% to 82%). |
| Glozman and Le [28] | Feature ranking of the white matter (WM) + SVM (with Linear and RBF Kernels) and Logic Regression of DTI (AD). | Average accuracy: 92%. |
| Grassi et al. [32] | Ensemble algorithm using sociodemographic information, clinical characteristics, neuropsychological measures; supervised ML. (Conversion from MCI to AD). | AUROC: 0.88; sensitivity: 77.7%; specificity: 79.9%. Range of AUROC for proposed models is 0.83–0.90. |
| Basaia et al. [33] | CNNs; classification of AD, stable MCI and converted MCI. Did not use feature engineering. | Accuracy of AD vs. CN: 98%; sMCI vs. cMCI: 75%. |
| Stamate et al. [34] | Deep Learning models: two Multi-Layer Perceptron (MLP1 and MLP2) models and a Convolutional Bidirectional Long Short-Term Memory (ConvBLSTM) model. The features were collected from clinical and genetic data, MRI data, PET data and some additional biospecimen. (Dem, MCI, CN). | The best models (MLP1 and MLP2) show the accuracy 0.86 for Dem, MCI, and CN classes. |
| Model | Hyperparameters |
|---|---|
| NB | Distribution: normal (Gaussian) |
| LD | Discriminant type: linear |
| L-SVM | Kernel function: linear Box constraint level:1 Kernel scale mode: auto Standardize data: true |
| Q-SVM | Kernel function: quadratic Box constraint level:1 Kernel scale mode: auto Standardize data: true |
| C-SVM | Kernel function: cubic Box constraint level:1 Kernel scale mode: auto Standardize data: true |
| MG-SVM | Kernel function: medium Gaussian Box constraint level:1 Kernel scale mode: manual Kernel scale: 32 Standardize data: true |
| Fine-KNN | Number of neighbors: 1 Distance metric: Euclidian Distance weight: equal Standardize data: true |
| Cos-KNN | Number of neighbors: 10 Distance metric: cosine Distance weight: equal Standardize data: true |
| Datasets | NB | LD | L-SVM | Q-SVM | C-SVM | MG-SVM | Fine-KNN | Cos-KNN | CNN |
|---|---|---|---|---|---|---|---|---|---|
| EMCI vs. NC | |||||||||
| Accuracy | 77.0 | 91.0 | 89.0 | 92.5 | 92.5 | 88.0 | 83.0 | 92.0 | 75.0 |
| Sensitivity | 78.0 | 91.0 | 89.0 | 92.0 | 95.0 | 85.0 | 99.0 | 96.0 | 90.0 |
| Specificity | 76.0 | 91.0 | 89.0 | 93.0 | 90.0 | 91.0 | 67.0 | 88.0 | 60.0 |
| AD vs. NC | |||||||||
| Accuracy | 78.5 | 90.0 | 92.0 | 92.5 | 93.0 | 90.0 | 86.5 | 89.5 | 90.0 |
| Sensitivity | 78.0 | 88.0 | 91.0 | 90.0 | 93.0 | 85.0 | 98.0 | 90.0 | 89.0 |
| Specificity | 79.0 | 92.0 | 93.0 | 95.0 | 93.0 | 95.0 | 75.0 | 89.0 | 92.0 |
| AD vs. EMCI | |||||||||
| Accuracy | 78.5 | 83.0 | 80.5 | 86.5 | 86.5 | 80.5 | 79.0 | 80.0 | 81.25 |
| Sensitivity | 75.0 | 85.0 | 84.0 | 89.0 | 88.0 | 84.0 | 78.0 | 83.0 | 72.5 |
| Specificity | 81.0 | 81.0 | 77.0 | 84.0 | 85.0 | 77.0 | 80.0 | 78.0 | 90.0 |
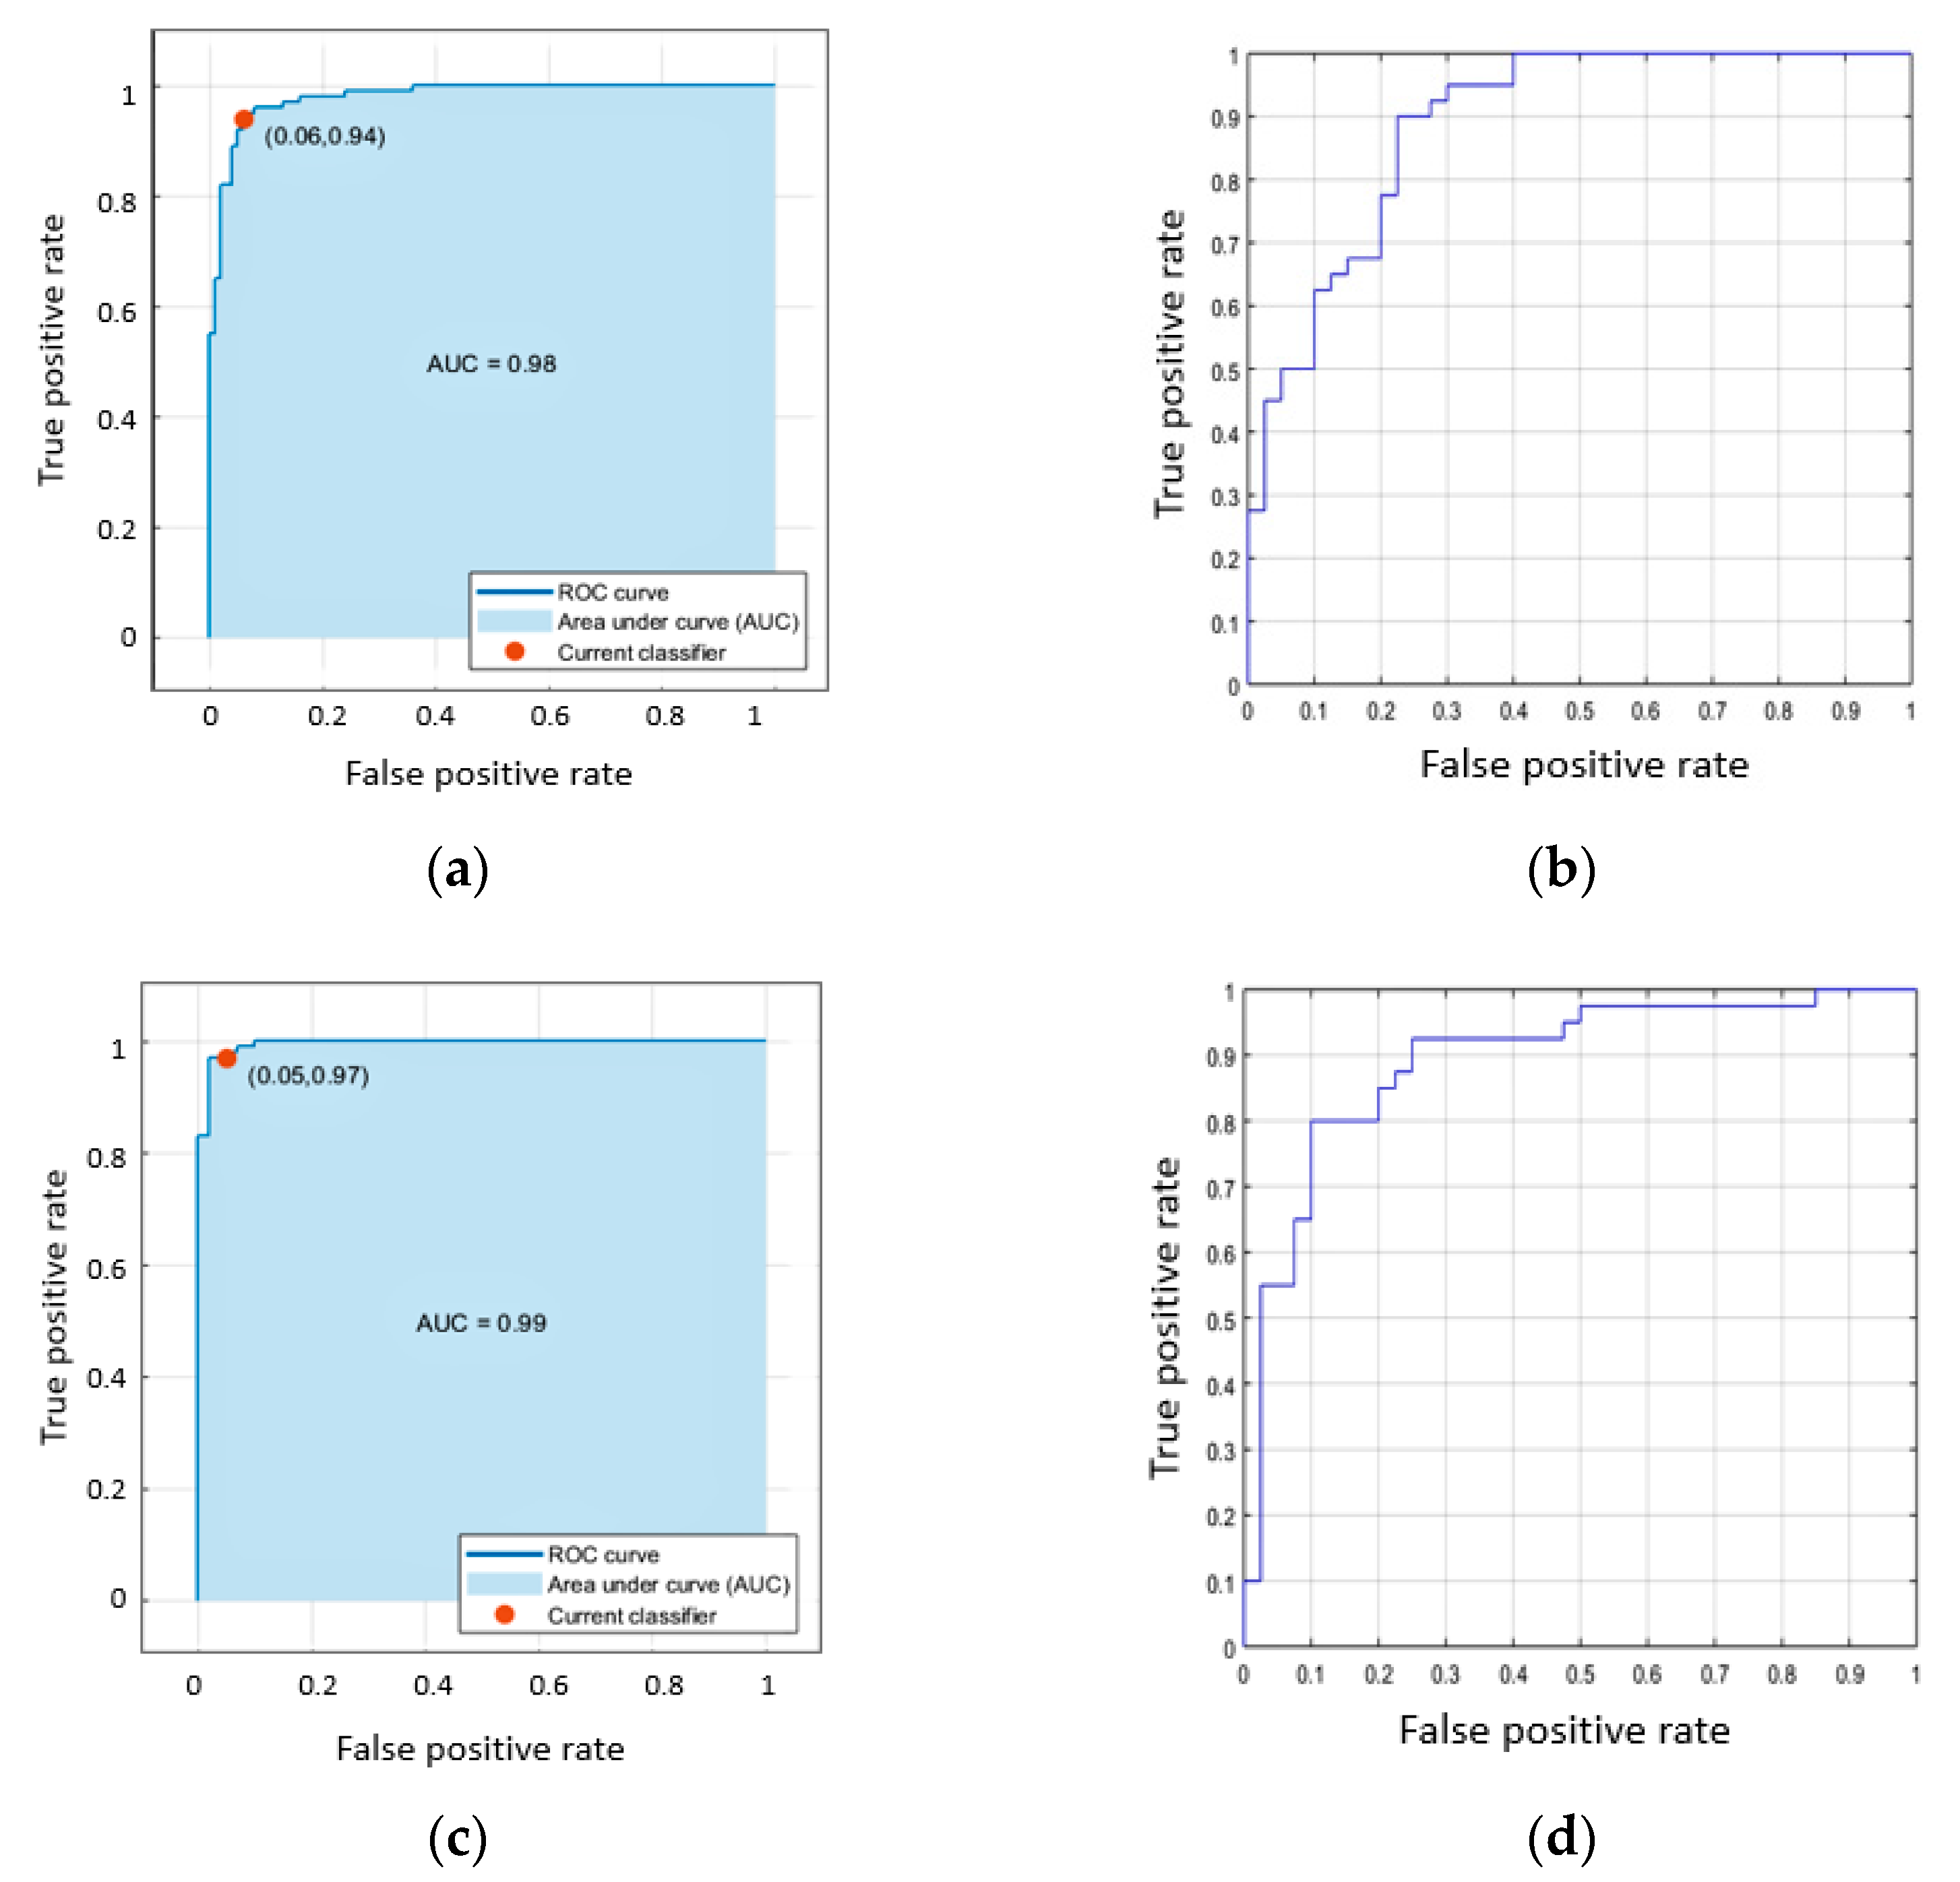
| Datasets | C-SVM | CNN |
|---|---|---|
| EMCI vs. NC | 0.98 | 0.90 |
| AD vs. NC | 0.99 | 0.92 |
| AD vs. EMCI | 0.94 | 0.88 |
Publisher’s Note: MDPI stays neutral with regard to jurisdictional claims in published maps and institutional affiliations. |
© 2021 by the authors. Licensee MDPI, Basel, Switzerland. This article is an open access article distributed under the terms and conditions of the Creative Commons Attribution (CC BY) license (http://creativecommons.org/licenses/by/4.0/).
Share and Cite
Herzog, N.J.; Magoulas, G.D. Brain Asymmetry Detection and Machine Learning Classification for Diagnosis of Early Dementia. Sensors 2021, 21, 778. https://doi.org/10.3390/s21030778
Herzog NJ, Magoulas GD. Brain Asymmetry Detection and Machine Learning Classification for Diagnosis of Early Dementia. Sensors. 2021; 21(3):778. https://doi.org/10.3390/s21030778
Chicago/Turabian StyleHerzog, Nitsa J., and George D. Magoulas. 2021. "Brain Asymmetry Detection and Machine Learning Classification for Diagnosis of Early Dementia" Sensors 21, no. 3: 778. https://doi.org/10.3390/s21030778
APA StyleHerzog, N. J., & Magoulas, G. D. (2021). Brain Asymmetry Detection and Machine Learning Classification for Diagnosis of Early Dementia. Sensors, 21(3), 778. https://doi.org/10.3390/s21030778