This study aims at constructing an effective and feasible fault diagnosis model for permanent magnet DC motors (PMDCMs) by means of multi-segment feature extraction.
4.3. Performance of Multi-Segment Features Model
A total of 1200 data files are obtained in the stage of data collection (see
Section 4.2). Additionally, the feature vector is extracted from each data file in the stage of feature extraction (see
Section 3). Thus, a total of 1200 feature vectors can be obtained, which are randomly divided into two subsets of equal size: the training dataset and test dataset.
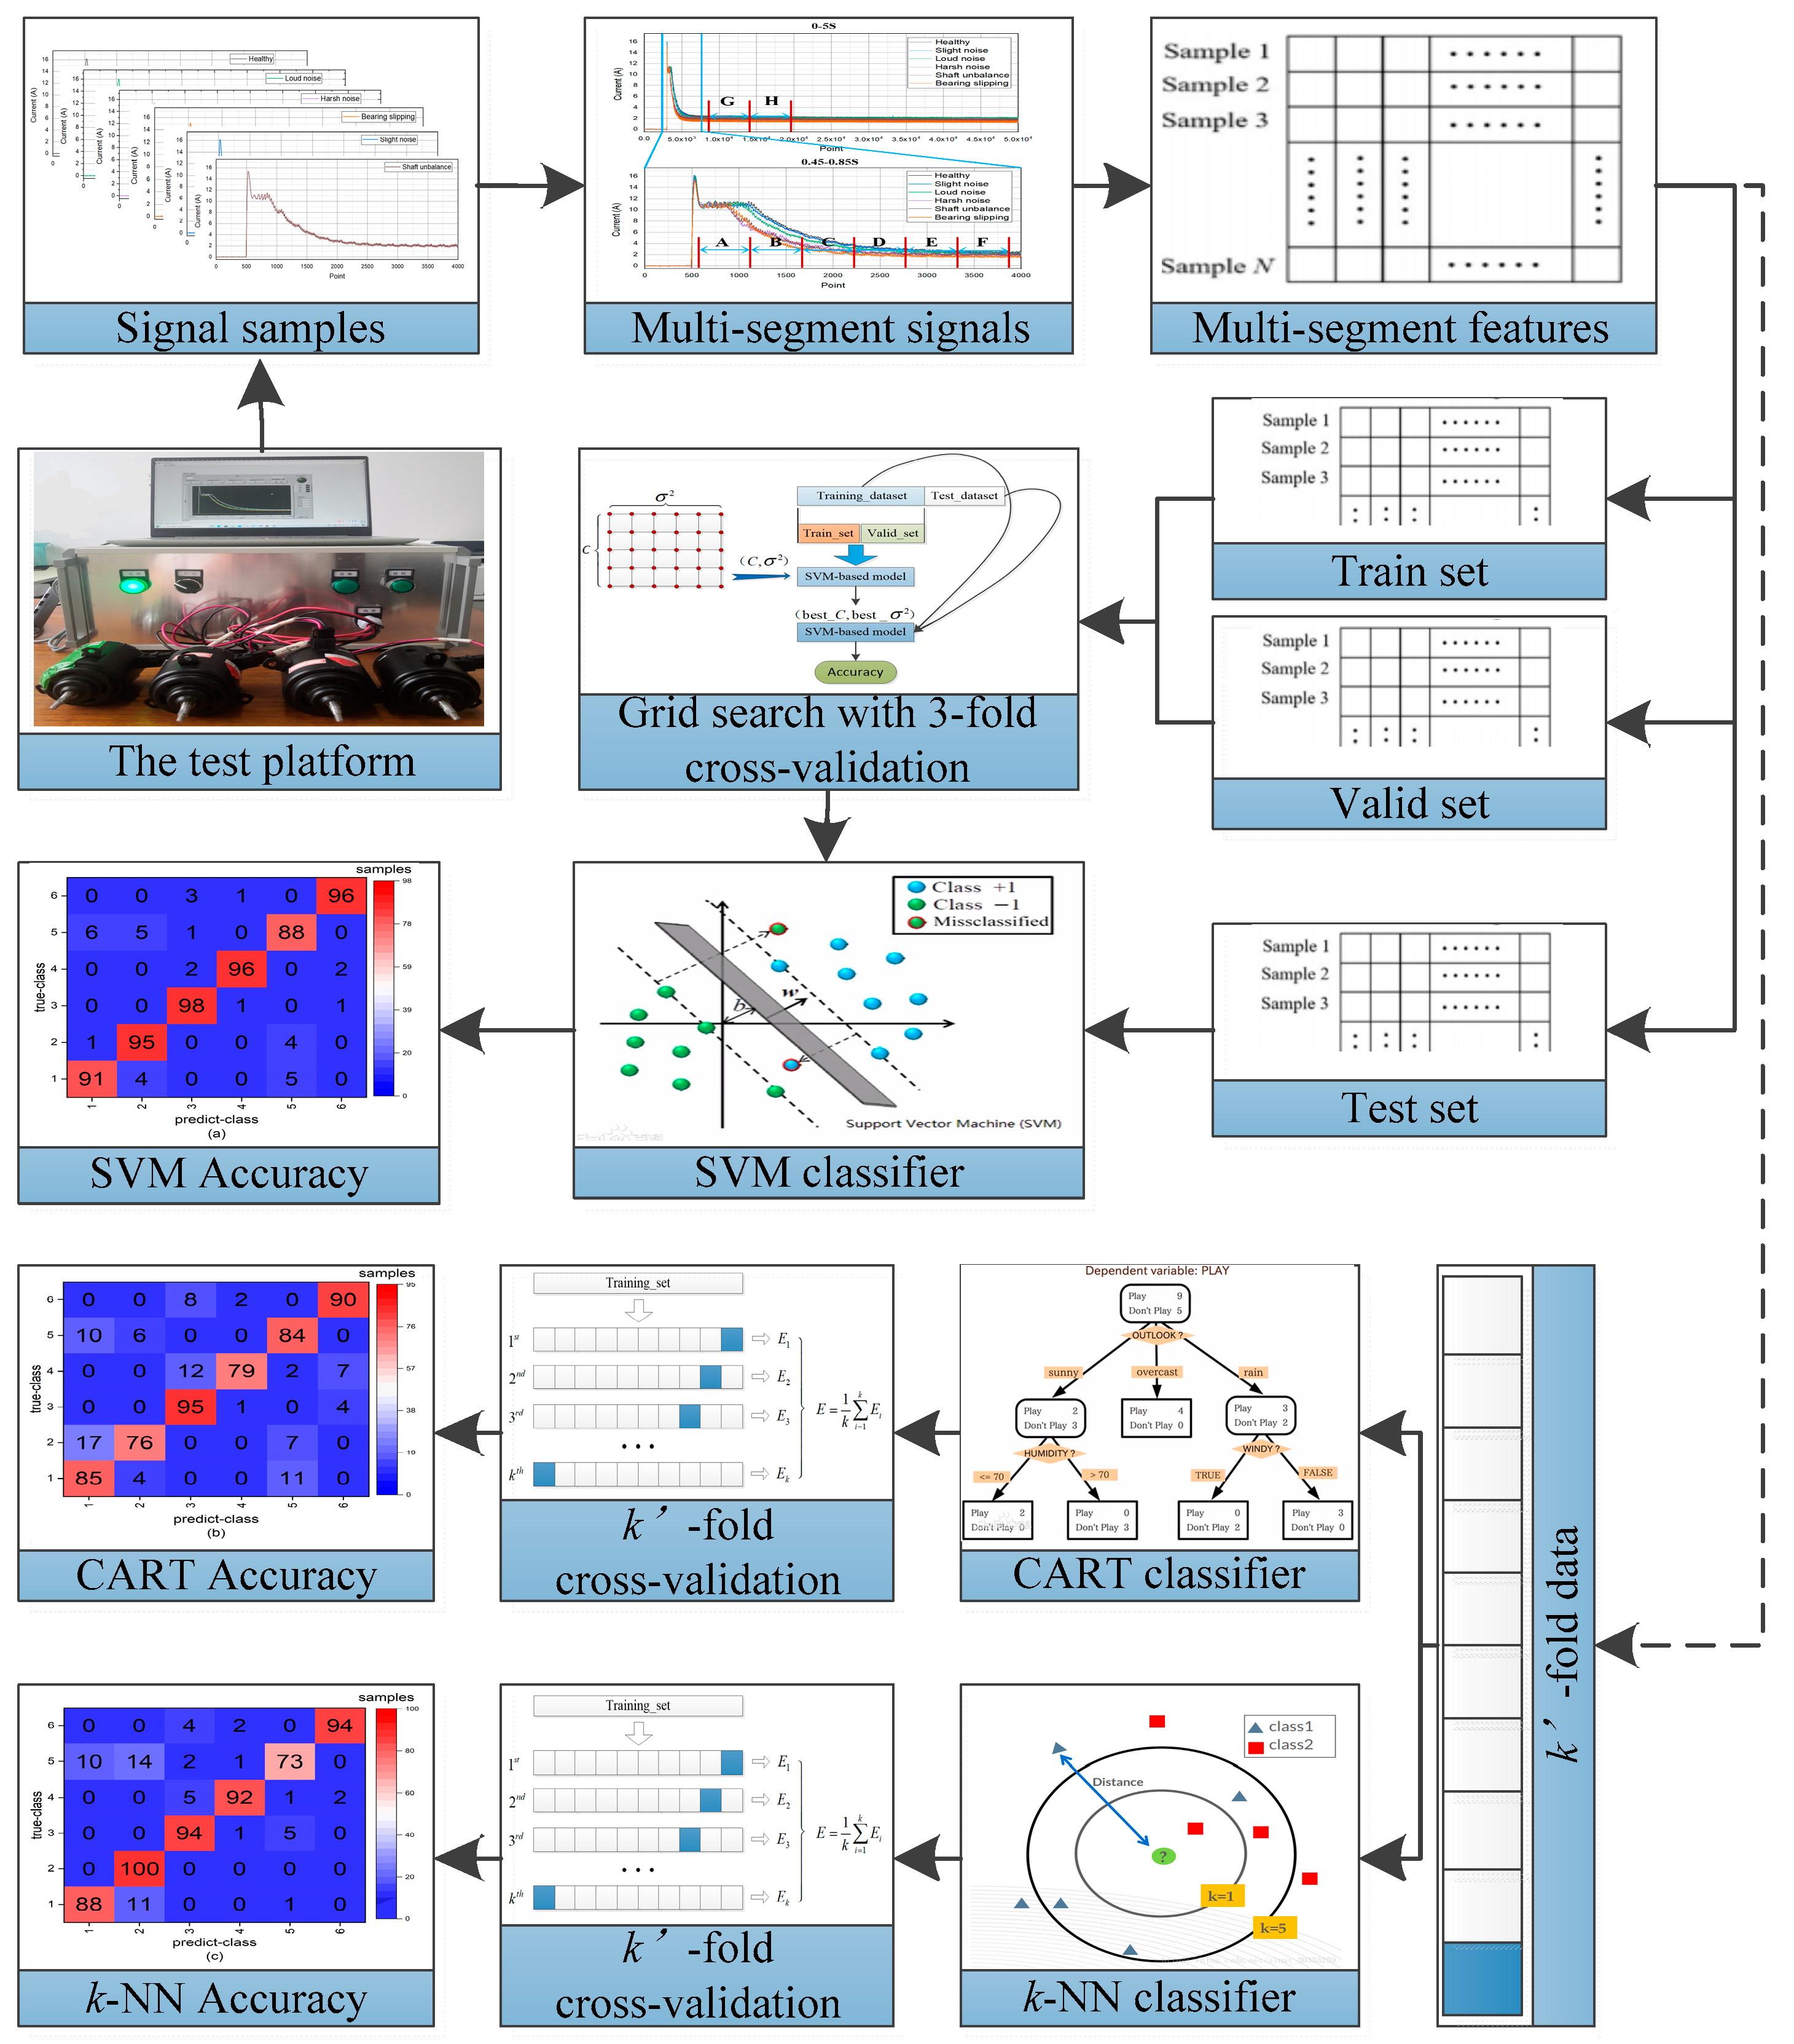
In this work, in order to prove the effectiveness of the proposed multi-segment feature extraction method for fault diagnosis of PMDCMs, the SVM, CART, and k-NN are utilized to construct the fault diagnosis model of PMDCMs based on the training dataset. The corresponding test dataset is adopted to verify the effectiveness of the fault diagnosis model.
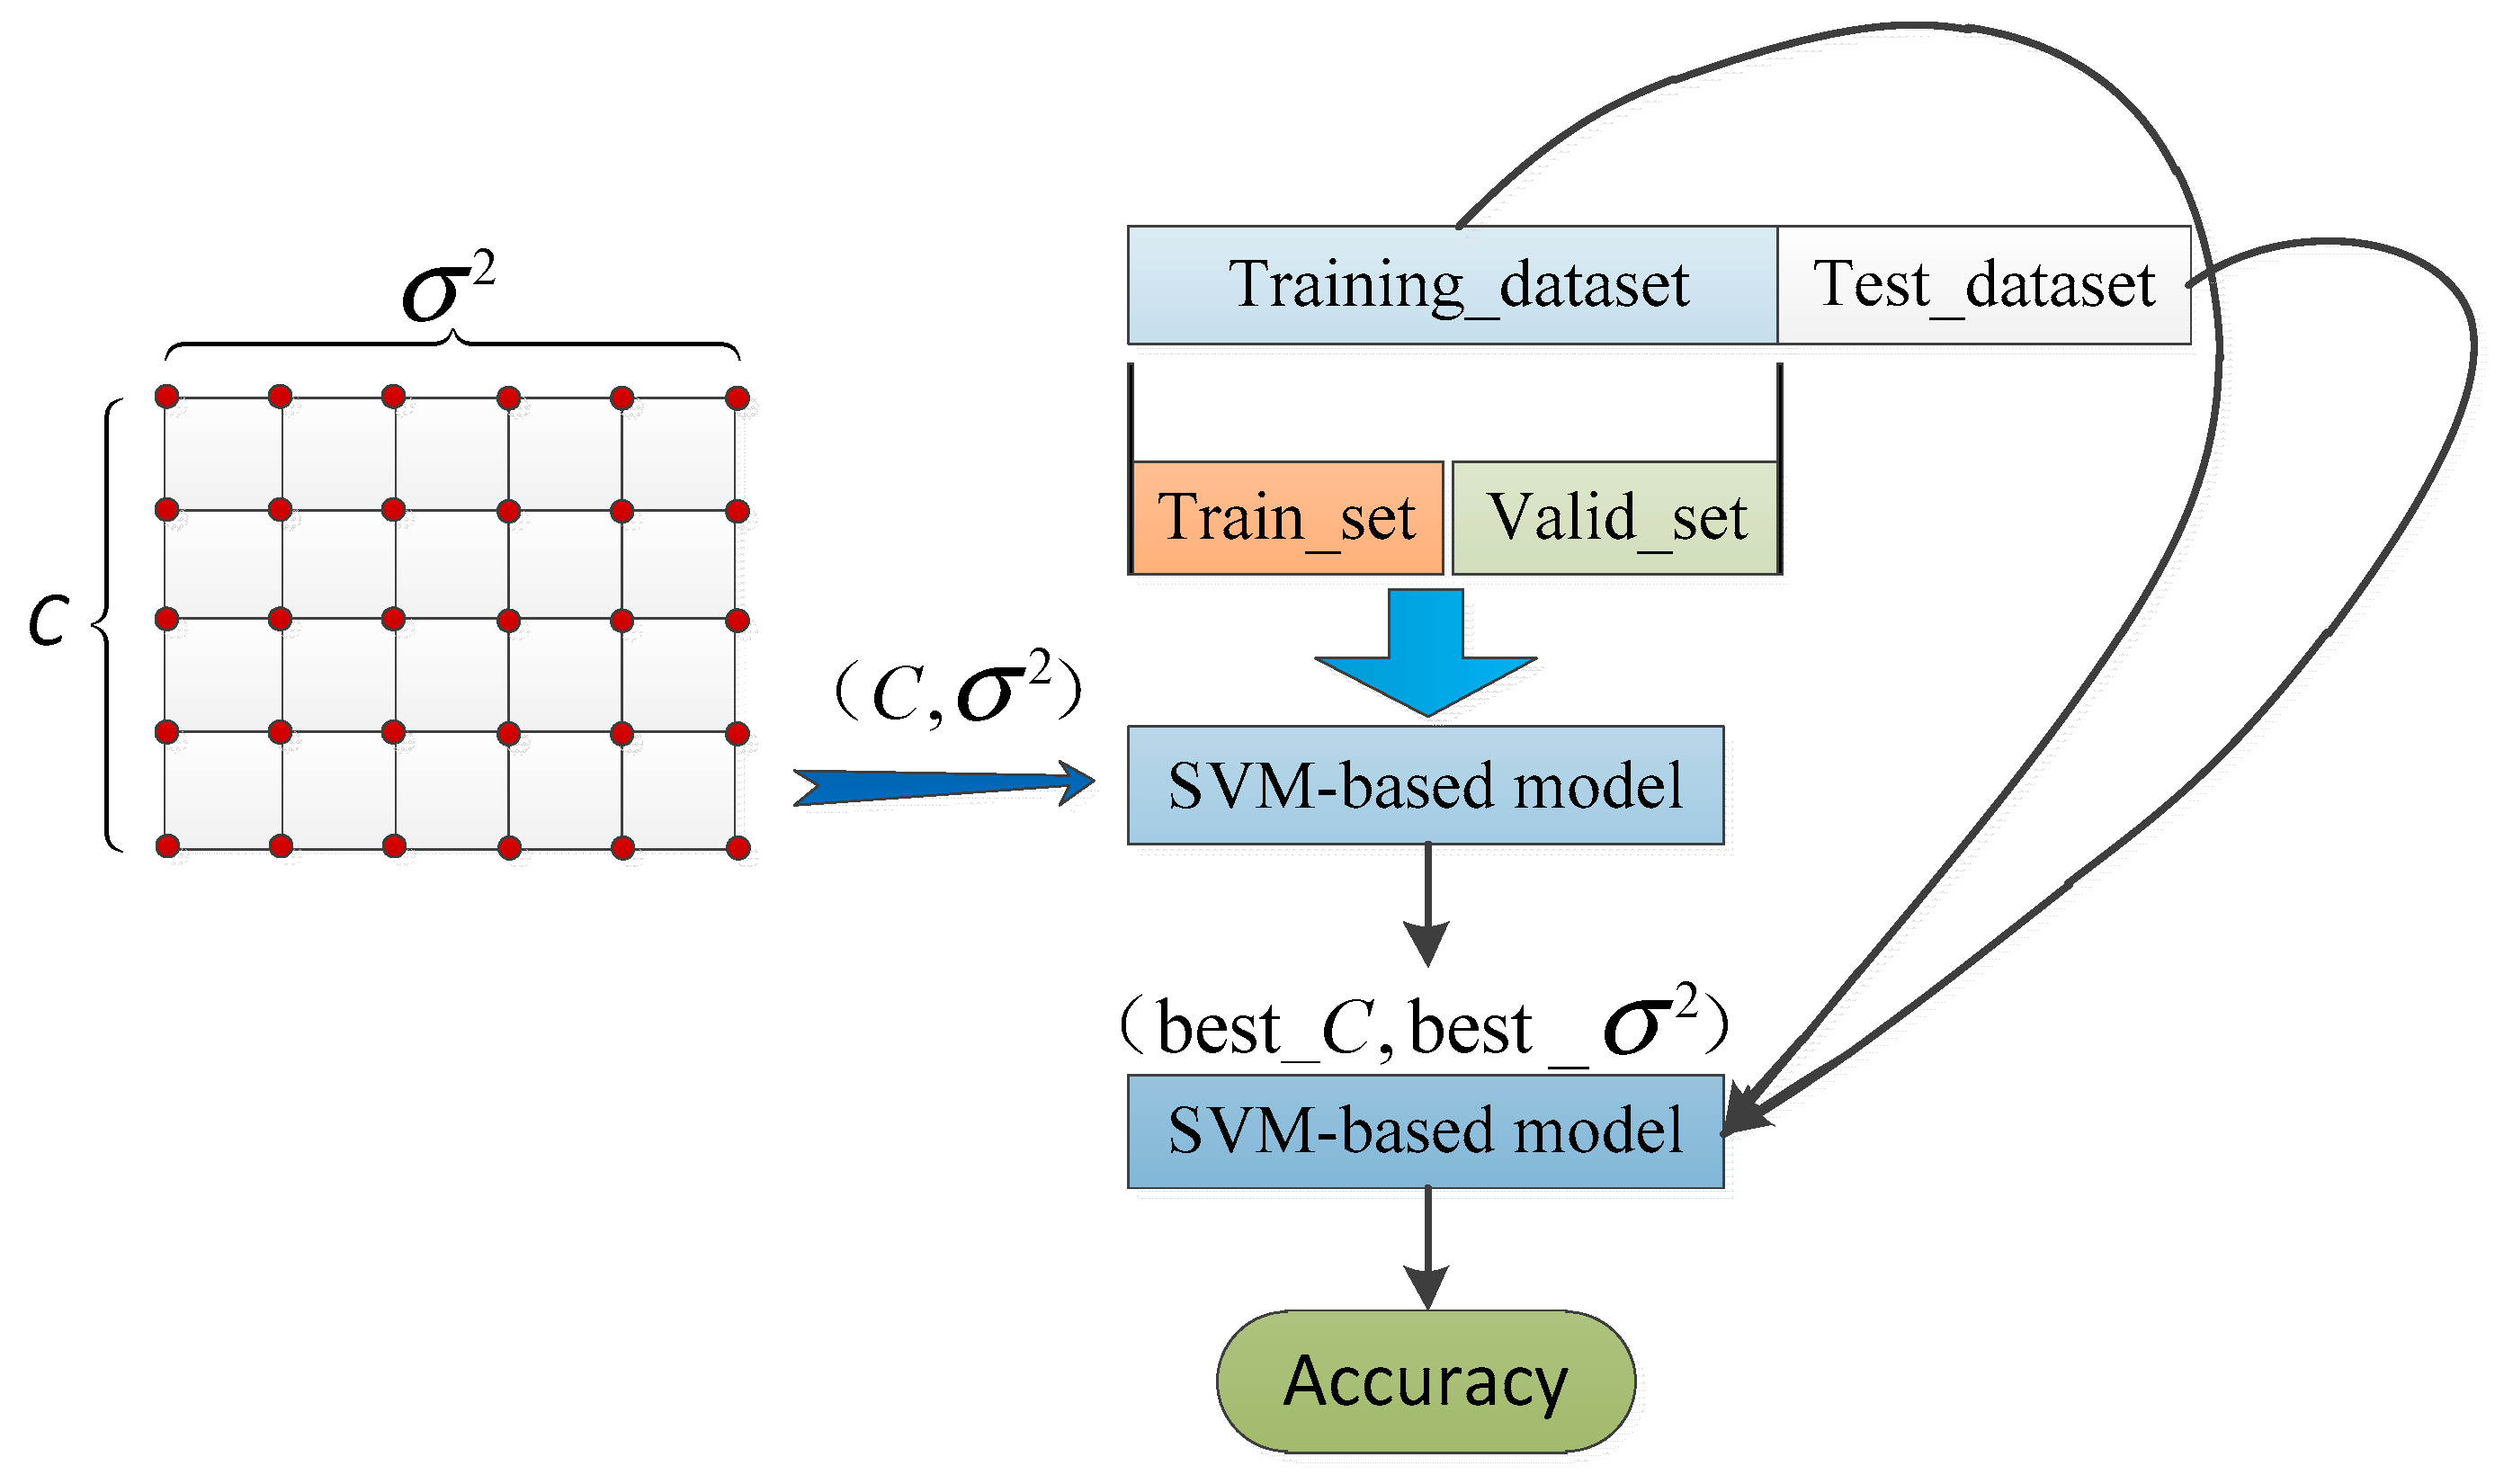
As for the SVM-based fault diagnosis model of PMDCMs, there are two model parameters that directly affect the performance, i.e., the penalty parameter
and the kernel parameter
. The procedure of the parameter optimization in SVM for fault diagnosis of PMDCMs is illustrated in
Figure 5.
In this work, sevenfold cross-validation is selected. The intersection that corresponds to the minimum fitness contains the two optimized model parameters (
and
). Then, the SVM-based fault diagnosis model can be constructed by using the training dataset and the determined model parameters (
and
). The test dataset is adopted to evaluate the performance of the constructed SVM-based fault diagnosis model, as shown in
Table 5. The accuracy of the constructed SVM-based fault diagnosis model using the multi-segment features (the S005 feature set) reaches up to 93.83%.
As for the CART-based fault diagnosis model of PMDCMs, sevenfold cross-validation is selected. (Typically, sevenfold cross-validation can produce better and more stable results, as we can see in
Figure 6. A total of 1200 feature vectors are randomly divided into seven subsets on average. Six subsets are adopted as the training set, and the remaining one subset is taken as the test set. The accuracy rate of the CART-based fault diagnosis model is adopted as the evaluation indicator, as shown in
Table 5. The accuracy of the constructed sevenfold cross-validation CART-based fault diagnosis model using the multi-segment features (the S0025 feature set) reaches up to 89.41%.
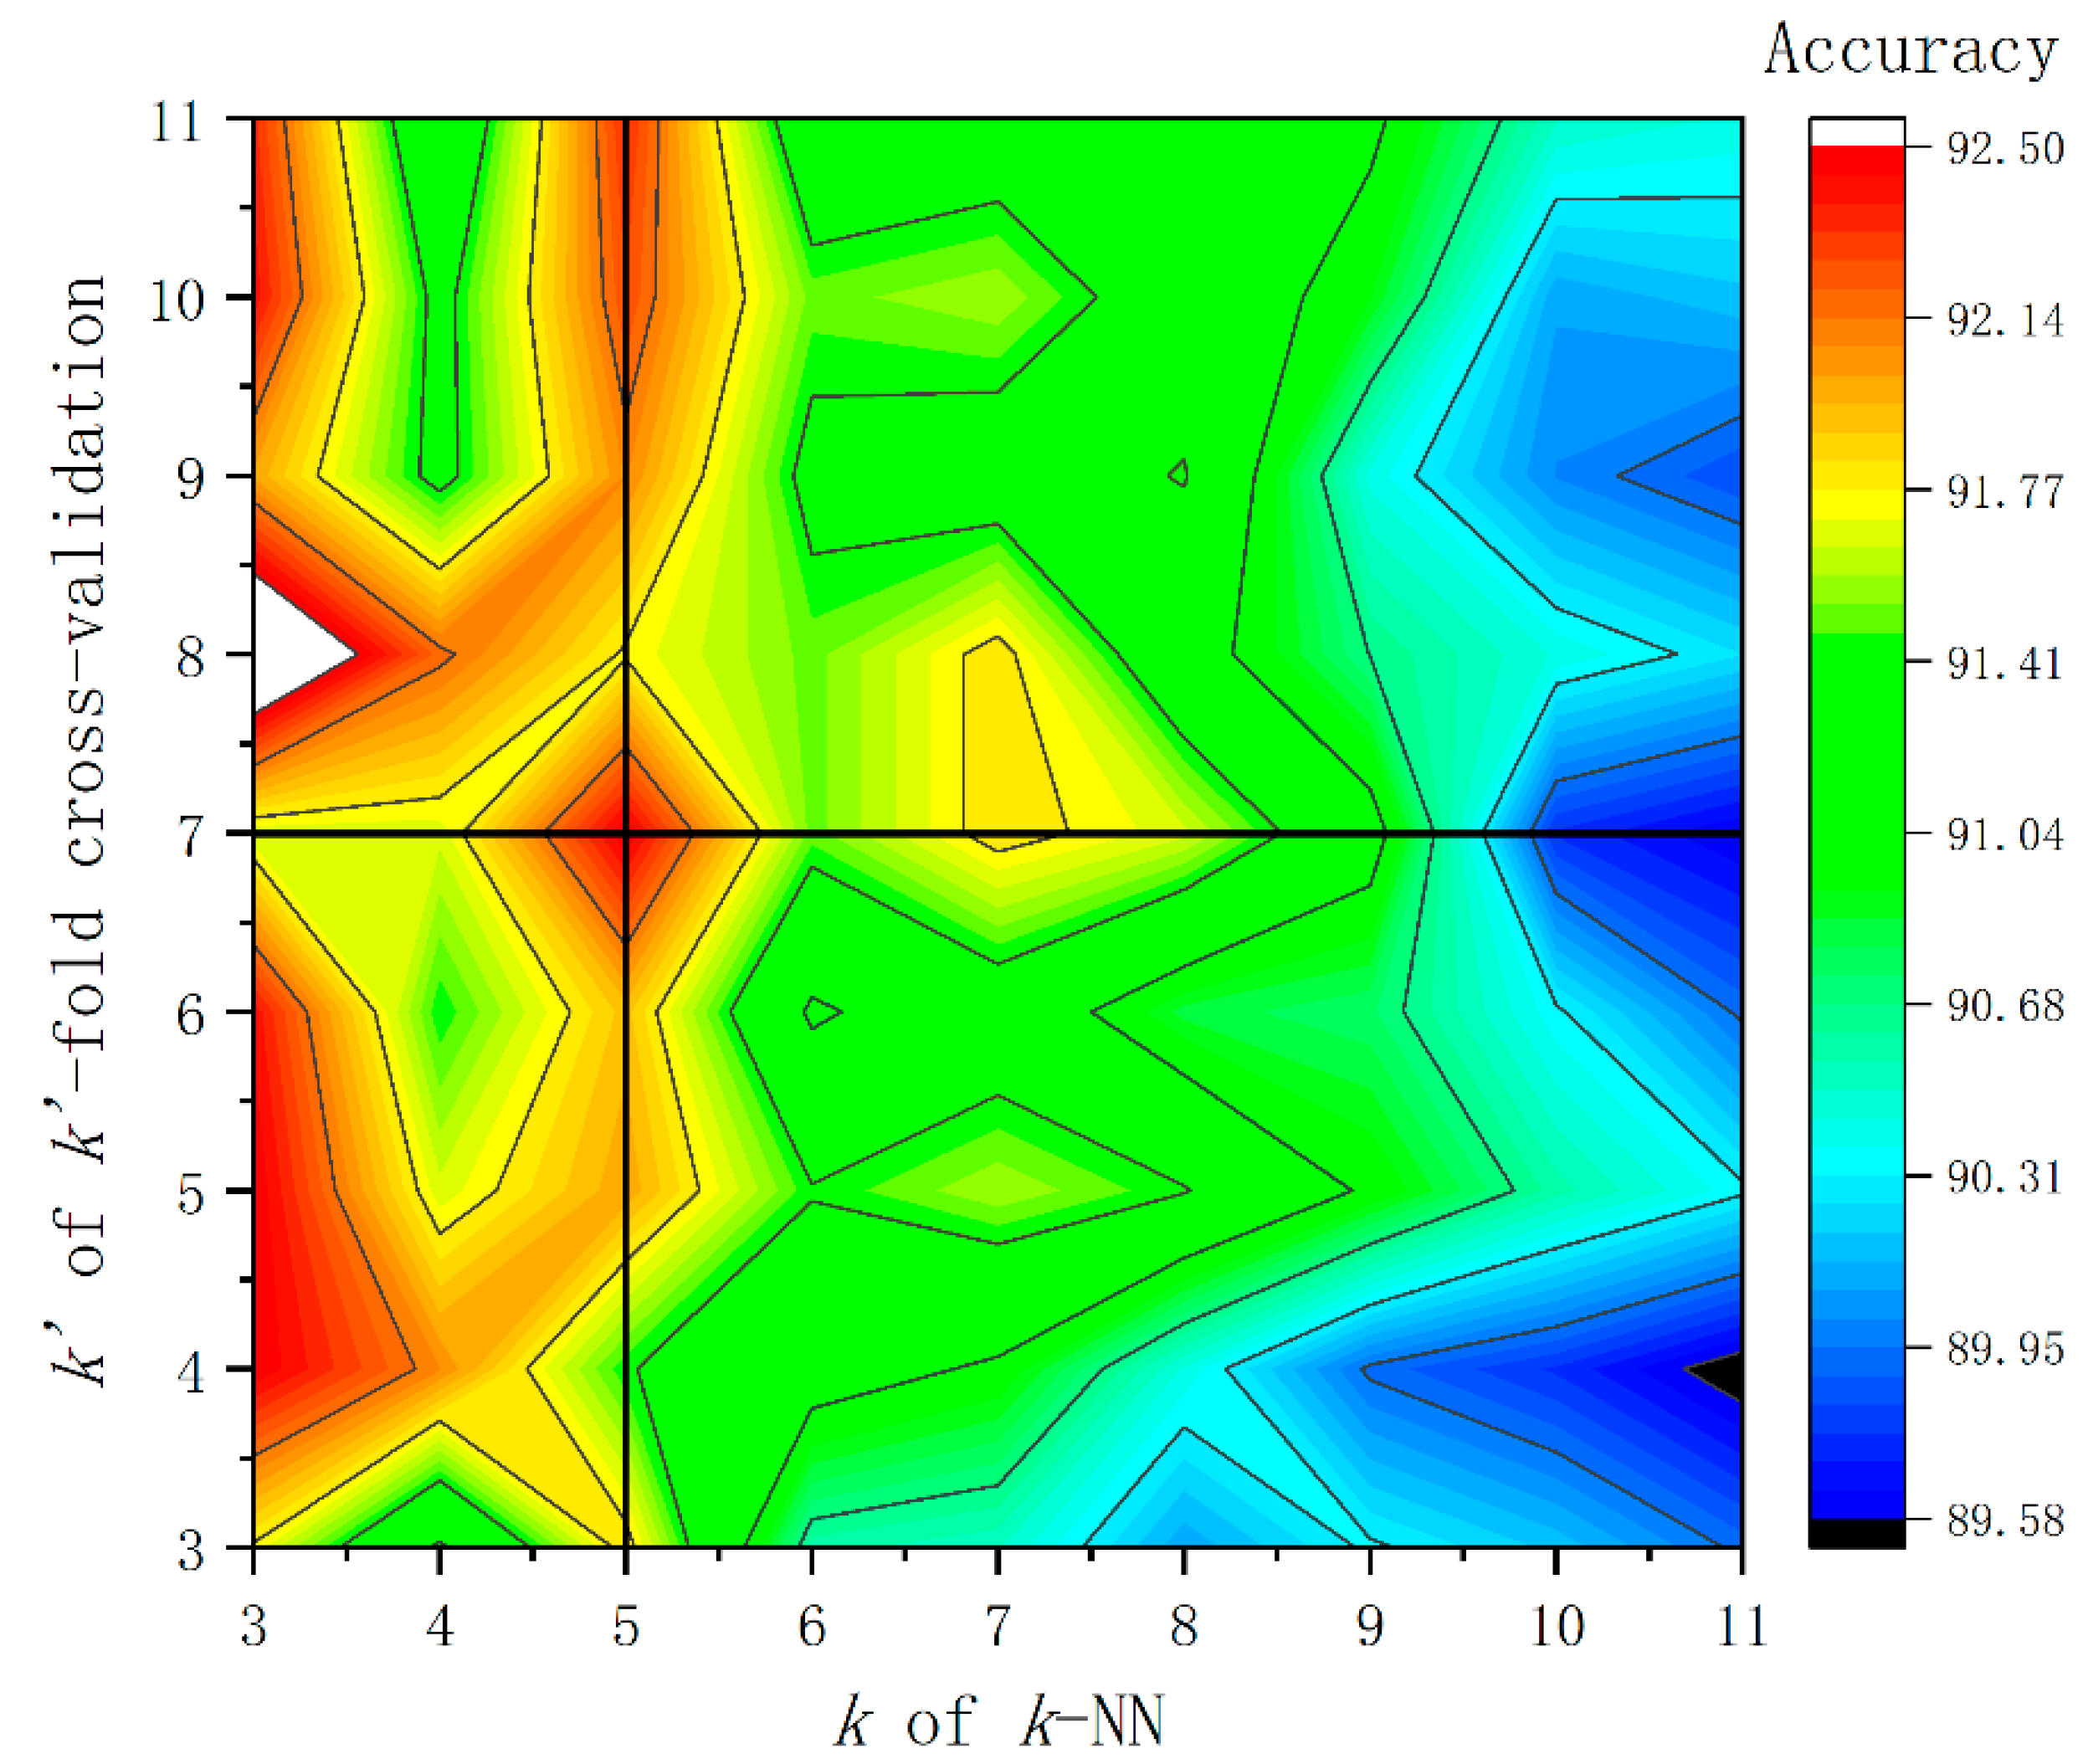
As for the
k-NN-based fault diagnosis model of PMDCMs, the grid-search method is utilized to determine the two model parameters. The
of the
k-NN ranges from 3 to 11 with step size 1. The
of
-fold cross-validation ranges from 3 to 11 with step size 1, respectively. The accuracy of the constructed
k-NN-based fault diagnosis model with cross-validation using the multi-segment features (the S005 feature set) is shown in
Table 6. It is apparent that when the
of
k-NN is set to 5 always can perform best, and also when
of
-fold cross-validation is set to 7, most times (5/9), it can perform better. See
Figure 6 for visual illustration of the selection process regarding
and
. The accuracy of the constructed sevenfold cross-validation
k-NN-based (
) fault diagnosis model using the multi-segment features (the S005 feature set) reaches up to 92.5%. Naturally, in next section (
Section 4.4), the
k-NN based fault diagnosis model of PMDCMs utilizing single-segment features (nine-dimension) is constructed with the
of
k-NN being set to 5 and the
of
-fold cross-validation being set to 7.
From F1 to F9, some of the features are correlated, so each feature is extracted separately in each single segment, and the SVM-, CART-,
-NN-based models are established by utilizing the eight-dimension features. The performances of the SVM-, CART-,
-NN-based models utilizing the F1 to F9 feature sets separately are shown in
Table 7, the models utilizing the F1 feature set achieve the best performance one time, and the models utilizing the F2 feature set achieve the best performance time times. Therefore, F2 was used as the benchmark feature, and the other eight features and calculated Pearson correlation coefficients [
22] with F2, respectively, are shown in
Table 8. The Pearson correlation coefficients of F1 and F3 are more than 0.5 with F2; thus, the No_F1 and No_F3 feature sets are formed by eliminating the F1 and F3 from the S005 feature set, respectively; the No_F1_F3 feature set is formed by eliminating the F1 and F3 from the S005 feature set at the same time. The performances of the SVM-, CART
-NN-based models utilizing the No_F1, No_F3, and No_F1_F3 are shown in
Table 9. Whether F1 or F3 are eliminated or F1 and F3 are eliminated at the same time, the performances of the model are not as strong as the performances of the model using the S005 feature set.
The three fault diagnosis models of PMDCMs is aimed at proving the effectiveness of the multi-segment features extraction method. As we can see in
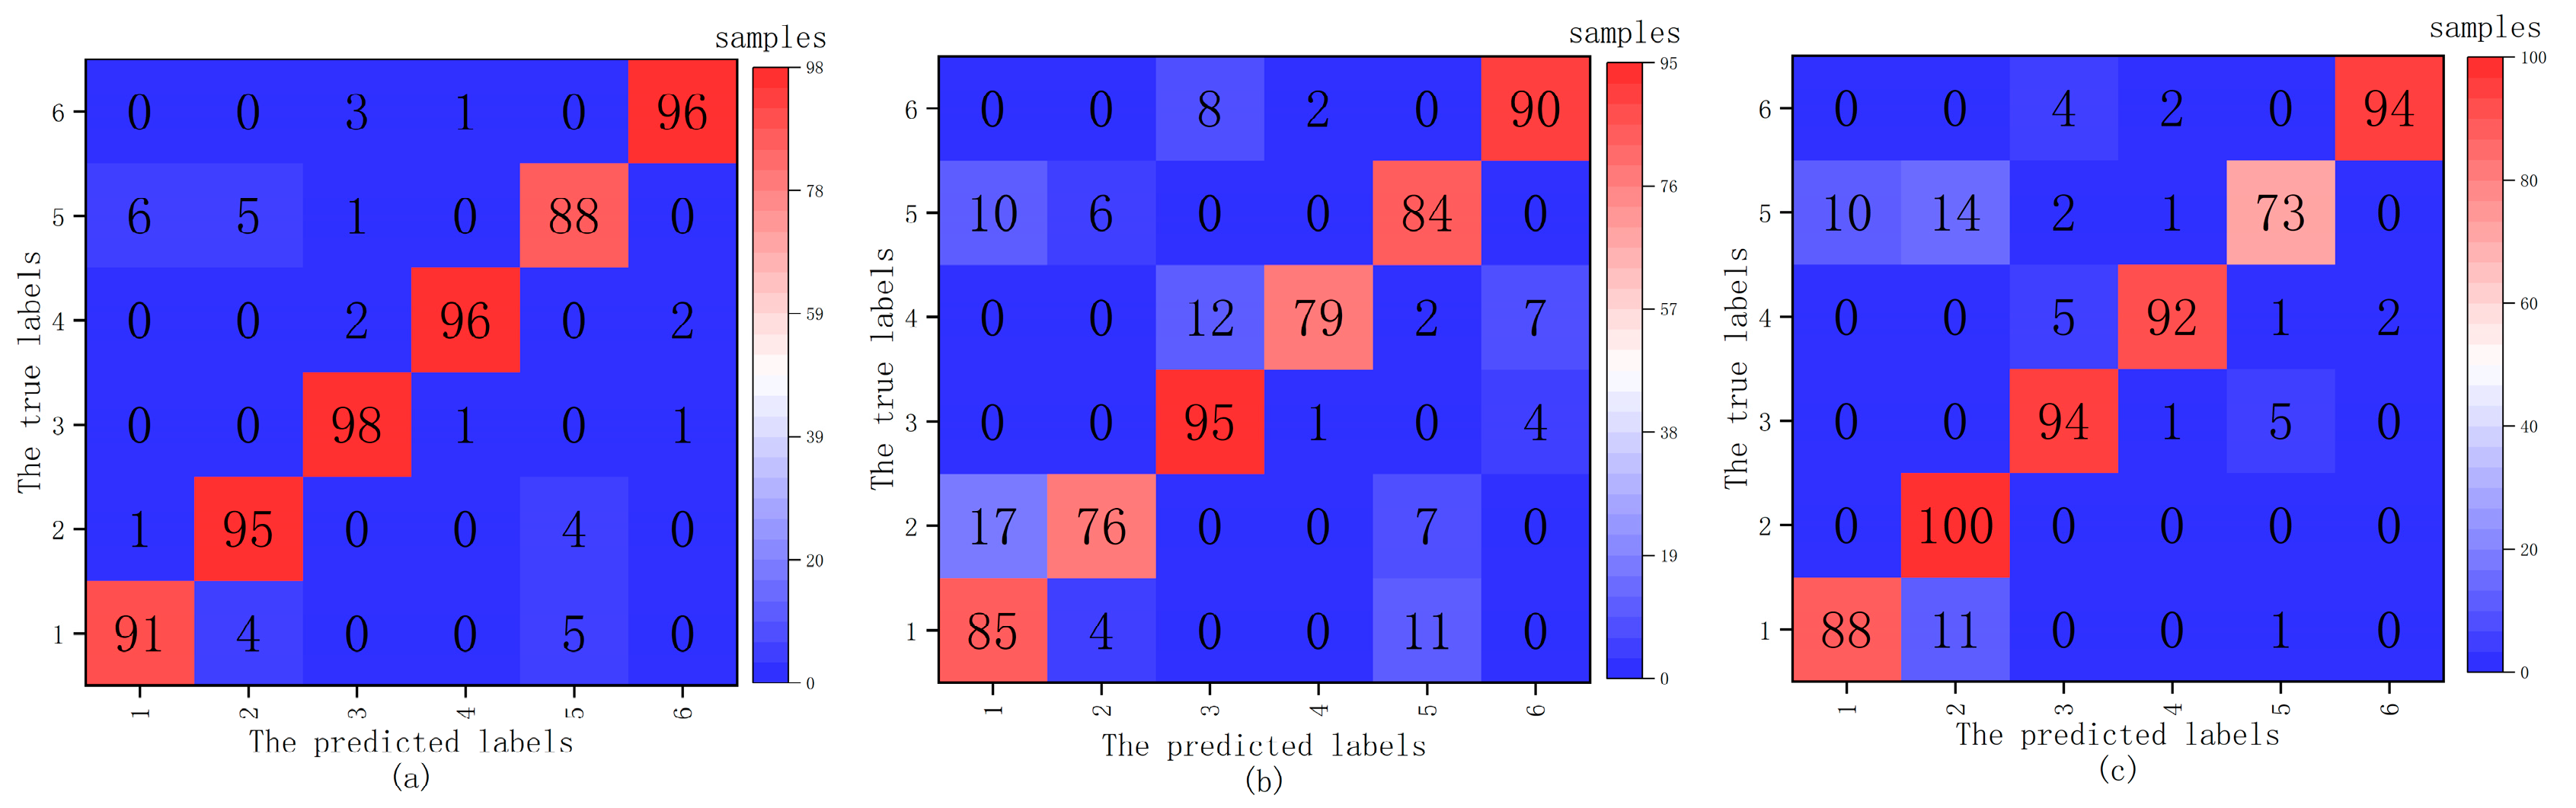
Table 10, the accuracy of the fault diagnosis model using the multi-segment (S005 feature set) features reach up to 93.83%, 89.16%, 92.5%, respectively, for more a intuitive explanation and deeper understanding of the effect of the proposed multi-segment feature extraction method. In this paper, 1200 samples are divided into two groups. One is used to train and the other is used to test.
Figure 7 shows the confusion matrices of three fault diagnosis models, and the
x-axis corresponds to the predicted status, while the
y- represents the actual status. In
Figure 7a, the confusion matrix utilizing the SVM-based (
and
) fault diagnosis model of PMDCMs is shown. In
Figure 7b, the confusion matrix utilizing the CART-based fault diagnosis model of PMDCMs is shown. In
Figure 7c, the confusion matrix utilizing the k-NN-based fault diagnosis model of PMDCMs is shown. It can be seen from the three confusion matrices that most samples were correctly classified; however, they still have a small mounts class 5 predicted as class 1 or class 2, class 1 predicted as class 1, and class 2 predicted as class 1. As shown in
Table 4, class 1 represents healthy, class 2 represents slight noise, and class 5 represents shaft unbalance. There is no obvious difference between class 1 and class 2; shaft unbalance only produces slight vibration and no noise, so class 5 is close to class 1.
4.4. Performance of Single-Segment Features Model
To show the effectiveness of the multi-segment features (seventy-two-dimension), the single segment (i.e., A, B, C, D, E, F, G, and H) features (nine-dimension), as shown in
Figure 2, are used for model construction and evaluation, respectively. The detailed process is the same as that in
Section 4.3. The testing results for each segment are listed in
Table 10.
The best prediction performance of the SVM-based fault diagnosis model reaches up to 81.76% based on H-segment features, followed by 79.33% based on G-segment features. The best prediction performance of the CART-based fault diagnosis model reaches up to 73.67% based on G-segment features, followed by 72.92% based on H-segment features. The best prediction performance of the k-NN-based fault diagnosis model reaches up to 76.25% based on H-segment features, followed by 72.42% based on G-segment features. The SVM-, CART-, and k-NN-based models all achieved better prediction results on G or H single-segment features than A, B, C, D, E, and F single-segment features. The reason for this might be not only that G and H segments have longer durations than A, B, C, D, E, and F segments but also that in the stable stage, they can have more stable features.
It can be seen from the data in
Table 10 that the accuracy of the constructed SVM-based fault diagnosis model using the single-segment features (nine-dimension) varies from 68.67% to 81.67%, and the average accuracy is 75.25%. It can be found that the SVM-based fault diagnosis model using multi-segment features (93.83%) has a better diagnostic effect than using single-segment features (68.67~81.67%), and it increased by 18.58% on average. The accuracy of the constructed CART-based fault diagnosis model using the single-segment features (nine-dimension) varies from 68.08% to 73.67%, and the average accuracy is 70.57%. It can be found that the CART-based fault diagnosis model using multi-segment features (89.16%) has a better diagnostic effect than using single-segment features (68.08~73.67%), and it increased by 18.59% on average. The accuracy of the constructed
k-NN-based (
) fault diagnosis model using the single-segment features (nine-dimension) varies from 64.67% to 76.25%, and the average accuracy is 70.04%. It can be found that the
k-NN-based (
) fault diagnosis model using multi-segment features (92.5%) has a better diagnostic effect than using single-segment features (64.67~76.25%), and it increased by 22.46% on average. Fault diagnosis of PMDCMs based on multi-segment features has better performance than that based on single-segment features by utilized the SVM, CART, and
k-NN classifier. Compared with the single-segment features-based fault diagnosis models, multi-segment features-based fault diagnosis models have more features. However, in our opinion, the more important reason is that the multi-segment features reflect the potential information between different single segments.


