
Highly-Optimized Radar-Based Gesture Recognition System with Depthwise Expansion Module

 , , ,
, , ,
Abstract
:1. Introduction
- We present a novel building block—Depthwise Expansion Module. To the best of our knowledge, this type of building block has never been proposed in the field of radar-based gesture recognition.
- We deploy and test our algorithm on Edge TPU, proposing the 8-bit algorithm implementation. As far as we are aware, we propose the first radar-based gesture recognition classifier, which is optimized and deployed on the Coral Edge TPU board.
- We propose a signal processing pipeline that allows a compressed data representation of the FMCW radar signal.
2. Related Works
3. System Description and Implementation
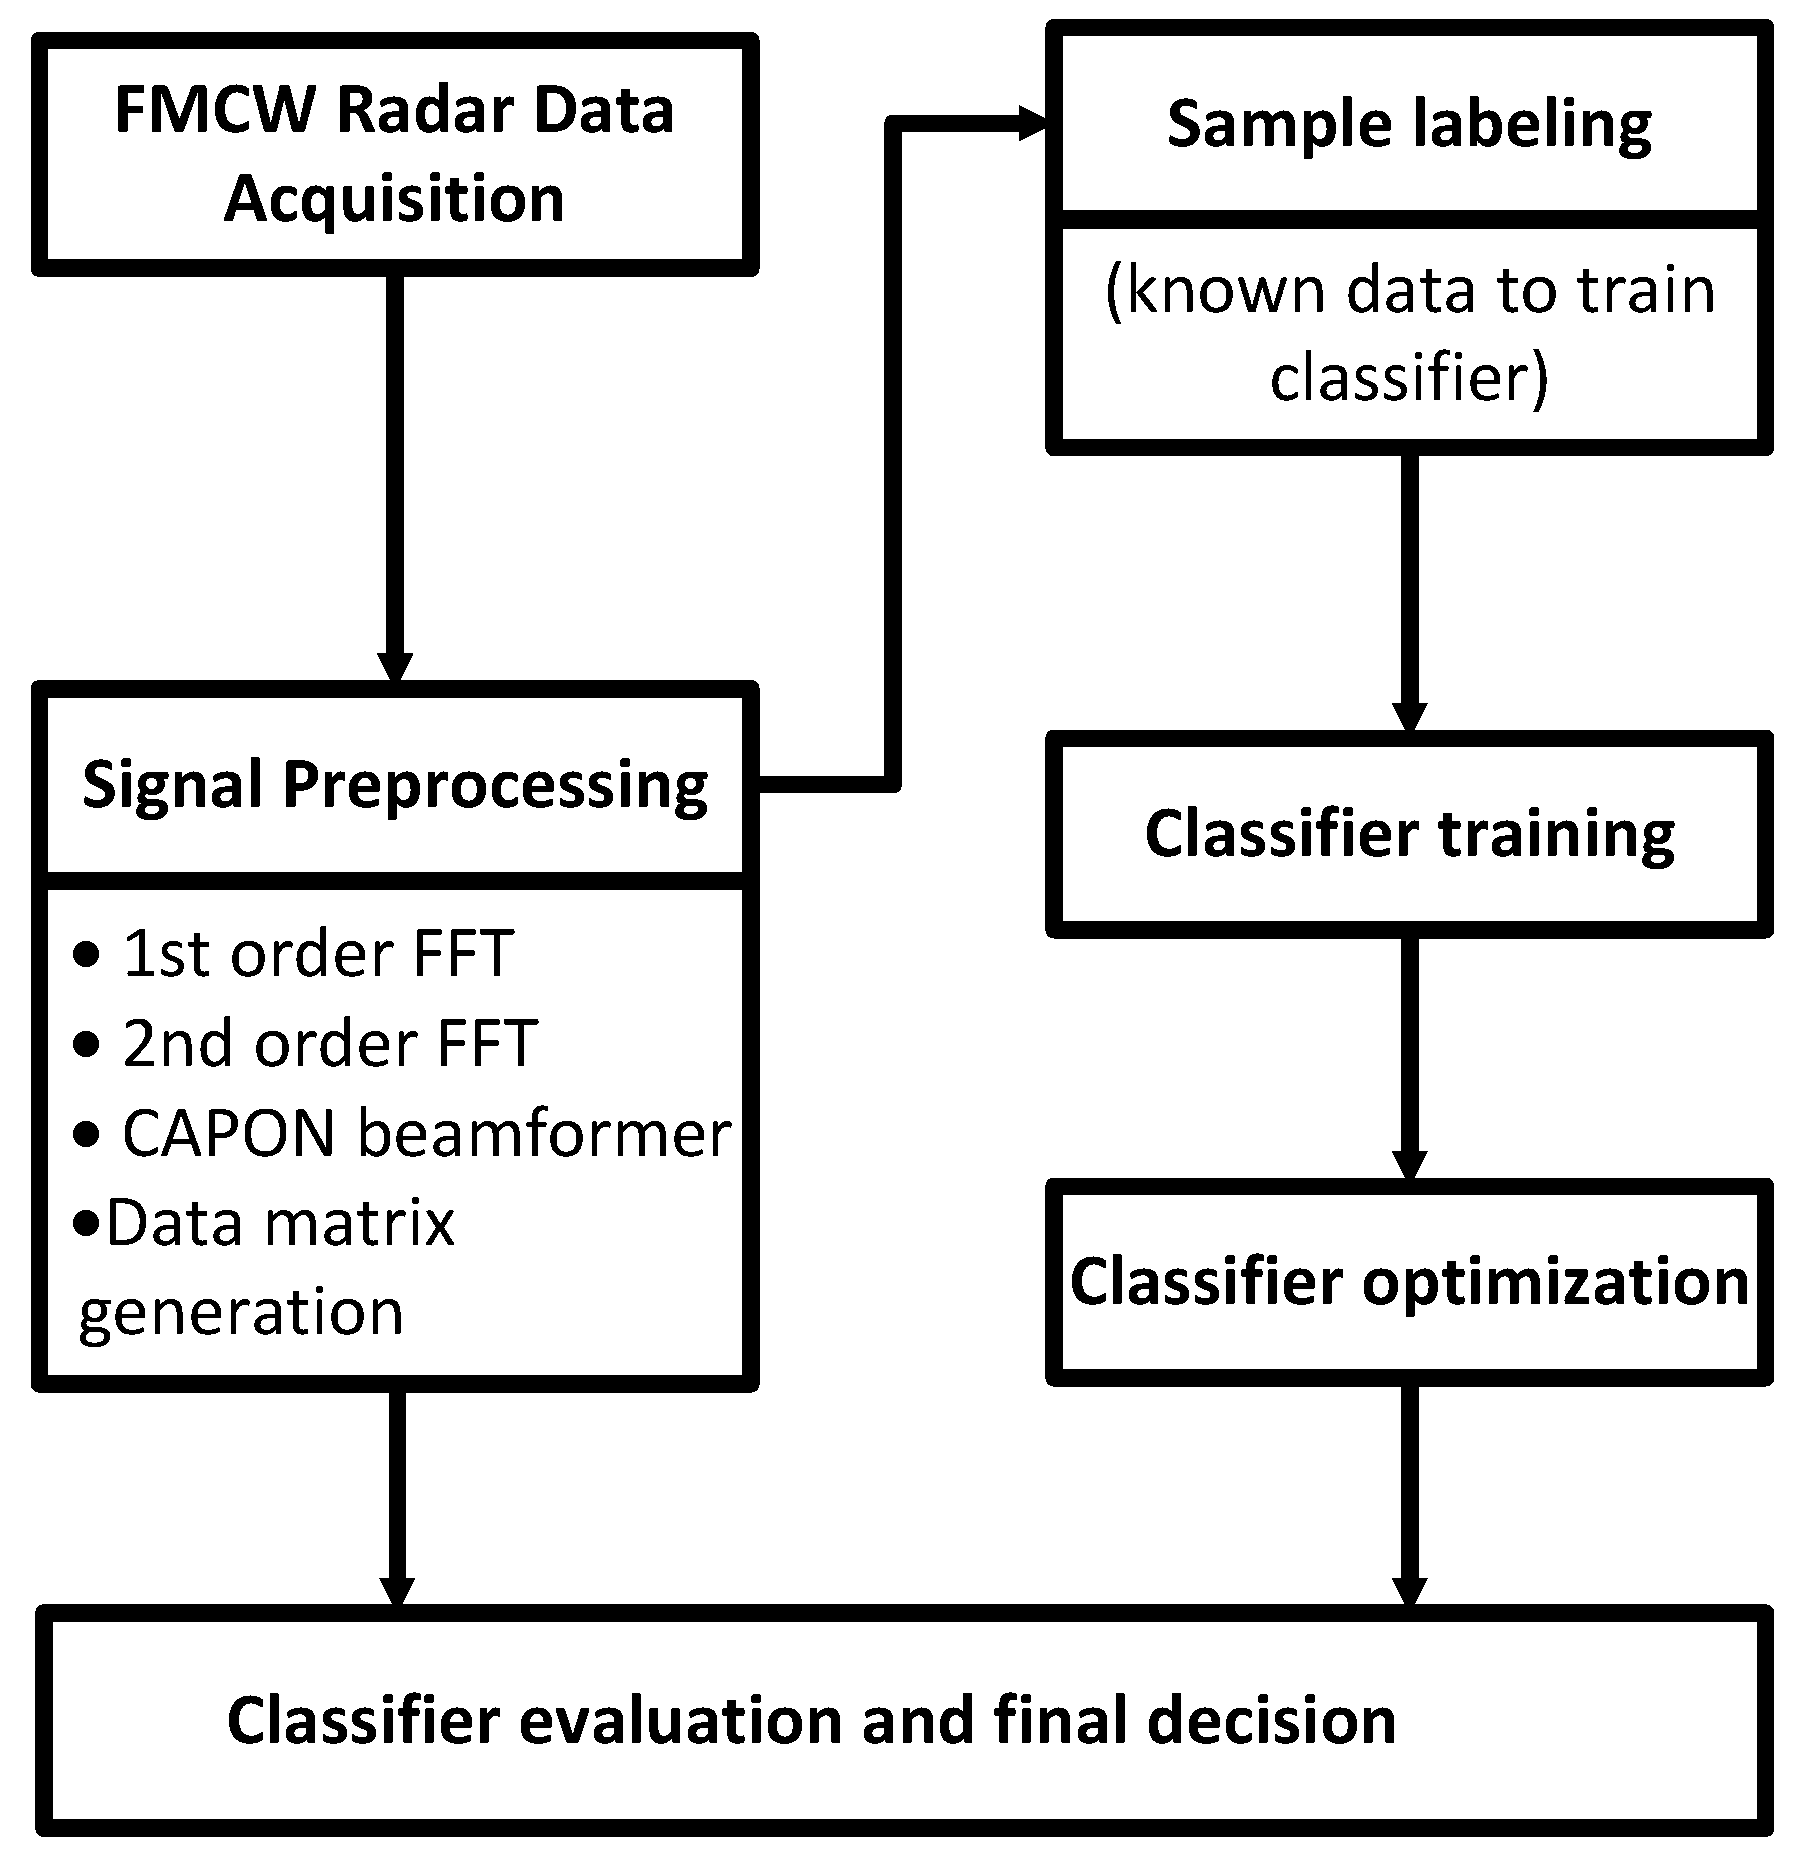
3.1. The General Overview of the Proposed Framework
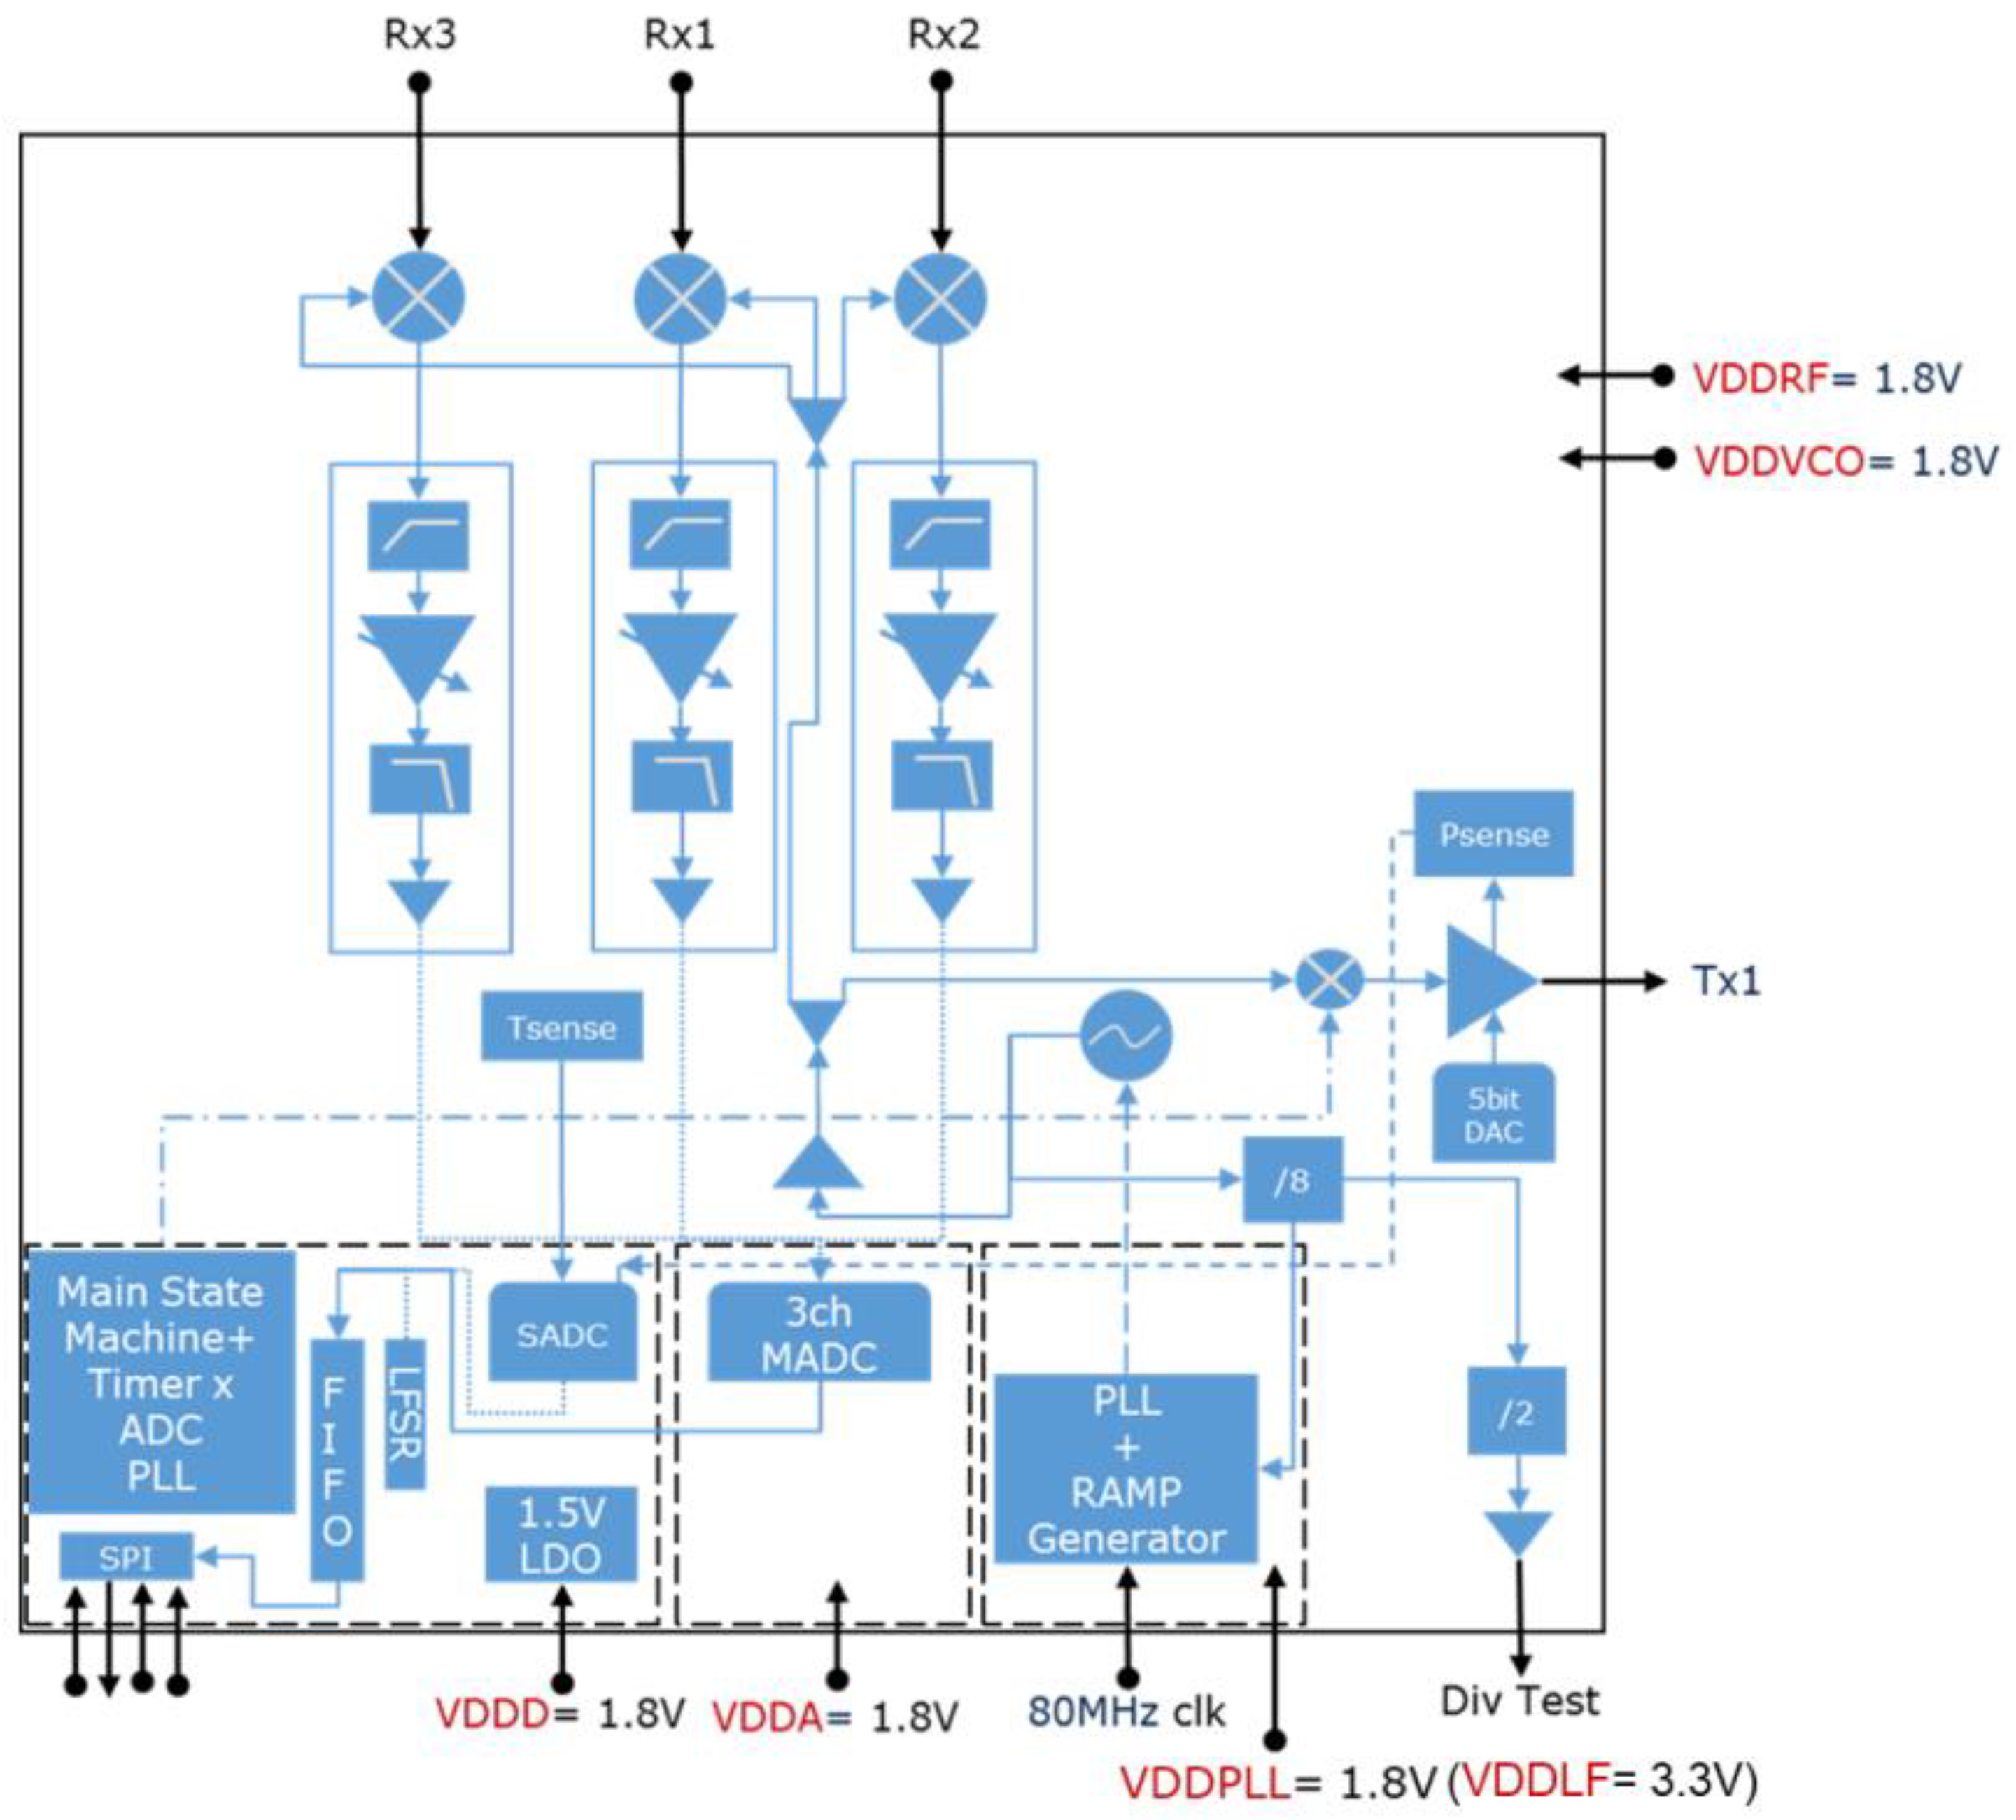
3.2. Radar
3.3. Radar Signal Model
3.4. Radar Signal Processing
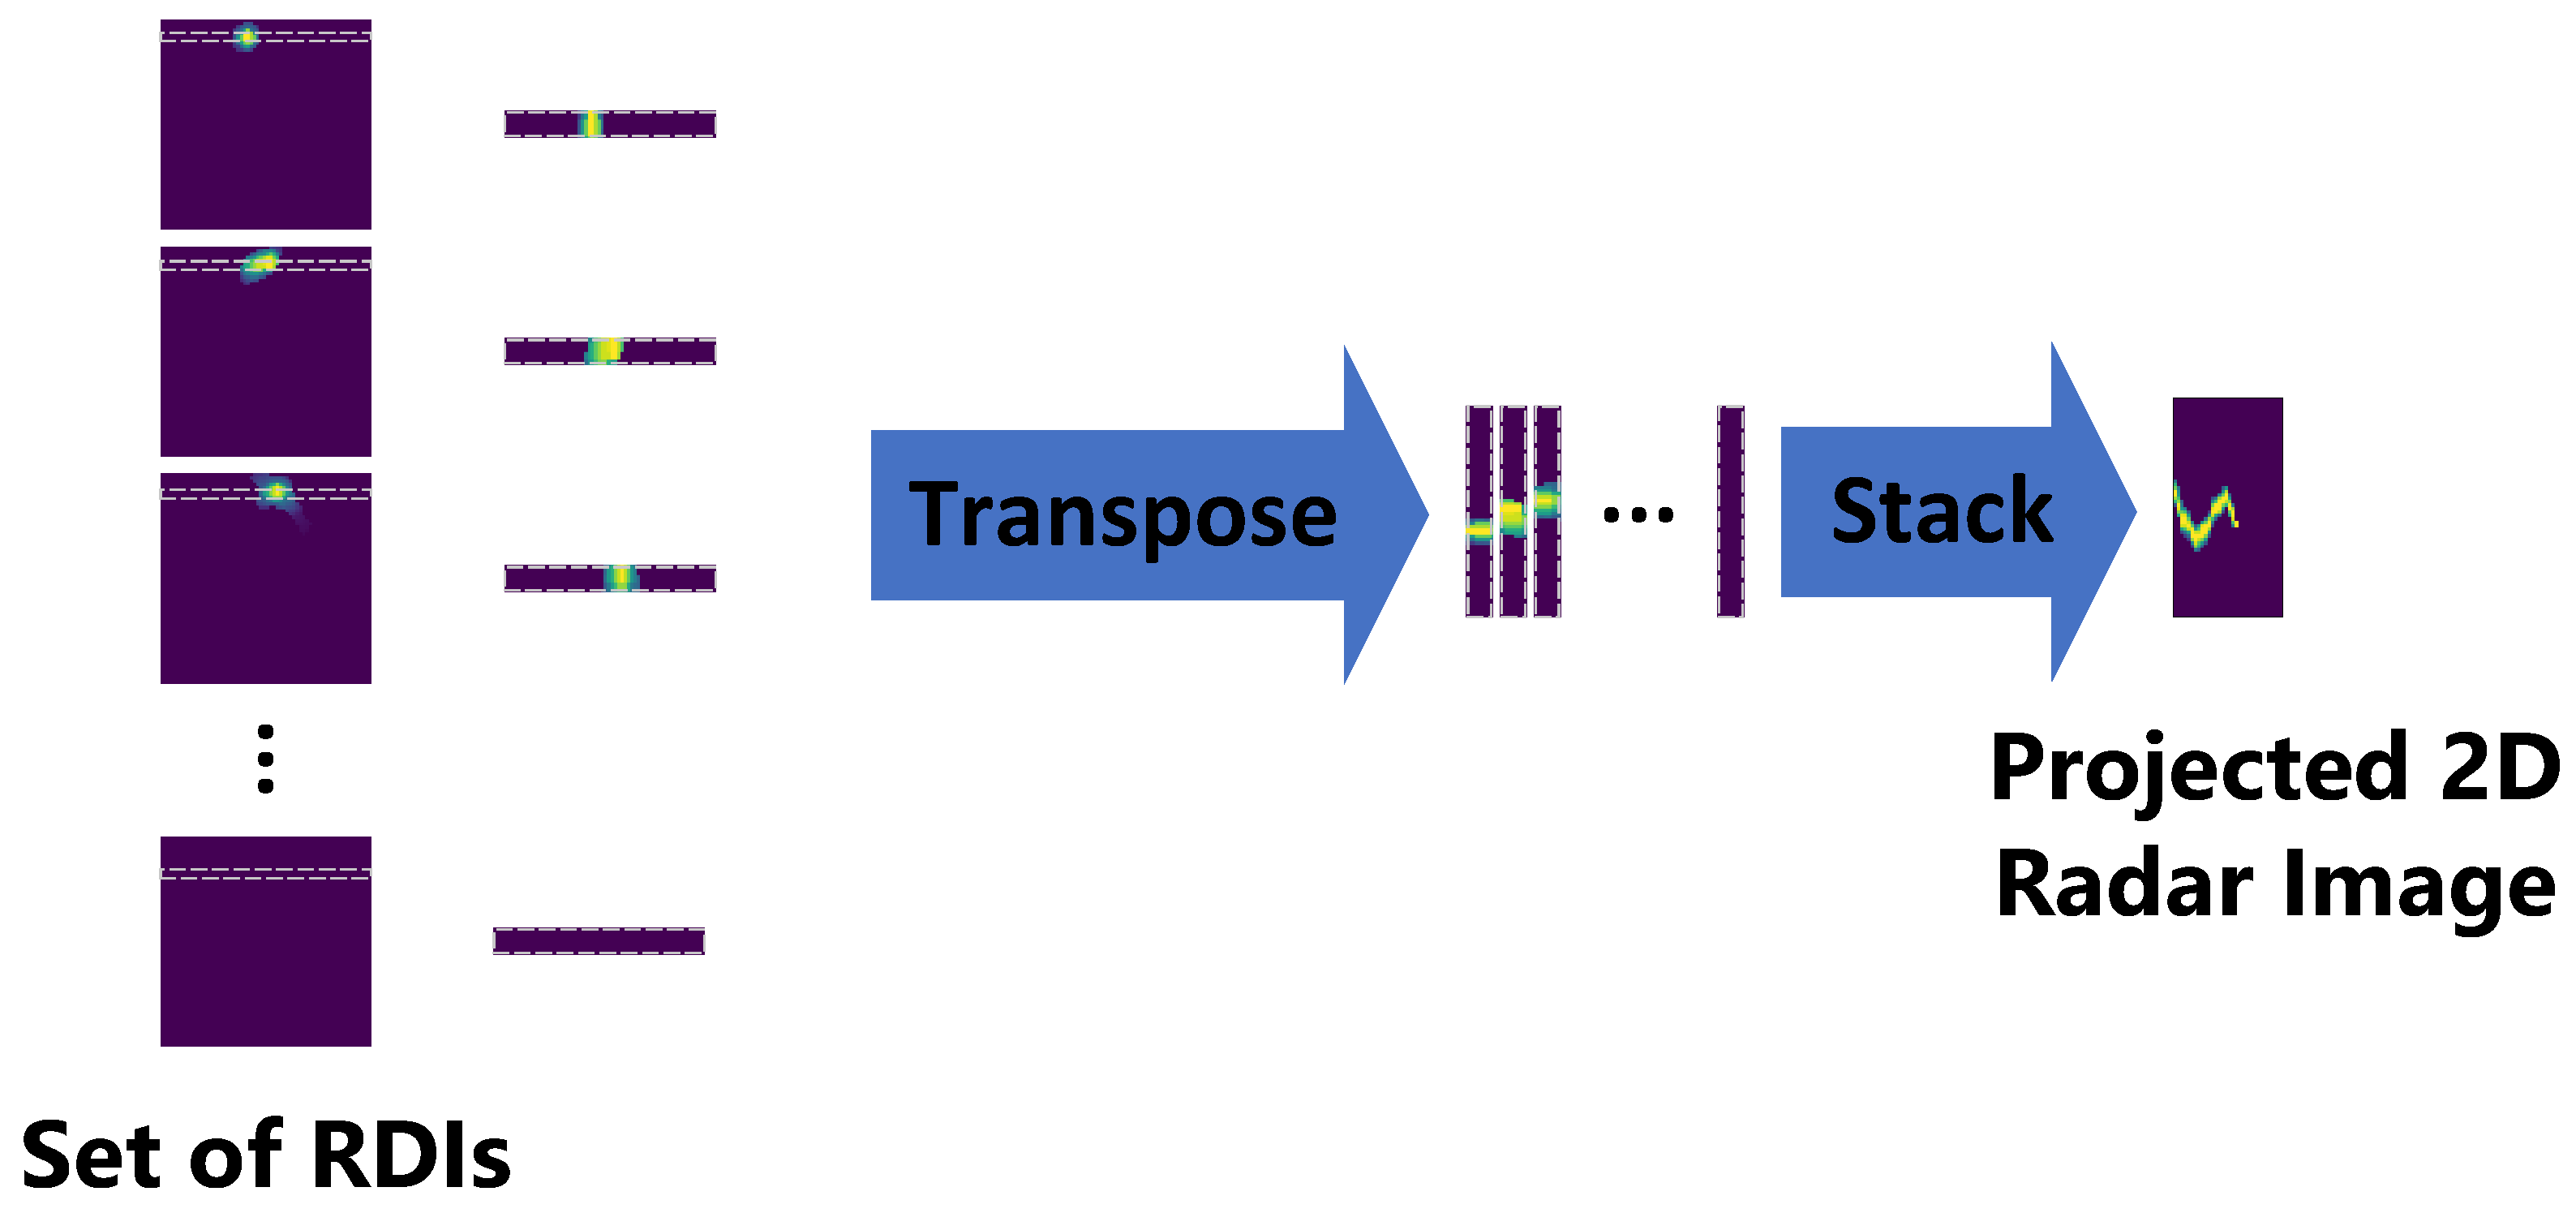
3.4.1. Range Doppler Image Generation
3.4.2. Angle Estimation
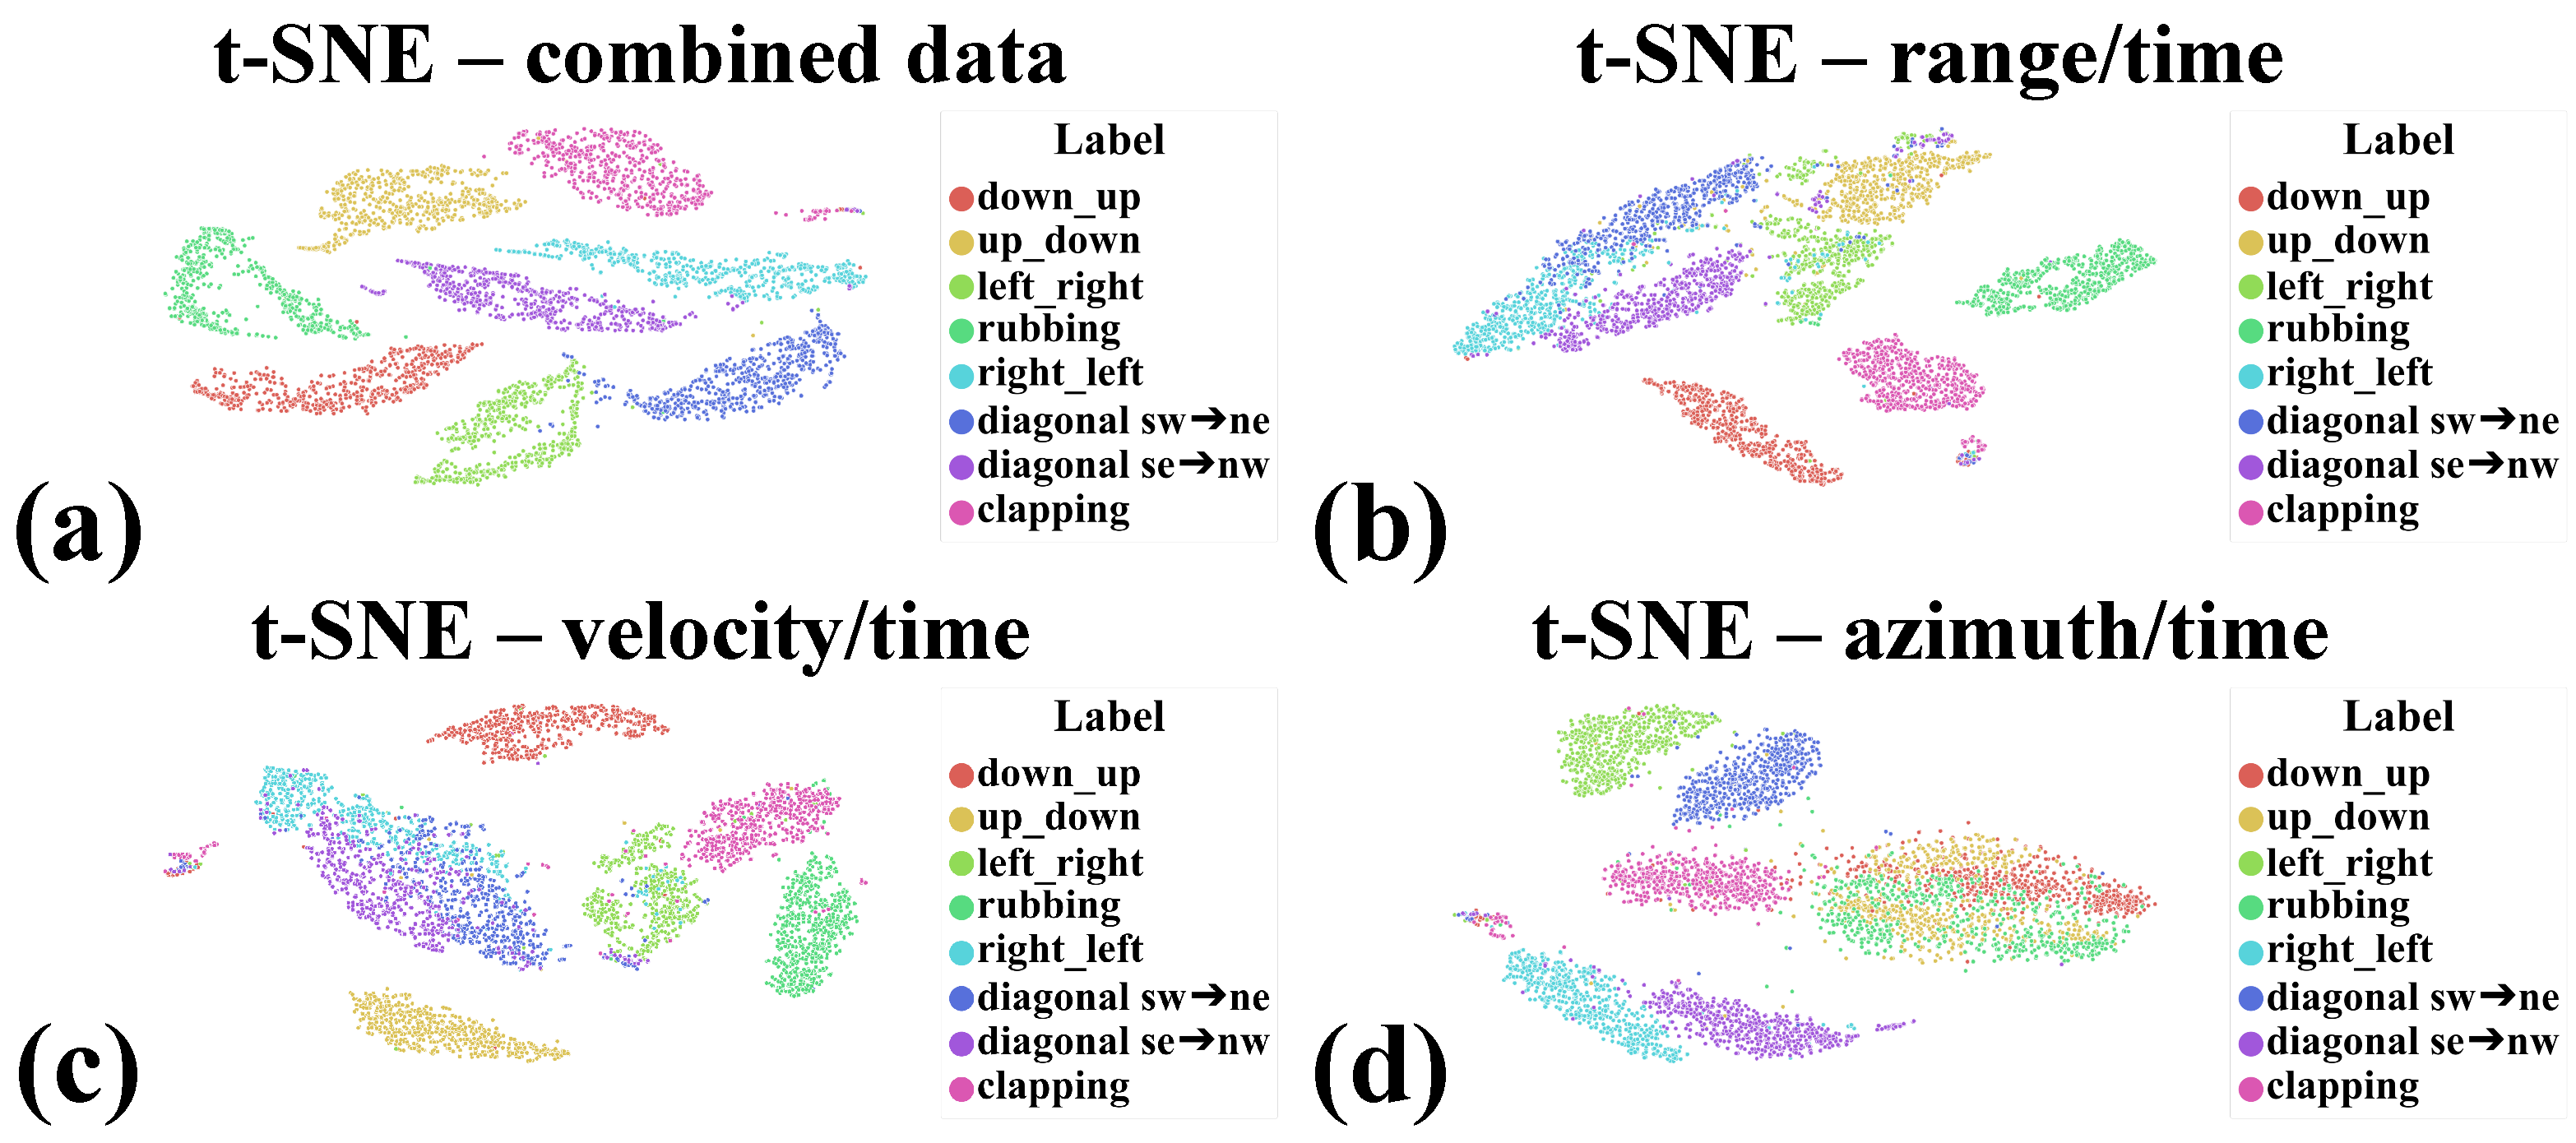
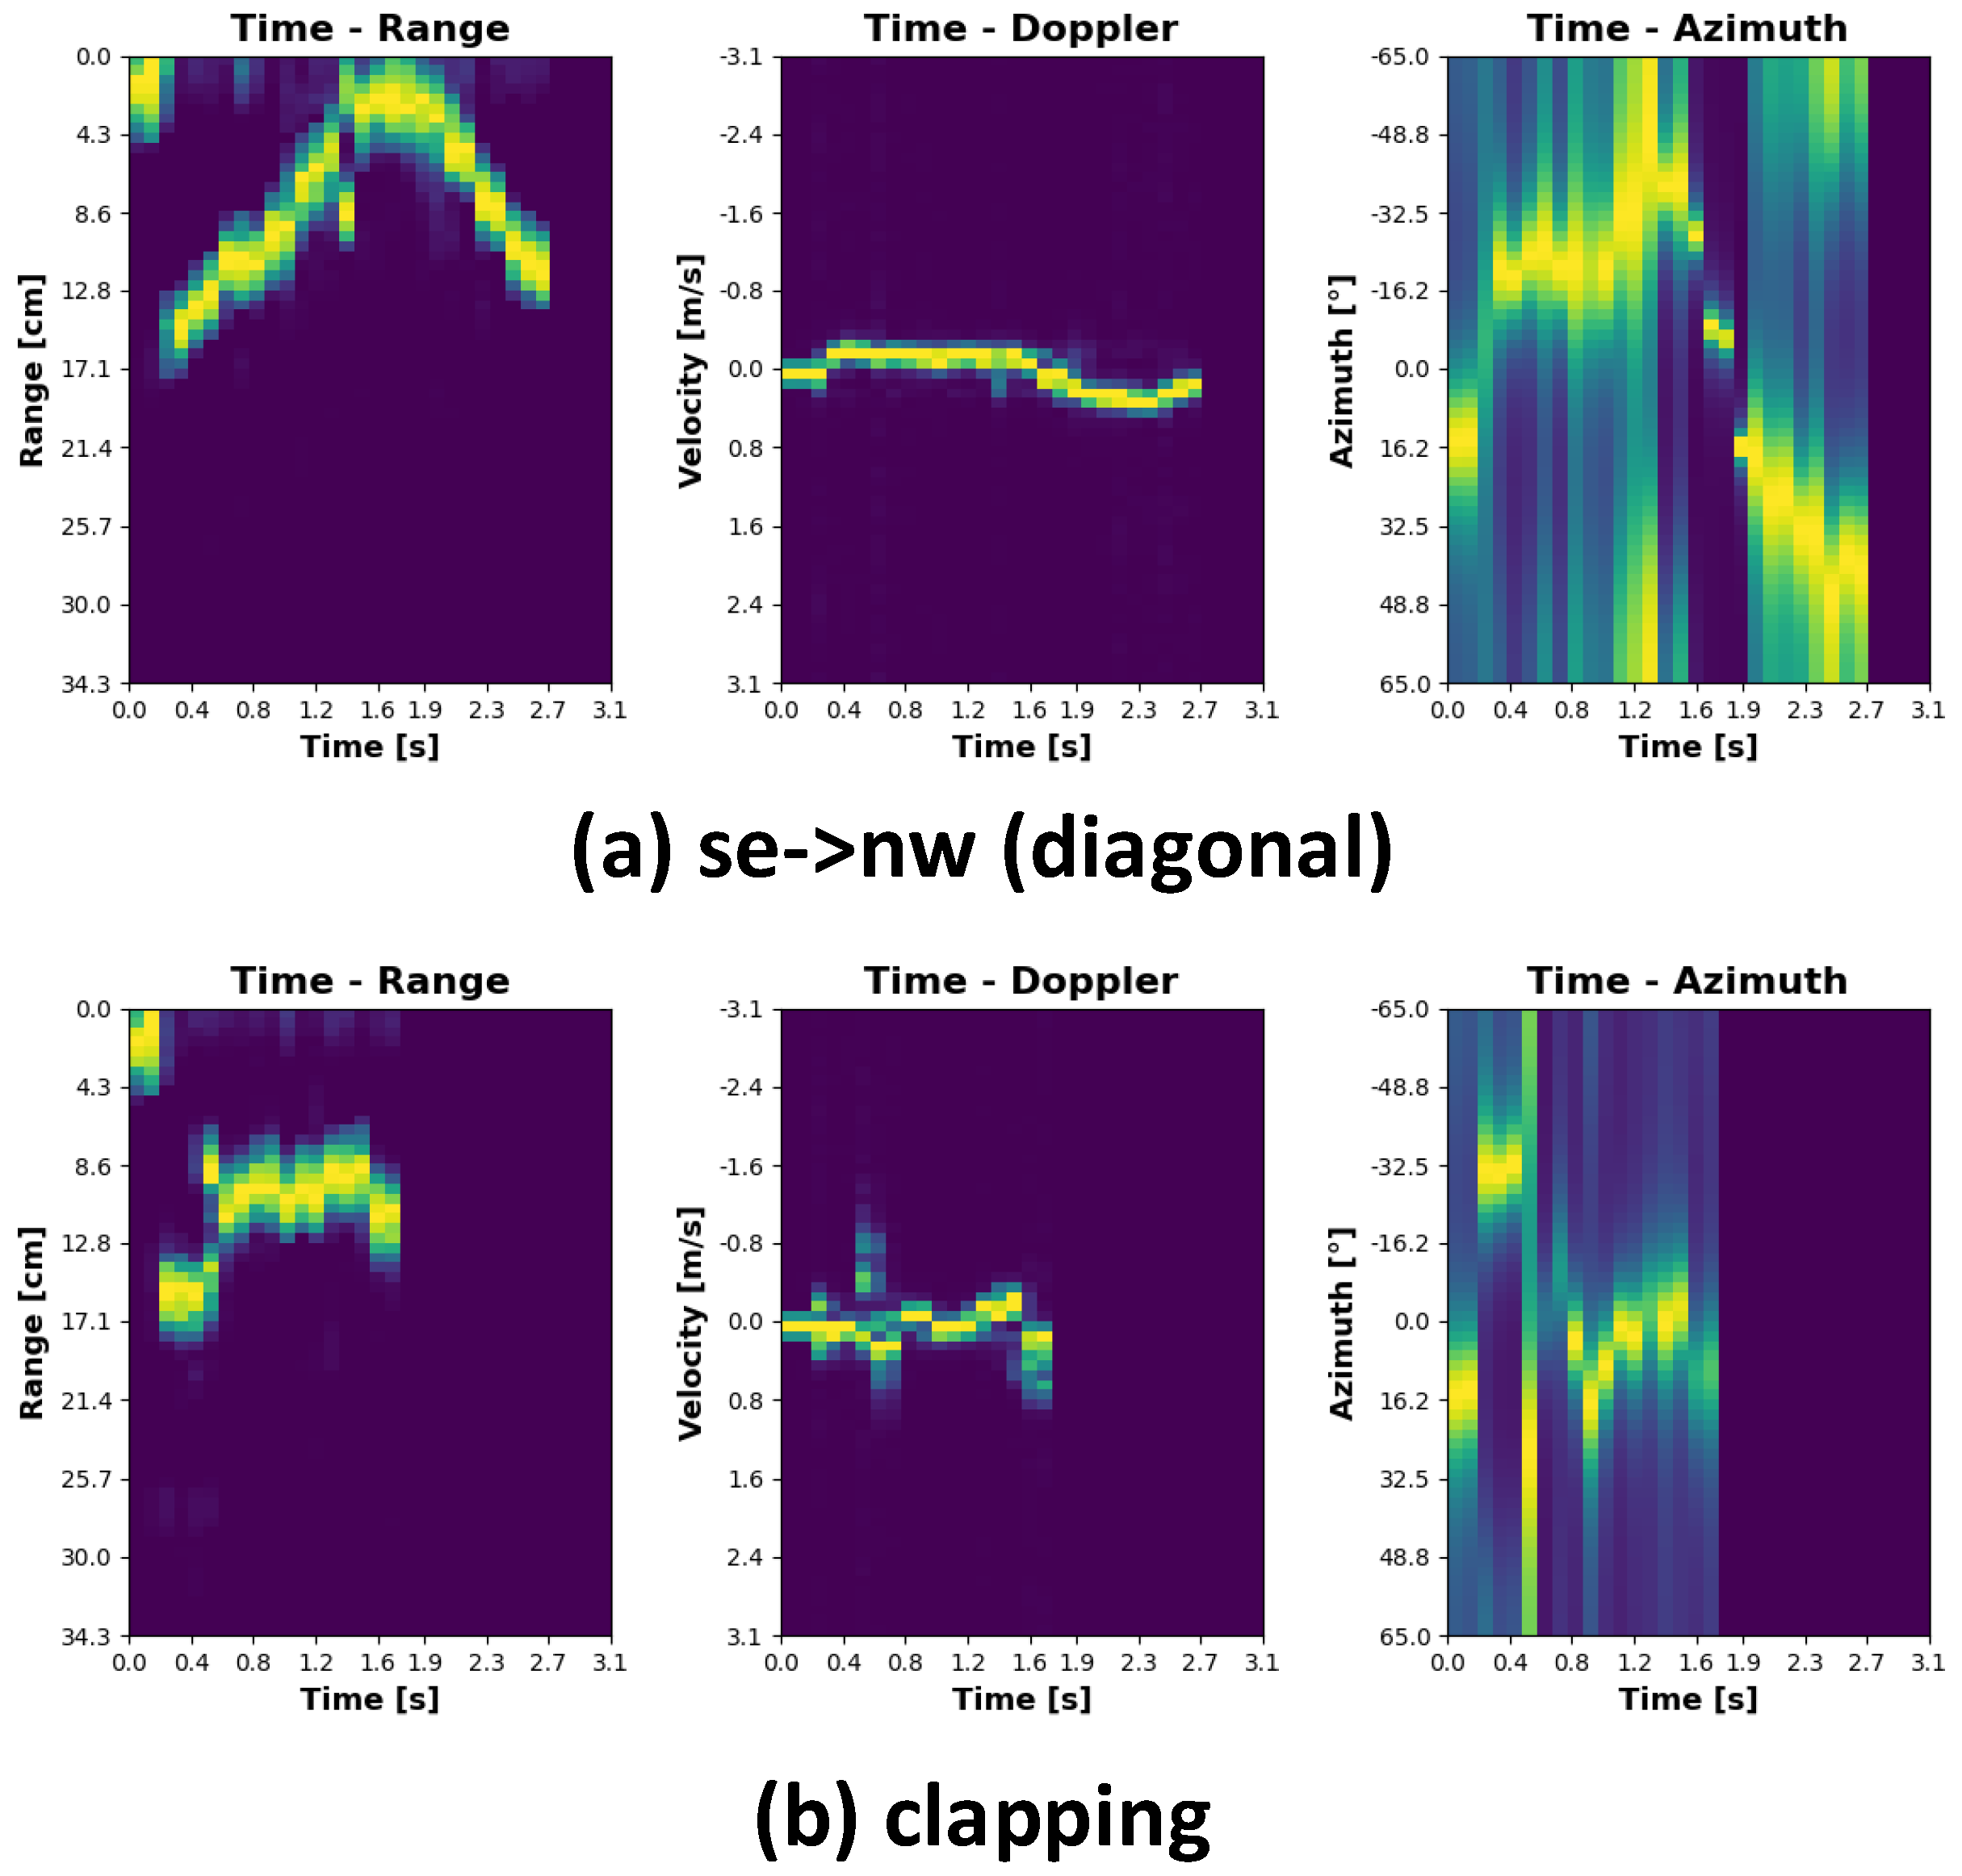
3.4.3. Dataset Generation
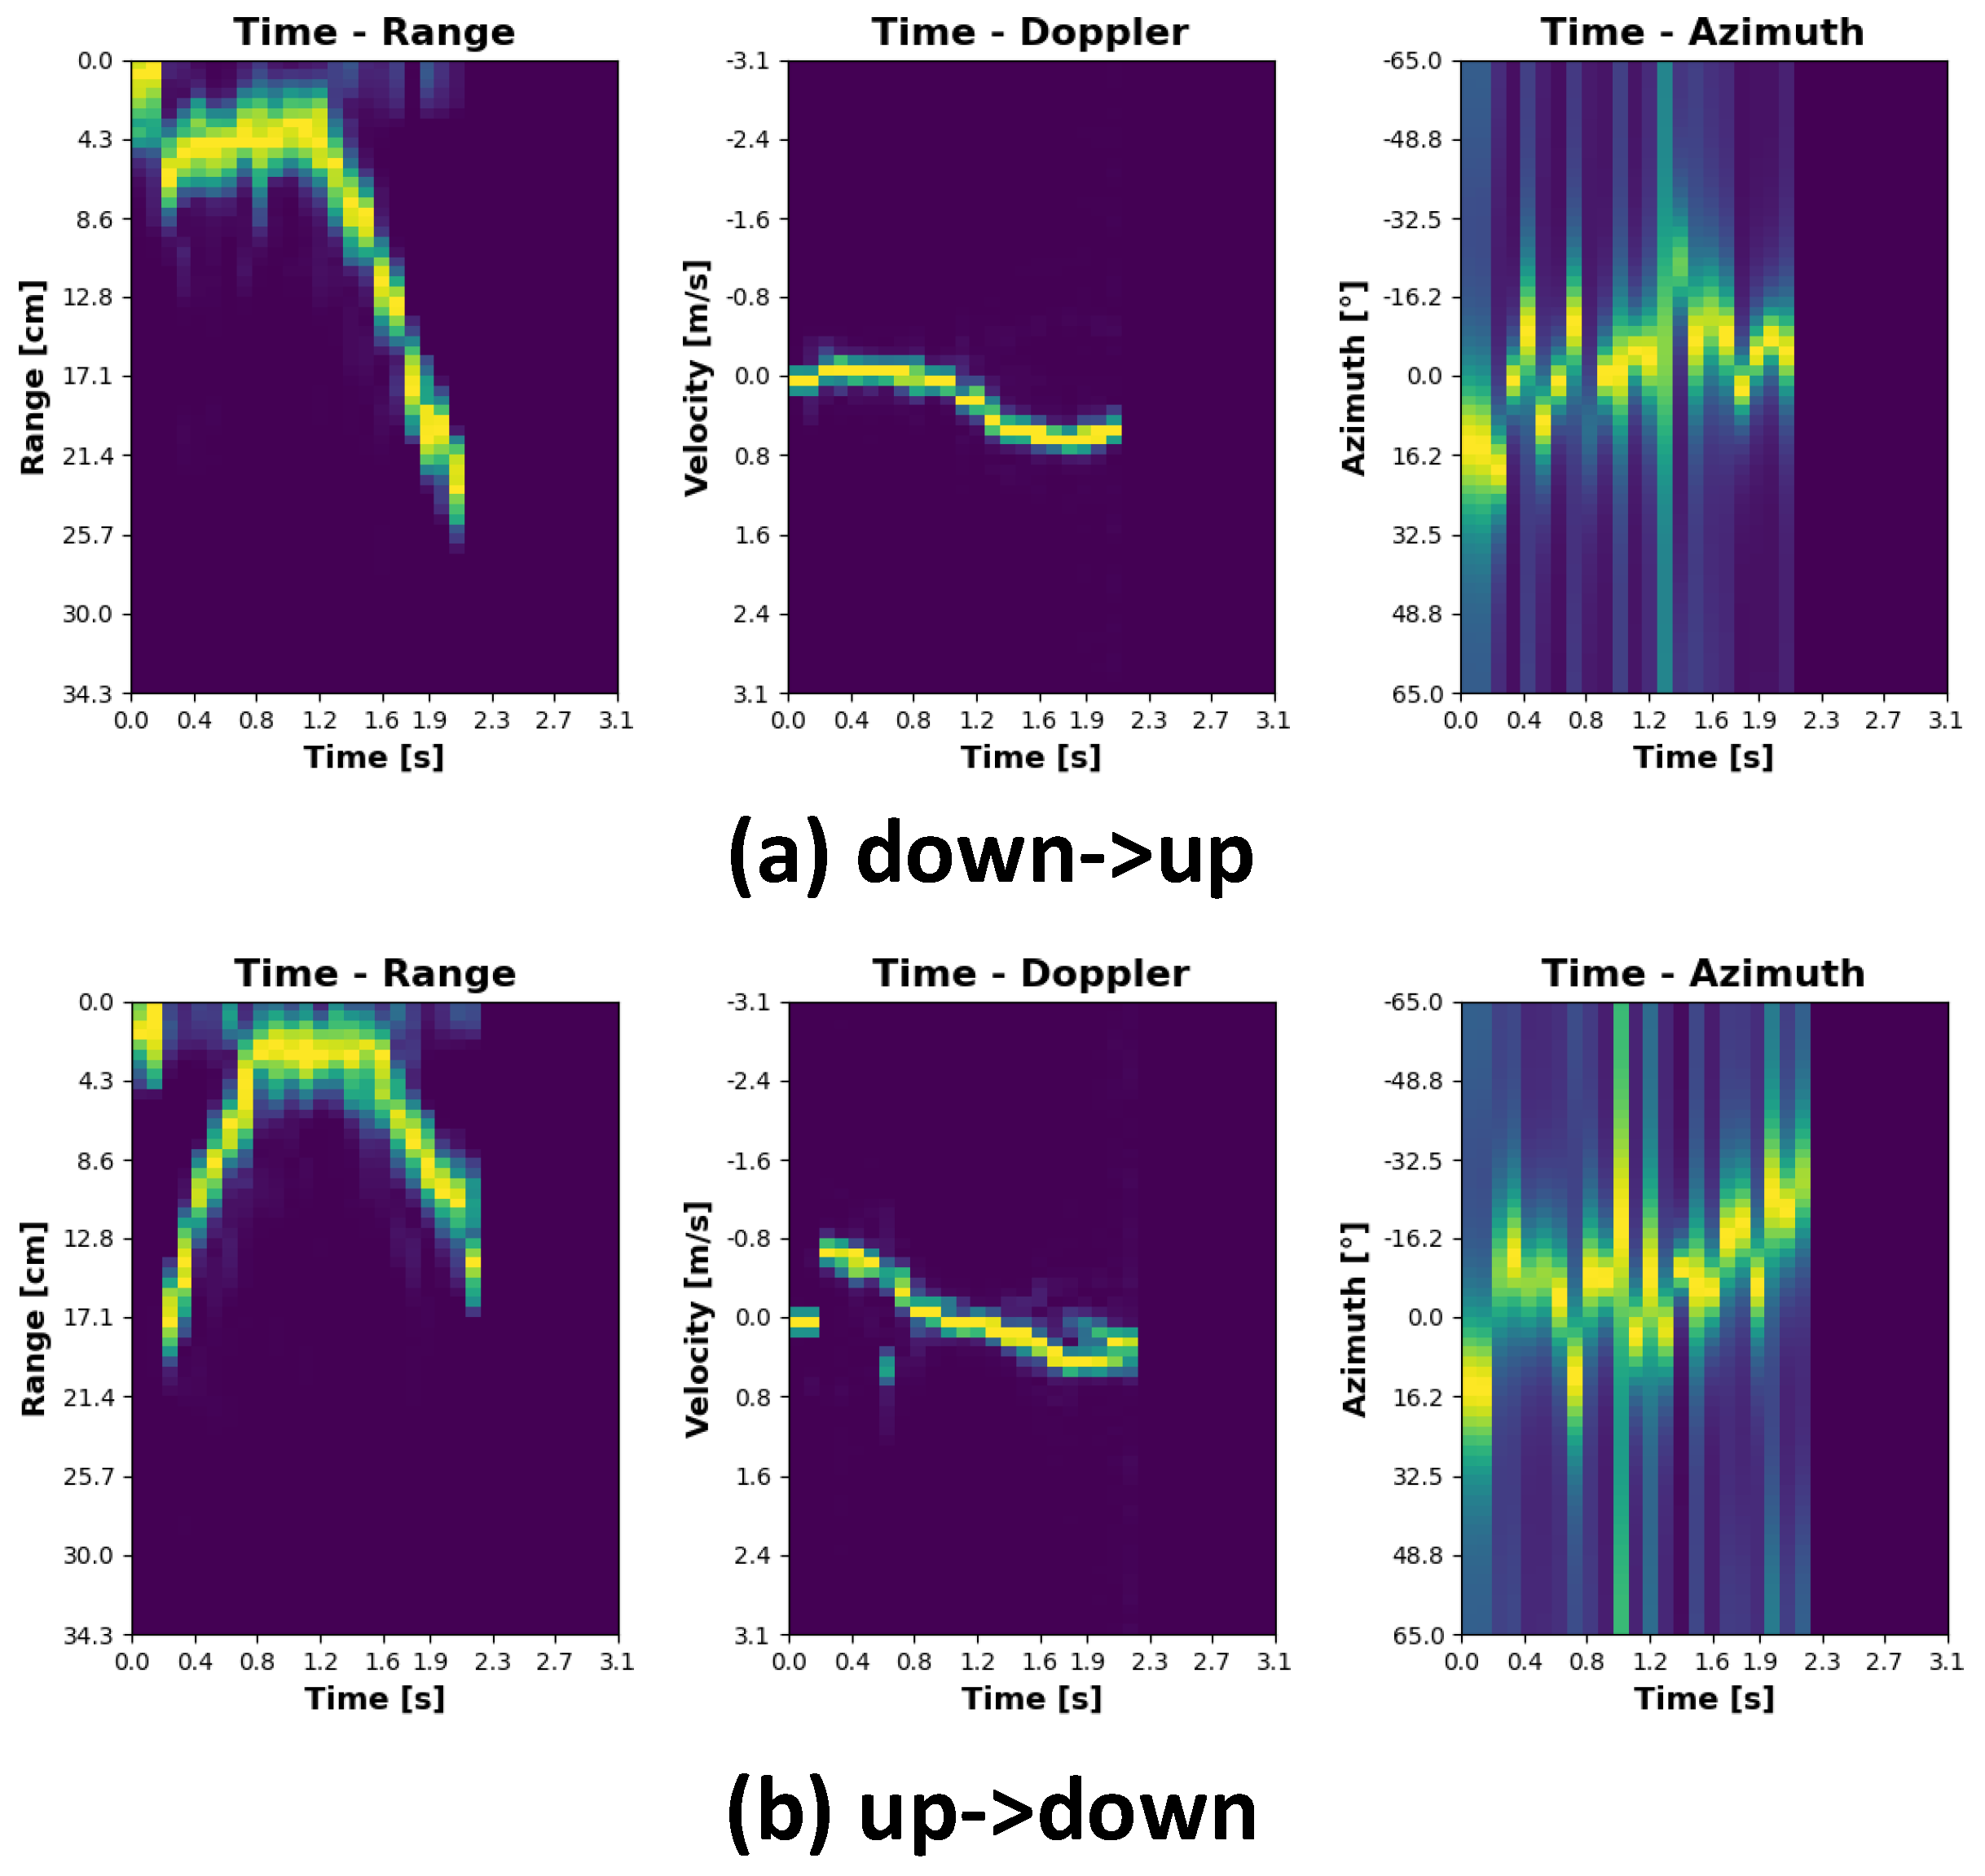
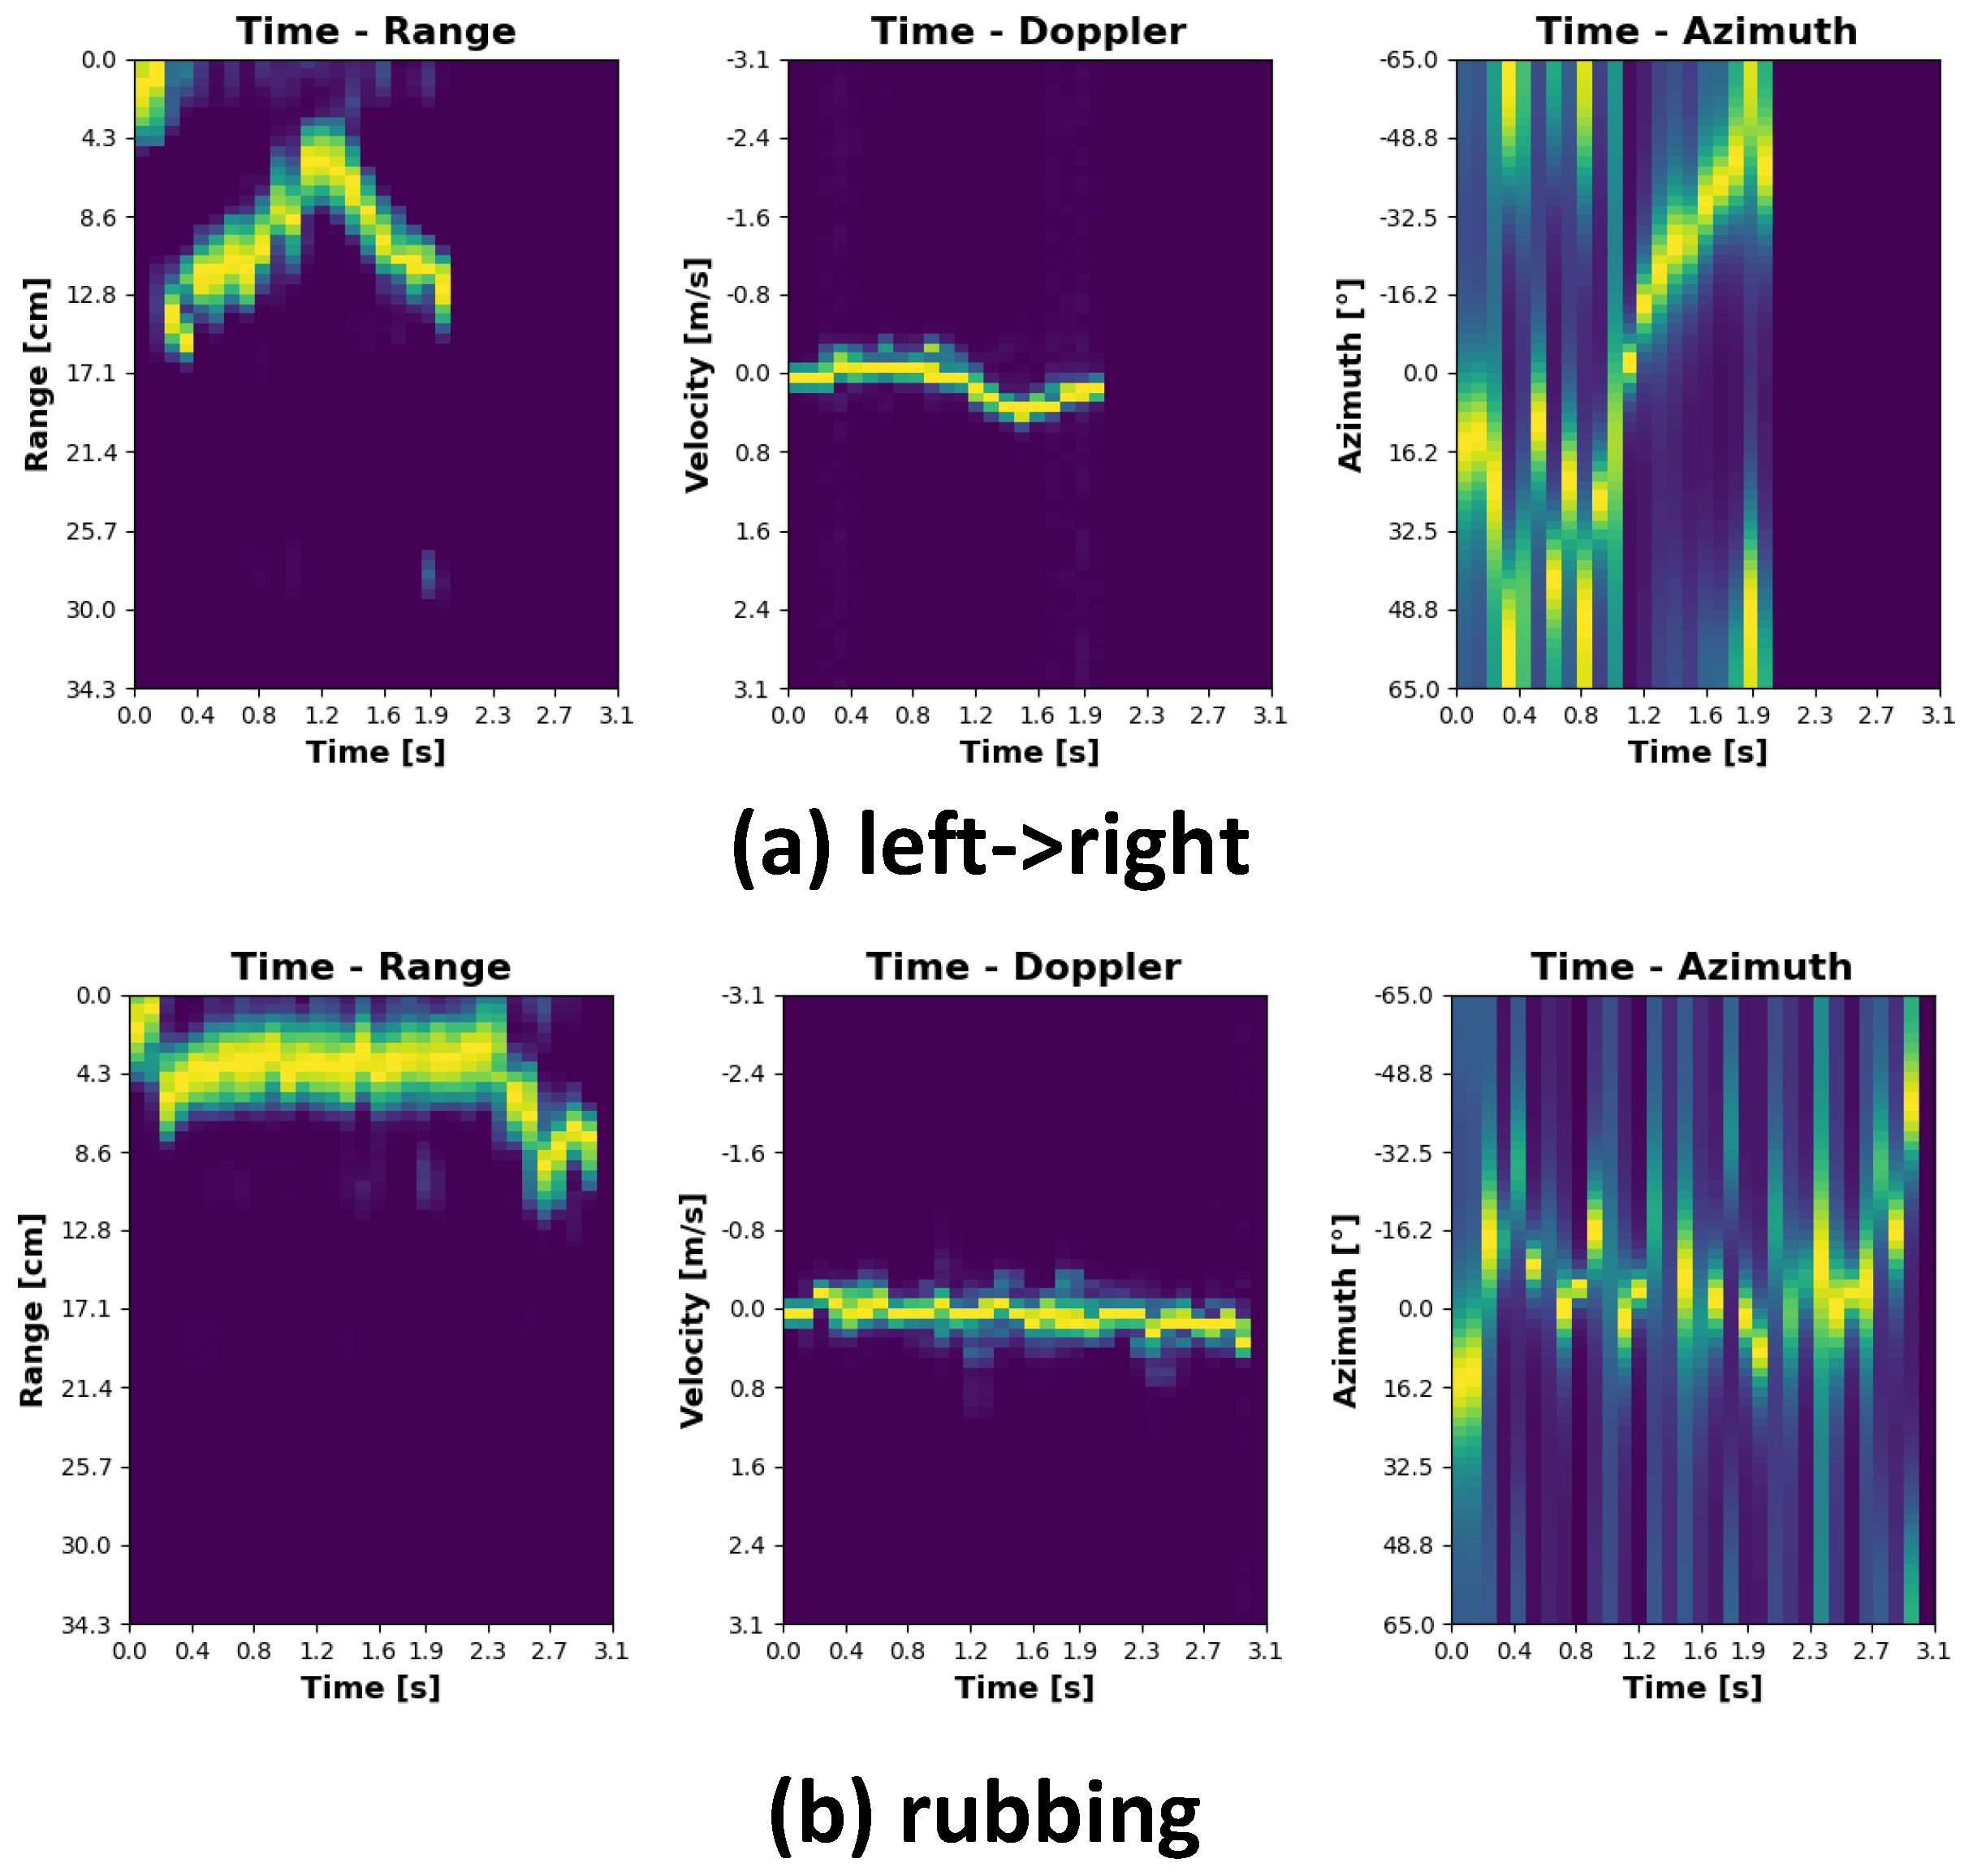
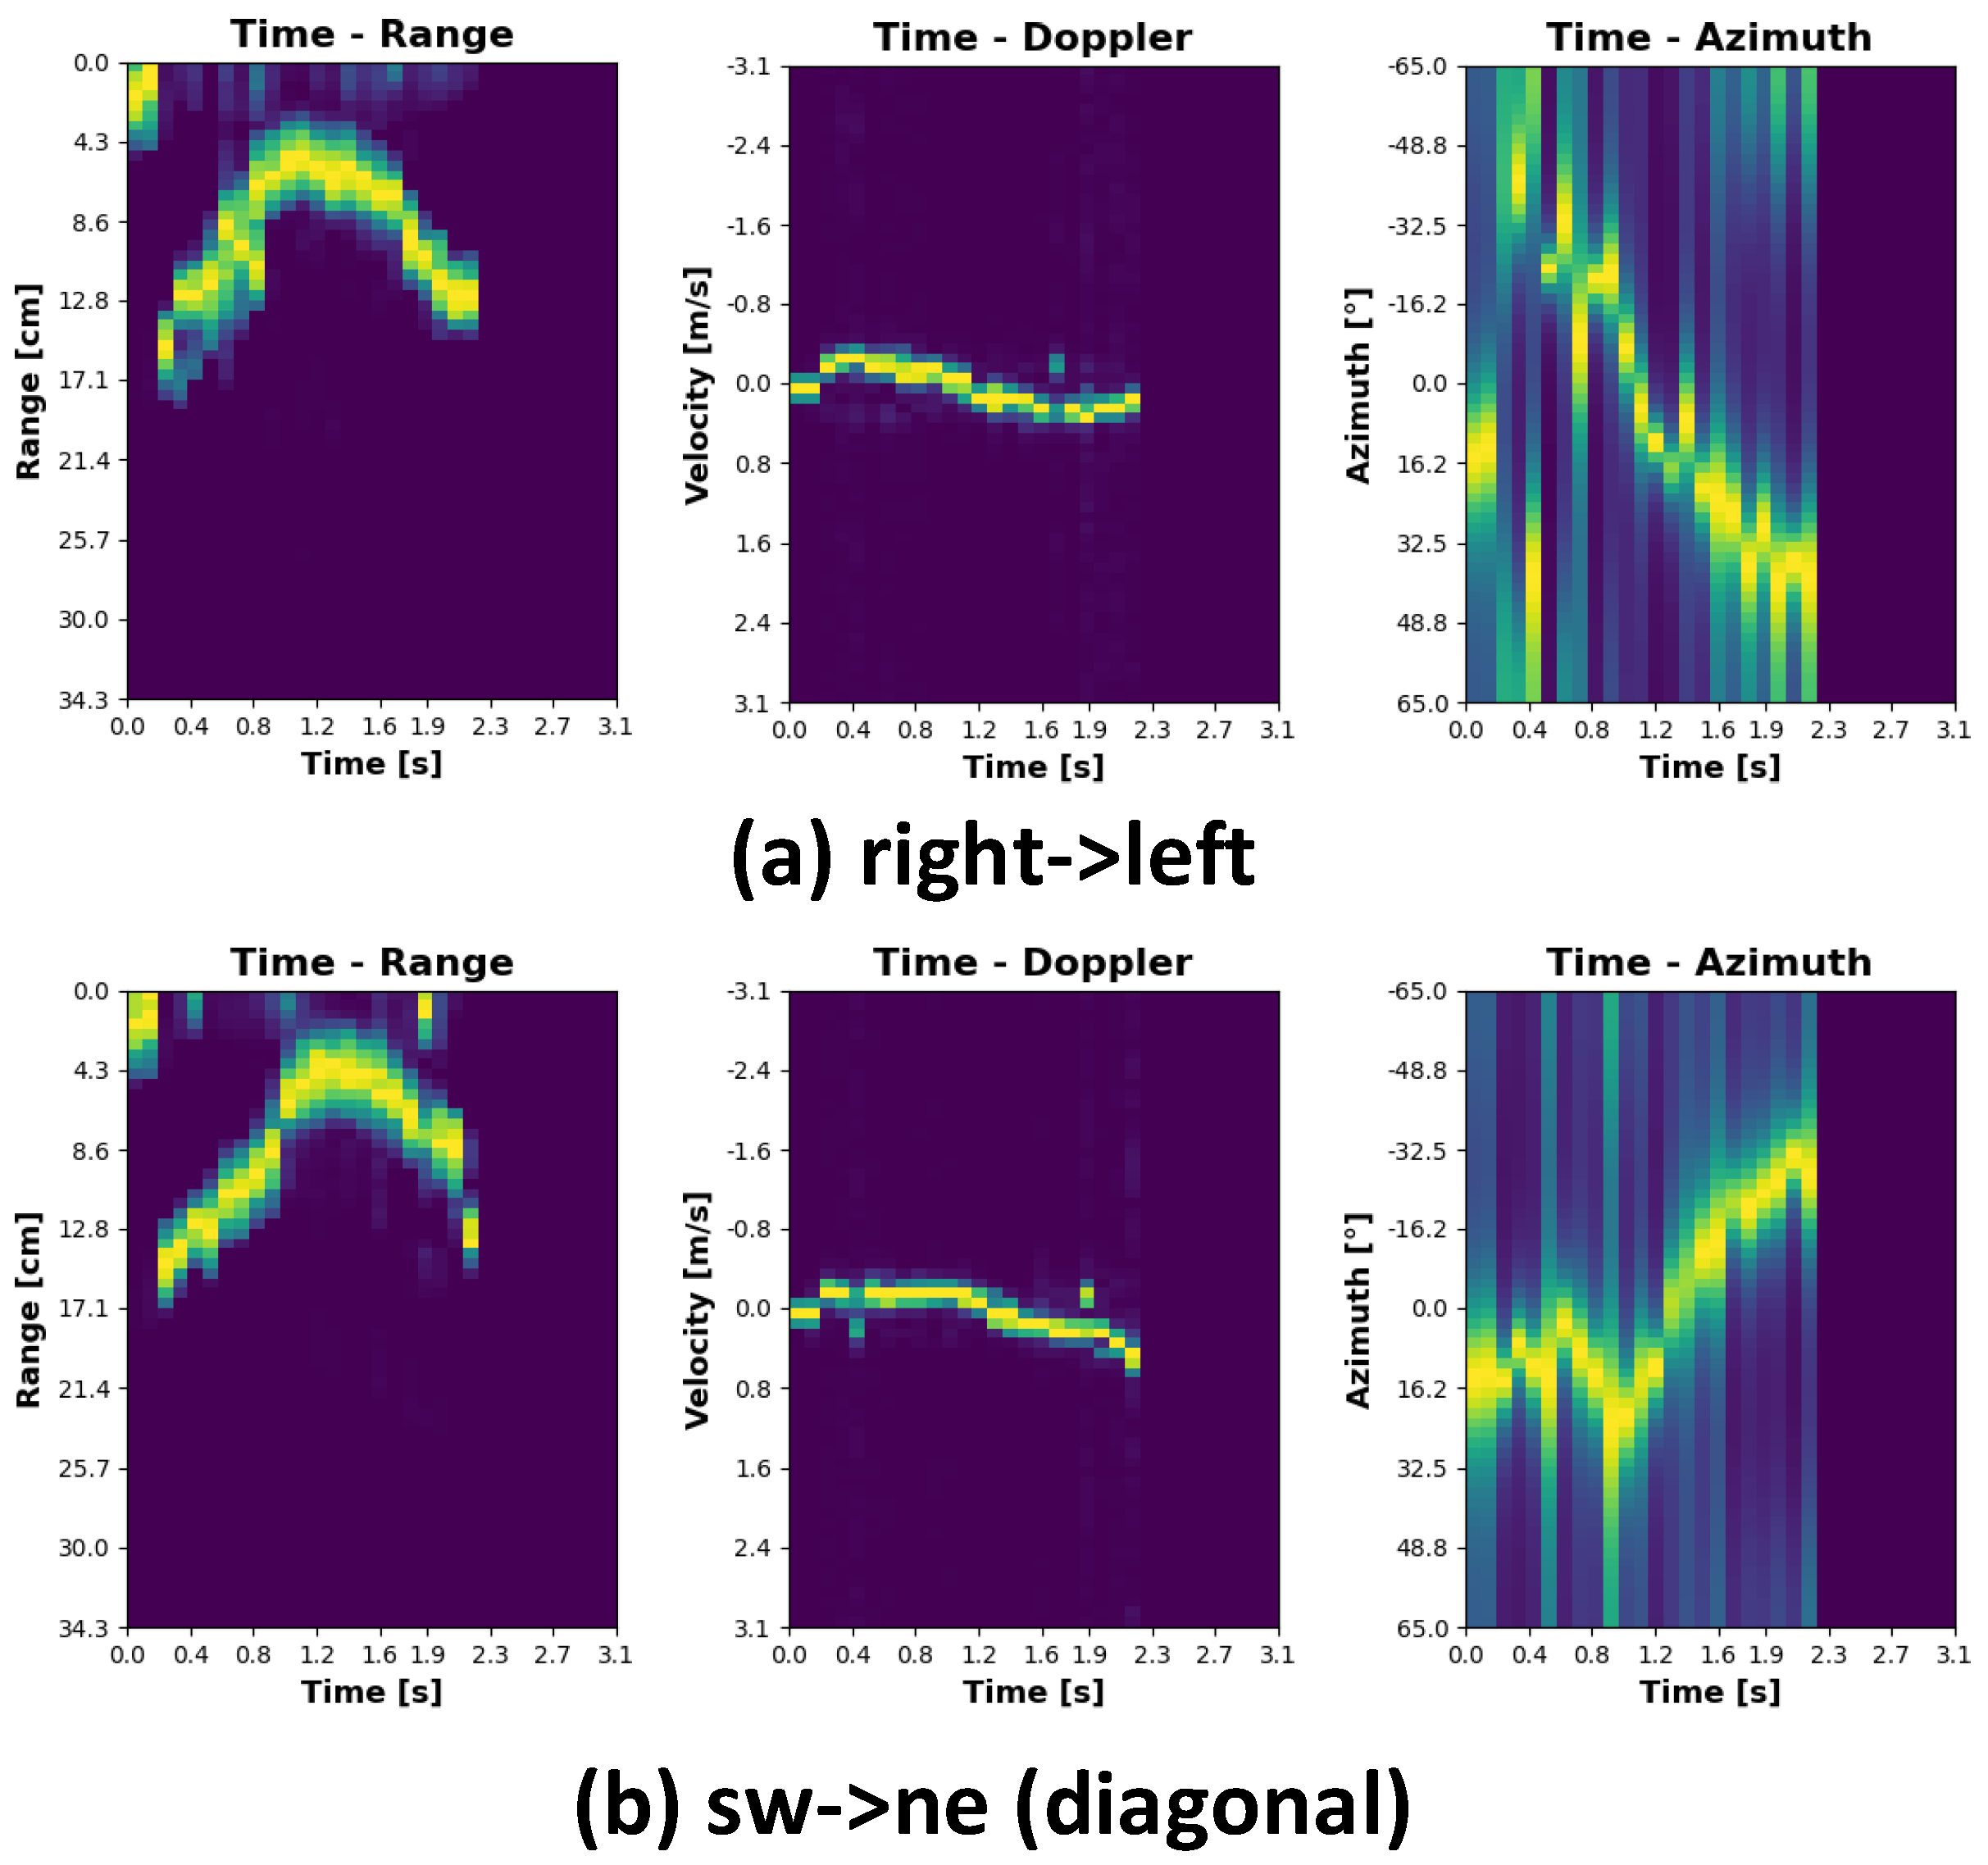
3.5. Gesture Vocabulary
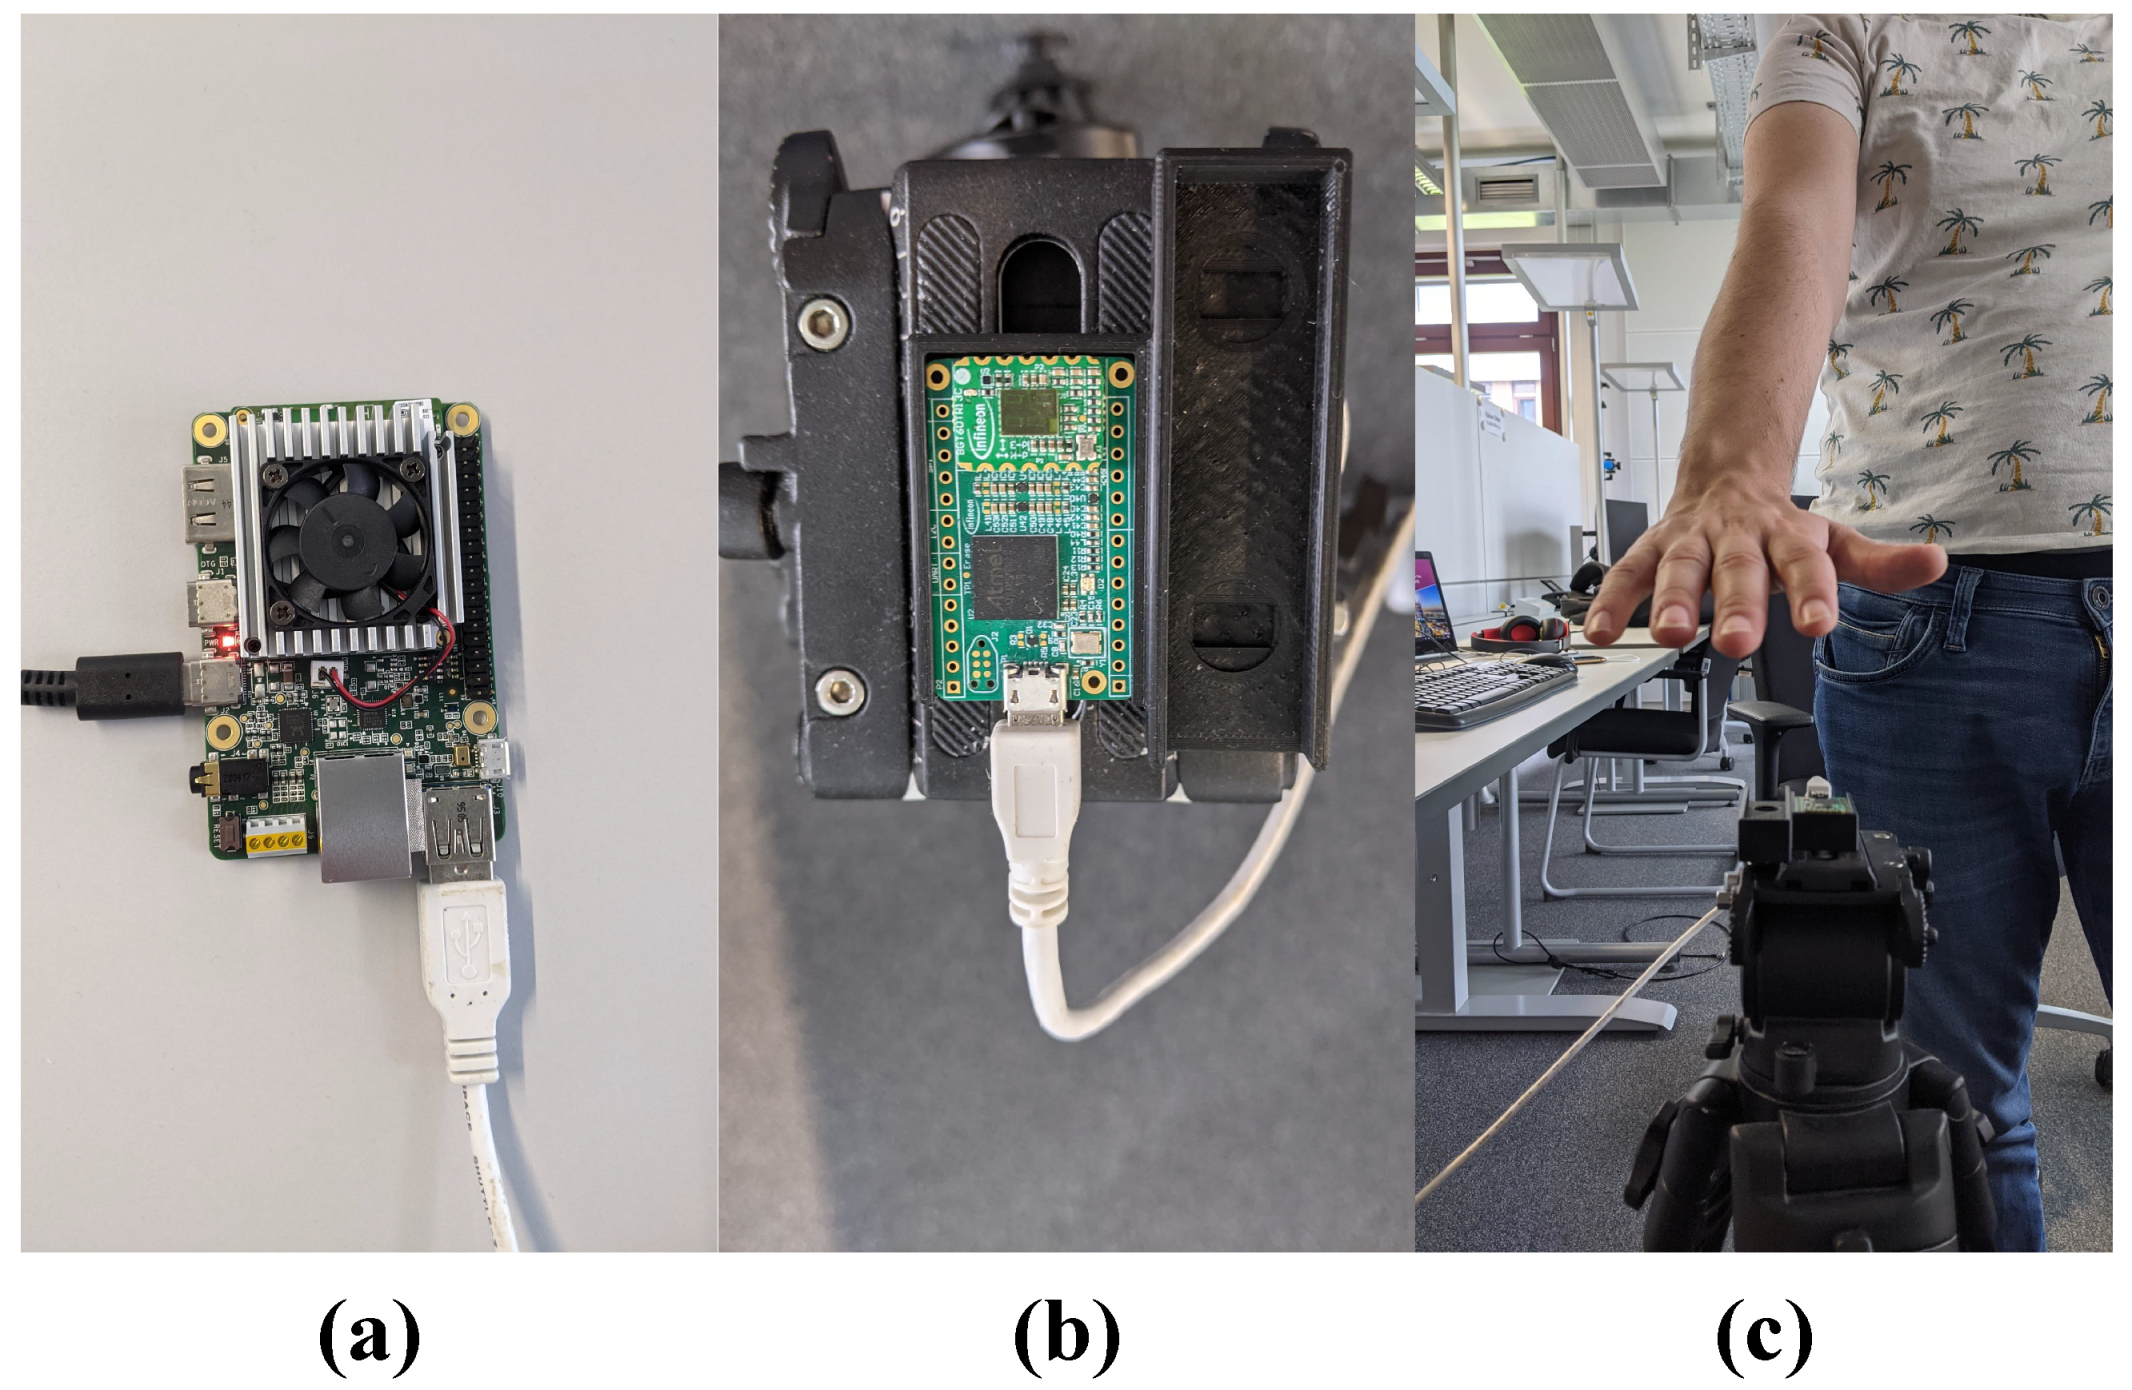
3.6. Experimental Setup
4. Deep Learning Classifier
4.1. CNN Architecture
- Input Layer: representing the input data in the form of a 3D tensor.
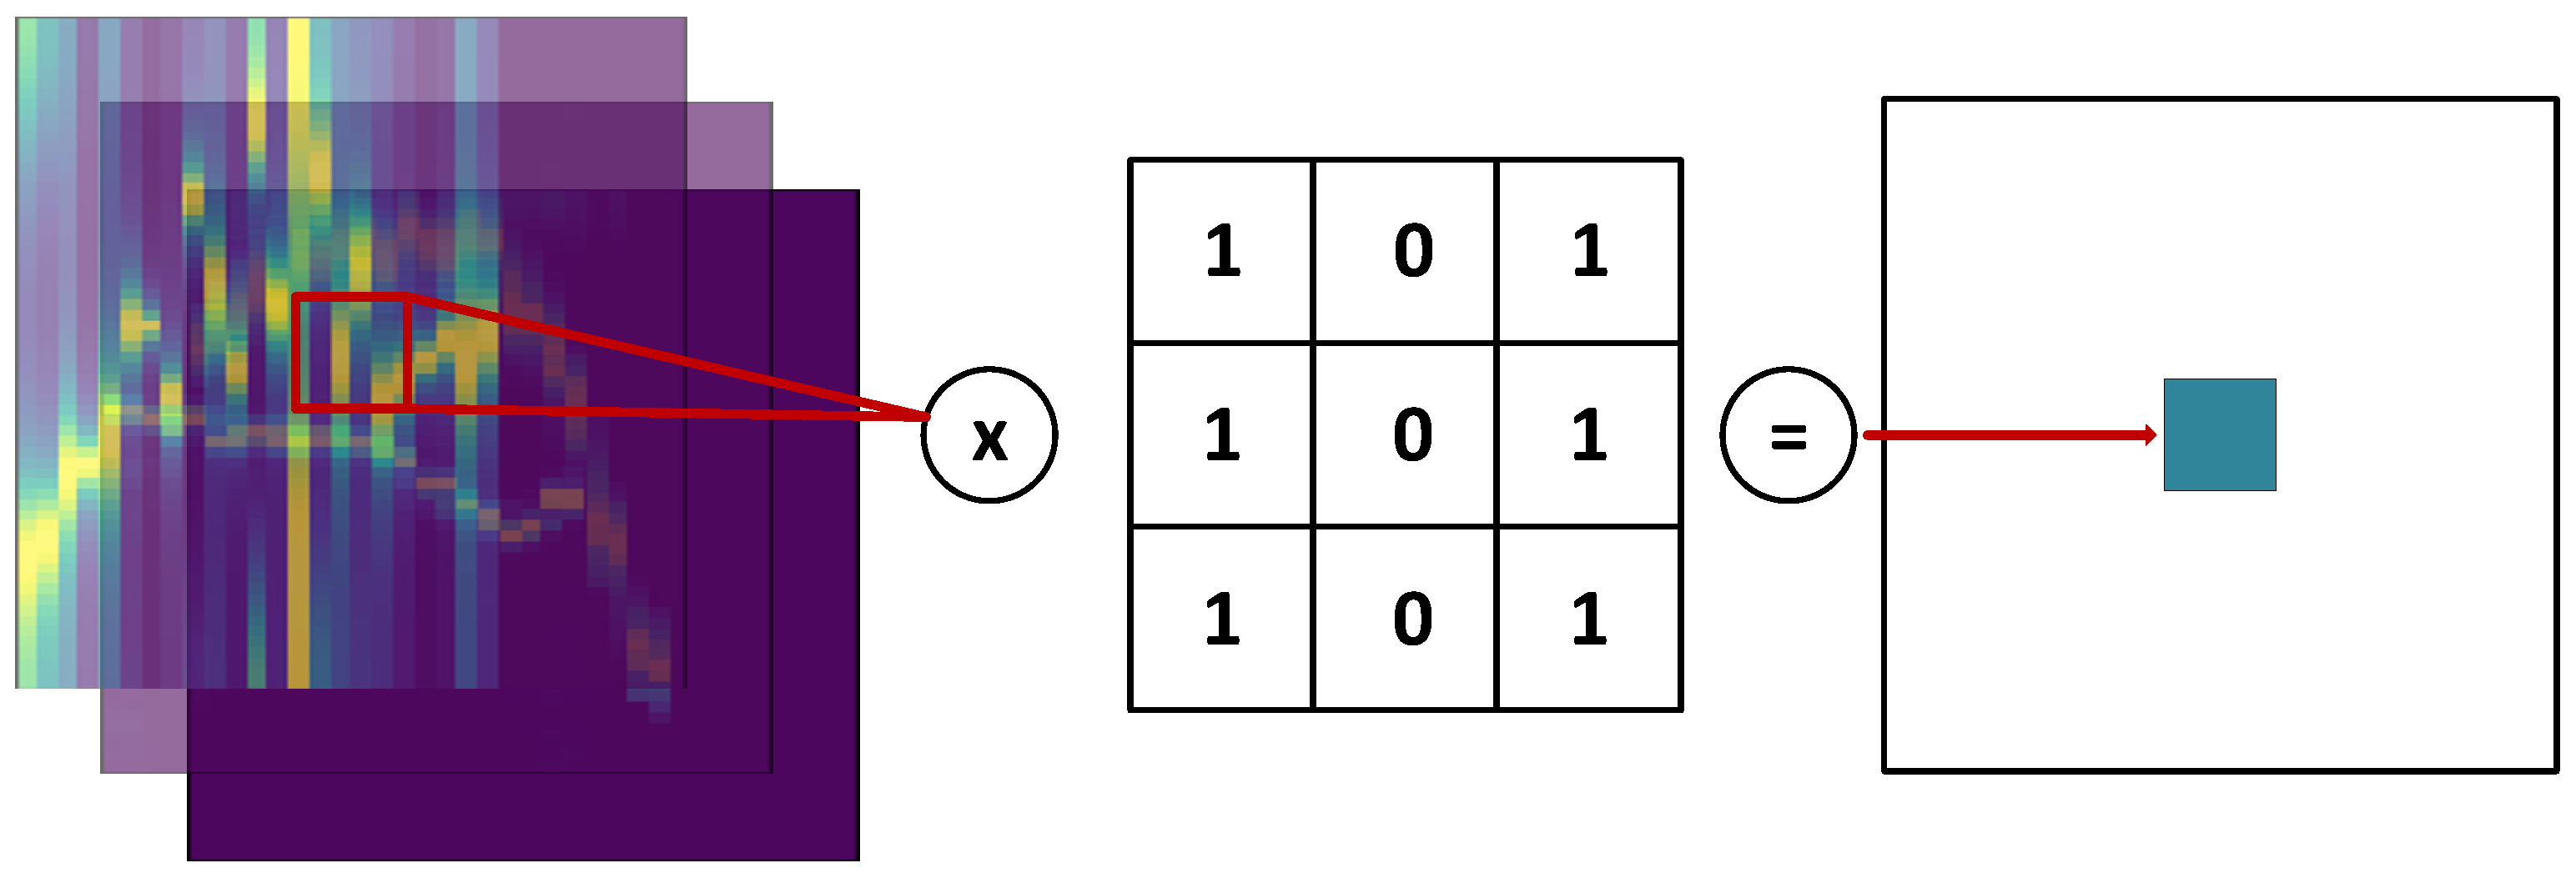
- Convolutional Layer: the main objective of a convolutional layer is the feature extraction achieved by convolving the input data with a kernel in the form of a 2D matrix. The filter kernels are moved through the input data generating the output (feature maps) of the convolutional layer. The principle of operation of the convolutional layer is depicted in Figure 14.
- Batch Normalization Layer: the layer used after convolution to speed up the training process.
- Activation Function: the activation function, e.g., ReLu, LeakyRelu, ReLu6, SiLu, SeLu, and GELU. It is used to introduce the nonlinearity, and to be able to learn more sophisticated data patterns.
- MaxPooling2D: the layer utilized for the dimensionality reduction and feature extraction of the most relevant data.
- Regularization Layers: e.g., Dropout, AlphaDropout, and GaussianDropout; employed to make the classifier noise resistant.
4.2. Radar Edge Network
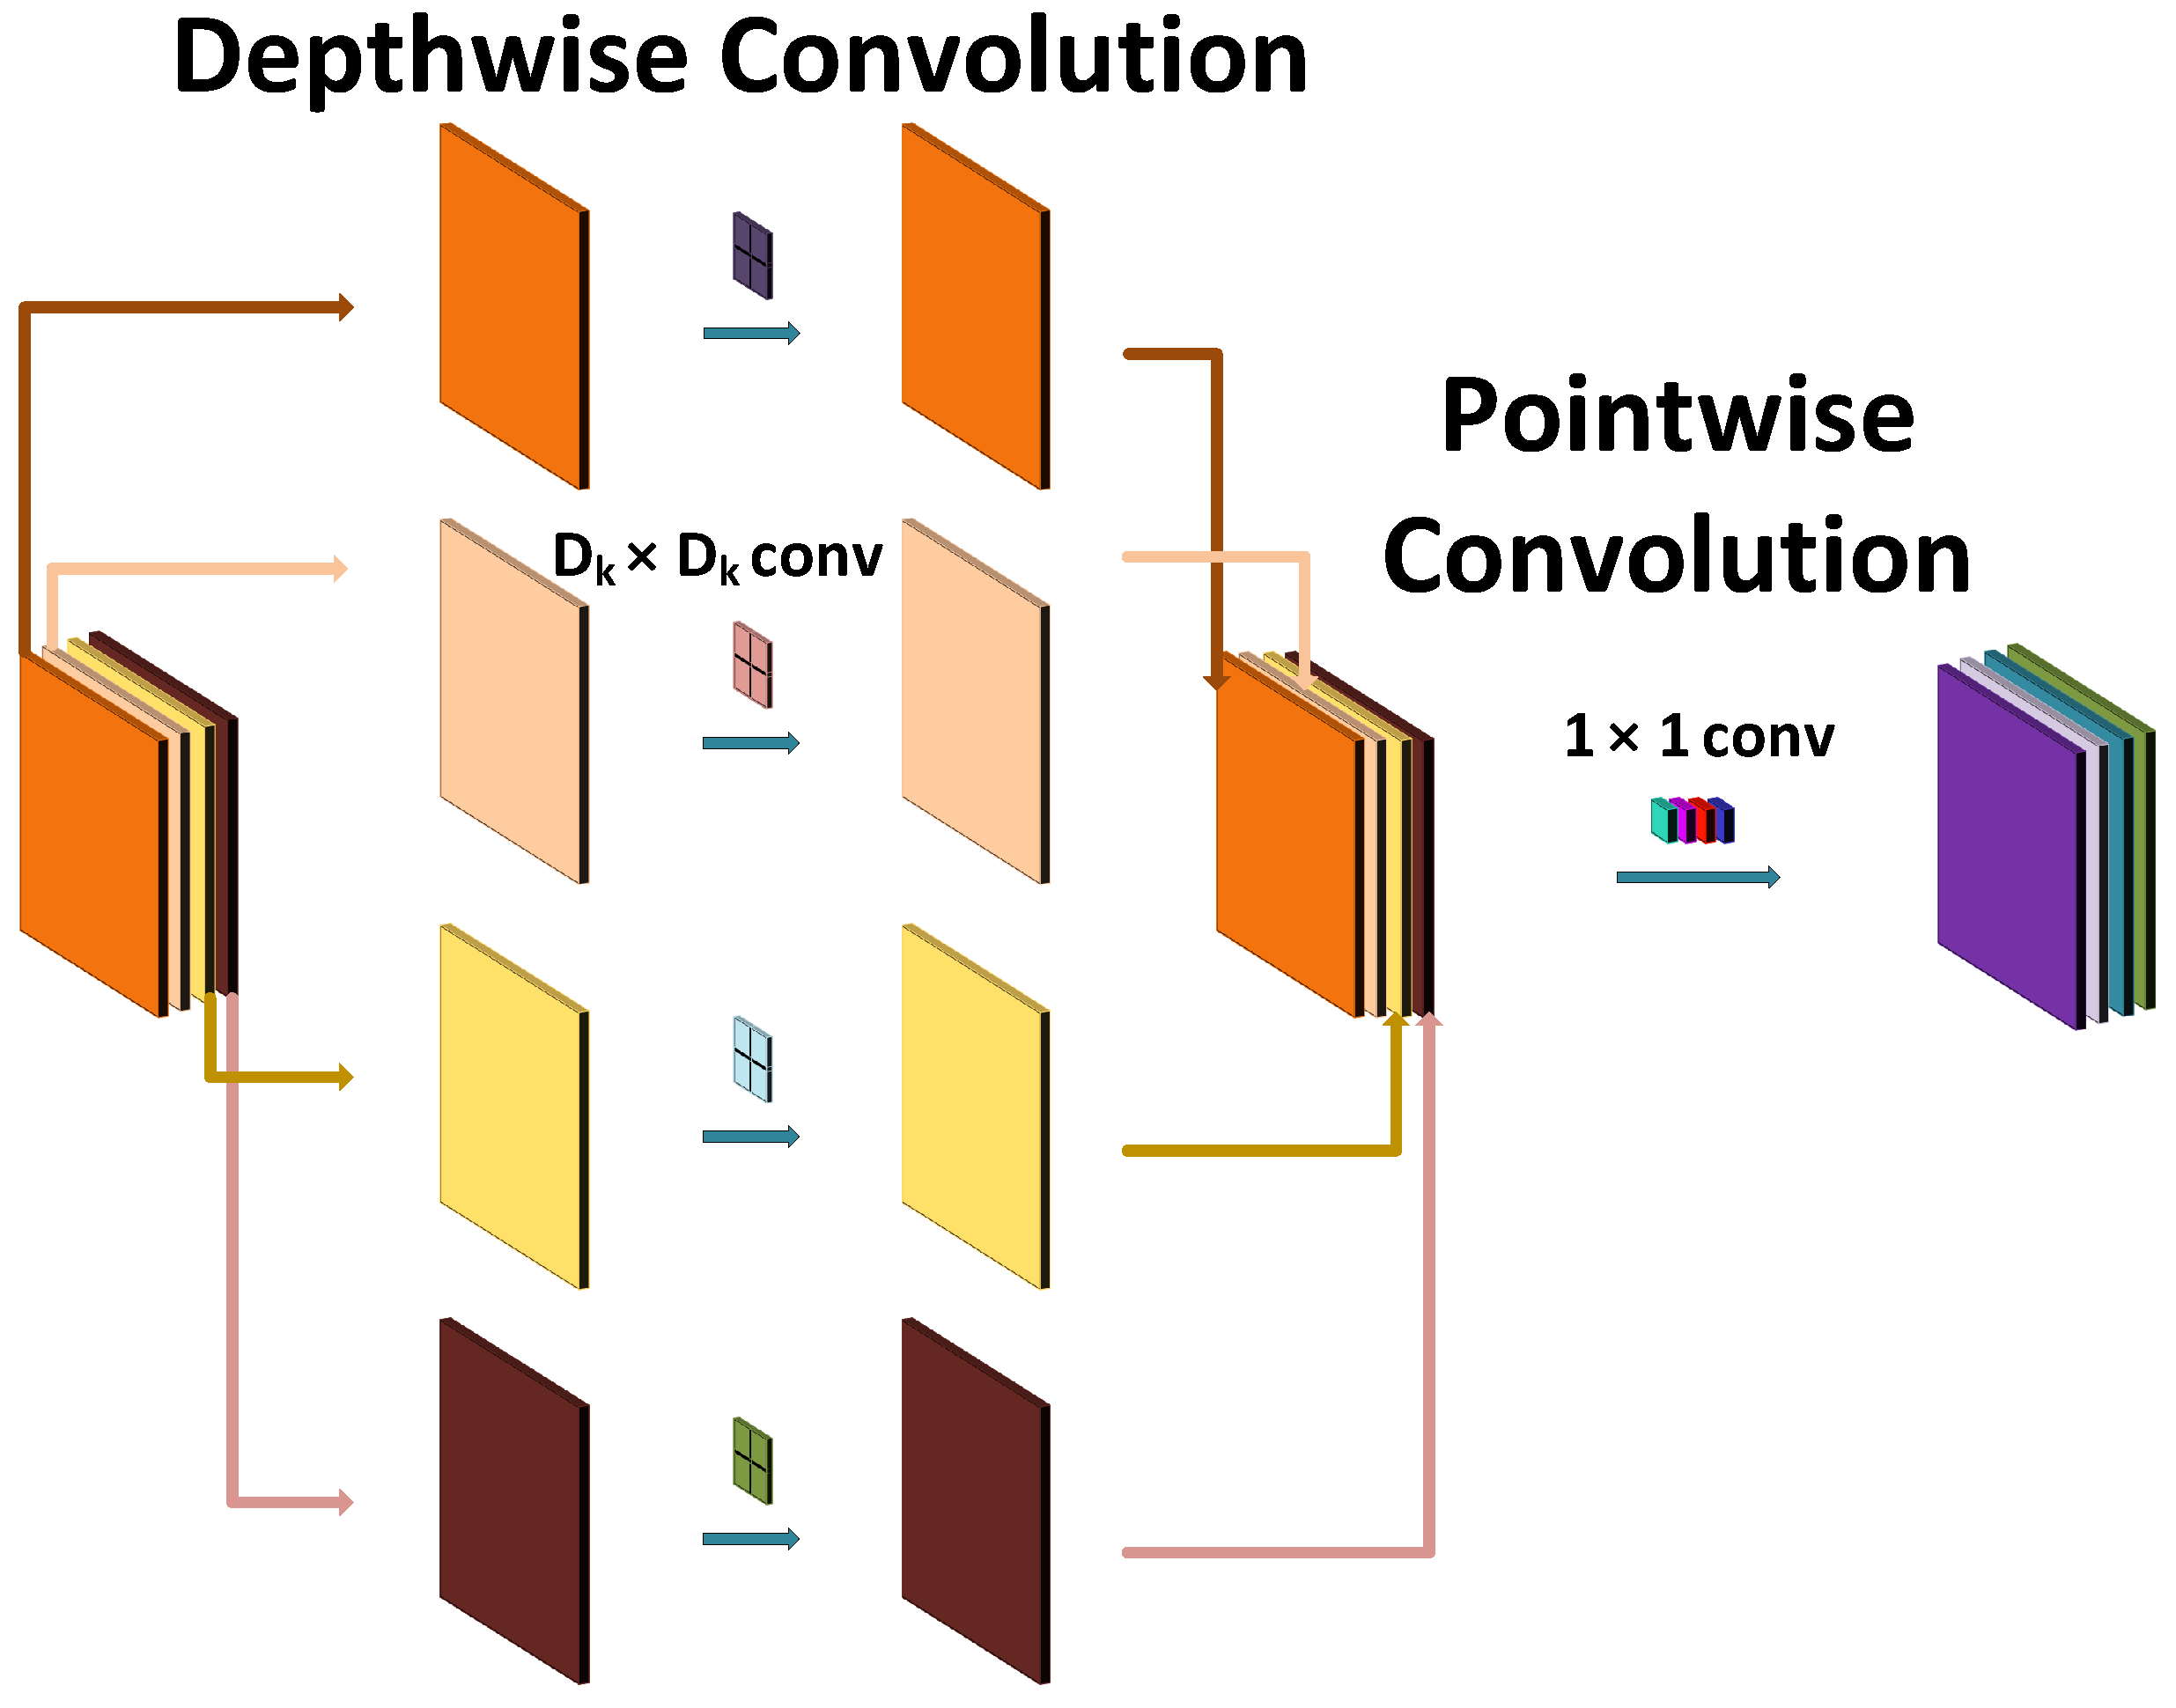
4.2.1. Depthwise Separable Convolutions
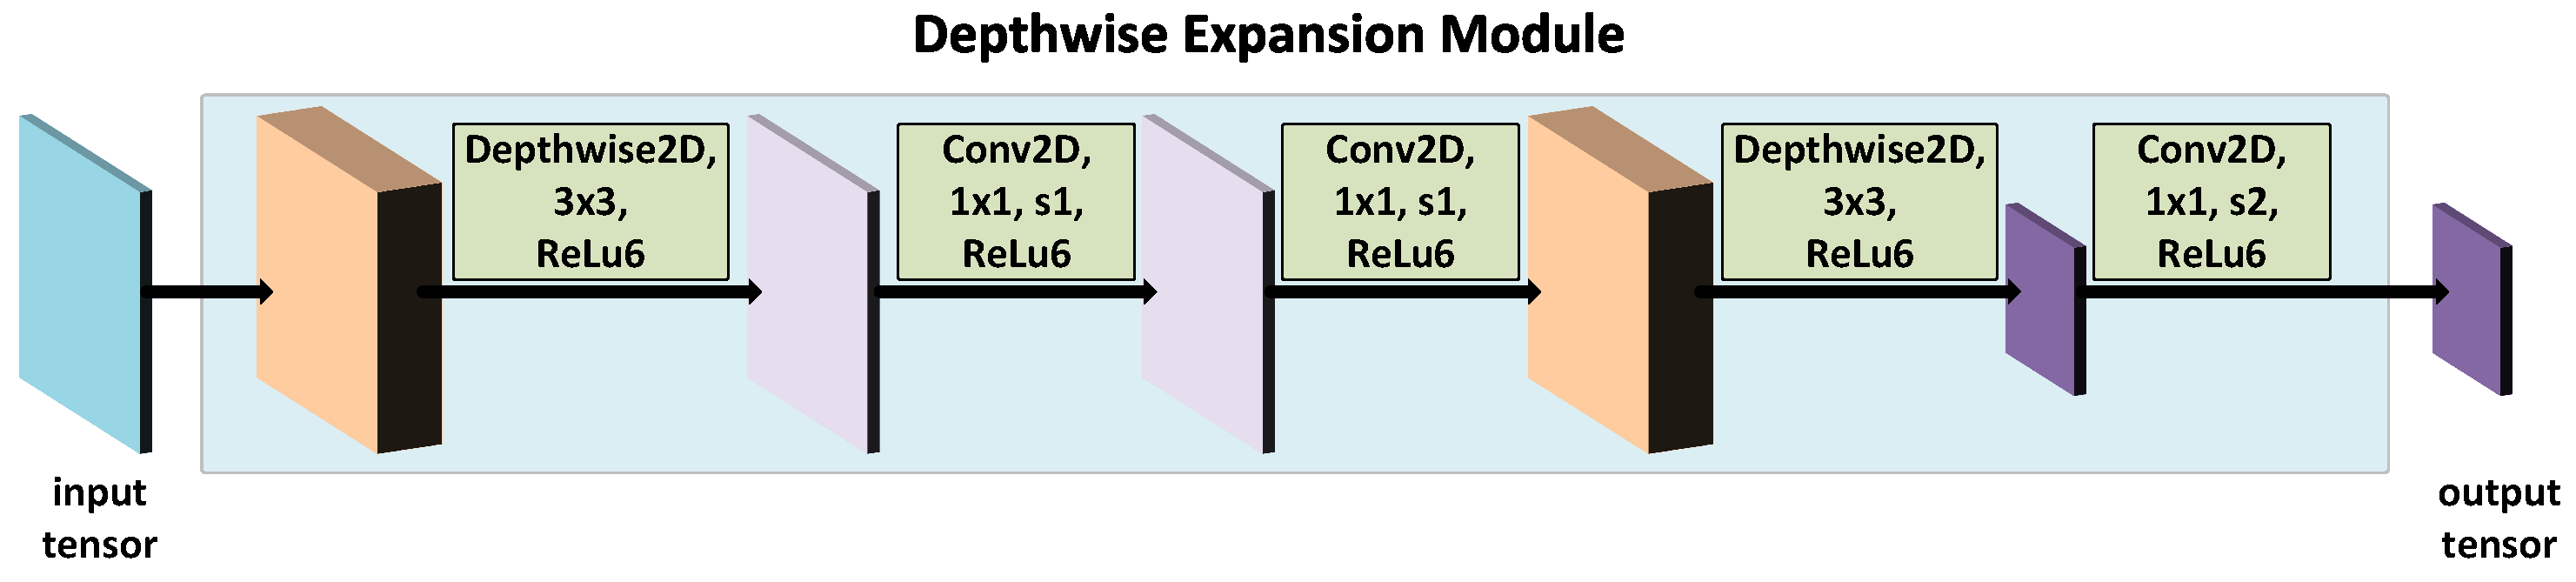
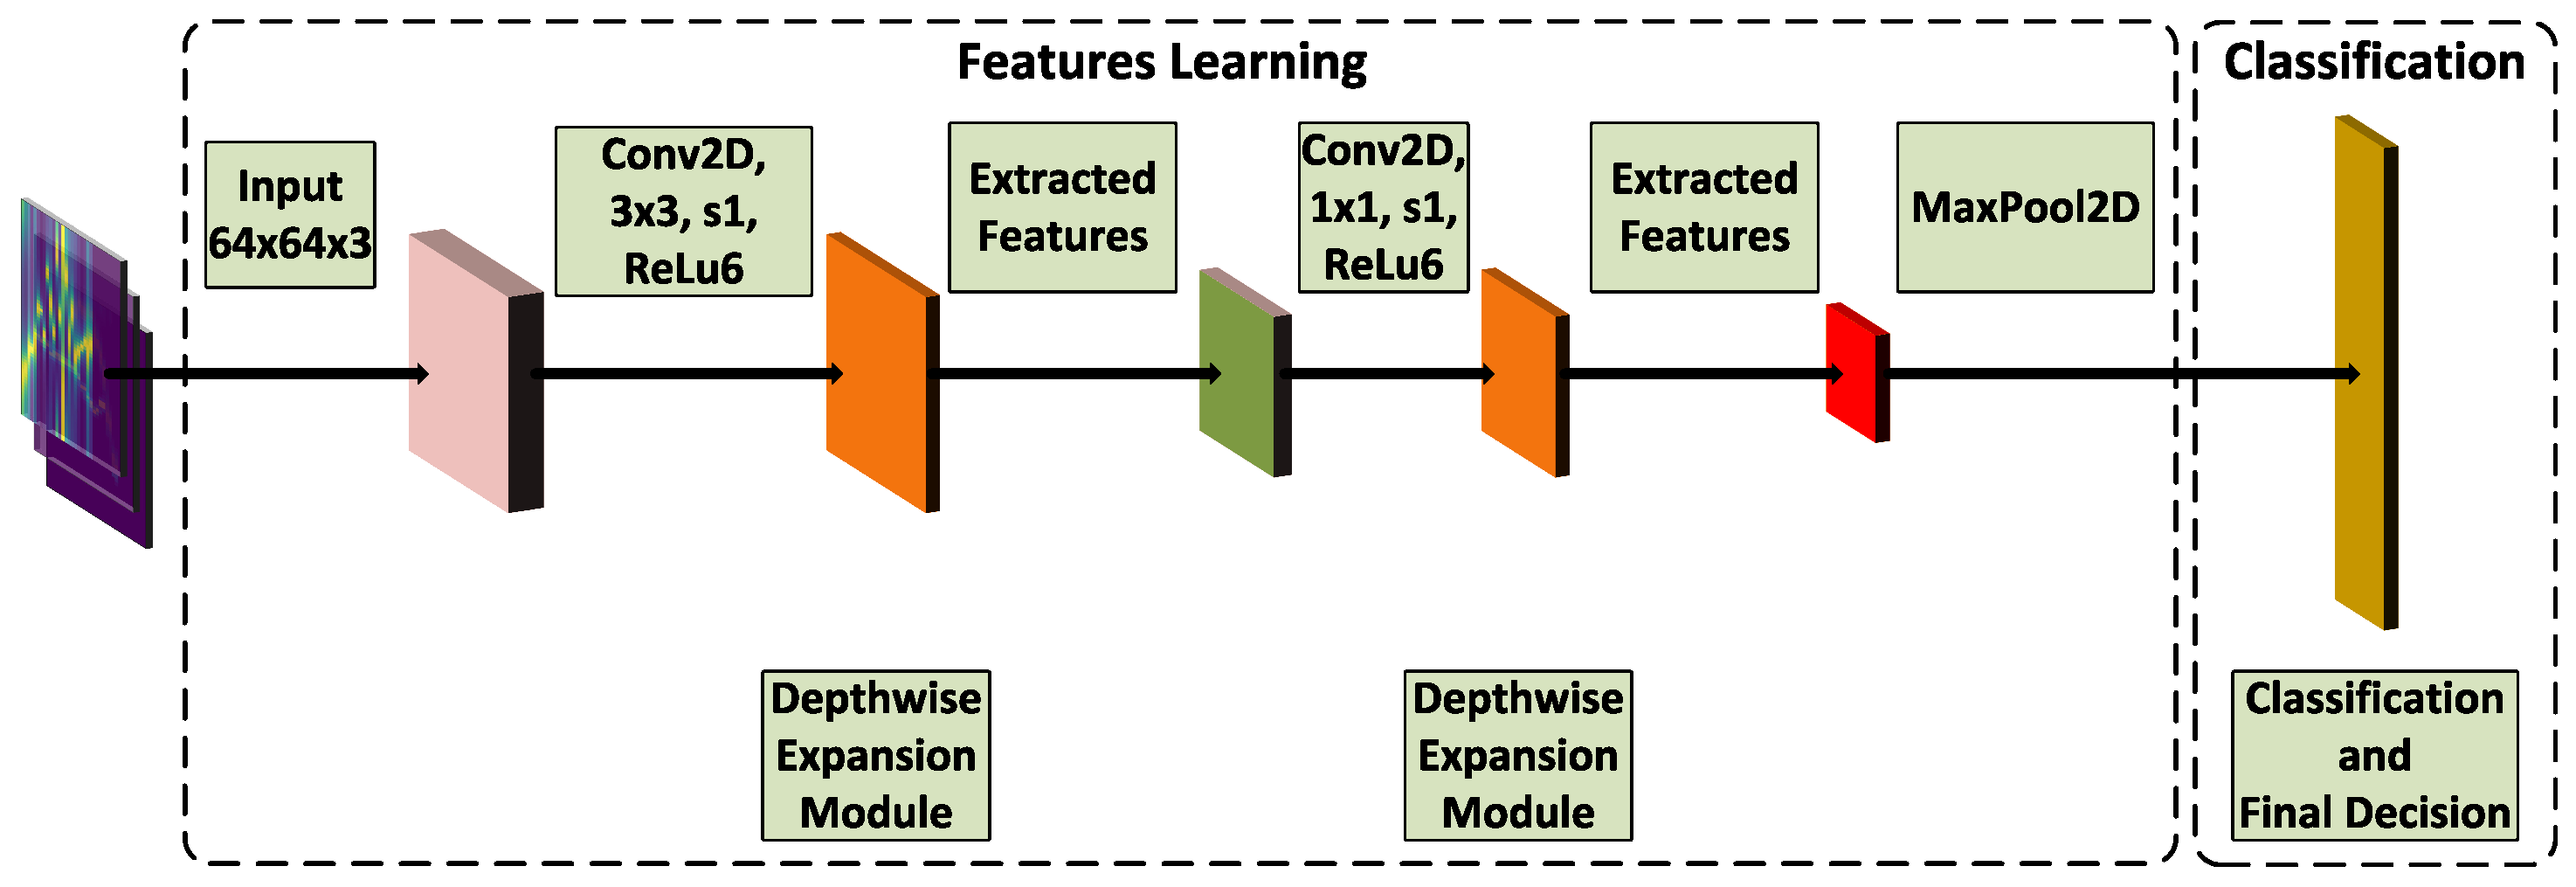
4.2.2. Depthwise Expansion Module
4.2.3. Proposed Classifier
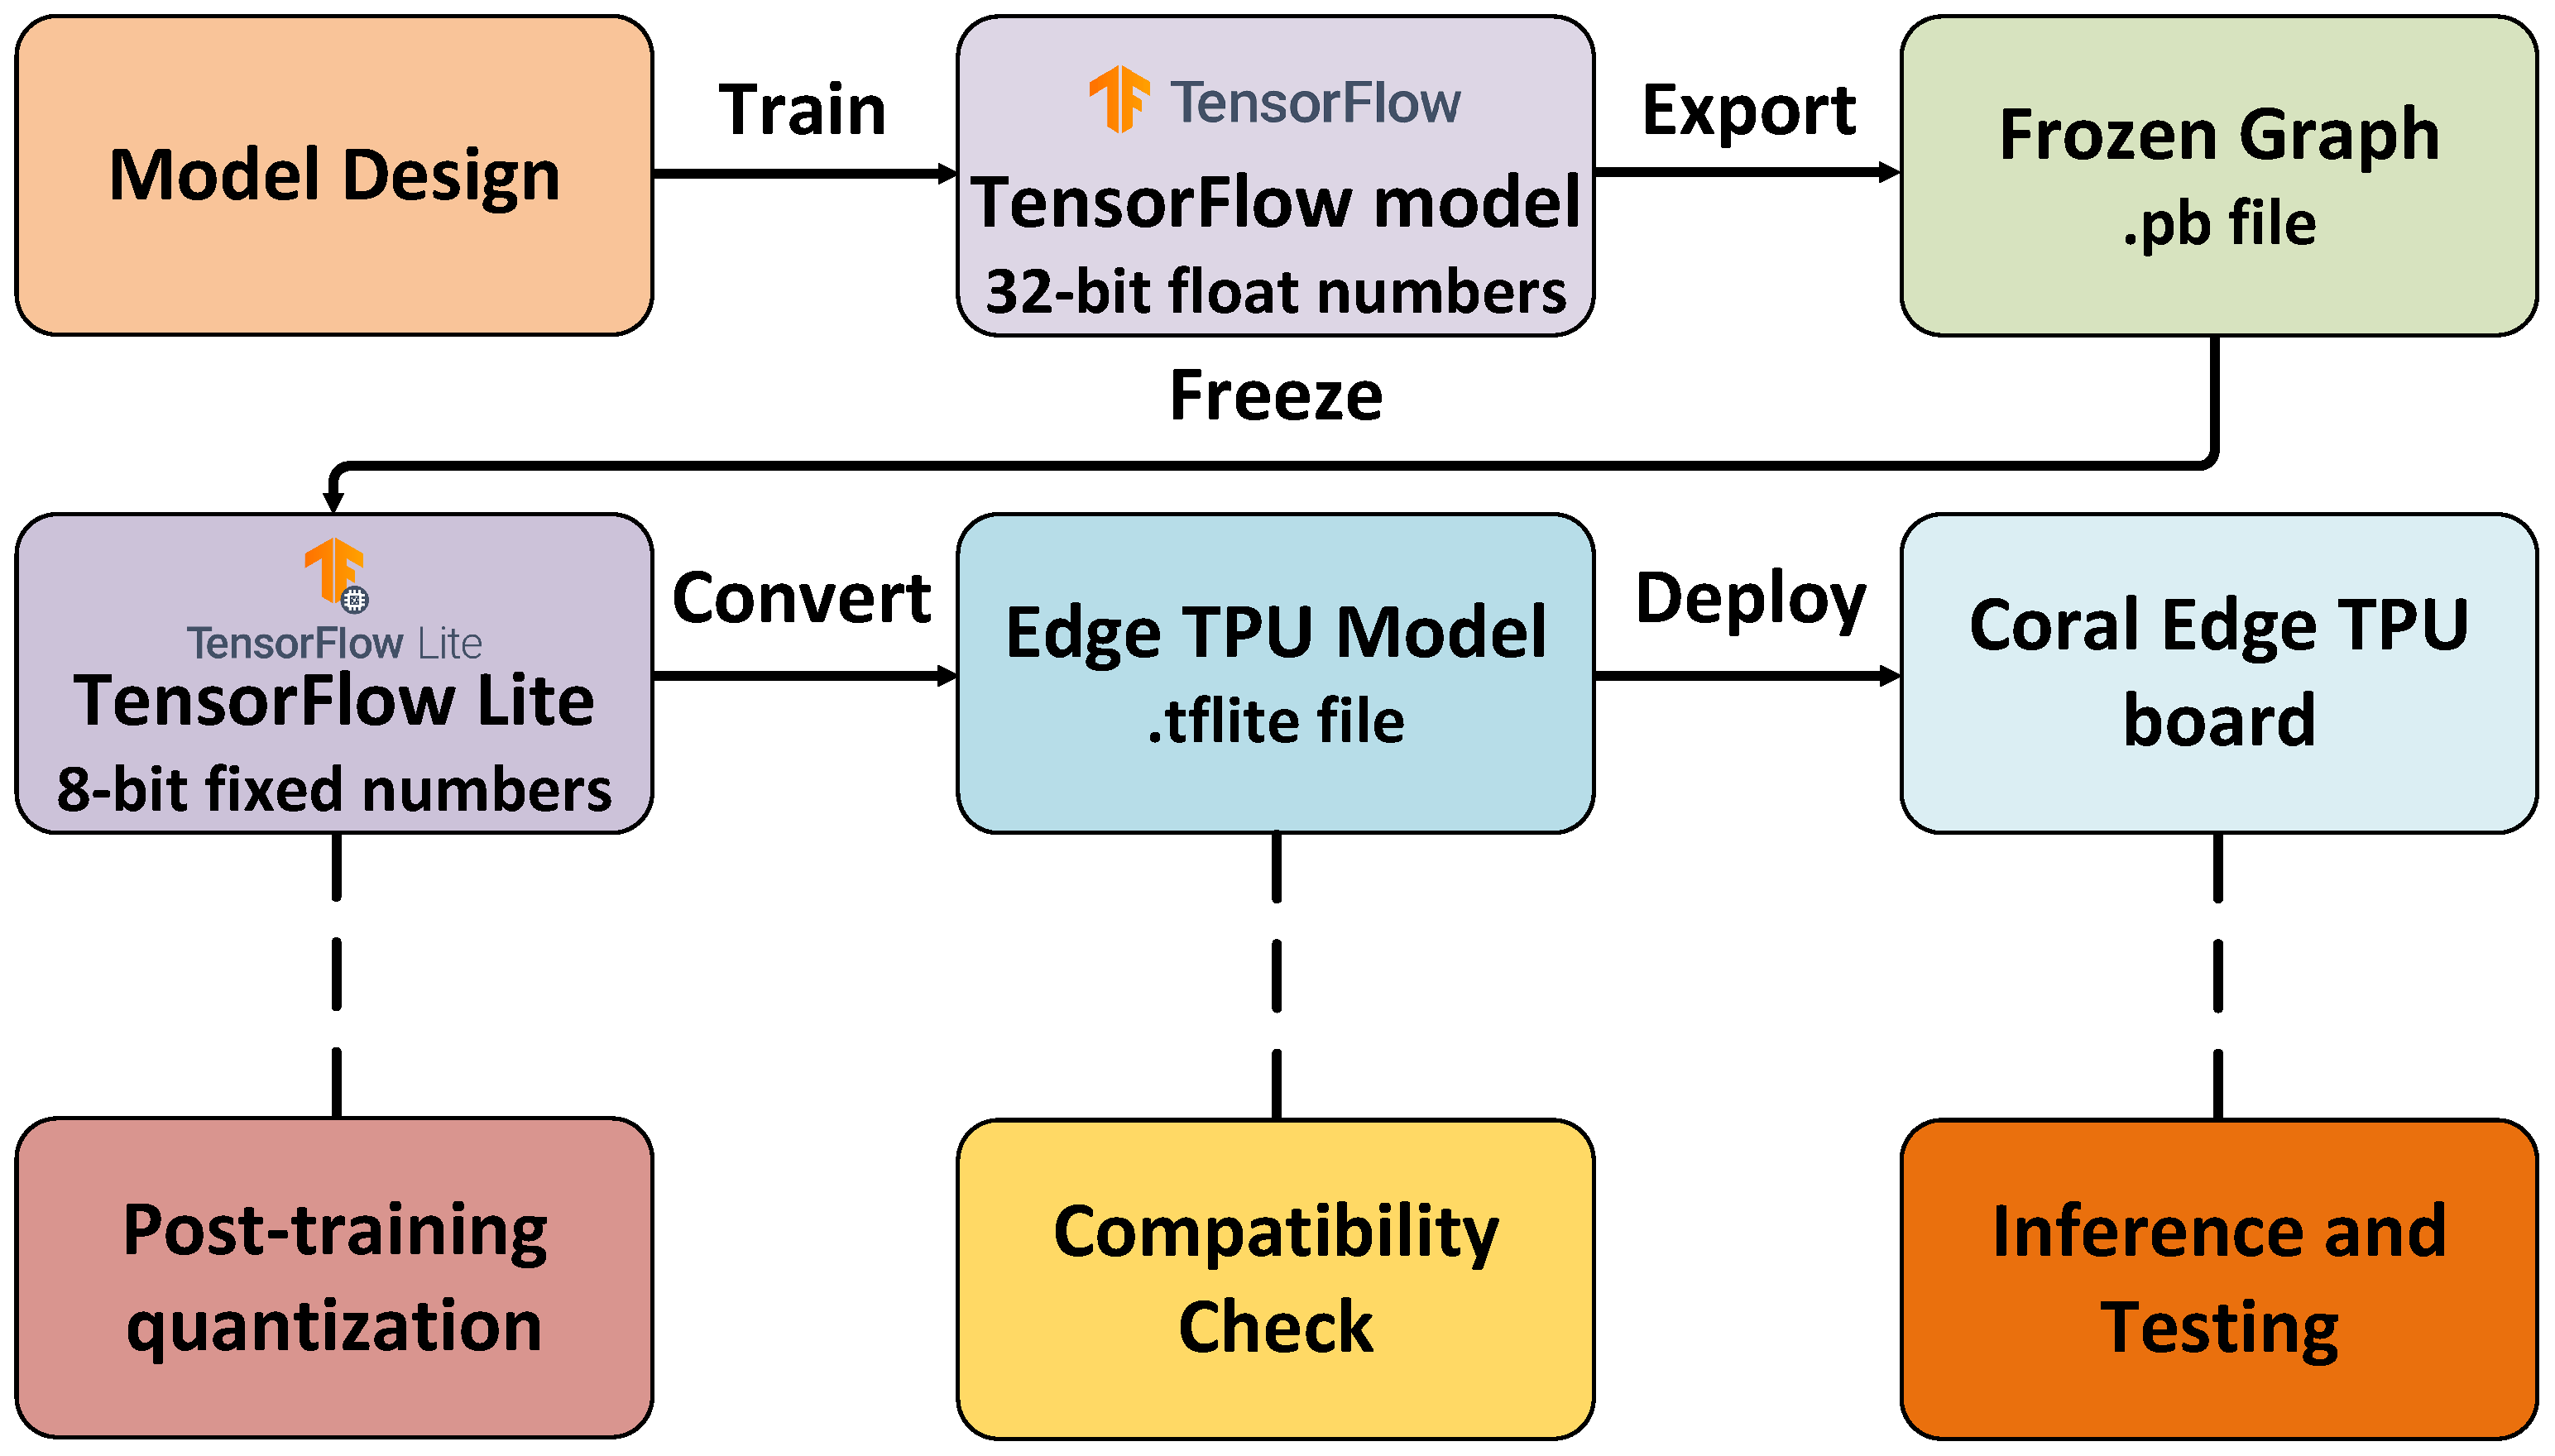
4.3. Edge TPU Deployment
5. Performance Evaluation
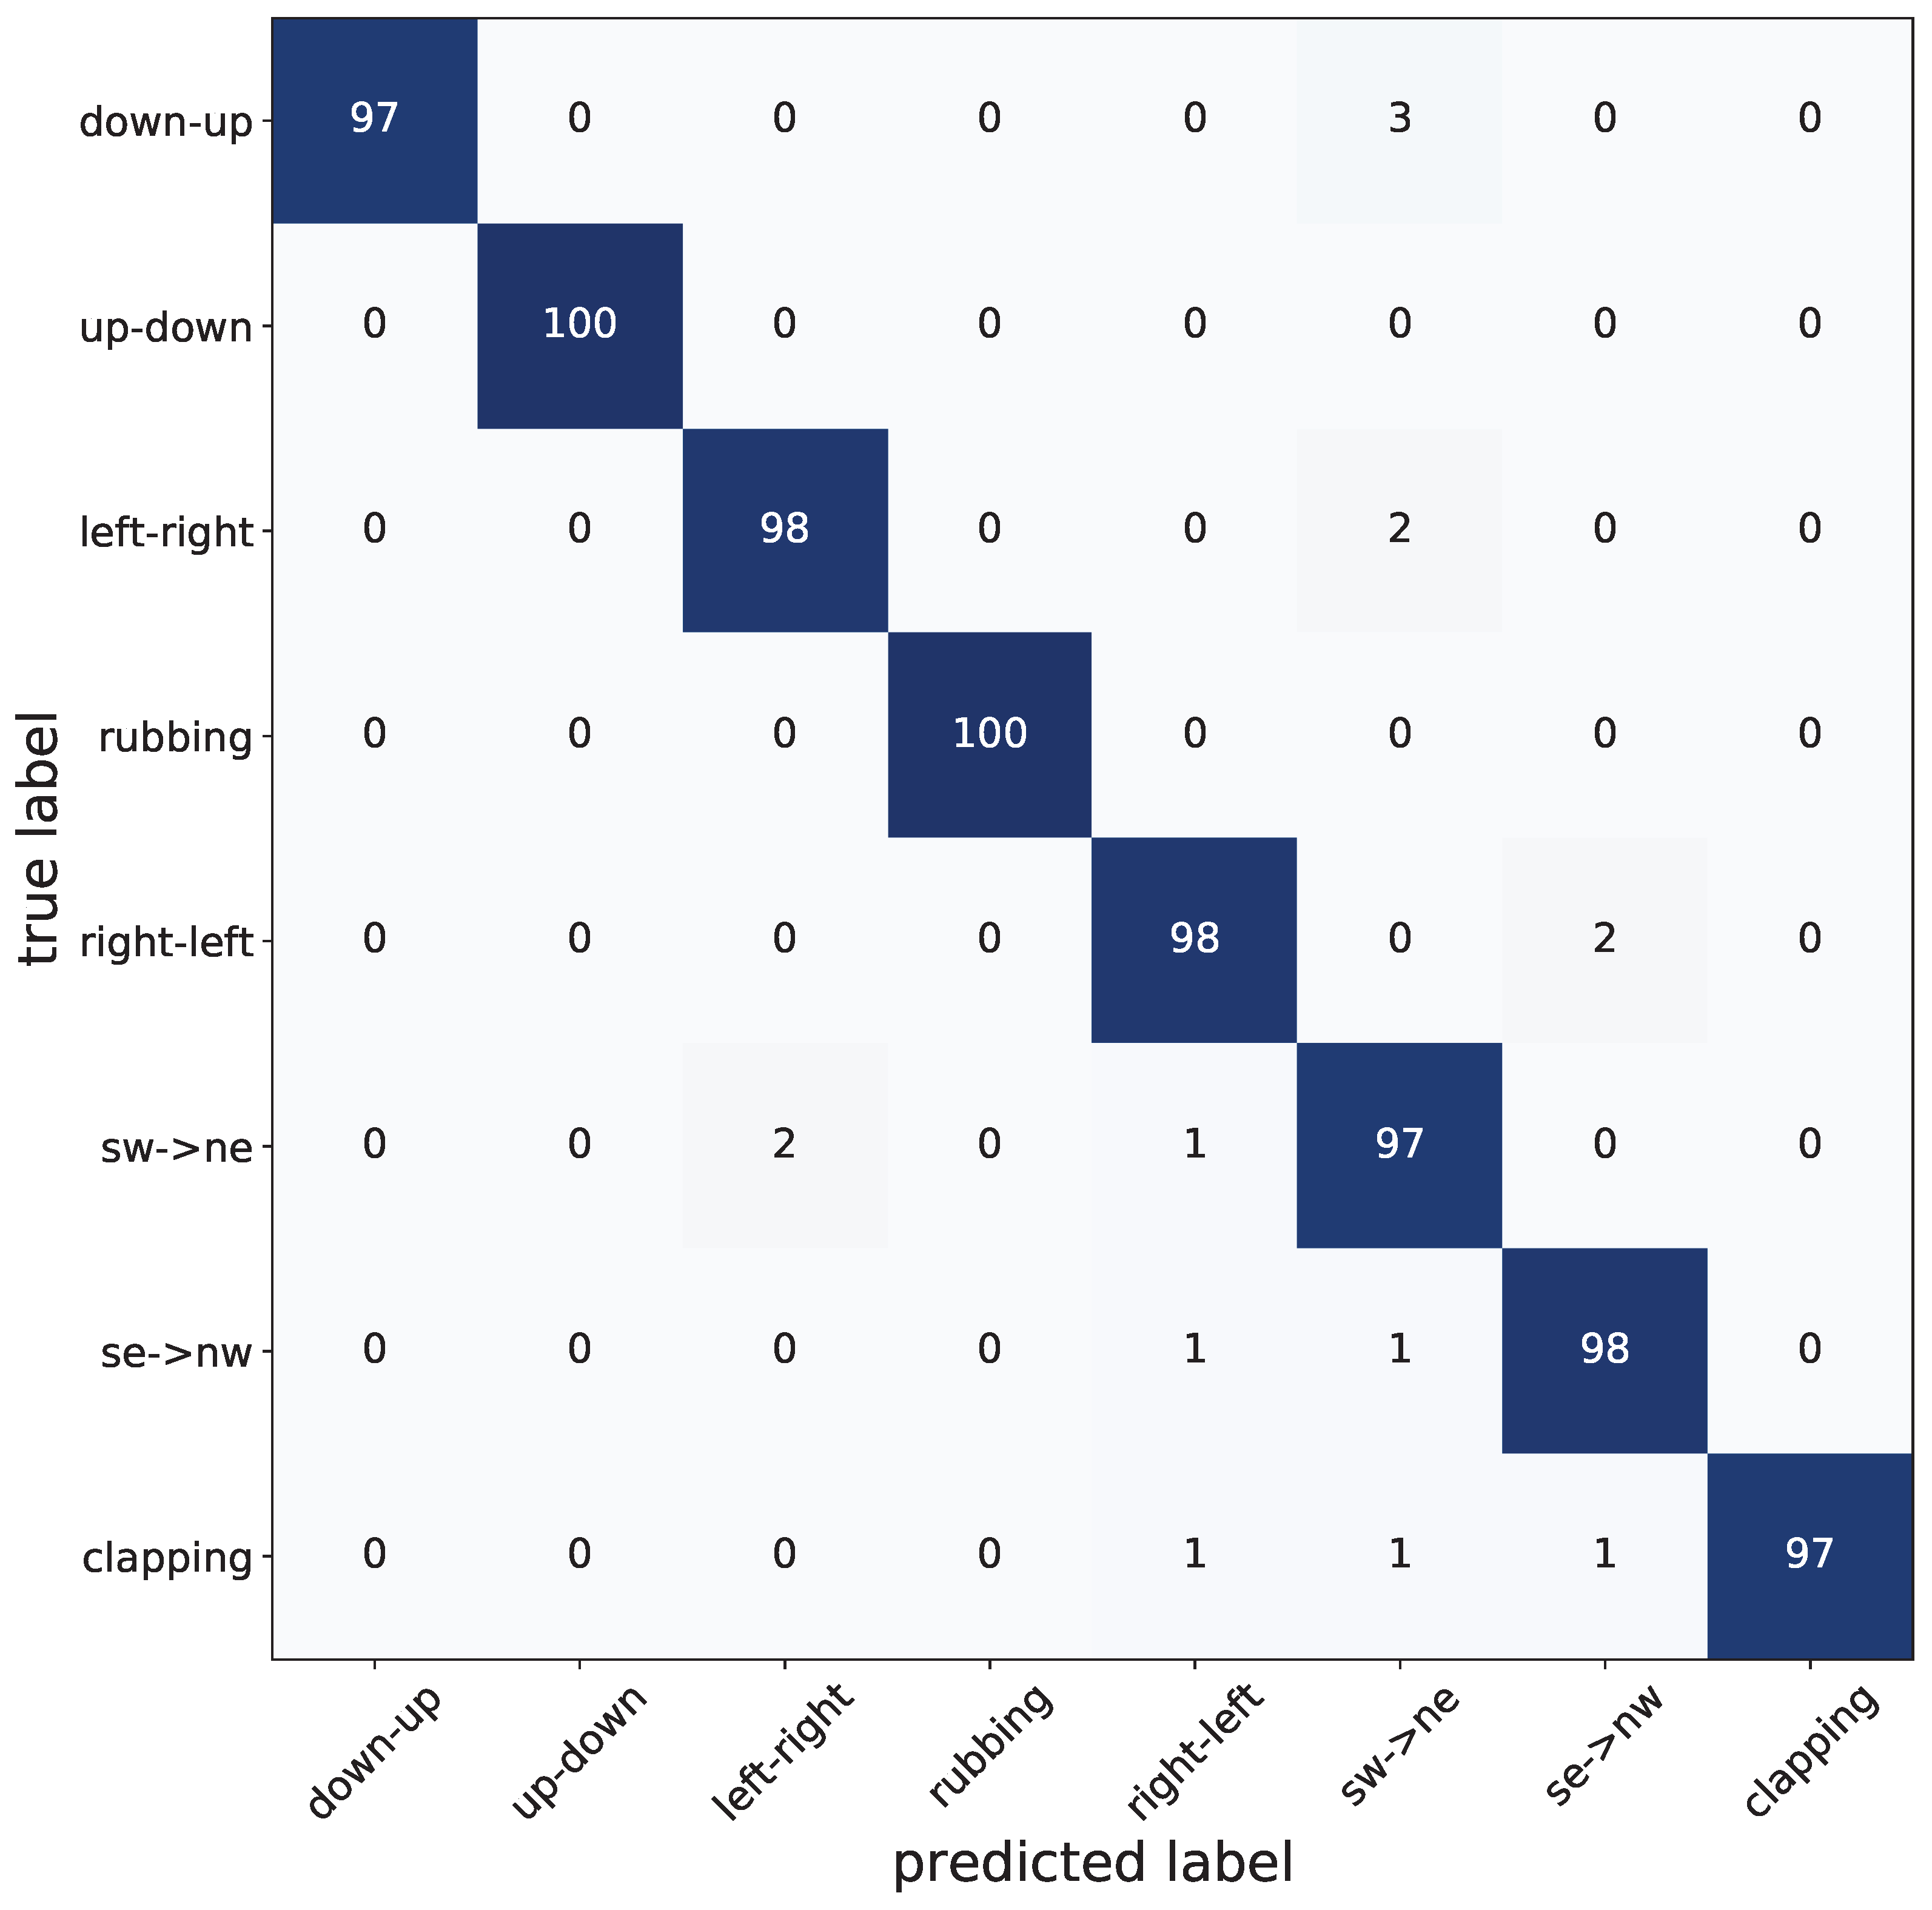
5.1. Classification Accuracy
5.2. Comparison with Existing Techniques
6. Conclusions
Author Contributions
Funding
Informed Consent Statement
Data Availability Statement
Acknowledgments
Conflicts of Interest
Abbreviations
| HCI | Human–Computer Interaction |
| FMCW | Frequency-Modulated Continuous Wave |
| RGB | Red Green Blue |
| ToF | Time of Flight |
| 3DCNN | 3D Convolutional Neural Networks |
| LSTM | Long Short-term Memory |
| RNN | Recurrent Neural Networks |
| IoT | Internet of Things |
| LRACNN | Long Recurrent All Convolutional Neural Network |
| NCS 2 | Neural Compute Stick 2 |
| RDM | Range-Doppler Map |
| k-NN | k-Nearest Neighbour |
| RFC | Random Forest Classifier |
| CWT | Continuous Wavelet Transform |
| R3DCNN | Recurrent 3D Convolutional Neural Network |
| I3D | Inflated 3D ConvNets |
| 2D-FFT | 2-Dimensional Fast Fourier Transform |
| MUSIC | Multiple Signal Classification |
| FDTW | Fusion Dynamic Time Wrapping |
| LDA | Linear Discriminant Analysis |
| QDA | Quadratic Discriminant Analysis |
| SVM | Support Vector Machine |
| ADC | Analog to Digital Converter |
| VGA | Voltage Gain Amplifier |
| RDI | Range-Doppler Image |
| FFT | Fast Fourier Transform |
| RAI | Range-Angle Image |
| SVD | Singular Value Decomposition |
| MVDR | Minimum Variance Distortionless Response |
| DOA | Direction of Arrival |
References
- Shehab, A.H.; Al-Janabi, S. Edge Computing: Review and Future Directions (Computación de Borde: Revisión y Direcciones Futuras). REVISTA AUS J. 2019, 368–380. [Google Scholar] [CrossRef]
- Yasen, M.; Jusoh, S. A systematic review on hand gesture recognition techniques, challenges and applications. PeerJ Comput. Sci. 2019, 5, e218. [Google Scholar] [CrossRef] [PubMed] [Green Version]
- Park, H.; McKilligan, S. A systematic literature review for human-computer interaction and design thinking process integration. In Proceedings of the International Conference of Design, User Experience, and Usability, Las Vegas, NV, USA, 15–20 July 2018; Springer: Cham, Switzerland, 2018; pp. 725–740. [Google Scholar]
- Mirsu, R.; Simion, G.; Caleanu, C.D.; Pop-Calimanu, I.M. A pointnet-based solution for 3d hand gesture recognition. Sensors 2020, 20, 3226. [Google Scholar] [CrossRef]
- Nebiker, S.; Meyer, J.; Blaser, S.; Ammann, M.; Rhyner, S. Outdoor Mobile Mapping and AI-Based 3D Object Detection with Low-Cost RGB-D Cameras: The Use Case of On-Street Parking Statistics. Remote Sens. 2021, 13, 3099. [Google Scholar] [CrossRef]
- Kumar, P.; Jaiswal, A.; Deepak, B.; Reddy, G.R.M. Hand gesture-based stable powerpoint presentation using kinect. In Progress in Intelligent Computing Techniques: Theory, Practice, and Applications; Springer: Singapore, 2018; pp. 81–94. [Google Scholar]
- Khari, M.; Garg, A.K.; Crespo, R.G.; Verdú, E. Gesture Recognition of RGB and RGB-D Static Images Using Convolutional Neural Networks. Int. J. Interact. Multim. Artif. Intell. 2019, 5, 22–27. [Google Scholar] [CrossRef]
- Nguyen, N.-H.; Phan, T.; Lee, G.; Kim, S.; Yang, H. Gesture Recognition Based on 3D Human Pose Estimation and Body Part Segmentation for RGB Data Input. Appl. Sci. 2020, 10, 6188. [Google Scholar] [CrossRef]
- Hakim, N.L.; Shih, T.K.; Arachchi, S.P.K.; Aditya, W.; Chen, Y.; Lin, C. Dynamic hand gesture recognition using 3DCNN and LSTM with FSM context-aware model. Sensors 2019, 19, 5429. [Google Scholar] [CrossRef] [Green Version]
- Kumar, P.; Gauba, H.; Roy, P.P.; Dogra, D.P. Coupled HMM-based multi-sensor data fusion for sign language recognition. Pattern Recognit. Lett. 2017, 86, 1–8. [Google Scholar] [CrossRef]
- Abeßer, J. A review of deep learning based methods for acoustic scene classification. Appl. Sci. 2020, 10, 2020. [Google Scholar] [CrossRef] [Green Version]
- Alexakis, G.; Panagiotakis, S.; Fragkakis, A.; Markakis, E.; Vassilakis, K. Control of smart home operations using natural language processing, voice recognition and IoT technologies in a multi-tier architecture. Designs 2019, 3, 32. [Google Scholar] [CrossRef] [Green Version]
- Agathya, M.; Brilliant, S.M.; Akbar, N.R.; Supadmini, S. Review of a framework for audiovisual dialog-based in human computer interaction. In Proceedings of the 2015 IEEE International Conference on Information & Communication Technology and Systems (ICTS), Surabaya, Indonesia, 16 September 2015; pp. 137–140. [Google Scholar]
- Palacios, J.M.; Sagüés, C.; Montijano, E.; Llorente, S. Human-computer interaction based on hand gestures using RGB-D sensors. Sensors 2013, 13, 11842–11860. [Google Scholar] [CrossRef]
- Paravati, G.; Gatteschi, V. Human-computer interaction in smart environments. Sensors 2015, 15, 19487–19494. [Google Scholar] [CrossRef] [Green Version]
- Singh, S.; Nasoz, F. Facial expression recognition with convolutional neural networks. In Proceedings of the 2020 IEEE 10th Annual Computing and Communication Workshop and Conference (CCWC), Las Vegas, NV, USA, 6–8 January 2020; pp. 0324–0328. [Google Scholar]
- Manaris, B. Natural language processing: A human-computer interaction perspective. In Advances in Computers; Elsevier: Amsterdam, The Netherlands, 1998; Volume 47, pp. 1–66. [Google Scholar]
- Katona, J. A Review of Human–Computer Interaction and Virtual Reality Research Fields in Cognitive InfoCommunications. Appl. Sci. 2021, 11, 2646. [Google Scholar] [CrossRef]
- Aditya, K.; Chacko, P.; Kumari, D.; Kumari, D.; Bilgaiyan, S. Recent trends in HCI: A survey on data glove, LEAP motion and microsoft kinect. In Proceedings of the 2018 IEEE International Conference on System, Computation, Automation and Networking (ICSCA), Pondicherry, India, 6–7 July 2018; pp. 1–5. [Google Scholar]
- Ahmed, S.; Kallu, K.D.; Ahmed, S.; Cho, S.H. Hand gestures recognition using radar sensors for human-computer-interaction: A review. Remote Sens. 2021, 13, 527. [Google Scholar] [CrossRef]
- Yu, M.; Kim, N.; Jung, Y.; Lee, S. A frame detection method for real-time hand gesture recognition systems using CW-radar. Sensors 2020, 20, 2321. [Google Scholar] [CrossRef] [Green Version]
- Kabanda, G. Review of Human Computer Interaction and Computer Vision; GRIN Verlag: Munich, Germany, 2019. [Google Scholar]
- D’Eusanio, A.; Simoni, A.; Pini, S.; Borghi, G.; Vezzani, R.; Cucchiara, R. A Transformer-Based Network for Dynamic Hand Gesture Recognition. In Proceedings of the IEEE 2020 International Conference on 3D Vision (3DV), Fukuoka, Japan, 25–28 November 2020; pp. 623–632. [Google Scholar]
- Molchanov, P.; Yang, X.; Gupta, S.; Kim, K.; Tyree, S.; Kautz, J. Online detection and classification of dynamic hand gestures with recurrent 3d convolutional neural network. In Proceedings of the IEEE Conference on Computer Vision and Pattern Recognition, Las Vegas, NV, USA, 27–30 June 2016; pp. 4207–4215. [Google Scholar]
- Carreira, J.; Zisserman, A. Quo vadis, action recognition? a new model and the kinetics dataset. In Proceedings of the IEEE Conference on Computer Vision and Pattern Recognition, Honolulu, HI, USA, 21–26 July 2017; pp. 6299–6308. [Google Scholar]
- D’Eusanio, A.; Simoni, A.; Pini, S.; Borghi,, G.; Vezzani, R.; Cucchiara, R. Multimodal hand gesture classification for the human–car interaction. In Informatics; Multidisciplinary Digital Publishing Institute: Basel, Switzerland, 2020; Volume 7, p. 31. [Google Scholar]
- Hazra, S.; Santra, A. Robust gesture recognition using millimetric-wave radar system. IEEE Sens. Lett. 2018, 2, 1–4. [Google Scholar] [CrossRef]
- Hazra, S.; Santra, A. Short-range radar-based gesture recognition system using 3D CNN with triplet loss. IEEE Access 2019, 7, 125623–125633. [Google Scholar] [CrossRef]
- Hazra, S.; Santra, A. Radar gesture recognition system in presence of interference using self-attention neural network. In Proceedings of the 2019 18th IEEE International Conference on Machine Learning And Applications (ICMLA), Boca Raton, FL, USA, 16–19 December 2019; pp. 1409–1414. [Google Scholar]
- Santra, A.; Hazra, S. Deep Learning Applications of Short-Range Radars; Artech House: Norwood, MA, USA, 2020. [Google Scholar]
- Sun, Y.; Zhang, B.; Luo, M. Survey of Edge Computing Based on a Generalized Framework and Some Recommendation. In Proceedings of the International Conference on Edge Computing, Honolulu, HI, USA, 18–20 September 2020; Springer: Cham, Switzerland, 2020; pp. 111–126. [Google Scholar]
- Liu, F.; Tang, G.; Li, Y.; Cai, Z.; Zhang, X.; Zhou, T. A survey on edge computing systems and tools. Proc. IEEE 2019, 107, 1537–1562. [Google Scholar] [CrossRef] [Green Version]
- Yang, Z.; Zhang, S.; Li, R.; Li, C.; Wang, M.; Wang, D.; Zhang, M. Efficient Resource-Aware Convolutional Neural Architecture Search for Edge Computing with Pareto-Bayesian Optimization. Sensors 2021, 21, 444. [Google Scholar] [CrossRef] [PubMed]
- Hamdan, S.; Ayyash, M.; Almajali, S. Edge-computing architectures for internet of things applications: A survey. Sensors 2020, 20, 6441. [Google Scholar] [CrossRef]
- Koubâa, A.; Ammar, A.; Alahdab, M.; Kanhouch, A.; Azar, A.T. DeepBrain: Experimental Evaluation of Cloud-Based Computation Offloading and Edge Computing in the Internet-of-Drones for Deep Learning Applications. Sensors 2020, 20, 5240. [Google Scholar] [CrossRef] [PubMed]
- McClellan, M.; Cervelló-Pastor, C.; Sallent, S. Deep learning at the mobile edge: Opportunities for 5G networks. Appl. Sci. 2020, 10, 4735. [Google Scholar] [CrossRef]
- TensorFlow Models on the Edge TPU. Coral. Available online: https://coral.ai/docs/edgetpu/models-intro/#supported-operations (accessed on 18 August 2021).
- Capra, M.; Maurizio, B.; Marchisio, A.; Shafique, M.; Masera, G.; Martina, M. An updated survey of efficient hardware architectures for accelerating deep convolutional neural networks. Future Internet 2020, 12, 113. [Google Scholar] [CrossRef]
- Véstias, M.P. A Survey of Convolutional Neural Networks on Edge with Reconfigurable Computing. Algorithms 2019, 12, 154. [Google Scholar] [CrossRef] [Green Version]
- Krizhevsky, A.; Sutskever, I.; Hinton, G.E. ImageNet classification with deep convolutional neural networks. Commun. ACM 2017, 60, 84–90. [Google Scholar] [CrossRef]
- Simonyan, K.; Zisserman, A. Very deep convolutional networks for large-scale image recognition. arXiv 2014, arXiv:1409.1556. [Google Scholar]
- He, K.; Zhang, X.; Ren, S.; Sun, J. Deep residual learning for image recognition. In Proceedings of the IEEE Conference on Computer Vision and Pattern Recognition, Las Vegas, NV, USA, 27–30 June 2016; pp. 770–778. [Google Scholar]
- Fan, F.-L.; Xiong, J.; Li, M.; Wang, G. On interpretability of artificial neural networks: A survey. IEEE Trans. Radiat. Plasma Med. Sci. 2021. [Google Scholar] [CrossRef]
- Shahroudnejad, A. A survey on understanding, visualizations, and explanation of deep neural networks. arXiv 2021, arXiv:2102.01792. [Google Scholar]
- Véstias, M.P. Deep learning on edge: Challenges and trends. Smart Syst. Des. Appl. Chall. 2020, 23–42. [Google Scholar] [CrossRef]
- Deng, S.; Zhao, H.; Fang, W.; Yin, J.; Dustdar, S.; Zomaya, A.Y. Edge intelligence: The confluence of edge computing and artificial intelligence. IEEE Internet Things J. 2020, 7, 7457–7469. [Google Scholar] [CrossRef] [Green Version]
- Chen, J.; Ran, X. Deep Learning with Edge Computing: A Review. Proc. IEEE 2019, 107, 1655–1674. [Google Scholar] [CrossRef]
- Wang, X.; Han, Y.; Leung, V.C.M.; Niyato, D.; Yan, X.; Chen, X. Convergence of edge computing and deep learning: A comprehensive survey. IEEE Commun. Surv. Tutor. 2020, 22, 869–904. [Google Scholar] [CrossRef] [Green Version]
- Sun, S.; Cao, Z.; Zhu, H.; Zhao, J. A survey of optimization methods from a machine learning perspective. IEEE Trans. Cybern. 2019, 50, 3668–3681. [Google Scholar] [CrossRef] [Green Version]
- Kastratia, M.; Bibaa, M. A State-of-the-Art Survey of Advanced Optimization Methods in Machine Learning RTA-CSIT 2021: Tirana, Albania. In Proceedings of the 4th International Conference on Recent Trends and Applications in Computer Science and Information Technology, Tirana, Albania, 21–22 May 2021. [Google Scholar]
- Howard, A.G.; Zhu, M.; Chen, B.; Kalenichenko, D.; Wang, W.; Weyand, T.; Andreetto, M.; Adam, H. Mobilenets: Efficient convolutional neural networks for mobile vision applications. arXiv 2017, arXiv:1704.04861. [Google Scholar]
- Sandler, M.; Howard, A.; Zhu, M.; Zhmoginov, A.; Chen, L. Mobilenetv2: Inverted residuals and linear bottlenecks. In Proceedings of the IEEE conference on computer vision and pattern recognition, Salt Lake City, UT, USA, 18–22 June 2018; pp. 4510–4520. [Google Scholar]
- Iandola, F.N.; Han, S.; Moskewicz, M.W.; Ashraf, K.; Dally, W.J.; Keutzer, K. SqueezeNet: AlexNet-level accuracy with 50x fewer parameters and <0.5 MB model size. arXiv 2016, arXiv:1602.07360. [Google Scholar]
- Tan, M.; Le, Q.V. Mixconv: Mixed depthwise convolutional kernels. arXiv 2019, arXiv:1907.09595. [Google Scholar]
- Szegedy, C.; Liu, W.; Jia, Y.; Sermanet, P.; Reed, S.; Anguelov, D.; Erhan, D.; Vanhoucke, V.; Rabinovich, A. Going deeper with convolutions. In Proceedings of the IEEE conference on Computer Vision and Pattern Recognition, Boston, MA, USA, 7–12 June 2015; pp. 1–9. [Google Scholar]
- Yu, T.; Zhu, H. Hyper-parameter optimization: A review of algorithms and applications. arXiv 2020, arXiv:2003.05689. [Google Scholar]
- Elsken, T.; Metzen, J.H.; Hutter, F. Neural architecture search: A survey. J. Mach. Learn. Res. 2019, 20, 1997–2017. [Google Scholar]
- Siems, J.N.; Klein, A.; Archambeau, C.; Mahsereci, M. Dynamic Pruning of a Neural Network via Gradient Signal-to-Noise Ratio. In Proceedings of the 8th ICML Workshop on Automated Machine Learning (AutoML), Virtual, 23–24 July 2021. [Google Scholar]
- Meng, F.; Cheng, H.; Li, K.; Luo, H.; Guo, X.; Lu, G.; Sun, X. Pruning filter in filter. arXiv 2020, arXiv:2009.14410. [Google Scholar]
- Liebenwein, L.; Baykal, C.; Carter, B.; Gifford, D.; Rus, D. Lost in pruning: The effects of pruning neural networks beyond test accuracy. In Proceedings of Machine Learning and Systems 3; 2021; Available online: https://proceedings.mlsys.org/paper/2021 (accessed on 20 October 2021).
- Nagel, M.; Fournarakis, M.; Amjad, R.A.; Bondarenko, Y.; van Baalen, M.; Blankevoort, T. A White Paper on Neural Network Quantization. arXiv 2021, arXiv:2106.08295. [Google Scholar]
- Zhao, R.; Hu, Y.; Dotzel, J.; de Sa, C.; Zhang, Z. Improving neural network quantization without retraining using outlier channel splitting. In Proceedings of the International Conference on Machine Learning, PMLR, Beach, CA, USA, 9–15 June 2019; pp. 7543–7552. [Google Scholar]
- Jacob, B.; Kligys, S.; Chen, B.; Zhu, M.; Tang, M.; Howard, A.; Adam, H.; Kalenichenko, D. Quantization and training of neural networks for efficient integer-arithmetic-only inference. In Proceedings of the IEEE Conference on Computer Vision and Pattern Recognition, Salt Lake City, UT, USA, 18–22 June 2018; pp. 2704–2713. [Google Scholar]
- Neill, J.O. An overview of neural network compression. arXiv 2020, arXiv:2006.03669. [Google Scholar]
- Cheng, Y.; Wang, D.; Zhou, P.; Zhang, T. A survey of model compression and acceleration for deep neural networks. arXiv 2017, arXiv:1710.09282. [Google Scholar]
- Hinton, G.; Vinyals, O.; Dean, J. Distilling the knowledge in a neural network. arXiv 2015, arXiv:1503.02531. [Google Scholar]
- Weiß, J.; Pérez, R.; Biebl, E. Improved people counting algorithm for indoor environments using 60 GHz FMCW radar. In Proceedings of the 2020 IEEE Radar Conference (RadarConf20), Florence, Italy, 21–25 September 2020; pp. 1–6. [Google Scholar]
- Aydogdu, C.Y.; Hazra, S.; Santra, A.; Weigel, R. Multi-modal cross learning for improved people counting using short-range FMCW radar. In Proceedings of the 2020 IEEE International Radar Conference (RADAR), Washington, DC, USA, 27 April–1 May 2020; pp. 250–255. [Google Scholar]
- Thi Phuoc Van, N.; Tang, L.; Demir, V.; Hasan, S.F.; Minh, N.D.; Mukhopadhyay, S. Microwave radar sensing systems for search and rescue purposes. Sensors 2019, 19, 2879. [Google Scholar] [CrossRef] [PubMed] [Green Version]
- Turppa, E.; Kortelainen, J.M.; Antropov, O.; Kiuru, T. Vital sign monitoring using FMCW radar in various sleeping scenarios. Sensors 2020, 20, 6505. [Google Scholar] [CrossRef] [PubMed]
- Wu, Q.; Zhao, D. Dynamic hand gesture recognition using FMCW radar sensor for driving assistance. In Proceedings of the 2018 IEEE 10th International Conference on Wireless Communications and Signal Processing (WCSP), Hangzhou, China, 18–20 October 2018; pp. 1–6. [Google Scholar]
- Son, Y.-S.; Sung, H.; Heo, S.W. Automotive frequency modulated continuous wave radar interference reduction using per-vehicle chirp sequences. Sensors 2018, 18, 2831. [Google Scholar] [CrossRef] [PubMed] [Green Version]
- Lin, J., Jr.; Li, Y.; Hsu, W.; Lee, T. Design of an FMCW radar baseband signal processing system for automotive application. SpringerPlus 2016, 5, 1–16. [Google Scholar] [CrossRef] [Green Version]
- Zhang, Z.; Tian, Z.; Zhou, M. Latern: Dynamic continuous hand gesture recognition using FMCW radar sensor. IEEE Sens. J. 2018, 18, 3278–3289. [Google Scholar] [CrossRef]
- Ahmed, S.; Cho, S.H. Hand gesture recognition using an IR-UWB radar with an inception module-based classifier. Sensors 2020, 20, 564. [Google Scholar] [CrossRef] [Green Version]
- Molchanov, P.; Gupta, S.; Kim, K.; Pulli, K. Multi-sensor system for driver’s hand-gesture recognition. In Proceedings of the 2015 11th IEEE International Conference and Workshops on Automatic Face and Gesture Recognition (FG), Ljubljana, Slovenia, 4–8 May 2015; Volume 1, pp. 1–8. [Google Scholar]
- Lien, J.; Gillian, N.; Karagozler, M.E.; Amihood, P.; Schwesig, C.; Olson, E.; Raja, H.; Poupyrev, I. Soli: Ubiquitous gesture sensing with millimeter wave radar. ACM Trans. Graph. (TOG) 2016, 35, 1–19. [Google Scholar] [CrossRef] [Green Version]
- Chmurski, M.; Zubert, M. Novel Radar-based Gesture Recognition System using Optimized CNN-LSTM Deep Neural Network for Low-power Microcomputer Platform. In Proceedings of the ICAART, Online, 4–6 February 2021; pp. 882–890. [Google Scholar]
- Chmurski, M.; Zubert, M.; Bierzynski, K.; Santra, A. Analysis of Edge-Optimized Deep Learning Classifiers for Radar-Based Gesture Recognition. IEEE Access 2021, 9, 74406–74421. [Google Scholar] [CrossRef]
- Manganaro, F.; Pini, S.; Borghi, G.; Vezzani, R.; Cucchiara, R. Hand gestures for the human-car interaction: The briareo dataset. In Proceedings of the International Conference on Image Analysis and Processing, Trento, Italy, 9–13 September 2019; Springer: Cham, Switzerland, 2019; pp. 560–571. [Google Scholar]
- Liu, L.; Shao, L. Learning discriminative representations from RGB-D video data. In Proceedings of the Twenty-third International Joint Conference on Artificial Intelligence, Beijing, China, 3–9 August 2013. [Google Scholar]
- Escalera, S.; Baró, X.; Gonzalez, J.; Bautista, M.A.; Madadi, M.; Reyes, M.; Ponce-López, V.; Escalante, H.J.; Shotton, J.; Guyon, I. Chalearn looking at people challenge 2014: Dataset and results. In Proceedings of the European Conference on Computer Vision, Zurich, Switzerland, 6–12 September 2014; Springer: Cham, Switzerland, 2014; pp. 459–473. [Google Scholar]
- Soomro, K.; Zamir, A.R.; Shah, M. UCF101: A dataset of 101 human actions classes from videos in the wild. arXiv 2012, arXiv:1212.0402. [Google Scholar]
- Kuehne, H.; Jhuang, H.; Garrote, E.; Poggio, T.; Serre, T. HMDB: A large video database for human motion recognition. In Proceedings of the 2011 IEEE International Conference on Computer Vision, Barcelona, Spain, 6–13 November 2011; pp. 2556–2563. [Google Scholar]
- Wang, Y.; Ren, A.; Zhou, M.; Wang, W.; Yang, X. A novel detection and recognition method for continuous hand gesture using fmcw radar. IEEE Access 2020, 8, 167264–167275. [Google Scholar] [CrossRef]
- Wang, S.; Song, J.; Lien, J.; Poupyrev, I.; Hilliges, O. Interacting with soli: Exploring fine-grained dynamic gesture recognition in the radio-frequency spectrum. In Proceedings of the 29th Annual Symposium on User Interface Software and Technology, Tokyo, Japan, 16–19 October 2016; pp. 851–860. [Google Scholar]
- Ritchie, M.; Capraru, R.; Fioranelli, F. Dop-NET: A micro-Doppler radar data challenge. Electron. Lett. 2020, 56, 568–570. [Google Scholar] [CrossRef] [Green Version]
- Ritchie, M.; Jones, A.M. Micro-Doppler gesture recognition using Doppler, time and range based features. In Proceedings of the 2019 IEEE Radar Conference (RadarConf), Boston, MA, USA, 22–26 April 2019; pp. 1–6. [Google Scholar]
- Trotta, S.; Weber, D.; Jungmaier, R.W.; Baheti, A.; Lien, J.; Noppeney, D.; Tabesh, M.; Rumpler, C.; Aichner, M.; Albel, S.; et al. SOLI: A Tiny Device for a New Human Machine Interface. In Proceedings of the 2021 IEEE International Solid-State Circuits Conference (ISSCC), San Francisco, CA, USA, 13–22 February 2021; Volume 64, pp. 42–44. [Google Scholar]
- Chudnikov, V.V.; Shakhtarin, B.I.; Bychkov, A.V.; Kazaryan, S.M. DOA Estimation in Radar Sensors with Colocated Antennas. In Proceedings of the IEEE 2020 Systems of Signal Synchronization, Generating and Processing in Telecommunications (SYNCHROINFO), Svetlogorsk, Russia, 1–3 July 2020; pp. 1–6. [Google Scholar]


| Accuracy [%] | |||
|---|---|---|---|
| x86 | Edge TPU | ||
| Topologies | CNN3D | 99.63% | N/A |
| CNN2D | 86.25% | 85.88% | |
| MobileNetV2—1 bottleneck | 98.88% | 98.88% | |
| MobileNetV2—2 bottleneck | 99.00% | 98.75% | |
| MobileNetV2—3 bottleneck | 97.13% | 97.25% | |
| MobileNetV2—4 bottleneck | 98.50% | 98.50% | |
| MobileNetV2—5 bottleneck | 97.75% | 97.75% | |
| MobileNetV2—6 bottleneck | 98.00% | 97.88% | |
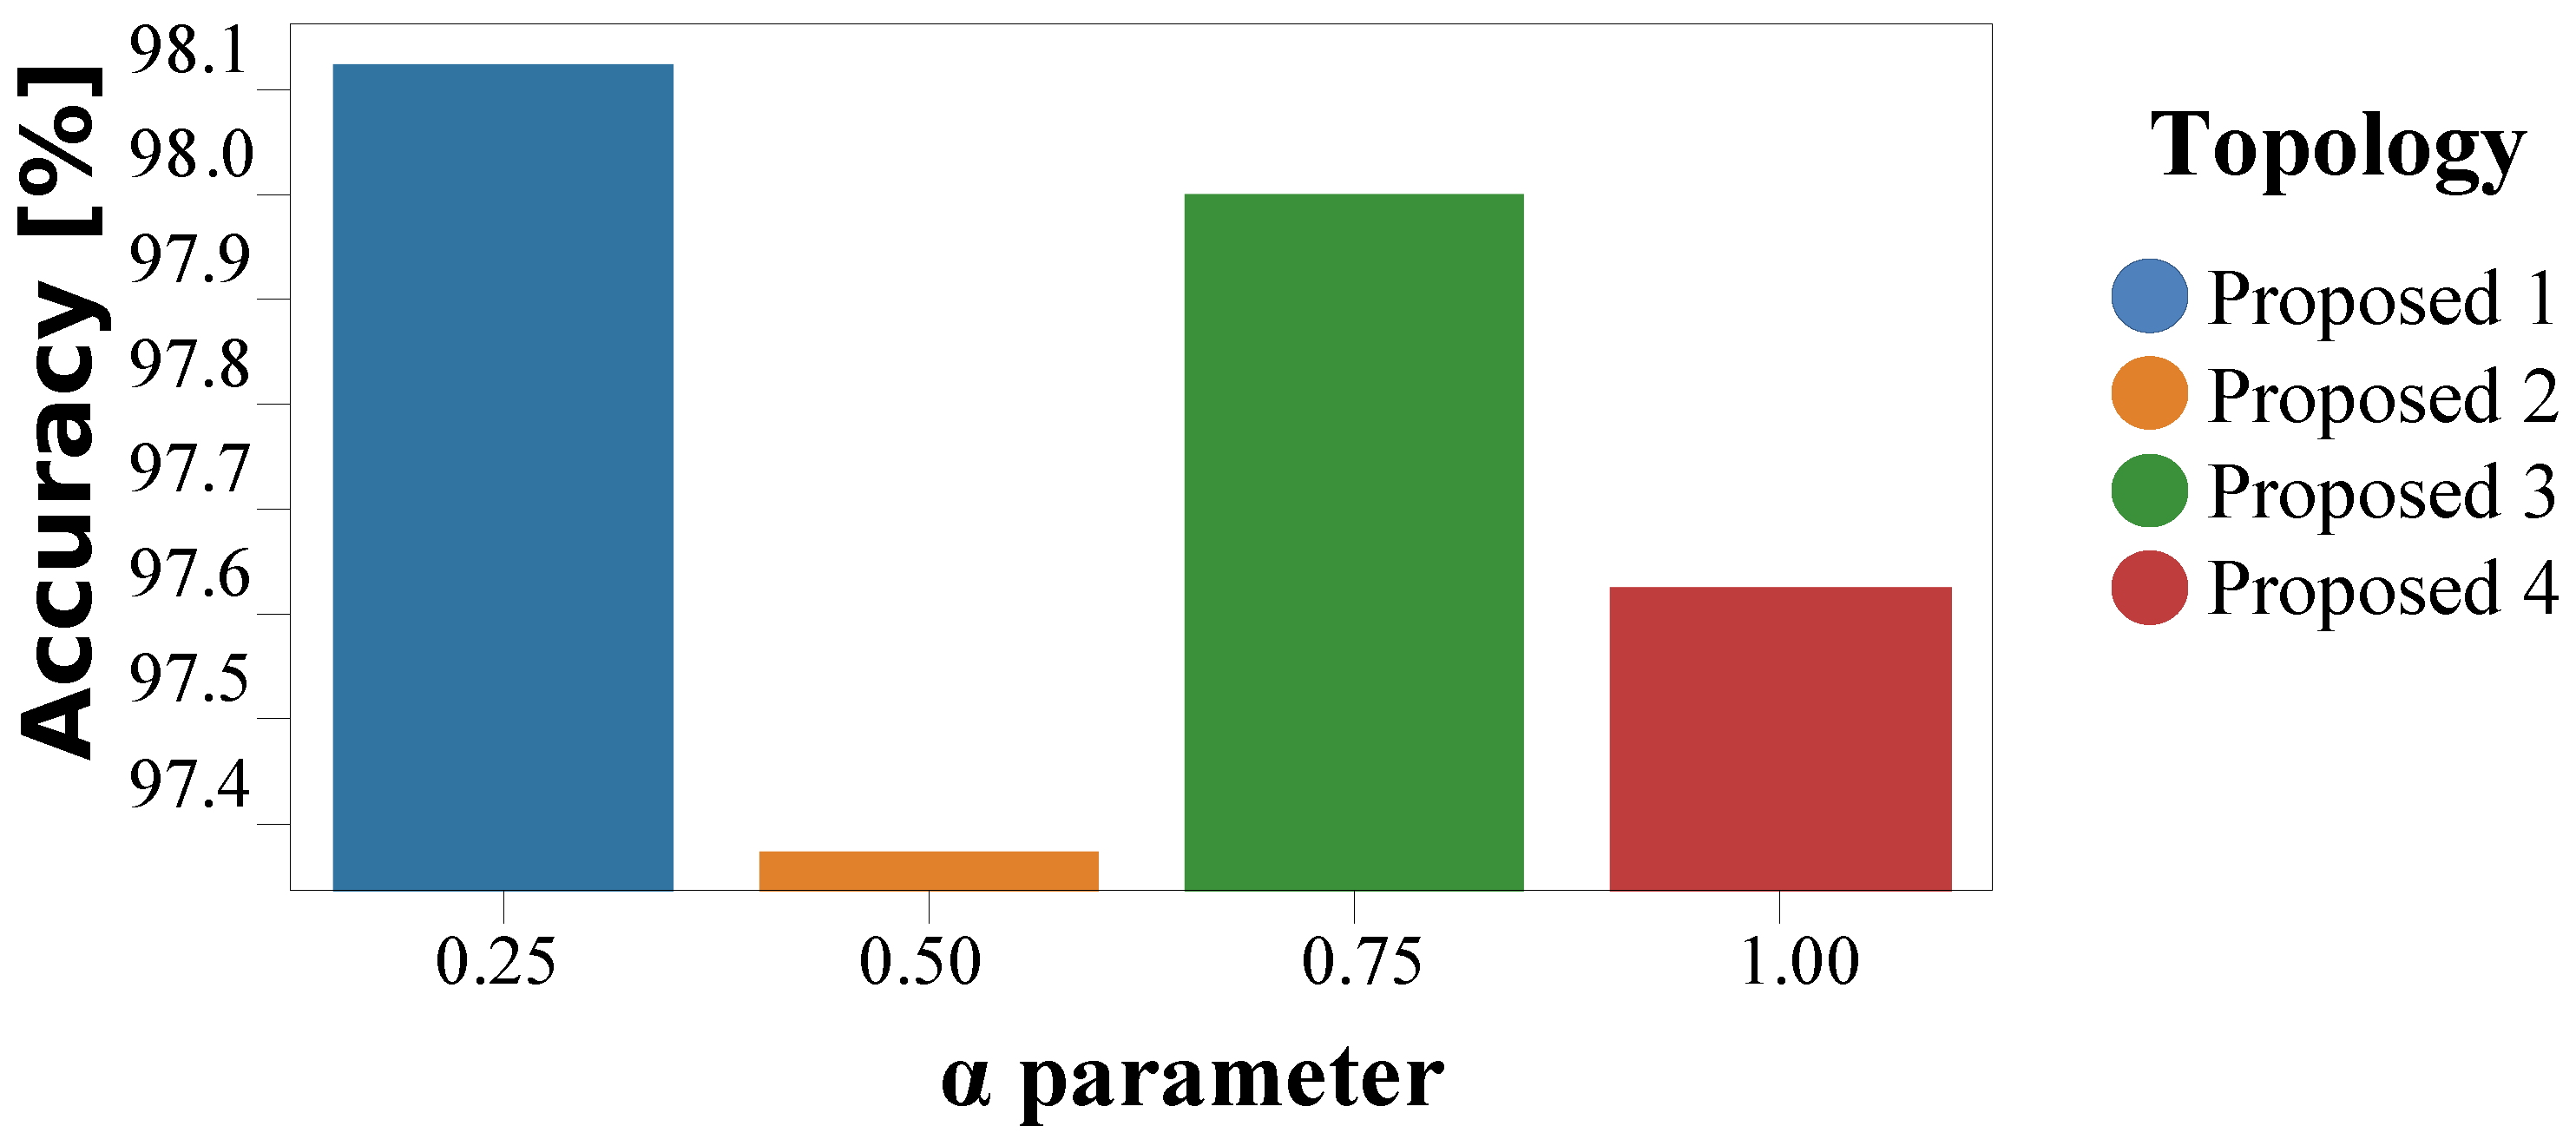
| Proposed 1 | 98.00% | 98.13% | |
| Proposed 2 | 97.50% | 97.38% | |
| Proposed 3 | 98.13% | 98.00% | |
| Proposed 4 | 97.63% | 97.63% | |
| Model | No. Gestures | Accuracy | Type of Algorithm |
|---|---|---|---|
| Hazra et al. [27] | 5 | 94.34% | DL |
| Zhang et al. [74] | 8 | 96.00% | DL |
| Ahmed et al. [75] | 8 | 95.00% | DL |
| Hazra et al. [28] | 6 | 94.50% | DL |
| Molchanov et al. [76] | 11 | 94.10% | DL |
| Lien et al. [77] | 4 | 92.10% | RF |
| Chmurski et al. [78] | 4 | 95.05% | DL |
| Chmurski et al. [79] | 4 | 98.10% | DL |
| D’Eusanio et al. [23] | 25 | 87.60% | DL |
| D’Eusanio et al. [23] | 12 | 97.20% | DL |
| Molchanov et al. [24] | 25 | 83.80% | DL |
| D’Eusanio et al. [26] | 25 | 76.10% | DL |
| D’Eusanio et al. [26] | 12 | 92.00% | DL |
| Wang et al. [85] | 6 | 95.83% | FDTW |
| Wang et al. [86] | 4 | 87.17% | DL |
| Ritchie et al. [87] | 4 | 69.7% | DT |
| Ritchie et al. [87] | 4 | 71.4% | k-NN |
| Ritchie et al. [87] | 4 | 54.6% | LDA |
| Ritchie et al. [87] | 4 | 59.7% | QDA |
| Ritchie et al. [87] | 4 | 61.9% | SVM-l |
| Ritchie et al. [87] | 4 | 74.2% | SVM-q |
| Ritchie et al. [88] | 4 | 87.0% | k-NN |
| Proposed 1 (Edge TPU) | 8 | 98.13% | DL |
| Size [KB] | |||
|---|---|---|---|
| x86 | Edge TPU | ||
| Topologies | CNN3D | 12,586.58 | N/A |
| CNN2D | 375.89 | 80.67 | |
| MobileNetV2—1 bottleneck | 1770.96 | 200.67 | |
| MobileNetV2—2 bottleneck | 2028.85 | 232.67 | |
| MobileNetV2—3 bottleneck | 2287.06 | 264.67 | |
| MobileNetV2—4 bottleneck | 2545.35 | 296.67 | |
| MobileNetV2—5 bottleneck | 2804.27 | 328.67 | |
| MobileNetV2—6 bottleneck | 3063.25 | 360.67 | |
| Proposed 1 | 624.92 | 92.67 | |
| Proposed 2 | 999.00 | 140.67 | |
| Proposed 3 | 1543.89 | 220.67 | |
| Proposed 4 | 2233.44 | 280.67 | |
| Inference [ms] | |||
|---|---|---|---|
| x86 | Edge TPU | ||
| Topologies | CNN3D | 3.57 | N/A |
| CNN2D | 1.16 | 3.61 | |
| MobileNetV2—1 bottleneck | 2.19 | 1.19 | |
| MobileNetV2—2 bottleneck | 4.17 | 1.52 | |
| MobileNetV2—3 bottleneck | 5.66 | 1.65 | |
| MobileNetV2—4 bottleneck | 8.52 | 1.79 | |
| MobileNetV2—5 bottleneck | 8.74 | 1.92 | |
| MobileNetV2—6 bottleneck | 10.42 | 2.04 | |
| Proposed 1 | 5.74 | 1.28 | |
| Proposed 2 | 10.18 | 1.63 | |
| Proposed 3 | 14.22 | 1.76 | |
| Proposed 4 | 20.73 | 1.90 | |
Publisher’s Note: MDPI stays neutral with regard to jurisdictional claims in published maps and institutional affiliations. |
© 2021 by the authors. Licensee MDPI, Basel, Switzerland. This article is an open access article distributed under the terms and conditions of the Creative Commons Attribution (CC BY) license (https://creativecommons.org/licenses/by/4.0/).
Share and Cite
Chmurski, M.; Mauro, G.; Santra, A.; Zubert, M.; Dagasan, G. Highly-Optimized Radar-Based Gesture Recognition System with Depthwise Expansion Module. Sensors 2021, 21, 7298. https://doi.org/10.3390/s21217298
Chmurski M, Mauro G, Santra A, Zubert M, Dagasan G. Highly-Optimized Radar-Based Gesture Recognition System with Depthwise Expansion Module. Sensors. 2021; 21(21):7298. https://doi.org/10.3390/s21217298
Chicago/Turabian StyleChmurski, Mateusz, Gianfranco Mauro, Avik Santra, Mariusz Zubert, and Gökberk Dagasan. 2021. "Highly-Optimized Radar-Based Gesture Recognition System with Depthwise Expansion Module" Sensors 21, no. 21: 7298. https://doi.org/10.3390/s21217298
APA StyleChmurski, M., Mauro, G., Santra, A., Zubert, M., & Dagasan, G. (2021). Highly-Optimized Radar-Based Gesture Recognition System with Depthwise Expansion Module. Sensors, 21(21), 7298. https://doi.org/10.3390/s21217298