
Valuable Clues for DCNN-Based Landslide Detection from a Comparative Assessment in the Wenchuan Earthquake Area


Abstract
:1. Introduction
2. Materials and Methods
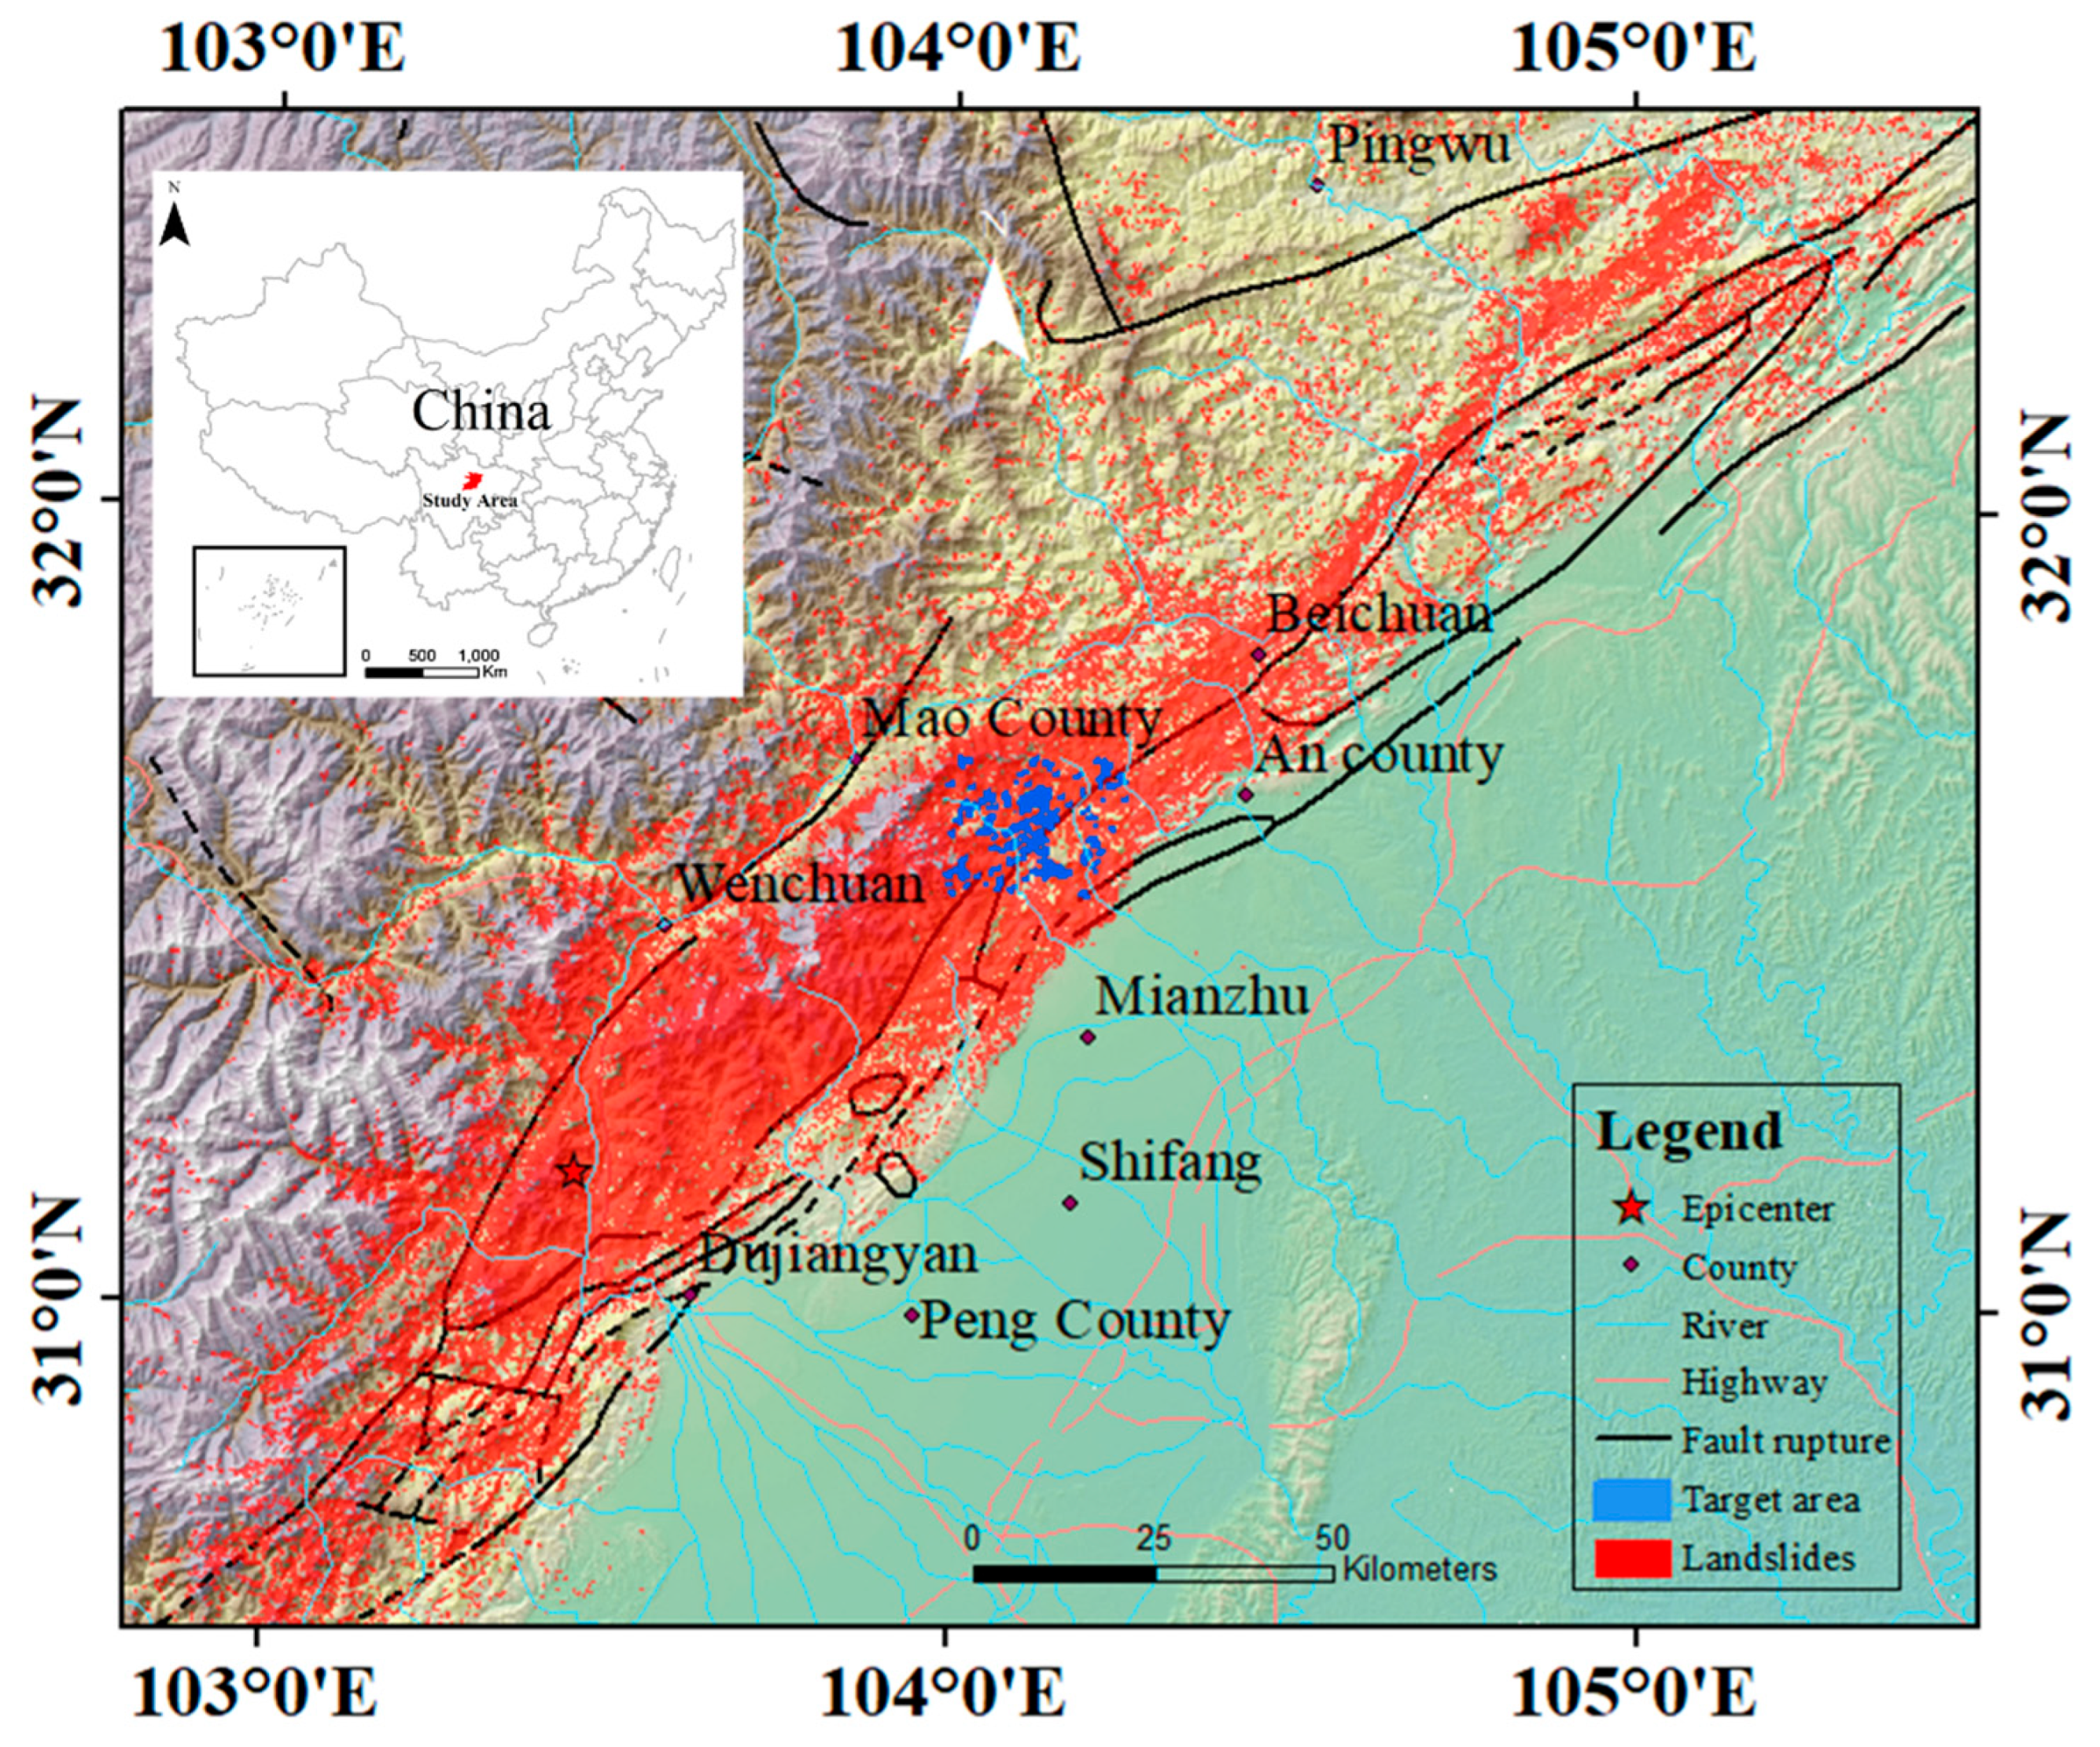
2.1. Study Area
2.2. Data and Samples
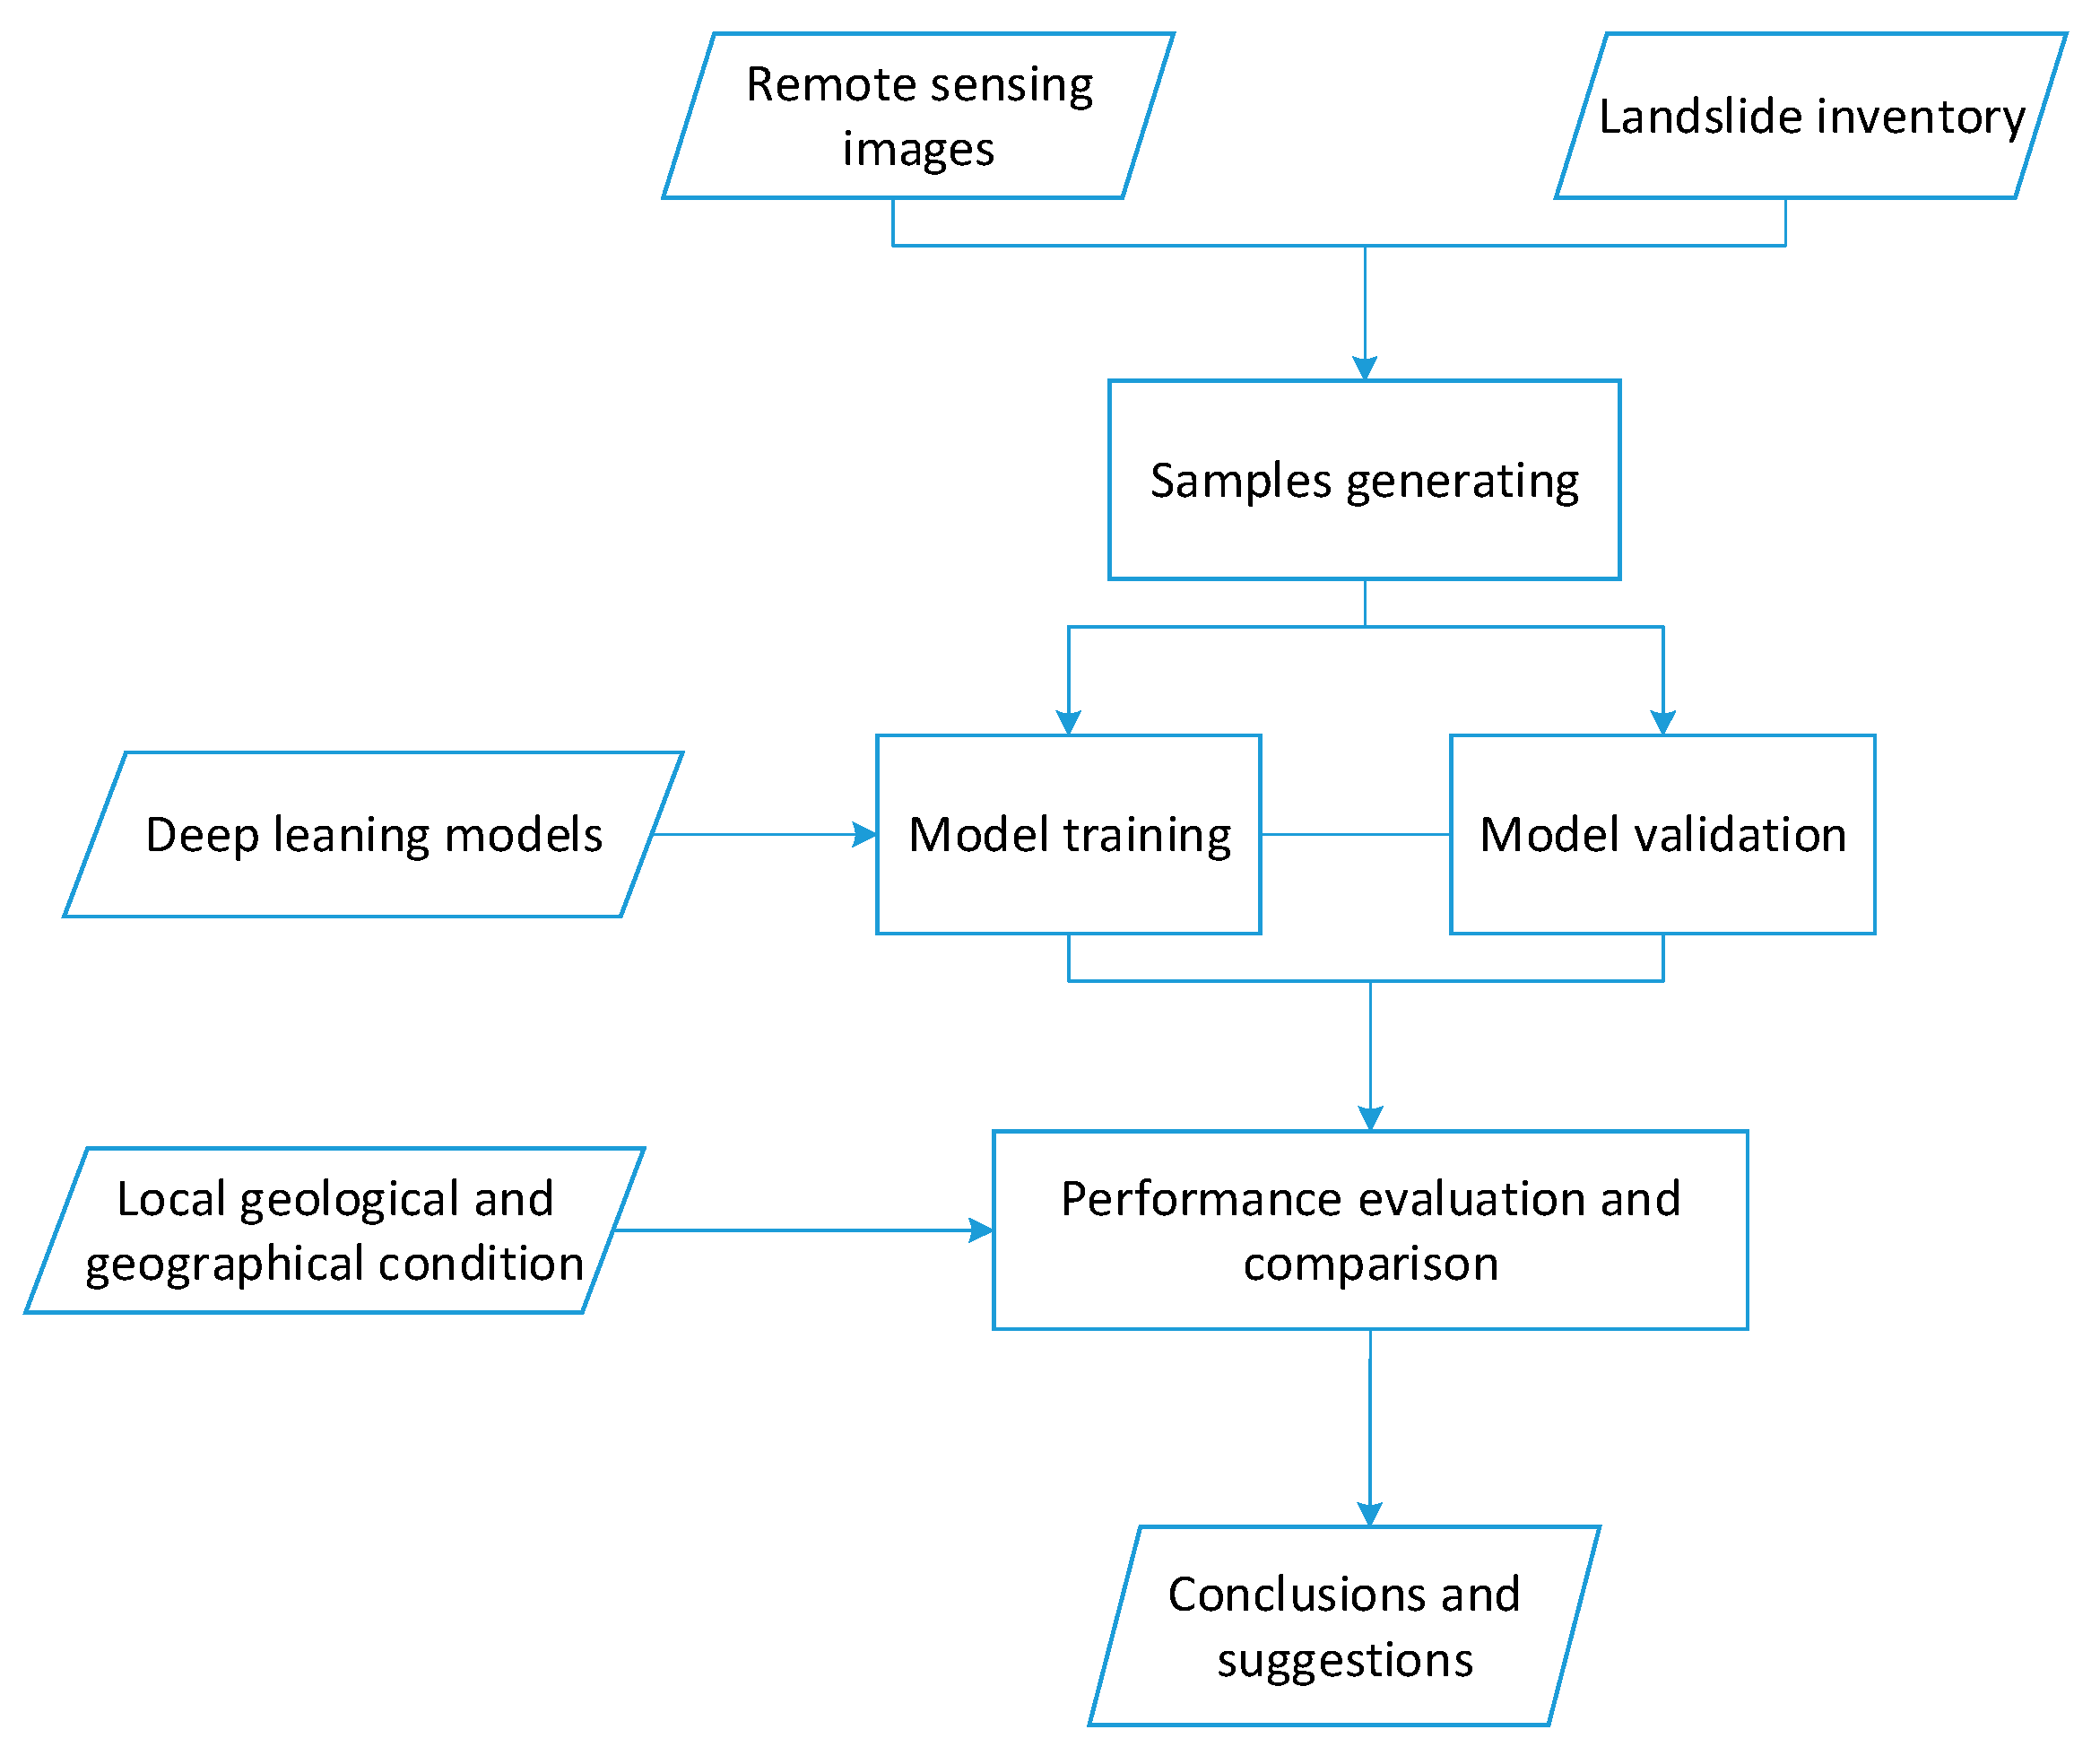
2.3. Methods
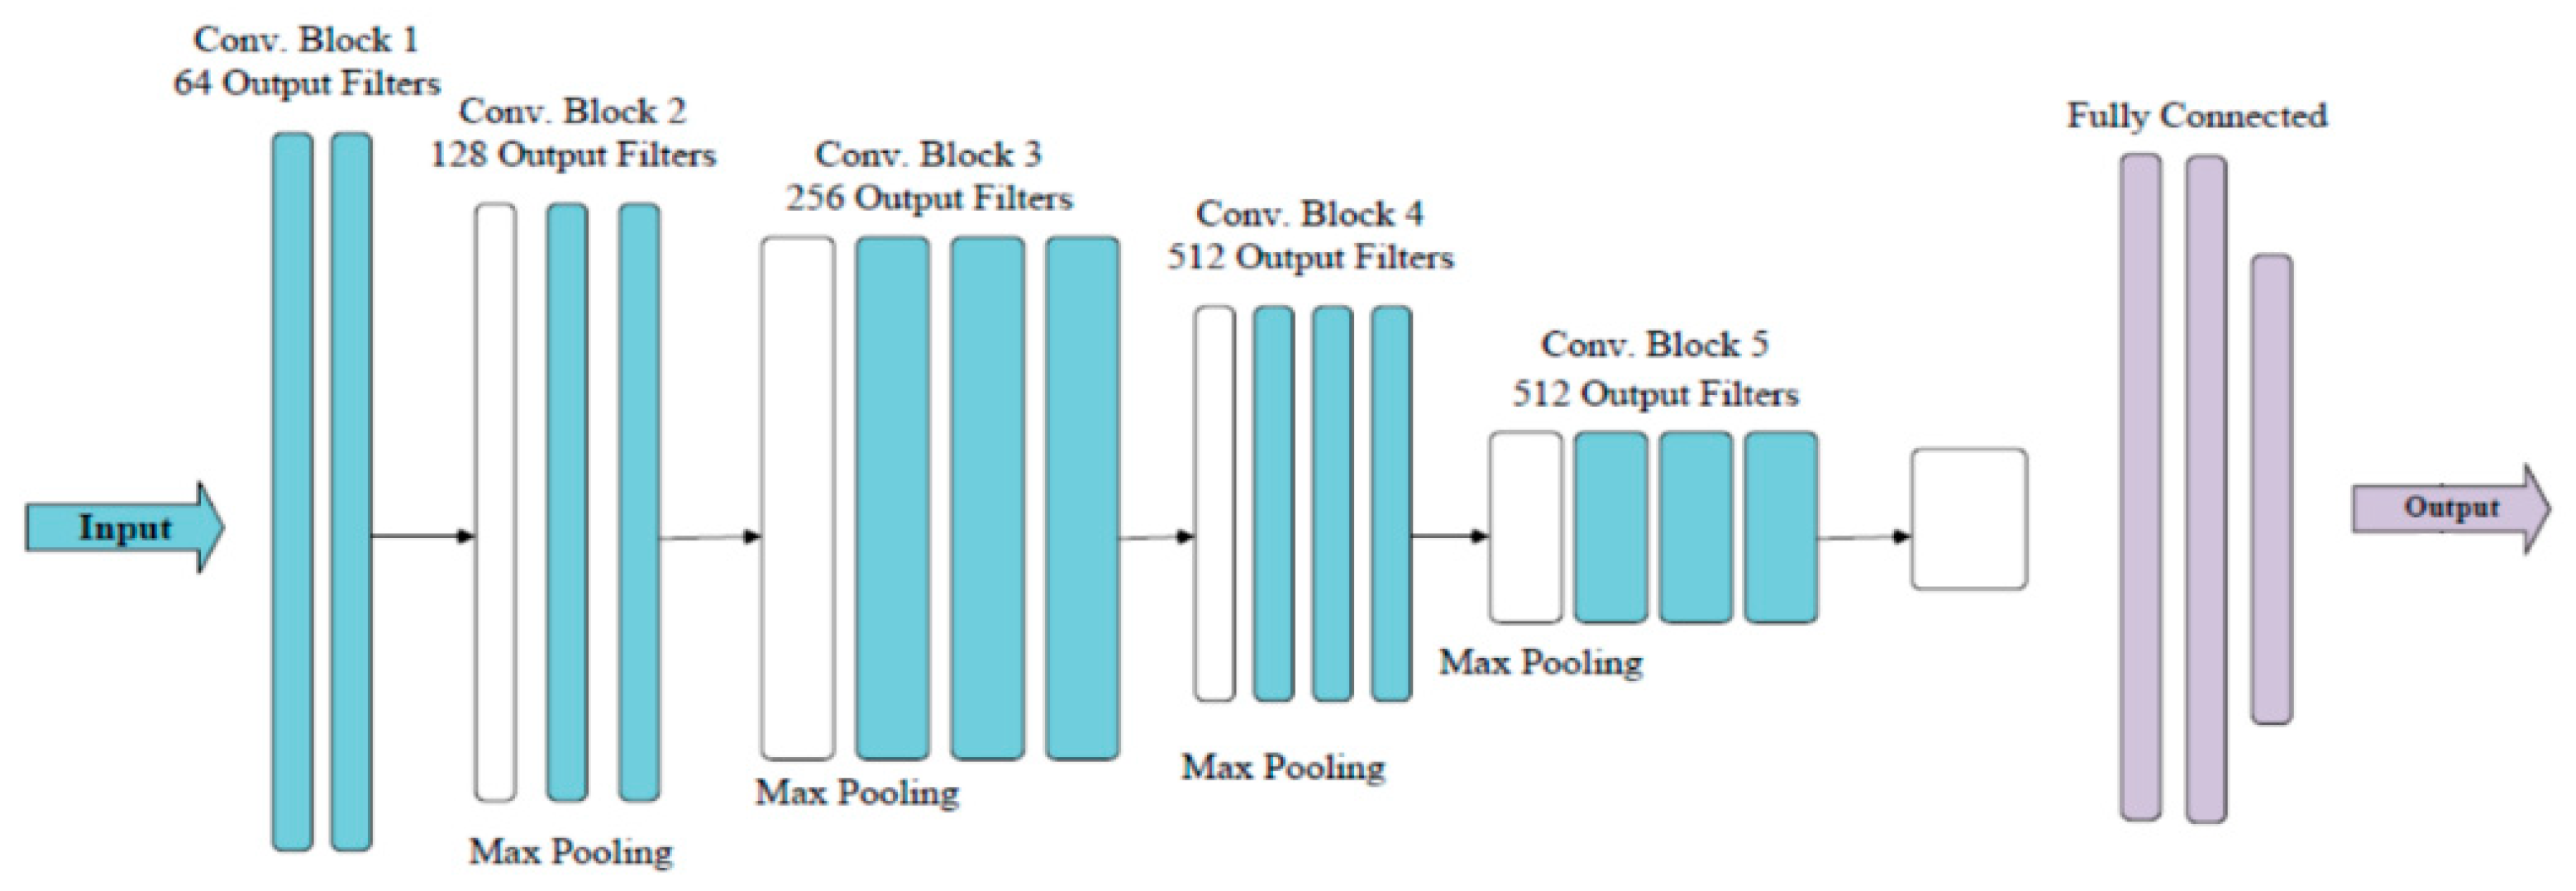
2.3.1. VGG Models
2.3.2. ResNet Models
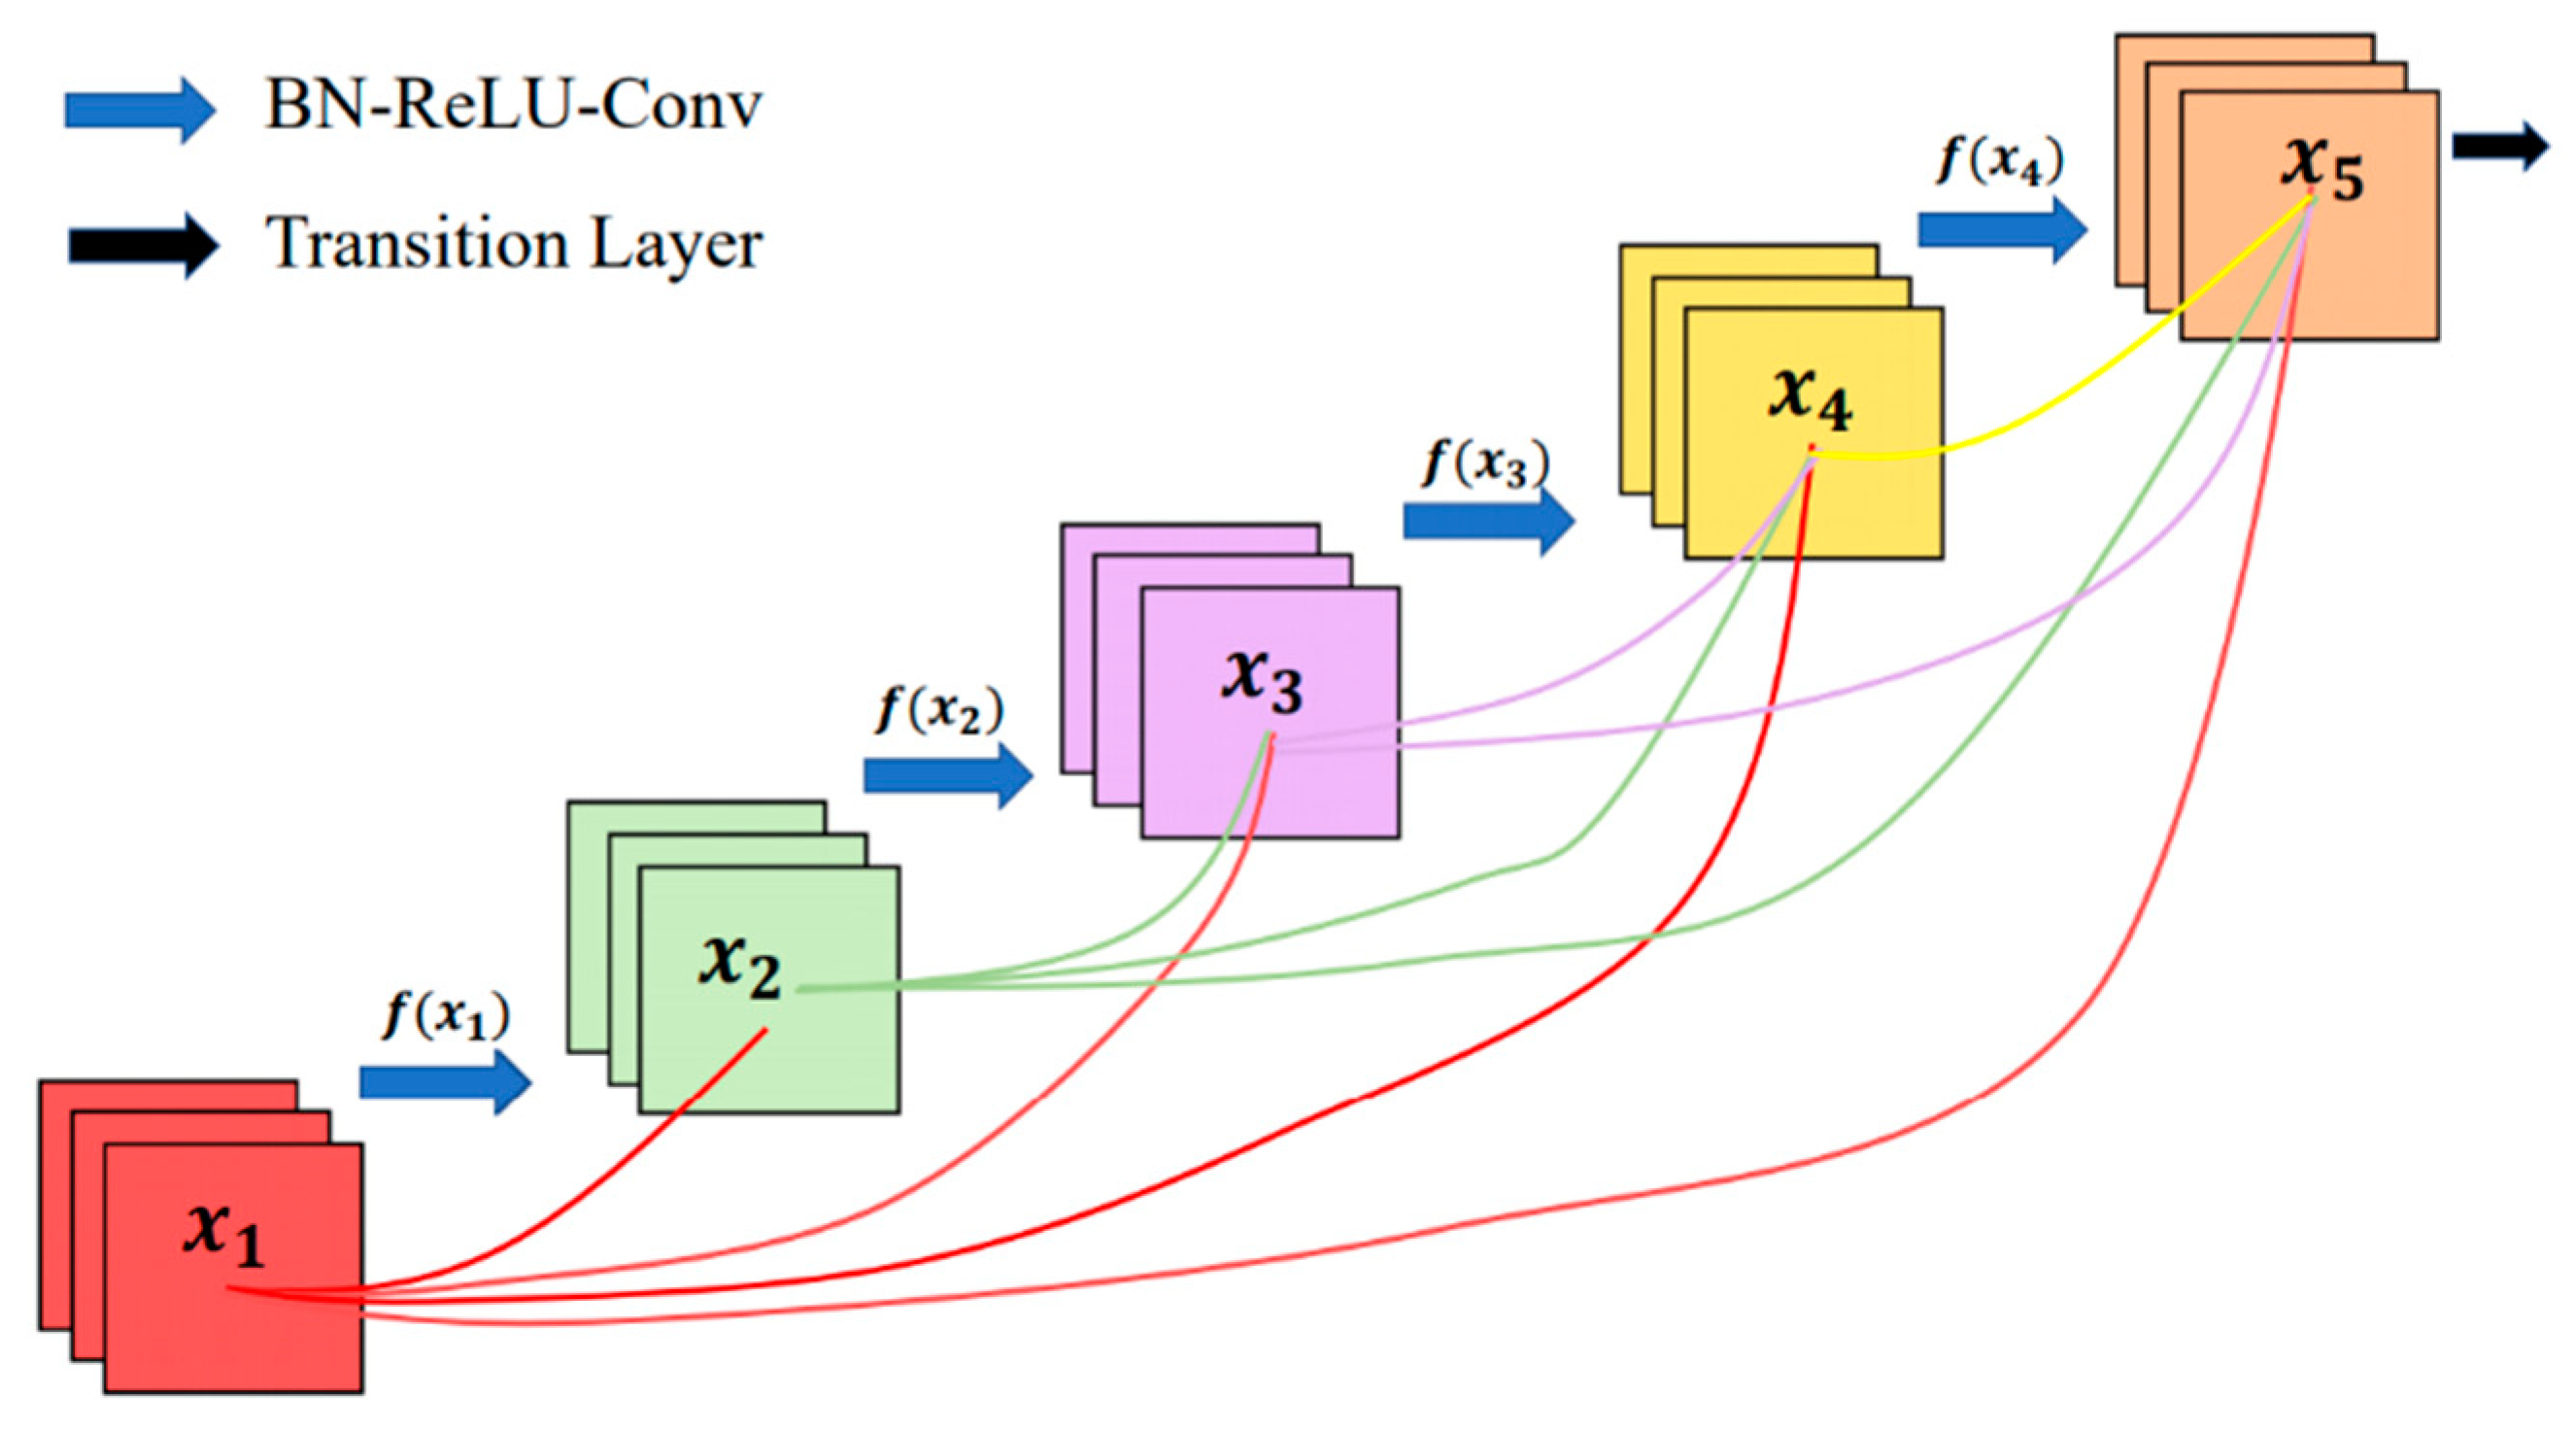
2.3.3. DenseNet Models
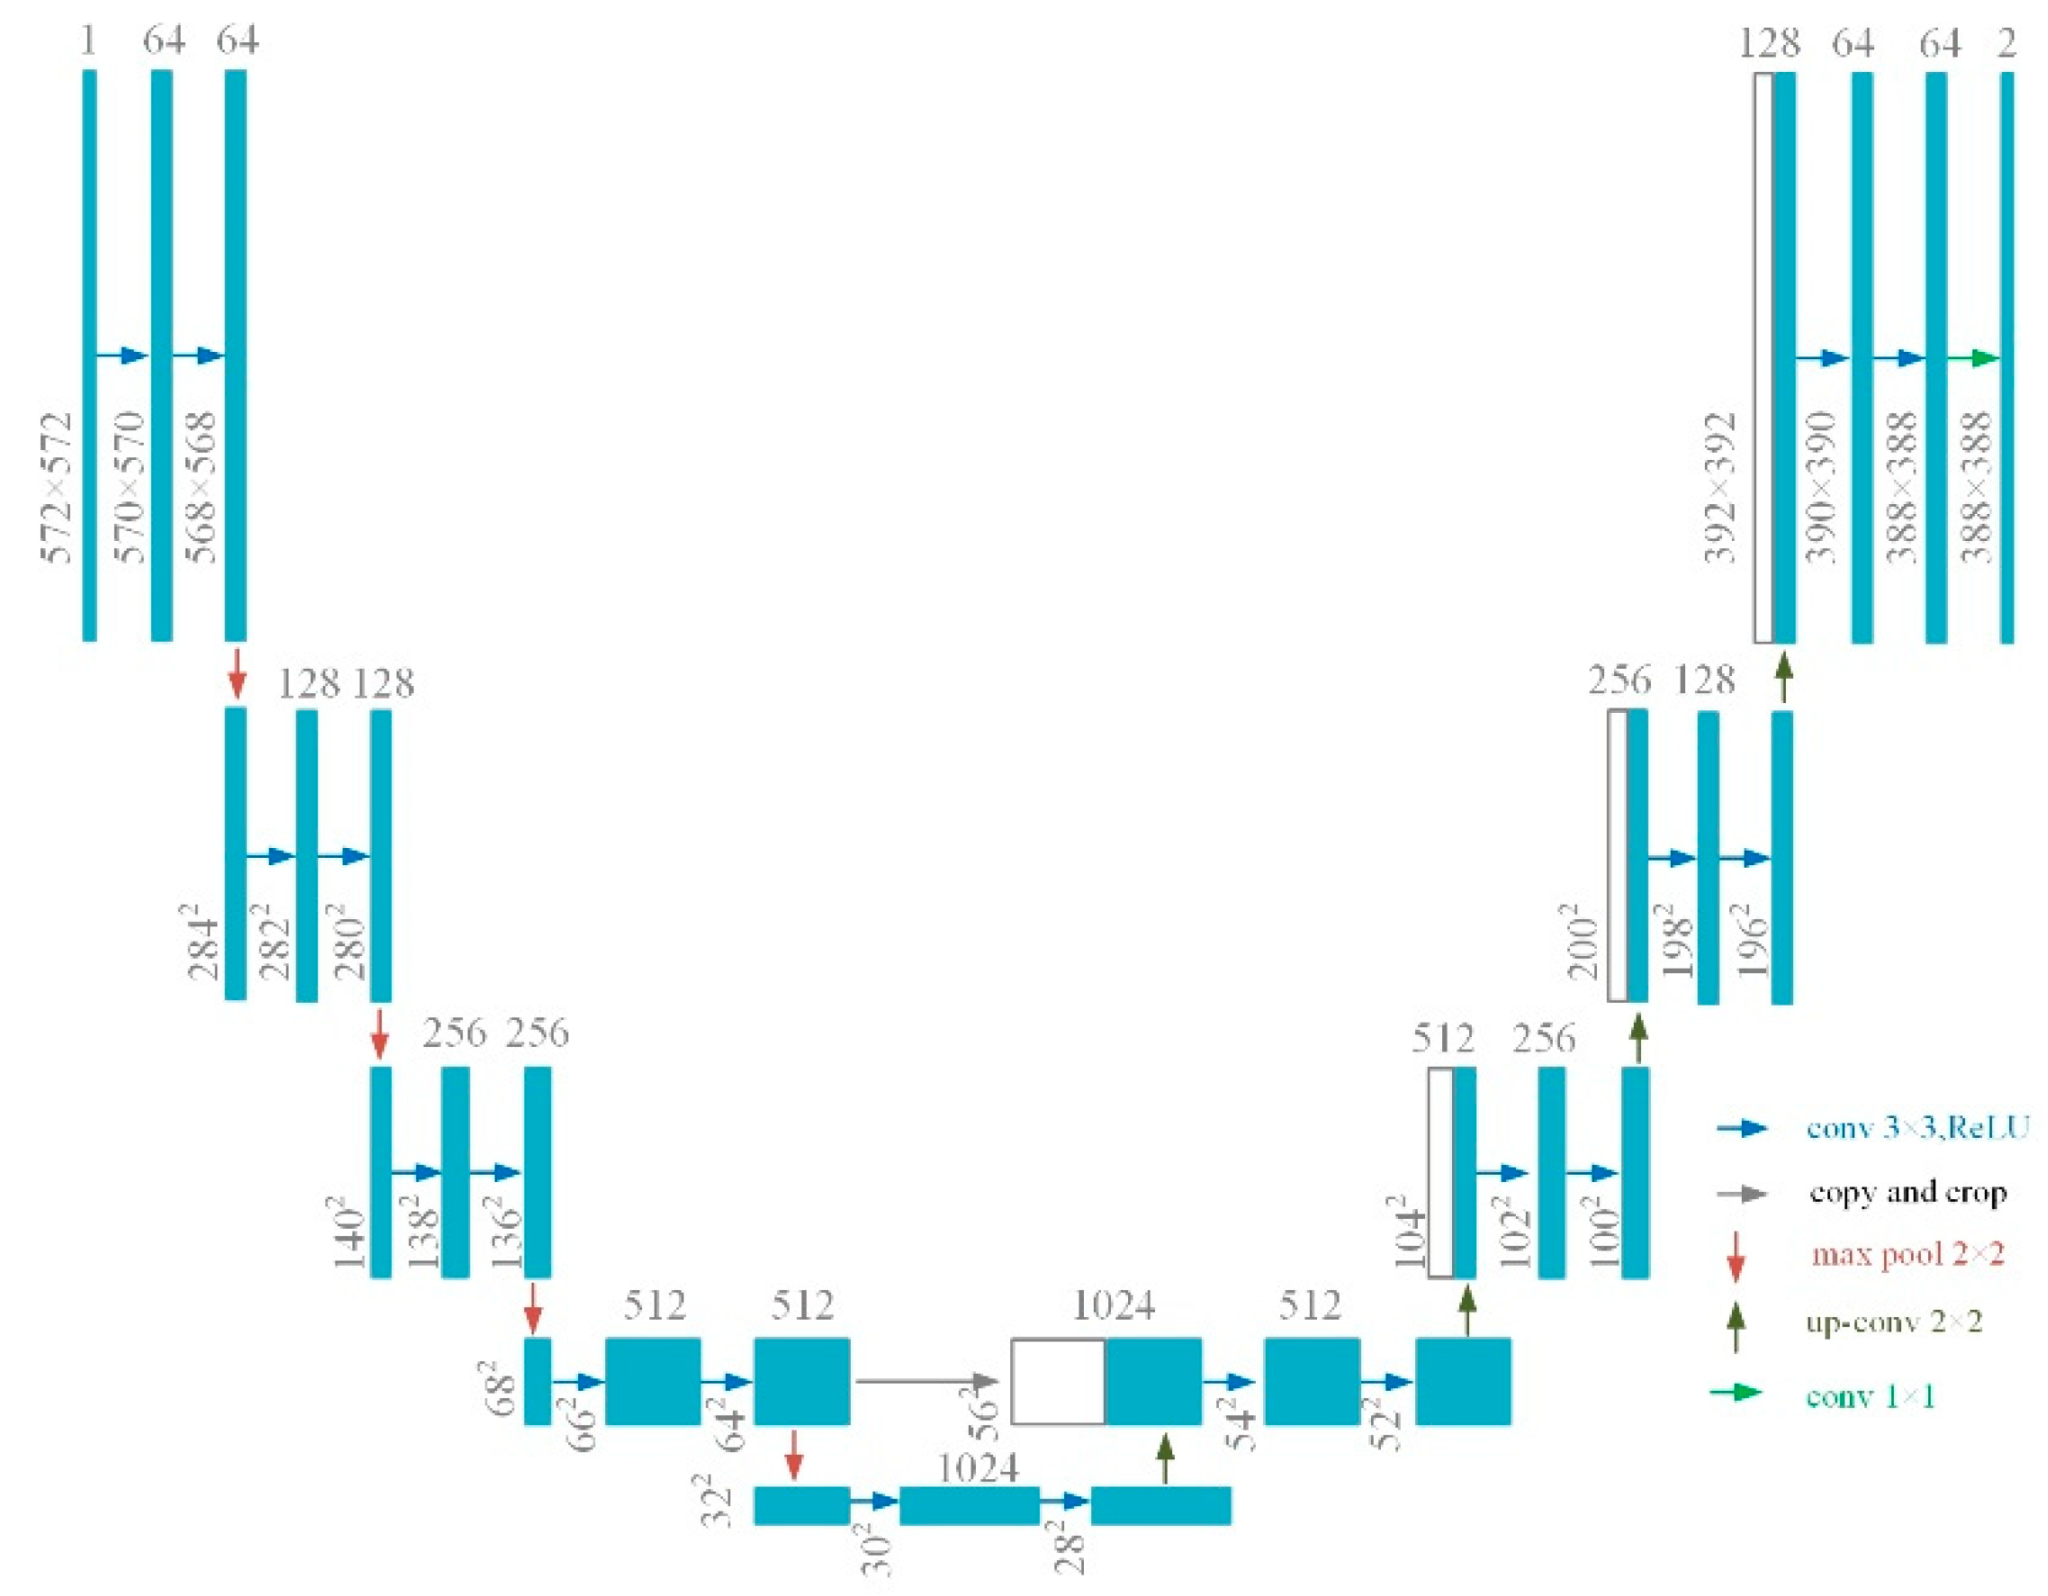
2.3.4. U-Net models
2.3.5. Performance Assessment
3. Results


4. Discussion
5. Conclusions
Supplementary Materials
Author Contributions
Funding
Institutional Review Board Statement
Informed Consent Statement
Data Availability Statement
Acknowledgments
Conflicts of Interest
References
- China Geological Survey. National Geological Disasters Bulletin. Available online: https://www.cgs.gov.cn/ (accessed on 22 May 2021).
- Wang, G.; Joyce, J.; Phillips, D.; Shrestha, R.; Carter, W. Delineating and defining the boundaries of an active landslide in the rainforest of Puerto Rico using a combination of airborne and terrestrial lidar data. Landslides 2013, 10, 503–513. [Google Scholar] [CrossRef]
- Zhou, S.; Fang, L. Support vector machine modeling of earthquake-induced landslides susceptibility in Central Part of Sichuan Province China. Geoenviron. Disasters 2015, 2, 1–12. [Google Scholar] [CrossRef] [Green Version]
- Marc, O.; Meunier, P.; Hovius, N. Prediction of the area affected by earthquake-induced landsliding based on seismological parameters. Nat. Hazards Eatrh Syst. Sci. 2017, 17, 1159–1175. [Google Scholar]
- Guzzetti, F.; Mondini, A.C.; Cardinali, M.; Fiorucci, F.; Santangelo, M.; Chang, K.T. Landslide inventory maps: New tools for an old problem. Earth Sci. Rev. 2012, 112, 42–66. [Google Scholar] [CrossRef] [Green Version]
- Zhong, C.; Liu, Y.; Gao, P.; Chen, W.; Li, H.; Hou, Y.; Tuohuti, N. Landslide mapping with remote sensing: Challenges and opportunities. Int. J. Remote Sens. 2020, 41, 555–1581. [Google Scholar] [CrossRef]
- Behling, R.; Roessner, S.; Kaufmann, H.; Kleinschmit, B. Automated spatiotemporal landslide mapping over large areas using RapidEye time series data. Remote Sens. 2014, 6, 8026–8055. [Google Scholar] [CrossRef] [Green Version]
- Ramos-Berna, R.; Vázquez-Jiménez, R.; Romero-Calcerrada, R.; Arrogante-Funes, P.; Novillo, C. Evaluation of unsupervised change detection methods applied to landslide inventory mapping using ASTER imagery. Remote Sens. 2018, 10, 1987. [Google Scholar] [CrossRef] [Green Version]
- Deng, S.; Shi, W. Semi-automatic approach for identifying locations of shallow debrisslides/flows based on lidar-derived morphological features. Int. J. Remote Sens. 2014, 35, 3741–3763. [Google Scholar] [CrossRef]
- Leshchinsky, B.; Olsen, M.J.; Tanyu, B.F. Contour connection method for automated identification and classification of landslide deposits. Comput. Geosci. 2015, 74, 27–38. [Google Scholar] [CrossRef]
- Zhang, Y.; Meng, X.; Chen, G.; Qiao, L.; Zeng, R.; Chang, J. Detection of geohazards in the Bailong river basin using synthetic aperture radar interferometry. Landslides 2016, 13, 1273–1284. [Google Scholar] [CrossRef]
- Rosin, P.L.; Hervás, J. Remote Sensing image thresholding methods for determining landslide activity. Int. J. Remote Sens. 2005, 26, 1075–1092. [Google Scholar] [CrossRef] [Green Version]
- Yu, B.; Chen, F. A new technique for landslide mapping from a large-scale remote sensed image: A case study of central Nepal. Comput. Geosci. 2017, 100, 115–124. [Google Scholar] [CrossRef] [Green Version]
- Li, Z.; Shi, W.; Lu, P.; Yan, L.; Wang, Q.; Miao, Z. Landslide mapping from aerial photographs using change detection-based Markov random field. Remote Sens. Environ. 2016, 187, 76–90. [Google Scholar] [CrossRef] [Green Version]
- Zhao, W.; Li, A.; Nan, X.; Zhang, Z.; Lei, G. Postearthquake landslides mapping from landsat-8 data for the 2015 Nepal earthquake using a pixel-based change detection method. IEEE J. Sel. Top. Appl. Earth Obs. Remote Sens. 2017, 10, 1758–1768. [Google Scholar] [CrossRef]
- Zhong, C.; Wang, C.; Li, H.; Chen, W.; Hou, Y. Mapping inter-annual land cover variations automatically based on a novel sample transfer method. Remote Sens. 2018, 10, 1457. [Google Scholar] [CrossRef] [Green Version]
- Parker, R.; Densmore, A.; Rosser, N.; de Michele, M.; Li, Y.; Huang, R.; Whadcoat, S.; Petley, D. Mass wasting triggered by the 2008 Wenchuan earthquake is greater than orogenic growth. Nat. Geosci. 2011, 4, 449–452. [Google Scholar] [CrossRef] [Green Version]
- Siyahghalati, S.; Saraf, A.; Pradhan, B.; Jebur, N.; Tehrany, M.S. Rule-based semi-automated approach for the detection of landslides induced by 18 September 2011 Sikkim Himalaya earthquake using IRS LISS3 satellite images. Geomat. Nat. Hazards Risk 2016, 7, 326–344. [Google Scholar] [CrossRef] [Green Version]
- Mustafa, R.M.; Biswajeet, P.; Hossein, M. Improving landslide detection from airborne laser scanning data using optimized dempster–shafer. Remote Sens. 2018, 10, 1029. [Google Scholar]
- Hu, X.; Wang, T.; Pierson, T.C.; Lu, Z.; Kim, J.W.; Cecere, T.H. Detecting seasonal landslide movement within the cascade landslide complex (Washington) using time-series SAR imagery. Remote Sens. Environ. 2016, 187, 49–61. [Google Scholar] [CrossRef] [Green Version]
- Lian, X.; Li, Z.; Yuan, H.; Liu, J.; Zhang, Y.; Liu, X.; Wu, Y. Rapid identification of landslide collapse and crack based on low-altitude remote sensing image of UAV. J. Mt. Sci. 2020, 17, 2915–2928. [Google Scholar] [CrossRef]
- Geoffrey, E.; Hinton, S.; Osindero, Y. A fast learning algorithm for deep belief nets. Neural Comput. 2006, 18, 1527–1554. [Google Scholar]
- Russakovsky, O.; Deng, J.; Su, H.; Krause, J.; Satheesh, S.; Ma, S.; Huang, Z.; Karpathy, A.; Khosla, A.; Bernstein, M.; et al. ImageNet large-scale visual recognition challenge. Int. J. Comput. Vis. 2015, 115, 211–252. [Google Scholar] [CrossRef] [Green Version]
- Shao, Z.; Cai, J.; Fu, P.; Hu, L.; Liu, T. Deep learning-based fusion of landsat-8 and sentinel-2 images for a harmonized surface reflectance product. Remote Sens. Environ. 2019, 235, 111425. [Google Scholar] [CrossRef]
- Zhang, R.; Shao, Z.; Huang, X.; Wang, J.; Li, D. Object detection in UAV images via global density fused convolutional network. Remote Sens. 2020, 12, 3140. [Google Scholar] [CrossRef]
- Mohan, A.; Singh, A.K.; Kumar, B.; Dwivedi, R. Review on remote sensing methods for landslide detection using machine and deep learning. Trans. Emerg. Telecommun. Technol. 2020, 32, e3998. [Google Scholar] [CrossRef]
- Ghorbanzadeh, O.; Meena, S.R.; Blaschke, T.; Aryal, J. UAV-based slope failure detection using deep-learning convolutional neural networks. Remote Sens. 2019, 11, 2046. [Google Scholar] [CrossRef] [Green Version]
- Ghorbanzadeh, O.; Blaschke, T.; Gholamnia, K.; Sansar, R.M.; Tiede, D.; Aryal, J. Evaluation of different machine learning methods and deep-learning convolutional neural networks for landslide detection. Remote Sens. 2019, 11, 196. [Google Scholar] [CrossRef] [Green Version]
- Sameen, M.; Pradhan, B. Landslide detection using residual networks and the fusion of spectral and topographic information. IEEE Access 2019, 7, 114363–114373. [Google Scholar] [CrossRef]
- Ji, S.P.; Yu, D.W.; Shen, C.Y.; Xu, Q. Landslide detection from an open satellite imagery and digital elevation model dataset using attention boosted convolutional neural networks. Landslides 2020, 17, 1337–1352. [Google Scholar] [CrossRef]
- Prakash, I.; Manconi, A.; Loew, S. Mapping landslides on EO data: Performance of deep learning models vs. traditional machine learning models. Remote Sens. 2020, 12, 346. [Google Scholar] [CrossRef] [Green Version]
- Yi, Y.; Zhang, W. A new deep-learning-based approach for earthquake-triggered landslide detection from single-temporal RapidEye satellite imagery. IEEE J. Sel. Top. Appl. Earth Obs. Remote Sens. 2020, 13, 6166–6176. [Google Scholar] [CrossRef]
- Shi, W.; Zhang, M.; Ke, H.; Fang, X.; Zhan, Z.; Chen, S. Landslide recognition by deep convolutional neural network and change detection. IEEE Trans. Geosci. Remote Sens. 2021, 59, 4654–4672. [Google Scholar] [CrossRef]
- Ullo, S.; Mohan, A.; Sebastianelli, A.; Ahamed, S.; Kumar, B.; Dwivedi, R.; Sinha, G. A new mask R-CNN-based method for improved landslide detection. IEEE J. Sel. Top. Appl. Earth Obs. Remote Sens. 2021, 14, 3799–3810. [Google Scholar] [CrossRef]
- Wang, W.; Godard, V.; Liu, Z.J.; Scherler, D.; Xu, C.; Zhang, J.; Xie, K.; Bellier, O.; Ansberque, C.; De Sigoyer, J. Perturbation of fluvial sediment fluxes following the 2008 Wenchuan earthquake: Fluvial sediment fluxes following large-magnitude earthquake. Earth Surf. Process. Landf. 2017, 42, 2611–2622. [Google Scholar] [CrossRef]
- Xu, C. Preparation of earthquake-triggered landslide inventory maps using remote sensing and GIS technologies: Principles and case studies. Geosci. Front. 2015, 6, 825–836. [Google Scholar] [CrossRef] [Green Version]
- Fan, X.; Domènech, G.; Scaringi, G.; Huang, R.; Xu, Q.; Hales, T.C.; Dai, L.; Yang, Q.; Francis, O. Spatio-temporal evolution of mass wasting after the 2008 mw 7.9 Wenchuan earthquake revealed by a detailed multi-temporal inventory. Landslides 2018, 15, 2325–2341. [Google Scholar] [CrossRef]
- Fan, X.; Scaringi, G.; Domènech, G.; Yang, F.; Guo, X.; Dai, L.; He, C.; Xu, Q.; Huang, R. Two multi-temporal datasets that track the enhanced landsliding after the 2008 Wenchuan earthquake. Earth Syst. Sci. Data 2019, 11, 35–55. [Google Scholar] [CrossRef] [Green Version]
- Krizhevsky, A.; Sutskever, I.; Hinton, G. ImageNet classification with deep convolutional neural networks. Adv. Neural Inf. Process. Syst. NIPS 2012, 1, 1097–1105. [Google Scholar] [CrossRef]
- Zhang, L.; Shao, Z.; Liu, J.; Cheng, Q. Deep learning-based retrieval of forest aboveground biomass from combined lidar and Landsat 8 data. Remote Sens. 2019, 11, 1459. [Google Scholar] [CrossRef] [Green Version]
- He, L.; Zhang, X.; Ren, S.; Sun, J. Deep Residual learning for image recognition. arXiv 2020, arXiv:1512.03385v1. [Google Scholar]
- Gao, H.; Zhuang, L.; Weinberger, L. Densely connected convolutional networks. In Proceedings of the CVPR 2017, Honolulu, HI, USA, 21–26 July 2017. [Google Scholar]
- Shao, Z.; Zhou, W.; Deng, X.; Zhang, M.; Cheng, Q. Multilabel remote sensing image retrieval based on fully convolutional network. IEEE J. Sel. Top. Appl. Earth Obs. Remote Sens. 2020, 13, 318–328. [Google Scholar] [CrossRef]
- Ronneberger, O.; Fischer, P.; Brox, T. U-Net: Convolutional networks for biomedical image segmentation. In Proceedings of the International Conference on Medical Image Computing and Computer-Assisted Intervention, Munich, Germany, 5–9 October 2015. [Google Scholar]
- Lucas, S.; Helen, D.; Carlos, G. Landslide segmentation with U-Net: Evaluating different sampling methods and patch sizes. arXiv 2020, arXiv:2007.06672v1. [Google Scholar]
- Yin, Y.; Cheng, Y.; Wang, J.; Wang, M.; Liu, B.; Song, Y.; Liang, J. Remote sensing research on Daguangbao gigantic rock-Slide triggered by Wenchuan earthquake. Q. J. Eng. Geol. Hydrogeol. 2011, 19, 674–684. [Google Scholar]
- Simonyan, K.; Zisserman, A. Very deep convolutional networks for large-scale image recognition. arXiv 2020, arXiv:1409.1556. [Google Scholar]


Publisher’s Note: MDPI stays neutral with regard to jurisdictional claims in published maps and institutional affiliations. |
© 2021 by the authors. Licensee MDPI, Basel, Switzerland. This article is an open access article distributed under the terms and conditions of the Creative Commons Attribution (CC BY) license (https://creativecommons.org/licenses/by/4.0/).
Share and Cite
Li, C.; Yi, B.; Gao, P.; Li, H.; Sun, J.; Chen, X.; Zhong, C. Valuable Clues for DCNN-Based Landslide Detection from a Comparative Assessment in the Wenchuan Earthquake Area. Sensors 2021, 21, 5191. https://doi.org/10.3390/s21155191
Li C, Yi B, Gao P, Li H, Sun J, Chen X, Zhong C. Valuable Clues for DCNN-Based Landslide Detection from a Comparative Assessment in the Wenchuan Earthquake Area. Sensors. 2021; 21(15):5191. https://doi.org/10.3390/s21155191
Chicago/Turabian StyleLi, Chang, Bangjin Yi, Peng Gao, Hui Li, Jixing Sun, Xueye Chen, and Cheng Zhong. 2021. "Valuable Clues for DCNN-Based Landslide Detection from a Comparative Assessment in the Wenchuan Earthquake Area" Sensors 21, no. 15: 5191. https://doi.org/10.3390/s21155191
APA StyleLi, C., Yi, B., Gao, P., Li, H., Sun, J., Chen, X., & Zhong, C. (2021). Valuable Clues for DCNN-Based Landslide Detection from a Comparative Assessment in the Wenchuan Earthquake Area. Sensors, 21(15), 5191. https://doi.org/10.3390/s21155191