
Hemorrhage Detection Based on 3D CNN Deep Learning Framework and Feature Fusion for Evaluating Retinal Abnormality in Diabetic Patients


Abstract
1. Introduction
- 1.
- Hemorrhages occur in places where the contrast is significantly poor.
- 2.
- False hazard because of the existence of blood vessels.
- 3.
- Detection performance may vary by disparate sizes of MAs and hemorrhages.
- 4.
- Existing DR screening methods are computationally complex and take a longer processing time to detect the accurate hemorrhages.
- 1.
- A modified Contrast Limited Adaptive Histogram Equalization (CLAHE) method is used as a preprocessing step to enhance the edge details from the input source images.
- 2.
- A novel 3D Convolutional Neural Network (CNN) model for the accurate segmentation of hemorrhages from the retinal images with high accuracy and early detection.
- 3.
- A modified pre-trained VGG19 deep learning architecture is used for feature extraction, and it performs transfer learning to retrieve the selected datasets.
2. Related Work
3. Proposed Hemorrhage Detection Technique
3.1. Green Channel Extraction
3.2. Contrast Enhancement
3.3. 3D CNN Based Segmentation Model
3.4. Training Models
3.5. Deep Learning Features
3.6. Feature Extraction Using Transfer Learning
3.7. Feature Selection
3.8. Feature Fusion and Classification
4. Performance Evaluation
4.1. Environment and Datasets
4.2. Performance Evaluation Criteria
4.3. Results and Discussion
4.4. Computational Efficiency
5. Conclusions
Author Contributions
Funding
Institutional Review Board Statement
Informed Consent Statement
Data Availability Statement
Conflicts of Interest
References
- Flaxman, S.R.; Bourne, R.R.; Resnikoff, S. Global causes of blindness and distance vision impairment 1990–2020: A systematic review and meta-analysis. Lancet Glob. Health 2017, 5, 1221–1234. [Google Scholar] [CrossRef]
- Li, T.; Bo, W.; Hu, C.; Kang, H.; Liu, H.; Wang, K.; Fu, H. Applications of deep learning in fundus images: A review. Med. Image Anal. 2021, 69, 101971. [Google Scholar] [CrossRef]
- Tan, J.H.; Bhandary, S.; Sivaprasad, S.; Hagiwara, Y.; Bagchi, A.; Raghavendra, U.; Rao, A.K.; Raju, B.; Shetty, N.S.; Gertych, A.; et al. Age-related Macular Degeneration detection using deep convolutional neural network. Futur. Gener. Comput. Syst. 2018, 87, 127–135. [Google Scholar] [CrossRef]
- Duh, E.J.; Sun, J.; Stitt, A.W. Diabetic retinopathy: Current understanding, mechanisms, and treatment strategies. JCI Insight 2017, 2, 93751. [Google Scholar] [CrossRef] [PubMed]
- Delcourt, C.; Massin, P.; Rosilio, M. Epidemiology of diabetic retinopathy: Expected vs. reported prevalence of cases in the French population. Diabetes Metab. 2009, 35, 431–438. [Google Scholar] [CrossRef] [PubMed]
- Fabelo, H.; Ortega, S.; Lazcano, R.; Madroñal, D.; Callicó, G.M.; Juárez, E.; Salvador, R.; Bulters, D.; Bulstrode, H.; Szolna, A.; et al. An intraoperative visualization system using hyperspectral imaging to aid in brain tumor delineation. Sensors 2018, 18, 430. [Google Scholar] [CrossRef]
- YKanagasingam, Y.; Bhuiyan, A.; Abramoff, M.; Smith, R.T.; Goldschmidt, L.; Wong, T.Y. Progress on retinal image analysis for age related macular degeneration. Prog. Retin. Eye Res. 2014, 38, 20–42. [Google Scholar] [CrossRef] [PubMed]
- Mookiah, M.R.K.; Hogg, S.; MacGillivray, T.J.; Prathiba, V.; Pradeepa, R.; Mohan, V.; Anjana, R.M.; Doney, A.S.; Palmer, C.N.; Trucco, E. A review of machine learning methods for retinal blood vessel segmentation and artery/vein classification. Med. Image Anal. 2021, 68, 101905. [Google Scholar] [CrossRef]
- Alade, O.M.; Sowunmi, O.Y.; Misra, S.; Maskeliūnas, R.; Damaševičius, R. A neural network based expert system for the diagnosis of diabetes mellitus. In Advances in Intelligent Systems and Computing; Springer International Publishing: Berlin/Heidelberg, Germany, 2018; pp. 14–22. [Google Scholar] [CrossRef]
- Resnikoff, S.; Felch, W.; Gauthier, T.-M.; Spivey, B. The number of ophthalmologists in practice and training worldwide: A growing gap despite more than 200 000 practitioners. Br. J. Ophthalmol. 2012, 96, 783–787. [Google Scholar] [CrossRef]
- Roesch, K.; Swedish, T.; Raskar, R. Automated retinal imaging and trend analysis—A tool for health monitoring. Clin. Ophthalmol. 2017, 11, 1015–1020. [Google Scholar] [CrossRef]
- Schmidt-Erfurth, U.; Sadeghipour, A.; Gerendas, B.S.; Waldstein, S.M.; Bogunović, H. Artificial intelligence in retina. Prog. Retin. Eye Res. 2018, 67, 1–29. [Google Scholar] [CrossRef]
- Abràmoff, M.D.; Garvin, M.K.; Sonka, M. Retinal Imaging and Image Analysis. IEEE Rev. Biomed. Eng. 2010, 3, 169–208. [Google Scholar] [CrossRef] [PubMed]
- Assem, M.; Glasser, M.F.; Van Essen, D.C.; Duncan, J. A Domain-General Cognitive Core Defined in Multimodally Parcellated Human Cortex. Cereb. Cortex 2020, 30, 4361–4380. [Google Scholar] [CrossRef] [PubMed]
- Hood, D.C.; Raza, A.; de Moraes, C.G.V.; Liebmann, J.M.; Ritch, R. Glaucomatous damage of the macula. Prog. Retin. Eye Res. 2013, 32, 1–21. [Google Scholar] [CrossRef]
- Rahim, S.S.; Palade, V.; Shuttleworth, J.; Jayne, C. Automatic screening and classification of diabetic retinopathy and maculopathy using fuzzy image processing. Brain Informatics 2016, 3, 249–267. [Google Scholar] [CrossRef]
- Solomon, S.D.; Chew, E.; Duh, E.J.; Sobrin, L.; Sun, J.; VanderBeek, B.L.; Wykoff, C.C.; Gardner, T.W. Diabetic Retinopathy: A Position Statement by the American Diabetes Association. Diabetes Care 2017, 40, 412–418. [Google Scholar] [CrossRef] [PubMed]
- Hyun, C.M.; Baek, S.H.; Lee, M.; Lee, S.M.; Seo, J.K. Deep learning-based solvability of underdetermined inverse problems in medical imaging. Med. Image Anal. 2021, 69, 101967. [Google Scholar] [CrossRef] [PubMed]
- Vanagas, G.; Engelbrecht, R.; Damaševičius, R.; Suomi, R.; Solanas, A. eHealth Solutions for the Integrated Healthcare. J. Heal. Eng. 2018, 2018, 3846892. [Google Scholar] [CrossRef]
- Tang, L.; Niemeijer, M.; Reinhardt, J.M.; Garvin, M.K.; Abramoff, M. Splat Feature Classification With Application to Retinal Hemorrhage Detection in Fundus Images. IEEE Trans. Med. Imaging 2012, 32, 364–375. [Google Scholar] [CrossRef]
- Srivastava, R.; Duan, L.; Wong, D.W.; Liu, J.; Wong, T.Y. Detecting retinal microaneurysms and hemorrhages with robustness to the presence of blood vessels. Comput. Methods Programs Biomed. 2017, 138, 83–91. [Google Scholar] [CrossRef]
- Frame, A.J.; Undrill, P.E.; Cree, M.J.; Olson, J.A.; McHardy, K.C.; Sharp, P.F.; Forrester, J.V. A comparison of computer based classification methods applied to the detection of microaneurysms in ophthalmic fluorescein angiograms. Comput. Biol. Med. 1998, 28, 225–238. [Google Scholar] [CrossRef]
- Ramasamy, L.K.; Padinjappurathu, S.G.; Kadry, S.; Damaševičius, R. Detection of diabetic retinopathy using a fusion of textural and ridgelet features of retinal images and sequential minimal optimization classifier. PeerJ Comput. Sci. 2021, 7, e456. [Google Scholar] [CrossRef] [PubMed]
- Yanase, J.; Triantaphyllou, E. A systematic survey of computer-aided diagnosis in medicine: Past and present developments. Expert Syst. Appl. 2019, 138, 112821. [Google Scholar] [CrossRef]
- Maqsood, S.; Javed, U. Multi-modal medical image fusion based on two-scale image decomposition and sparse representation. Biomed. Signal Process. Control 2020, 57, 101810. [Google Scholar] [CrossRef]
- Pan, W.W.; Lin, F.; Fort, P.E. The innate immune system in diabetic retinopathy. Prog. Retin. Eye Res. 2021, 100940. [Google Scholar] [CrossRef]
- Soomro, T.A.; Gao, J.; Khan, T.; Hani, A.F.M.; Khan, M.A.U.; Paul, M. Computerised approaches for the detection of diabetic retinopathy using retinal fundus images: A survey. Pattern Anal. Appl. 2017, 20, 927–961. [Google Scholar] [CrossRef]
- Salamat, N.; Missen, M.M.S.; Rashid, A. Diabetic retinopathy techniques in retinal images: A review. Artif. Intell. Med. 2019, 97, 168–188. [Google Scholar] [CrossRef]
- Priya, H.A.G.; Anitha, J.; Popescu, D.E.; Asokan, A.; Jude Hemanth, D.; Son, L.H. Detection and Grading of Diabetic Retinopathy in Retinal Images Using Deep Intelligent Systems: A Comprehensive Review. Comput. Mater. Contin. 2021, 66, 2771–2786. [Google Scholar] [CrossRef]
- Seoud, L.; Hurtut, T.; Chelbi, J.; Cheriet, F.; Langlois, J.M.P. Red Lesion Detection Using Dynamic Shape Features for Diabetic Retinopathy Screening. IEEE Trans. Med. Imaging 2016, 35, 1116–1126. [Google Scholar] [CrossRef]
- Wu, J.; Zhang, S.; Xiao, Z.; Zhang, F.; Geng, L.; Lou, S.; Liu, M. Hemorrhage detection in fundus image based on 2D Gaussian fitting and human visual characteristics. Opt. Laser Technol. 2019, 110, 69–77. [Google Scholar] [CrossRef]
- Mumtaz, R.; Hussain, M.; Sarwar, S.; Khan, K.; Mumtaz, S.; Mumtaz, M. Automatic detection of retinal hemorrhages by exploiting image processing techniques for screening retinal diseases in diabetic patients. Int. J. Diabetes Dev. Ctries. 2018, 38, 80–87. [Google Scholar] [CrossRef]
- Tan, J.H.; Fujita, H.; Sivaprasad, S.; Bhandary, S.; Rao, A.K.; Chua, K.C.; Acharya, U.R. Automated segmentation of exudates, haemorrhages, microaneurysms using single convolutional neural network. Inf. Sci. 2017, 420, 66–76. [Google Scholar] [CrossRef]
- Prasad, P. Retinal hemorrhage detection using feature classification. Int. J. Eng. Comput. Sci. 2015, 4, 10960–10963. [Google Scholar]
- Orujov, F.; Maskeliūnas, R.; Damaševičius, R.; Wei, W. Fuzzy based image edge detection algorithm for blood vessel detection in retinal images. Appl. Soft Comput. 2020, 94, 106452. [Google Scholar] [CrossRef]
- Kathiresan, S.; Sait, A.R.W.; Gupta, D.; Lakshmanaprabu, S.K.; Khanna, A.; Pandey, H.M. Automated detection and classification of fundus diabetic retinopathy images using synergic deep learning model. Pattern Recognit. Lett. 2020, 133, 210–216. [Google Scholar]
- Gadekallu, T.R.; Khare, N.; Bhattacharya, S.; Singh, S.; Maddikunta, P.K.R.; Ra, I.-H.; Alazab, M. Early Detection of Diabetic Retinopathy Using PCA-Firefly Based Deep Learning Model. Electronics 2020, 9, 274. [Google Scholar] [CrossRef]
- Kumar, S.; Adarsh, A.; Kumar, B.; Singh, A.K. An automated early diabetic retinopathy detection through improved blood vessel and optic disc segmentation. Opt. Laser Technol. 2020, 121, 105815. [Google Scholar] [CrossRef]
- Joshi, S.; Karule, P.T. Haemorrhages detection using geometrical techniques. Comput. Methods Biomech. Biomed. Eng. Imaging Vis. 2020, 8, 436–445. [Google Scholar] [CrossRef]
- Qureshi, I.; Ma, J.; Abbas, Q. Diabetic retinopathy detection and stage classification in eye fundus images using active deep learning. Multimedia Tools Appl. 2021, 80, 11691–11721. [Google Scholar] [CrossRef]
- Bae, J.P.; Kim, K.G.; Kang, H.C.; Jeong, C.B.; Park, K.H.; Hwang, J.-M. A Study on Hemorrhage Detection Using Hybrid Method in Fundus Images. J. Digit. Imaging 2010, 24, 394–404. [Google Scholar] [CrossRef] [PubMed][Green Version]
- Sirajudeen, A.; Ezhilarasi, M. Multi-scale LBP and SVM Classification to Identify Diabetic Retinopathy in Lesions. Curr. Med. Imaging 2015, 11, 49–55. [Google Scholar] [CrossRef]
- Fan, R.; Li, X.; Lee, S.; Li, T.; Zhang, H.L. Smart Image Enhancement Using CLAHE Based on an F-Shift Transformation during Decompression. Electronics 2020, 9, 1374. [Google Scholar] [CrossRef]
- Simonyan, K.; Zisserman, A. Very deep convolutional networks for large-scale image recognition. arXiv 2014, arXiv:1409.1556. [Google Scholar]
- Rashid, M.; Khan, M.A.; Alhaisoni, M.; Wang, S.-H.; Naqvi, S.R.; Rehman, A.; Saba, T. A Sustainable Deep Learning Framework for Object Recognition Using Multi-Layers Deep Features Fusion and Selection. Sustainability 2020, 12, 5037. [Google Scholar] [CrossRef]
- Muzammil, S.R.; Maqsood, S.; Haider, S.; Damaševičius, R. CSID: A Novel Multimodal Image Fusion Algorithm for Enhanced Clinical Diagnosis. Diagnostics 2020, 10, 904. [Google Scholar] [CrossRef] [PubMed]
- Huang, G.B.; Zhu, Q.Y.; Siew, C.K. Extreme Learning Machine: A New Learning Scheme of Feedforward Neural Networks. In Proceedings of the 2004 IEEE International Joint Conference on Neural Networks, Budapest, Hungary, 25–29 July 2004. [Google Scholar]
- High Resolution Fundus (HRF) Image Database; University of Erlangen-Nuremberg: Erlangen, Germany, 2014. Available online: http://www5.cs.fau.de/research/data/fundus-images/ (accessed on 29 May 2021).
- Staal, J.; Abramoff, M.; Niemeijer, M.; A Viergever, M.; Van Ginneken, B. Ridge-Based Vessel Segmentation in Color Images of the Retina. IEEE Trans. Med. Imaging 2004, 23, 501–509. [Google Scholar] [CrossRef] [PubMed]
- Goldbaum, M. Structured Analysis of the Retina. 2013. Available online: http://www.ces.clemson.edu/ahoover/stare/ (accessed on 29 January 2016).
- Decenciere, E.; Zhang, X.; Cazuguel, G.; Lay, B.; Cochener, B.; Trone, C. Feed back on a publicly distributed image database: The MESSIDOR database. Image Anal. Stereol. 2014, 33, 231–234. [Google Scholar] [CrossRef]
- DIARETDB0 Database. Medical Image Understanding and Analysis. March 2014. Available online: http://www.it.lut.fi/project/imageret/diaretdb0/ (accessed on 29 May 2021).
- Kalviainen, R.; Uusitalo, H. DIARETDB1 diabetic retinopathy database and evaluation protocol. Med Image Underst. Anal. 2007, 2007, 61. [Google Scholar]
- García, M.; López, M.I.; Álvarez, D.; Hornero, R. Assessment of four neural network based classifiers to automatically detect red lesions in retinal images. Med. Eng. Phys. 2010, 32, 1085–1093. [Google Scholar] [CrossRef]
- Sinthanayothin, C.; Boyce, J.F.; Williamson, T.H.; Cook, H.L.; Mensah, E.; Lal, S.; Usher, D. Automated detection of diabetic retinopathy on digital fundus images. Diabet. Med. 2002, 19, 105–112. [Google Scholar] [CrossRef]
- Acharya, U.R.; Lim, C.M.; Ng, E.Y.; Chee, C.; Tamura, T. Computer-based detection of diabetes retinopathy stages using digital fundus images. Proc. Inst. Mech. Eng. Part H J. Eng. Med. 2009, 223, 545–553. [Google Scholar] [CrossRef] [PubMed]
- Zhang, B.; Wu, X.; You, J.; Li, Q.; Karray, F. Detection of microaneurysms using multi-scale correlation coefficients. Pattern Recognit. 2010, 43, 2237–2248. [Google Scholar] [CrossRef]
- Saleh, M.D.; Eswaran, C. An automated decision-support system for non-proliferative diabetic retinopathy disease based on MAs and HAs detection. Comput. Methods Programs Biomed. 2012, 108, 186–196. [Google Scholar] [CrossRef]


| Layers | Types | Number of Feature Maps | Kernel Size to Form each Feature Map | Stride | Padding |
|---|---|---|---|---|---|
| 1 | Input Layer | 3 | 32 × 32 × 3 | ||
| 2 | Convolutional Layer | 16 | 3 × 3 | [1 1] | [1 1 1 1] |
| 3 | ReLU | ||||
| 4 | Max Pooling Layer | 32 | 2 × 2 | [1 1] | [0 0 0 0] |
| 5 | Convolutional Layer | 32 | 3 × 3 | [1 1] | [1 1 1 1] |
| 6 | ReLU | ||||
| 7 | Convolutional Layer | 64 | 3 × 3 | [1 1] | [1 1 1 1] |
| 8 | ReLU | ||||
| 9 | Max Pooling Layer | 64 | 2 × 2 | [2 2] | [0 0 0 0] |
| 10 | Transpose Convolutional Layer | 64 | 4 × 4 | [2 2] | |
| 11 | Convolutional Layer | 128 | 1 × 1 | [1 1] | [0 0 0 0] |
| 12 | Softmax Layer | ||||
| 13 | Classification Layer | Cross entropy loss |
| Database | Number of Images | Normal | DR |
|---|---|---|---|
| HRF | 30 | 15 | 15 |
| DRIVE | 40 | 33 | 7 |
| STARE | 20 | 12 | 8 |
| MESSIDOR | 1200 | 851 | 349 |
| DIARETDB0 | 130 | 20 | 110 |
| DIARETDB1 | 89 | 5 | 84 |
| Total Images | 1509 | 936 | 573 |
| Database | Test Images | Correctly Detected | Accuracy (%) |
|---|---|---|---|
| HRF | 15 | 15 | 100 |
| DRIVE | 40 | 40 | 100 |
| STARE | 20 | 19 | 95 |
| MESSIDOR | 349 | 347 | 99.42 |
| DIARETDB0 | 110 | 105 | 95.45 |
| DIARETDB1 | 84 | 81 | 96.42 |
| Total | 618 | 607 | 98.22 |
| Authors | Datasets | Method | Sensitivity | Specificity | Accuracy |
|---|---|---|---|---|---|
| Tang et al. [20] | MESSIDOR | Splat feature | 93% | 66% | - |
| Mumtaz et al. [32] | DIARETDB1 | Scale based | 84% | 87% | 89% |
| Tan et al. [33] | CLEOPATRA | CNN | 62.57% | 96.93% | - |
| Qureshi et al. [40] | EyePACS | ADL-CNN | 92.20% | 95.10 | 98% |
| García et al. [54] | MESSIDOR | Four neural network | 86% | - | 83.08% |
| Sinthanayothin et al. [55] | - | Moat operator | 77.5% | 88.7% | - |
| Acharya et al. [56] | - | Simple morphological operations | 82% | 86% | - |
| Zhang et al. [57] | DIARETDB1 | Multi-scale correlation filtering | 88.1% | 89.3% | 90.6% |
| Saleh et al. [58] | - | Decision support | 87.53% | 95.08% | - |
| Our Proposed Method | HRF, DRIVE, STARE, MESSIDOR, DIARETDB0, and DIARETDB1 | 3D CNN | 97.54% | 97.89% | 98.22% |
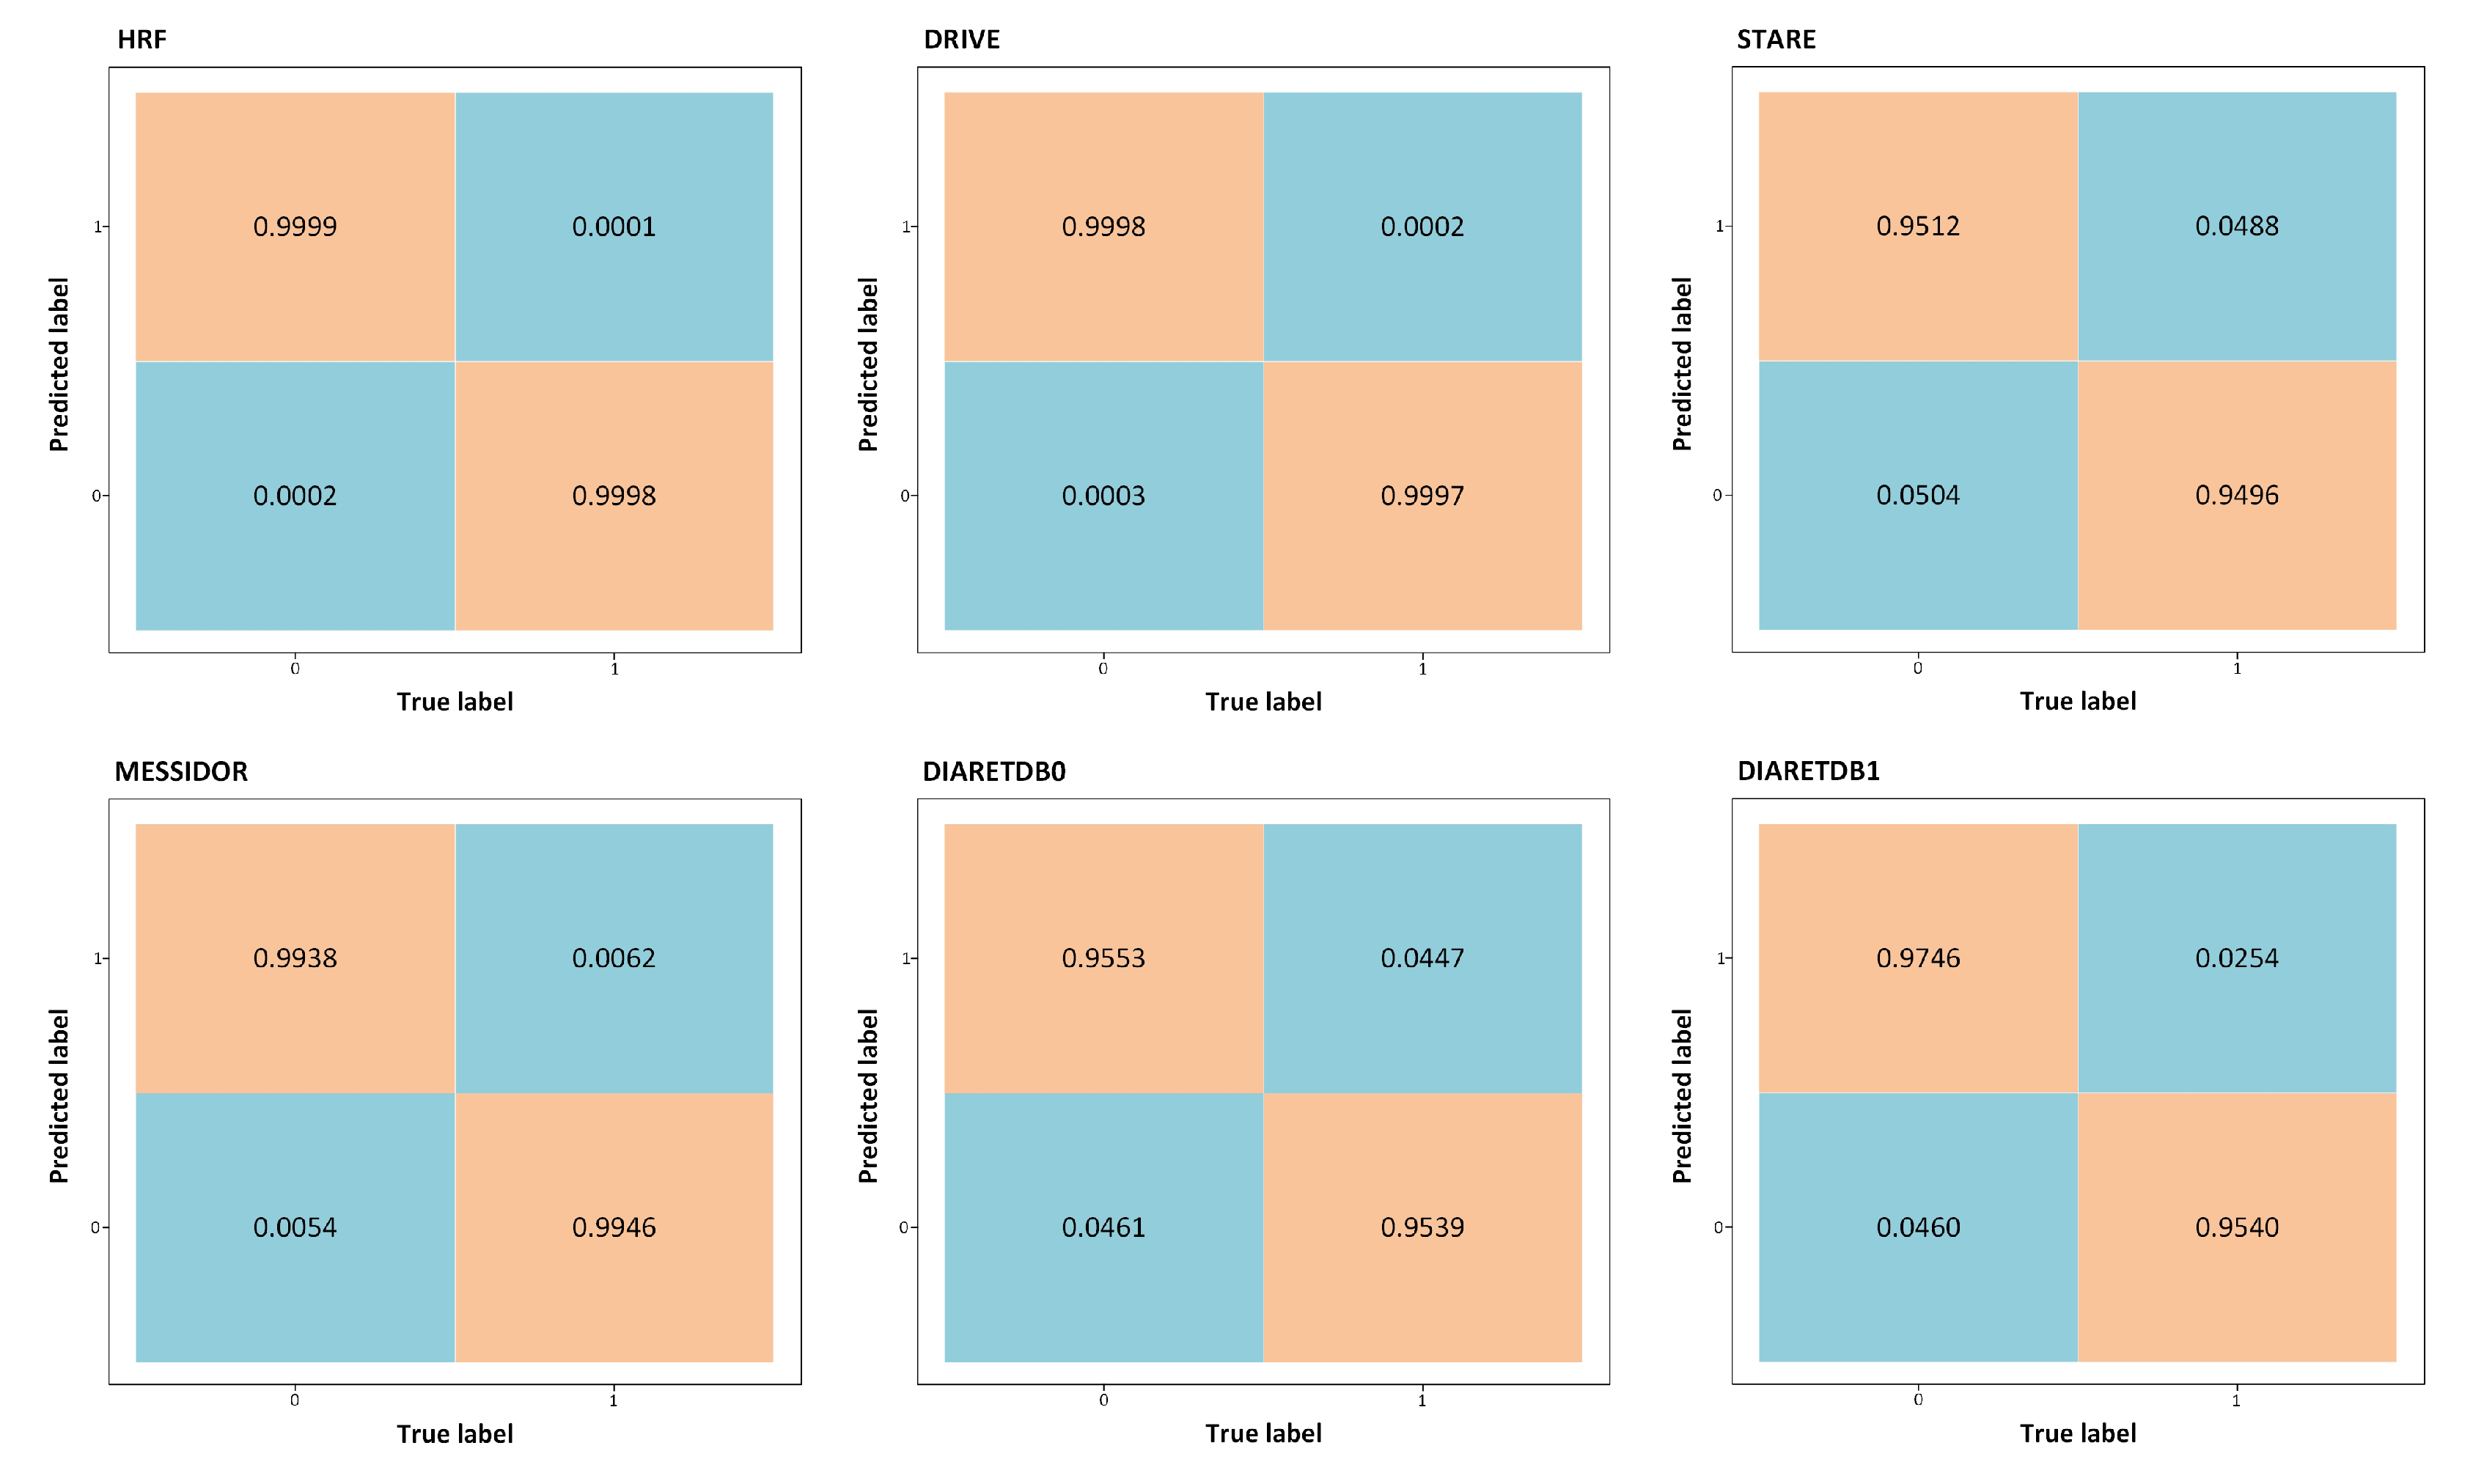
| Database | Sensitivity (%) | Specificity (%) | Accuracy (%) | PPV (%) | F1 Score (%) | AUC (%) |
|---|---|---|---|---|---|---|
| HRF | 99.98 (99.96–99.99) | 99.98 (95.96–99.99) | 99.98 (99.97–99.99) | 99.99 (99.98–99.99) | 99.98 (99.95–99.99) | 99.99 (99.97–99.99) |
| DRIVE | 99.97 (99.96–99.98) | 99.97 (99.94–99.98) | 99.97 (99.94–99.98) | 99.98 (99.96–99.99) | 99.97 (99.95–99.98) | 99.98 (99.97–99.99) |
| STARE | 94.96 (94.92–94.98) | 95.11 (95.07–95.15) | 95.04 (95.01–95.07) | 95.12 (95.08–95.16) | 95.03 (95.00–95.07) | 95.04 (95.02–95.06) |
| MESSIDOR | 99.45 (99.42–99.47) | 99.38 (99.35–99.41) | 99.42 (99.39–99.45) | 99.38 (99.36–99.41) | 99.41 (99.39–99.43) | 99.42 (99.40–99.43) |
| DIARETDB0 | 95.39 (95.36–95.42) | 95.52 (95.50–95.55) | 95.46 (95.43–95.49) | 95.53 (95.51–95.55) | 95.45 (95.42–95.47) | 95.46 (95.43–95.48) |
| DIARETDB1 | 95.49 (95.45–95.54) | 97.40 (97.44–97.37) | 96.43 (96.40–96.46) | 97.46 (97.44–97.49) | 96.46 (96.49–96.43) | 96.45 (96.42–96.47) |
| HRF | DRIVE | STARE | MESSIDOR | DIARETDB0 | DIARETDB1 | |
|---|---|---|---|---|---|---|
| Time (in seconds) | 16.78 | 15.87 | 16.01 | 17.54 | 16.44 | 15.46 |
Publisher’s Note: MDPI stays neutral with regard to jurisdictional claims in published maps and institutional affiliations. |
© 2021 by the authors. Licensee MDPI, Basel, Switzerland. This article is an open access article distributed under the terms and conditions of the Creative Commons Attribution (CC BY) license (https://creativecommons.org/licenses/by/4.0/).
Share and Cite
Maqsood, S.; Damaševičius, R.; Maskeliūnas, R. Hemorrhage Detection Based on 3D CNN Deep Learning Framework and Feature Fusion for Evaluating Retinal Abnormality in Diabetic Patients. Sensors 2021, 21, 3865. https://doi.org/10.3390/s21113865
Maqsood S, Damaševičius R, Maskeliūnas R. Hemorrhage Detection Based on 3D CNN Deep Learning Framework and Feature Fusion for Evaluating Retinal Abnormality in Diabetic Patients. Sensors. 2021; 21(11):3865. https://doi.org/10.3390/s21113865
Chicago/Turabian StyleMaqsood, Sarmad, Robertas Damaševičius, and Rytis Maskeliūnas. 2021. "Hemorrhage Detection Based on 3D CNN Deep Learning Framework and Feature Fusion for Evaluating Retinal Abnormality in Diabetic Patients" Sensors 21, no. 11: 3865. https://doi.org/10.3390/s21113865
APA StyleMaqsood, S., Damaševičius, R., & Maskeliūnas, R. (2021). Hemorrhage Detection Based on 3D CNN Deep Learning Framework and Feature Fusion for Evaluating Retinal Abnormality in Diabetic Patients. Sensors, 21(11), 3865. https://doi.org/10.3390/s21113865