Medication Adherence and Liquid Level Tracking System for Healthcare Provider Feedback

 , , and
Abstract
1. Introduction
2. Materials and Methods
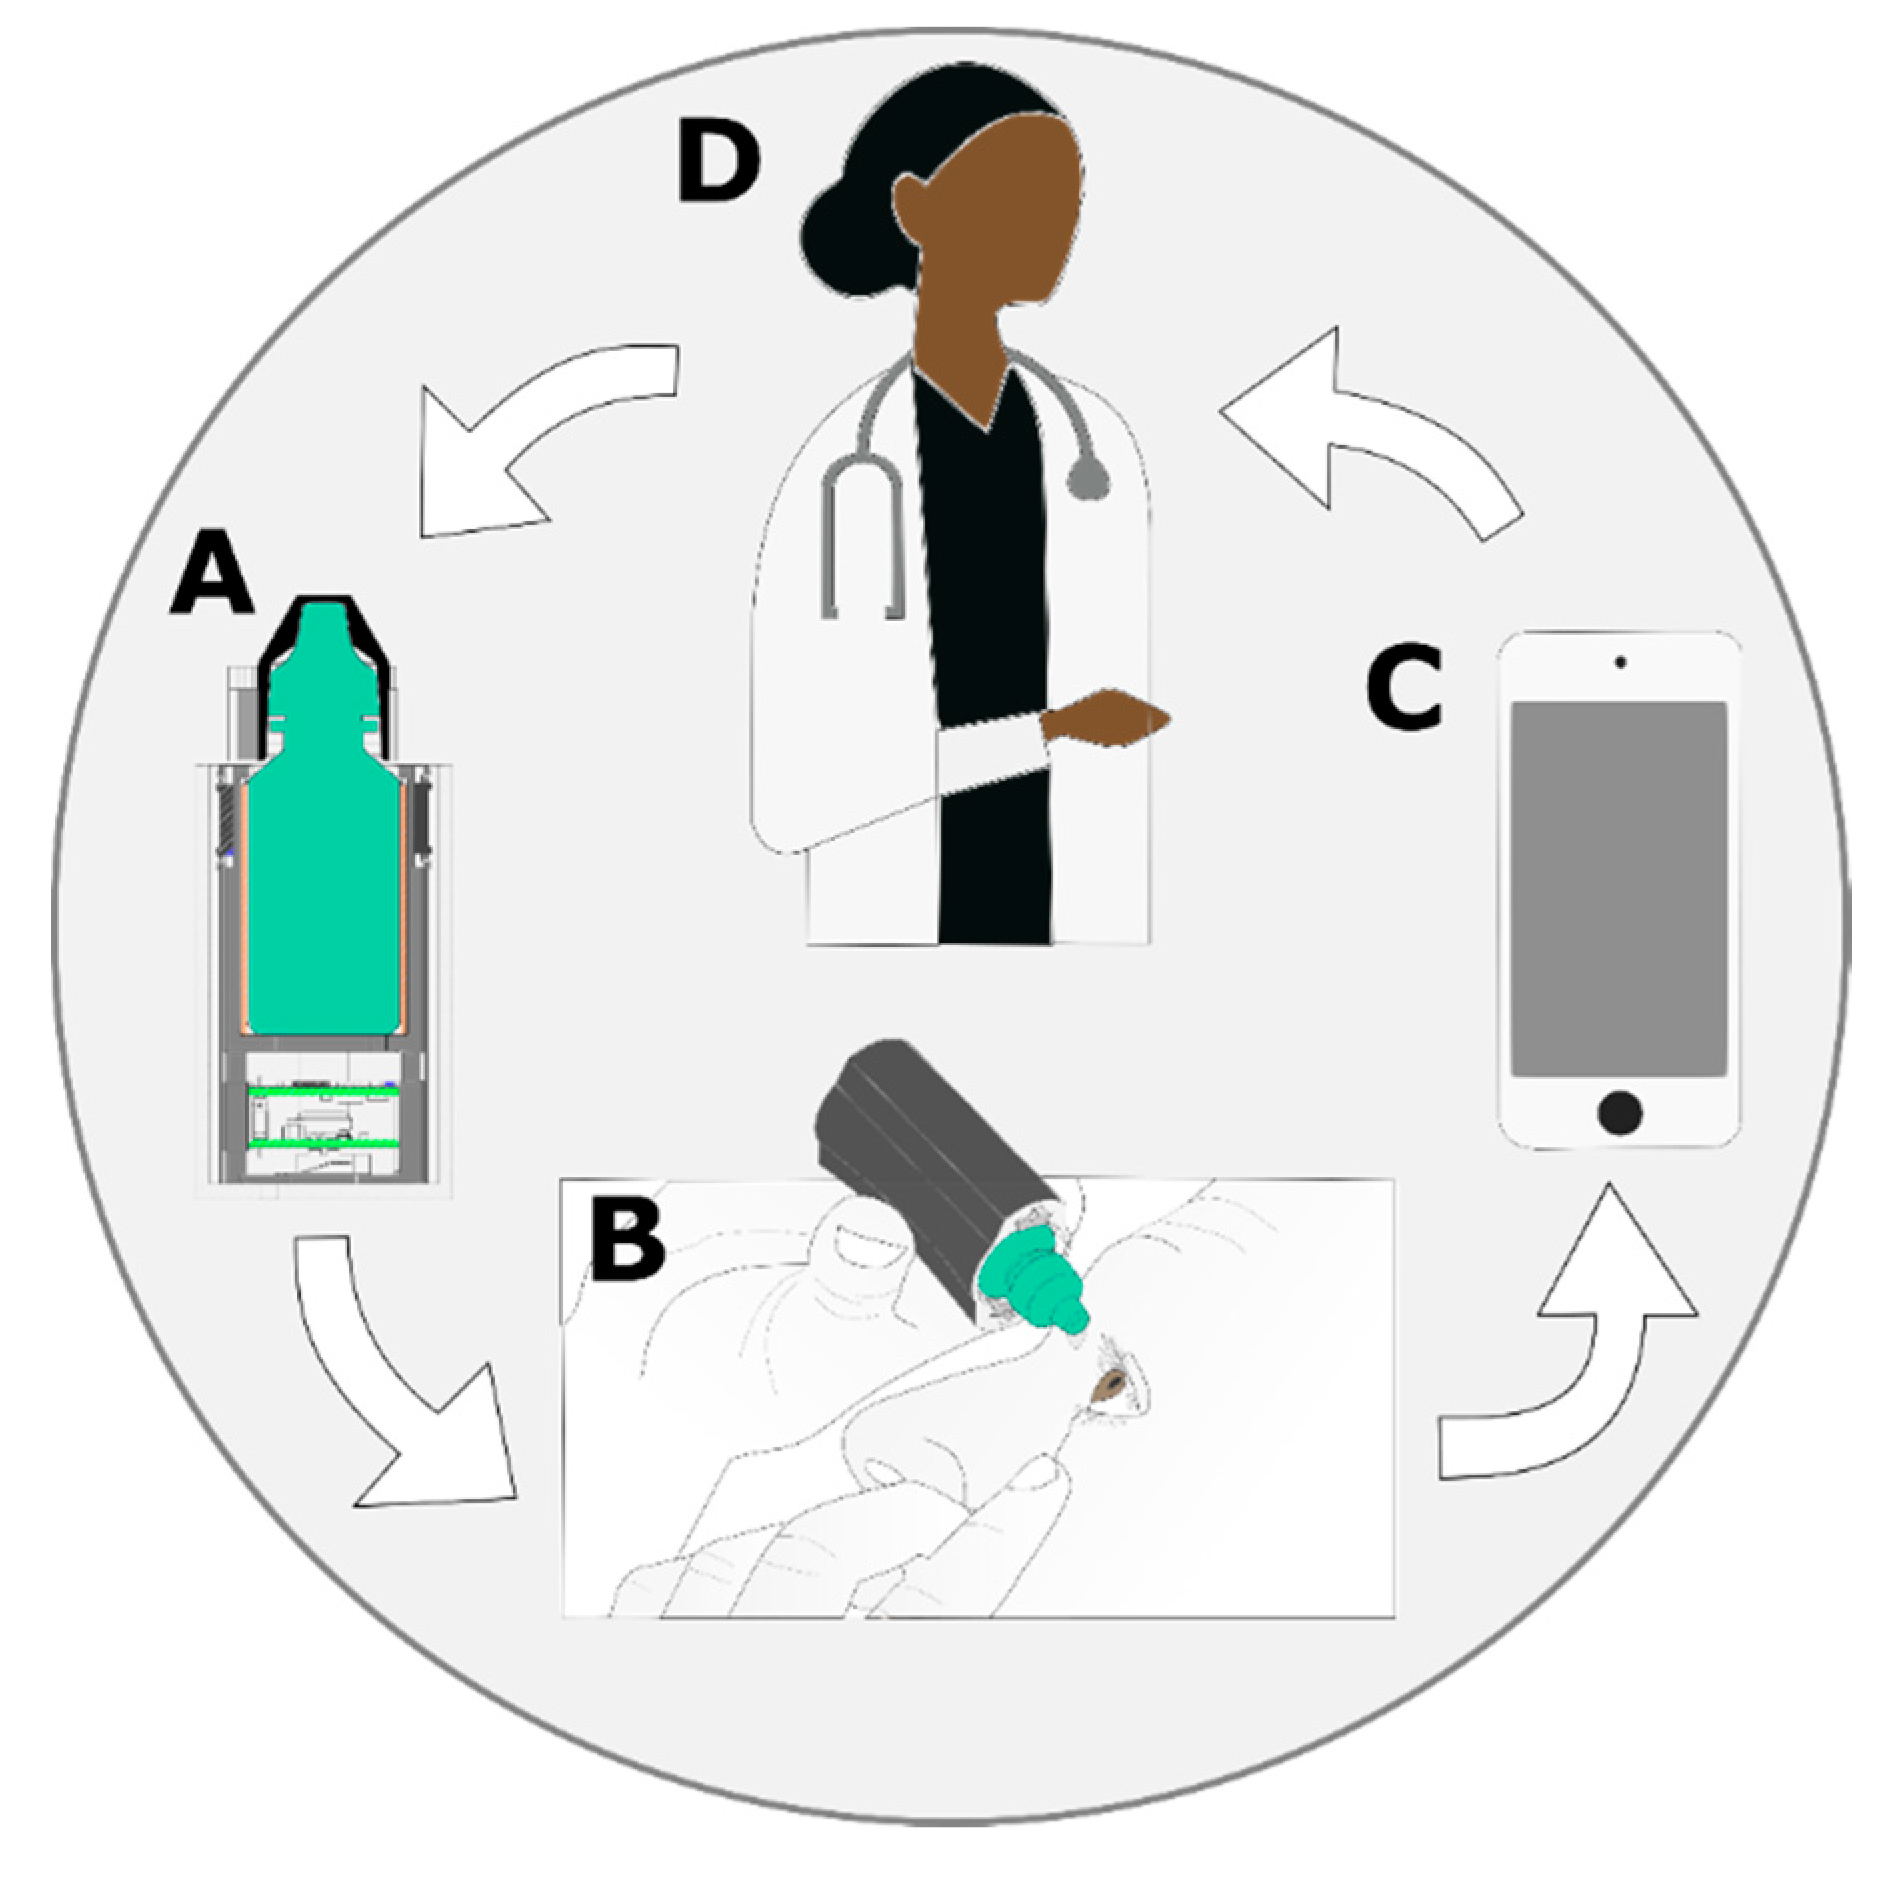
2.1. Overview
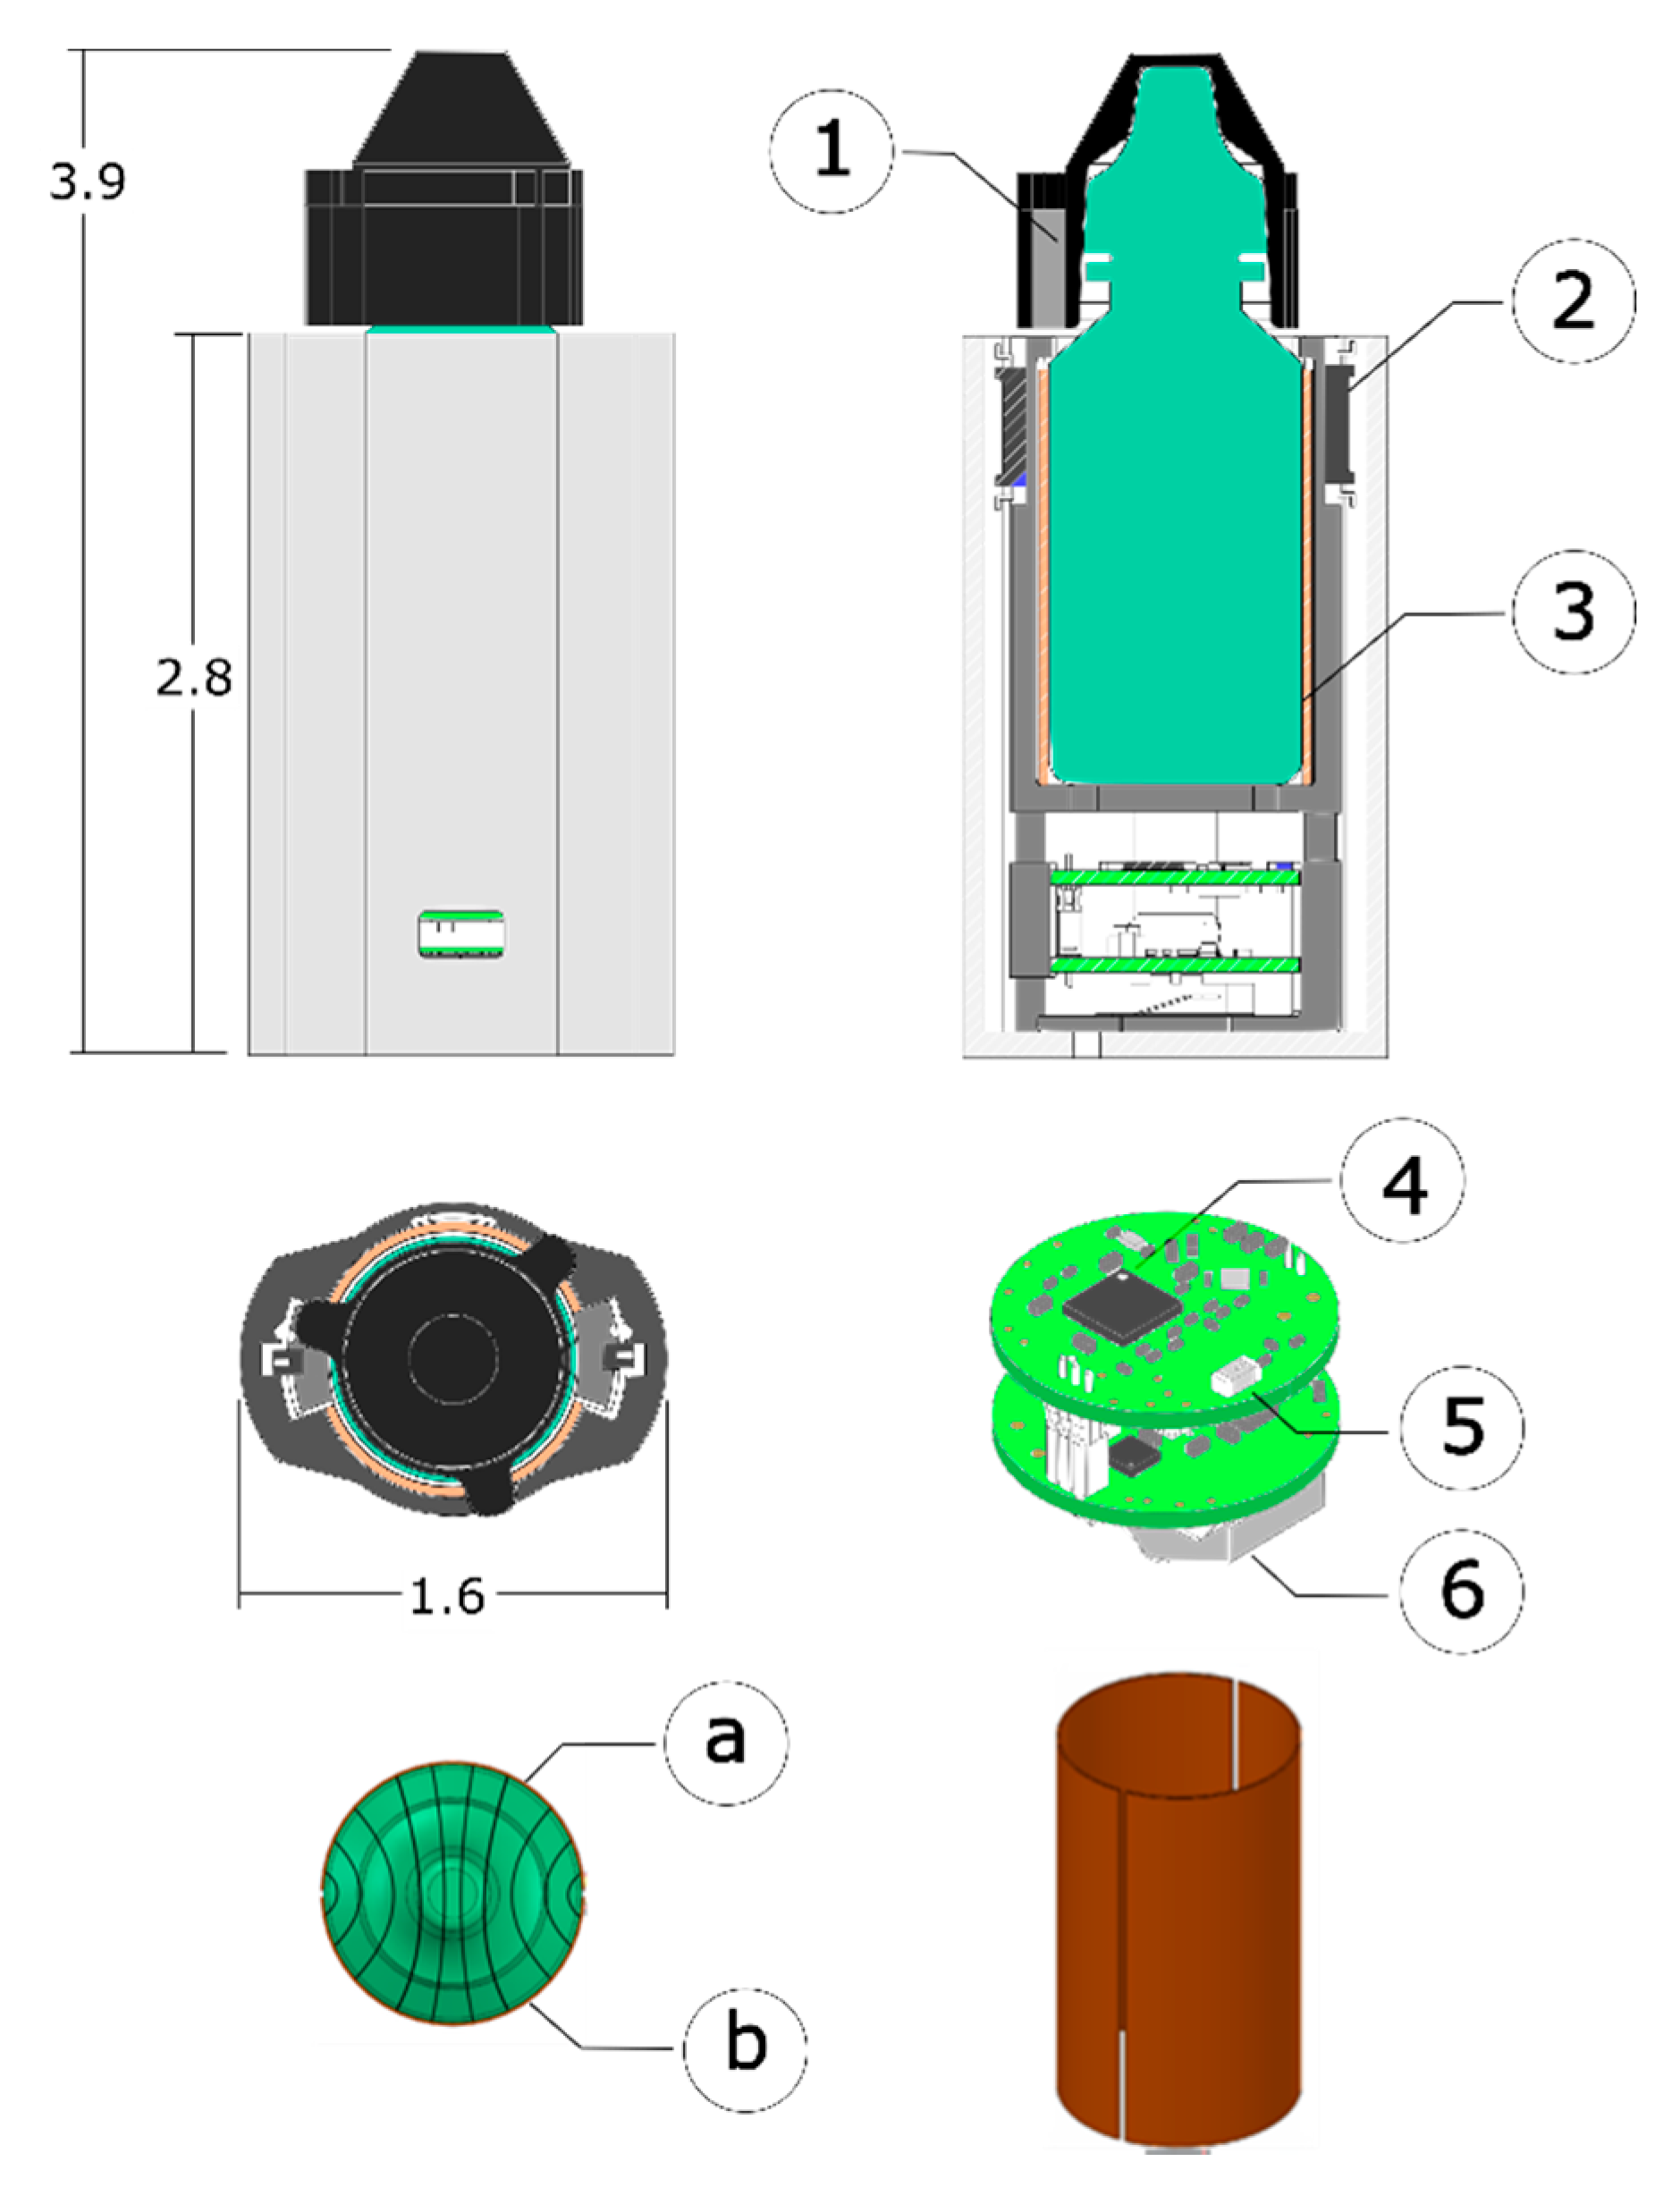
2.2. Sleeve Design
2.2.1. Sleeve Packaging and Electronics
2.2.2. Data Logging and Communication
2.3. Event Detection
2.3.1. Event Detection – Rule-Based Algorithm
2.3.2. Event Detection – Machine Learning Algorithm
2.4. Experimental Evaluation
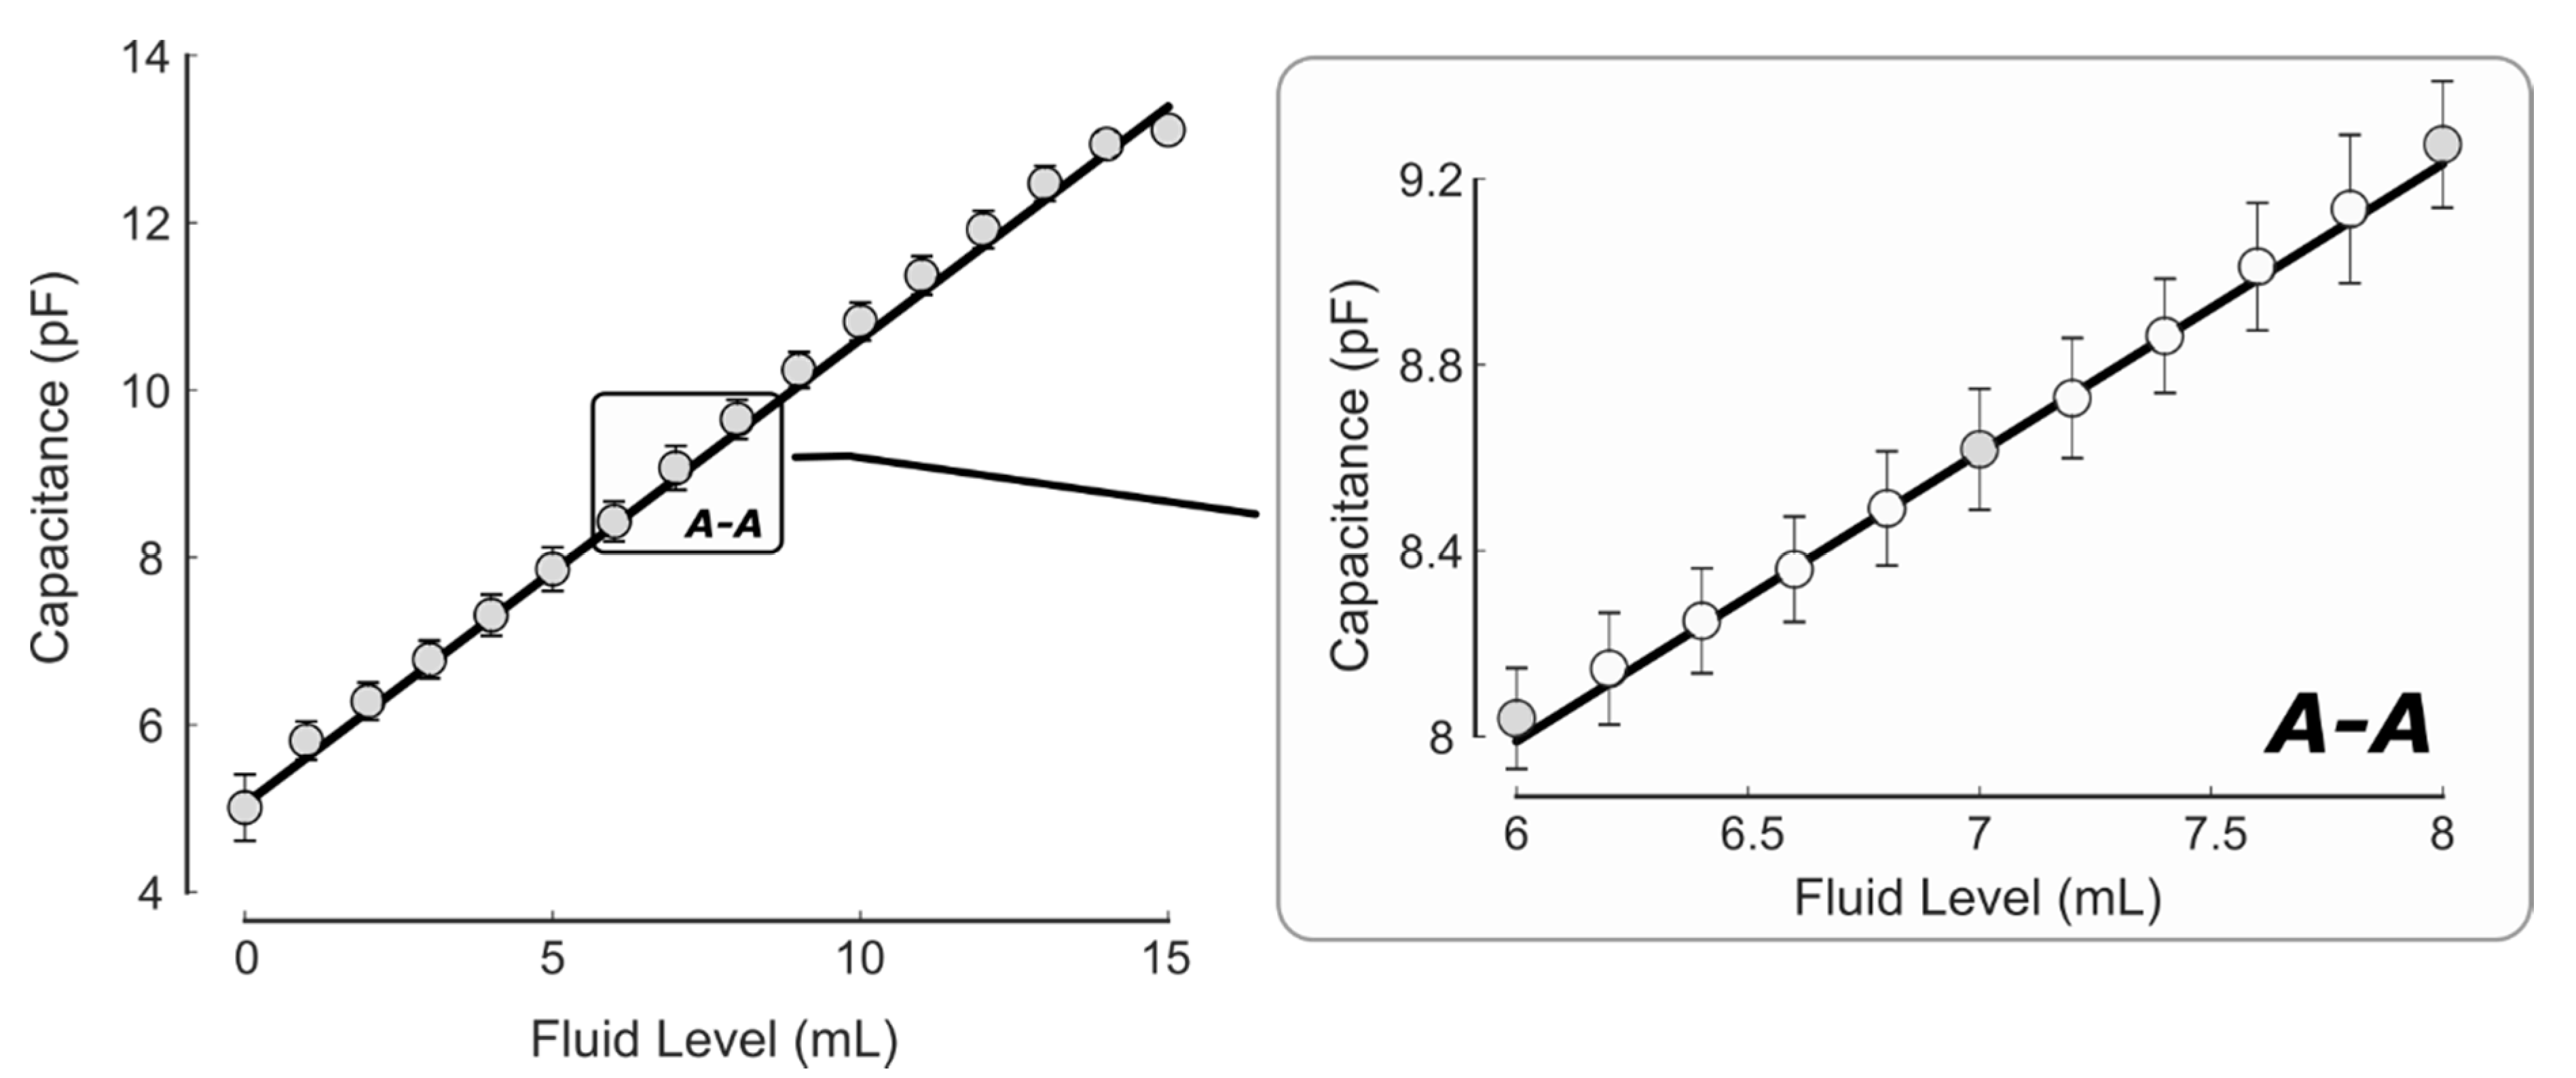
2.4.1. System and Sensor Testing
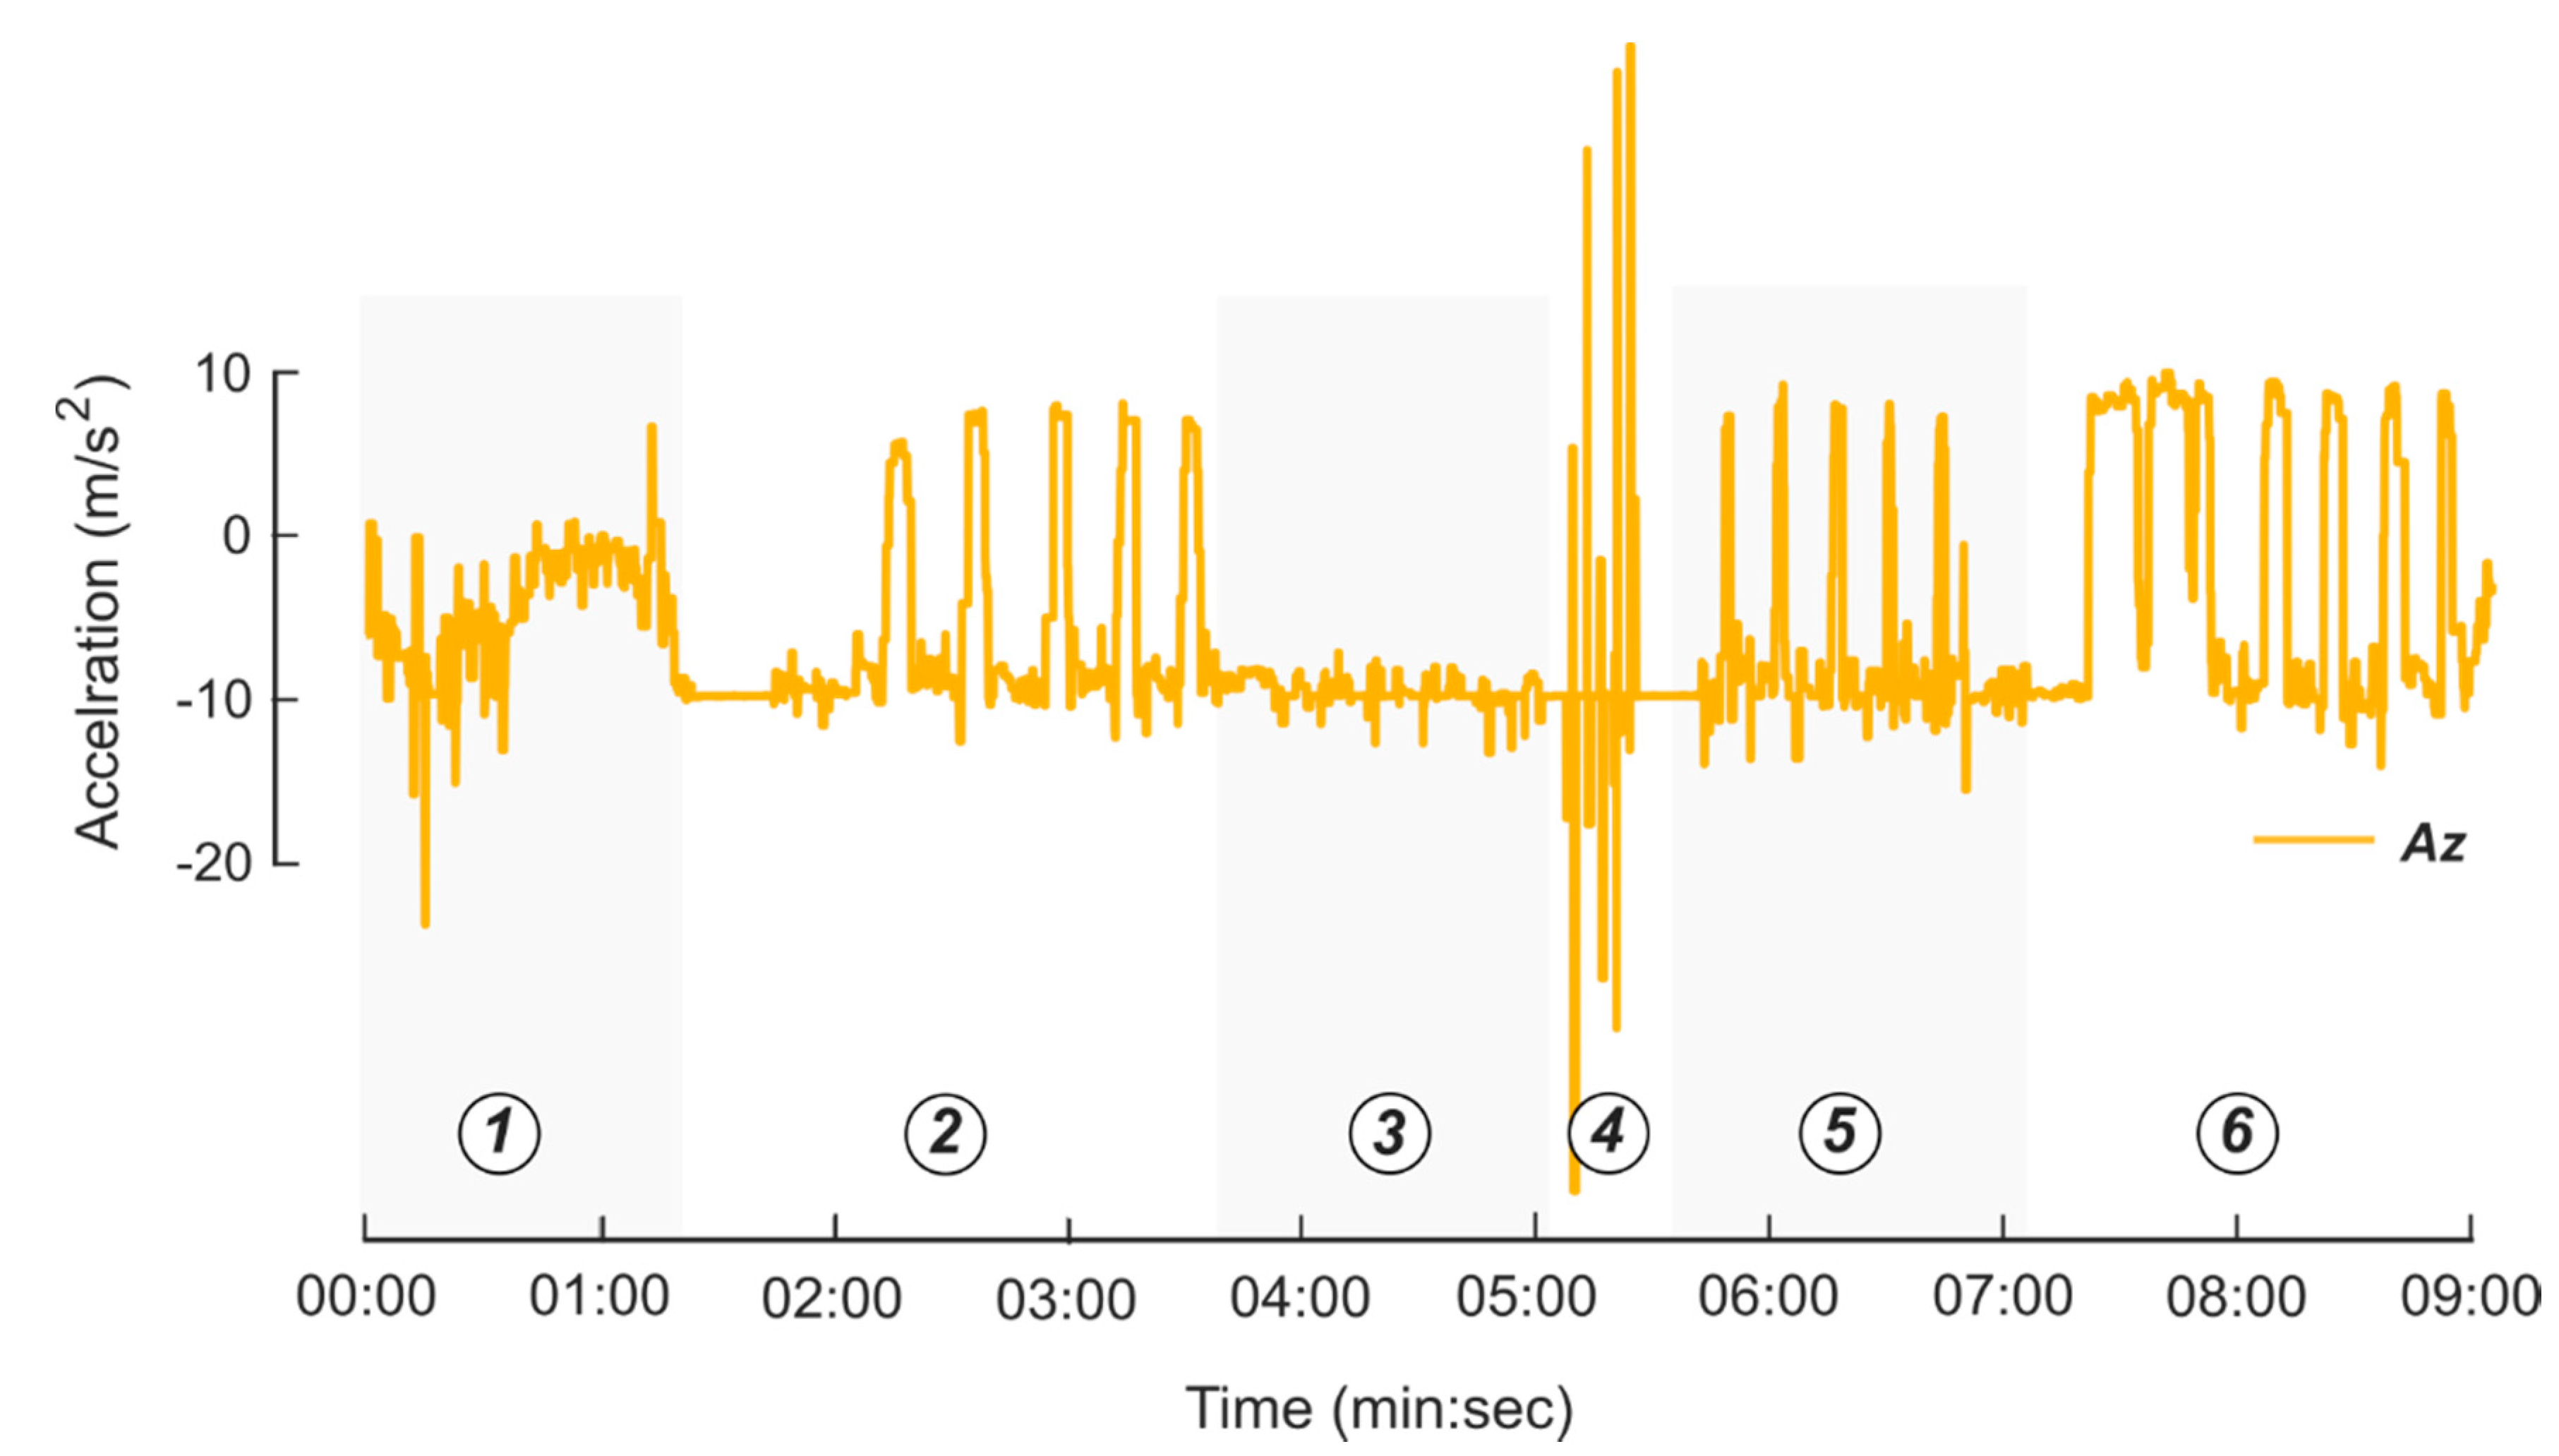
2.4.2. Experimental Evaluation – Subject Testing
- Walk around the room with the instrumented system in a pocket/purse for one minute.
- Remove the bottle cap, dispense eye drops (in one or both eyes depending on personal preference), then place the cap back on the bottle. Repeat five times.
- Remove the bottle cap, place the bottle back on the table without dispensing any fluid, then place the cap back on the bottle. Repeat five times.
- Shake the bottle for five seconds (with the cap still on). Repeat five times.
- Remove the bottle cap, simulate the motion used to dispense eye drops, but do not dispense fluid, then place the cap back on the bottle. Repeat five times.
- Remove the bottle cap, dispense eye drops in the same fashion as Step 3, but with the participant reclining, then place the cap back on the bottle. Repeat five times.
2.4.3. Experimental Evaluation – Full-Day Testing
2.5. Statistical Analysis
3. Results
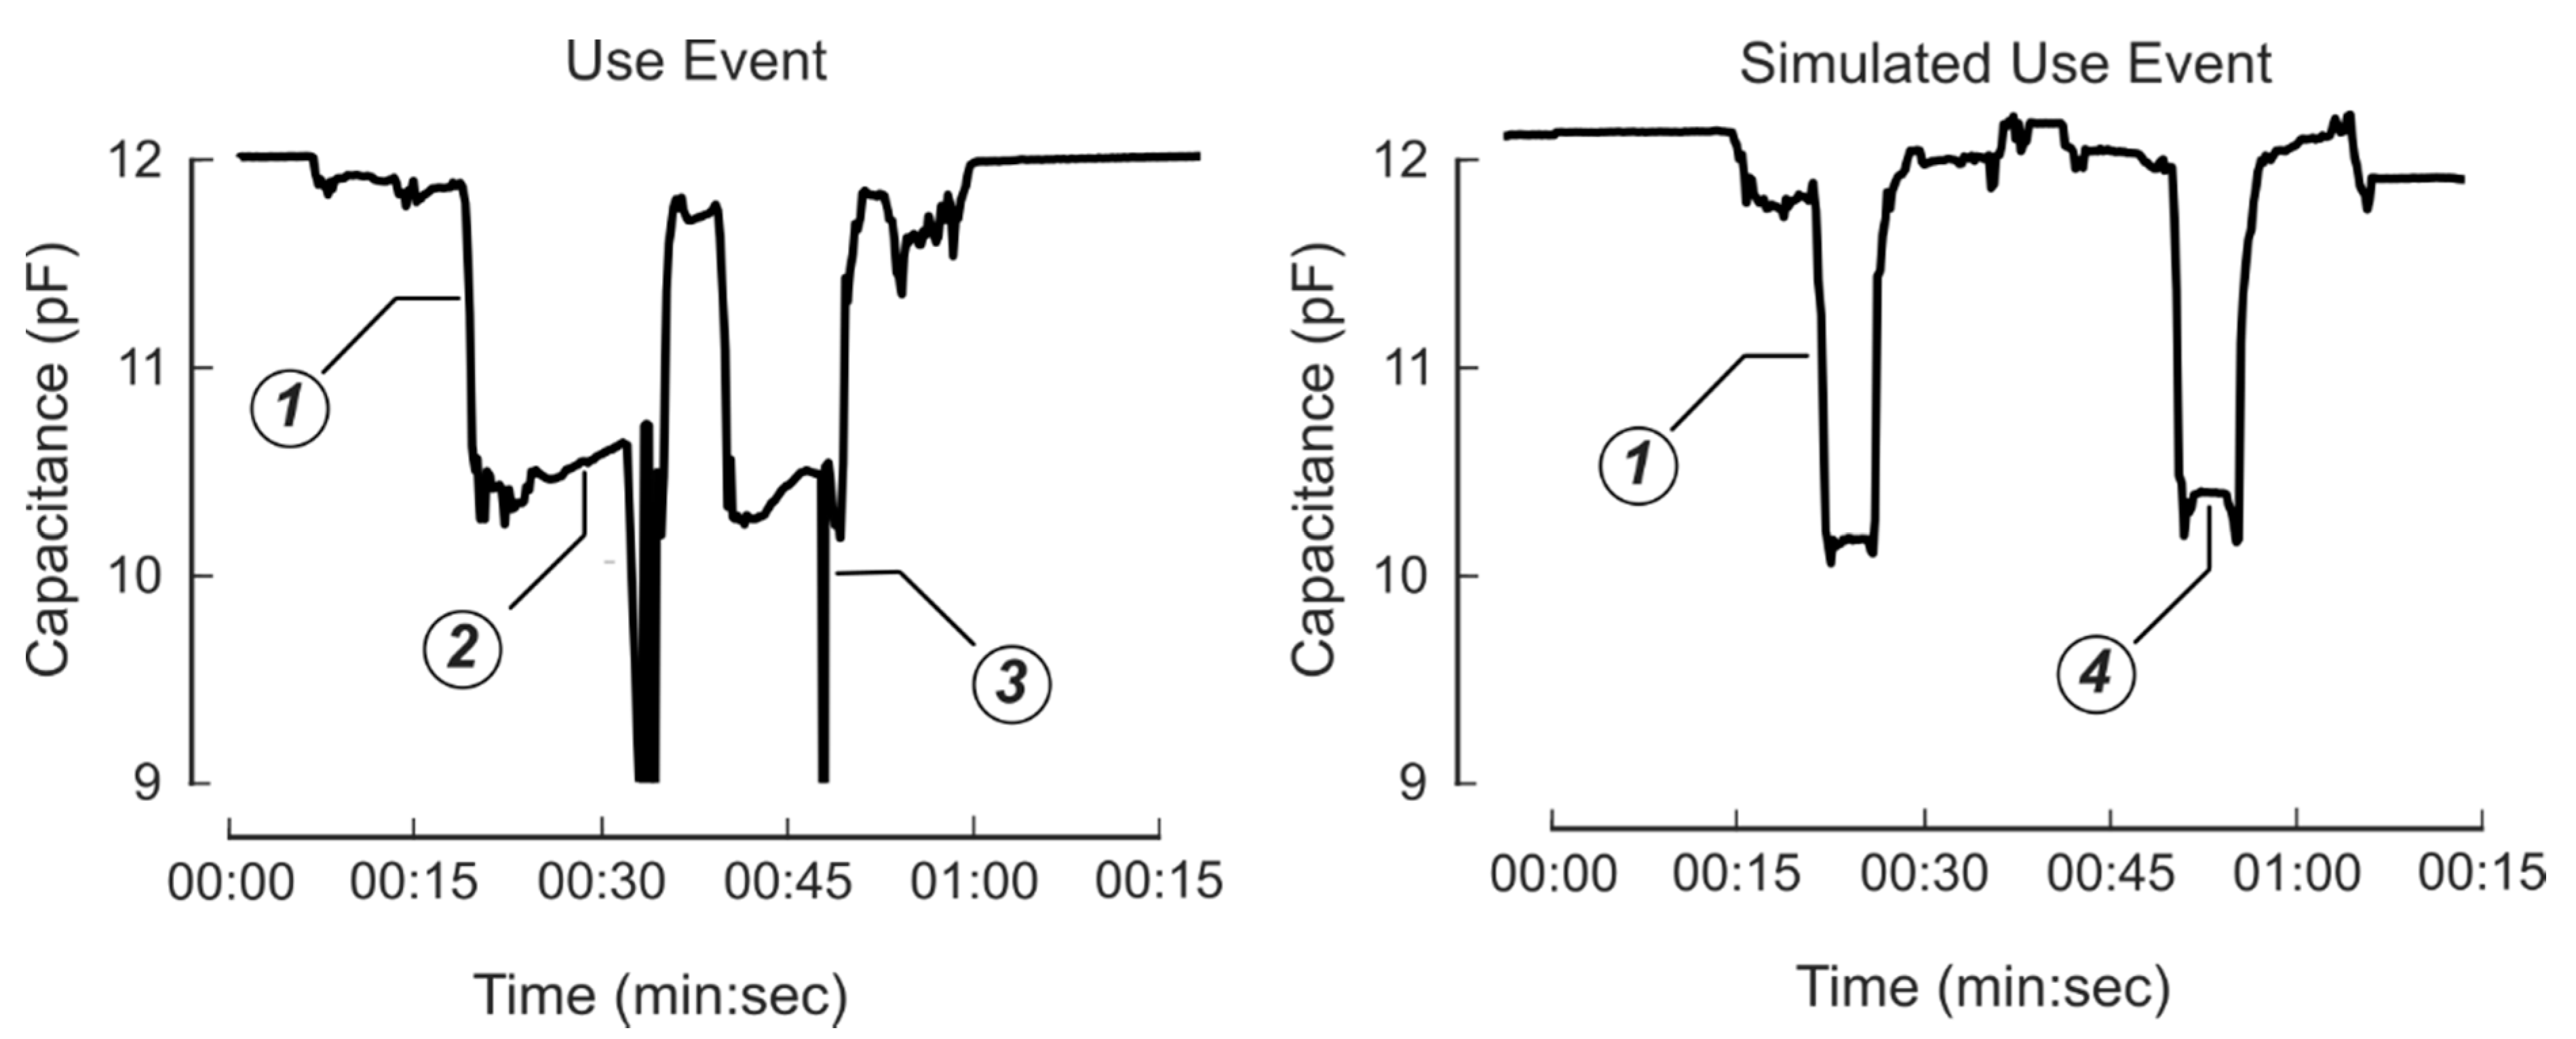
3.1. System and Sensor Testing
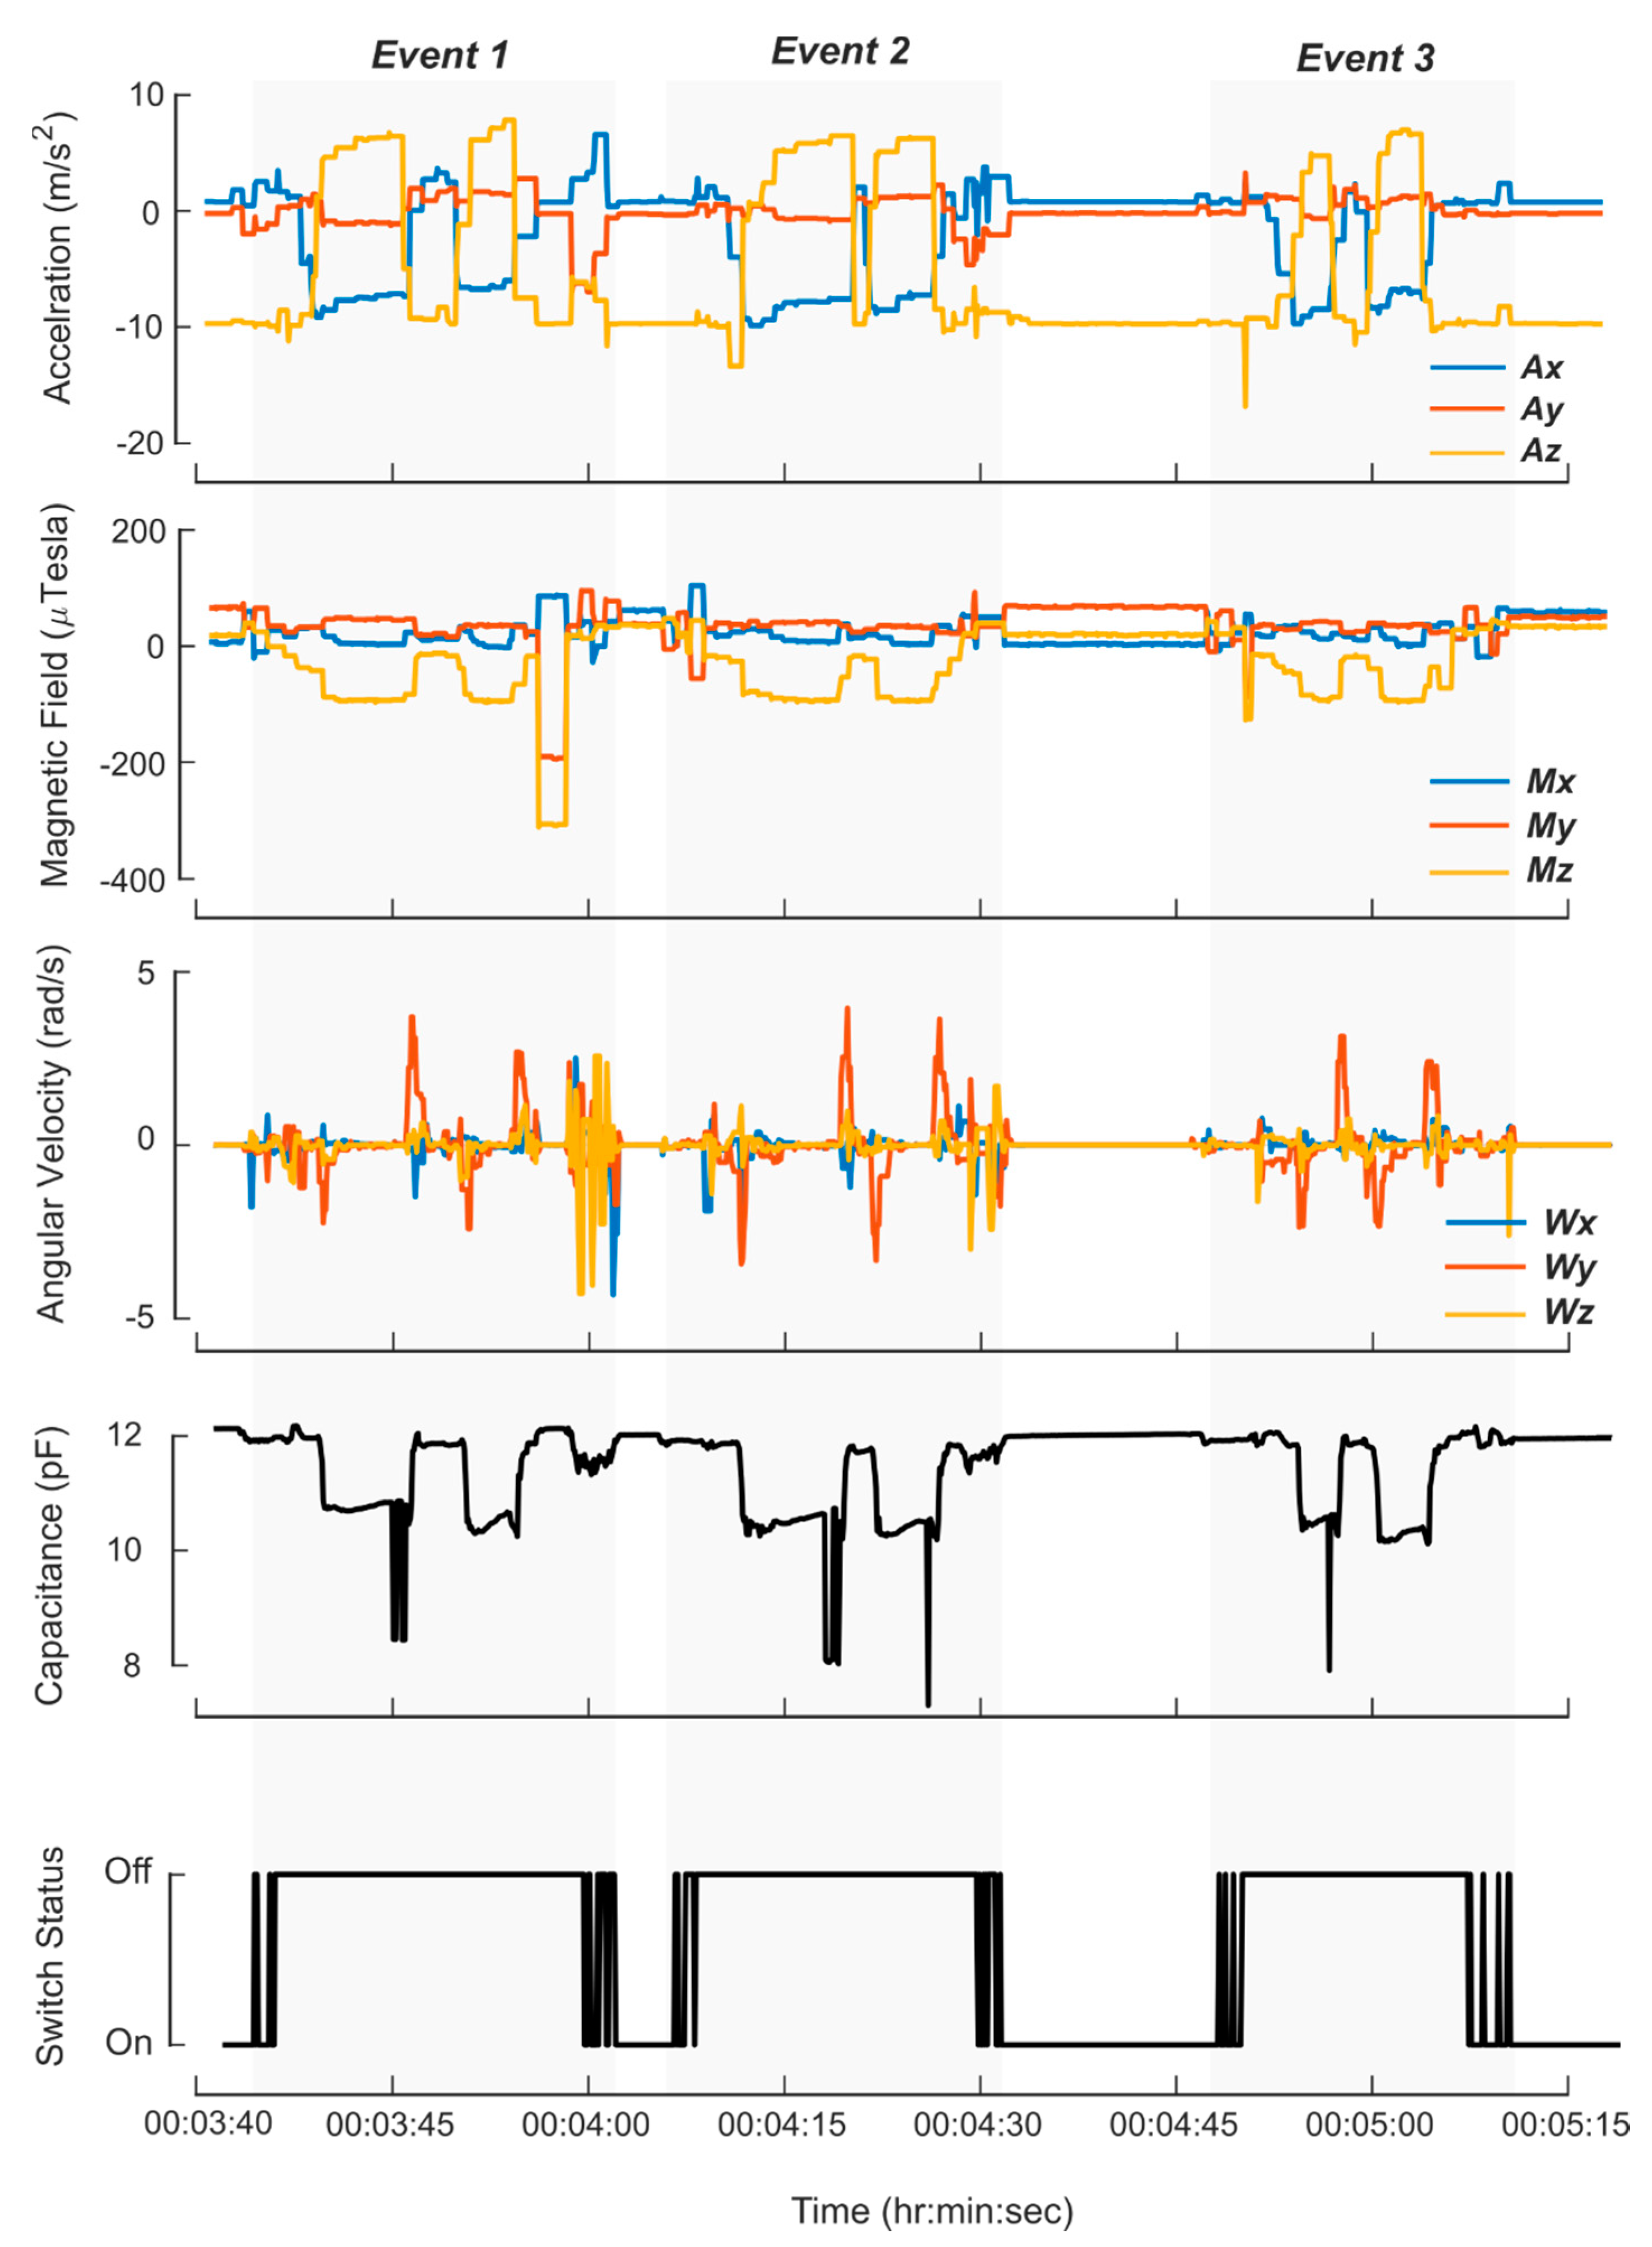
3.2. Patient Testing
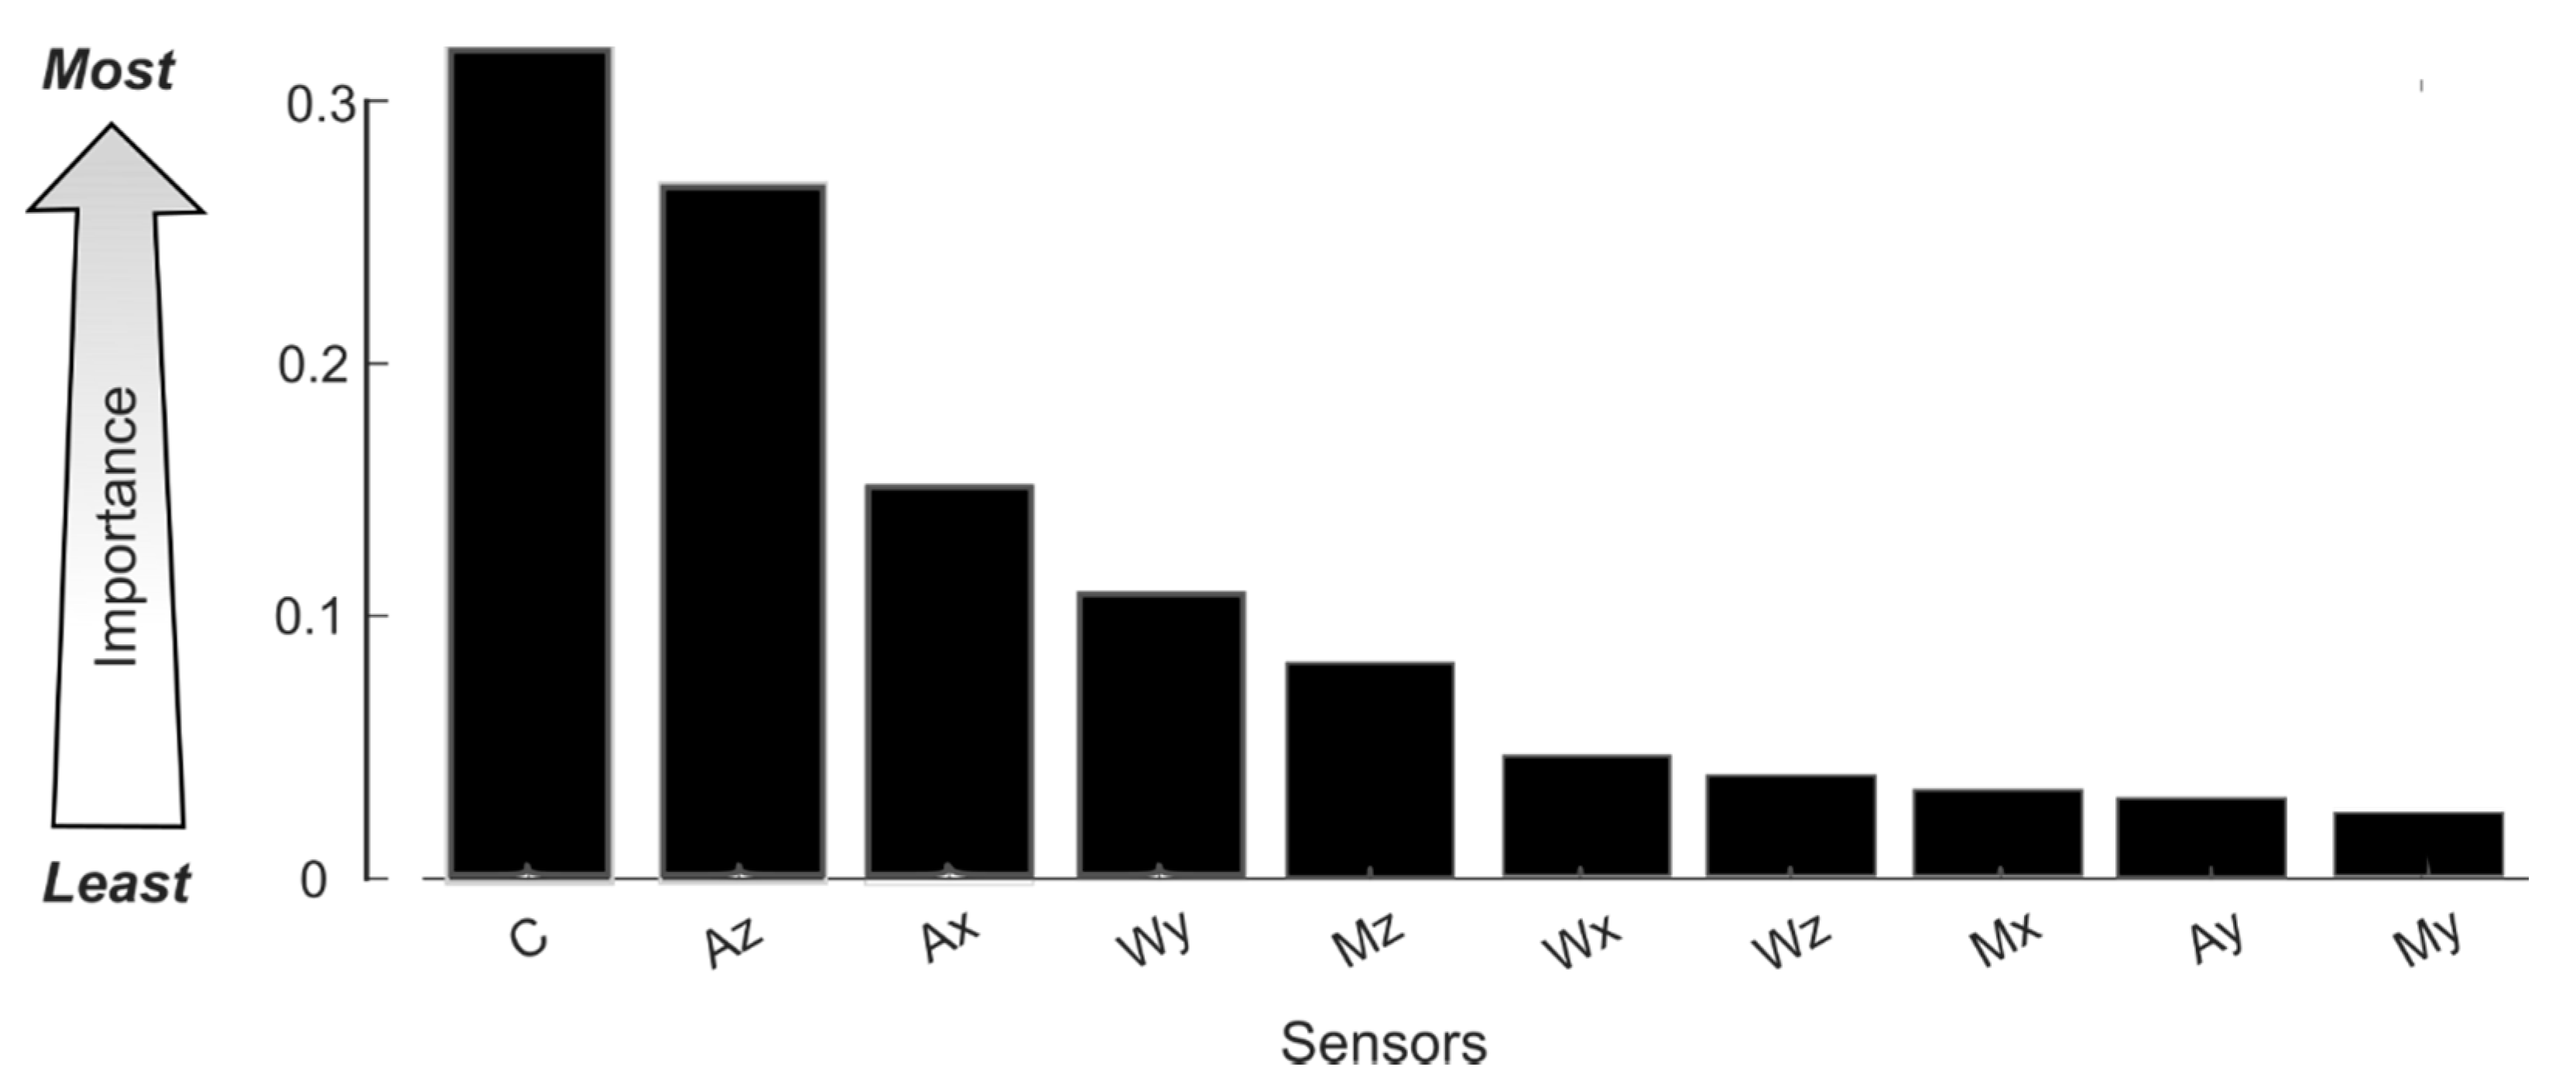
3.3. Machine Learning Results
3.4. Machine Learning versus Event Detection Algorithm Results
3.5. Full Day Test Results
4. Discussion
5. Conclusions
Author Contributions
Funding
Acknowledgments
Conflicts of Interest
Appendix A. Power Consumption Calculations
- When the cap is off.
- Every 30 min to determine if the bottle is upright to gather fluid level readings.
Appendix B. Featurization Approach

| AVG | MIN | MAX | STDEV | MIN_SLOPE | MAX_SLOPE | SUM_ABS_SLIDE | AVG_ABS_SLIDE | Sensor IG | |
|---|---|---|---|---|---|---|---|---|---|
| FDC | 0.16 | 0.44 | 0.07 | 0.35 | 0.54 | 0.43 | 0.47 | 0.13 | 0.32 |
| ACCEL_Z | 0.47 | 0.00 | 0.33 | 0.31 | 0.21 | 0.23 | 0.32 | 0.31 | 0.27 |
| ACCEL_X | 0.21 | 0.17 | 0.00 | 0.18 | 0.12 | 0.19 | 0.22 | 0.17 | 0.16 |
| GYRO_Y | 0.00 | 0.12 | 0.13 | 0.19 | 0.00 | 0.08 | 0.22 | 0.16 | 0.11 |
| MAG_Z | 0.08 | 0.14 | 0.00 | 0.07 | 0.00 | 0.06 | 0.31 | 0.00 | 0.08 |
| GYRO_X | 0.00 | 0.00 | 0.00 | 0.07 | 0.00 | 0.00 | 0.23 | 0.07 | 0.05 |
| GYRO_Z | 0.00 | 0.12 | 0.00 | 0.00 | 0.00 | 0.00 | 0.19 | 0.00 | 0.04 |
| MAG_X | 0.00 | 0.00 | 0.07 | 0.00 | 0.00 | 0.00 | 0.19 | 0.00 | 0.03 |
| ACCEL_Y | 0.00 | 0.00 | 0.00 | 0.00 | 0.00 | 0.00 | 0.17 | 0.07 | 0.03 |
| MAG_Y | 0.00 | 0.00 | 0.00 | 0.00 | 0.00 | 0.00 | 0.10 | 0.09 | 0.02 |
| AlgorithmIG | 0.09 | 0.10 | 0.06 | 0.12 | 0.09 | 0.10 | 0.24 | 0.10 |
References
- Bourne, R.R.A.; Stevens, G.A.; White, R.A.; Smith, J.L.; Flaxman, S.R.; Price, H.; Jonas, J.B.; Keeffe, J.; Leasher, J.; Naidoo, K.; et al. Causes of vision loss worldwide, 1990–2010: A systematic analysis. Lancet Glob. Health 2013, 1, e339–e349. [Google Scholar] [CrossRef]
- Wittenborn, J.; Rein, D. The Future of Vision: Forecasting the Prevalence and Costs of Vision Problems. 2014. Available online: https://www.preventblindness.org/sites/default/files/national/documents/Future_of_Vision_final_0.pdf (accessed on 16 October 2019).
- McKean-Cowdin, R.; Varma, R.; Wu, J.; Hays, R.D.; Azen, S.P. Severity of Visual Field Loss and Health-related Quality of Life. Am. J. Ophthalmol. 2007, 143, 1013–1023. [Google Scholar] [CrossRef] [PubMed]
- McKean-Cowdin, R.; Wang, Y.; Wu, J.; Azen, S.P.; Varma, R. Impact of Visual Field Loss on Health-Related Quality of Life in Glaucoma: The Los Angeles Latino Eye Study. Ophthalmology 2008, 115, 941–948.e1. [Google Scholar] [CrossRef] [PubMed]
- Freeman, E.E.; Muñoz, B.; West, S.K.; Jampel, H.D.; Friedman, D.S. Glaucoma and Quality of Life: The Salisbury Eye Evaluation. Ophthalmology 2008, 115, 233–238. [Google Scholar] [CrossRef] [PubMed]
- Haymes, S.A.; LeBlanc, R.P.; Nicolela, M.T.; Chiasson, L.A.; Chauhan, B.C. Risk of Falls and Motor Vehicle Collisions in Glaucoma. Investig. Ophthalmol. Vis. Sci. 2007, 48, 1149–1155. [Google Scholar] [CrossRef] [PubMed]
- Olthoff, C.M.G.; Schouten, J.S.A.G.; van de Borne, B.W.; Webers, C.A.B. Noncompliance with Ocular Hypotensive Treatment in Patients with Glaucoma or Ocular Hypertension: An Evidence-Based Review. Ophthalmology 2005, 112, 953–961.e7. [Google Scholar] [CrossRef] [PubMed]
- Reardon, G.; Kotak, S.; Schwartz, G.F. Objective assessment of compliance and persistence among patients treated for glaucoma and ocular hypertension: A systematic review. Patient Prefer. Adherence 2011, 5, 441–463. [Google Scholar] [CrossRef] [PubMed]
- Newman-Casey, P.A.; Robin, A.L.; Blachley, T.; Farris, K.; Heisler, M.; Resnicow, K.; Lee, P.P. The Most Common Barriers to Glaucoma Medication Adherence: A Cross-Sectional Survey. Ophthalmology 2015, 122, 1308–1316. [Google Scholar] [CrossRef] [PubMed]
- Friedman, D.S.; Hahn, S.R.; Gelb, L.; Tan, J.; Shah, S.N.; Kim, E.E.; Zimmerman, T.J.; Quigley, H.A. Doctor–Patient Communication, Health-Related Beliefs, and Adherence in Glaucoma: Results from the Glaucoma Adherence and Persistency Study. Ophthalmology 2008, 115, 1320–1327.e3. [Google Scholar] [CrossRef] [PubMed]
- Conn, V.S.; Ruppar, T.M. Medication adherence outcomes of 771 intervention trials: Systematic review and meta-analysis. Prev. Med. 2017, 99, 269–276. [Google Scholar] [CrossRef] [PubMed]
- Kini, V.; Ho, P.M. Interventions to Improve Medication Adherence: A Review. JAMA 2018, 320, 2461–2473. [Google Scholar] [CrossRef] [PubMed]
- Murray, M.D.; Young, J.; Hoke, S.; Tu, W.; Weiner, M.; Morrow, D.; Stroupe, K.T.; Wu, J.; Clark, D.; Smith, F.; et al. Pharmacist Intervention to Improve Medication Adherence in Heart Failure: A Randomized Trial. Ann. Intern. Med. 2007, 146, 714. [Google Scholar] [CrossRef] [PubMed]
- Williams, A.; Manias, E.; Walker, R. Interventions to improve medication adherence in people with multiple chronic conditions: A systematic review. J. Adv. Nurs. 2008, 63, 132–143. [Google Scholar] [CrossRef] [PubMed]
- NIH. Improving Patient Adherence to Treatment and Prevention Regimens to Promote Health (PA-18-722). May 2018. Available online: https://grants.nih.gov/grants/guide/pa-files/pa-18-722.html (accessed on 14 December 2019).
- Aldeer, M.; Javanmard, M.; Martin, R.P. A Review of Medication Adherence Monitoring Technologies. Appl. Syst. Innov. 2018, 1, 14. [Google Scholar] [CrossRef]
- Measurements of Medication Adherence: In Search of a Gold Standard|Journal of Clinical Pathways. Available online: https://www.journalofclinicalpathways.com/article/measurements-medication-adherence-search-gold-standard (accessed on 16 November 2019).
- DeMeo, D.; Morena, M. Medication adherence using a smart pill bottle. In Proceedings of the 2014 11th International Conference Expo on Emerging Technologies for a Smarter World (CEWIT), Melville, NY, USA, 29–30 October 2014; pp. 1–4. [Google Scholar] [CrossRef]
- Lee, M.L.; Dey, A.K. Sensor-based observations of daily living for aging in place. Pers. Ubiquitous Comput. 2015, 19, 27–43. [Google Scholar] [CrossRef]
- Abbey, B.; Alipour, A.; Gilmour, L.; Camp, C.; Hofer, C.; Lederer, R.; Rasmussen, G.; Liu, L.; Nikolaidis, I.; Stroulia, E.; et al. A remotely programmable smart pillbox for enhancing medication adherence. In Proceedings of the 2012 25th IEEE International Symposium on Computer-Based Medical Systems (CBMS), Rome, Italy, 20–22 June 2012; pp. 1–4. [Google Scholar] [CrossRef]
- Serdaroglu, K.; Uslu, G.; Baydere, S. Medication intake adherence with real time activity recognition on IoT. In Proceedings of the 2015 IEEE 11th International Conference on Wireless and Mobile Computing, Networking and Communications (WiMob), AbuDhabi, UAE, 19–21 October 2015; pp. 230–237. [Google Scholar] [CrossRef]
- Mondol, A.S.; Emi, I.A.; Stankovic, J.A. MedRem: An interactive medication reminder and tracking system on wrist devices. In Proceedings of the 2016 IEEE Wireless Health (WH), Bethesda, MD, USA, 25–27 October 2016; pp. 1–8. [Google Scholar] [CrossRef]
- Lim, T.H.; Abdullah, A.H. Medication Adherence using Non-intrusive Wearable Sensors. ICST Trans. Ambient Syst. 2017, 4, e3. [Google Scholar] [CrossRef][Green Version]
- Hafezi, H.; Robertson, T.L.; Moon, G.D.; Au-Yeung, K.-Y.; Zdeblick, M.J.; Savage, G.M. An Ingestible Sensor for Measuring Medication Adherence. IEEE Trans. Biomed. Eng. 2015, 62, 99–109. [Google Scholar] [CrossRef] [PubMed]
- nRF51422 Product Specification v3.1. Nordic Semiconductor. 2014. Available online: https://infocenter.nordicsemi.com/pdf/nRF51422_PS_v3.1.pdf?cp=4_6_0_3 (accessed on 3 November 2019).
- Lee, K.; Koo, J.; Sun, W.; Choi, S. Power Consumption Modeling of BLE Advertising Devices. In Proceedings of the The 7th International Conference on Information and Communication Technology Convergence (ICTC 2016), Jeju Island, Korea, 19–21 October 2016; p. 3. [Google Scholar]
- Gomez, C.; Oller, J.; Paradells, J. Overview and Evaluation of Bluetooth Low Energy: An Emerging Low-Power Wireless Technology. Sensors 2012, 12, 11734–11753. [Google Scholar] [CrossRef]
- Won, S.P.; Melek, W.W.; Golnaraghi, F. A Kalman/Particle Filter-Based Position and Orientation Estimation Method Using a Position Sensor/Inertial Measurement Unit Hybrid System. IEEE Trans. Ind. Electron. 2010, 57, 1787–1798. [Google Scholar] [CrossRef]
- Witten, I.H.; Frank, E.; Hall, M.A.; Pal, C.J. Data Mining: Practical Machine Learning Tools and Techniques, 4th ed.; Morgan Kaufmann: San Francisco, CA, USA, 2016. [Google Scholar]
- Novakovic, J. Using Information Gain Attribute Evaluation to Classify Sonar Targets. In Proceedings of the 17th Telecommunications Forum TELFOR, Belgrade, Serbia, 24–26 November 2009. [Google Scholar]
- Rodriguez, J.D.; Perez, A.; Lozano, J.A. Sensitivity Analysis of k-Fold Cross Validation in Prediction Error Estimation. IEEE Trans. Pattern Anal. Mach. Intell. 2010, 32, 569–575. [Google Scholar] [CrossRef] [PubMed]
- Kohavi, R. The power of decision tables. In Proceedings of the European Conference on Machine Learning: ECML-95, Berlin/Heidelberg, Germany, 25–27 April 1995; pp. 174–189. [Google Scholar]
- Rish, I. An empirical study of the naive Bayes classifier. In Proceedings of the IJCAI 2001 Workshop on Empirical Methods in Artificial Intelligence, Seattle, WA, USA, 4 August 2001; Volume 3, pp. 41–46. [Google Scholar]


| Component | Manufacturer | Model | Function |
|---|---|---|---|
| Inertial Movement Unit | Hillcrest Labs | BNO080 | Orientation Estimation |
| Reed Switch x2 | Coto Technology | CT10-1540-G1 | Cap Removal Detection |
| Capacitance-to-Digital Converter | Texas Instruments | FDC1004 | Fluid Level 1 and Force Detection |
| Microcontroller | Nordic Semiconductor | nRF51422 | Data Processing/BLE communication |
| Coin Cell Battery | Illinois Capacitor | RJD2032C1 | Powering |
| Charge Management Controller | Microchip Technology | MCP73831 | Charging |
| Component | Idle Power (mW) | Active Power (mW) | Time Active (%) | Average Power (mW) |
|---|---|---|---|---|
| nRF51422 (MCU) | 3.3 | 30.5 | 0.1 | 3.3 |
| BNO080 (IMU) | 5.0 | 23.5 | 0.4 | 5.1 |
| FDC1004 (Capacitance) | 0.1 | 2.3 | 0.4 | 0.1 |
| Bluetooth (BLE) | 8.9 | 32.4 | 3.0 | 9.5 |
| ML Models | TPR | FPR | Precision | MCC | ROC Area |
|---|---|---|---|---|---|
| Decision Table [32] | 0.89 | 0.11 | 0.89 | 0.79 | 0.96 |
| Naïve Bayes [33] | 0.87 | 0.14 | 0.87 | 0.74 | 0.94 |
| Logistic Regression | 0.88 | 0.12 | 0.88 | 0.76 | 0.91 |
| SMO (SVM) | 0.94 | 0.07 | 0.94 | 0.87 | 0.94 |
| Random Forest | 0.96 | 0.04 | 0.96 | 0.92 | 0.99 |
| ML Models | TPR | FPR | Precision | Recall | F-Measure | MCC | ROC Area |
|---|---|---|---|---|---|---|---|
| Online ML | 0.97 | 0.11 | 0.90 | 0.97 | 0.93 | 0.86 | 0.93 |
| Offline Rule-Based | 0.92 | 0.23 | 0.80 | 0.92 | 0.86 | 0.70 | 0.85 |
© 2020 by the authors. Licensee MDPI, Basel, Switzerland. This article is an open access article distributed under the terms and conditions of the Creative Commons Attribution (CC BY) license (http://creativecommons.org/licenses/by/4.0/).
Share and Cite
Payne, N.; Gangwani, R.; Barton, K.; Sample, A.P.; Cain, S.M.; Burke, D.T.; Newman-Casey, P.A.; Shorter, K.A. Medication Adherence and Liquid Level Tracking System for Healthcare Provider Feedback. Sensors 2020, 20, 2435. https://doi.org/10.3390/s20082435
Payne N, Gangwani R, Barton K, Sample AP, Cain SM, Burke DT, Newman-Casey PA, Shorter KA. Medication Adherence and Liquid Level Tracking System for Healthcare Provider Feedback. Sensors. 2020; 20(8):2435. https://doi.org/10.3390/s20082435
Chicago/Turabian StylePayne, Nolan, Rahul Gangwani, Kira Barton, Alanson P. Sample, Stephen M. Cain, David T. Burke, Paula Anne Newman-Casey, and K. Alex Shorter. 2020. "Medication Adherence and Liquid Level Tracking System for Healthcare Provider Feedback" Sensors 20, no. 8: 2435. https://doi.org/10.3390/s20082435
APA StylePayne, N., Gangwani, R., Barton, K., Sample, A. P., Cain, S. M., Burke, D. T., Newman-Casey, P. A., & Shorter, K. A. (2020). Medication Adherence and Liquid Level Tracking System for Healthcare Provider Feedback. Sensors, 20(8), 2435. https://doi.org/10.3390/s20082435