Ultrasound Image-Based Diagnosis of Malignant Thyroid Nodule Using Artificial Intelligence


Abstract
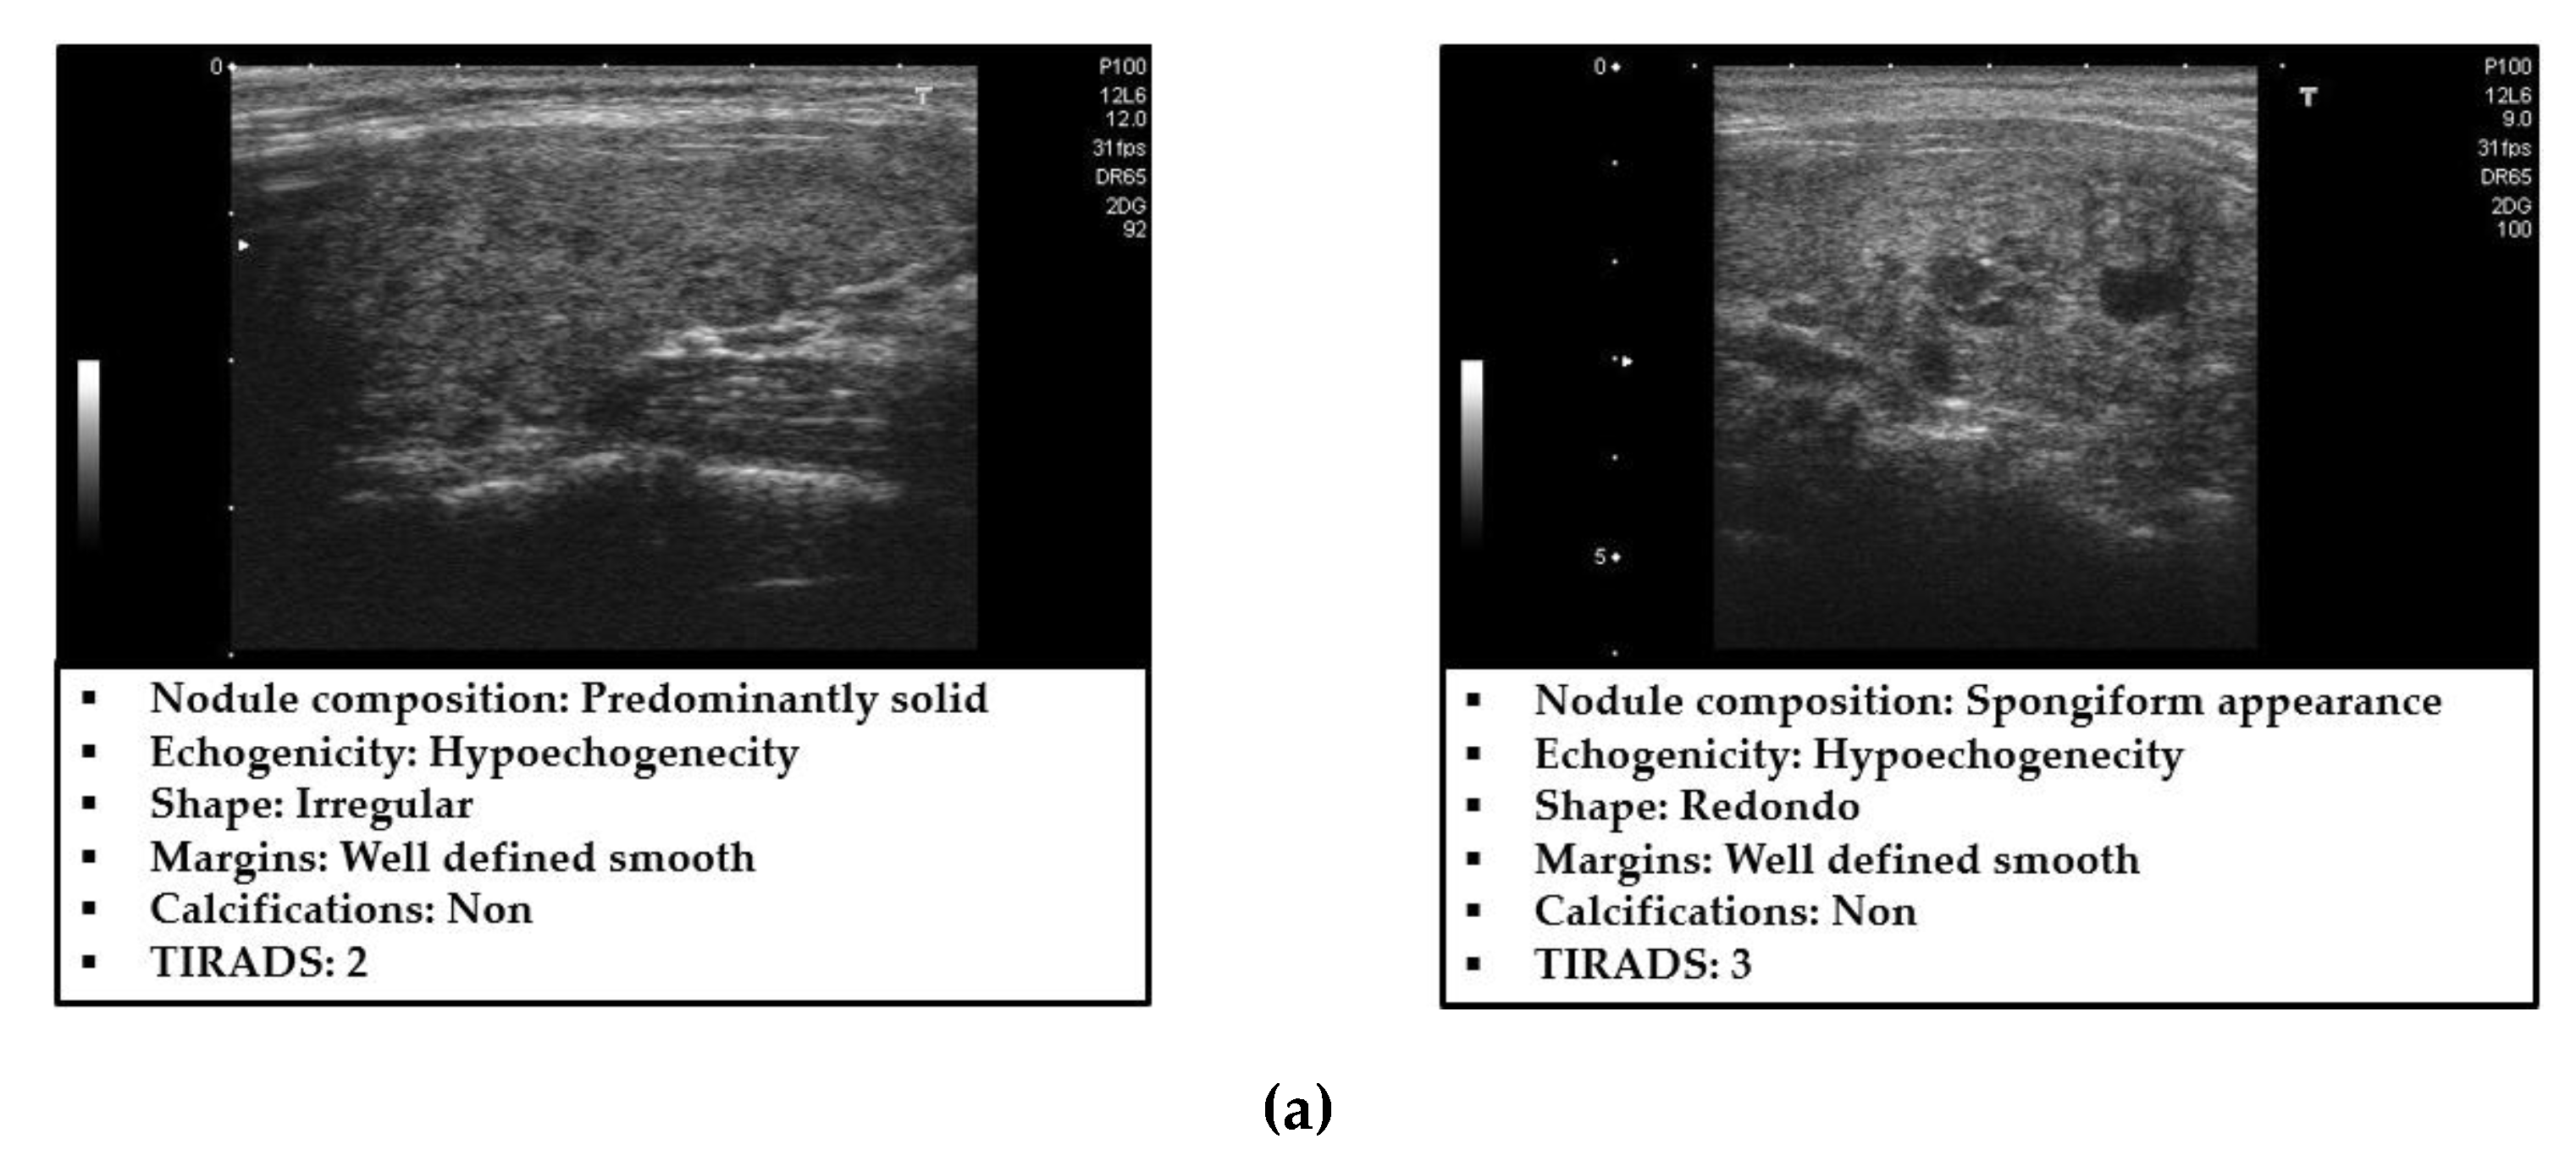
1. Introduction
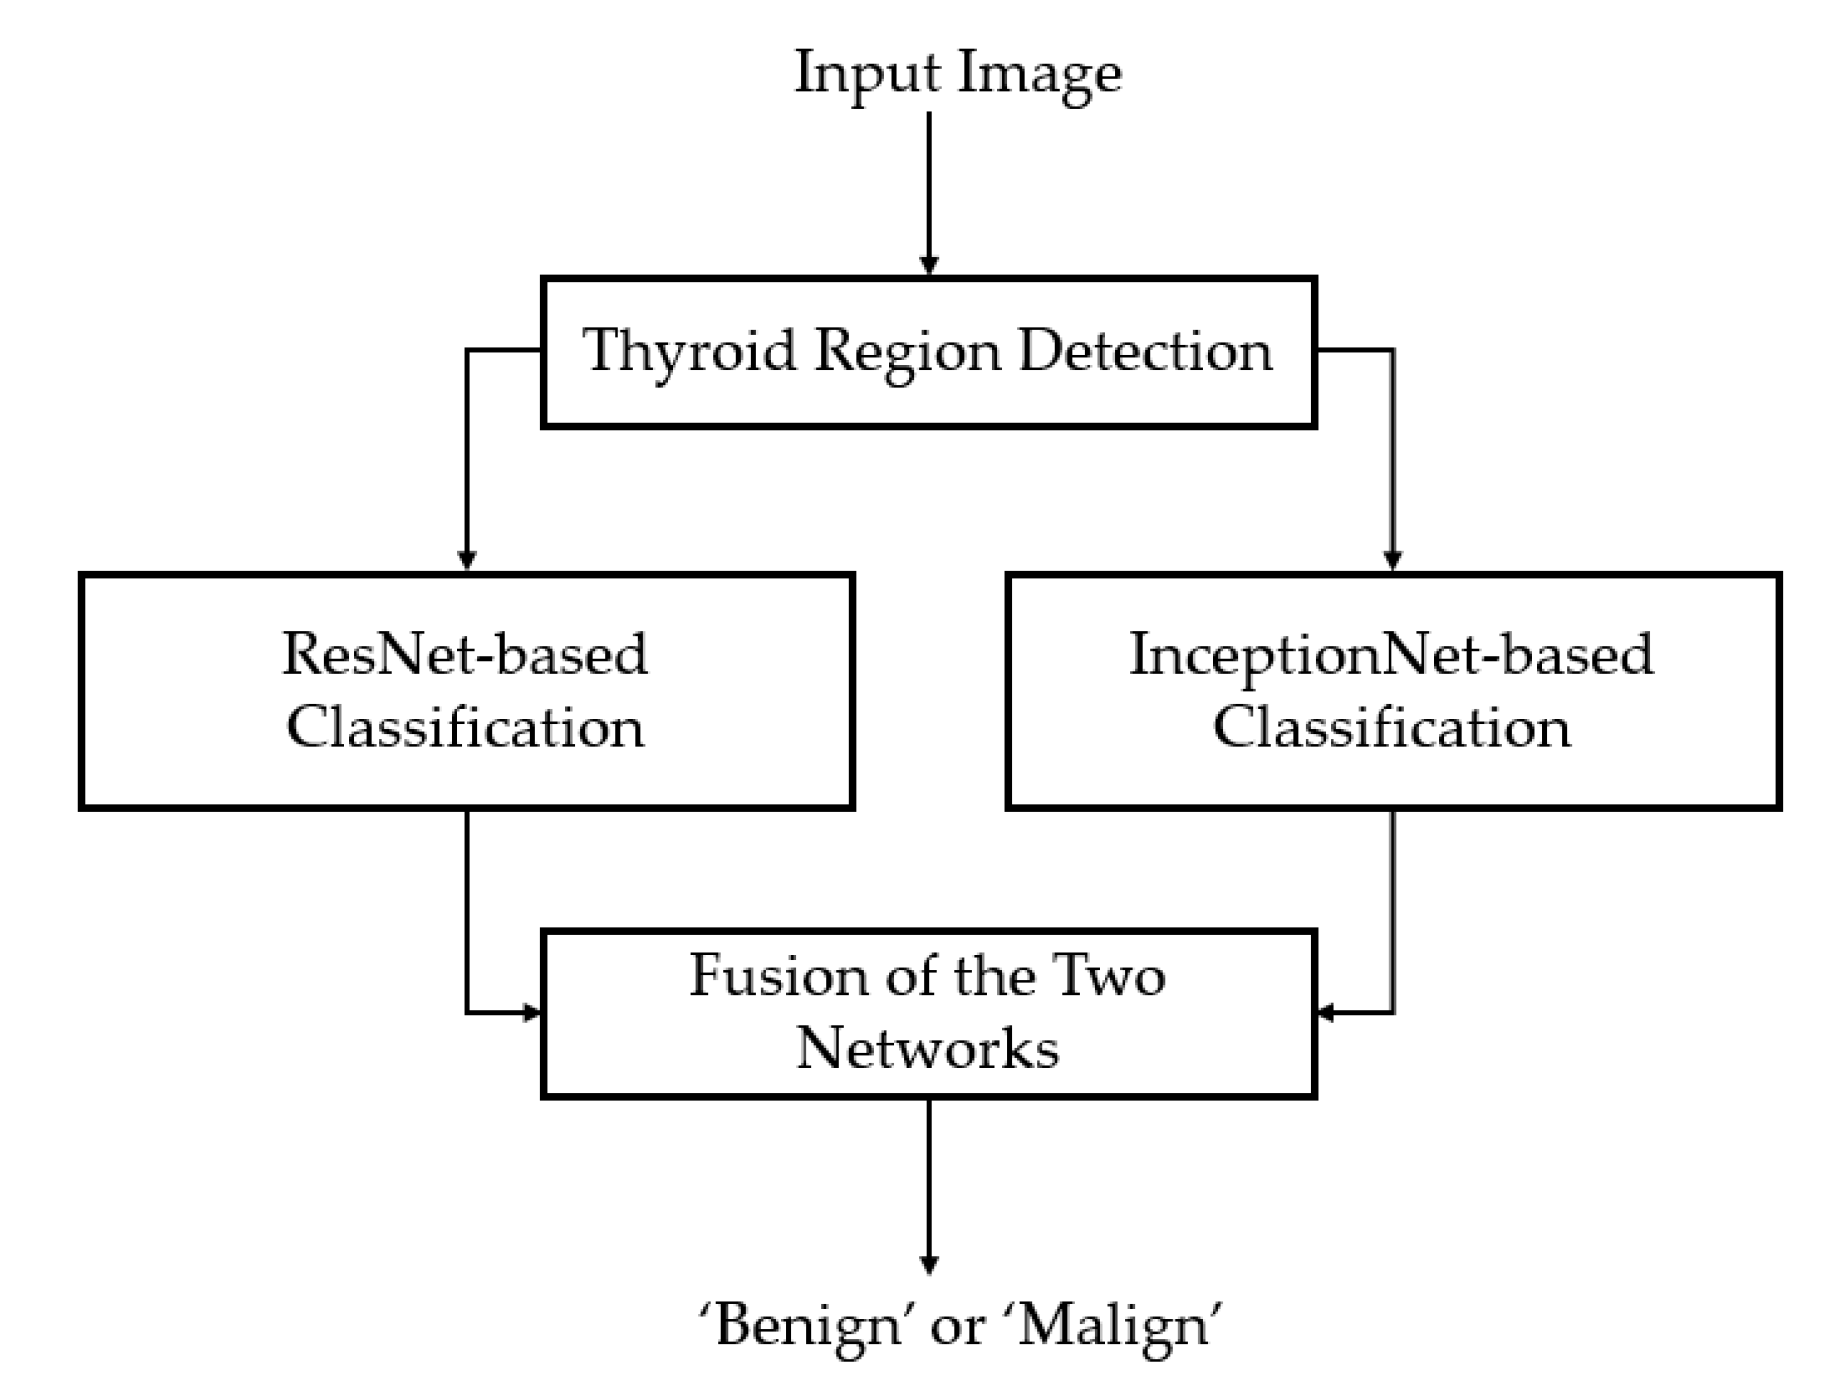
- We propose the use of multiple CNN-based models to analyze input ultrasound thyroid images deeply for the classification problem. Since each CNN model has its own architecture and characteristics of learning the characteristics of input images, the use of multiple CNN-based models can help to extract richer information compared to using an individual model.
- In order to solve the problem of unbalanced data samples between the benign and malign classes in the training data, we propose the use of a weighted binary cross-entropy loss function instead of the conventional binary cross-entropy loss function. As the name suggests, we assign a higher weight value to data samples of class (benign or malign), which have a smaller number of data than the other. This procedure helps increase the focus of the training process on this class rather than the other class. As a result, it helps to reduce the effects of the overfitting problem of the CNN networks when training with unbalanced data.
- We combine the outputs of multiple CNN-based models to enhance the classification performance using several bagging methods, including MIN, MAX, and AVERAGE combination rules which take the minimum, maximum, and average results of the multiple CNN-based models, respectively.
- We make our algorithm available to the public through [37], so that other researchers can make fair comparisons.
2. Proposed Method
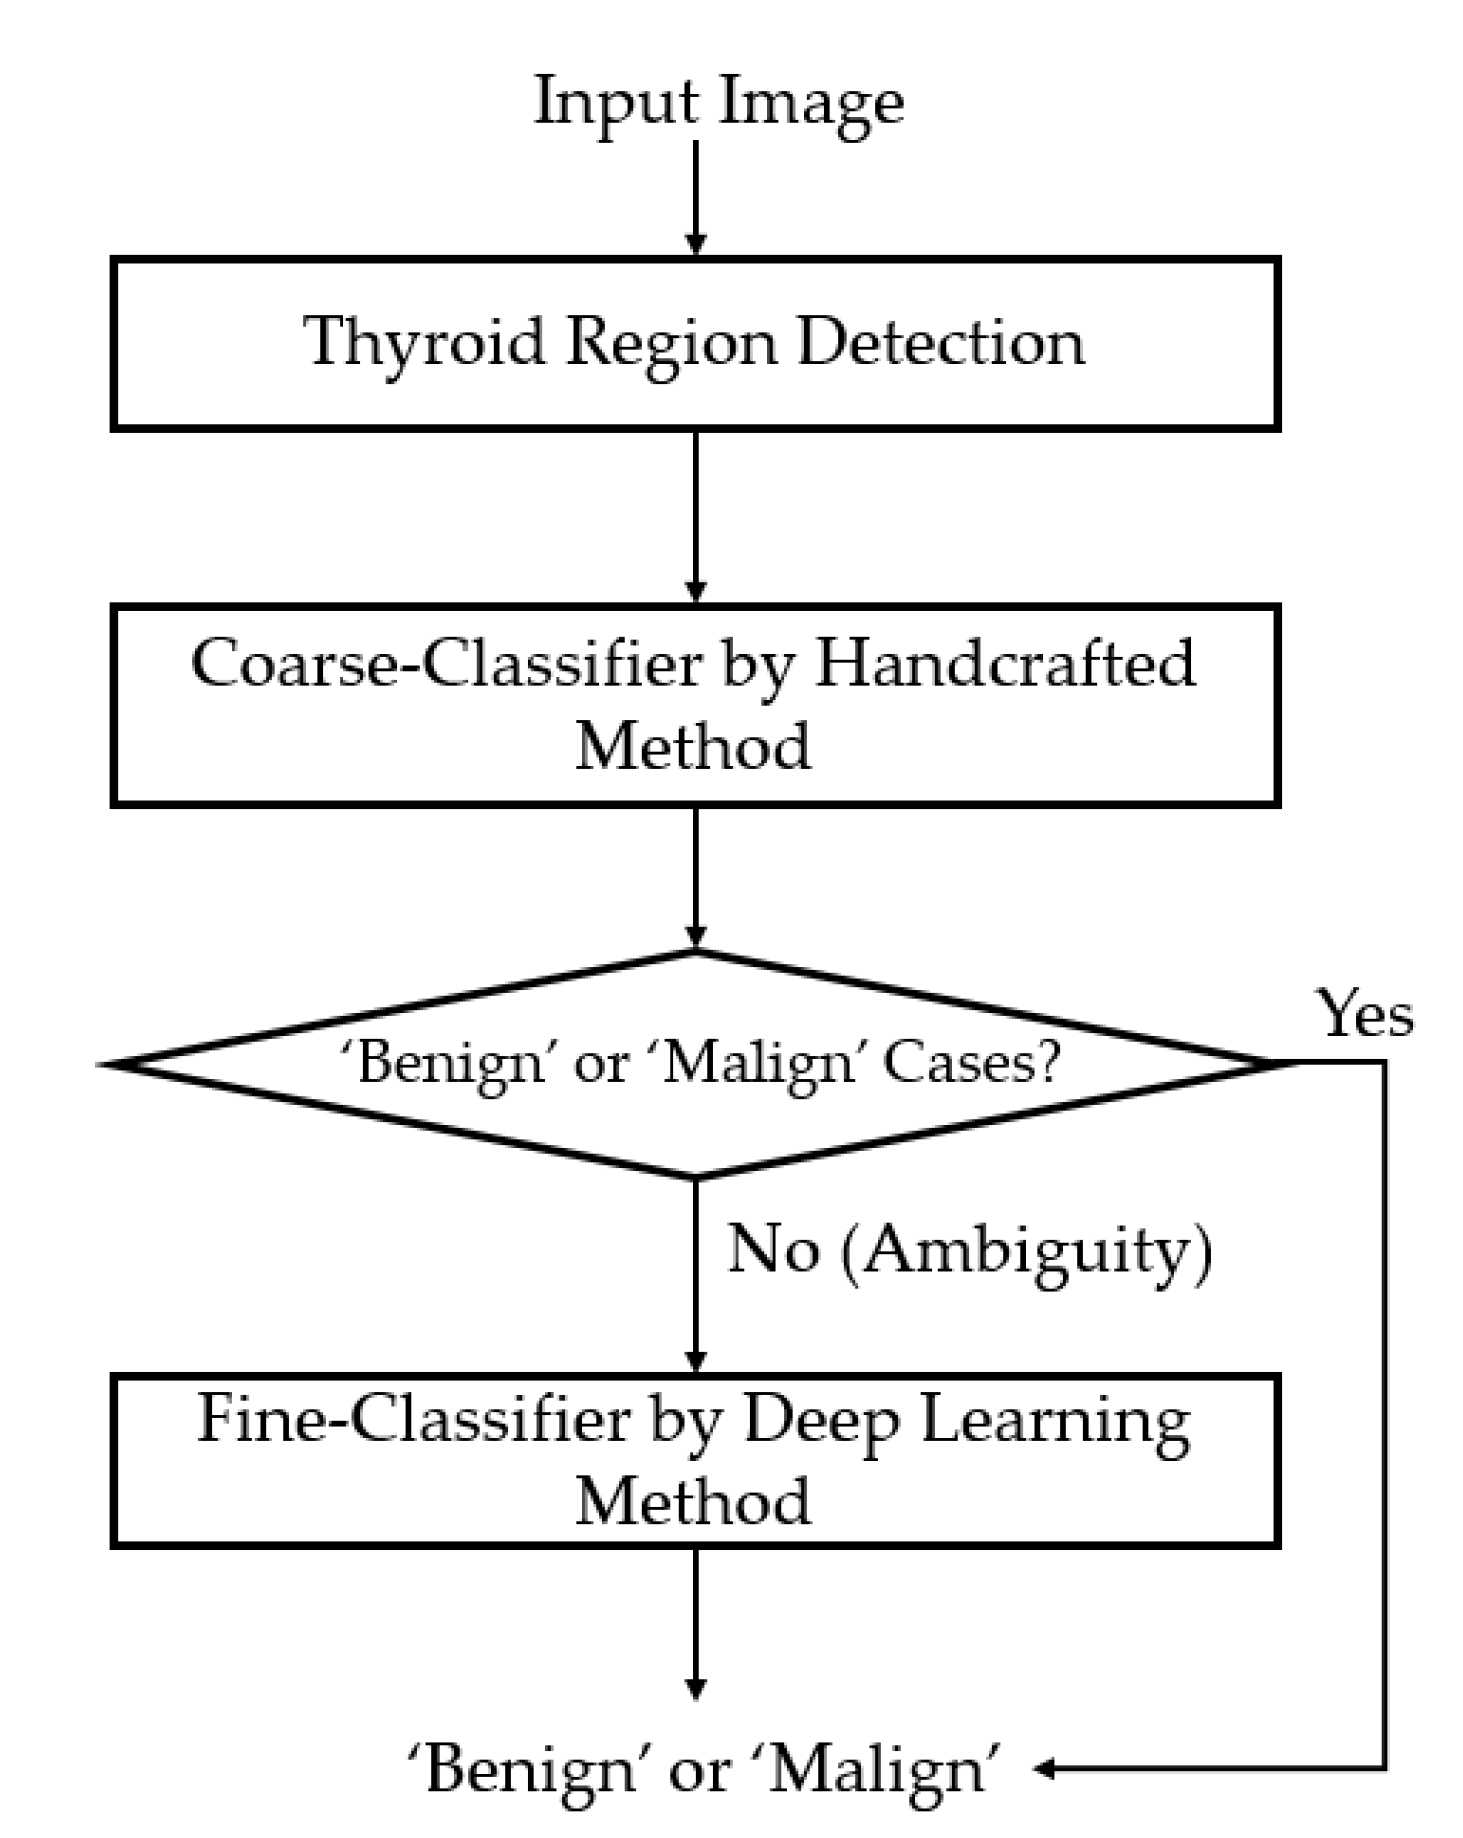
2.1. Overview of the Proposed Method
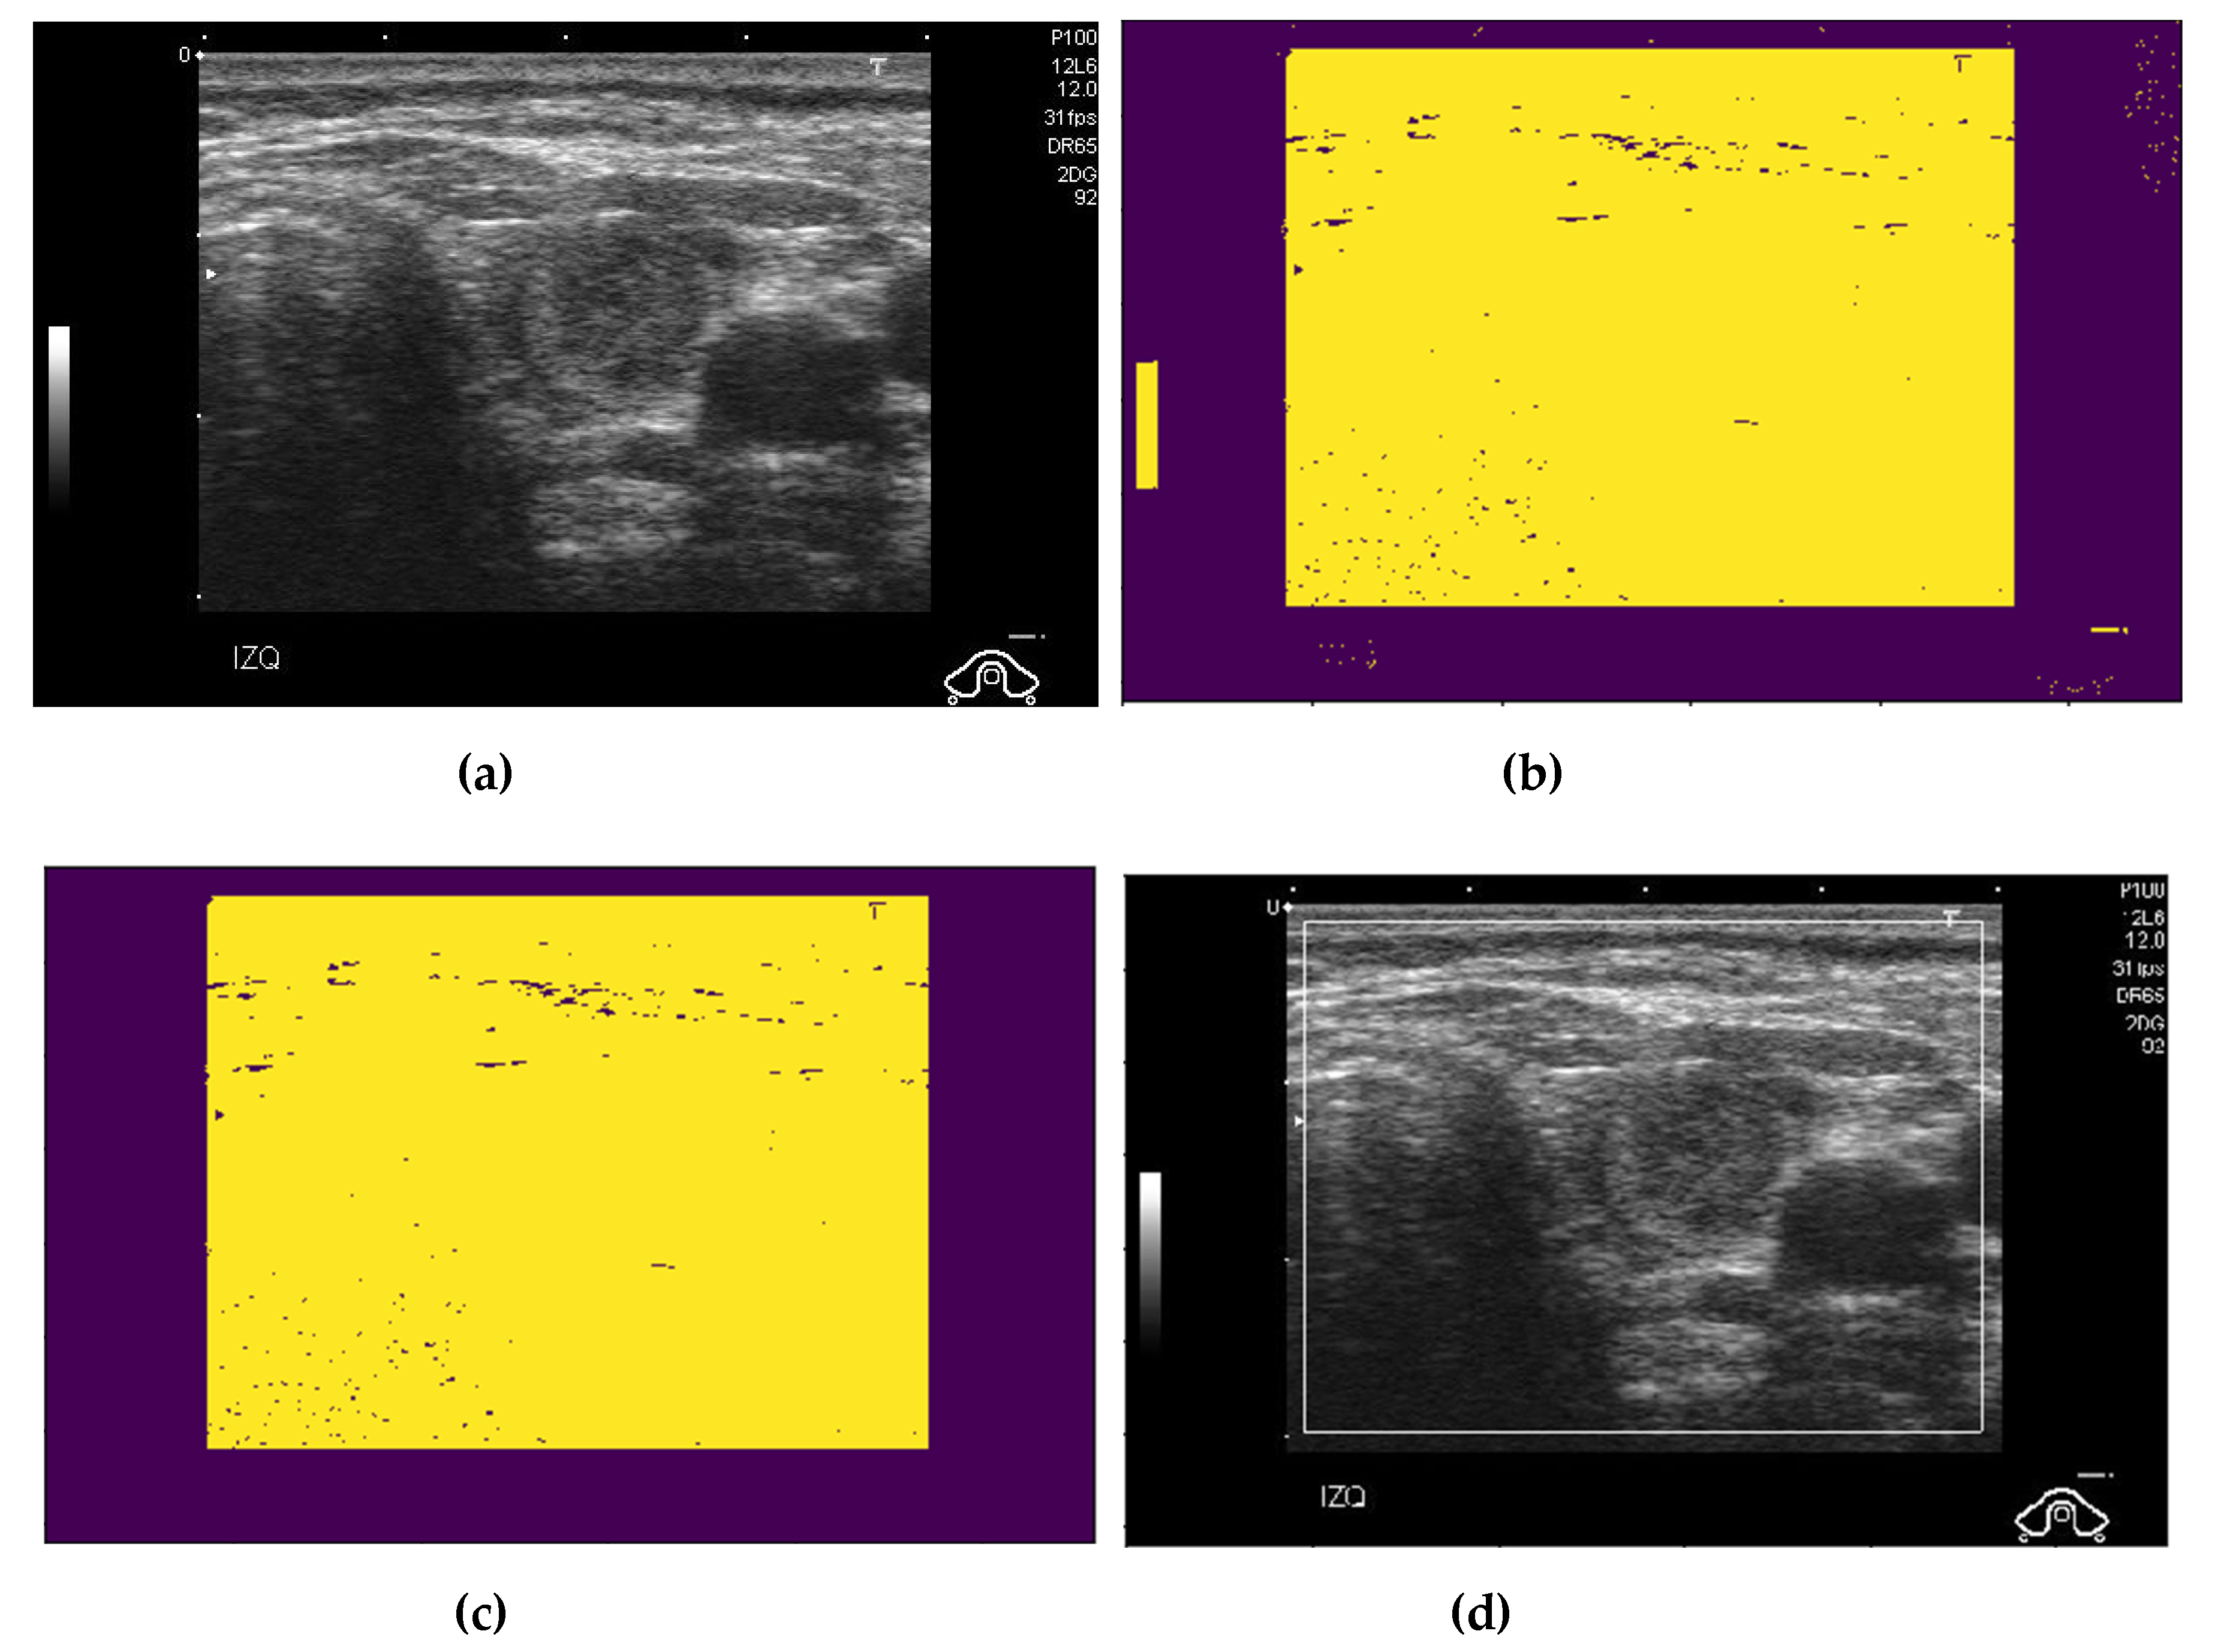
2.2. Preprocessing of Captured Thyroid Images
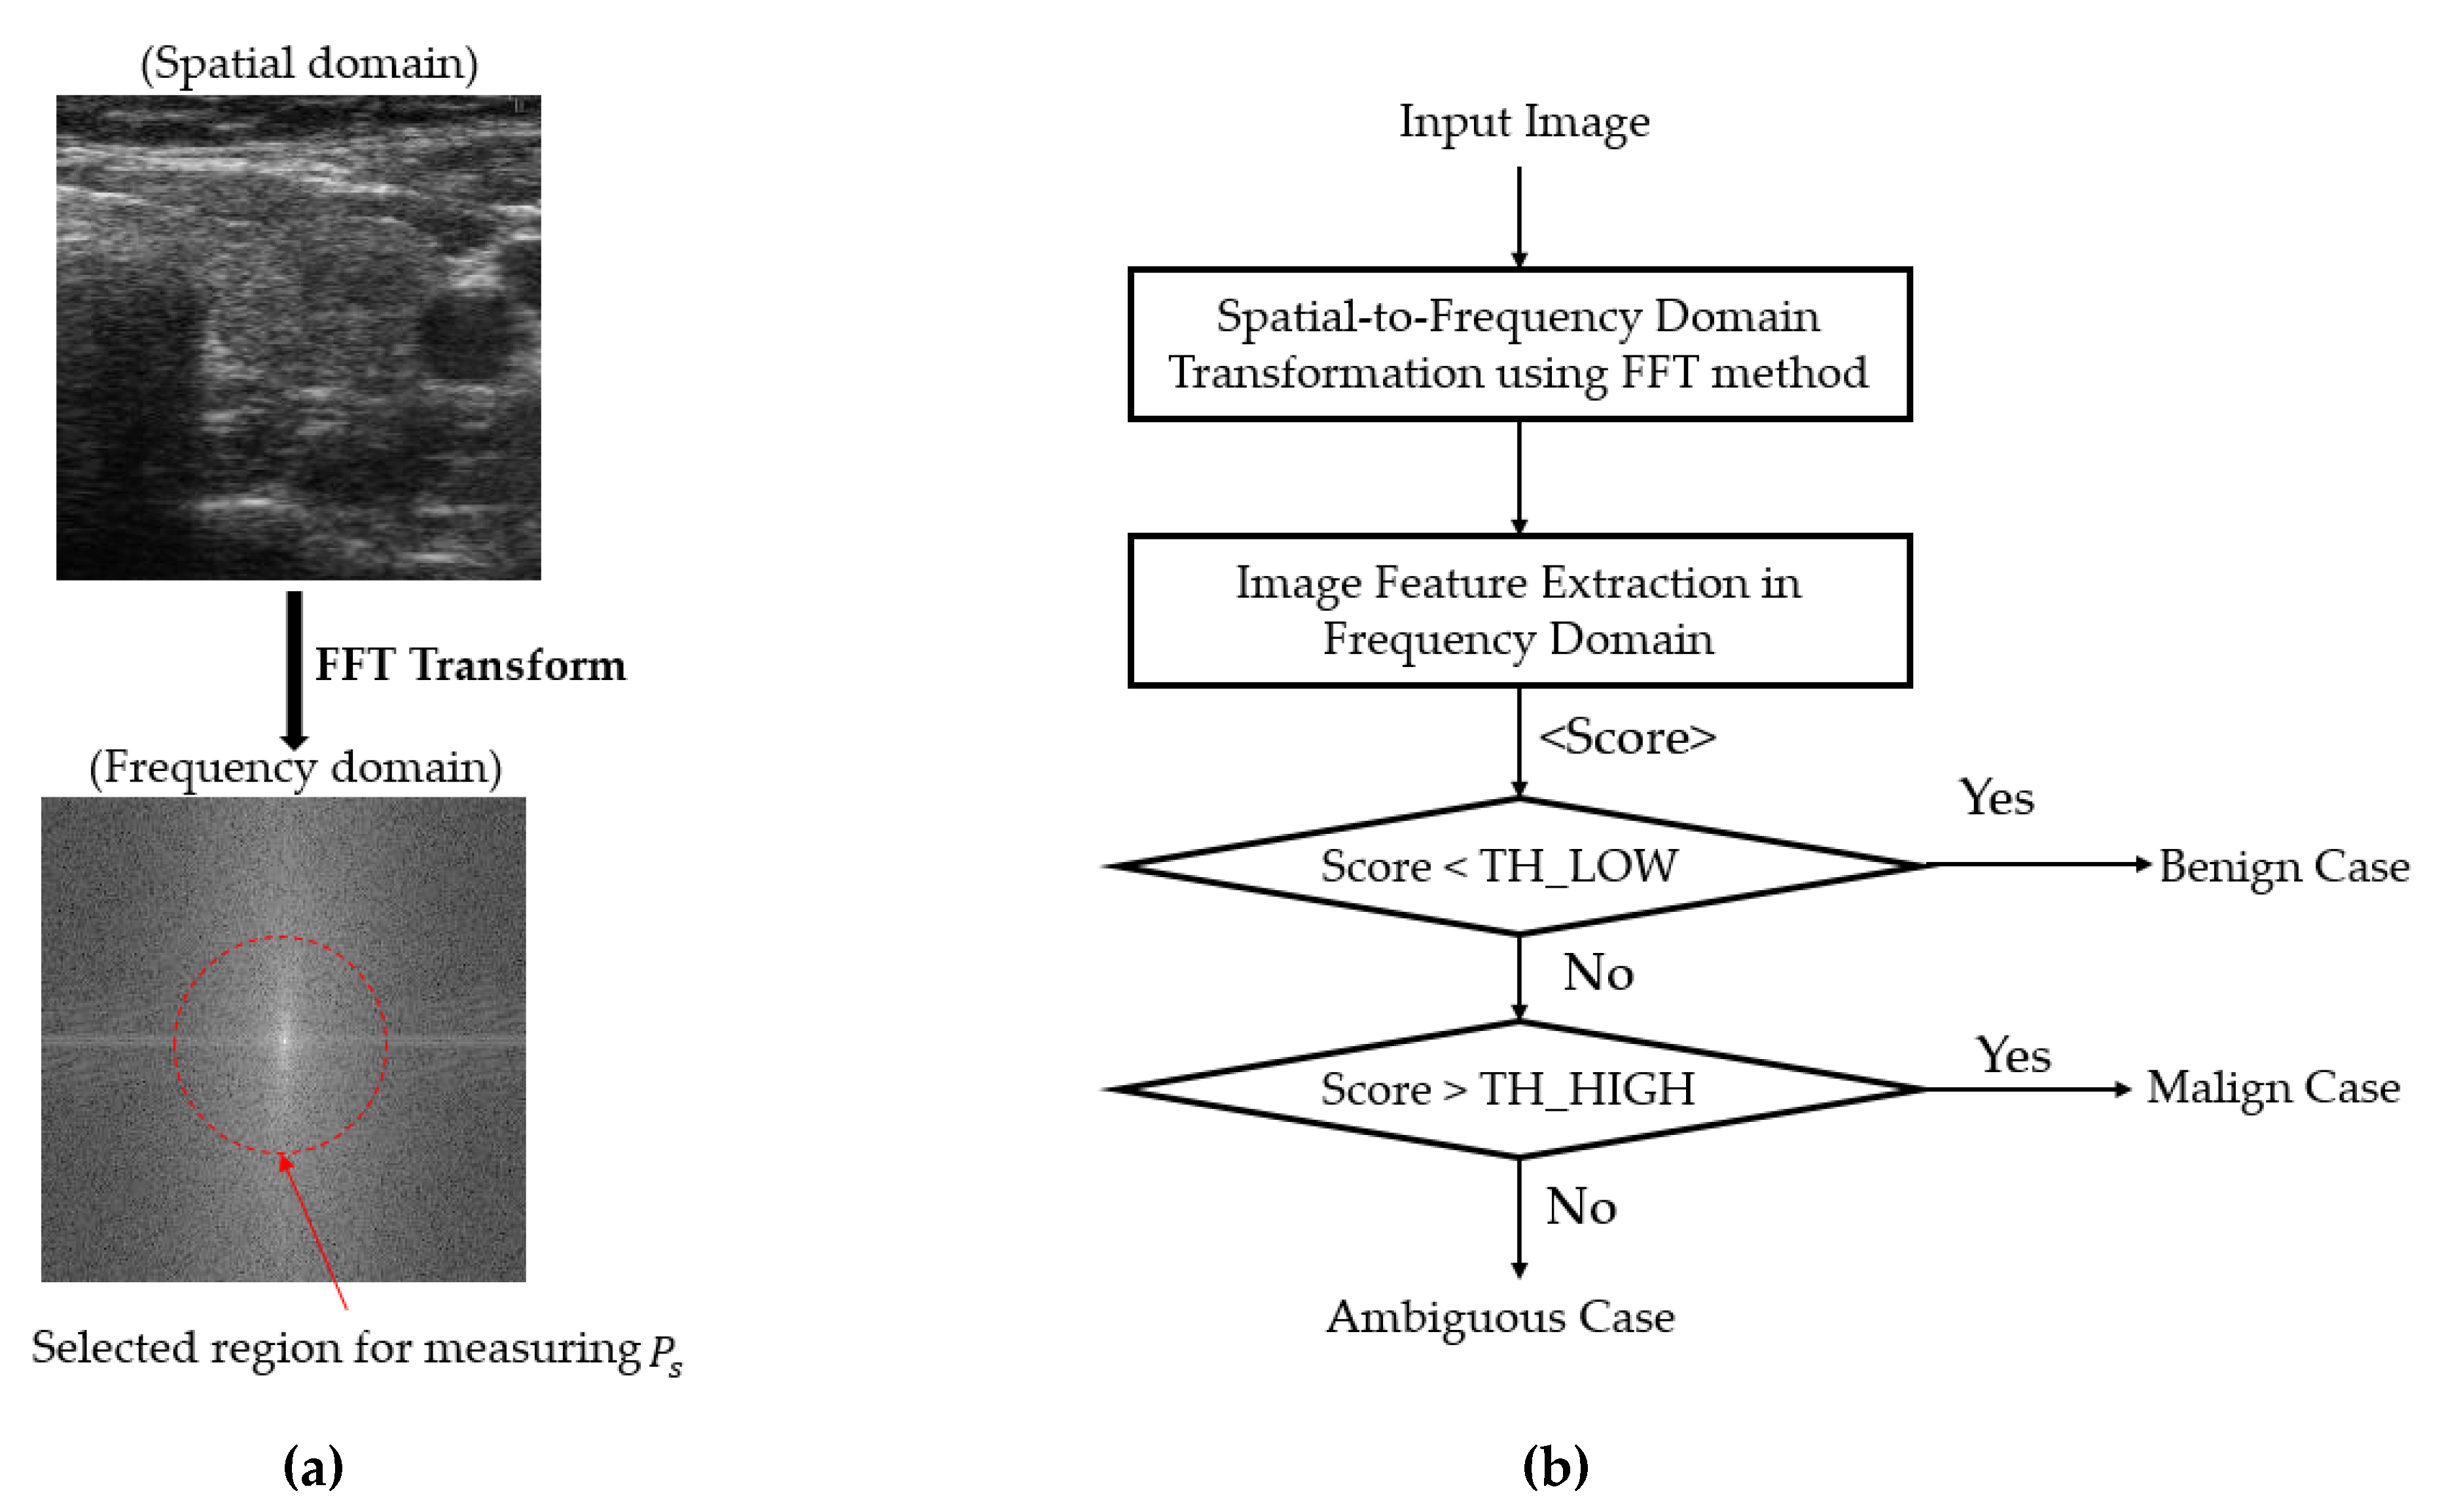
2.3. Coarse Classifier Based on Information Extracted in the Frequency Domain
2.4. Fine Classifier Based on a Combination of Multiple CNN Models
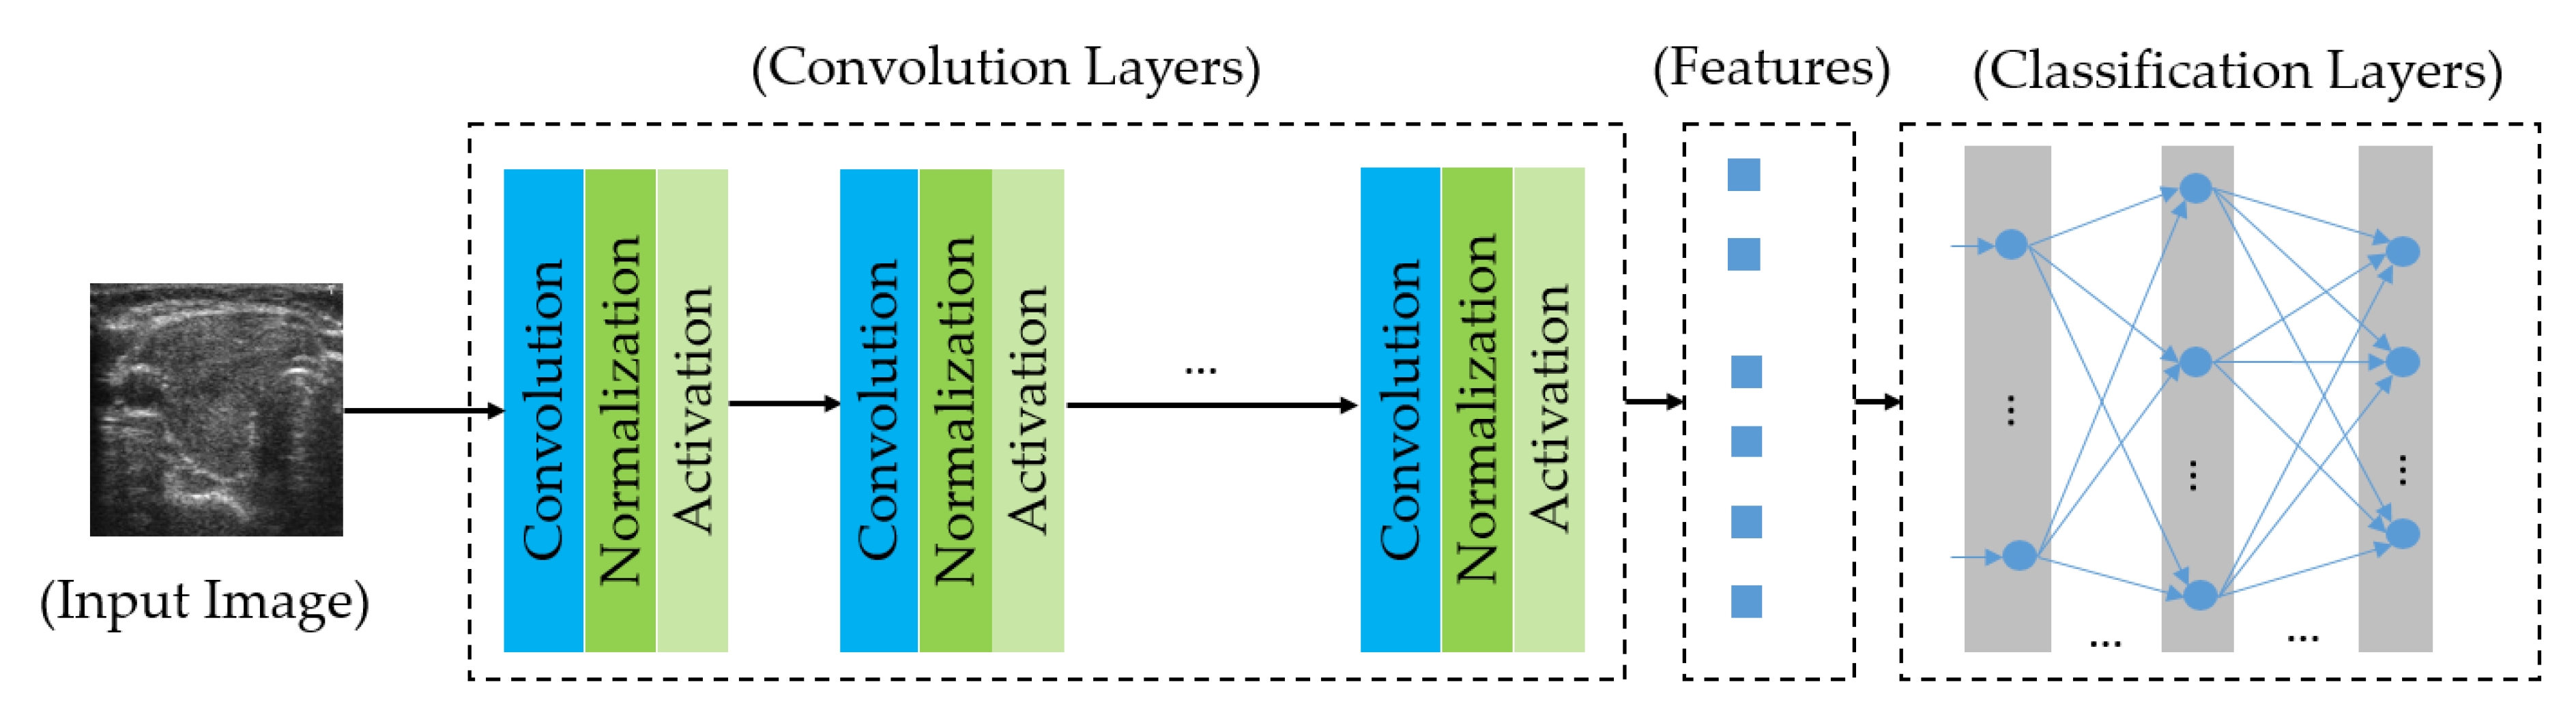
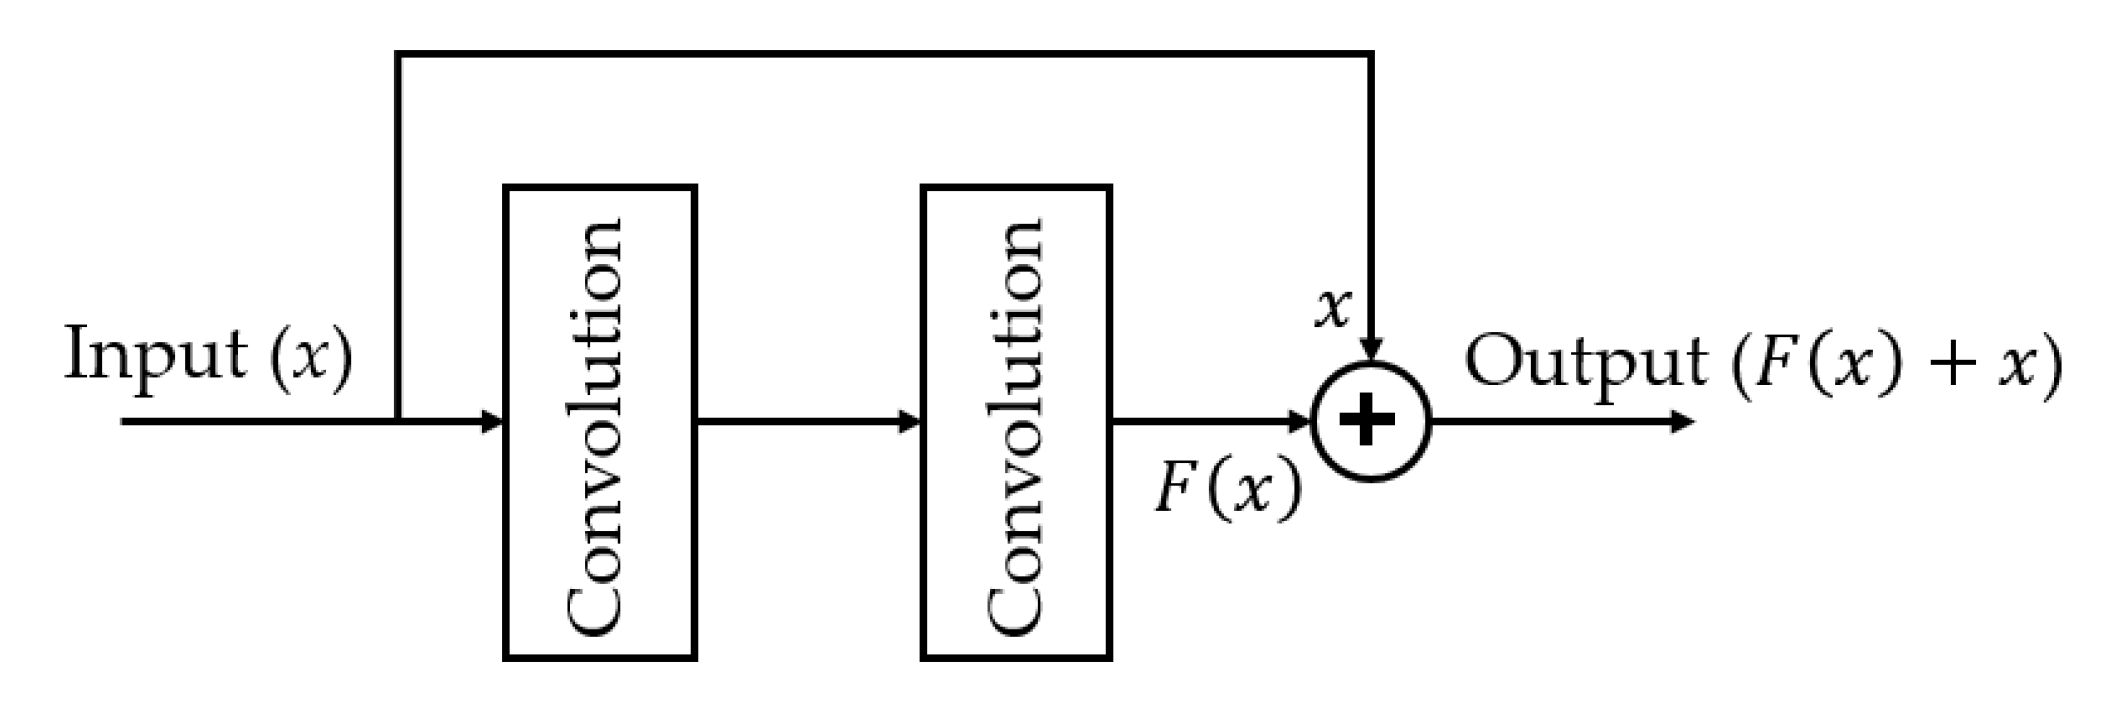
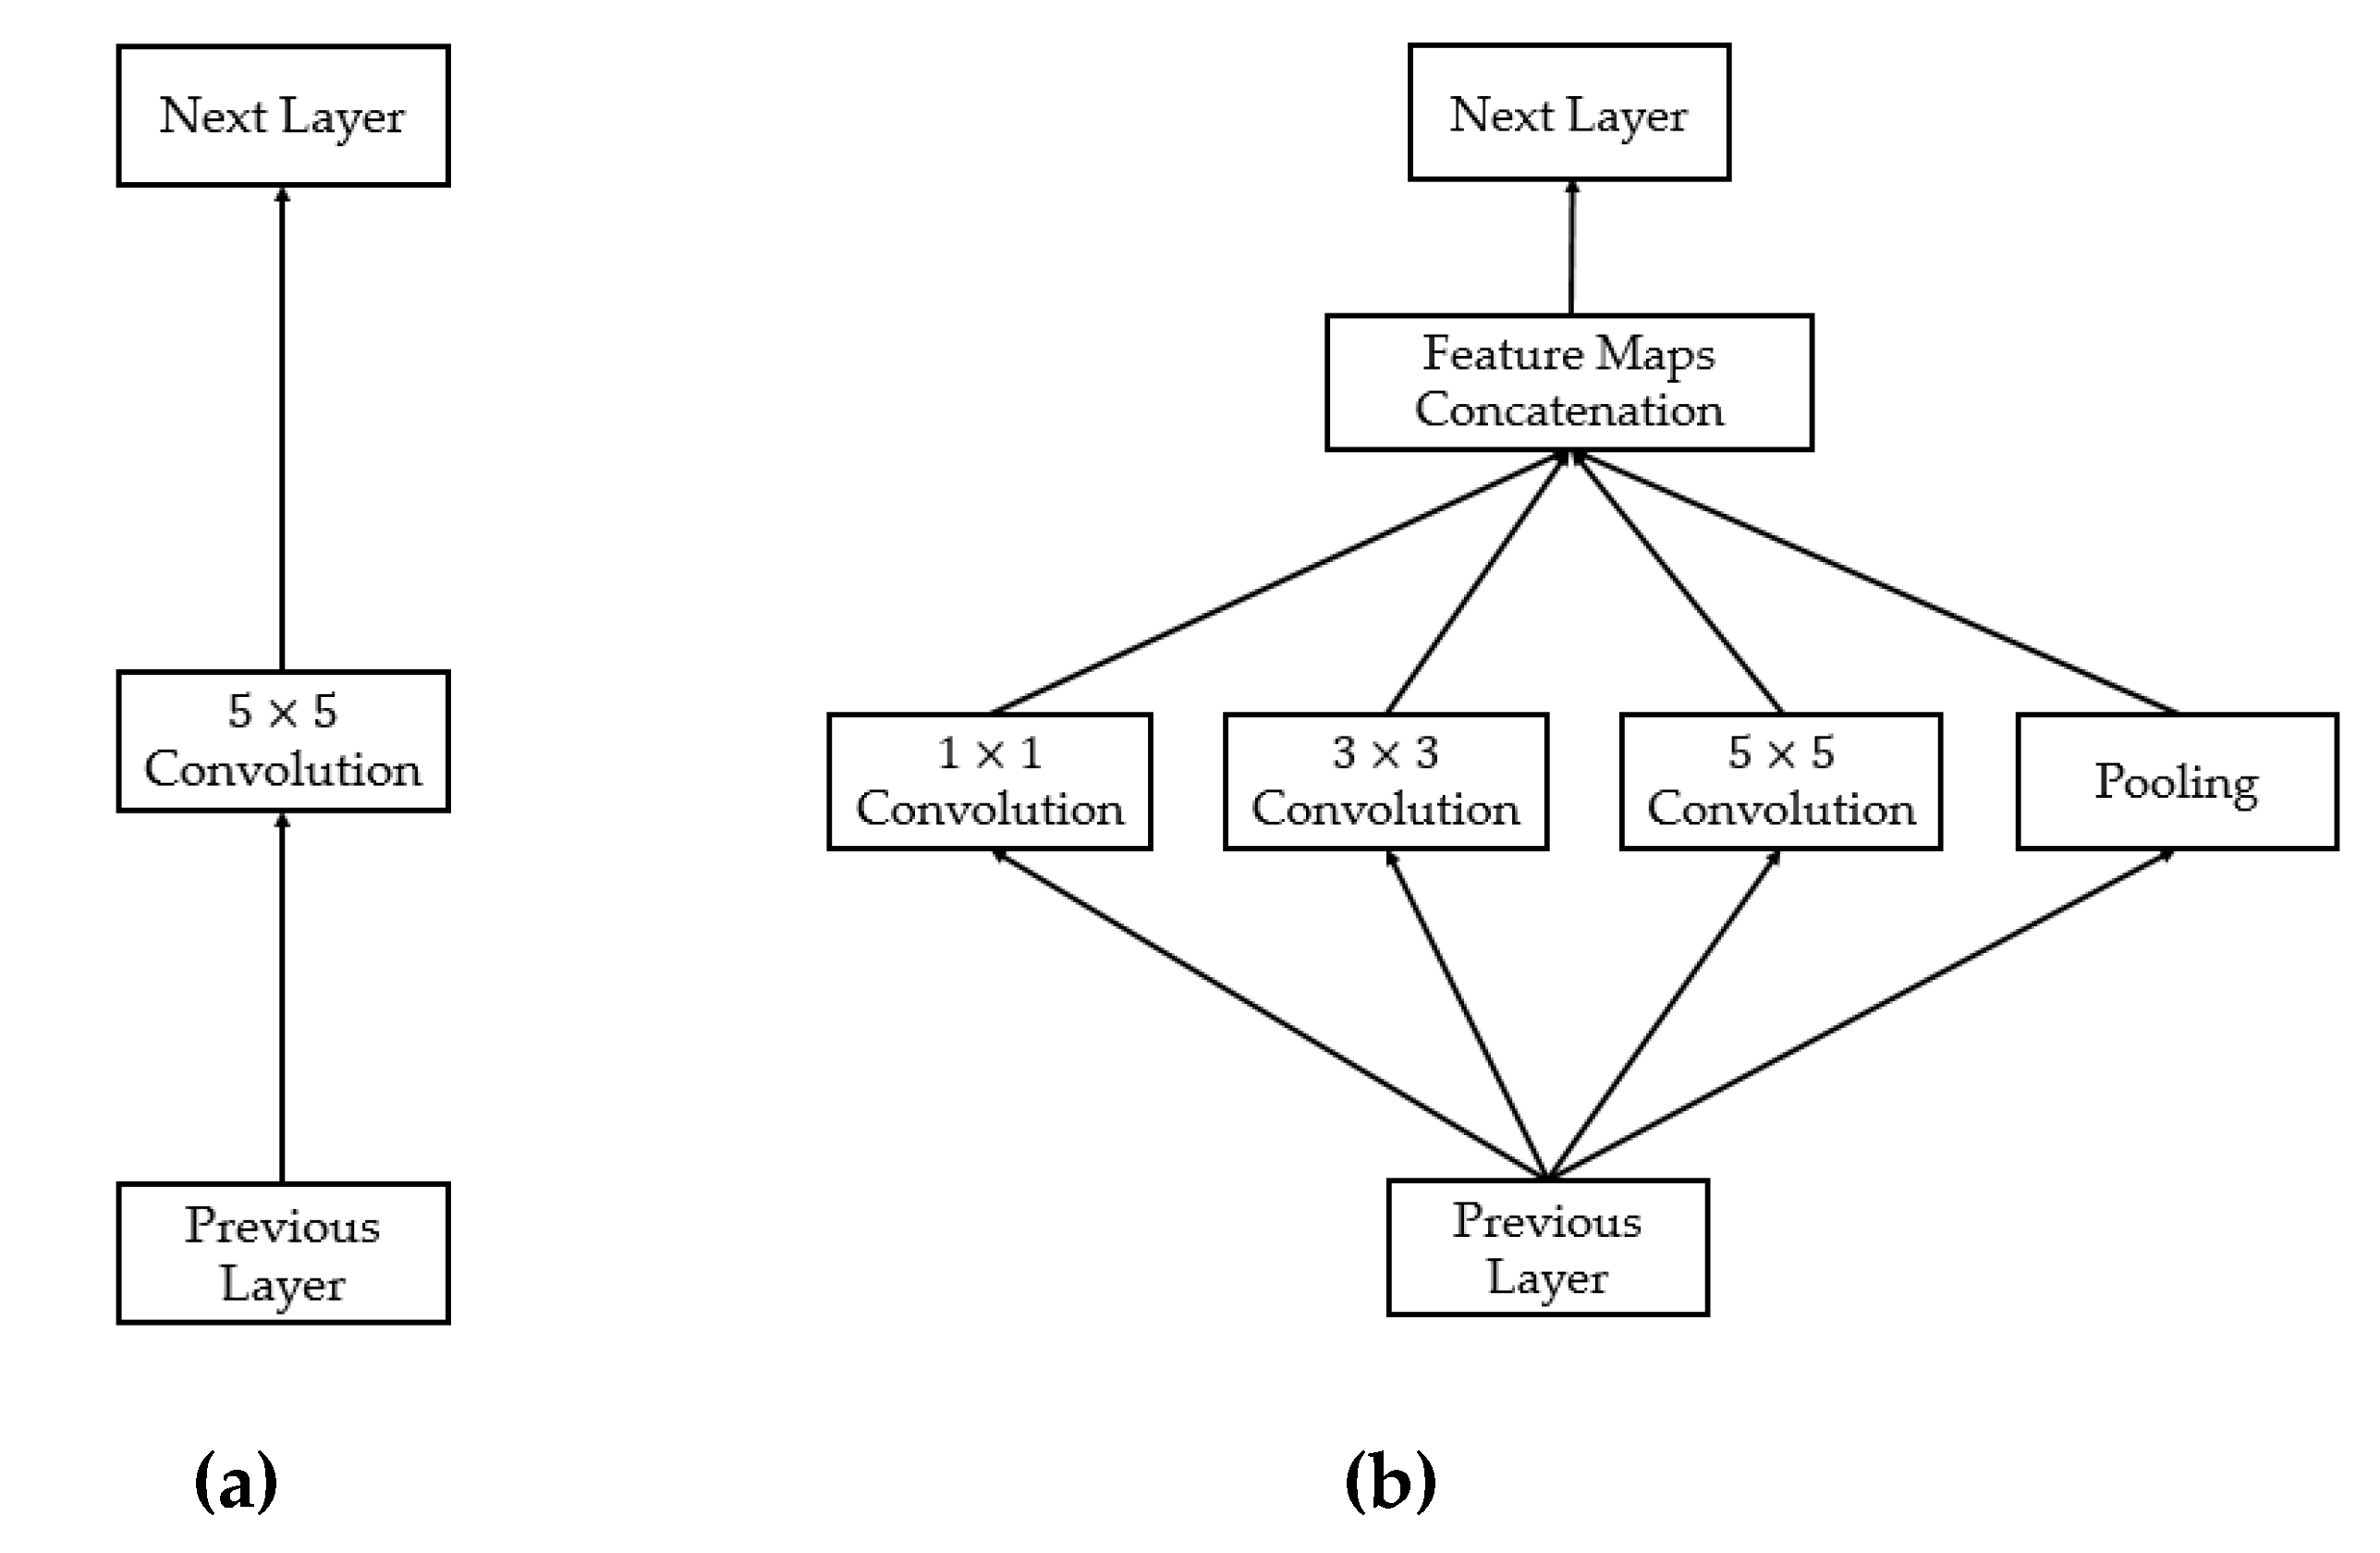
2.4.1. Introduction to the Deep Learning Framework
2.4.2. Proposed Method for Thyroid Nodule Classification Using Multiple CNN Models
2.4.3. Weighted Binary Cross-Entropy Loss Function for Compensating the Imbalance of Training Samples
3. Experimental Results
3.1. Dataset and Experimental Setups
3.2. Criteria for Classification Performance of a Thyroid Nodule Classification Method
3.3. Classification Results Based on Multiple Artificial-Intelligence Models
3.4. Classification Results by the Proposed Method
3.5. Performance Comparisons of Proposed Method with the State-of-the Art Methods
3.6. Analysis and Discussion
4. Conclusions
Author Contributions
Acknowledgments
Conflicts of Interest
References
- Vuong, Q.H.; Ho, M.T.; Vuong, T.T.; La, V.P.; Ho, M.T.; Nghiem, K.C.P.; Tran, B.X.; Giang, H.H.; Giang, T.V.; Latkin, C.; et al. Artificial intelligence vs. natural stupidity: Evaluating AI readiness for the Vietnamese medical information system. J. Clin. Med. 2019, 8, 168. [Google Scholar] [CrossRef] [PubMed]
- Havaei, M.; Davy, A.; Warde-Farley, D.; Biard, A.; Courville, A.; Bengio, Y.; Pal, C.; Jodoin, P.-M.; Larochelle, H. Brain tumor segmentation with deep neural networks. Med. Image Anal. 2017, 35, 18–31. [Google Scholar] [CrossRef] [PubMed]
- Cheng, C.-H.; Liu, W.-X. Identifying degenerative brain disease using rough set classifier based on wavelet packet method. J. Clin. Med. 2018, 7, 124. [Google Scholar] [CrossRef] [PubMed]
- Xian, M.; Zhang, Y.; Cheng, H.D.; Xu, F.; Zhang, F.; Ding, J. Automatic breast ultrasound image segmentation: A survey. Pattern Recognit. 2018, 79, 340–355. [Google Scholar] [CrossRef]
- Milletar, F.; Ahmadi, S.-A.; Kroll, C.; Plate, A.; Rozanski, V.; Maiostre, J.; Levin, J.; Dietrich, O.; Ertl-Wagner, B.; Botzel, K.; et al. Hough-CNN: Deep learning for segmentation of deep brain regions in MRI and ultrasound. Comput. Vis. Image Underst. 2017, 16, 92–102. [Google Scholar] [CrossRef]
- Owais, M.; Arsalan, M.; Choi, J.; Park, K.R. Effective diagnosis and treatment through content-based medical image retrieval (CBMIR) by using artificial intelligence. J. Clin. Med. 2019, 8, 462. [Google Scholar] [CrossRef]
- Zhang, W.; Li, R.; Deng, H.; Wang, L.; Lin, W.; Ji, S.; Shen, D. Deep convolutional neural networks for multi-modality isointense infant brain image segmentation. Neuroimage 2015, 108, 214–224. [Google Scholar] [CrossRef]
- Moon, W.K.; Chang, S.-C.; Huang, C.-S.; Chang, R.-F. Breast tumor classification using fuzzy clustering for breast elastography. Ultrasound Med. Biol. 2011, 37, 700–708. [Google Scholar] [CrossRef]
- Hrzic, F.; Stajduhar, I.; Tschauner, S.; Sorantin, E.; Lerga, J. Local-entropy based approach for x-ray image segmentation and fracture detection. Entropy 2019, 21, 338. [Google Scholar] [CrossRef]
- Bhandary, A.; Prabhu, G.A.; Rajinikanth, V.; Thanaraj, K.P.; Satapathy, S.C.; Robbins, D.E.; Shasky, C.; Zhang, Y.D.; Tavares, J.M.R.; Raja, N.S.M. Deep-learning framework to detect lung abnormality—A study with chest x-ray and lung CT scan images. Pattern Recogn. Lett. 2020, 129, 271–278. [Google Scholar] [CrossRef]
- Jung, N.Y.; Kang, B.J.; Kim, H.S.; Cha, E.S.; Lee, J.H.; Park, C.S.; Whang, I.Y.; Kim, S.H.; An, Y.Y.; Choi, J.J. Who could benefit the most from using a computer-aided detection system in full-field digital mammography? World, J. Surg. Oncol. 2014, 12, 168. [Google Scholar] [CrossRef] [PubMed]
- Kamnitsas, K.; Ledig, C.; Newcombe, V.F.J.; Simpson, J.P.; Kane, A.D.; Menon, D.K.; Rueckert, D.; Glocker, B. Efficient multi-scale 3D CNN with fully connected CRF for accurate brain lesion segmentation. Med. Image Anal. 2017, 36, 61–78. [Google Scholar] [CrossRef] [PubMed]
- Moon, W.K.; Huang, Y.-S.; Lee, Y.-W.; Chang, S.-C.; Lo, C.-M.; Yang, M.-C.; Bae, M.S.; Lee, S.H.; Chang, J.M.; Huang, C.-S.; et al. Computer-aided tumor diagnosis using shear wave breast elastography. Ultrasonics 2017, 78, 125–133. [Google Scholar] [CrossRef] [PubMed]
- Acharya, U.R.; Ng, W.L.; Rahmat, K.; Sudarshan, V.K.; Koh, J.E.; Tan, J.H.; Hagiwara, Y.; Yeong, C.H.; Ng, K.H. Data mining framework for breast lesion classification in shear wave ultrasound: A hybrid feature paradigm. Biomed. Signal Process. Control 2017, 33, 400–410. [Google Scholar] [CrossRef]
- Moon, W.K.; Cheng, I.-L.; Chang, J.M.; Shin, S.U.; Lo, C.-M.; Chang, R.-F. The adaptive computer-aided diagnosis system based on tumor sizes for the classification of breast tumors detected at screening ultrasound. Ultrasonics 2017, 76, 70–77. [Google Scholar] [CrossRef]
- Xu, Y.; Wang, Y.; Yuan, J.; Cheng, Q.; Wang, X.; Carson, P.L. Medical breast ultrasound image segmentation by machine learning. Ultrasonics 2019, 91, 1–9. [Google Scholar] [CrossRef]
- Koundal, D.; Gupta, S.; Signh, S. Computer aided thyroid nodule detection system using medical ultrasound images. Biomed. Signal Process. Control 2018, 40, 117–130. [Google Scholar] [CrossRef]
- Tessler, F.N.; Middleton, W.D.; Grant, E.G.; Hoang, J.K.; Berland, L.L.; Teefey, S.A.; Cronan, J.J.; Beland, M.D.; Desser, T.S.; Frates, M.C.; et al. ACR thyroid imaging, reporting and data system (TI-RADS): White paper of the ACR TI-RADS committee. J. Am. Coll. Radiol. 2017, 14, 587–595. [Google Scholar] [CrossRef]
- Ma, J.; Wu, F.; Zhu, J.; Xu, D.; Kong, D. A pretrained convolutional neural network based method for thyroid nodule diagnosis. Ultrasonics 2017, 73, 221–230. [Google Scholar] [CrossRef]
- Pedraza, L.; Vargas, C.; Narvaez, F.; Duran, O.; Munoz, E.; Romero, E. An open access thyroid ultrasound-image database. In Proceedings of the 10th International Symposium on Medical Information Processing and Analysis, Cartagena de Indias, Colombia, 28 January 2015; pp. 1–6. [Google Scholar]
- Zhu, Y.; Fu, Z.; Fei, J. An image augmentation method using convolutional network for thyroid nodule classification by transfer learning. In Proceedings of the 3rd IEEE International Conference on Computer and Communication, Chengdu, China, 13–16 December 2017; pp. 1819–1823. [Google Scholar]
- Sudarshan, V.K.; Mookiah, M.R.K.; Acharya, U.R.; Chandran, V.; Molinari, F.; Fujita, H.; Ng, K.H. Application of wavelet techniques for cancer diagnosis using ultrasound images: A review. Comput. Biol. Med. 2016, 69, 97–111. [Google Scholar] [CrossRef]
- Chi, J.; Walia, E.; Babyn, P.; Wang, J.; Groot, G.; Eramian, M. Thyroid nodule classification in ultrasound images by fine-tuning deep convolutional neural network. J. Digit. Imaging 2017, 30, 477–486. [Google Scholar] [CrossRef] [PubMed]
- Chang, C.-Y.; Chen, S.-J.; Tsai, M.-F. Application of support-vector-machine-based method for feature selection and classification of thyroid nodules in ultrasound images. Pattern Recognit. 2010, 43, 3494–3506. [Google Scholar] [CrossRef]
- Luo, S.; Kim, E.H.; Dighe, M.; Kim, Y. Thyroid nodule classification using ultrasound elastography via linear discriminant analysis. Ultrasonics 2011, 51, 425–431. [Google Scholar] [CrossRef] [PubMed]
- Ouyang, F.-S.; Guo, B.-L.; Ouyang, L.-Z.; Liu, Z.-W.; Lin, Z.-W.; Meng, W.; Huang, X.-Y.; Chen, H.-X.; Hu, Q.-G.; Yang, S.-M. Comparison between linear and nonlinear machine-learning algorithms for the classification of thyroid nodule. Eur. J. Radiol. 2019, 113, 251–257. [Google Scholar] [CrossRef] [PubMed]
- Song, W.; Li, S.; Liu, J.; Qin, H.; Zhang, B.; Zhang, S.; Hao, A. Multitask cascade convolution neural networks for automatic thyroid nodule detection and recognition. IEEE J. Biomed. Health Inform. 2019, 23, 1215–1224. [Google Scholar] [CrossRef]
- Sundar, K.V.S.; Rajamani, K.T.; Sai, S.-S.S. Exploring image classification of thyroid ultrasound images using deep learning. In Proceedings of the International Conference on ISMAC in Computational Vision and Bio-Engineering, Palladam, India, 16–17 May 2018; pp. 1635–1641. [Google Scholar]
- Song, J.; Chai, Y.J.; Masuoka, H.; Park, S.-W.; Kim, S.-J.; Choi, J.Y.; Kong, H.-J.; Lee, K.E.; Lee, J.; Kwak, N.; et al. Ultrasound image analysis using deep learning algorithm for the diagnosis of thyroid nodules. Medicine 2019, 98, e15133. [Google Scholar] [CrossRef]
- Wang, L.; Yang, S.; Yang, S.; Zhao, C.; Tian, G.; Gao, Y.; Chen, Y.; Lu, Y. Automatic thyroid nodule recognition and diagnosis in ultrasound imaging with the Yolov2 neural network. World, J. Surg. Oncol. 2019, 17, 12. [Google Scholar] [CrossRef]
- Raghavendra, U.; Acharya, U.R.; Gudigar, A.; Tan, J.H.; Fujita, H.; Hagiwara, Y.; Molinari, F.; Kongmebol, P.; Ng, K.H. Fusion of spatial gray level dependency and fractal texture features for the characterization of thyroid lessons. Ultrasonics 2017, 77, 110–120. [Google Scholar] [CrossRef]
- Xia, J.; Chen, H.; Li, Q.; Zhou, M.; Chen, L.; Cai, Z.; Fang, Y.; Zhou, H. Ultrasound-based differentiation of malignant and benign thyroid nodules: An extreme learning machine approach. Comput. Methods Programs Biomed. 2017, 147, 37–49. [Google Scholar] [CrossRef]
- Choi, W.J.; Park, J.S.; Kim, K.G.; Kim, S.-Y.; Koo, H.R.; Lee, Y.-J. Computerized analysis of calcification of thyroid nodules as visualized by ultrasonography. Eur. J. Radiol. 2015, 84, 1949–1953. [Google Scholar] [CrossRef]
- Prochazka, A.; Gulati, S.; Holinka, S.; Smutek, D. Path-based classification of thyroid nodules in ultrasound images using direction independent features extracted by two-threshold binary decomposition. Comput. Med. Imaging Graph. 2019, 71, 9–18. [Google Scholar] [CrossRef] [PubMed]
- Acharya, U.R.; Chowriappa, P.; Fujita, H.; Bhat, S.; Dua, S.; Koh, J.E.W.; Eugence, J.W.J.; Kongmebhol, P.; Ng, K.H. Thyroid lesion classification in 242 patient population using Gabor transform features from high resolution ultrasound images. Knowl. Based Syst. 2016, 107, 235–245. [Google Scholar] [CrossRef]
- Nguyen, D.T.; Pham, D.T.; Batchuluun, G.; Yoon, H.S.; Park, K.R. Artificial intelligence-based thyroid nodule classification using information from spatial and frequency domains. J. Clin. Med. 2019, 8, 1976. [Google Scholar] [CrossRef] [PubMed]
- Enhanced Ultrasound Thyroid Nodule Classification (US-TNC-V2) Algorithm. Available online: http://dm.dongguk.edu/link.html (accessed on 28 December 2019).
- Otsu, N. A threshold selection method from gray-level histogram. IEEE Trans. Syst. Man Cybern. 1979, 9, 62–66. [Google Scholar] [CrossRef]
- Krizhevsky, A.; Sutskever, I.; Hinton, G.E. ImageNet classification with deep convolutional neural networks. In Proceedings of the Neural Information Processing Systems, Lake Tahoe, NV, USA, 3–8 December 2012; pp. 1097–1105. [Google Scholar]
- Simonyan, K.; Zisserman, A. Very deep convolutional neural networks for large-scale image recognition. arXiv 2014, arXiv:1409.1556. Available online: https://arxiv.org/abs/1409.1556v6 (accessed on 20 September 2019).
- He, K.; Zhang, X.; Ren, S.; Sun, J. Deep residual learning for image recognition. arXiv 2015, arXiv:1512.03385. Available online: https://arxiv.org/abs/1512.03385v1 (accessed on 20 September 2019).
- Szegedy, C.; Liu, W.; Jia, Y.; Sermanet, P.; Reed, S.; Anguelov, D.; Erhan, D.; Vanhoucke, V.; Rabinovich, A. Going deeper with convolutions. arXiv 2014, arXiv:1409.4842v1. Available online: https://arxiv.org/abs/1409.4842v1 (accessed on 20 September 2019).
- Srivastava, N.; Hinton, G.; Krizhevsky, A.; Sutskever, I.; Salakhutdinov, R. Dropout: A simple way to prevent neural networks from overfitting. J. Mach. Learn. Res. 2014, 15, 1929–1958. [Google Scholar]
- Ren, S.; He, K.; Girshick, R.; Sun, J. Faster R-CNN: Towards real-time object detection with region proposal networks. arXiv 2015, arXiv:1506.01497. Available online: https://arxiv.org/abs/1506.01497 (accessed on 20 September 2019). [CrossRef]
- Redmon, J.; Farhadi, A. YOLOv3: An incremental improvement. arXiv 2018, arXiv:1804.02767. Available online: https://arxiv.org/abs/1804.02767 (accessed on 20 September 2019).
- Chu, M.P.; Sung, Y.; Cho, K. Generative adversarial network-based method for transforming single RGB image into 3D point cloud. IEEE Access 2018, 7, 1021–1029. [Google Scholar] [CrossRef]
- Nguyen, D.T.; Yoon, H.S.; Pham, D.T.; Park, K.R. Spoof detection for finger-vein recognition system using NIR camera. Sensors 2017, 17, 2261. [Google Scholar] [CrossRef]
- Nguyen, D.T.; Pham, D.T.; Lee, M.B.; Park, K.R. Visible-light camera sensor-based presentation attack detection for face recognition by combining spatial and temporal information. Sensors 2019, 19, 410. [Google Scholar] [CrossRef] [PubMed]
- Young, T.; Hazarika, D.; Poria, S.; Cambria, E. Recent trends in deep learning based natural language processing. arXiv 2017, arXiv:1708.02709. Available online: https://arxiv.org/abs/1708.02709 (accessed on 20 December 2019).
- Otter, D.W.; Medina, J.R.; Kalita, J.K. A survey of the usages of deep learning in natural language processing. arXiv 2018, arXiv:1807.10854. Available online: https://arxiv.org/abs/1807.10854 (accessed on 20 December 2019).
- Islam, M.R. Feature and score fusion based multiple classifier selection for iris recognition. Comput. Intell. Neurosci. 2014, 380585. [Google Scholar] [CrossRef]
- Vishi, K.; Mavroeidis, V. An evaluation of score level fusion approaches for fingerprint and finger-vein biometrics. arXiv 2018, arXiv:1805.10666. Available online: https://arxiv.org/abs/1805.10666 (accessed on 9 March 2020).
- Nguyen, D.T.; Park, Y.H.; Lee, H.C.; Shin, K.Y.; Kang, B.J.; Park, K.R. Combining touched fingerprint and finger-vein of a finger, and its usability evaluation. Adv. Sci. Lett. 2012, 85–95. [Google Scholar] [CrossRef]
- Baloch, B.K.; Kumar, S.; Haresh, S.; Rehman, A.; Syed, T. Focused anchors loss: Cost-sensitive learning of discriminative features for imbalanced classification. In Proceedings of the machine learning research, Nagoya, Japan, 17–19 November 2019; pp. 822–835. [Google Scholar]
- Lin, T.-Y.; Goyal, P.; Girshick, R.; He, K.; Dollar, P. Focal loss for dense object detection. arXiv 2017, arXiv:1708.02002. Available online: https://arxiv.org/abs/1708.02002 (accessed on 9 March 2020).
- Cui, Y.; Jia, M.; Lin, T.-Y.; Song, Y.; Belongie, S. Class-balanced loss based on effective number of samples. arXiv 2019, arXiv:1901.05555. Available online: https://arxiv.org/abs/1901.05555 (accessed on 9 March 2020).
- Carvajal, D.N.; Rowe, P.C. Research and statistics: Sensitivity, specificity, predictive values, and likelihood ratios. Pediatr. Rev. 2010, 31, 511–513. [Google Scholar] [CrossRef]
- NVIDIA TitanX GPU. Available online: https://www.nvidia.com/en-us/geforce/products/10series/titan-x-pascal/ (accessed on 20 September 2019).
- Tensorflow Deep-Learning Library. Available online: https://www.tensorflow.org/ (accessed on 20 September 2019).


| Category | Method | Strength | Weakness |
|---|---|---|---|
| Handcrafted-based Methods |
|
|
|
| Deep learning-based methods |
|
| |
| Fusion of deep and handcrafted-based methods |
|
|
|
|
|
|
| Layer | Input Shape | Output Shape | Number of Parameters |
|---|---|---|---|
| Convolution Layers by ResNet-50 Network | (224, 224, 3) | (7, 7, 2048) | 23,587,712 |
| Global Average Pooling | (7, 7, 2048) | 2048 | 0 |
| Batch Normalization | 2048 | 2048 | 8192 |
| Dropout | 2048 | 2048 | 0 |
| Output Layer (Dense layer) | 2048 | 2 | 4098 |
| Layer | Input Shape | Output Shape | Number of Parameters |
|---|---|---|---|
| Convolution Layers by Inception Network | (224, 224, 3) | (5, 5, 2048) | 21,802,784 |
| Global Average Pooling | (5, 5, 2048) | 2048 | 0 |
| Batch Normalization | 2048 | 2048 | 8192 |
| Dropout | 2048 | 2048 | 0 |
| Output Layer (Dense layer) | 2048 | 2 | 4098 |
| Benign Case | Malign Case | Total | ||
|---|---|---|---|---|
| Training Data | Testing Data | Training Data | Testing Data | |
| 41 | 11 | 196 | 50 | 298 |
| Optimizer | Number of Epochs | Batch Size | Initial Learning Rate | Stop Criteria |
|---|---|---|---|---|
| Adam | 30 | 32 | 0.0001 | End of Epochs |
| Method | ResNet50-Based Network | Inception-Based Network | ||||
|---|---|---|---|---|---|---|
| Accuracy | Sensitivity | Specificity | Accuracy | Sensitivity | Specificity | |
| Using BCE [39,40,41,42] | 87.778 | 91.356 | 64.018 | 81.506 | 83.406 | 68.760 |
| Using wBCE (proposed method) | 82.412 | 83.950 | 72.524 | 80.792 | 81.842 | 74.016 |
| Method | MIN Rule | MAX Rule | SUM Rule | ||||||
|---|---|---|---|---|---|---|---|---|---|
| Accuracy | Sensitivity | Specificity | Accuracy | Sensitivity | Specificity | Accuracy | Sensitivity | Specificity | |
| Using BCE [39,40,41,42] | 83.938 | 85.868 | 71.142 | 90.603 | 95.446 | 58.718 | 82.677 | 83.894 | 74.219 |
| Using wBCE (proposed method) | 75.200 | 74.859 | 77.226 | 91.192 | 95.083 | 65.687 | 78.709 | 79.167 | 75.967 |
| Method | MIN Rule | MAX Rule | SUM Rule | ||||||
|---|---|---|---|---|---|---|---|---|---|
| Accuracy | Sensitivity | Specificity | Accuracy | Sensitivity | Specificity | Accuracy | Sensitivity | Specificity | |
| Using BCE [39,40,41,42] | 86.928 | 89.331 | 71.142 | 90.603 | 95.446 | 58.718 | 86.073 | 87.831 | 74.219 |
| Using wBCE (proposed method) | 83.517 | 84.466 | 77.226 | 92.051 | 96.072 | 65.687 | 85.286 | 86.748 | 75.967 |
| Methods | Accuracy | |
|---|---|---|
| Zhu et al. [21] | 84.00 | |
| Chi et al. [23] | 79.36 | |
| Sundar et al. [28] | VGG16 | 77.57 |
| GoogLeNet | 79.36 | |
| Nguyen et al. [36] | 90.88 | |
| Proposed Method | 92.05 | |
| Preprocessing Step. | FFT-Based Classification | ResNet50-Based Classification | Inception-Based Classification | Total |
|---|---|---|---|---|
| 11.646 | 5.093 | 17.525 | 23.178 | 57.442 |
© 2020 by the authors. Licensee MDPI, Basel, Switzerland. This article is an open access article distributed under the terms and conditions of the Creative Commons Attribution (CC BY) license (http://creativecommons.org/licenses/by/4.0/).
Share and Cite
Nguyen, D.T.; Kang, J.K.; Pham, T.D.; Batchuluun, G.; Park, K.R. Ultrasound Image-Based Diagnosis of Malignant Thyroid Nodule Using Artificial Intelligence. Sensors 2020, 20, 1822. https://doi.org/10.3390/s20071822
Nguyen DT, Kang JK, Pham TD, Batchuluun G, Park KR. Ultrasound Image-Based Diagnosis of Malignant Thyroid Nodule Using Artificial Intelligence. Sensors. 2020; 20(7):1822. https://doi.org/10.3390/s20071822
Chicago/Turabian StyleNguyen, Dat Tien, Jin Kyu Kang, Tuyen Danh Pham, Ganbayar Batchuluun, and Kang Ryoung Park. 2020. "Ultrasound Image-Based Diagnosis of Malignant Thyroid Nodule Using Artificial Intelligence" Sensors 20, no. 7: 1822. https://doi.org/10.3390/s20071822
APA StyleNguyen, D. T., Kang, J. K., Pham, T. D., Batchuluun, G., & Park, K. R. (2020). Ultrasound Image-Based Diagnosis of Malignant Thyroid Nodule Using Artificial Intelligence. Sensors, 20(7), 1822. https://doi.org/10.3390/s20071822