Presentation Attack Face Image Generation Based on a Deep Generative Adversarial Network


Abstract
1. Introduction
1.1. Introduction to Face-Based Biometric System
1.2. Problem Definition
- -
- This is the first attempt to generate PA face images based on a deep-learning framework. By learning the characteristics of real and PA images in a training dataset, our method can efficiently generate PA images, which are difficult to collect using conventional image collection methods due to the diversity of attack methods.
- -
- By training our CycleGAN-based generation network using both captured real and PA images, we learn the characteristics of PA images in addition to the fusion of real and PA images. This approach can consequently help to fill the gap of missing PA samples caused by the diversity of attack methods.
- -
- We propose a new measurement method to evaluate the quality of generated images for biometric recognition systems based on the use of a conventional face-PAD system and the dprime measurement.
- -
- The code and pre-trained models for PA image generation are available as a reference to other researchers [16].
2. Related Works
3. Proposed Method
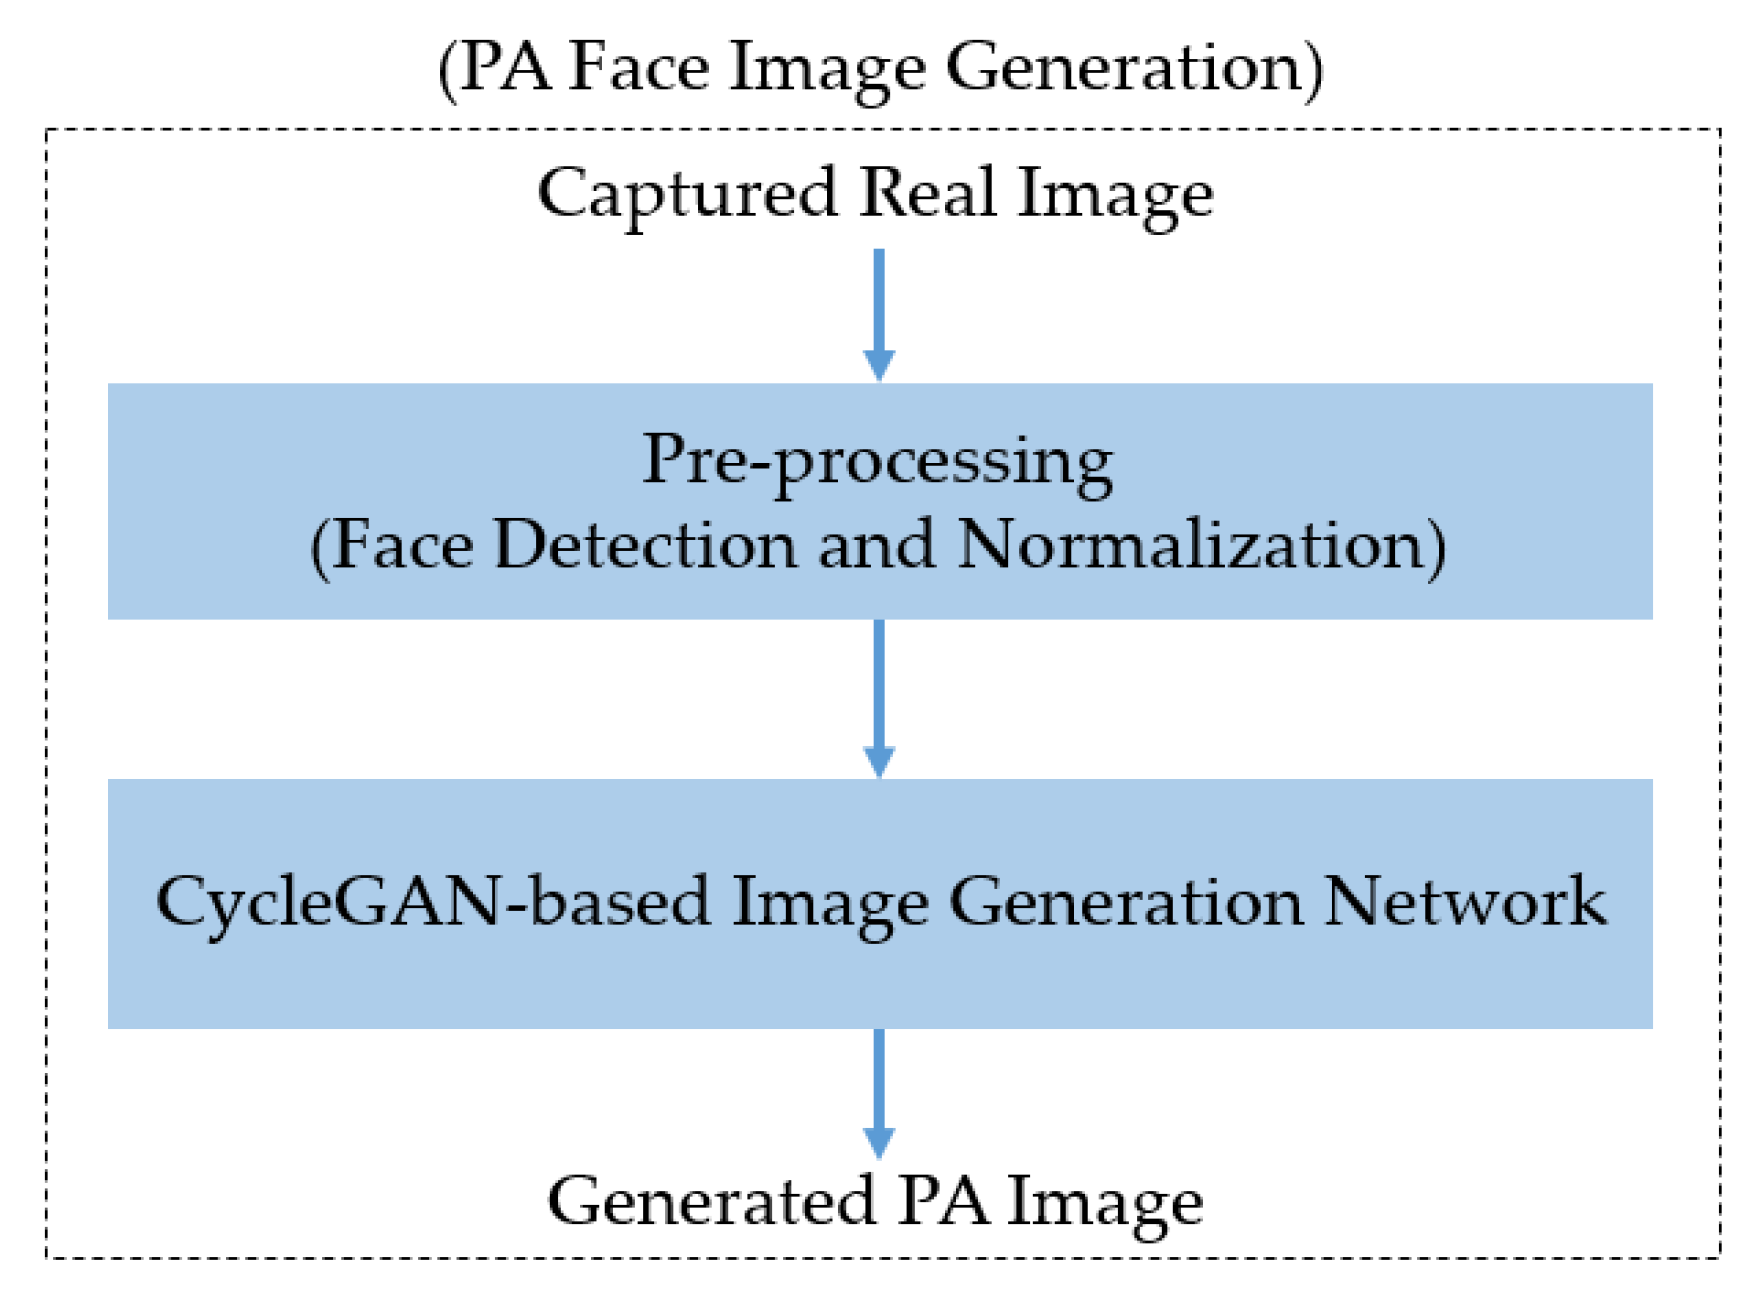
3.1. Overview of the Proposed Method
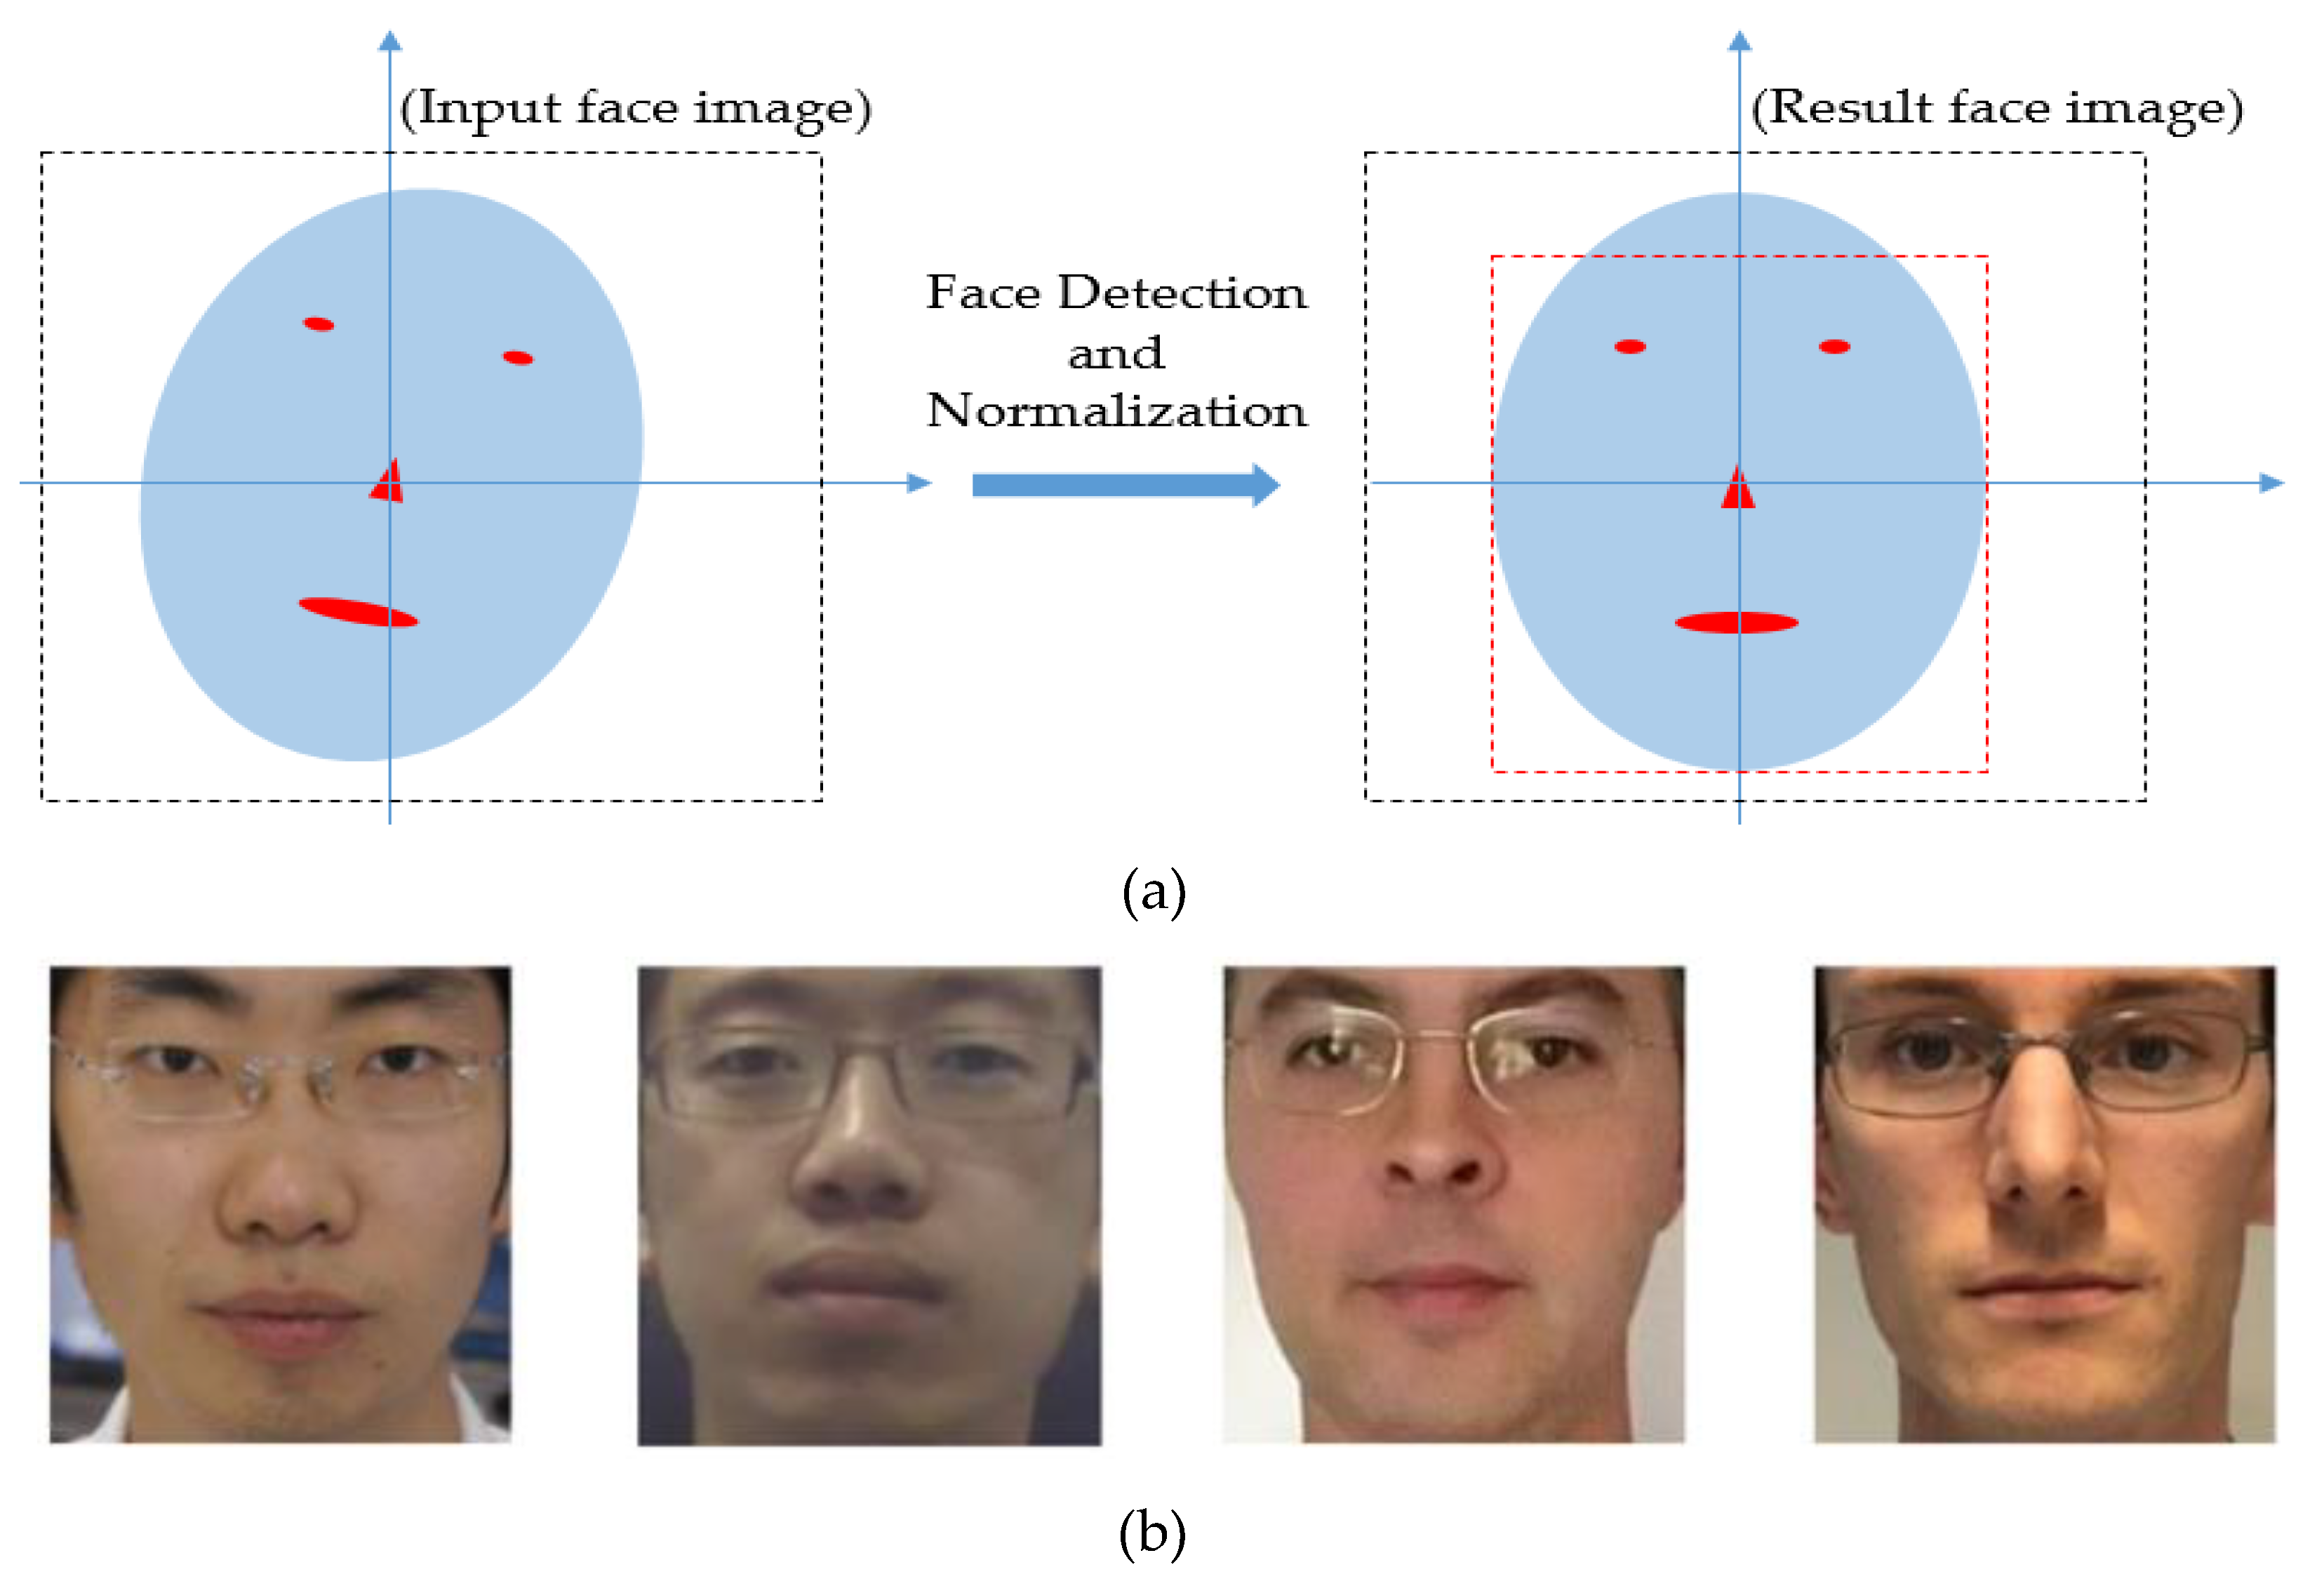
3.2. Face Detection and Normalization
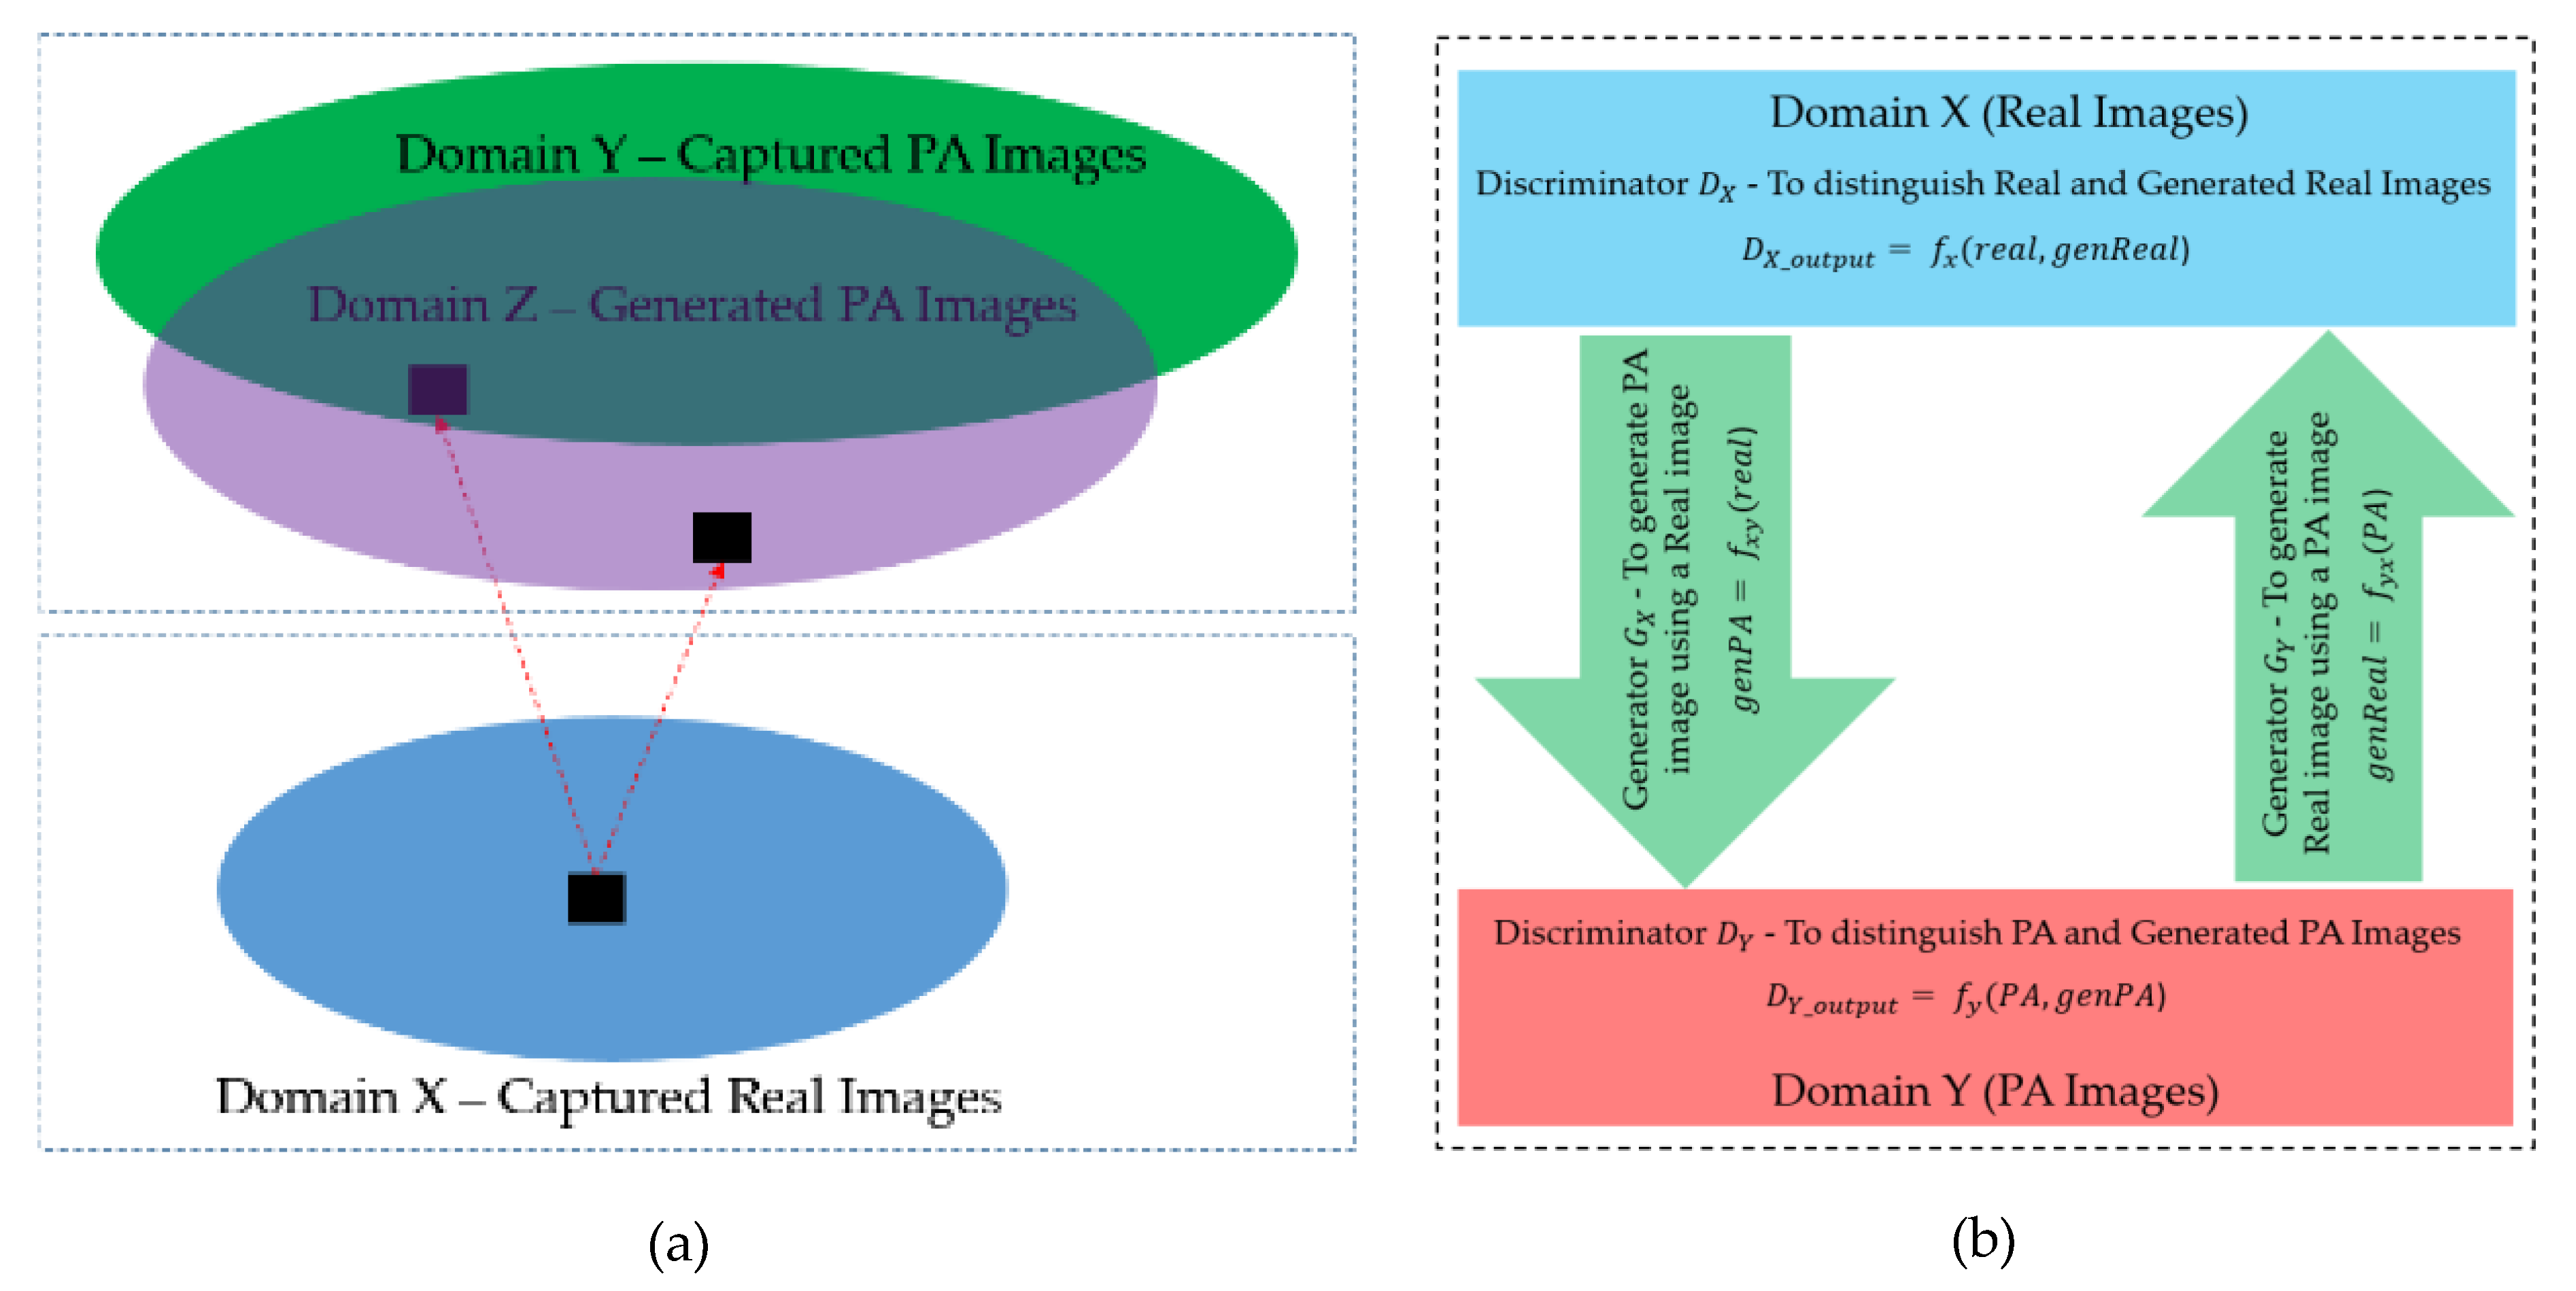
3.3. GAN-Based Image Generation Network
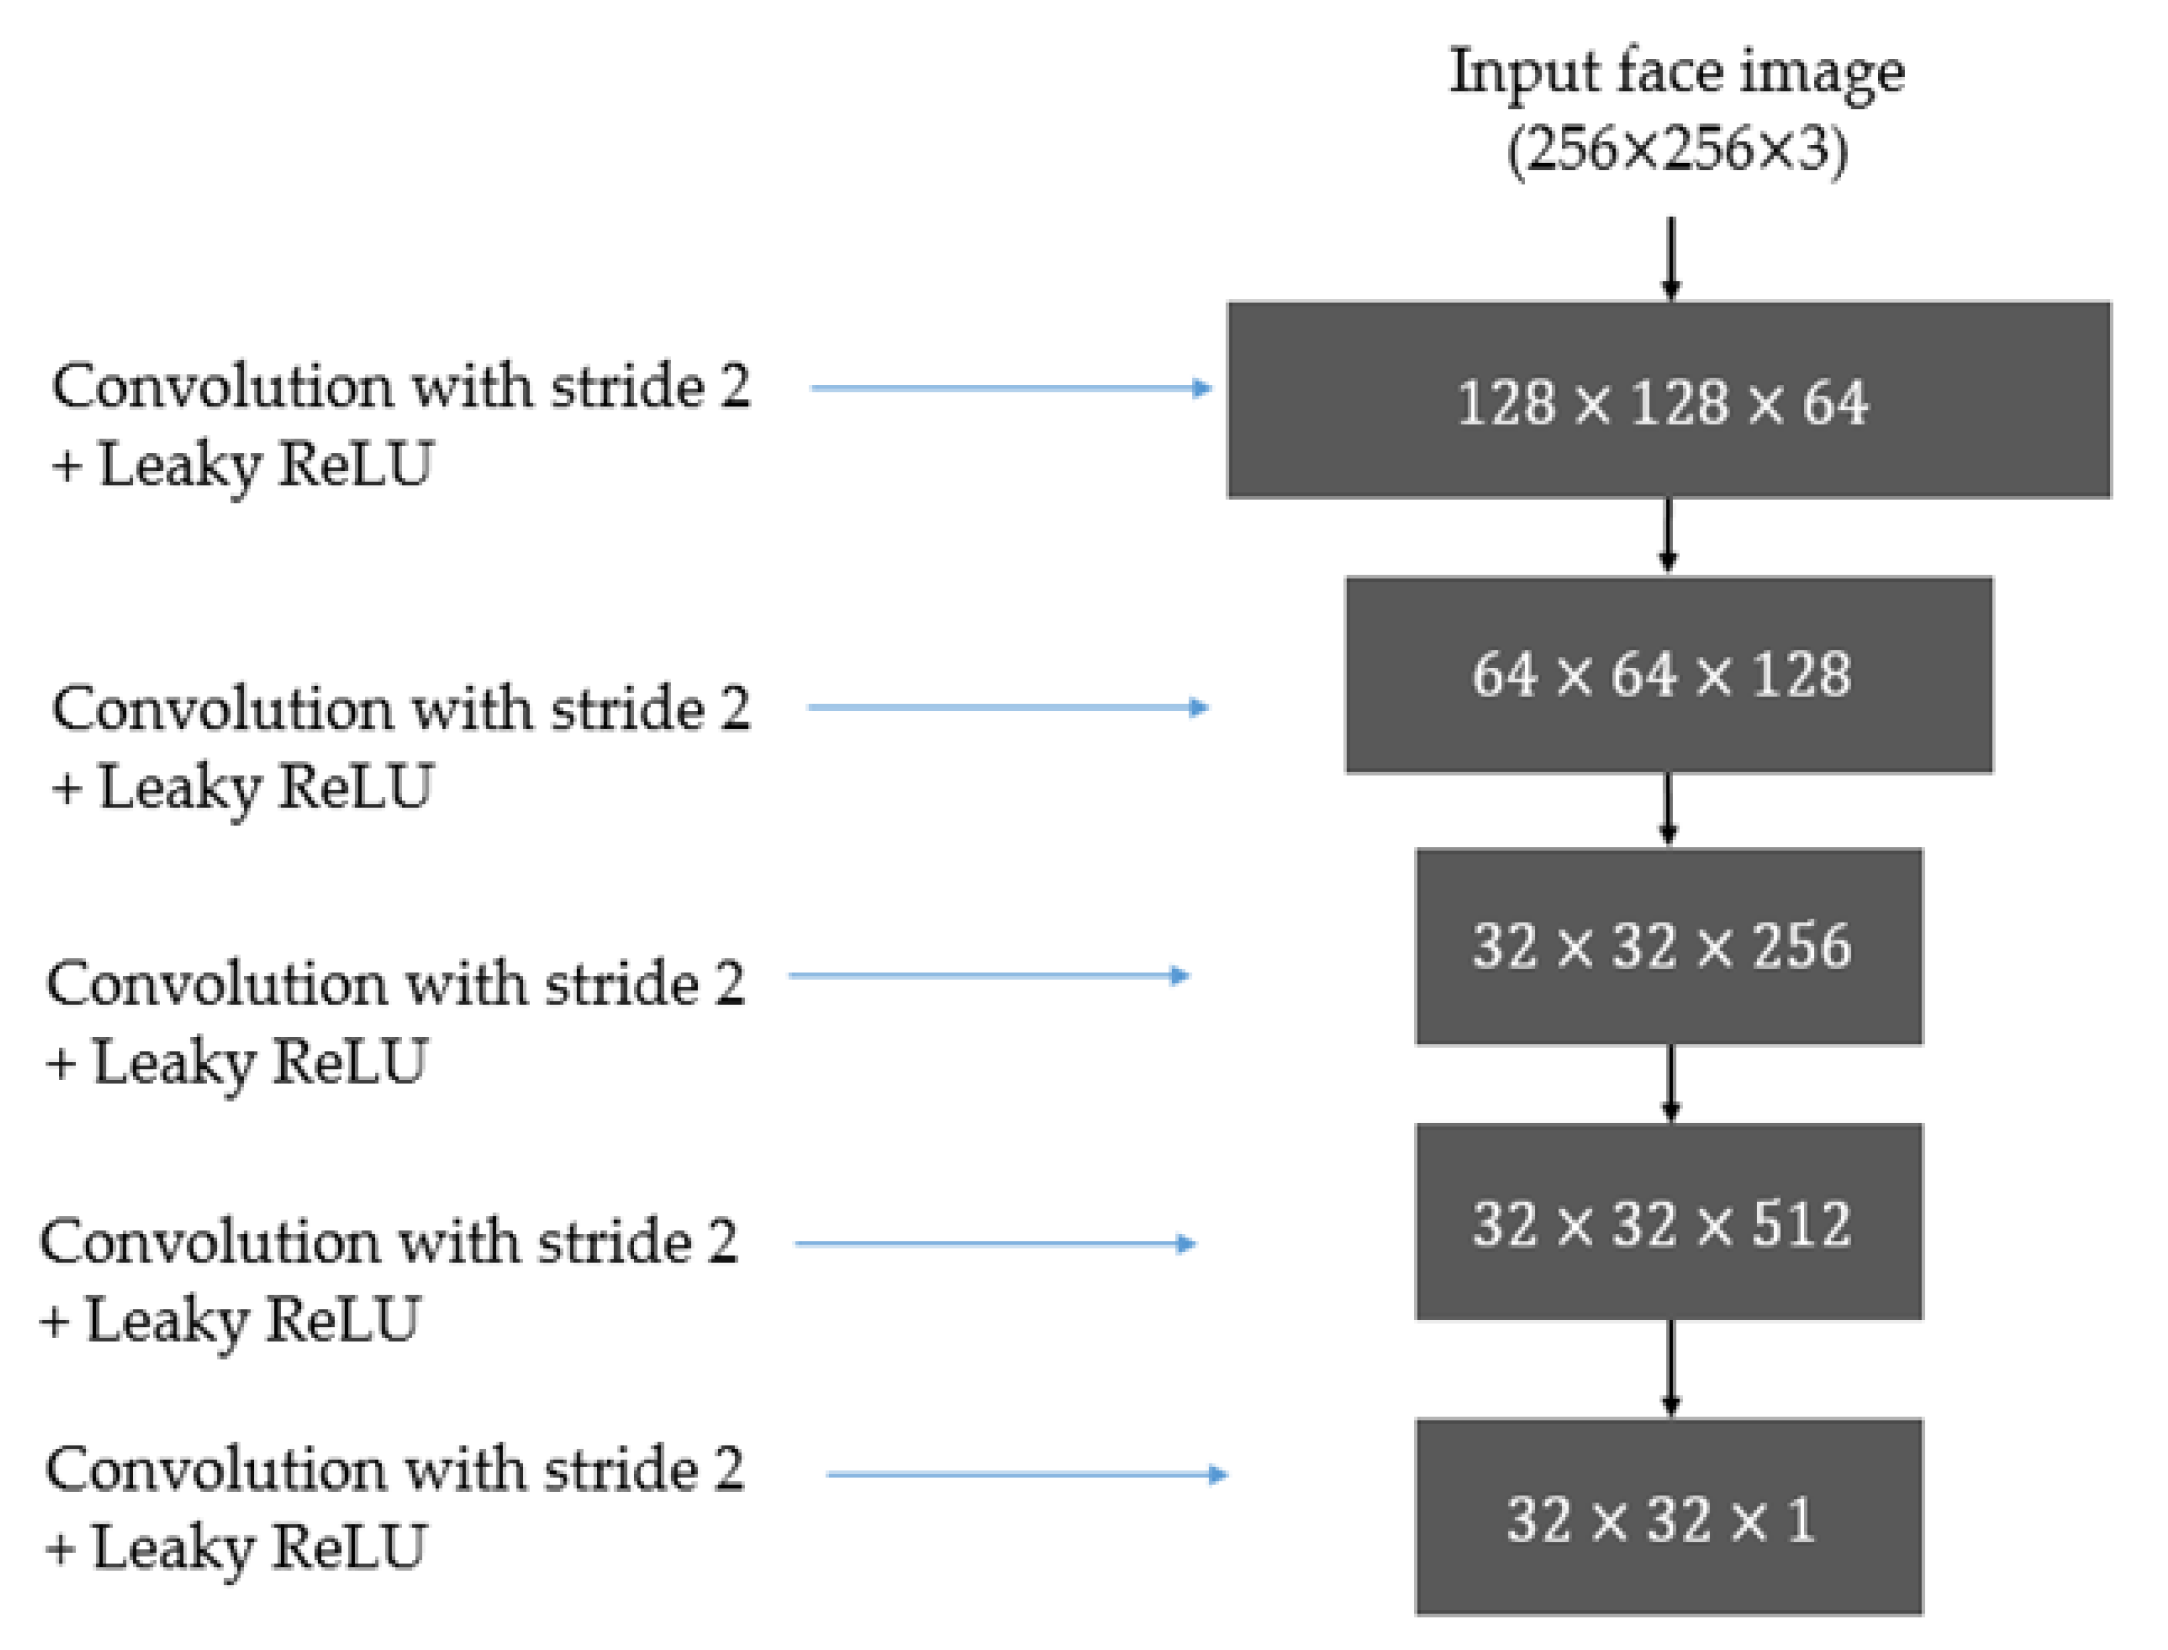
3.3.1. Discriminator Architecture
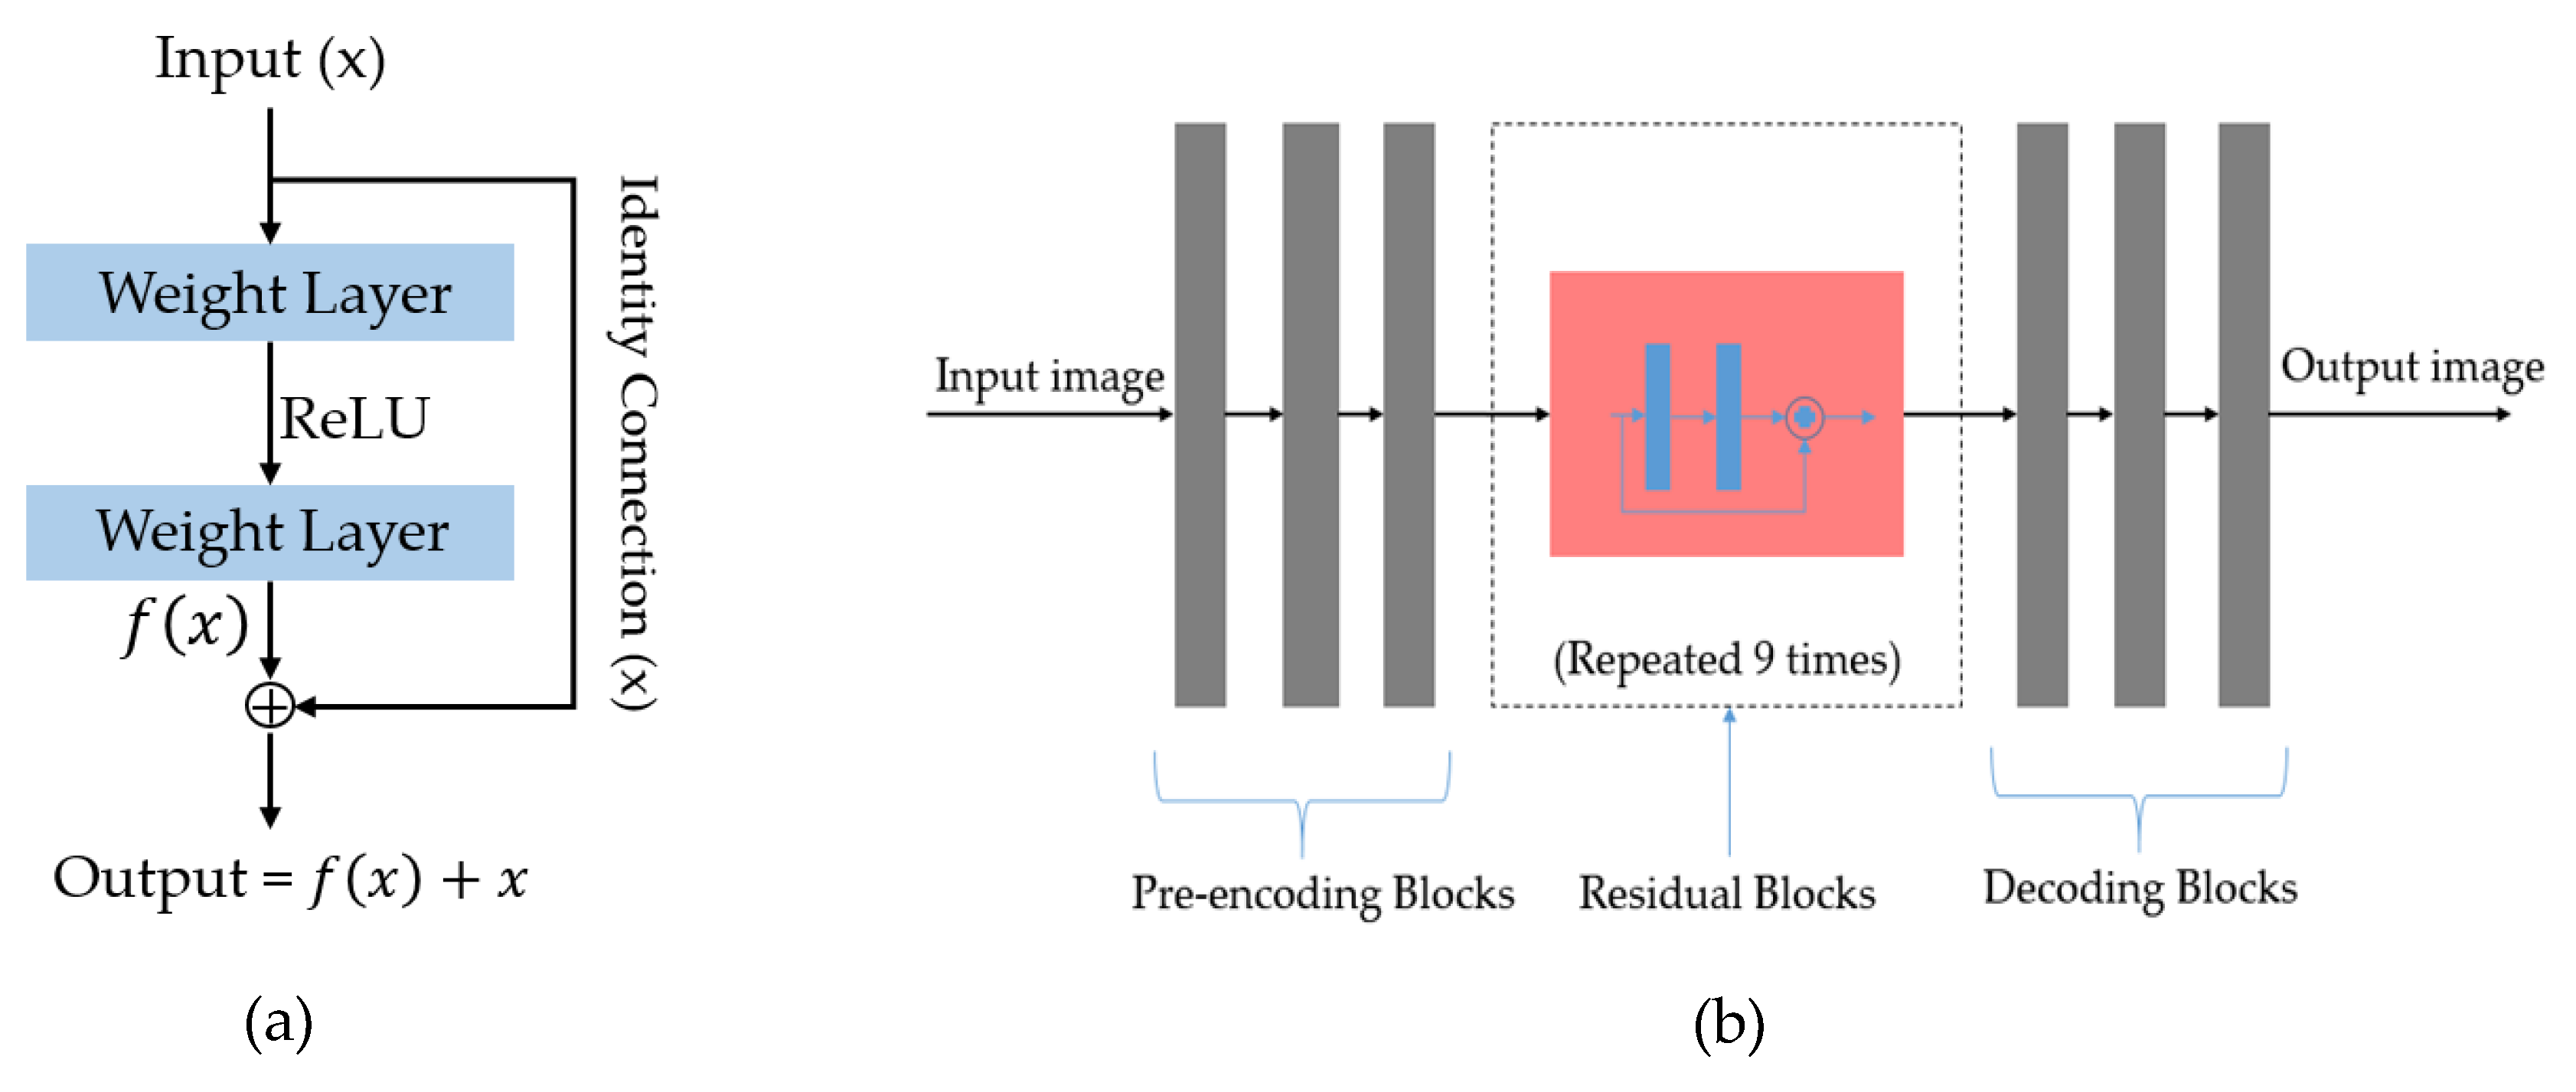
3.3.2. Generator Architecture
3.3.3. Calculation of Loss
4. Experimental Results
4.1. Experimental Setups
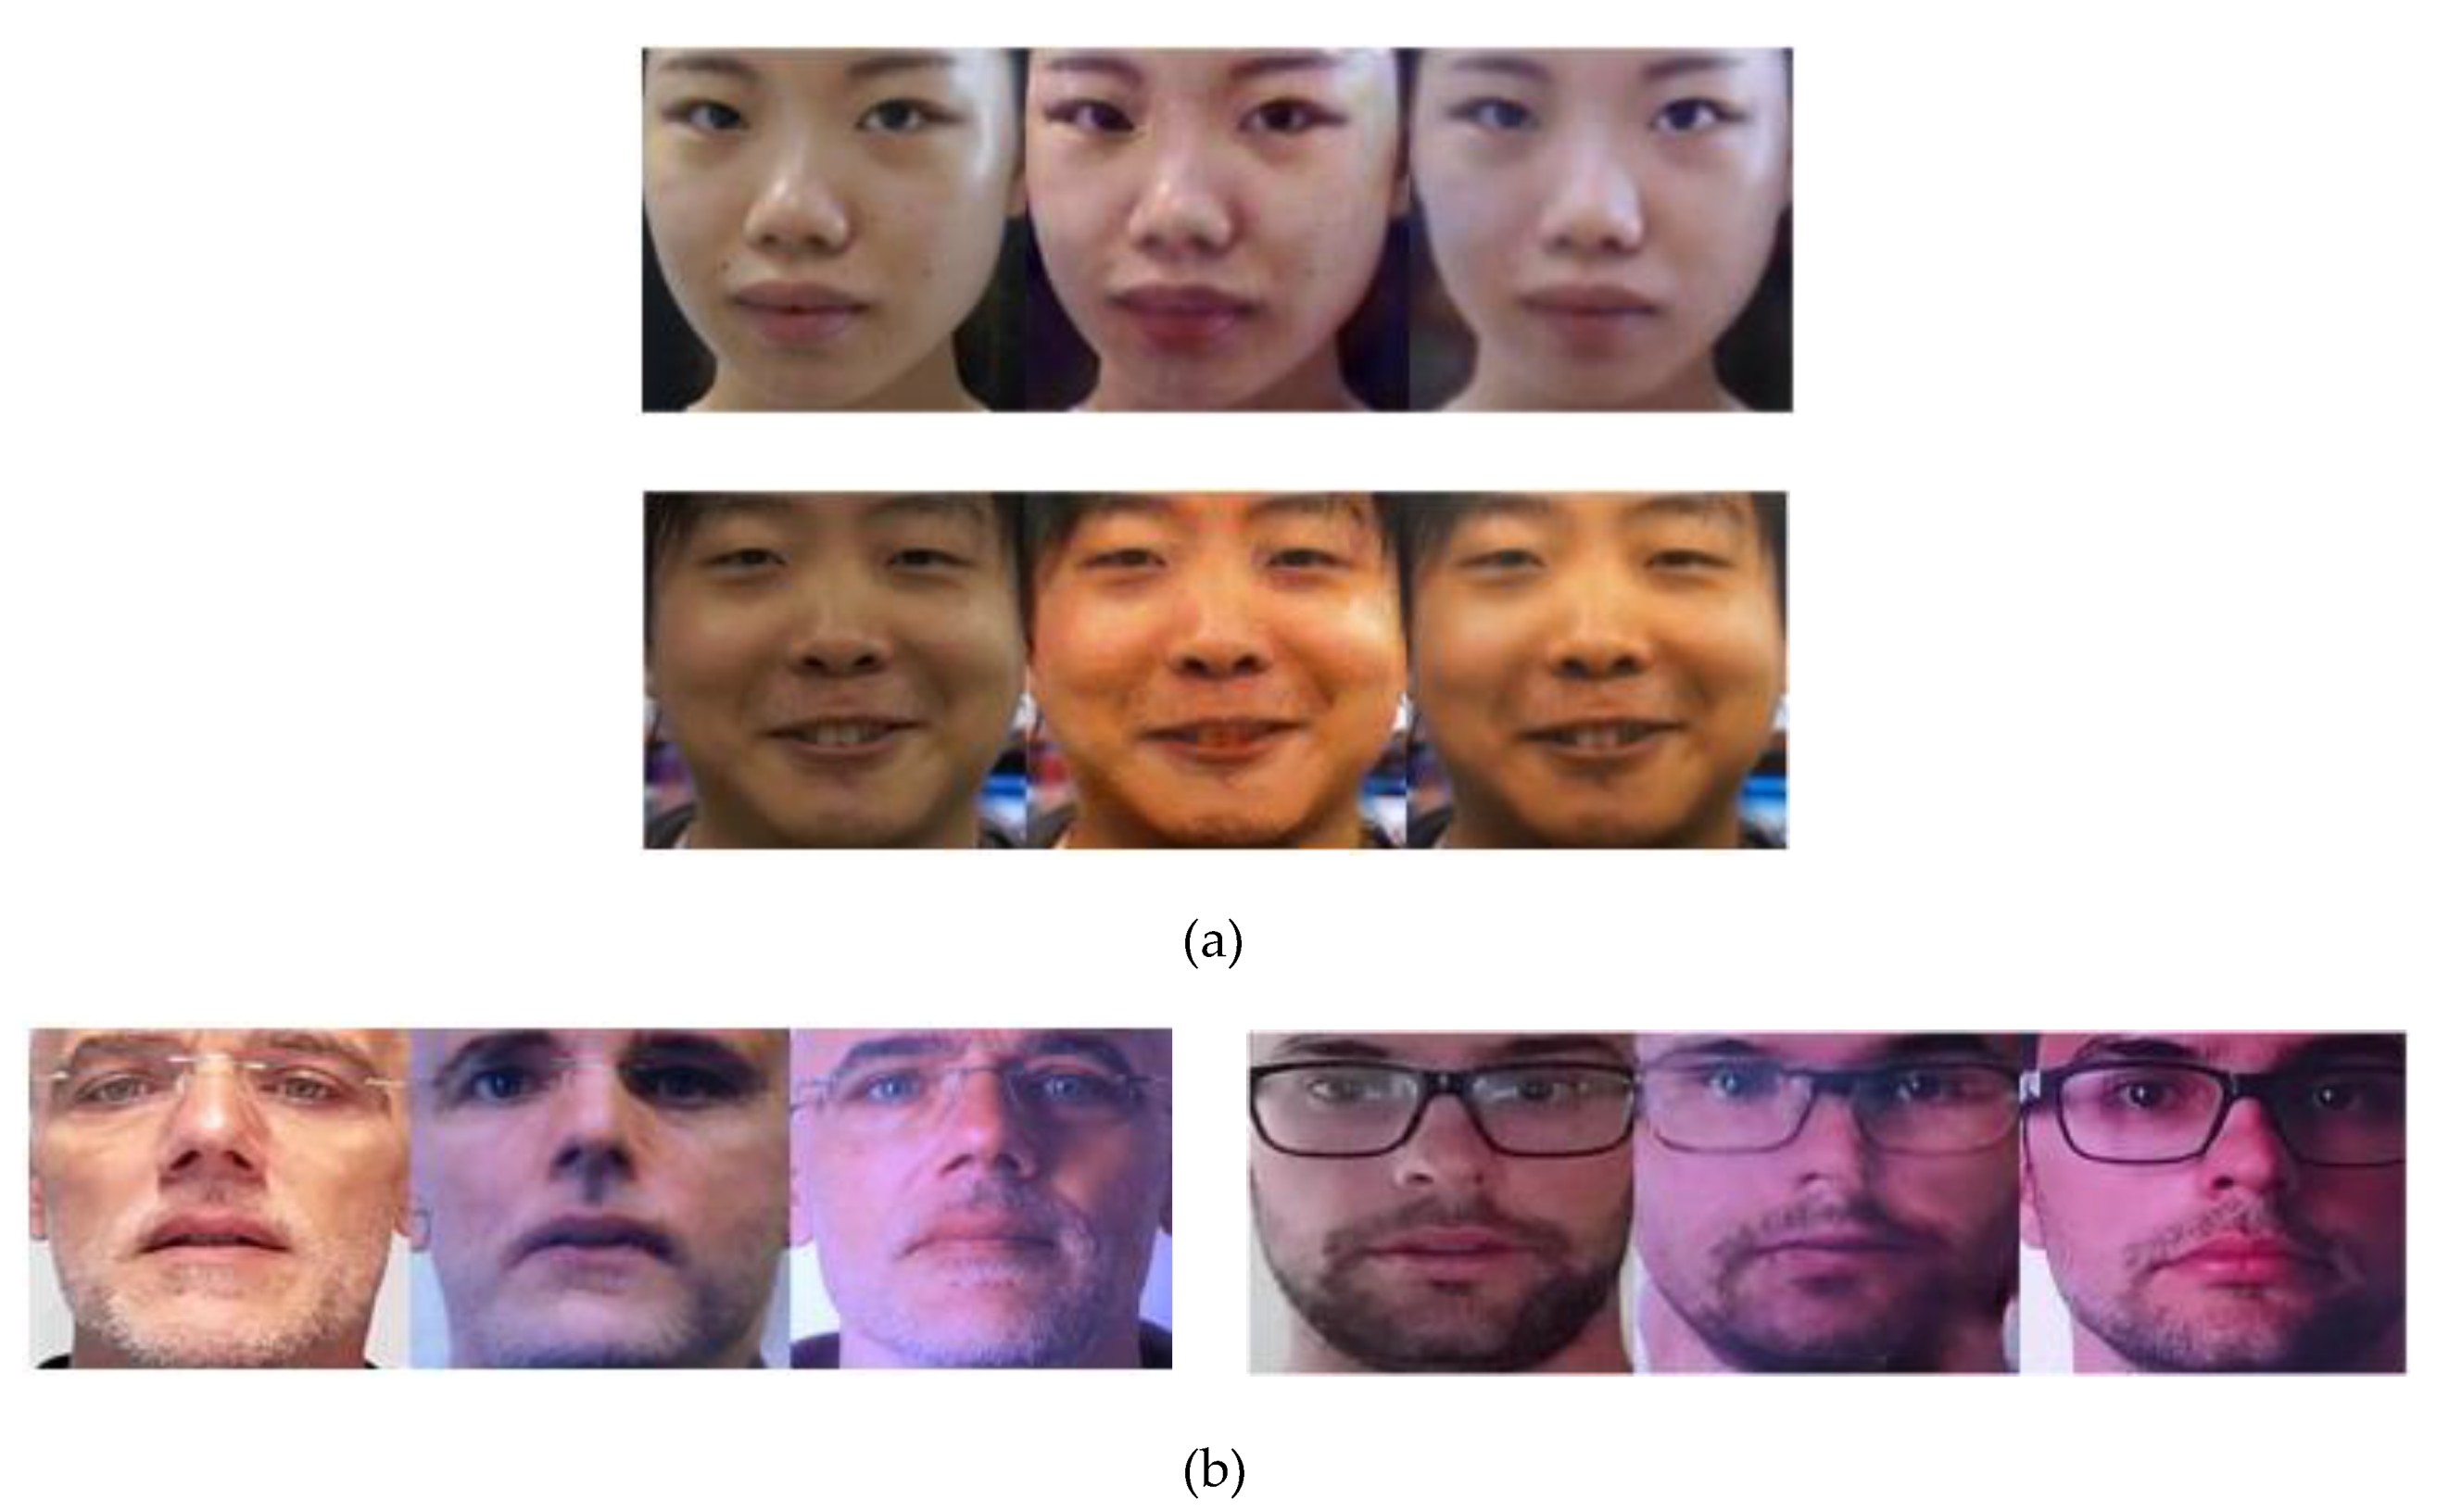
4.2. Results
4.2.1. Quality Assessment of Generated Images Using FID Measurement
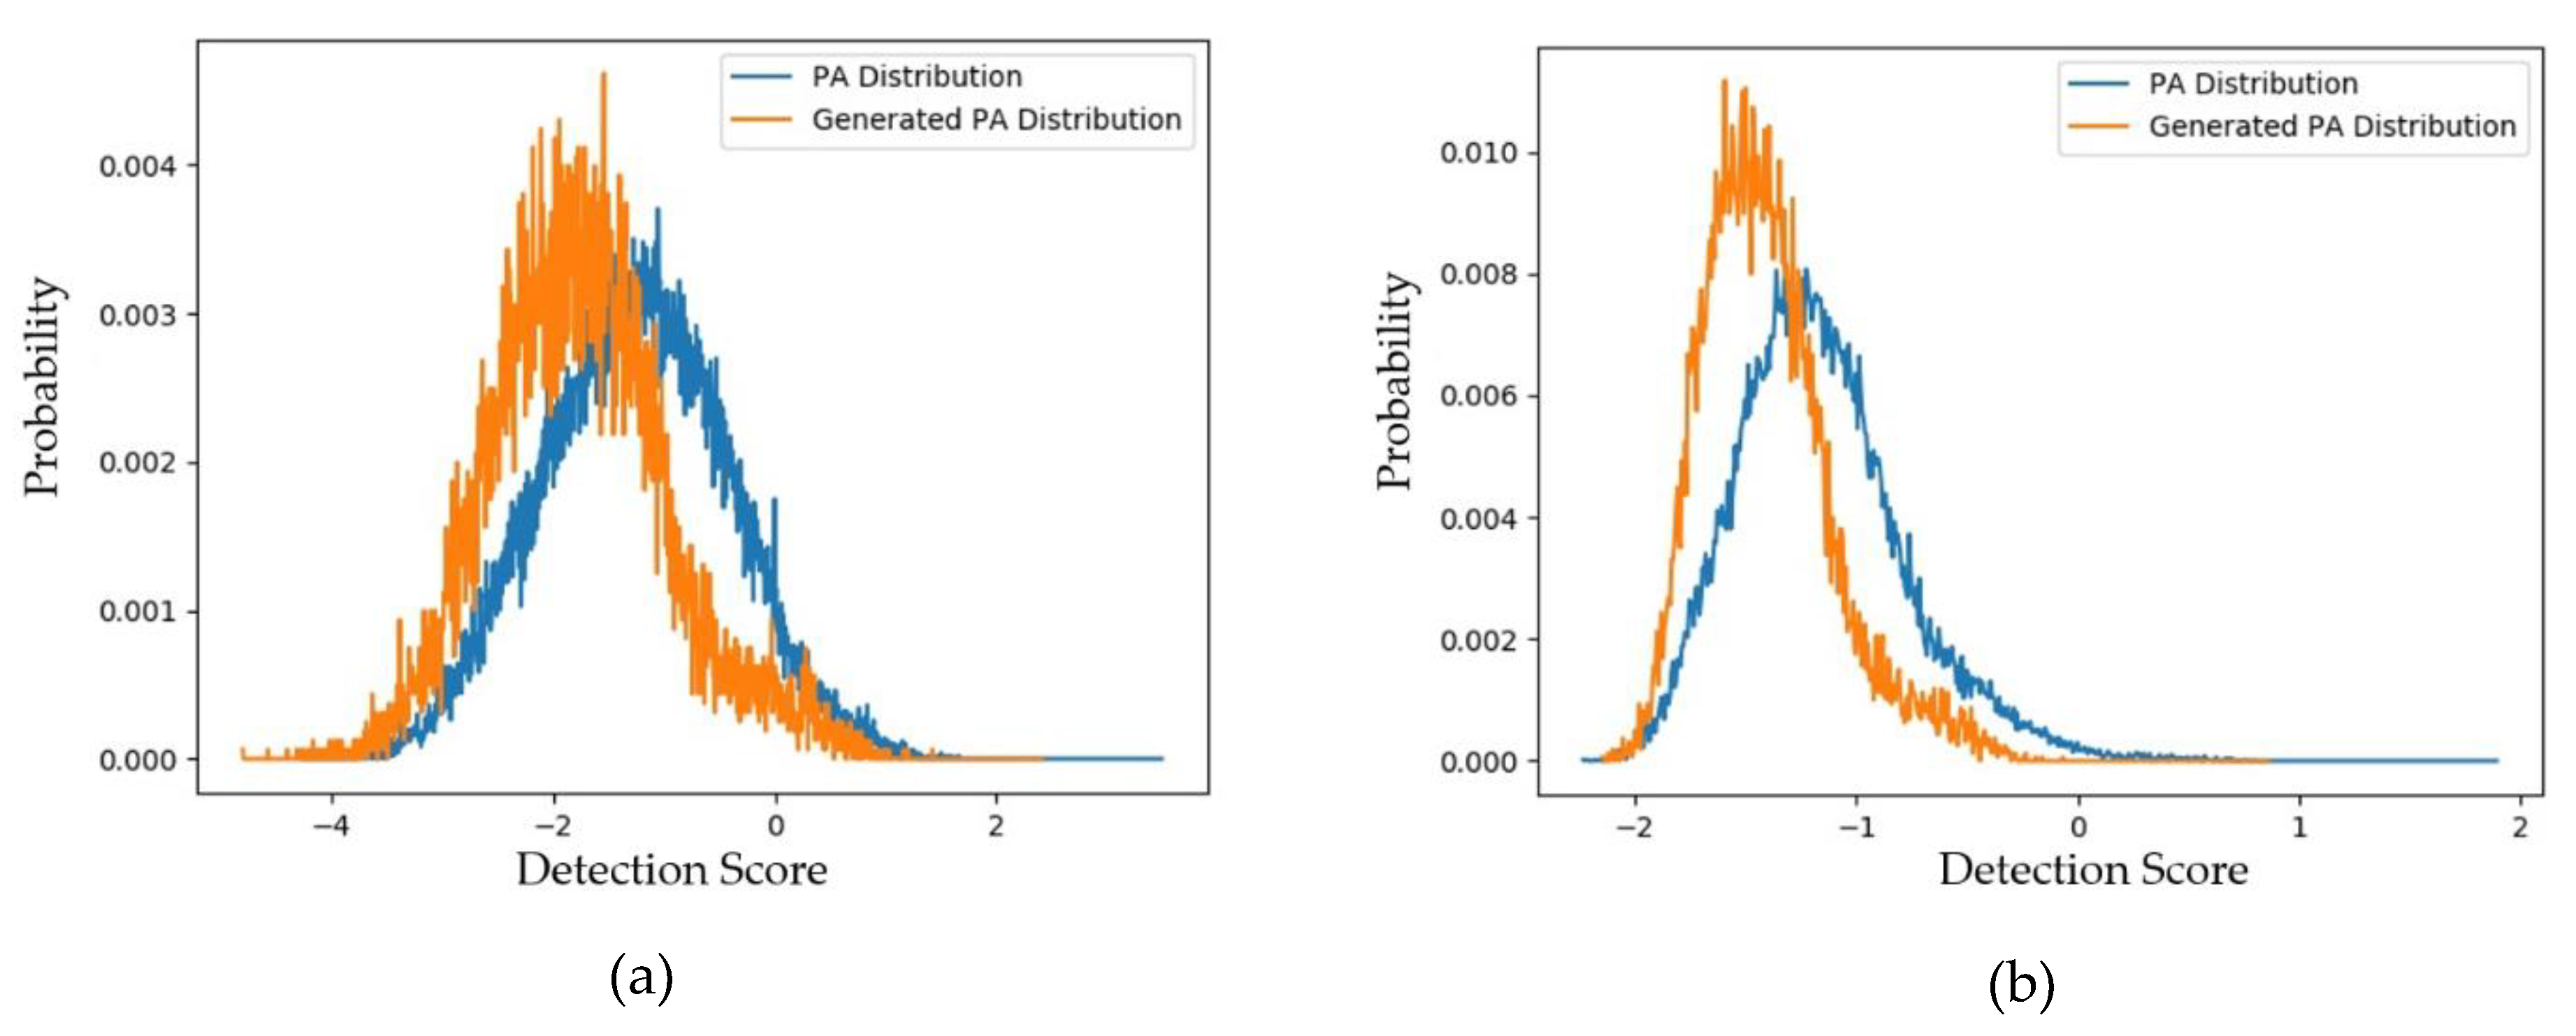
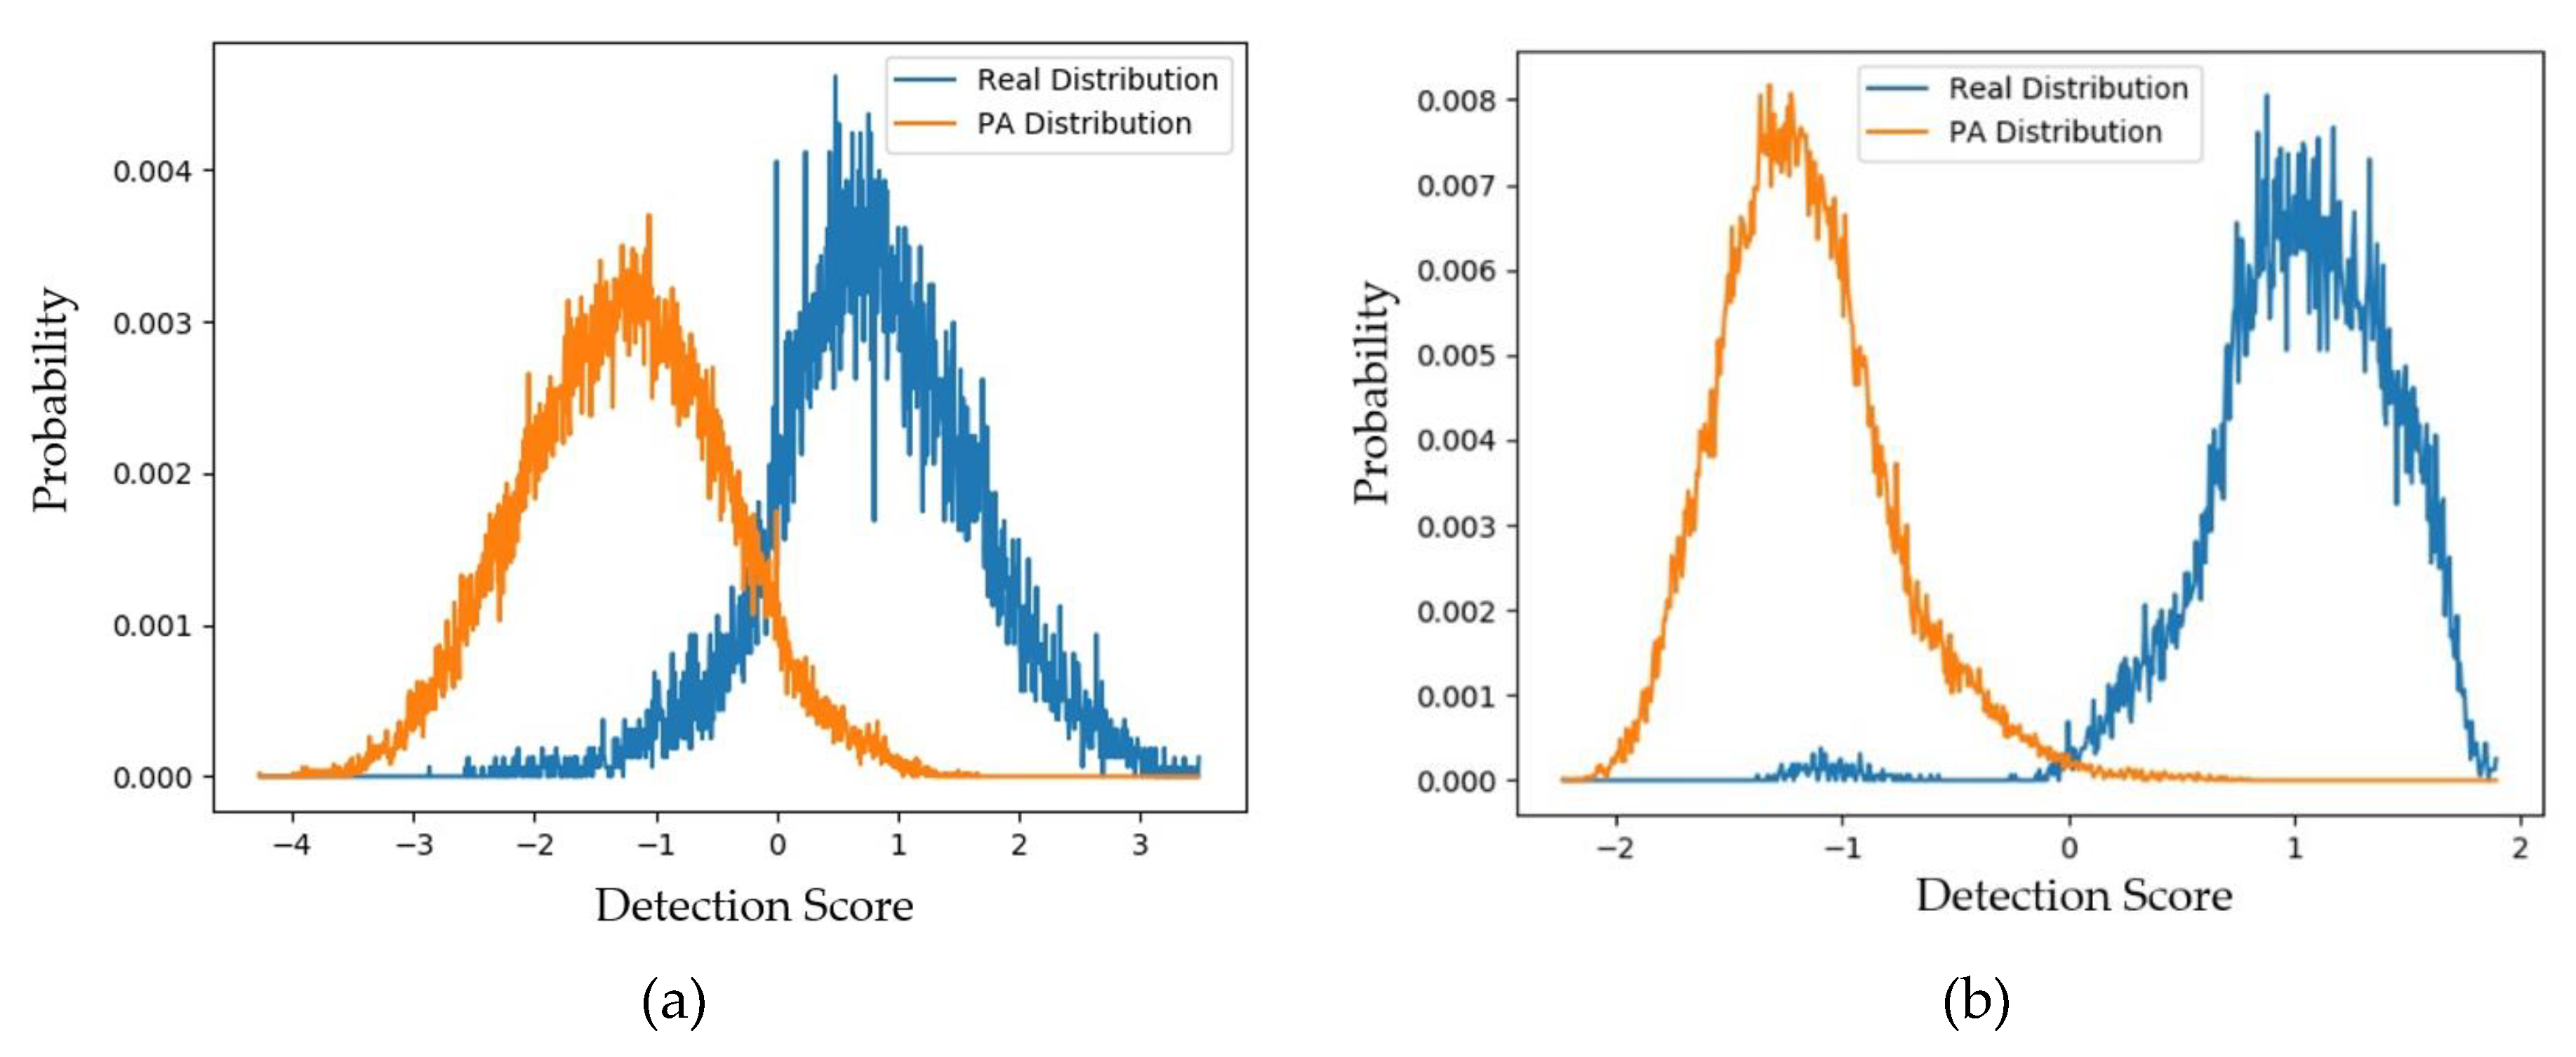
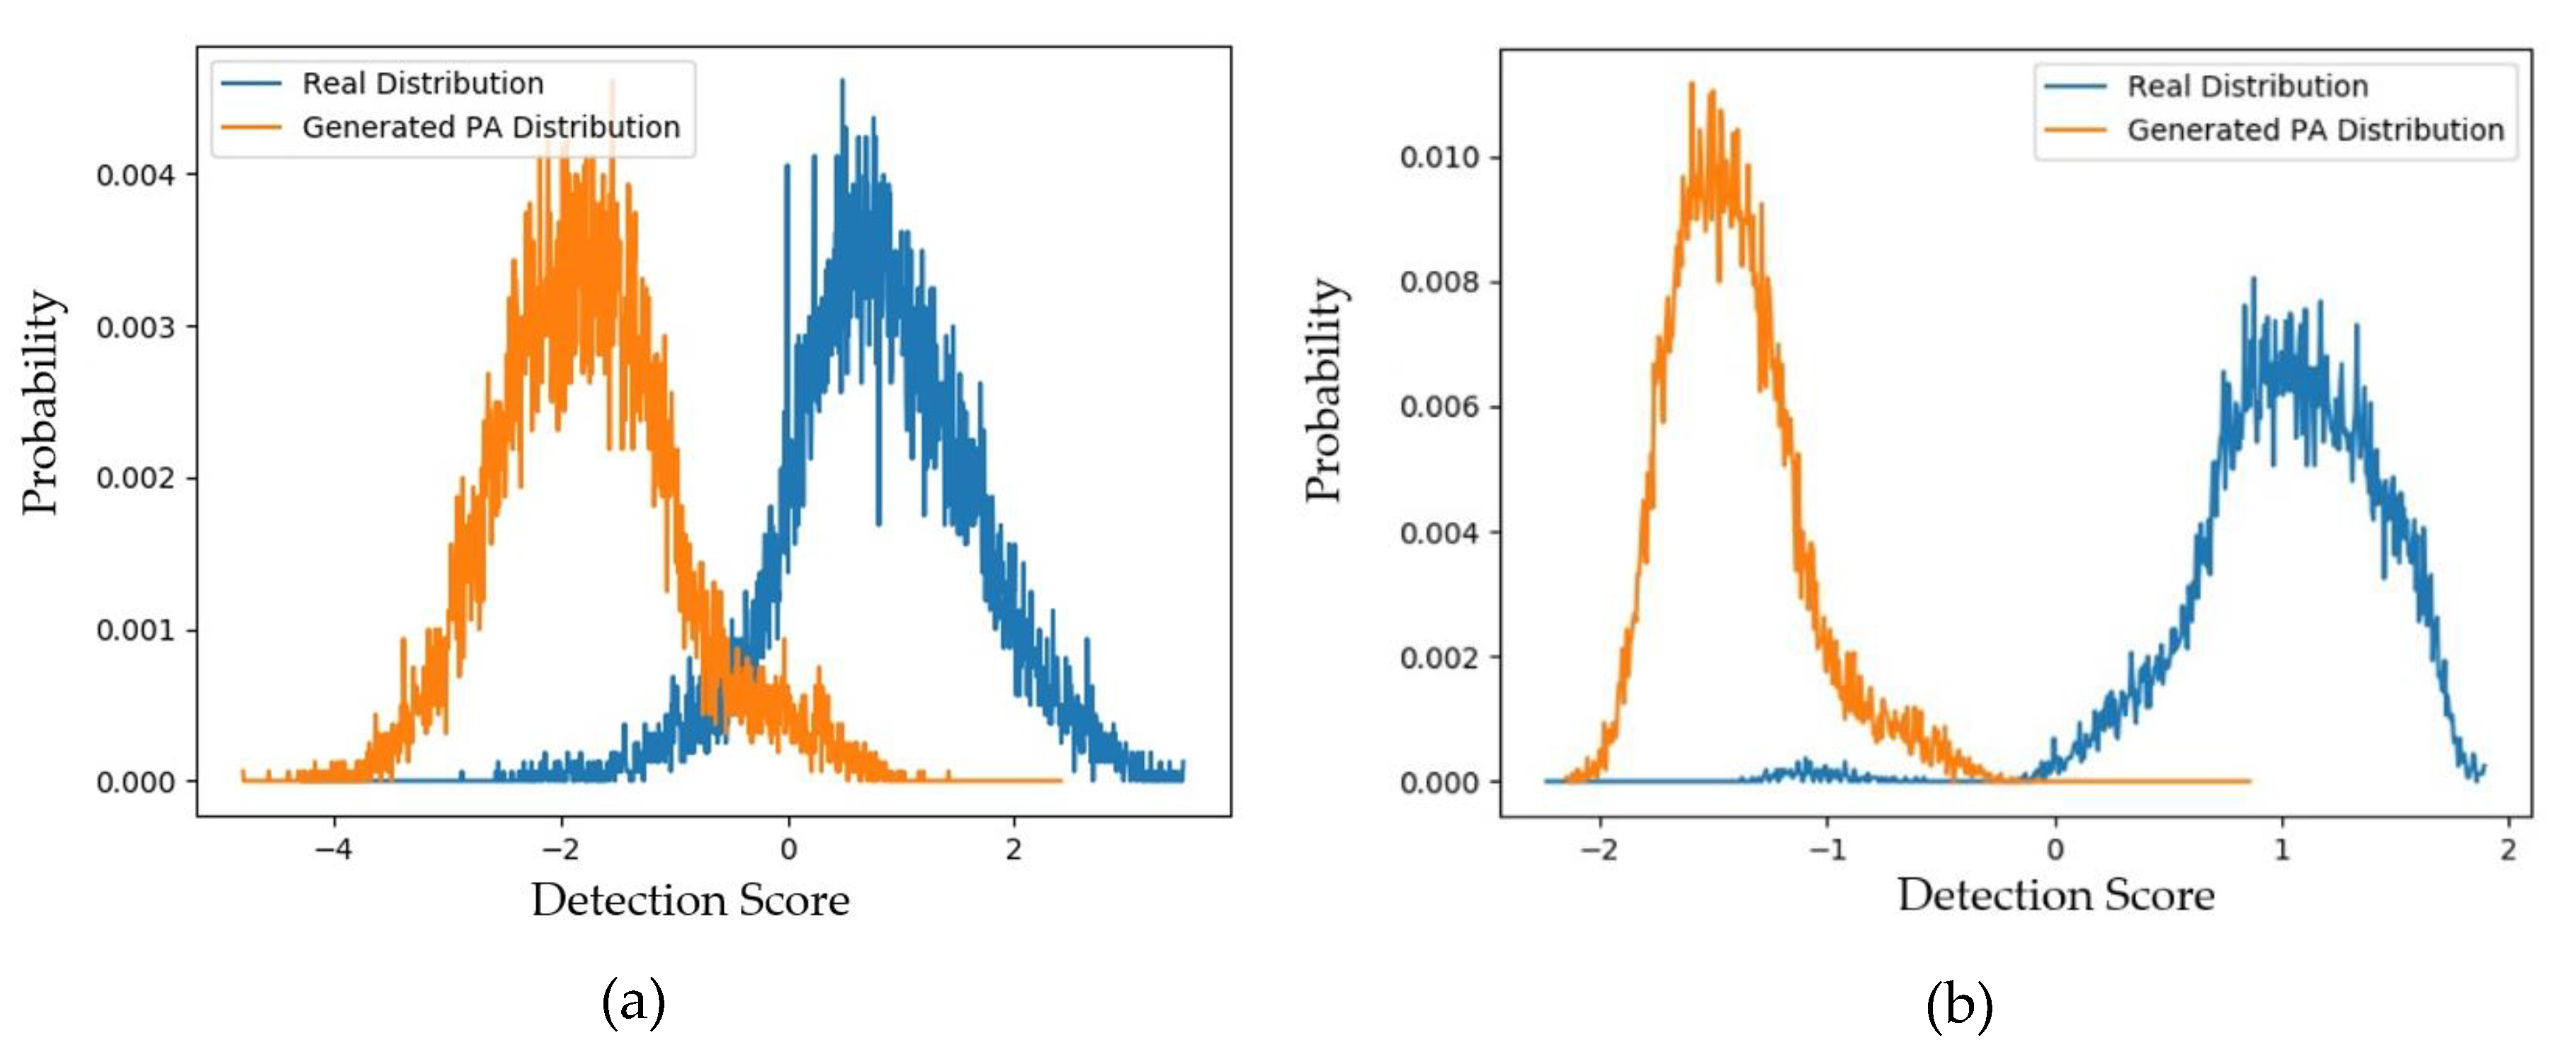
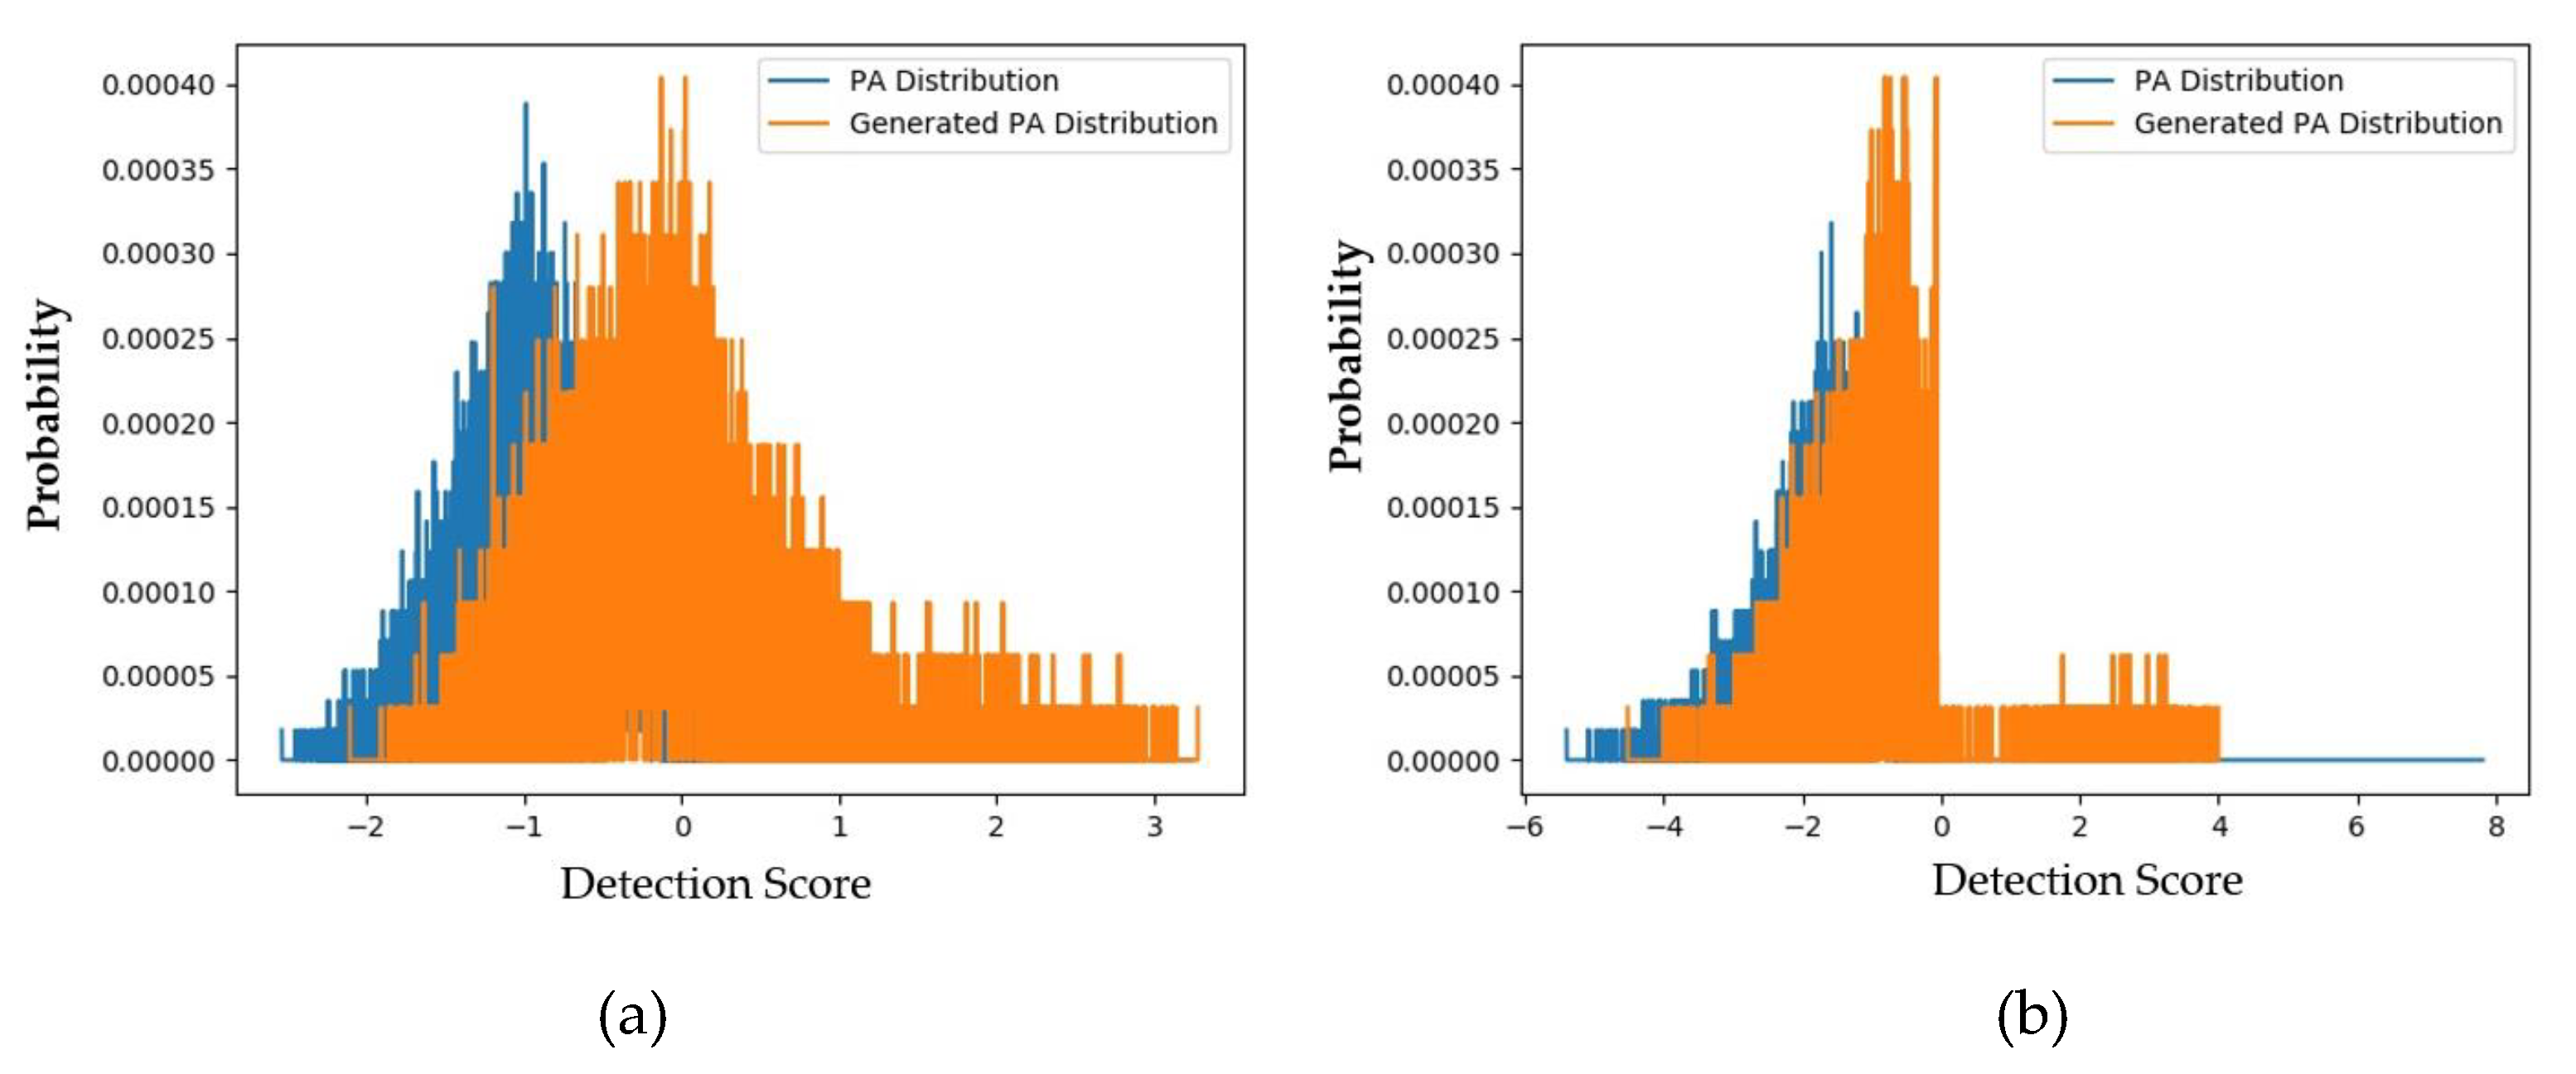
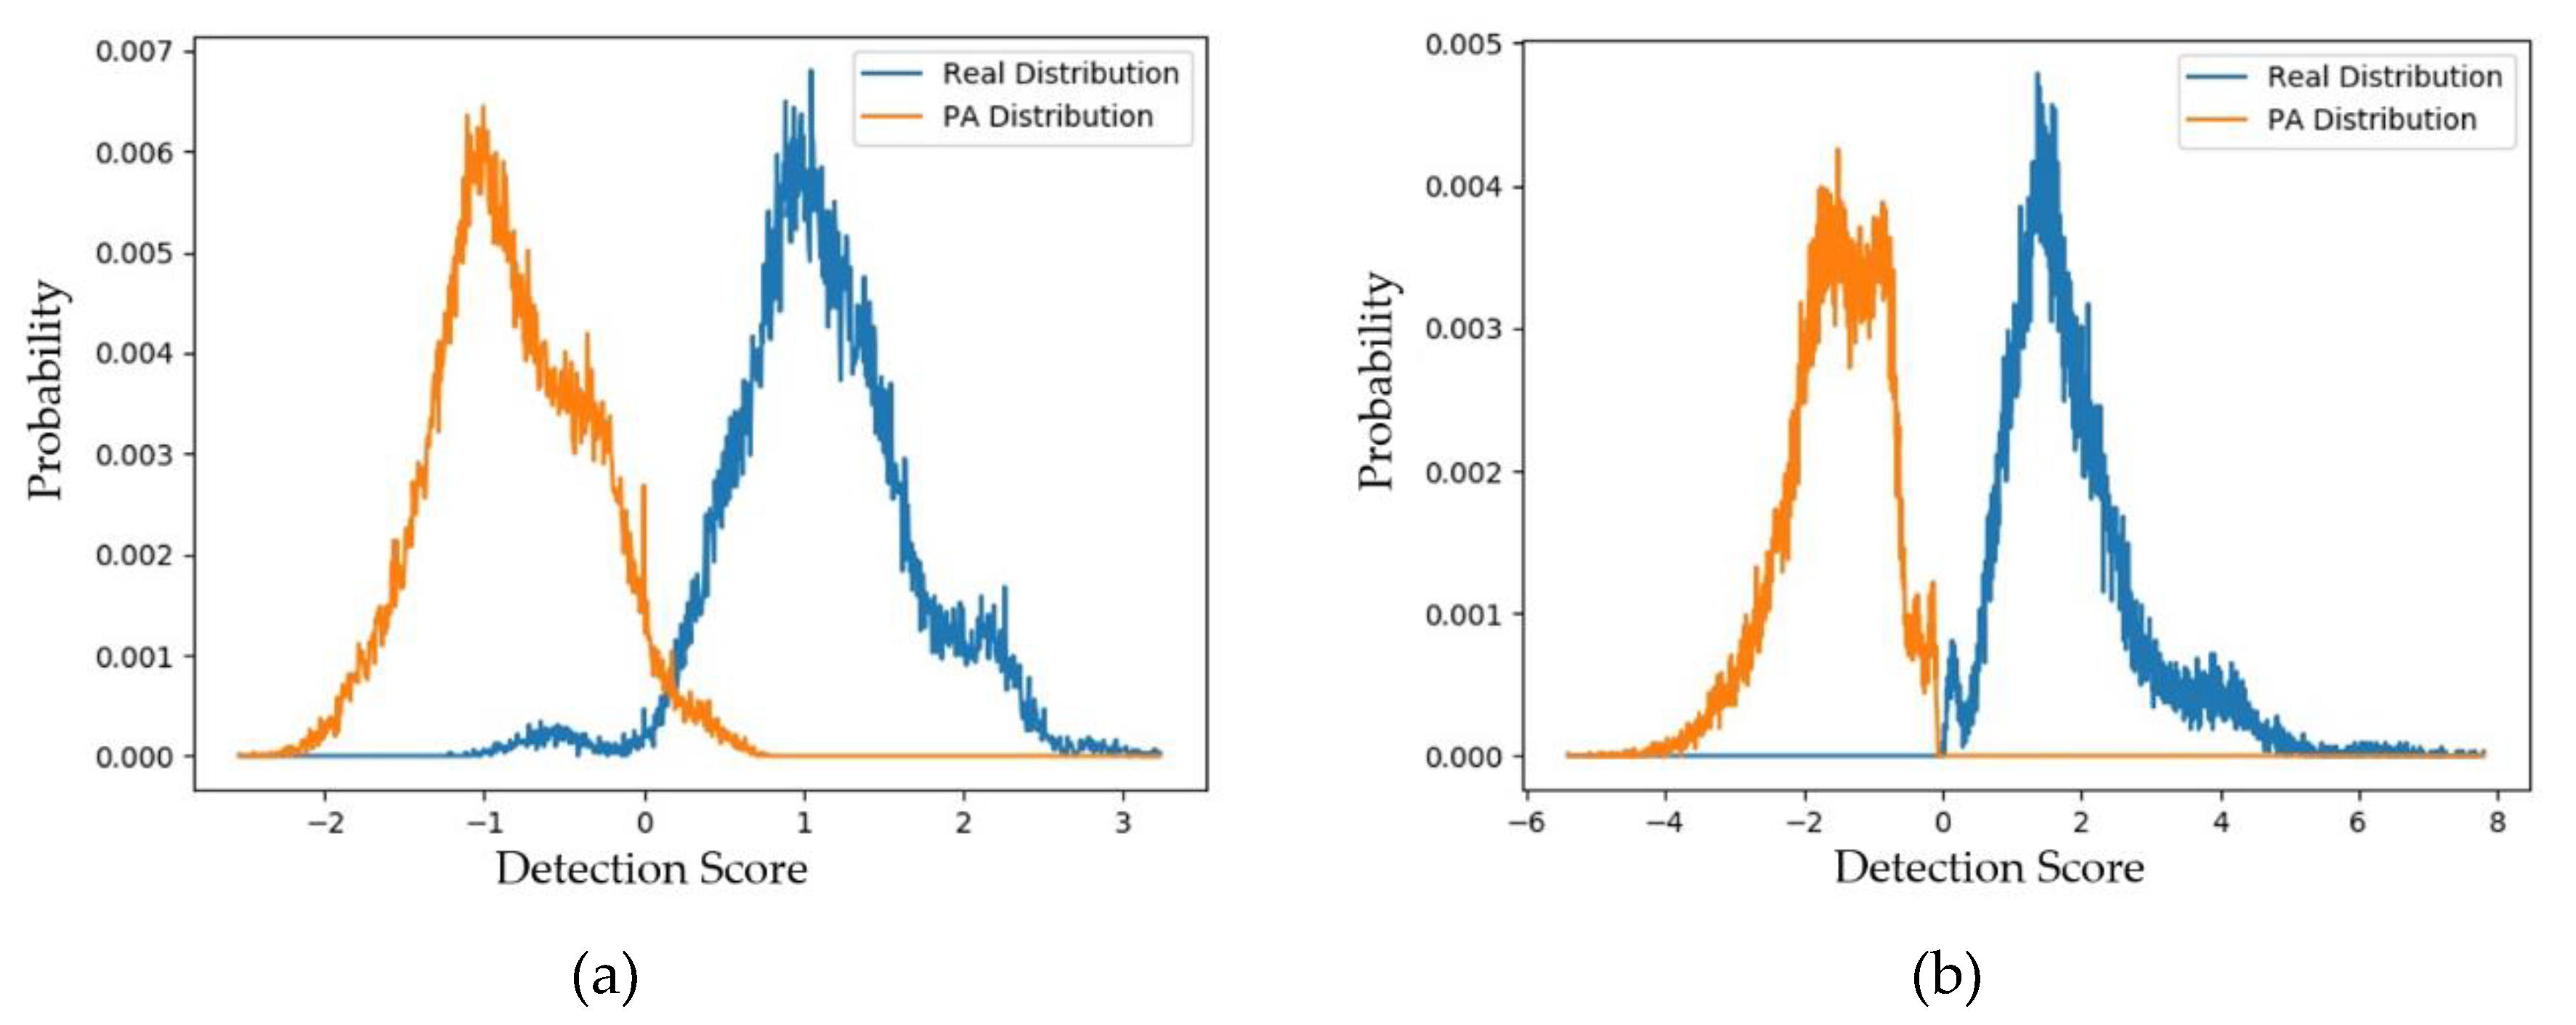
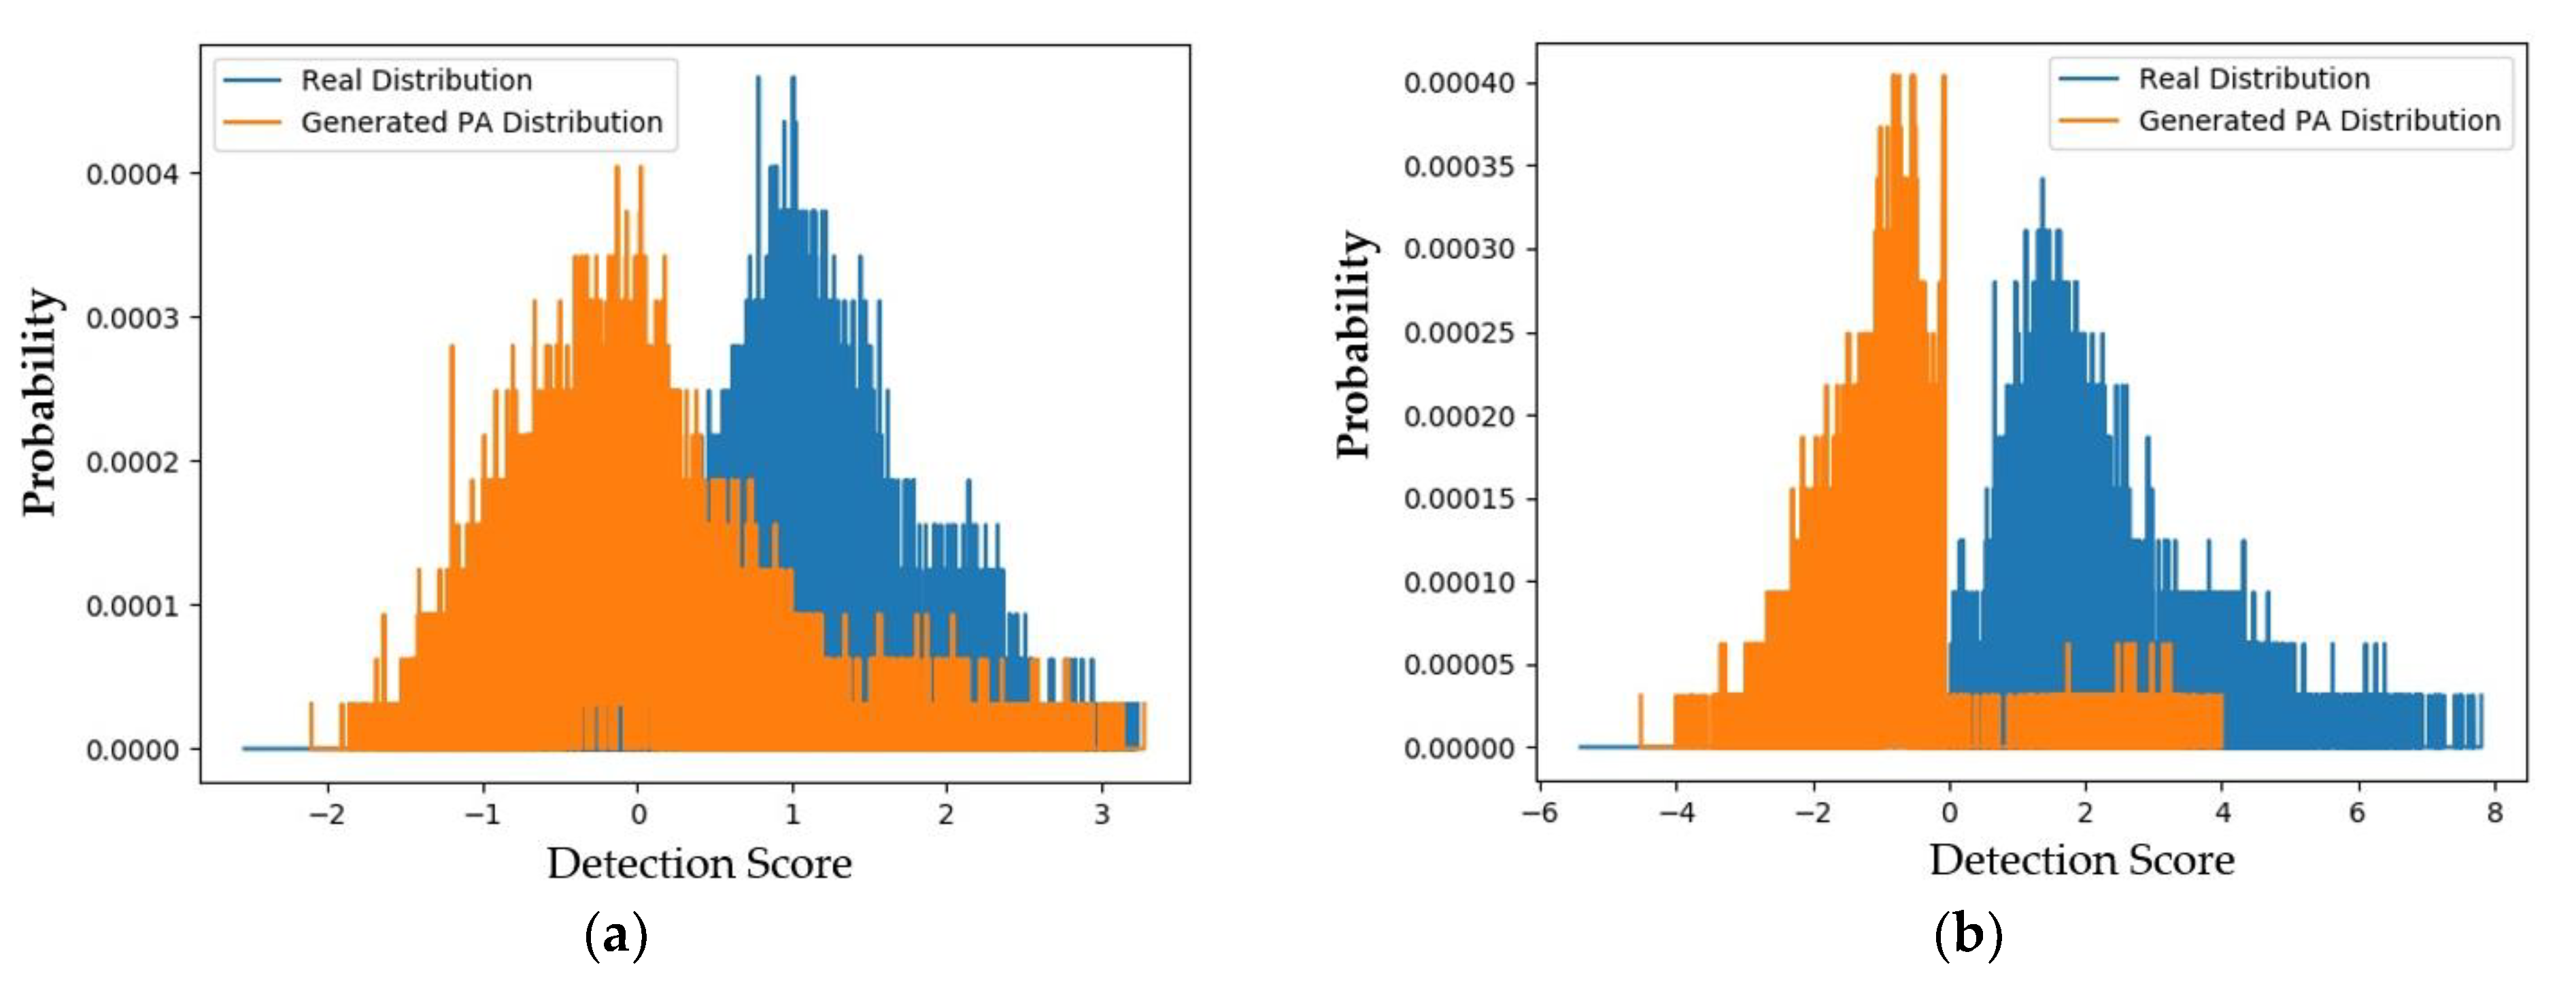
4.2.2. Quality Assessment of Generated Images Using padD Measurement on CASIA Dataset
4.2.3. Quality Assessment of Generated Images Using padD Measurement on Replay-Mobile Dataset
4.2.4. Processing Time of the Proposed Approach
5. Conclusions
Author Contributions
Acknowledgments
Conflicts of Interest
References
- Jain, A.K.; Ross, A.; Prabhakar, S. An Introduction to Biometric Recognition. IEEE Trans. Circuits Syst. Video Technol. 2004, 14, 4–20. [Google Scholar] [CrossRef]
- Nguyen, D.T.; Park, Y.H.; Lee, H.C.; Shin, K.Y.; Kang, B.J.; Park, K.R. Combining Touched Fingerprint and Finger-Vein of a Finger, and Its Usability Evaluation. Adv. Sci. Lett. 2012, 5, 85–95. [Google Scholar] [CrossRef]
- Taigman, Y.; Yang, M.; Ranzato, M.A.; Wolf, L. DeepFace: Closing the Gap to Human-Level Performance in Face Verification. In Proceedings of the IEEE Conference on Computer Vision and Pattern Recognition, Columbus, OH, USA, 23–28 June 2014; pp. 1701–1708. [Google Scholar]
- Lee, W.O.; Kim, Y.G.; Hong, H.G.; Park, K.R. Face Recognition System for Set-Top Box-Based Intelligent TV. Sensors 2014, 14, 21726–21749. [Google Scholar] [CrossRef] [PubMed]
- Zhao, J.; Han, J.; Shao, L. Unconstrained Face Recognition Using a Set-To-Set Distance Measure on Deep Learned Features. IEEE Trans. Circuits Syst. Video Technol. 2017, 28, 2679–2689. [Google Scholar] [CrossRef]
- Maatta, J.; Hadid, A.; Pietikainen, M. Face Spoofing Detection from Single Image Using Micro-Texture Analysis. In Proceedings of the International Joint Conference on Biometric, Washington, DC, USA, 11–13 October 2011; pp. 1–7. [Google Scholar]
- Zhang, Z.; Yan, J.; Liu, S.; Lei, Z.; Yi, D.; Li, S.Z. A Face Anti-Spoofing Database with Diverse Attack. In Proceedings of the 5th International Conference on Biometric, New Delhi, India, 29 March–1 April 2012; pp. 26–31. [Google Scholar]
- Kim, S.; Ban, Y.; Lee, S. Face Liveness Detection Using Defocus. Sensors 2015, 15, 1537–1563. [Google Scholar] [CrossRef]
- Costa-Pazo, A.; Bhattacharjee, S.; Vazquez-Fernandez, E.; Marcel, S. The Replay-Mobile Face Presentation Attack Database. In Proceedings of the International Conference on the Biometrics Special Interest Group, Darmstadt, Germary, 21–23 September 2016; pp. 1–7. [Google Scholar]
- Boulkenafet, Z.; Komulainen, J.; Hadid, A. Face Anti-Spoofing Based on Color Texture Analysis. In Proceedings of the IEEE International Conference on Image Processing, Quebec City, QC, Canada, 27–30 September 2015; pp. 2536–2640. [Google Scholar]
- Parveen, S.; Ahmad, S.M.S.; Abbas, N.H.; Adnan, W.A.W.; Hanafi, M.; Naeem, N. Face Liveness Detection Using Dynamic Local Ternary Pattern (DLTP). Computers 2016, 5, 10. [Google Scholar] [CrossRef]
- Menotti, D.; Chiachia, G.; Pinto, A.; Schwartz, W.R.; Pedrini, H.; Falcao, A.X.; Rocha, A. Deep Representation for Iris, Face and Fingerprint Spoofing Detection. IEEE Trans. Inf. Forensic Secur. 2015, 10, 864–879. [Google Scholar] [CrossRef]
- Nguyen, D.T.; Pham, D.T.; Baek, N.R.; Park, K.R. Combining Deep and Handcrafted Image Features for Presentation Attack Detection in Face Recognition Systems Using Visible-Light Camera Sensors. Sensors 2018, 18, 699. [Google Scholar] [CrossRef] [PubMed]
- De Souza, G.B.; Da Silva Santos, D.F.; Pires, R.G.; Marana, A.N.; Papa, J.P. Deep Texture Features for Robust Face Spoofing Detection. IEEE Trans. Circuits Syst. II-Express 2017, 64, 1397–1401. [Google Scholar] [CrossRef]
- Nguyen, D.T.; Pham, D.T.; Lee, M.B.; Park, K.R. Visible-light Camera Sensor-Based Presentation Attack Detection for Face Recognition by Combining Spatial and Temporal Information. Sensors 2019, 19, 410. [Google Scholar] [CrossRef] [PubMed]
- Dongguk Generation Model of Presentation Attack Face Image (DG_FACE_PAD_GEN). Available online: http://dm.dongguk.edu/link.html (accessed on 3 January 2020).
- Benlamoudi, A.; Zighem, M.E.; Bougourzi, F.; Bekhouche, S.E.; Ouafi, A.; Taleb-Ahmed, A. Face Anti-Spoofing Combining MLLBP and MLBSIF. In Proceedings of the CGE10SPOOFING, Alger, Algérie, 17–18 April 2017. [Google Scholar]
- Liu, Y.; Stehouwer, J.; Jourabloo, A.; Liu, X. Deep Tree Learning for Zero-Shot Face Anti-Spoofing. Available online: https://arxiv.org/abs/1904.02860v2 (accessed on 3 January 2020).
- Goodfellow, I.J.; Pouget-Abadie, J.; Mirza, M.; Xu, B.; Warde-Farley, D.; Ozair, S.; Courville, A.; Bengio, Y. Generative Adversarial Nets. Available online: https://arxiv.org/abs/1406.2661 (accessed on 3 January 2020).
- Perarnau, G.; Weijer, J.; Raducanu, B.; Alvarez, J.M. Invertible Conditional GAN for Image Editing. Available online: https://arxiv.org/abs/1611.06355 (accessed on 3 January 2020).
- Zhang, H.; Sindagi, V.; Patel, V.M. Image De-Raining Using a Conditional Generative Adversarial Network. Available online: https://arxiv.org/abs/1701.05957v4 (accessed on 3 January 2020).
- Ledig, C.; Theis, L.; Huszar, F.; Caballero, J.; Cunningham, A.; Acosta, A.; Aitken, A.; Tejani, A.; Totz, J.; Wang, Z.; et al. Photo-Realistic Single Image Super Resolution Using a Generative Adversarial Network. Available online: https://arxiv.org/abs/1609.04802v5 (accessed on 3 January 2020).
- Chen, J.; Tai, Y.; Liu, X.; Shen, C.; Yang, J. FSRNet: End-to-End Learning Face Super-Resolution with Facial Priors. Available online: https://arxiv.org/abs/1711.10703v1 (accessed on 3 January 2020).
- Tan, D.S.; Lin, J.-M.; Lai, Y.-C.; Ilao, J.; Hua, K.-L. Depth Map Up-sampling Via Multi-Modal Generative Adversarial Network. Sensors 2019, 19, 1587. [Google Scholar] [CrossRef] [PubMed]
- Kupyn, O.; Budzan, V.; Mykhailych, M.; Mishkin, D.; Matas, J. DeblurGAN: Blind Motion De-Blurring Using Conditional Adversarial Networks. Available online: https://arxiv.org/abs/1711.07064v4 (accessed on 3 January 2020).
- Wang, G.; Kang, W.; Wu, Q.; Wang, Z.; Gao, J. Generative Adversarial Network (GAN) Based Data Augmentation for Palm-print Recognition. In Proceedings of the Digital Image Computing: Techniques and Applications (DICTA), Canberra, Australia, 10–13 December 2018; pp. 1–7. [Google Scholar]
- Minaee, S.; Abdolrashidi, A. Iris-GAN: Learning to Generate Realistic Iris Images Using Convolutional GAN. Available online: https://arxiv.org/abs/1812.04822v3 (accessed on 3 January 2020).
- Minaee, S.; Abdolrashidi, A. Finger-GAN: Generating Realistic Fingerprint Images Using Connectivity Imposed GAN. Available online: https://arxiv.org/abs/1812.10482v1 (accessed on 3 January 2020).
- Zhu, J.-Y.; Park, T.; Isola, P.; Efros, A.A. Unpaired Image-to-Image Translation Using Cycle-Consistent Adversarial Networks. Available online: https://arxiv.org/abs/1703.10593v6 (accessed on 3 January 2020).
- Chu, M.P.; Sung, Y.; Cho, K. Generative Adversarial Network-based Method for Transforming Single RGB Image into 3D Point Cloud. IEEE Access 2019, 7, 1021–1029. [Google Scholar] [CrossRef]
- Isola, P.; Zhu, J.-Y.; Zhou, T.; Efros, A.A. Image-to-Image Translation with Conditional Adversarial Networks. Available online: https://arxiv.org/abs/1611.07004v3 (accessed on 3 January 2020).
- Pan, J.; Canton-Ferrer, C.; McGuinnes, K.; O’Connor, N.E.; Torres, J.; Sayol, E.; Giro-i-Nieto, X. SalGAN: Visual Saliency Prediction with Adversarial Networks. Available online: https://arxiv.org/abs/1701.01081v3 (accessed on 3 January 2020).
- Bontrager, P.; Roy, A.; Togelius, J.; Memon, N. Deepmasterprint: Fingerprint Spoofing via Latent Variable Evolution. Available online: https://arxiv.org/abs/1705.07386v4 (accessed on 3 January 2020).
- Kazemi, V.; Sullivan, J. One Millisecond Face Alignment with an Ensemble of Regression Trees. In Proceedings of the IEEE Conference on Computer Vision and Pattern Recognition, Columbus, OH, USA, 23–28 June 2014; pp. 1867–1874. [Google Scholar]
- Lecun, Y.; Bottou, L.; Bengio, Y.; Haffner, P. Gradient-based Learning Applied to Document Recognition. Proc. IEEE 1998, 86, 2278–2324. [Google Scholar] [CrossRef]
- Krizhevsky, A.; Sutskever, I.; Hinton, G.E. Imagenet Classification with Deep Convolutional Neural Networks. In Proceedings of the Advances in Neural Information Processing Systems, Lake Tahoe, NV, USA, 3–8 December 2012; pp. 1097–1105. [Google Scholar]
- Simonyan, K.; Zisserman, A. Very Deep Convolutional Neural Networks for Large-Scale Image Recognition. Available online: https://arxiv.org/abs/1409.1556v6 (accessed on 3 January 2020).
- Srivastava, N.; Hinton, G.; Krizhevsky, A.; Sutskever, I.; Salakhutdinov, R. Dropout: A Simple Way to Prevent Neural Networks from Overfitting. J. Mach. Learn. Res. 2014, 15, 1929–1958. [Google Scholar]
- Nguyen, D.T.; Kim, K.W.; Hong, H.G.; Koo, J.H.; Kim, M.C.; Park, K.R. Gender Recognition from Human-Body Images Using Visible-Light and Thermal Camera Videos Based on a Convolutional Neural Network for Image Feature Extraction. Sensors 2017, 17, 637. [Google Scholar] [CrossRef] [PubMed]
- Muhammad, K.; Ahmad, J.; Mehmood, I.; Rho, S.; Baik, S.W. Convolutional Neural Networks Based Fire Detection in Surveillance Videos. IEEE Access 2018, 6, 18174–18183. [Google Scholar] [CrossRef]
- Huang, G.; Liu, Z.; Maatern, L.; Weinberger, K.Q. Densely Connected Convolutional Network. Available online: https://arxiv.org/abs/1608.06993v5 (accessed on 3 January 2020).
- He, K.; Zhang, X.; Ren, S.; Sun, J. Deep Residual Learning for Image Recognition. Available online: https://arxiv.org/abs/1512.03385v1 (accessed on 3 January 2020).
- Szegedy, C.; Liu, W.; Jia, Y.; Sermanet, P.; Reed, S.; Anguelov, D.; Erhan, D.; Vanhoucke, V.; Rabinovich, A. Going Deeper with Convolutions. Available online: https://arxiv.org/abs/1409.4842v1 (accessed on 3 January 2020).
- Mao, X.; Li, Q.; Xie, H.; Lau, R.Y.K.; Wang, Z.; Smolley, S.P. Least Squares Generative Adversarial Networks. Available online: https://arxiv.org/abs/1611.04076v3 (accessed on 3 January 2020).
- Heusel, M.; Ramsauer, H.; Unterthiner, T.; Nessler, B.; Hochreiter, S. GANs Trained by a Two Time-Scale Update Rule Converge to a Local Nash Equilibrium. Available online: https://arxiv.org/abs/1706.08500v6 (accessed on 3 January 2020).
- Zhang, H.; Goodfellow, I.; Metaxas, D.; Odena, A. Self-Attention Generative Adversarial Networks. Available online: https://arxiv.org/abs/1805.08318v2 (accessed on 3 January 2020).
- Borji, A. Pros and Cons of GAN Evaluation Measures. Comput. Vis. Image Underst. 2019, 179, 41–65. [Google Scholar] [CrossRef]
- Lucic, M.; Kurach, K.; Michalski, M.; Gelly, S.; Bousquet, O. Are GANs Created Equal? A Large-Scale Study. Available online: https://arxiv.org/abs/1711.10337v4 (accessed on 3 January 2020).
- ISO Standard. ISO/IEC 30107-3:2017 [ISO/IEC 30107-3:2017] Information Technology—Biometric Presentation Attack Detection—Part 3: Testing and Reporting. Available online: https://www.iso.org/standard/67381.html (accessed on 3 January 2020).
- Ojala, T.; Pietikainen, M.; Maenpaa, T. Multiresolution Gray-Scale and Rotation Invariant Texture Classification with Local Binary Patterns. IEEE Trans. Pattern Anal. Mach. Intell. 2002, 24, 971–987. [Google Scholar] [CrossRef]
- Yi, Z.; Zhang, H.; Tan, P.; Gong, M. DualGAN: Unsupervised Dual Learning for Image-to-Image Translation. Available online: https://arxiv.org/abs/1704.02510v4 (accessed on 3 January 2020).
- Jetson TX2 Module. Available online: https://www.nvidia.com/en-us/autonomous-machines/embedded-systems-dev-kits-modules/ (accessed on 3 January 2020).
- NVIDIA TitanX GPU. Available online: https://www.nvidia.com/en-us/geforce/products/10series/titan-x-pascal/ (accessed on 3 January 2020).
- Tensorflow Deep-Learning Library. Available online: https://www.tensorflow.org/ (accessed on 3 January 2020).


| Task | Purpose |
|---|---|
| Fingerprint image generation [28,33] | -Generate realistic fingerprint images that are close to captured fingerprint images [28,33]. -Demonstrate that synthetic fingerprint images are capable of spoofing multiple peoples’ fingerprint patterns [33]. |
| Iris image generation [27] | -Generate realistic iris images that are close to captured iris images |
| Palm-print image generation [26] | -Generate realistic palm-print images and use them as augmented data to train a palm-print recognition system. -Enhance the performance of a palm-print recognition system using generated images. |
| PA face image generation (Our approach) | -Generate realistic PA face images to reduce the effort required for image acquisition. -Fill the gap of missing samples caused by diversity of attack methods. |
| Type of Layer | Kernel Size | Stride | Number of Filters | Alpha of Leaky ReLU | Input Shape | Output Shape |
|---|---|---|---|---|---|---|
| Convolution | 4 × 4 | 2 | 64 | - | 256 × 256 × 3 | 128 × 128 × 64 |
| Leaky ReLU | - | - | - | 0.2 | 128 × 128 × 64 | 128 × 128 × 64 |
| Convolution | 4 × 4 | 2 | 128 | - | 128 × 128 × 64 | 64 × 64× 128 |
| Instance Normalization | - | - | - | - | 64 × 64 × 128 | 64 × 64 × 128 |
| Leaky ReLU | - | - | - | 0.2 | 64 × 64 × 128 | 64 × 64 × 128 |
| Convolution | 4 × 4 | 2 | 256 | - | 64 × 64 × 128 | 32 × 32 × 256 |
| Instance Normalization | - | - | - | - | 32 × 32 × 256 | 32 × 32 × 256 |
| Leaky ReLU | - | - | - | 0.2 | 32 × 32 × 256 | 32 × 32 × 256 |
| Convolution | 4 × 4 | 1 | 512 | - | 32 × 32 × 256 | 32 × 32 × 512 |
| Instance Normalization | - | - | - | - | 32 × 32 × 512 | 32 × 32 × 512 |
| Leaky ReLU | - | - | - | 0.2 | 32 × 32 × 512 | 32 × 32 × 512 |
| Convolution | 4 × 4 | 1 | 1 | - | 32 × 32 × 512 | 32 × 32 × 1 |
| Type of Layer | Block | Kernel Size | Stride | Number of Filters | Input Shape | Output Shape | |
|---|---|---|---|---|---|---|---|
| Convolution | Encoding | 7 × 7 | 1 | 64 | 256 × 256 × 3 | 256 × 256 × 64 | |
| Instance Normalization | - | - | - | 256 × 256 × 64 | 256 × 256 × 64 | ||
| ReLU | - | - | - | 256 × 256 × 64 | 256 × 256 × 64 | ||
| Convolution | 3 × 3 | 2 | 128 | 256 × 256 × 64 | 128 × 128 × 128 | ||
| Instance Normalization | - | - | - | 128 × 128 × 128 | 128 × 128 × 128 | ||
| ReLU | - | - | - | 128 × 128 × 128 | 128 × 128 × 128 | ||
| Convolution | 3 × 3 | 2 | 256 | 128 × 128 × 128 | 64 × 64 × 256 | ||
| Instance Normalization | - | - | - | 64 × 64 × 256 | 64 × 64 × 256 | ||
| ReLU | - | - | - | 64 × 64 × 256 | 64 × 64 × 256 | ||
| Residual (Repeated 9 times) | Convolution | 3 × 3 | 1 | 256 | 64 × 64 × 256 | 64 × 64 × 256 | |
| Convolution | 3 × 3 | 1 | 256 | 64 × 64 × 256 | 64 × 64 × 256 | ||
| Deconvolution | Decoding | 3 × 3 | 2 | 128 | 64 × 64 × 256 | 128 × 128 × 128 | |
| Instance Normalization | - | - | - | 128 × 128 × 128 | 128 × 128 × 128 | ||
| ReLU | - | - | - | 128 × 128 × 128 | 128 × 128 × 128 | ||
| Deconvolution | 3 × 3 | 2 | 64 | 128 × 128 × 128 | 256 × 256 × 64 | ||
| Instance Normalization | - | - | - | 256 × 256 × 64 | 256 × 256 × 64 | ||
| ReLU | - | - | - | 256 × 256 × 64 | 256 × 256 × 64 | ||
| Convolution | 7 × 7 | 1 | 3 | 256 × 256 × 64 | 256 × 256 × 3 | ||
| Tanh Normalization | - | - | - | 256 × 256 × 3 | 256 × 256 × 3 | ||
| CASIA Dataset | Training Dataset (20 Persons) | Testing Dataset (30 Persons) | Total | ||
|---|---|---|---|---|---|
| Real Access | PA Access | Real Access | PA Access | ||
| Number of Videos | 60 | 180 | 90 | 270 | 600 |
| Number of Images | 10,940 | 34,148 | 16,029 | 49,694 | 110,811 |
| Replay-Mobile Dataset | Training Dataset (12 Persons) | Testing Dataset (12 Persons) | Total | ||
|---|---|---|---|---|---|
| Real Access | PA Access | Real Access | PA Access | ||
| Number of Videos | 120 | 192 | 110 | 192 | 614 |
| Number of Images | 35,087 | 56,875 | 32,169 | 56,612 | 180,743 |
| FID Measurement | Using CASIA Dataset | Using Replay-Mobile Dataset |
|---|---|---|
| Intra-class FID | 24.614 | 37.943 |
| Inter-class FID using CycleGAN-based model with conventional cross-entropy loss function | 30.968 | 51.207 |
| Inter-class FID by our proposed method (using least-squared loss function) | 28.300 | 42.066 |
| Method | DCGAN for Generation | CycleGAN for Generation | ||||
|---|---|---|---|---|---|---|
| Iris Images [27] | Fingerprint Images [28] | Replay-Mobile Dataset | CASIA Dataset | Replay-Mobile Dataset | CASIA Dataset | |
| FID | 41.08 | 70.5 | 65.049 | 82.400 | 42.066 | 28.300 |
| Handcrafted-Based PAD Method [50] | Deep-Learning-Based PAD Method [15] | ||
|---|---|---|---|
| Captured PA versus Generated PA Images | Captured Real versus Captured PA Images | Captured PA versus Generated PA Images | Captured Real versus Captured PA Images |
| 0.610 | 2.474 | 0.711 | 5.463 |
| Handcrafted-Based Face-PAD Method [50] | Deep-Learning-Based Face-PAD Method [15] | ||
|---|---|---|---|
| Captured PA Images | Generated PA Images | Captured PA Images | Generated PA Images |
| 9.488 | 4.292 | 0.784 | 0.000 |
| Handcrafted-Based Face-PAD Method [50] | Deep-Learning-Based Face-PAD Method [15] | ||
|---|---|---|---|
| Captured PA versus Generated PA Images | Captured Real versus Captured PA Images | Captured PA versus Generated PA Images | Captured Real versus Captured PA Images |
| 1.214 | 3.649 | 0.836 | 3.928 |
| Handcrafted-Based Face-PAD Method [50] | Deep-Learning-Based Face-PAD Method [15] | ||
|---|---|---|---|
| Captured PA Images | Generated PA Images | Captured PA Images | Generated PA Images |
| 5.684 | 41.294 | 0.00 | 1.551 |
| Desktop Computer | Jetson TX2 Embedded System |
|---|---|
| 29.920 | 62.423 |
© 2020 by the authors. Licensee MDPI, Basel, Switzerland. This article is an open access article distributed under the terms and conditions of the Creative Commons Attribution (CC BY) license (http://creativecommons.org/licenses/by/4.0/).
Share and Cite
Nguyen, D.T.; Pham, T.D.; Batchuluun, G.; Noh, K.J.; Park, K.R. Presentation Attack Face Image Generation Based on a Deep Generative Adversarial Network. Sensors 2020, 20, 1810. https://doi.org/10.3390/s20071810
Nguyen DT, Pham TD, Batchuluun G, Noh KJ, Park KR. Presentation Attack Face Image Generation Based on a Deep Generative Adversarial Network. Sensors. 2020; 20(7):1810. https://doi.org/10.3390/s20071810
Chicago/Turabian StyleNguyen, Dat Tien, Tuyen Danh Pham, Ganbayar Batchuluun, Kyoung Jun Noh, and Kang Ryoung Park. 2020. "Presentation Attack Face Image Generation Based on a Deep Generative Adversarial Network" Sensors 20, no. 7: 1810. https://doi.org/10.3390/s20071810
APA StyleNguyen, D. T., Pham, T. D., Batchuluun, G., Noh, K. J., & Park, K. R. (2020). Presentation Attack Face Image Generation Based on a Deep Generative Adversarial Network. Sensors, 20(7), 1810. https://doi.org/10.3390/s20071810