Wi-Fi Backscatter System with Tag Sensors Using Multi-Antennas for Increased Data Rate and Reliability


Abstract
1. Introduction
- We proposed a MIMO (multiple-input multiple-output) Wi-Fi backscatter system using multi-antennas tag sensor. Since proposed system controls the impedance of multi-antennas independently and reflection gain does not decrease, degree of difference in the CSI pattern between Wi-Fi symbols was maintained. As a result, BER performance did not deteriorate while increasing data rate.
- Instead of increasing data rate as needed, another backscatter method for improving reliability was presented by turning all switches on/off in multi-antennas tag sensor.
- Data rate and reliability improved by using multiple antennas, but computational complexity also increased. So, we proposed dedicating three demodulation methods that reduce computational complexity while maintaining BER performance.
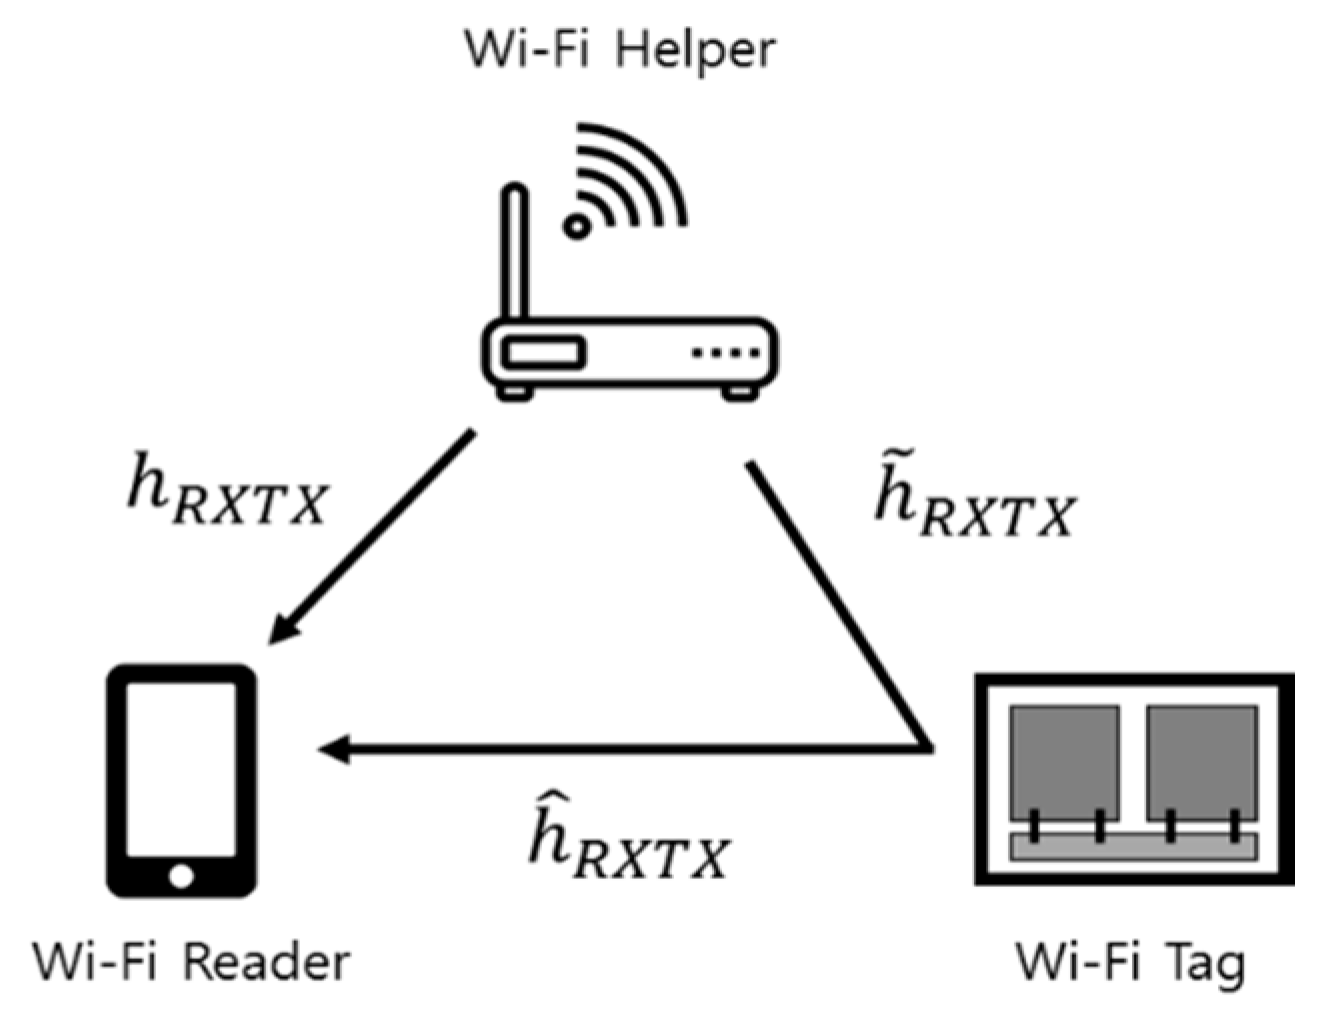
2. Existing Wi-Fi Backscatter Communication Systems
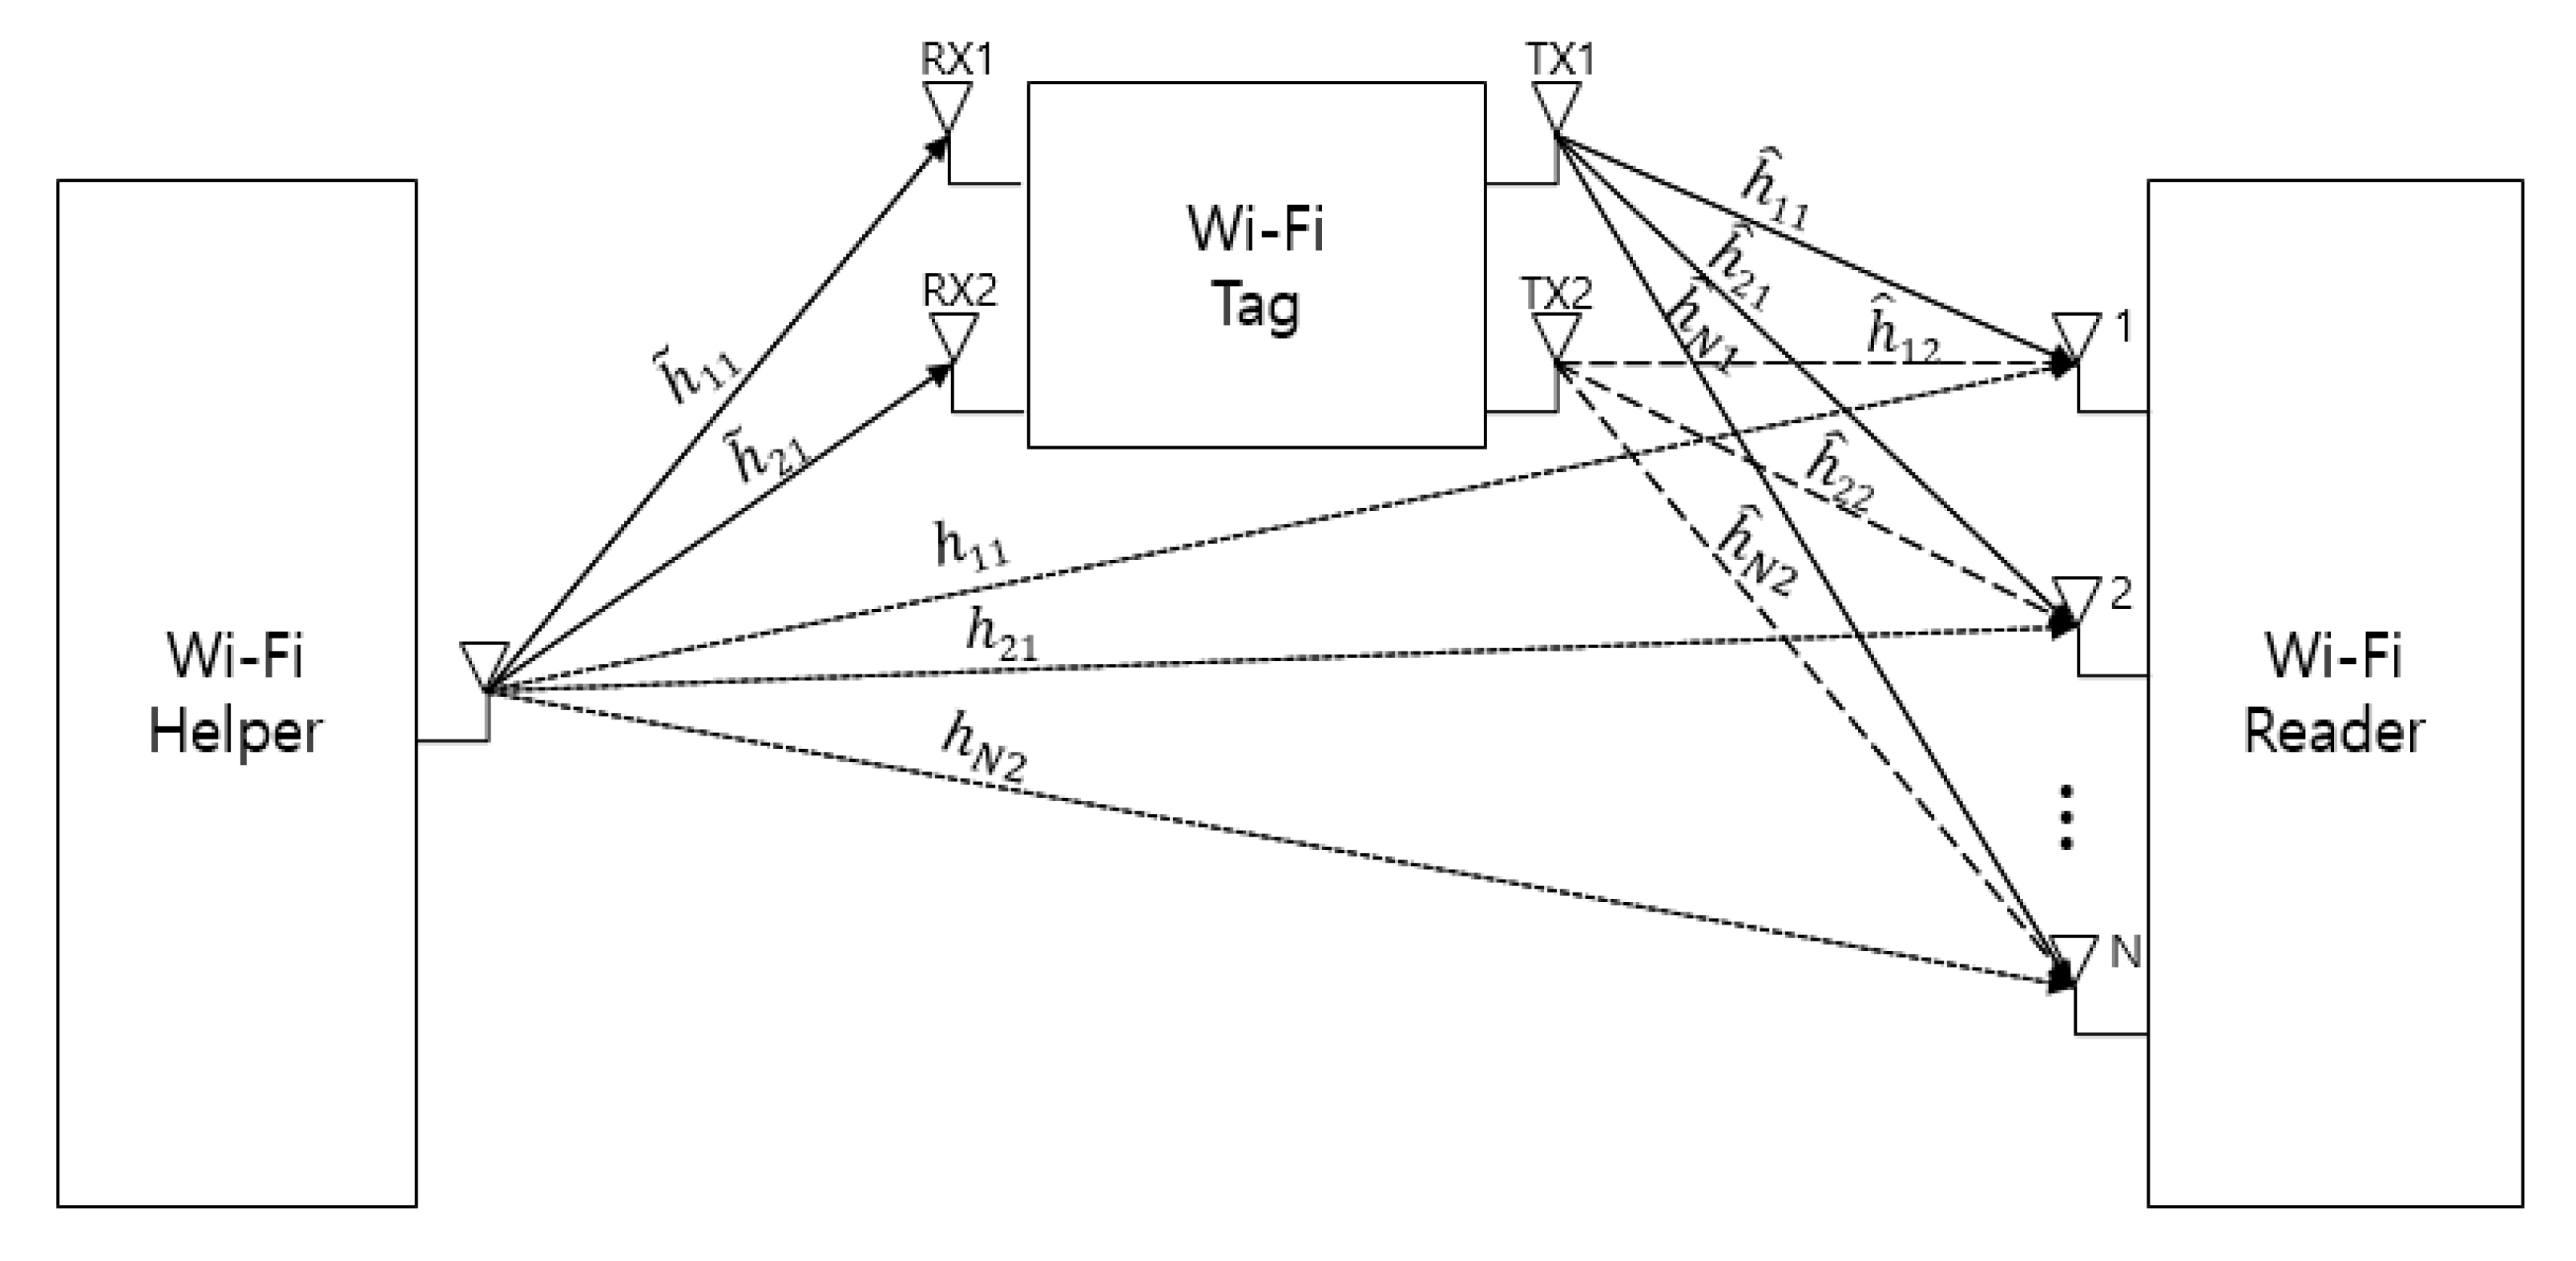
3. Proposed Wi-Fi Backscatter System Using Multiple Antennas
4. Demodulation Method
4.1. ED Method for MIMO Wi-Fi Backscatter
4.2. Low Complexity Demodulation Methods
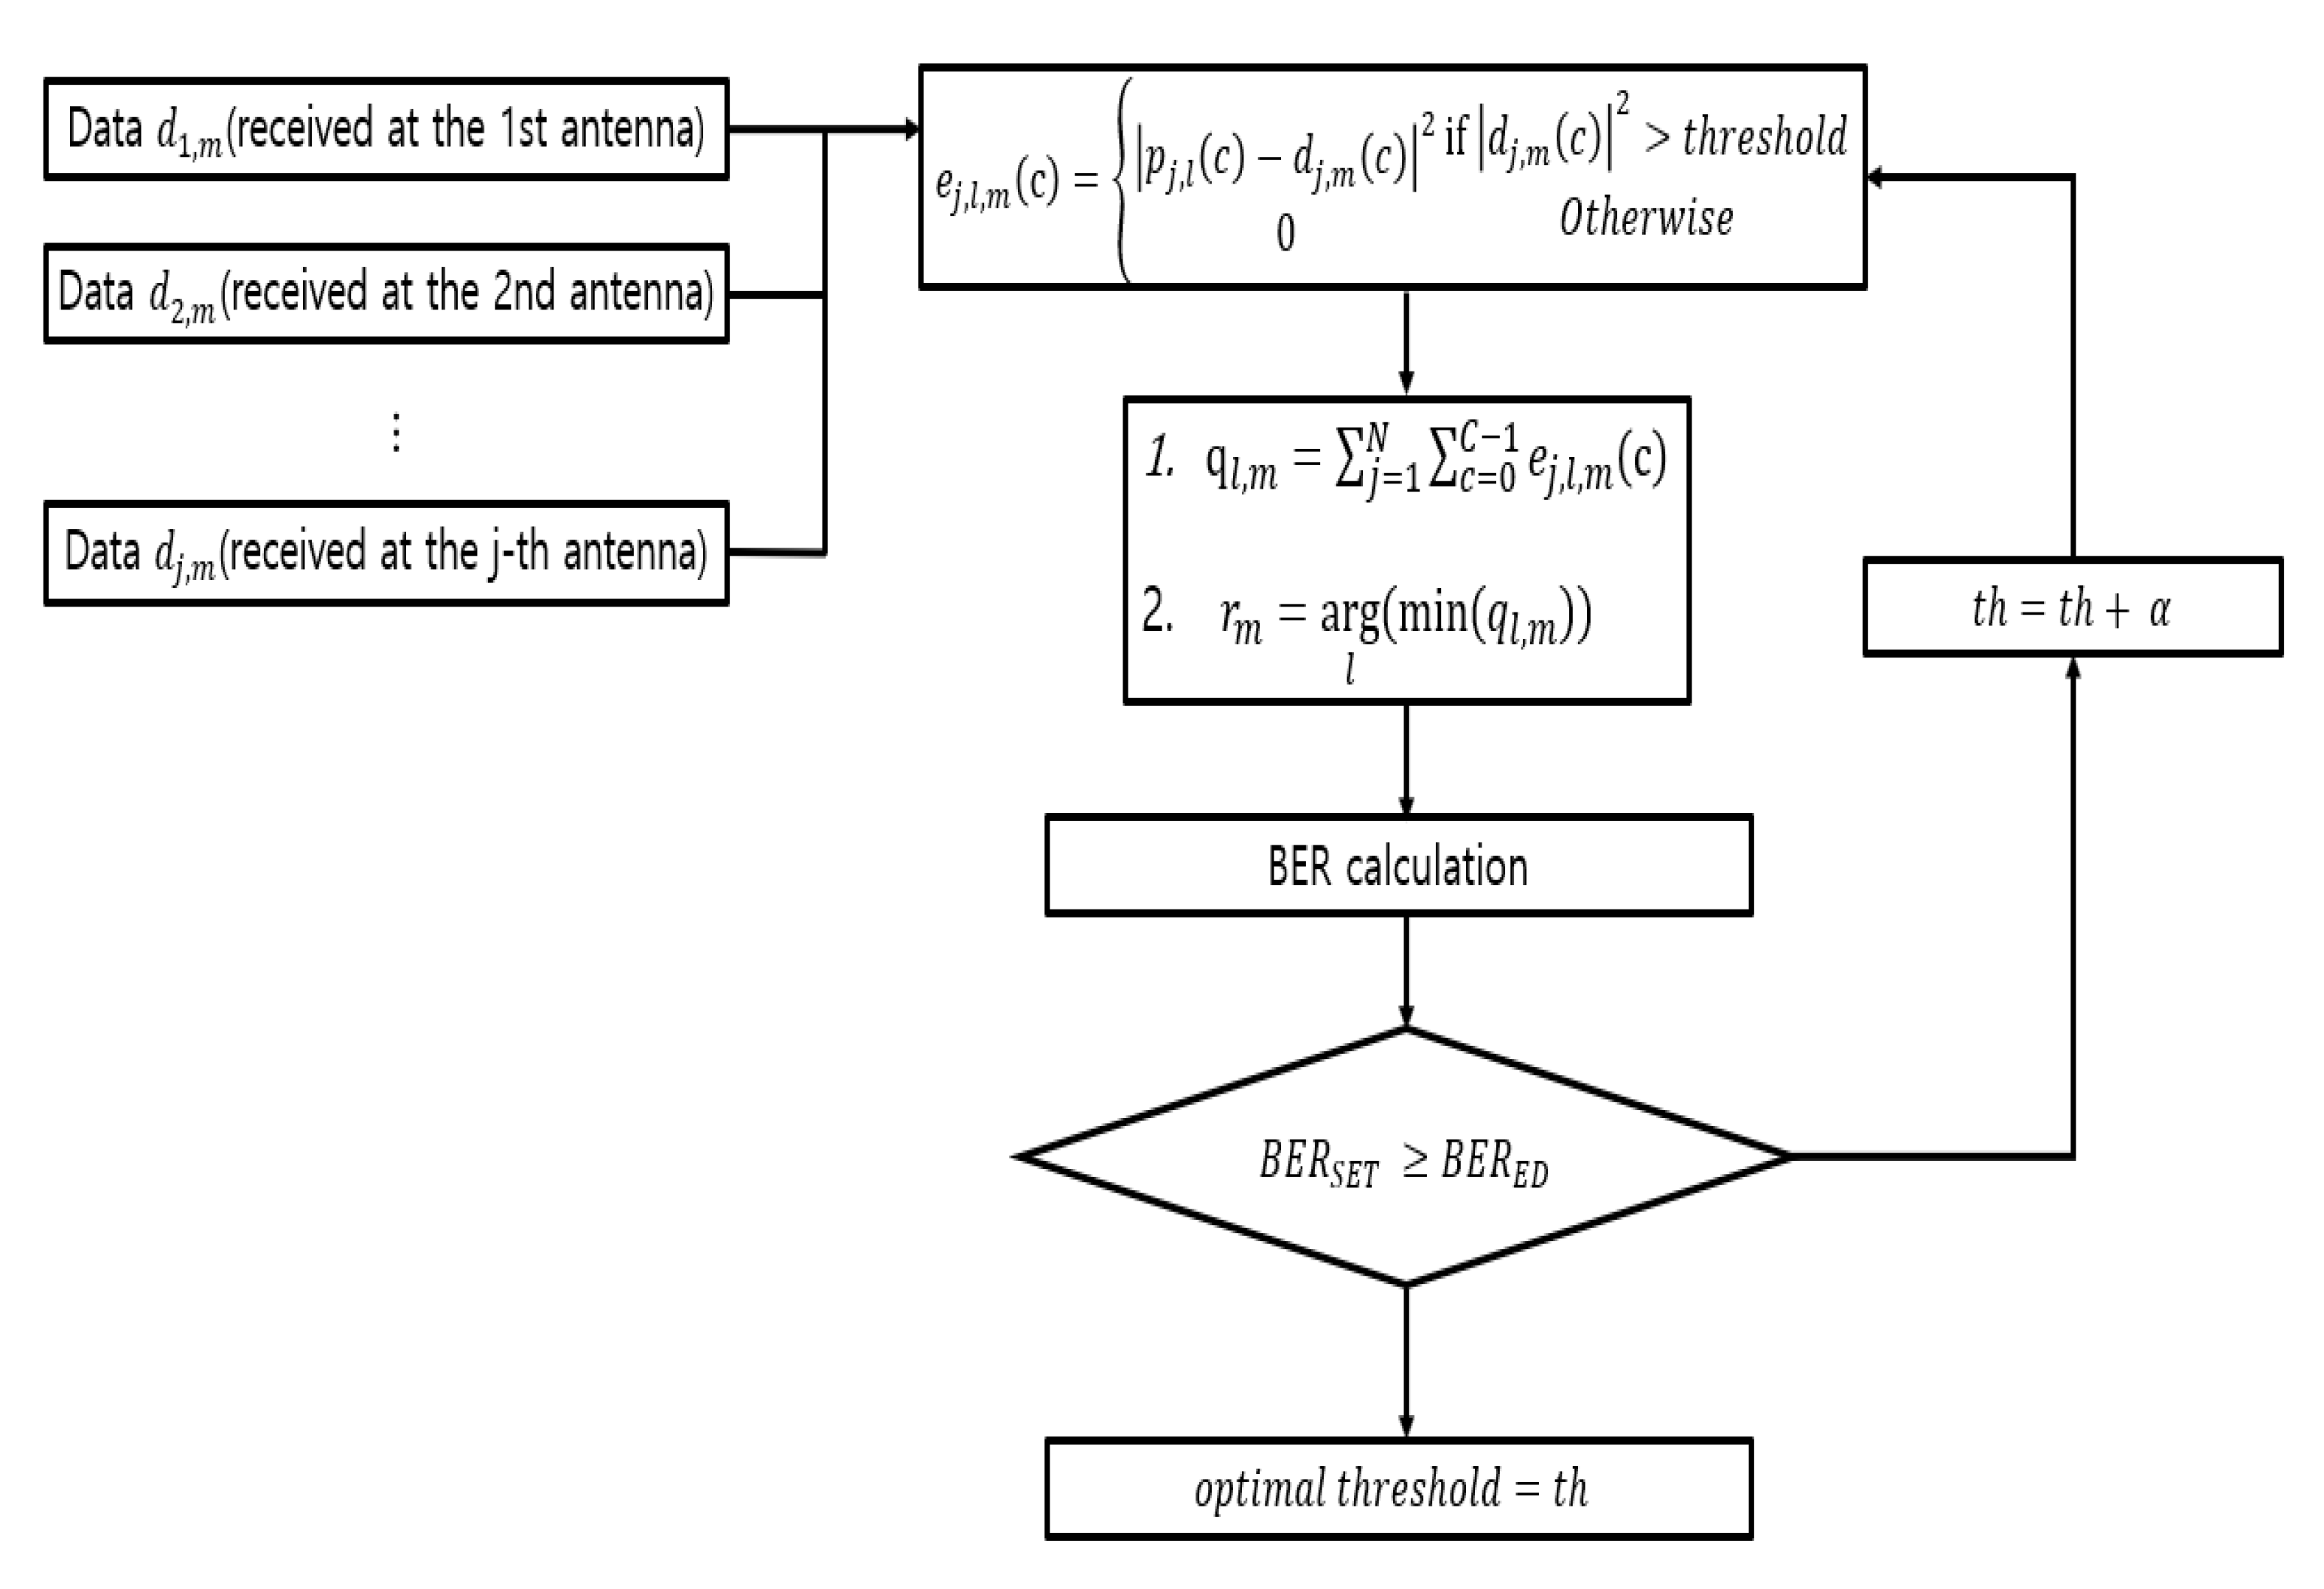
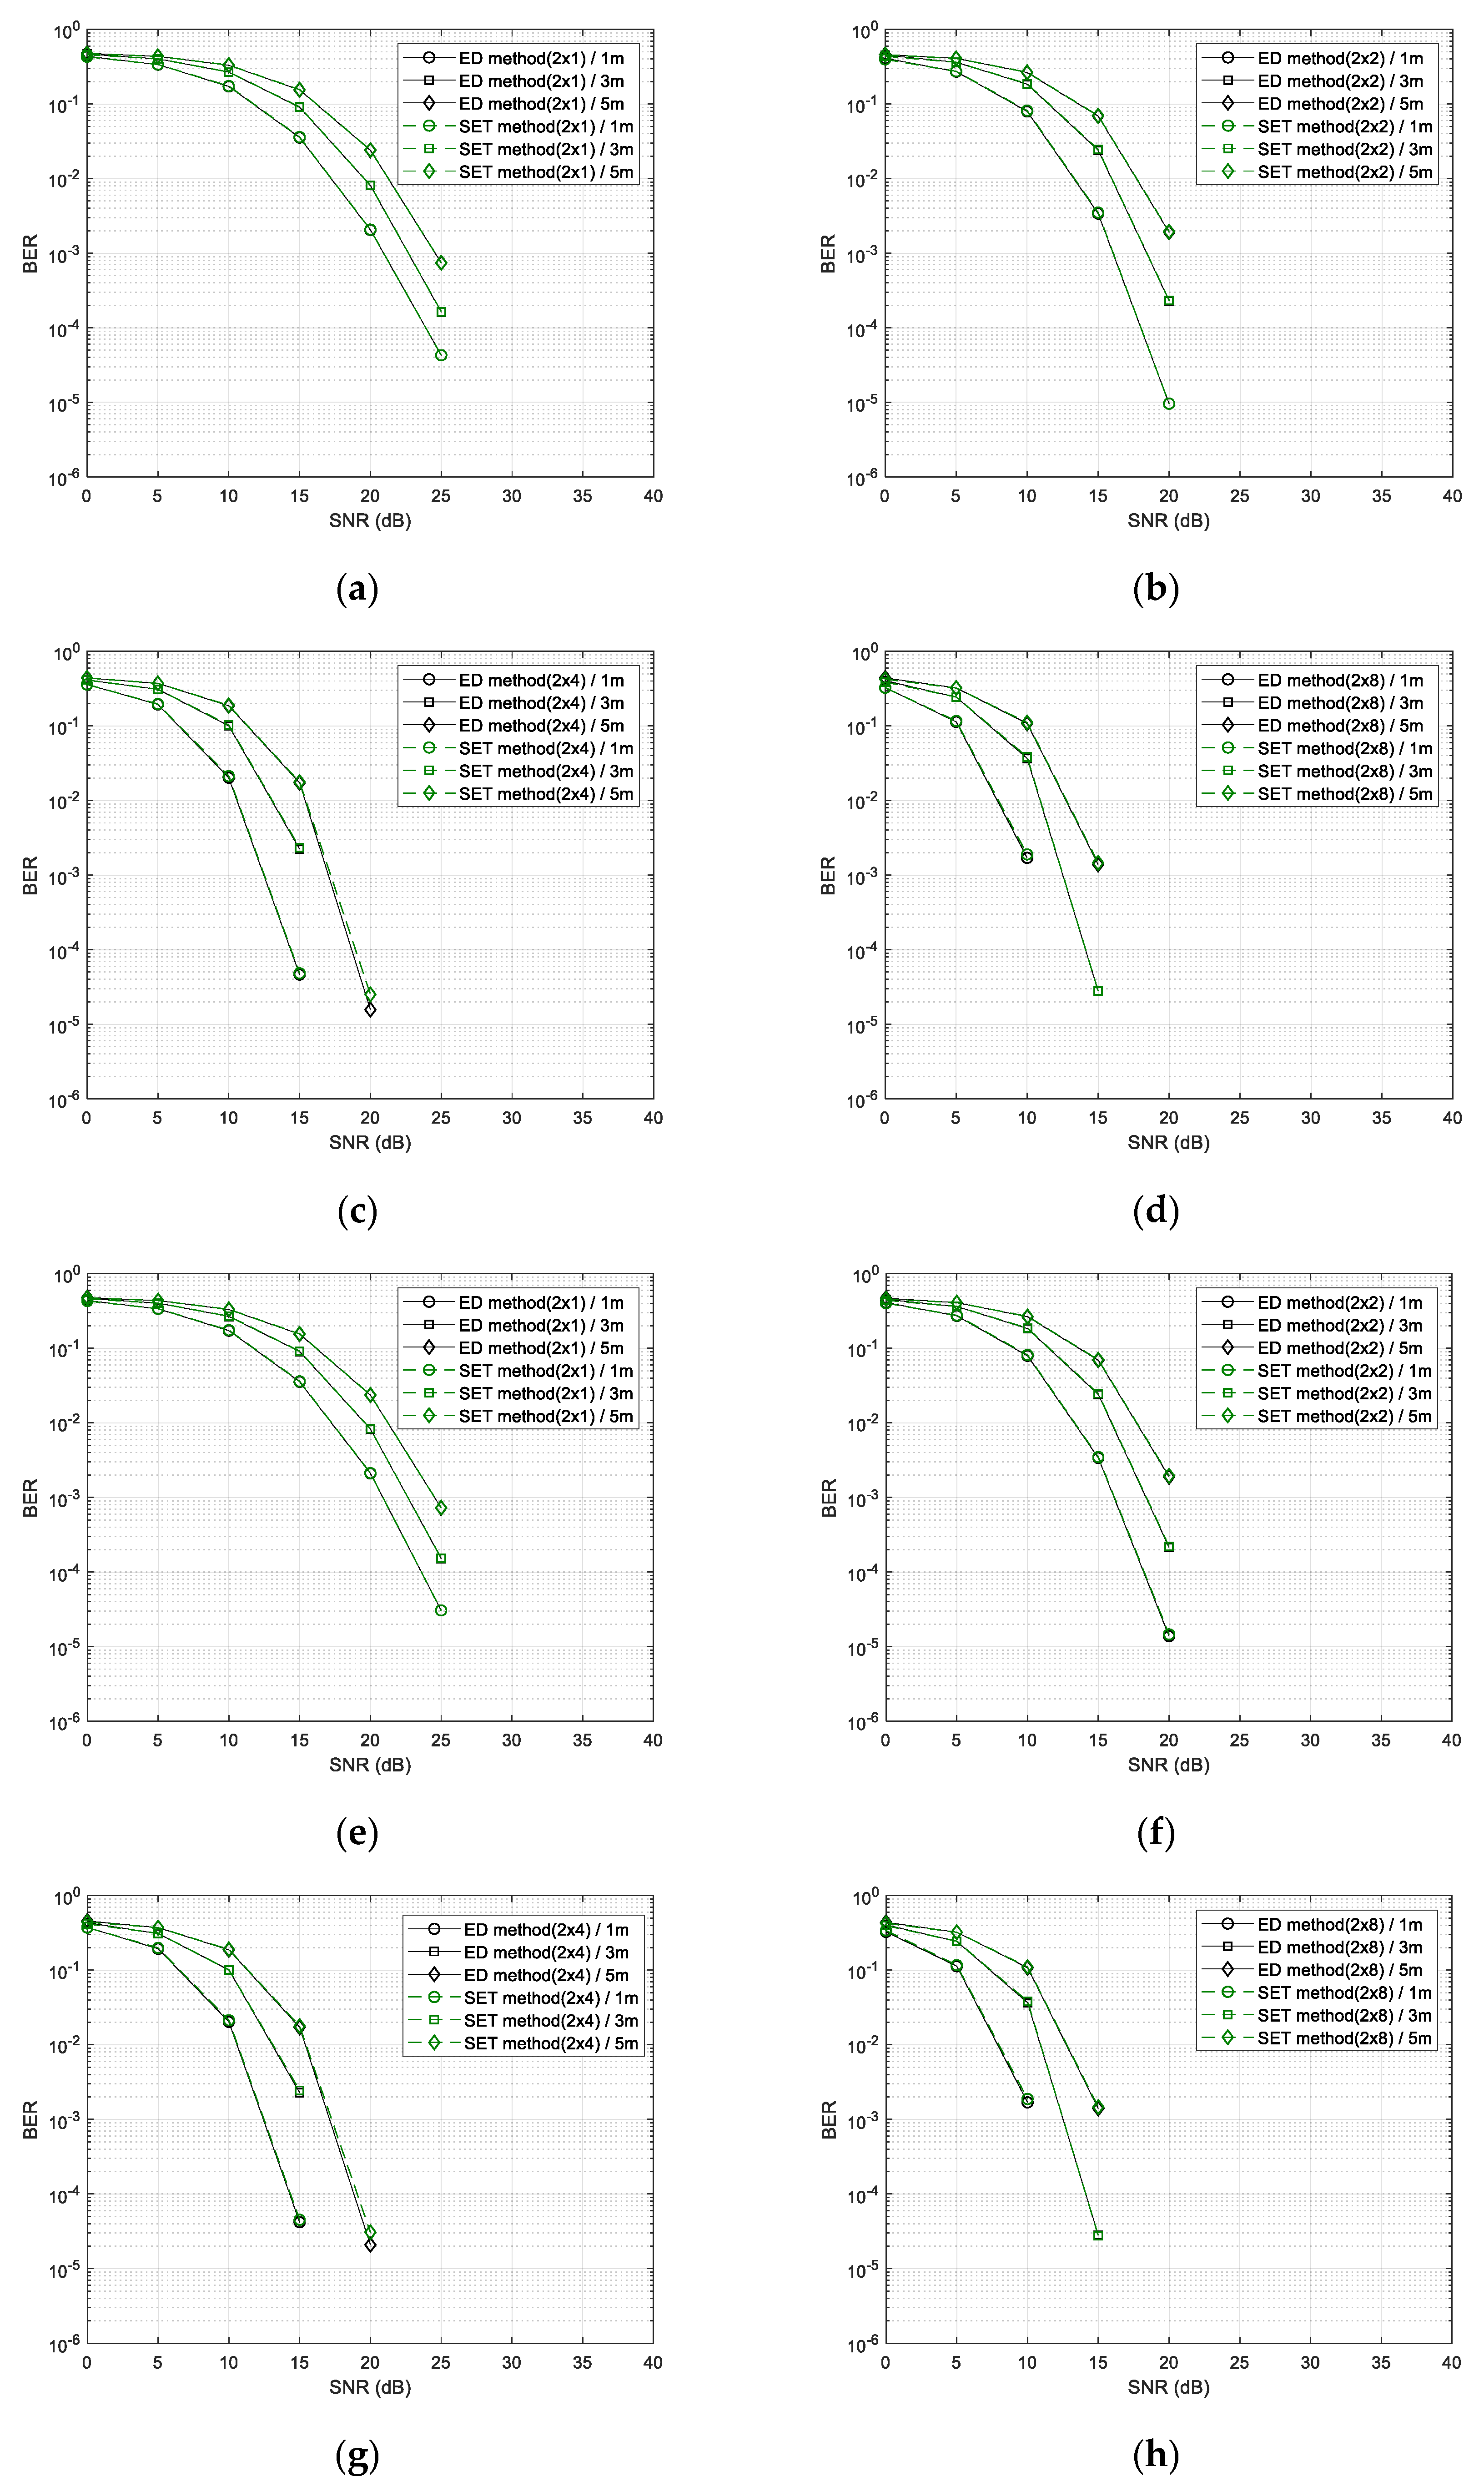
4.2.1. SET Method
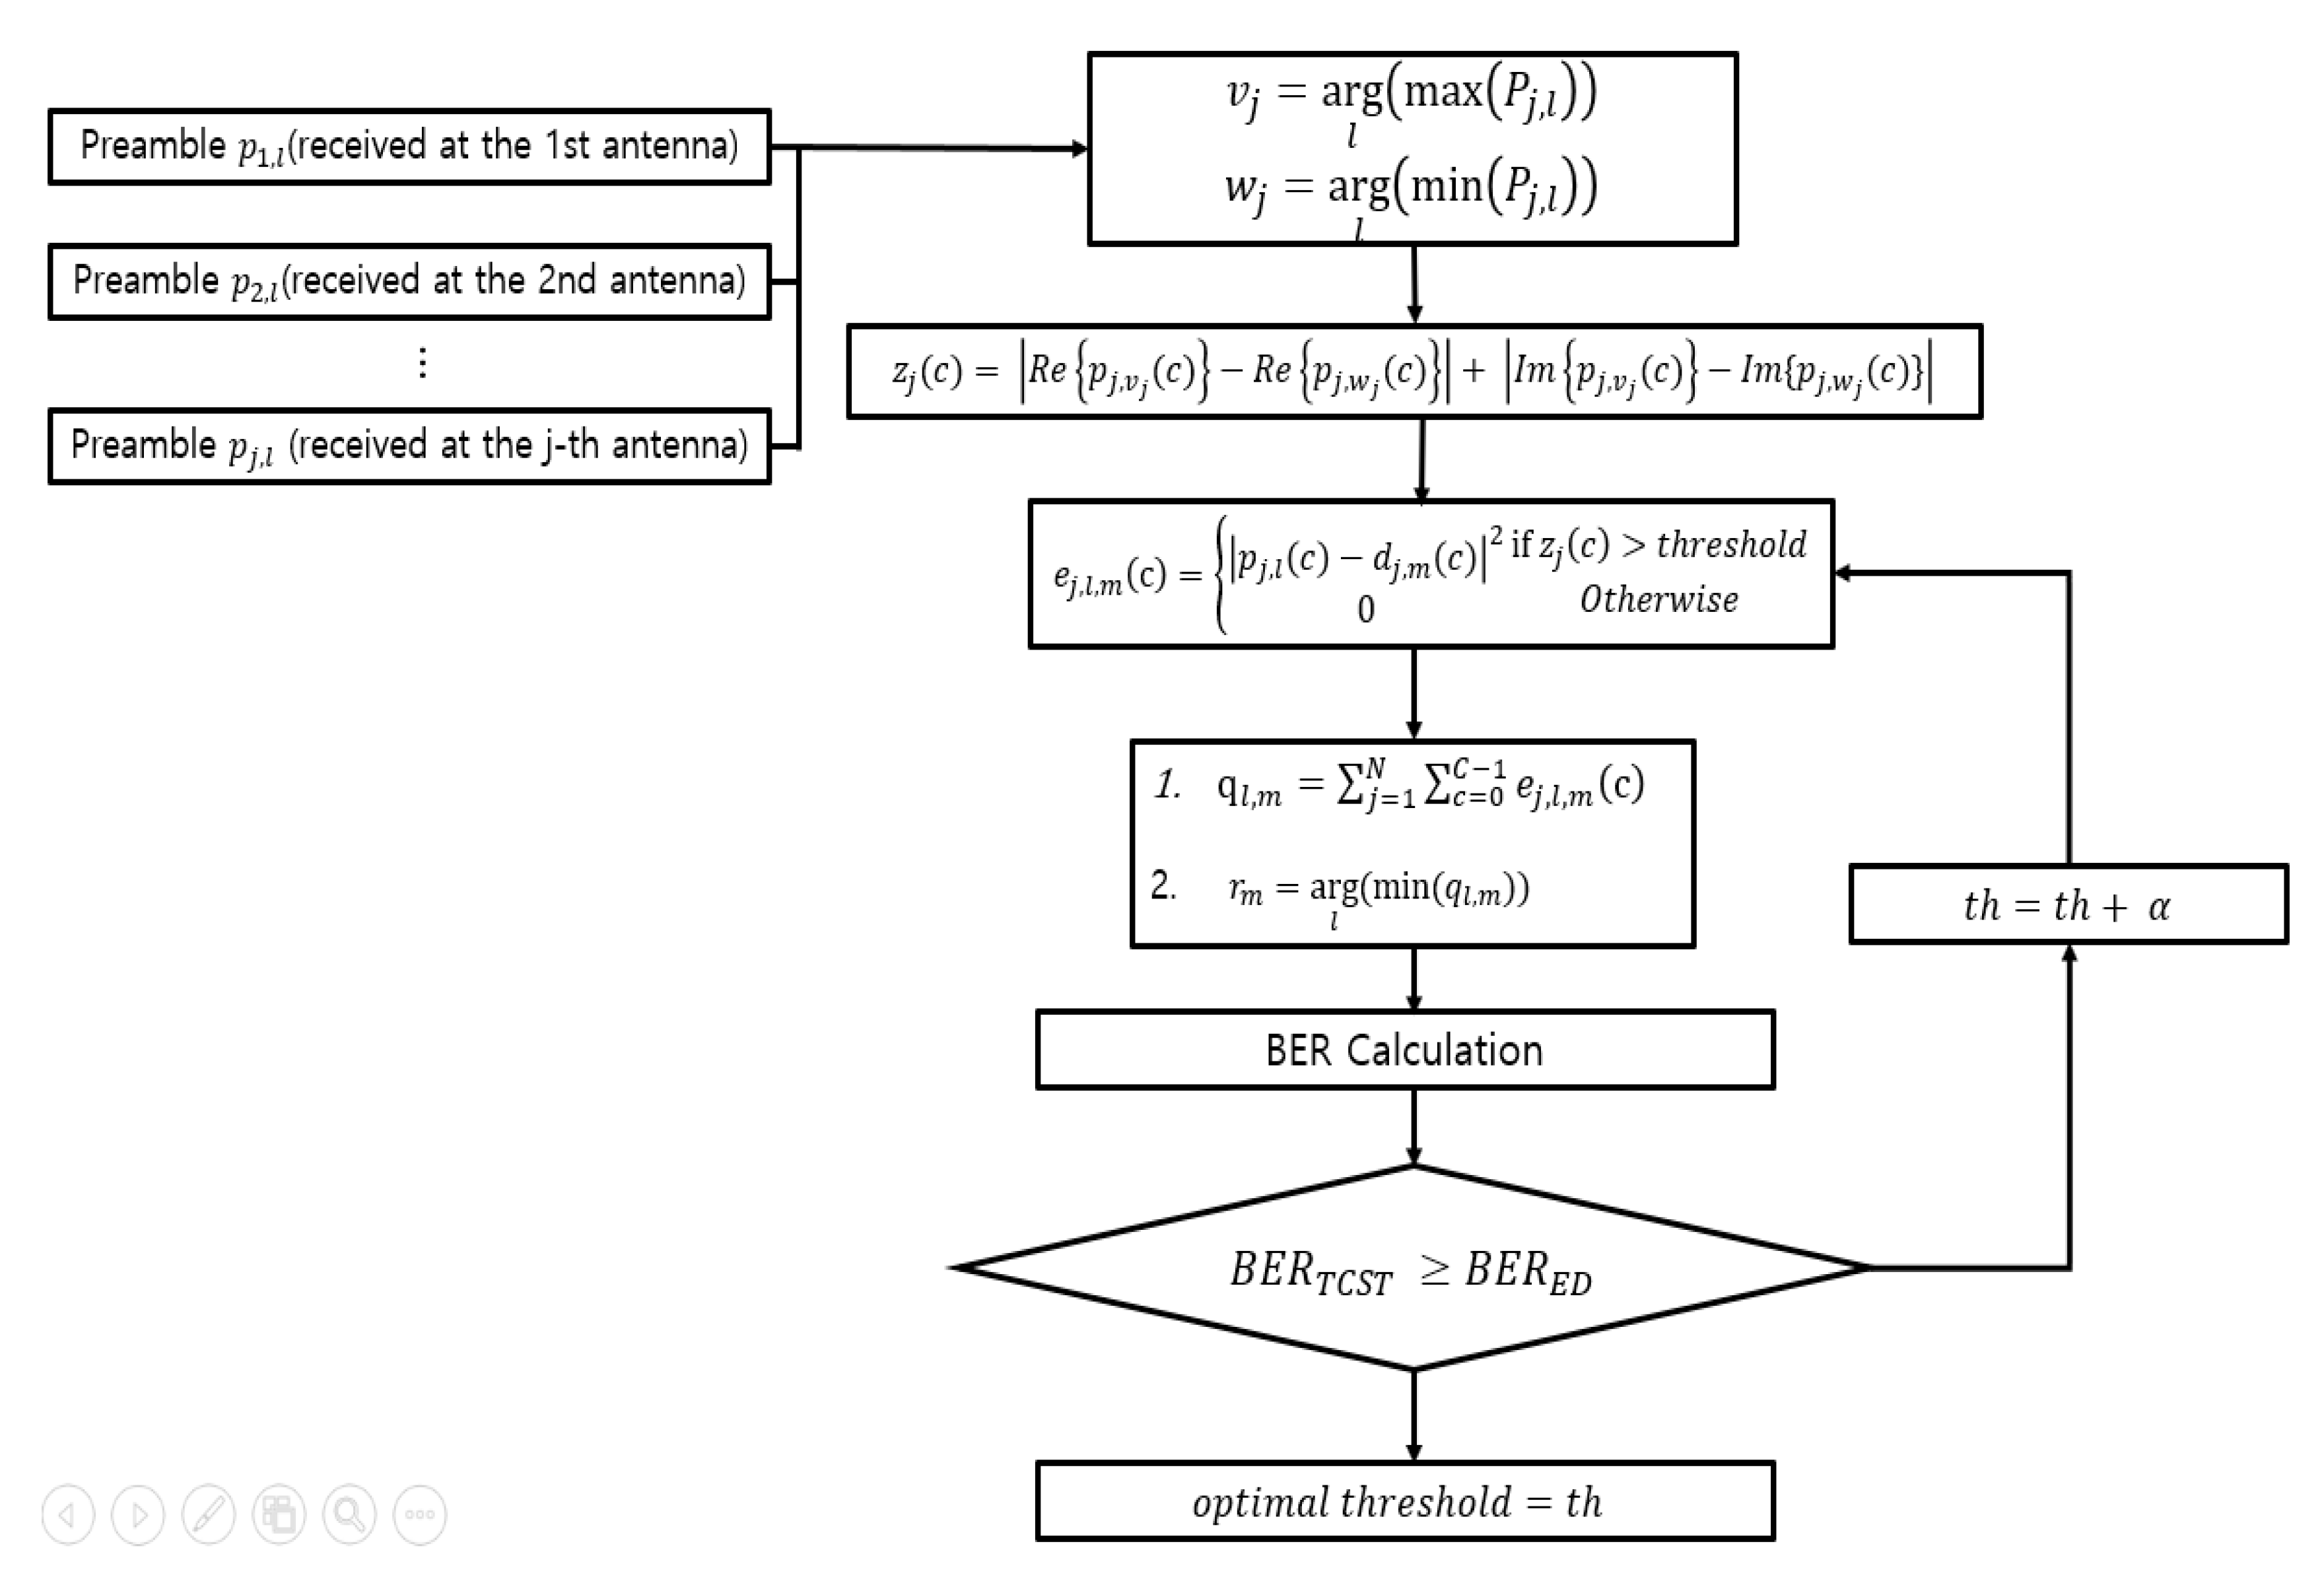
4.2.2. TCST Method
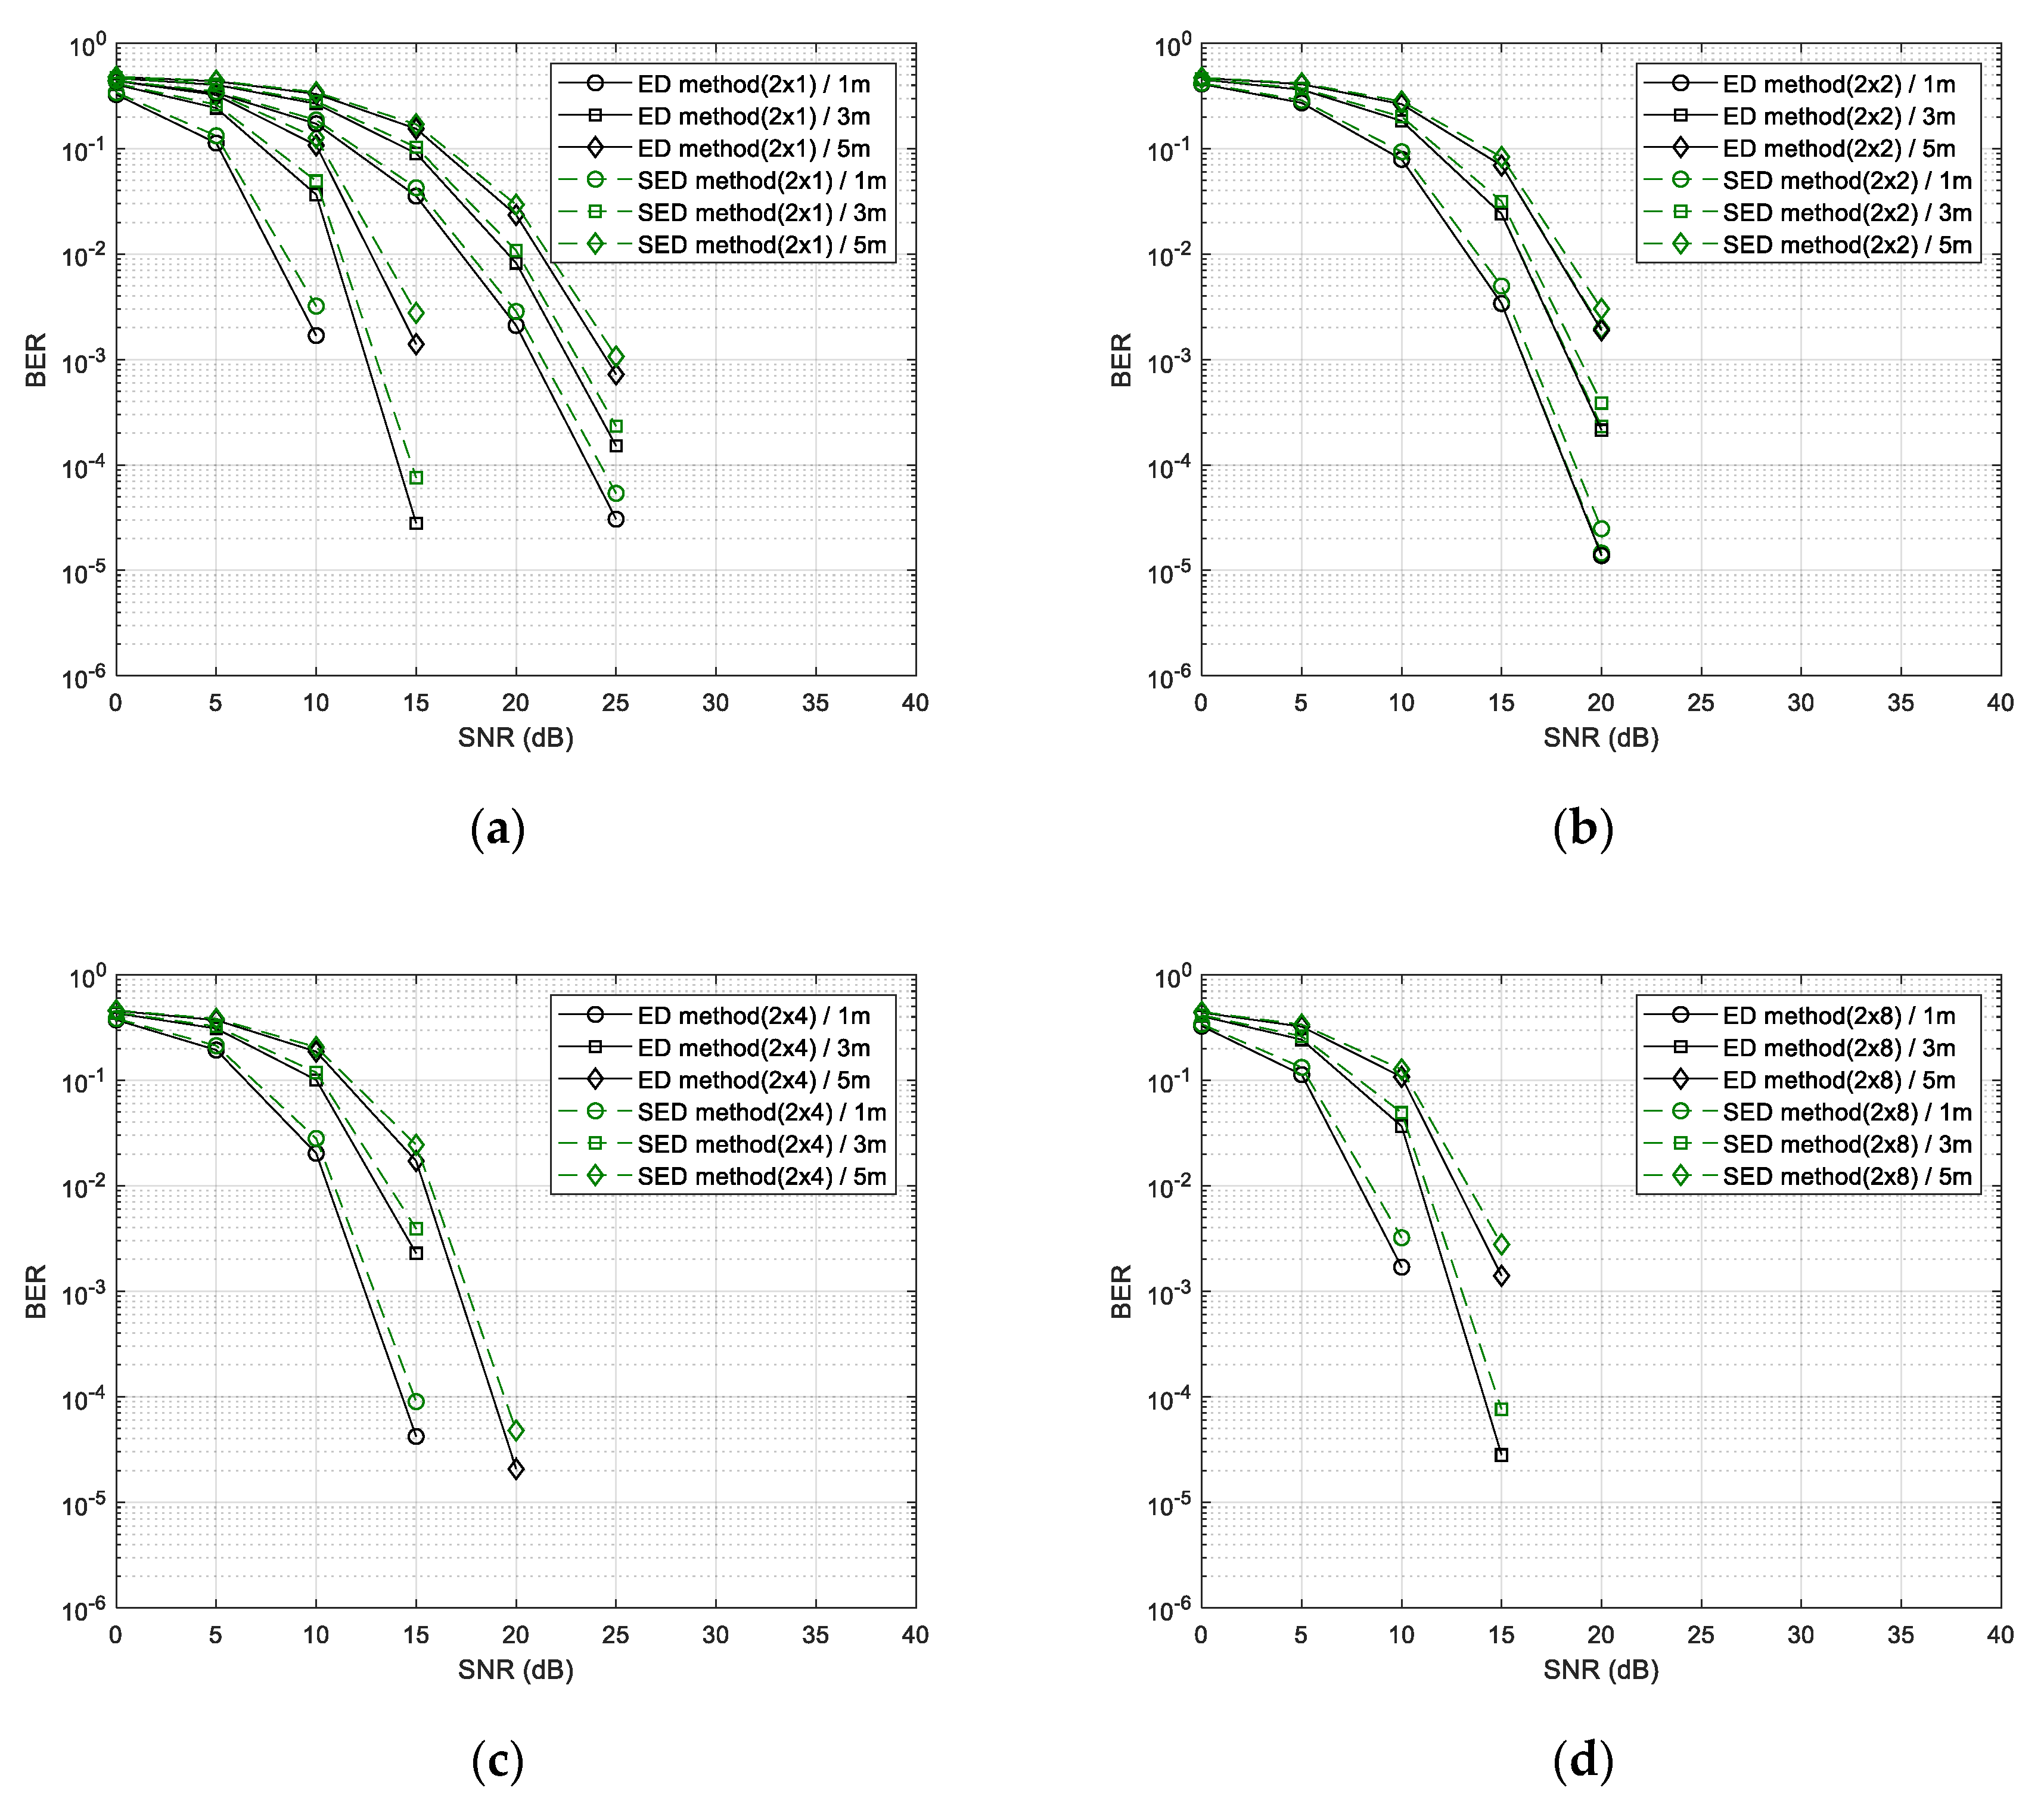
4.2.3. SED Method
5. Experimental Results
5.1. Performance Evaluation for MIMO Wi-Fi Backscatter System
5.2. Performance and Computational Complexity of the Low Complexity Demodulation Method
5.2.1. Performance Evaluation of Low Complexity Demodulation Method
5.2.2. Computational Complexity of Proposed Demodulation Methods
6. Conclusions
Author Contributions
Funding
Conflicts of Interest
References
- Xia, F.; Yang, L.T.; Wang, L. A Vinel, Internet of things. Int. J. Commun. Syst. 2012, 25, 1101. [Google Scholar] [CrossRef]
- Gubbi, J.; Buyya, R.; Marusic, S.; Palaniswami, M. Internet of Things (IoT): A vision, architectural elements, and future directions. Future Gener. Comput. Syst. 2013, 29, 1645–1660. [Google Scholar] [CrossRef]
- Lee, I.; Kyoochun, L.; Palaniswami, M. The Internet of Things (IoT): Applications, investments, and challenges for enterprises. Bus. Horiz. 2015, 58, 431–440. [Google Scholar] [CrossRef]
- Hui, S.Y. Planar wireless charging technology for portable electronic products and Qi. Proc. IEEE 2013, 101, 1290–1301. [Google Scholar] [CrossRef]
- Lu, X.; Wang, P.; Niyato, D.; Kim, D.I.; Han, Z. Wireless charging technologies: Fundamentals, standards, and network applications. IEEE Commun. Surv. Tutor. 2016, 18, 1413–1452. [Google Scholar] [CrossRef]
- Piñuela, M.; Paul, D.M.; Stepan, L. Ambient RF energy harvesting in urban and semi-urban environments. IEEE Trans. Microw. Theory Tech. 2013, 61, 2715–2726. [Google Scholar] [CrossRef]
- Lu, X.; Wang, P.; Niyato, D.; Kim, D.I.; Han, Z. Wireless Networks with RF Energy Harvesting: A Contemporary Survey. IEEE Commun. Surv. Tutor. 2015, 17, 757–789. [Google Scholar] [CrossRef]
- Darak, S.J.; Zhang, H.; Palicot, J.; Moy, C. Decision making policy for RF energy harvesting enabled cognitive radios in decentralized wireless networks. Digit. Signal Process. 2017, 60, 33–45. [Google Scholar] [CrossRef]
- Kellogg, B.; Parks, A.; Gollakota, S.; Smith, J.R.; Wetherall, D. Wi-Fi backscatter: Internet connectivity for RF-powered devices. ACM SIGCOMM Comput. Commun. Rev. 2014, 44, 607–618. [Google Scholar] [CrossRef]
- Kellogg, B.; Talla, V.; Gollakota, S.; Smith, J.R. Passive Wi-Fi: Bringing Low Power to Wi-Fi Transmissions. NSDI 2016, 16, 151–164. [Google Scholar] [CrossRef]
- Bharadia, D.; Joshi, K.R.; Kotaru, M.; Katti, S. Backfi: High throughput wifi backscatter. ACM SIGCOMM Comput. Commun. Rev. 2015, 45, 283–296. [Google Scholar] [CrossRef]
- Park, H.; Lee, N.; Jun, Y.; Jung, Y.; Lee, S. A Method for Throughput Enhancement in Wi-Fi Backscatter Communications Using Power-Level Modulation. AEU-Int. J. Electron. Commun. 2018, 85, 169–173. [Google Scholar] [CrossRef]
- Erceg, V. TGn Channel Models. 2004. Available online: https://www.semanticscholar.org/paper/IEEE-P802.11-Wireless-LANs-TGn-Channel-Models-Erceg/619aa9b3bb557065ddd480f59da5c180d7a38ee3 (accessed on 27 February 2020).
- Li, J.; Zhang, X.; Wang, Z.; Chen, X.; Chen, J.; Li, Y.; Zhang, A. Dual-band eight-antenna array design for MIMO applications in 5G mobile terminals. IEEE Access 2019, 7, 71636–71644. [Google Scholar] [CrossRef]
- Wang, H.; Zhang, R.; Luo, Y.; Yang, G. Compact Eight-Element Antenna Array for Triple-Band MIMO Operation in 5G Mobile Terminals. IEEE Access 2020, 8, 19433–19449. [Google Scholar] [CrossRef]
- Arm. Arm® Cortex®-A75 Software Optimization Guide; Arm: Cambridge, UK, 2018; pp. 12–15. [Google Scholar]


| # of Antennas | ||||||
|---|---|---|---|---|---|---|
| 1 | 2 | 4 | 8 | |||
| SNR | 0 | Threshold | 1 | 1 | 1 | 0.75 |
| Average # of subcarrier | 36 | 25 | 13 | 7 | ||
| 5 | Threshold | 0.316 | 0.158 | 0.08 | 0.039 | |
| Average # of subcarrier | 45 | 45 | 45 | 45 | ||
| 10 | Threshold | 0.1 | 0.05 | 0.025 | 0.125 | |
| Average # of subcarrier | 49 | 50 | 50 | 50 | ||
| 15 | Threshold | 0.031 | 0.015 | 0.007 | 0.004 | |
| Average # of subcarrier | 51 | 51 | 51 | 51 | ||
| 20 | Threshold | 0.01 | 0.005 | 0.03 | 0.083 | |
| Average # of subcarrier | 51 | 51 | 49 | 38 | ||
| 25 | Threshold | 0.003 | 0.031 | 0.119 | 0.193 | |
| Average # of subcarrier | 51 | 50 | 42 | 26 | ||
| 30 | Threshold | 0.02 | 0.12 | 0.25 | 0.538 | |
| Average # of subcarrier | 51 | 47 | 33 | 9 | ||
| 35 | Threshold | 0.063 | 0.198 | 0.64 | 0.988 | |
| Average # of subcarrier | 50 | 43 | 17 | 3 | ||
| 40 | Threshold | 0.08 | 0.25 | 1 | 1 | |
| Average # of subcarrier | 49 | 41 | 10 | 3 | ||
| # of Antennas | ||||||
|---|---|---|---|---|---|---|
| 1 | 2 | 4 | 8 | |||
| SNR | 0 | Threshold | 1 | 0.5 | 0.25 | 0.125 |
| Average # of subcarrier | 51 | 51 | 51 | 51 | ||
| 5 | Threshold | 0.632 | 0.158 | 0.079 | 0.04 | |
| Average # of subcarrier | 51 | 51 | 51 | 51 | ||
| 10 | Threshold | 0.2 | 0.05 | 0.025 | 0.013 | |
| Average # of subcarrier | 51 | 51 | 51 | 51 | ||
| 15 | Threshold | 0.063 | 0.016 | 0.008 | 0.004 | |
| Average # of subcarrier | 51 | 51 | 51 | 51 | ||
| 20 | Threshold | 0.01 | 0.005 | 0.01 | 0.023 | |
| Average # of subcarrier | 51 | 51 | 51 | 37 | ||
| 25 | Threshold | 0.003 | 0.013 | 0.026 | 0.019 | |
| Average # of subcarrier | 51 | 50 | 34 | 21 | ||
| 30 | Threshold | 0.013 | 0.02 | 0.018 | 0.038 | |
| Average # of subcarrier | 50 | 42 | 28 | 1 | ||
| 35 | Threshold | 0.004 | 0.014 | 0.014 | 0.028 | |
| Average # of subcarrier | 48 | 37 | 15 | 1 | ||
| 40 | Threshold | 0.008 | 0.001 | 0.021 | 0.013 | |
| Average # of subcarrier | 47 | 31 | 1 | 1 | ||
| # of additions | # of multiplications | |
|---|---|---|
| ED | ||
| SET | ||
| TCST | ||
| SED | - |
| # of Antennas | Method | C | Computational Complexity | ||||
|---|---|---|---|---|---|---|---|
| # of Instruction for Additions | # of Instruction for Multiplications | Total # of Instruction Clock Cycles | Reduction Ratio (%) | ||||
| ED | 52 | - | 828 | 416 | 2076 | - | |
| SET | - | 48 | 764 | 384 | 1916 | 7 | |
| TCST | - | 50 | 952 | 400 | 2152 | -3 | |
| SED | 52 | - | 828 | - | 828 | 60 | |
| ED | 52 | - | 1656 | 832 | 4152 | - | |
| SET | - | 46 | 1464 | 736 | 3672 | 11 | |
| TCST | - | 46 | 1776 | 736 | 3984 | 4 | |
| SED | 52 | - | 1656 | - | 1656 | 60 | |
| ED | 52 | - | 3312 | 1664 | 8304 | - | |
| SET | - | 35 | 2224 | 1120 | 5584 | 32 | |
| TCST | - | 37 | 2976 | 1184 | 6528 | 21 | |
| SED | 52 | - | 3312 | - | 3312 | 60 | |
| ED | 52 | - | 6624 | 3328 | 16608 | - | |
| SET | - | 28 | 3552 | 1792 | 8928 | 46 | |
| TCST | - | 31 | 5184 | 1984 | 11136 | 33 | |
| SED | 52 | - | 6624 | - | 6624 | 60 | |
© 2020 by the authors. Licensee MDPI, Basel, Switzerland. This article is an open access article distributed under the terms and conditions of the Creative Commons Attribution (CC BY) license (http://creativecommons.org/licenses/by/4.0/).
Share and Cite
Kim, T.; Park, H.; Jung, Y.; Lee, S. Wi-Fi Backscatter System with Tag Sensors Using Multi-Antennas for Increased Data Rate and Reliability. Sensors 2020, 20, 1314. https://doi.org/10.3390/s20051314
Kim T, Park H, Jung Y, Lee S. Wi-Fi Backscatter System with Tag Sensors Using Multi-Antennas for Increased Data Rate and Reliability. Sensors. 2020; 20(5):1314. https://doi.org/10.3390/s20051314
Chicago/Turabian StyleKim, Taeoh, Hyobeen Park, Yunho Jung, and Seongjoo Lee. 2020. "Wi-Fi Backscatter System with Tag Sensors Using Multi-Antennas for Increased Data Rate and Reliability" Sensors 20, no. 5: 1314. https://doi.org/10.3390/s20051314
APA StyleKim, T., Park, H., Jung, Y., & Lee, S. (2020). Wi-Fi Backscatter System with Tag Sensors Using Multi-Antennas for Increased Data Rate and Reliability. Sensors, 20(5), 1314. https://doi.org/10.3390/s20051314