Fully Integrated Photoacoustic NO2 Sensor for Sub-ppb Level Measurement


Abstract
1. Introduction
2. Sensor Design and Experimental Setup
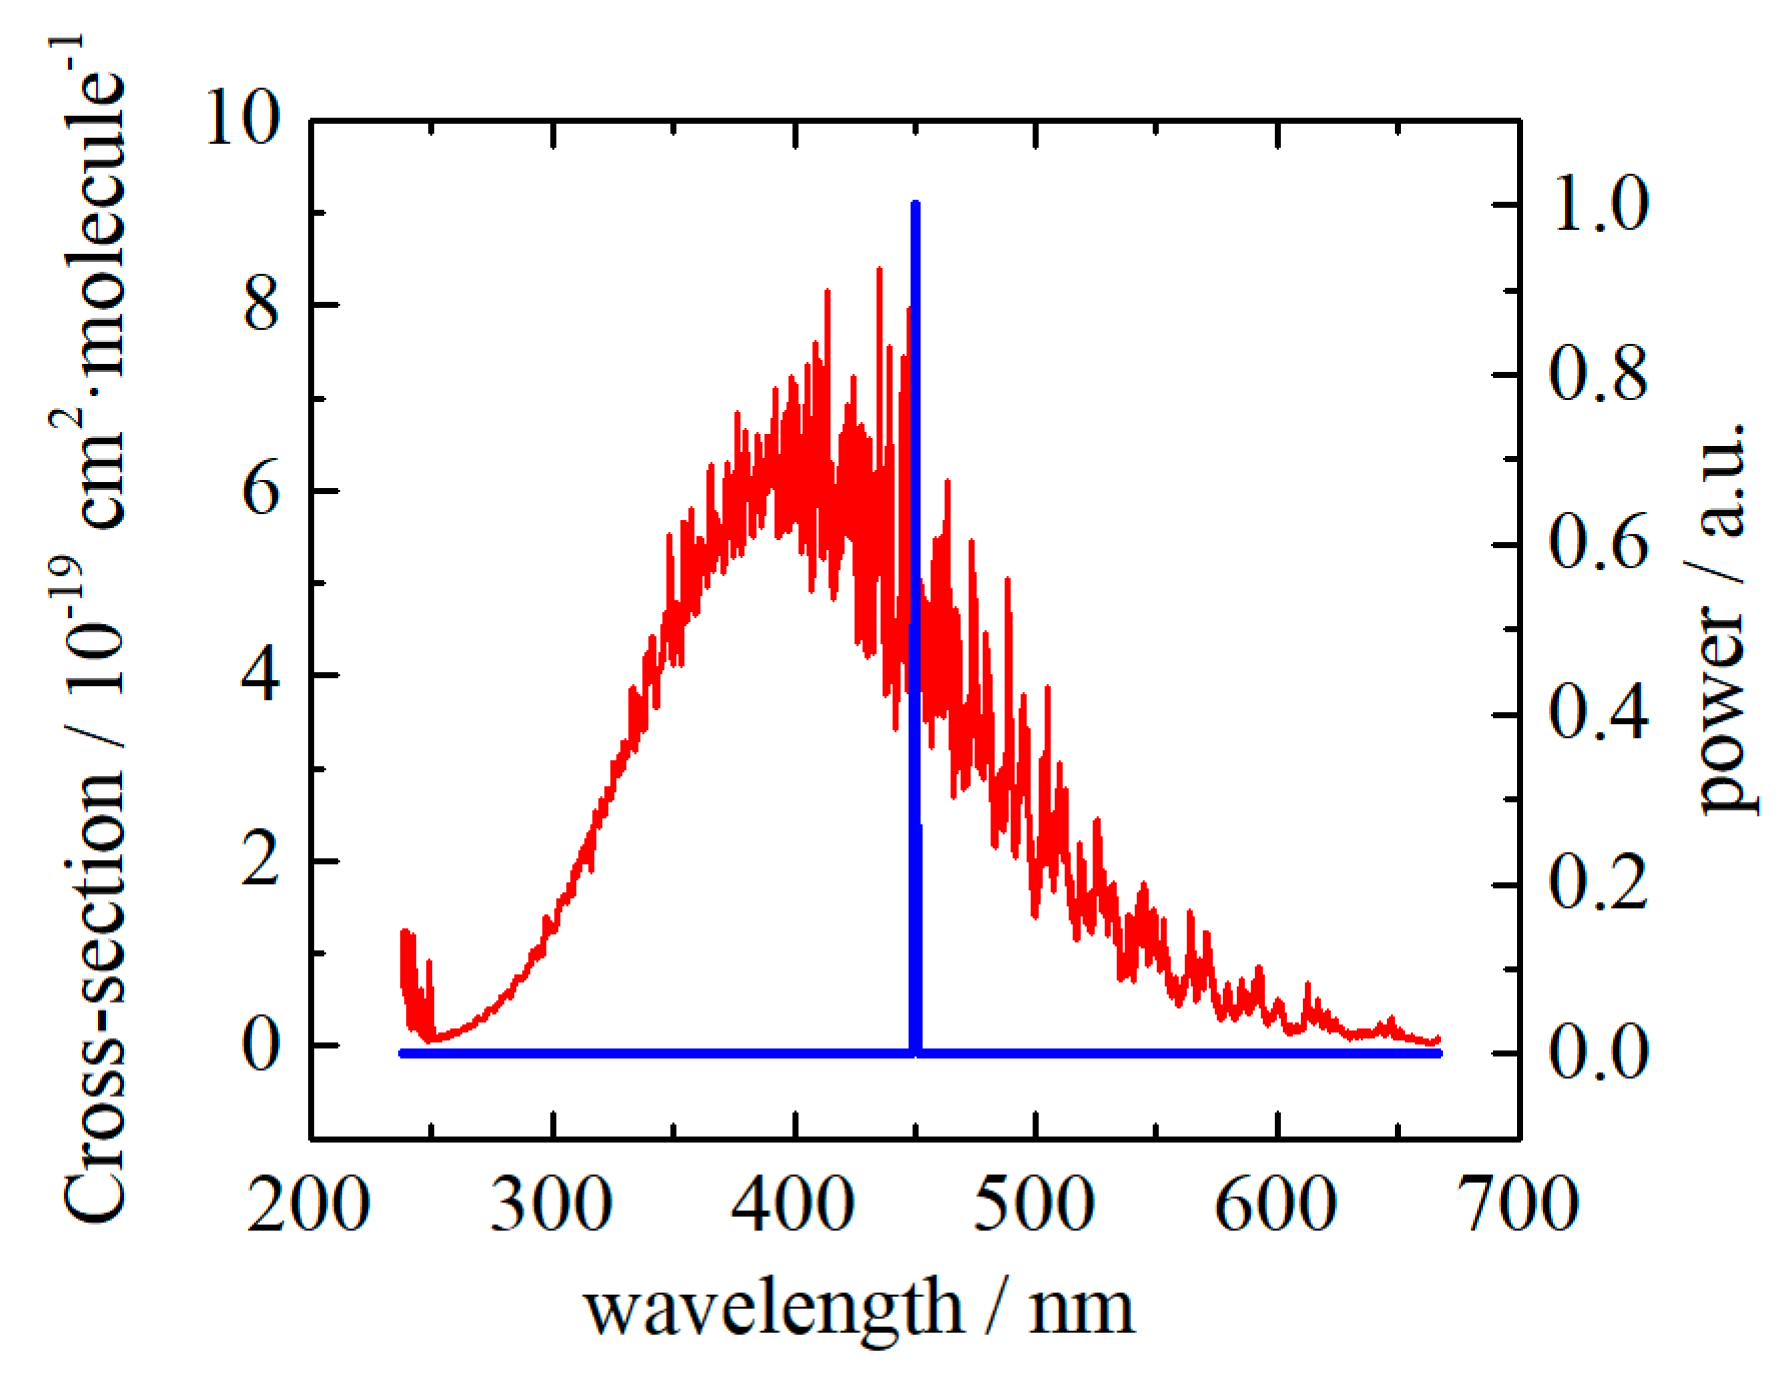
2.1. Laser Source
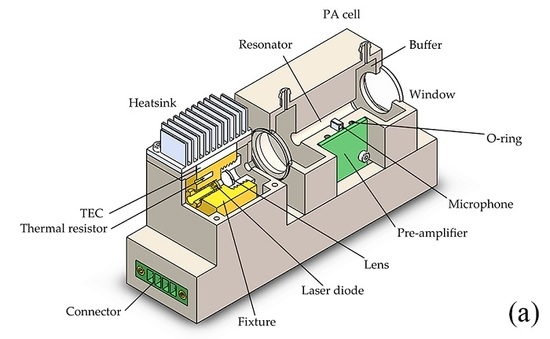
2.2. PA Cell
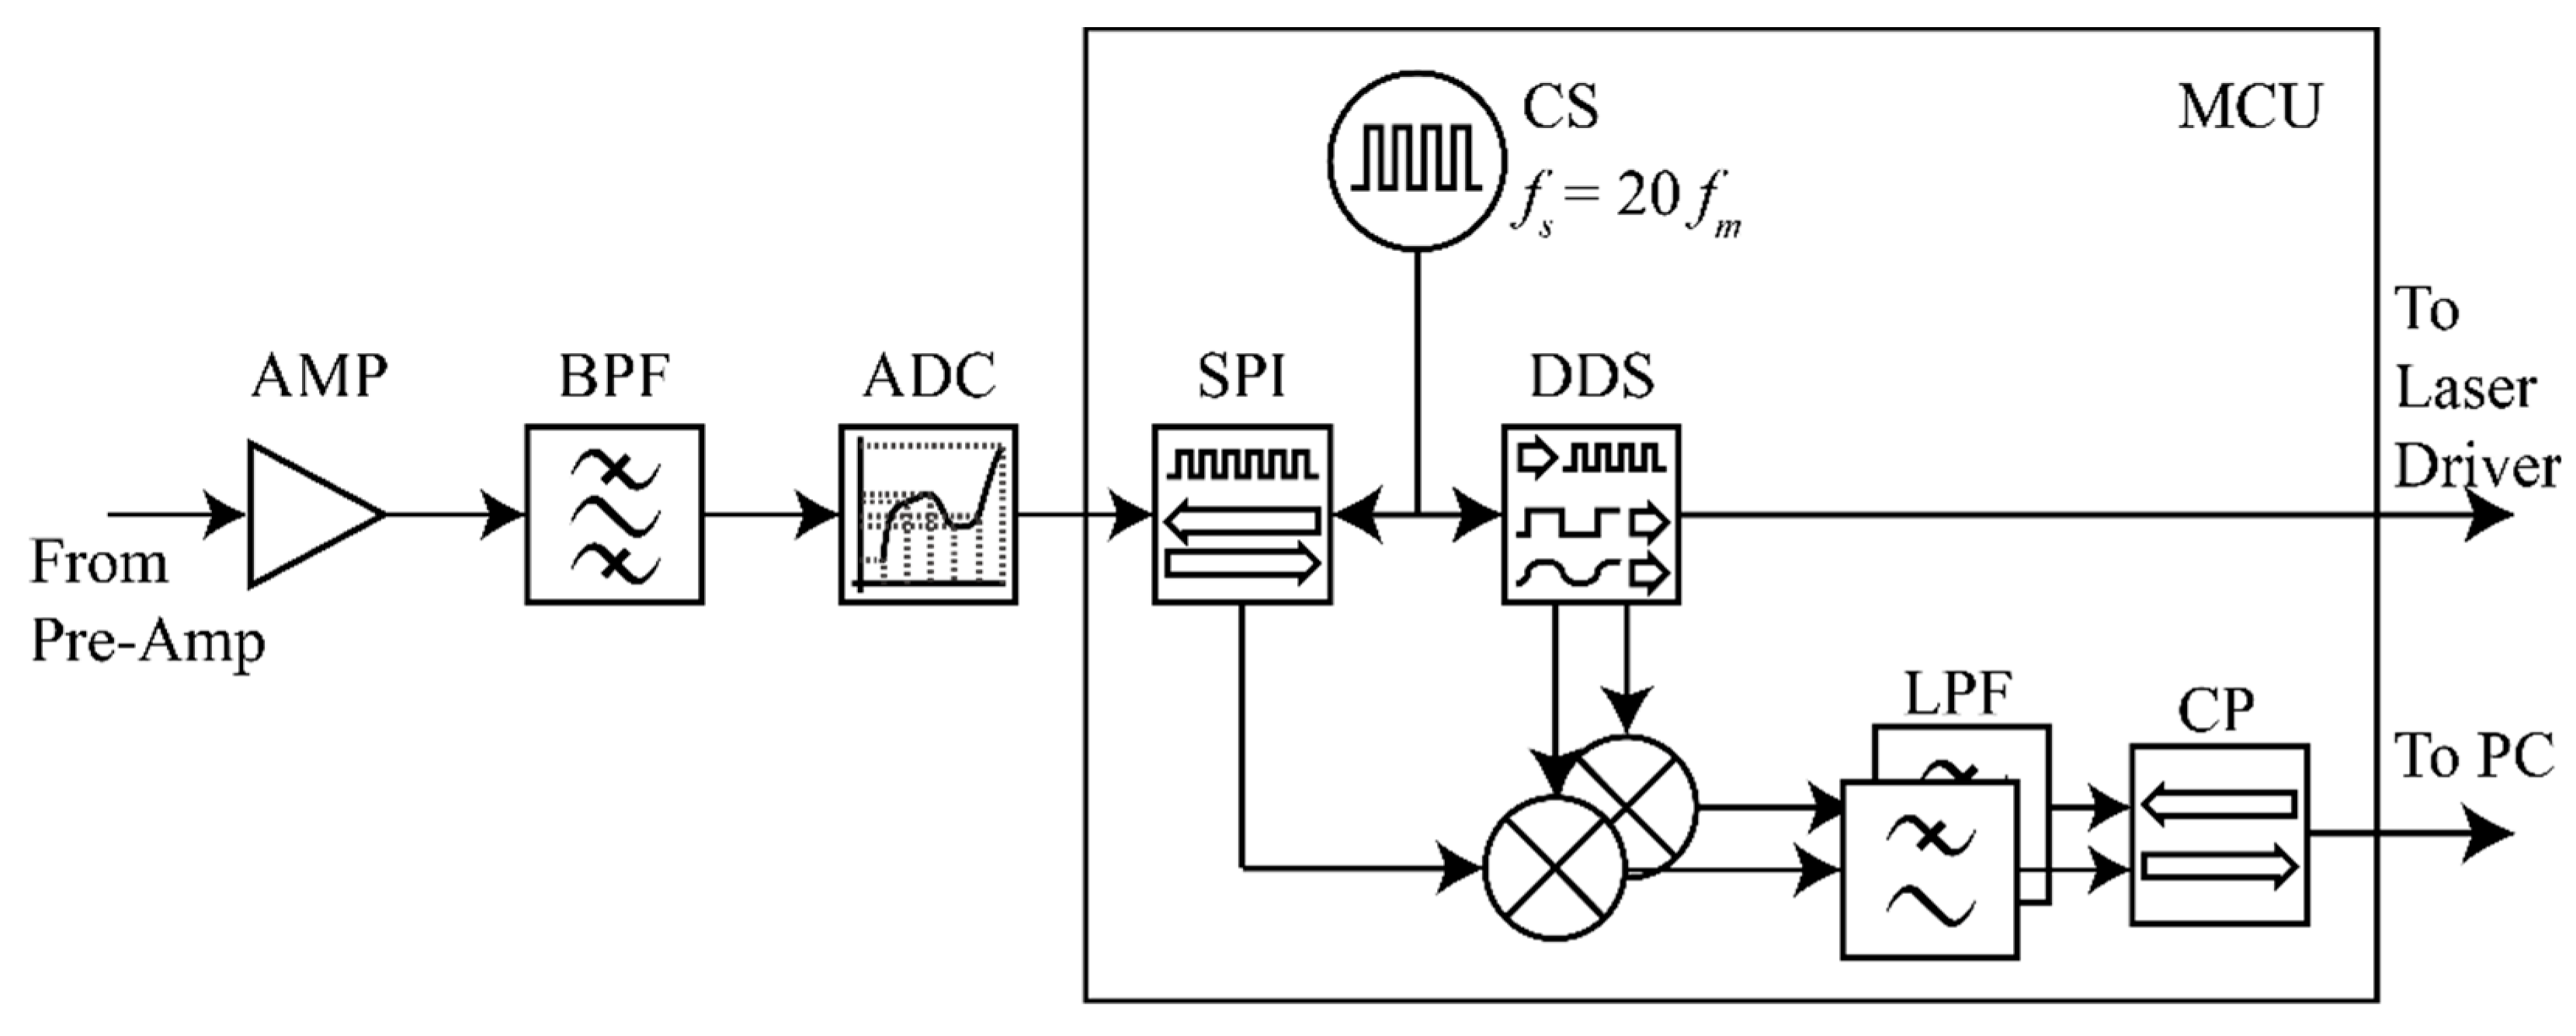
2.3. Signal Processing Circuits
2.4. Laboratory Setup
3. Results and Discussion
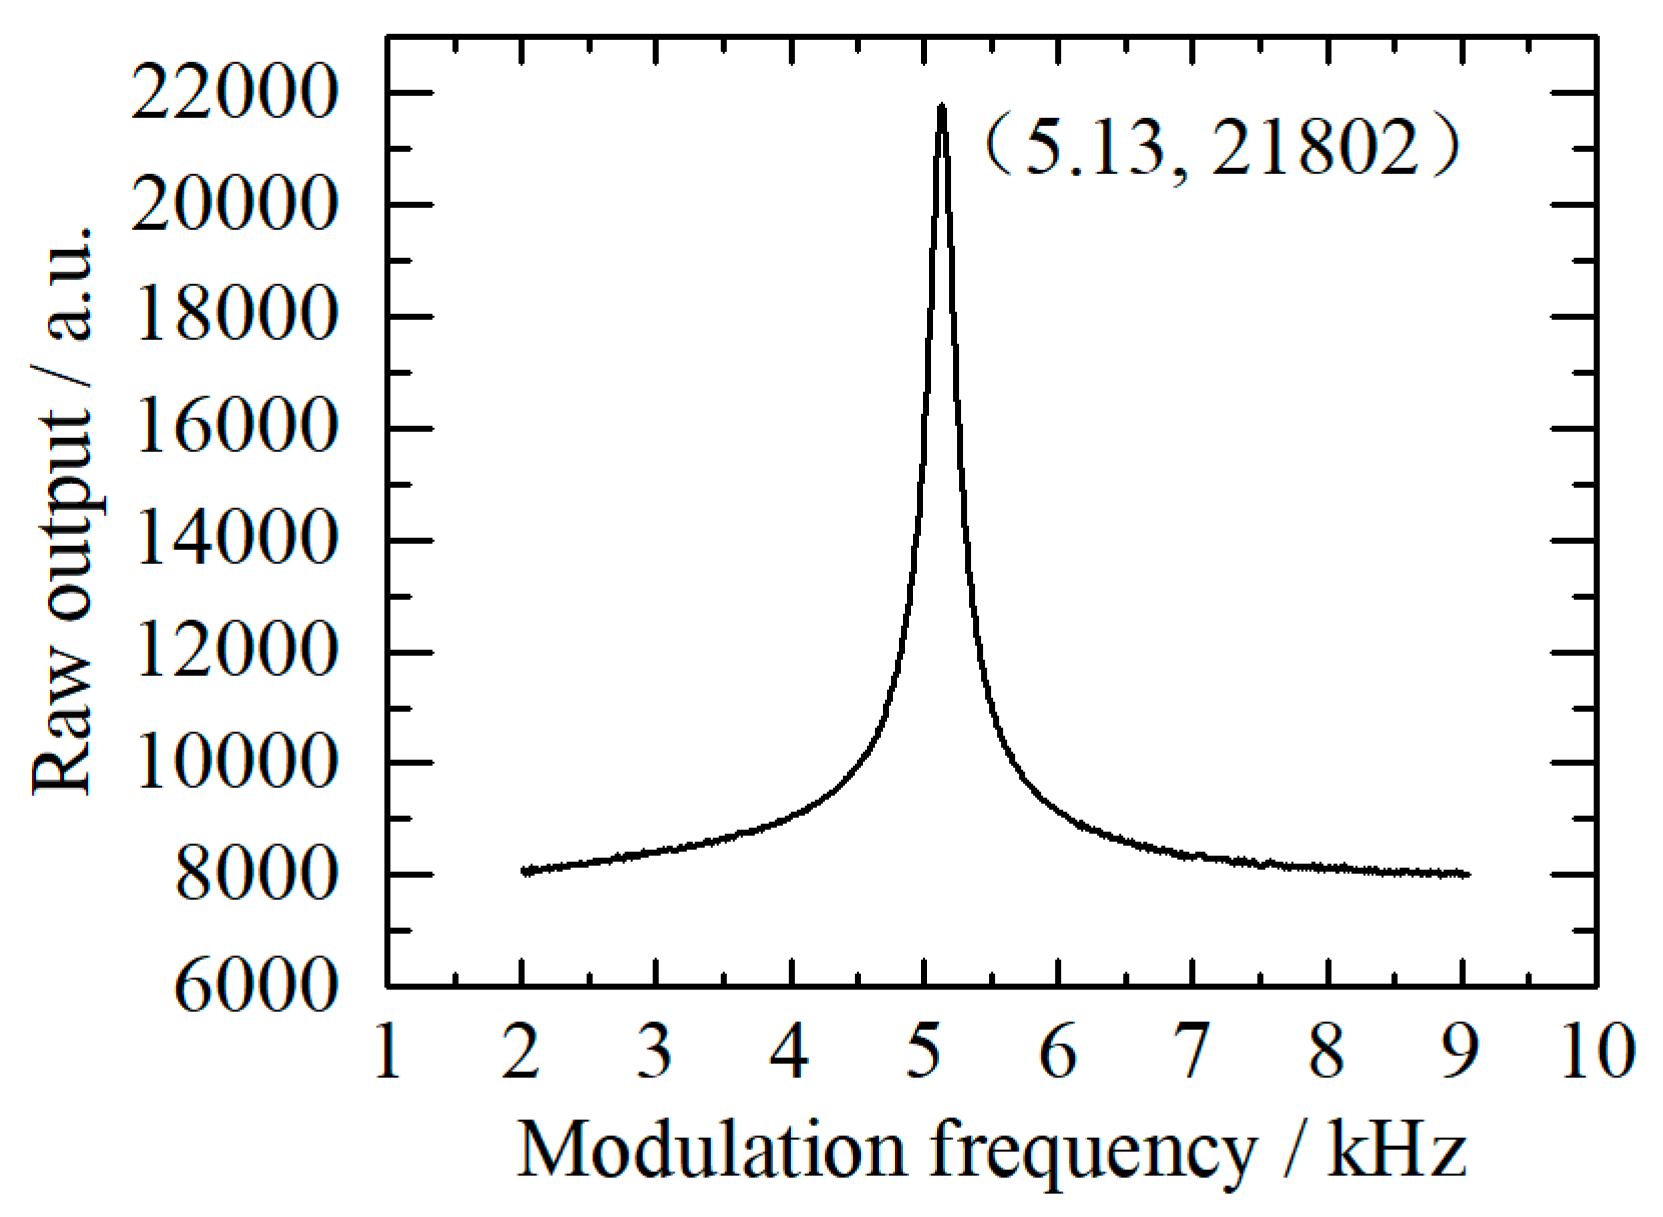
3.1. Resonance Characteristic
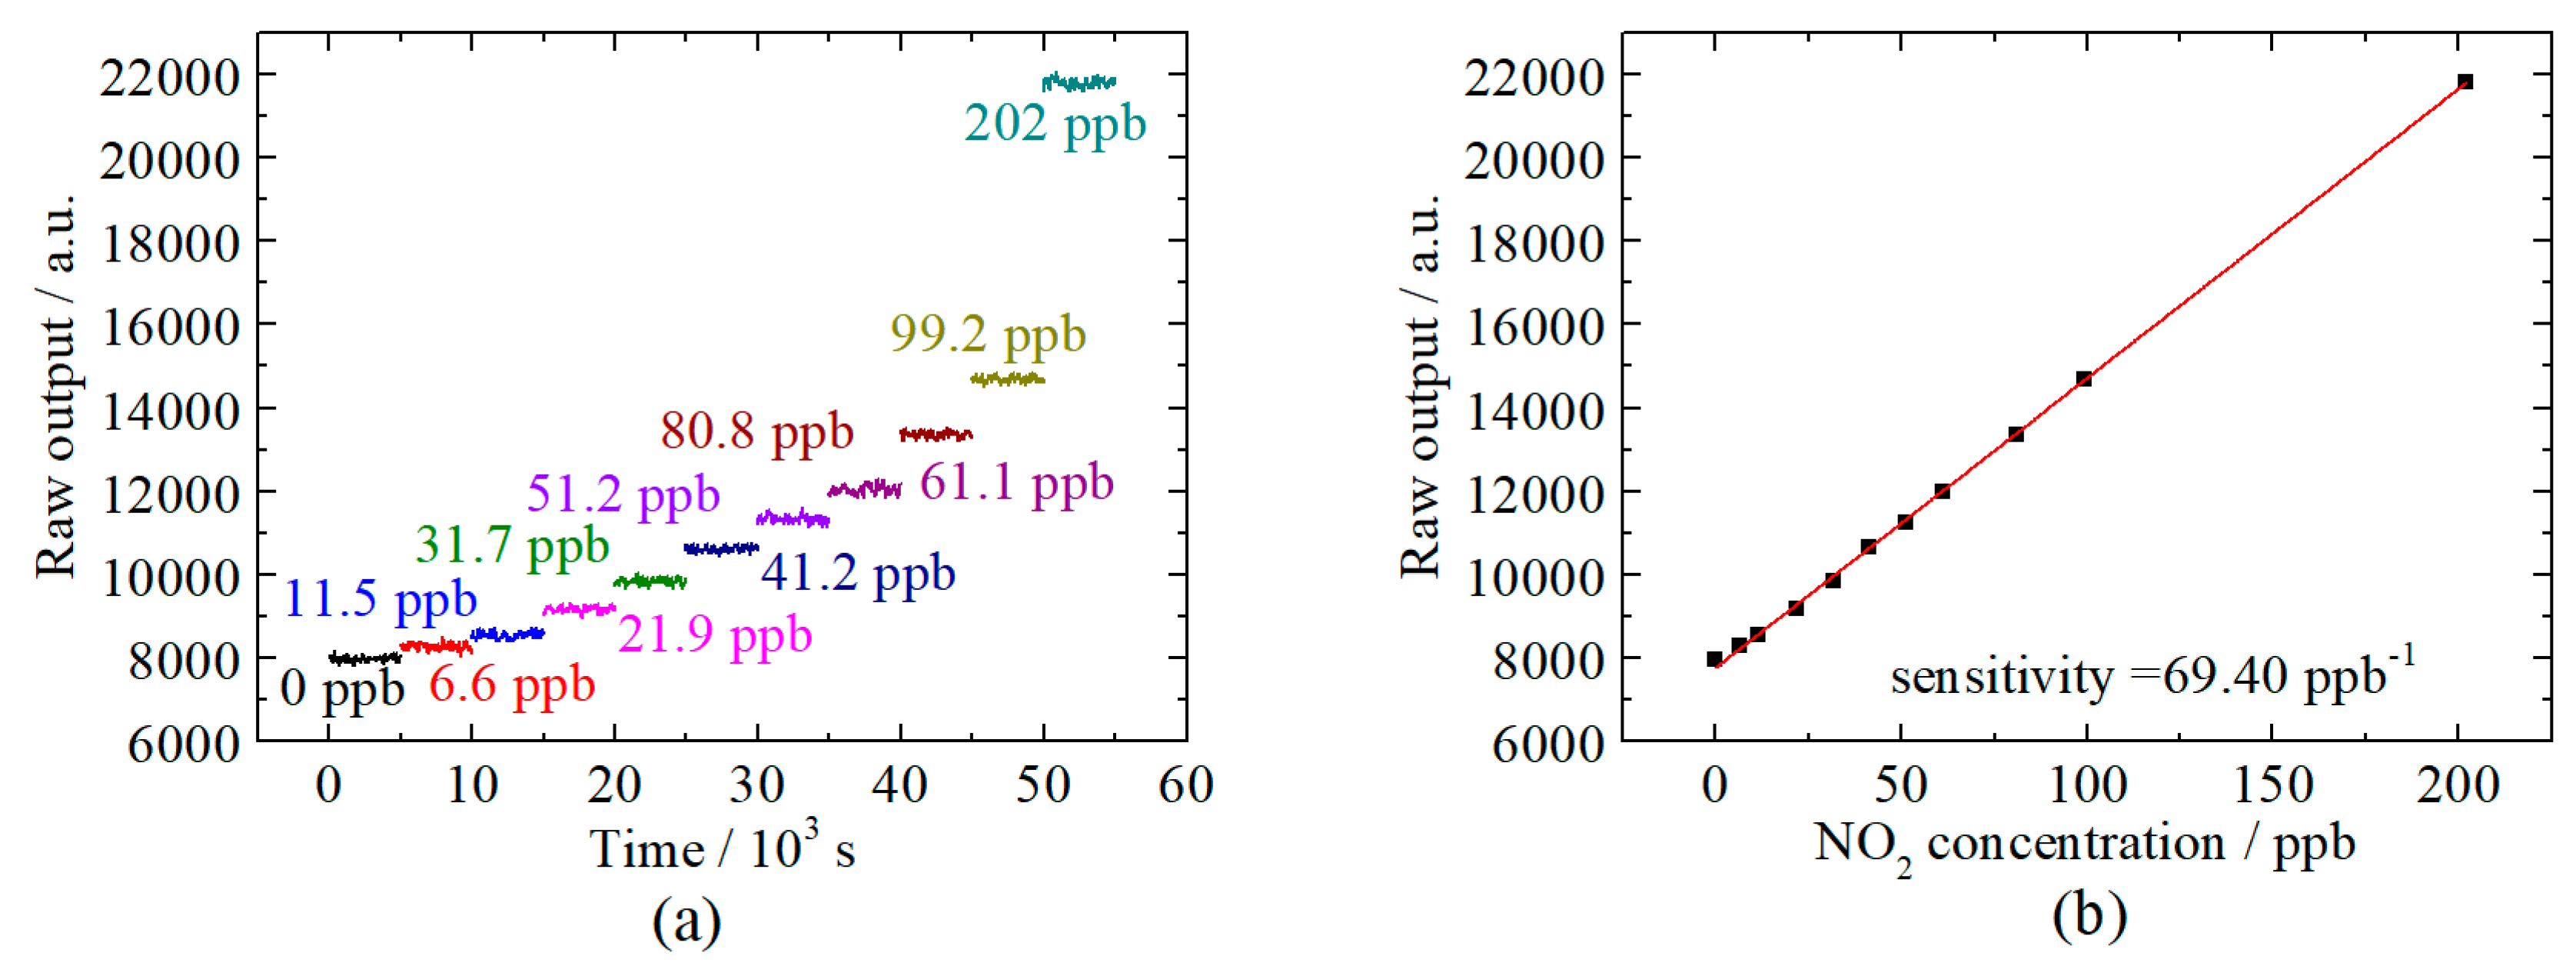
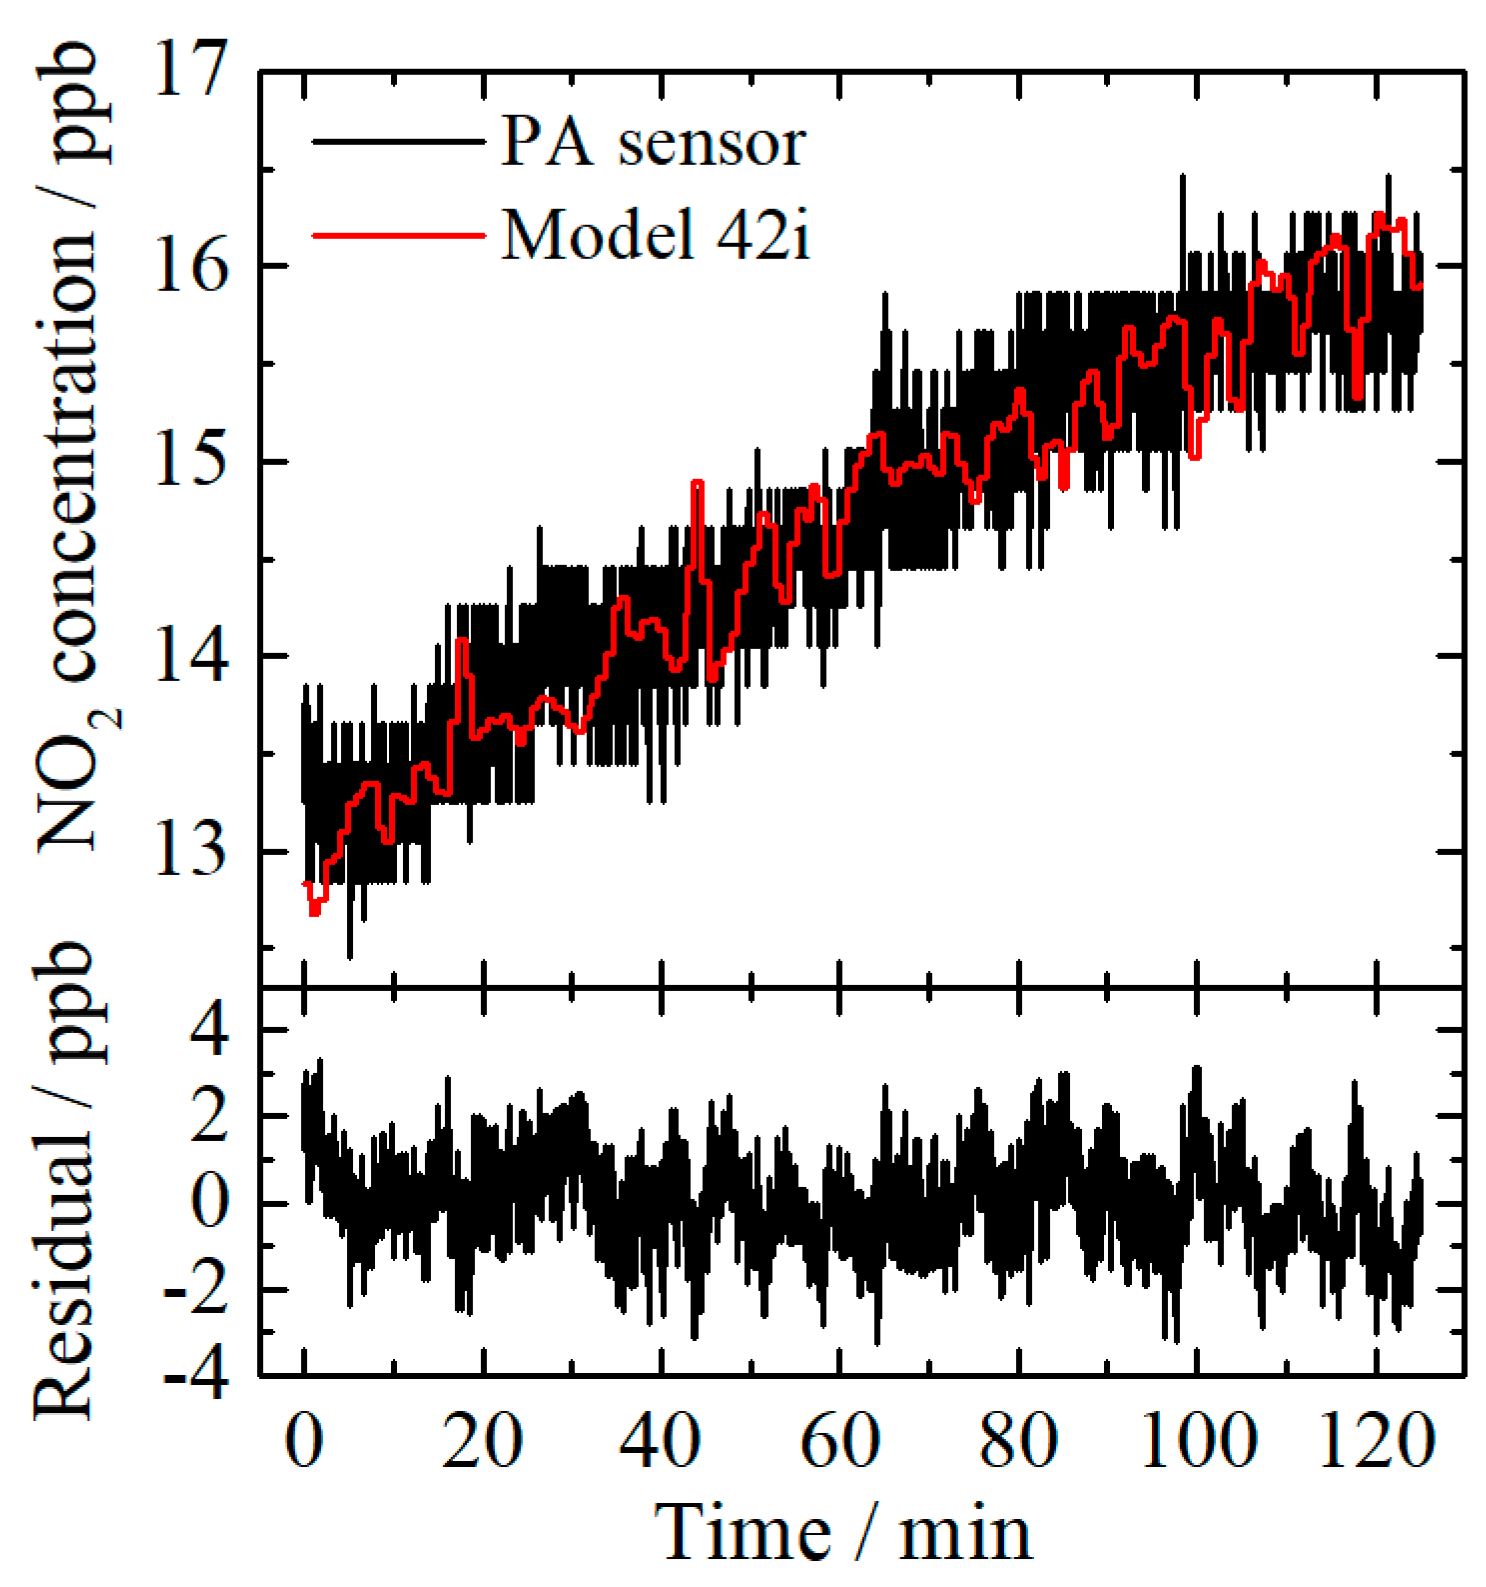
3.2. Performance Evaluation
4. Conclusions
Author Contributions
Funding
Conflicts of Interest
References
- Atkinson, R. Atmospheric chemistry of VOCs and NOx. Atmos. Environ. 2000, 34, 2063–2101. [Google Scholar] [CrossRef]
- Zhu, Y.; Kuhlmann, G.; Chan, K.L.; Donner, S.; Schütt, A.; Wagner, T.; Wenig, M. Citywide Measurements of NO2 Concentrations in Munich Using a Combination of Mobile and Stationary Spectroscopic Measurement Techniques. In Proceedings of the Light, Energy and the Environment, Leipzig, Germany, 14–17 November 2016. [Google Scholar]
- Herndon, S.C.; Shorter, J.H.; Zahniser, M.S.; Nelson David, D.; Jayne, J.; Brown, R.C.; Miake-Lye, R.C.; Waitz, I.; Silva, P.; Lanni, T.; et al. NO and NO2 Emission Ratios Measured from In-Use Commercial Aircraft during Taxi and Takeoff. Environ. Sci. Technol. 2004, 38, 6078–6084. [Google Scholar] [CrossRef] [PubMed]
- Gudem, M.; Hazra, A. Mechanism of the Chemiluminescent Reaction between Nitric Oxide and Ozone. J. Phys. Chem. A 2019, 123, 715–722. [Google Scholar] [CrossRef] [PubMed]
- Park, S.; An, S.; Ko, H.; Jin, C.; Lee, C. Enhanced NO2 sensing properties of Zn2SnO4-core/ZnO-shell nanorod sensors. Ceram. Int. 2013, 39, 3539–3545. [Google Scholar] [CrossRef]
- Fàbrega, C.; Fernández, L.; Monereo, O.; Pons-Balagué, A.; Xuriguera, E.; Casals, O.; Waag, A.; Prades, J.D. Highly Specific and Wide Range NO2 Sensor with Color Readout. ACS Sens. 2017, 2, 1612–1618. [Google Scholar] [CrossRef]
- Fuchs, H.; Dubé, W.P.; Lerner, B.M.; Wagner, N.L.; Williams, E.J.; Brown, S.S. A Sensitive and Versatile Detector for Atmospheric NO2 and NOX Based on Blue Diode Laser Cavity Ring-Down Spectroscopy. Environ. Sci. Technol. 2009, 43, 7831–7836. [Google Scholar] [CrossRef]
- Rao, G.N.; Karpf, A. High sensitivity detection of NO2 employing cavity ringdown spectroscopy and an external cavity continuously tunable quantum cascade laser. Appl. Opt. AO 2010, 49, 4906–4914. [Google Scholar] [CrossRef]
- Duan, J.; Qin, M.; Ouyang, B.; Fang, W.; Li, X.; Lu, K.; Tang, K.; Liang, S.; Meng, F.; Hu, Z.; et al. Development of an incoherent broadband cavity-enhanced absorption spectrometer for in situ measurements of HONO and NO2. Atmos. Meas. Tech. 2018, 11, 4531–4543. [Google Scholar] [CrossRef]
- Day, D.A.; Wooldridge, P.J.; Dillon, M.B.; Thornton, J.A.; Cohen, R.C. A thermal dissociation laser-induced fluorescence instrument for in situ detection of NO2, peroxy nitrates, alkyl nitrates, and HNO3. J. Geophys. Res. Atmos. 2002, 107, ACH-4. [Google Scholar] [CrossRef]
- Jágerská, J.; Jouy, P.; Tuzson, B.; Looser, H.; Mangold, M.; Soltic, P.; Hugi, A.; Brönnimann, R.; Faist, J.; Emmenegger, L. Simultaneous measurement of NO and NO2 by dual-wavelength quantum cascade laser spectroscopy. Opt. Express OE 2015, 23, 1512–1522. [Google Scholar] [CrossRef]
- Pastel, R.L.; Sausa, R.C. Detection of NO and NO2 by (2 + 2) resonance-enhanced multiphoton ionization and photoacoustic spectroscopy near 454 nm. Appl. Opt. AO 1996, 35, 4046–4052. [Google Scholar] [CrossRef] [PubMed]
- Slezak, V. High-precision pulsed photoacoustic spectroscopy in NO2-N2. Appl. Phys. B 2001, 73, 751–755. [Google Scholar] [CrossRef]
- Slezak, V.; Santiago, G.; Peuriot, A.L. Photoacoustic detection of NO2 traces with CW and pulsed green lasers. Opt. Lasers Eng. 2003, 40, 33–41. [Google Scholar] [CrossRef]
- Pushkarsky, M.; Tsekoun, A.; Dunayevskiy, I.G.; Go, R.; Patel, C.K.N. Sub-parts-per-billion level detection of NO2 using room-temperature quantum cascade lasers. Proc. Natl. Acad. Sci. USA 2006, 103, 10846–10849. [Google Scholar] [CrossRef]
- Yi, H.; Liu, K.; Chen, W.; Tan, T.; Wang, L.; Gao, X. Application of a broadband blue laser diode to trace NO2 detection using off-beam quartz-enhanced photoacoustic spectroscopy. Opt. Lett. OL 2011, 36, 481–483. [Google Scholar] [CrossRef] [PubMed]
- Peltola, J.; Hieta, T.; Vainio, M. Parts-per-trillion-level detection of nitrogen dioxide by cantilever-enhanced photo-acoustic spectroscopy. Opt. Lett. OL 2015, 40, 2933–2936. [Google Scholar] [CrossRef]
- Yin, X.; Dong, L.; Wu, H.; Zheng, H.; Ma, W.; Zhang, L.; Yin, W.; Jia, S.; Tittel, F.K. Sub-ppb nitrogen dioxide detection with a large linear dynamic range by use of a differential photoacoustic cell and a 3.5W blue multimode diode laser. Sens. Actuators B Chem. 2017, 247, 329–335. [Google Scholar] [CrossRef]
- Rück, T.; Bierl, R.; Matysik, F.-M. Low-cost photoacoustic NO2 trace gas monitoring at the pptV-level. Sens. Actuators A Phys. 2017, 263, 501–509. [Google Scholar] [CrossRef]
- Kapp, J.; Weber, C.; Schmitt, K.; Pernau, H.-F.; Wöllenstein, J. Resonant Photoacoustic Spectroscopy of NO2 with a UV-LED Based Sensor. Sensors 2019, 19, 724. [Google Scholar] [CrossRef]
- Vandaele, A.C.; Hermans, C.; Simon, P.C.; Carleer, M.; Colin, R.; Fally, S.; Mérienne, M.F.; Jenouvrier, A.; Coquart, B. Measurements of the NO2 absorption cross-section from 42 000 cm−1 to 10 000 cm−1 (238–1000 nm) at 220 K and 294 K. J. Quant. Spectrosc. Radiat. Transf. 1998, 59, 171–184. [Google Scholar] [CrossRef]
- Gaspar, J.; Chen, S.F.; Gordillo, A.; Hepp, M.; Ferreyra, P.; Marqués, C. Digital lock in amplifier: Study, design and development with a digital signal processor. Microprocess. Microsyst. 2004, 28, 157–162. [Google Scholar] [CrossRef]
- Chighine, A.; Tsekenis, S.-A.; Fisher, E.; Polydorides, N.; Wilson, D.; Lengden, M.; Johnstone, W.; McCann, H. TDLAS using FPGA-based lock-in detection for multi-channel Chemical Species Tomography. In Proceedings of the 2015 IEEE SENSORS, Busan, Korea, 1–4 November 2015; pp. 1–4. [Google Scholar]
- Bengtsson, L.E. A microcontroller-based lock-in amplifier for sub-milliohm resistance measurements. Rev. Sci. Instrum. 2012, 83, 075103. [Google Scholar] [CrossRef] [PubMed]
- Miklós, A.; Hess, P.; Bozóki, Z. Application of acoustic resonators in photoacoustic trace gas analysis and metrology. Rev. Sci. Instrum. 2001, 72, 1937–1955. [Google Scholar] [CrossRef]


© 2020 by the authors. Licensee MDPI, Basel, Switzerland. This article is an open access article distributed under the terms and conditions of the Creative Commons Attribution (CC BY) license (http://creativecommons.org/licenses/by/4.0/).
Share and Cite
Dong, Y.; Gu, M.; Zhu, G.; Tan, T.; Liu, K.; Gao, X. Fully Integrated Photoacoustic NO2 Sensor for Sub-ppb Level Measurement. Sensors 2020, 20, 1270. https://doi.org/10.3390/s20051270
Dong Y, Gu M, Zhu G, Tan T, Liu K, Gao X. Fully Integrated Photoacoustic NO2 Sensor for Sub-ppb Level Measurement. Sensors. 2020; 20(5):1270. https://doi.org/10.3390/s20051270
Chicago/Turabian StyleDong, Yang, Mingsi Gu, Gongdong Zhu, Tu Tan, Kun Liu, and Xiaoming Gao. 2020. "Fully Integrated Photoacoustic NO2 Sensor for Sub-ppb Level Measurement" Sensors 20, no. 5: 1270. https://doi.org/10.3390/s20051270
APA StyleDong, Y., Gu, M., Zhu, G., Tan, T., Liu, K., & Gao, X. (2020). Fully Integrated Photoacoustic NO2 Sensor for Sub-ppb Level Measurement. Sensors, 20(5), 1270. https://doi.org/10.3390/s20051270