A Stable Biotin-Streptavidin Surface Enables Multiplex, Label-Free Protein Detection by Aptamer and Aptamer-Protein Arrays Using Arrayed Imaging Reflectometry


Abstract

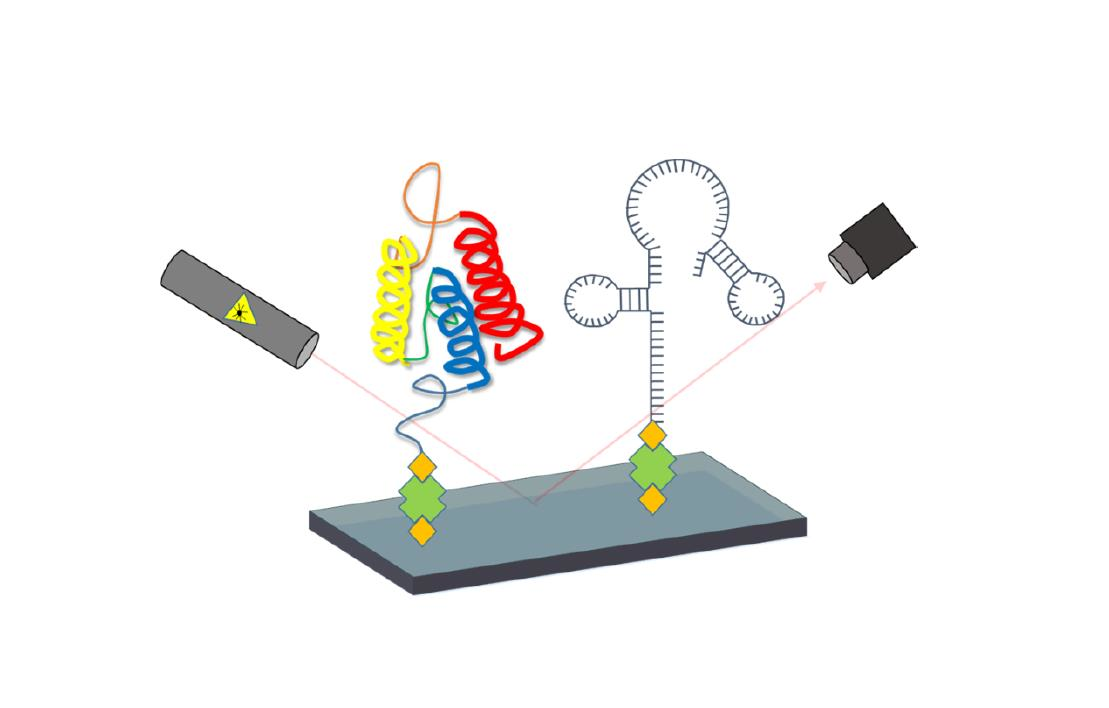
1. Introduction
2. Materials and Methods
3. Results and Discussion
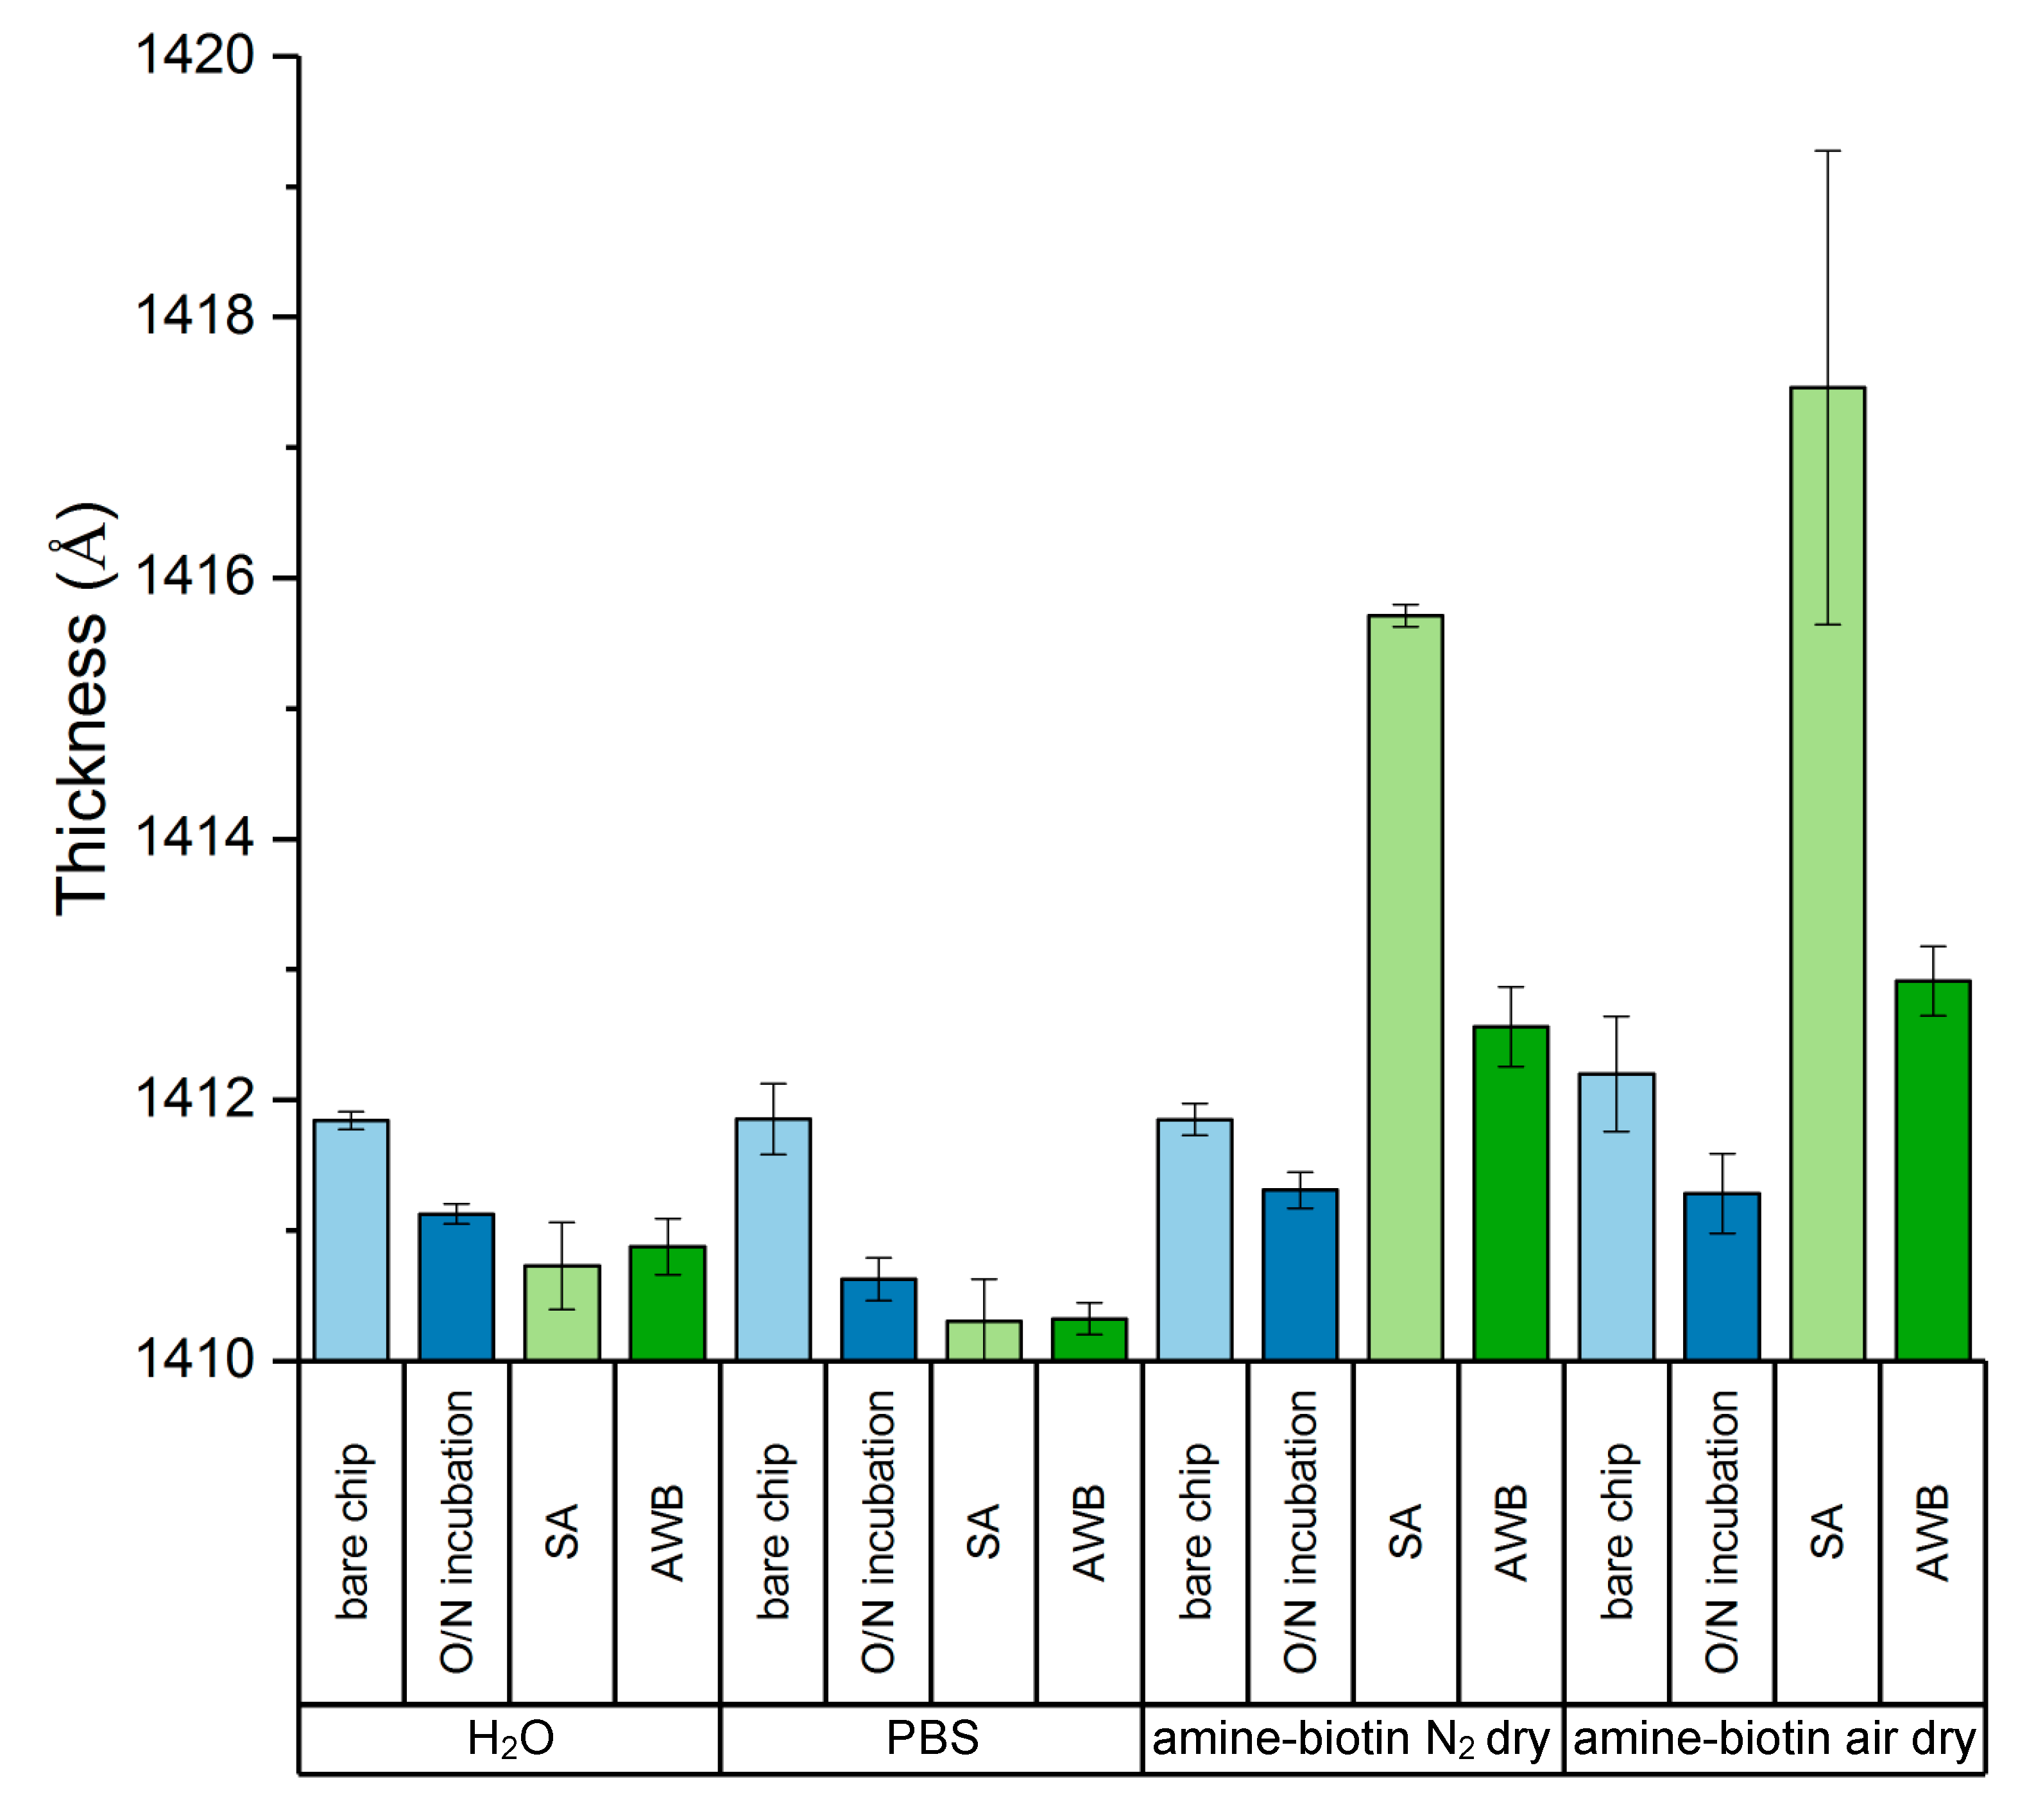
3.1. Generation of the B-SA Surface
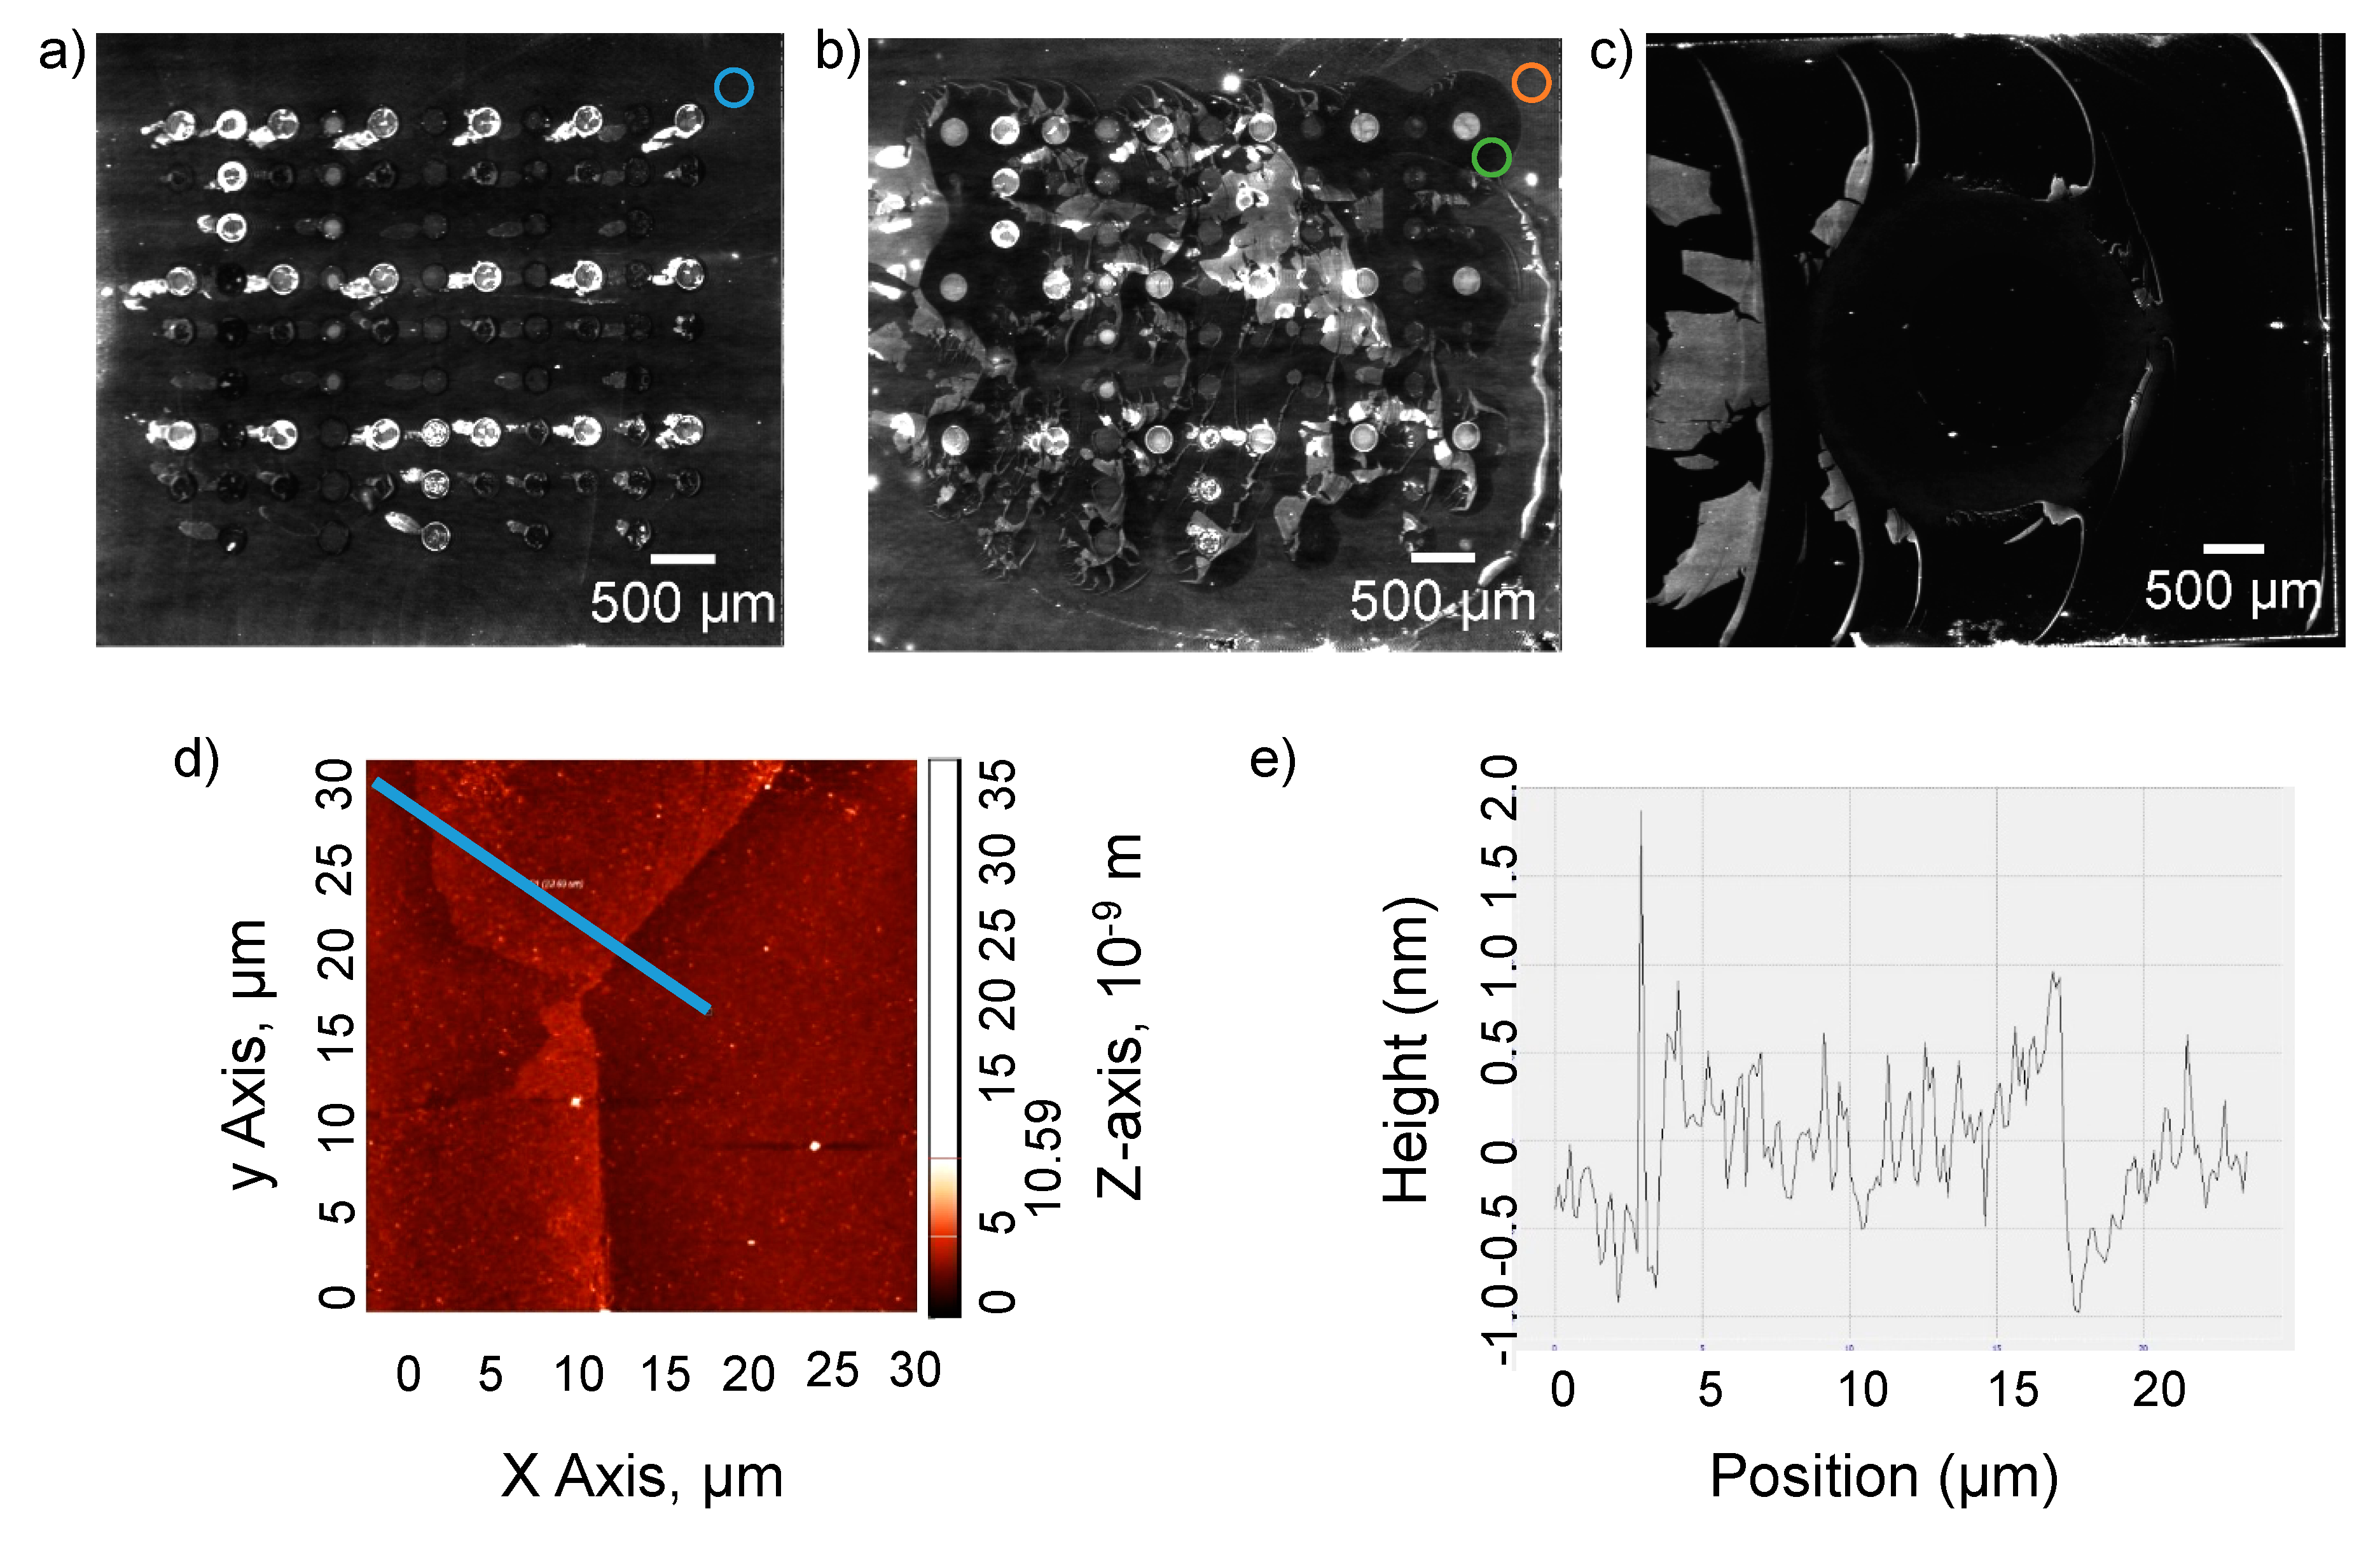
3.2. Characterization of the Dried and Rewetted Biotin-Sa Surface via AIR and AFM
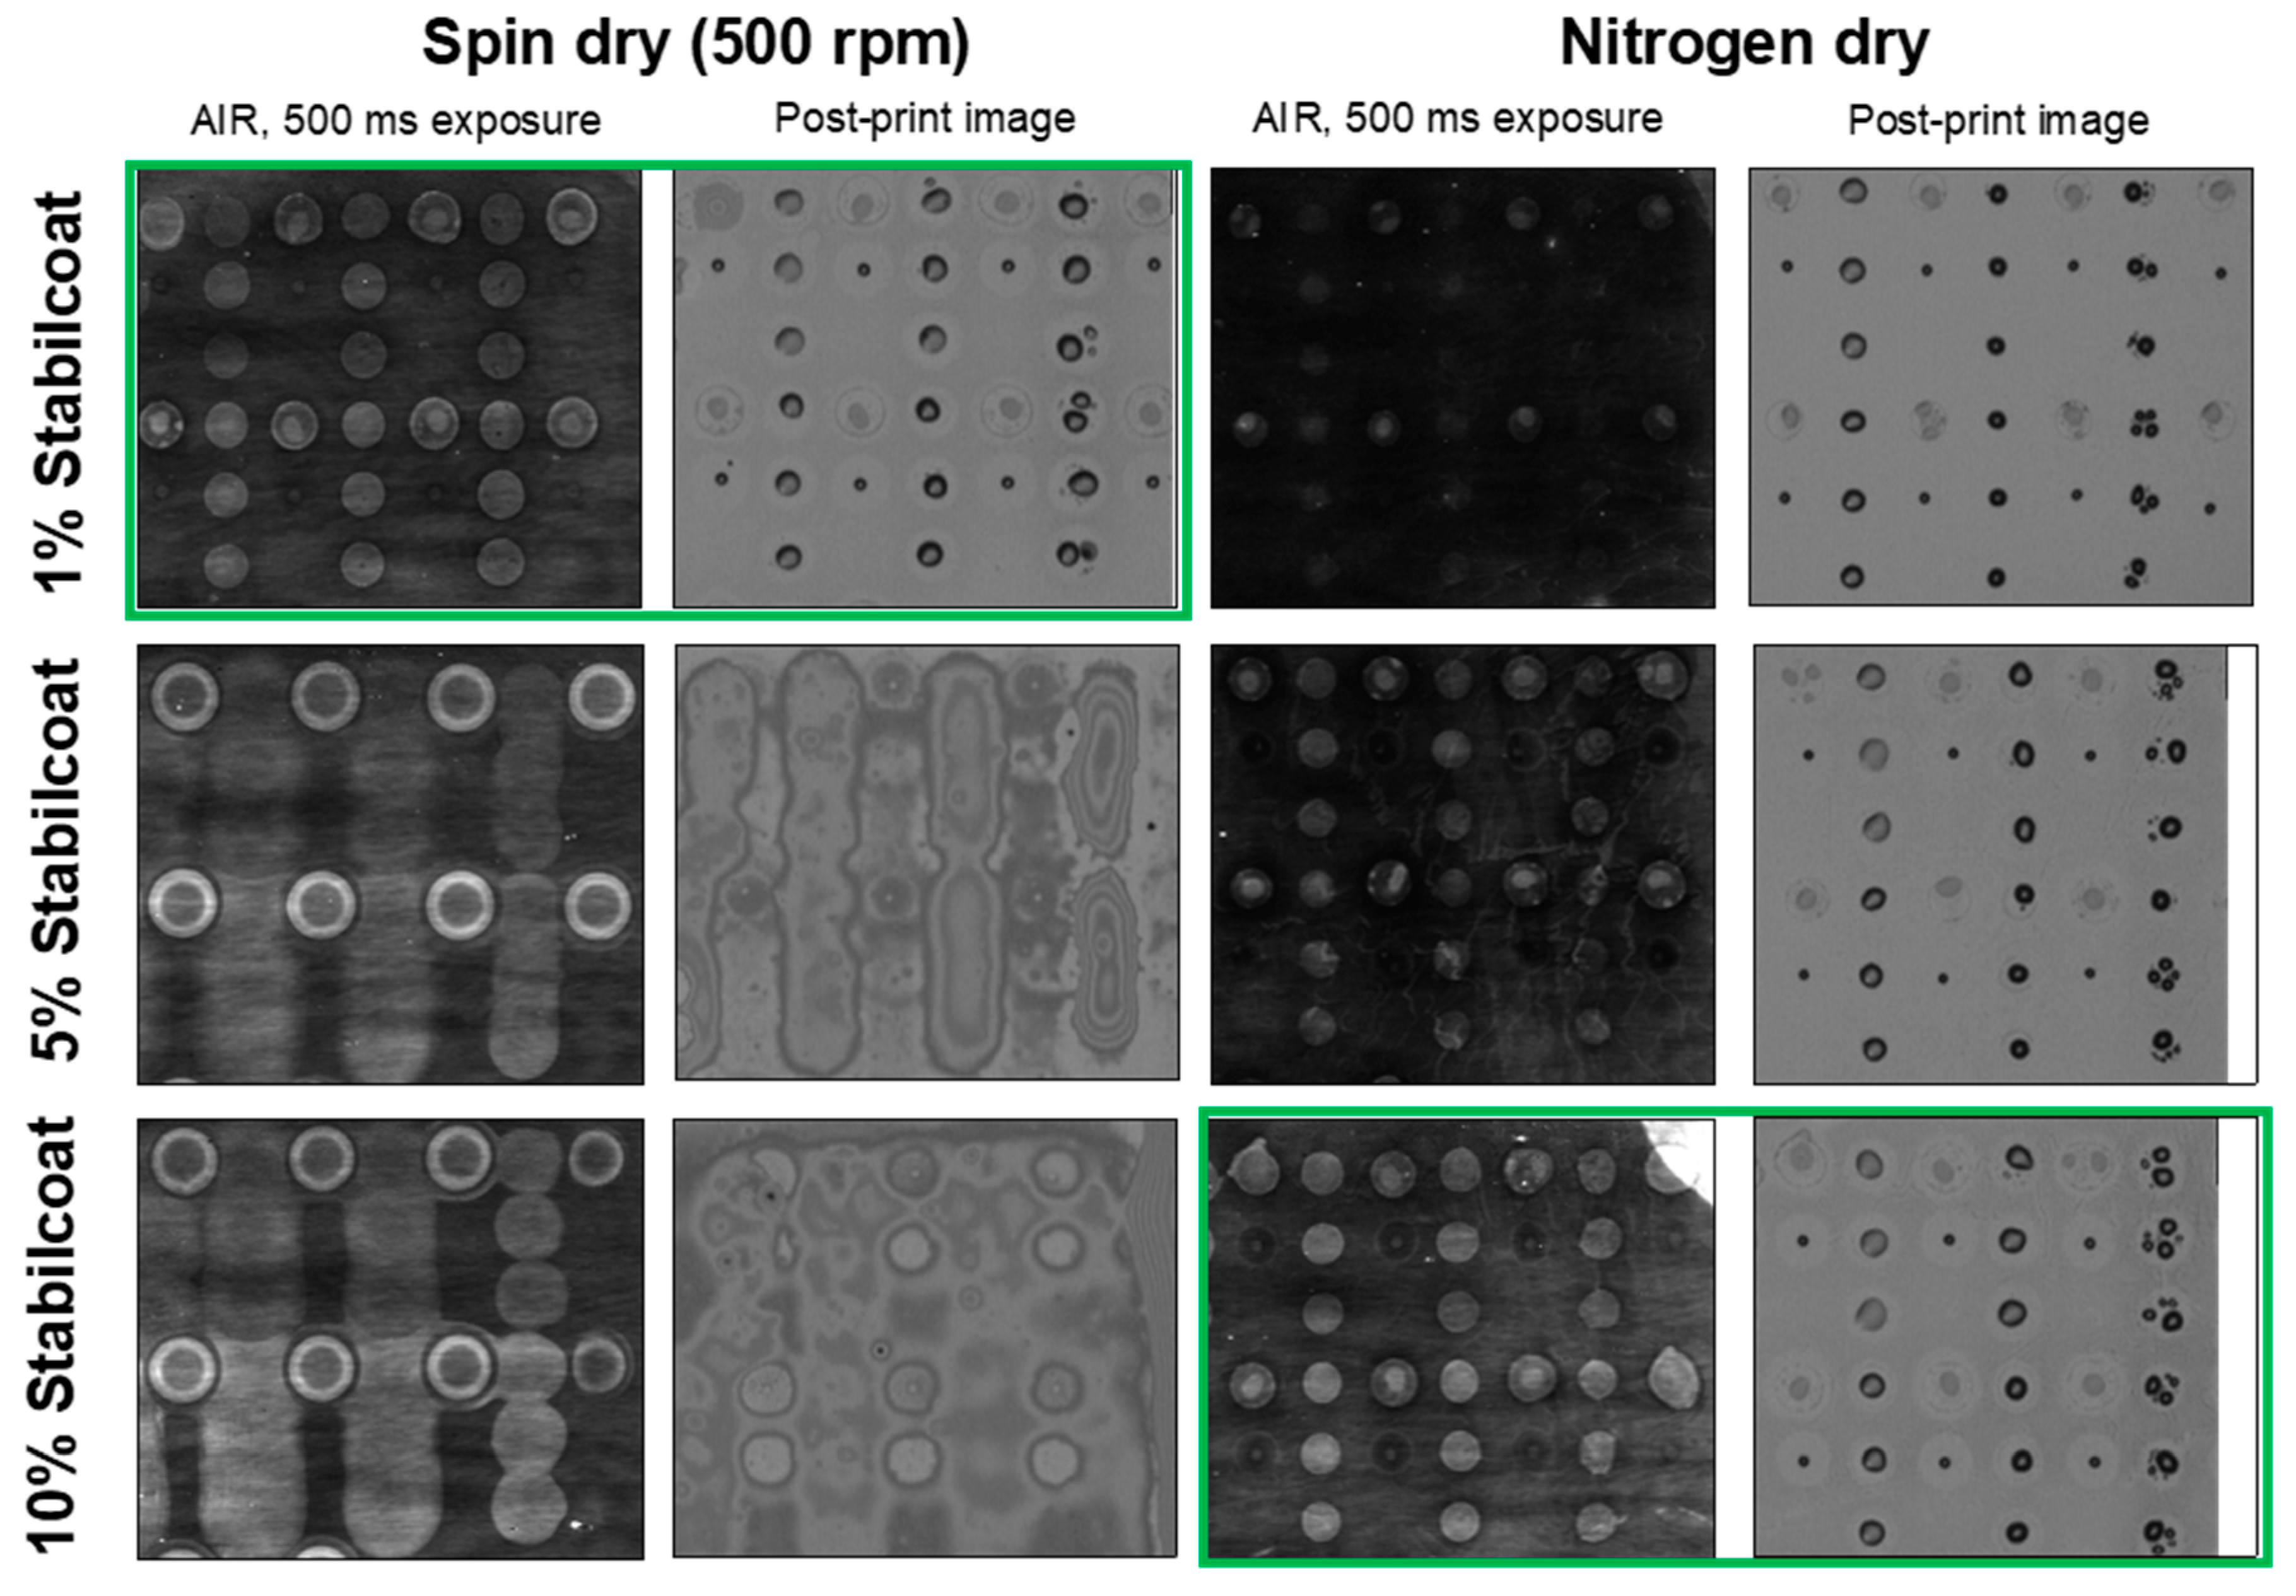
3.3. Optimization of Protective Coating and Preparation of Microarrays
3.4. Optimization of Biotin Linker and Streptavidin Concentration
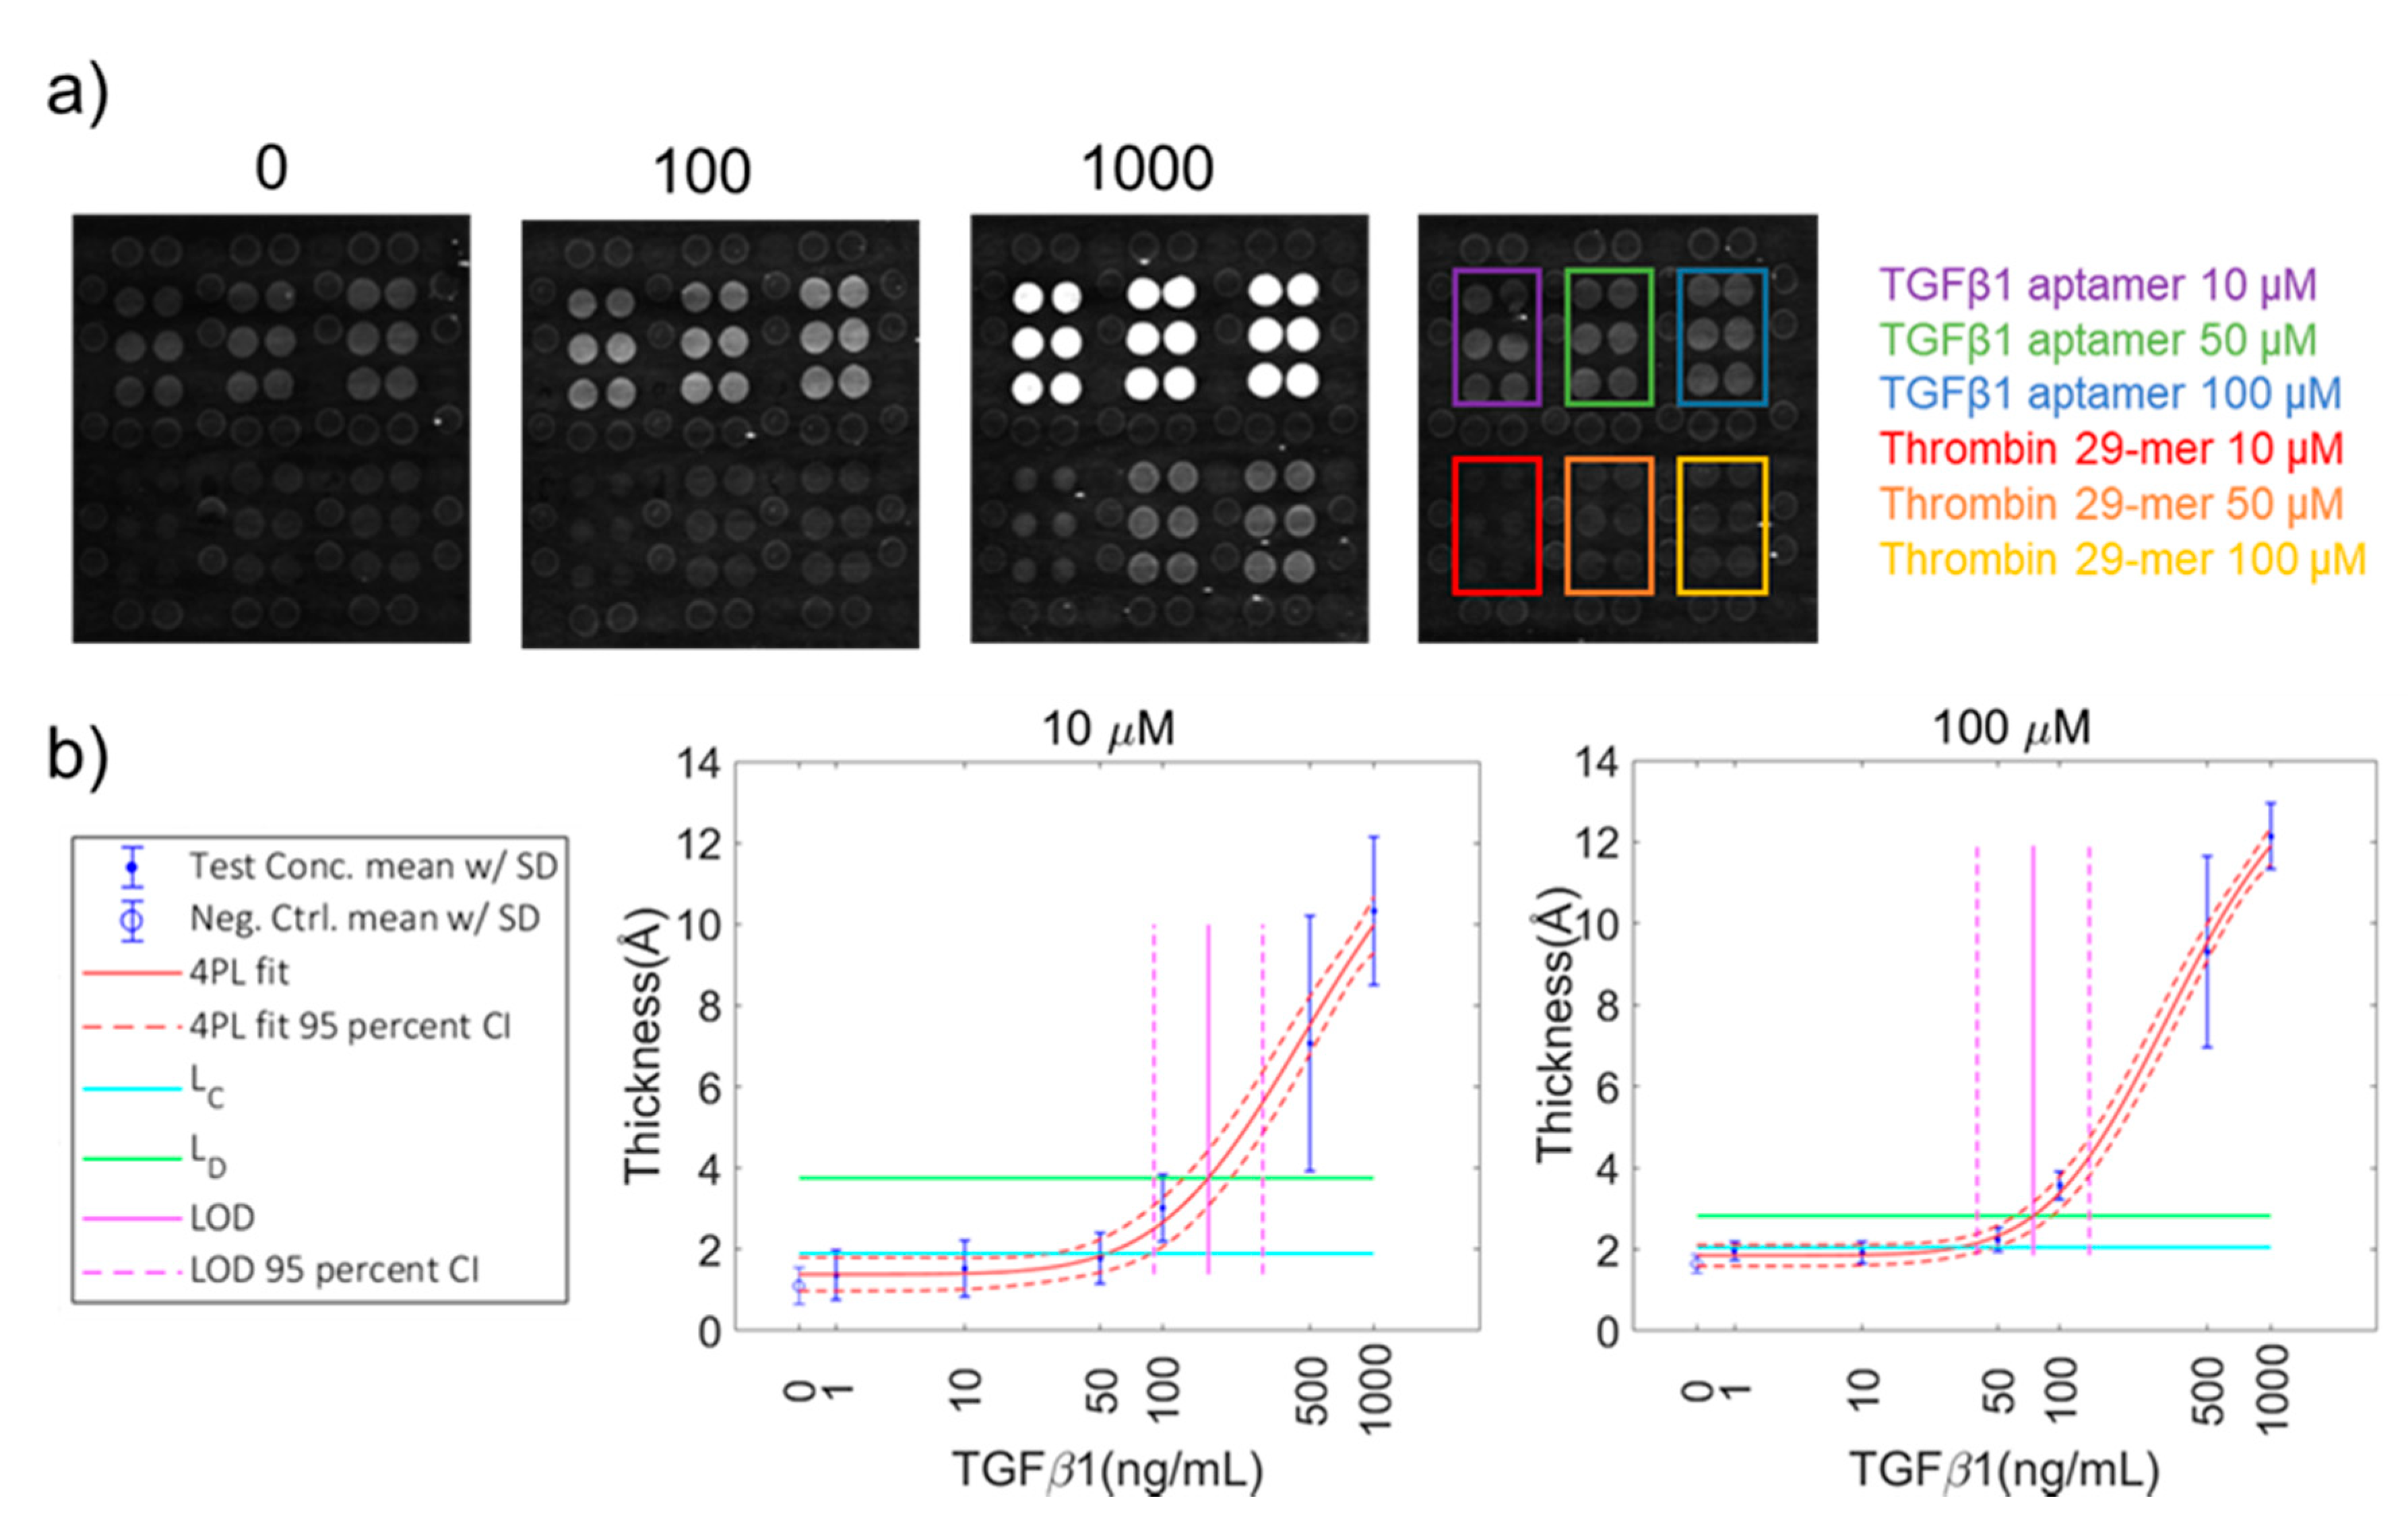
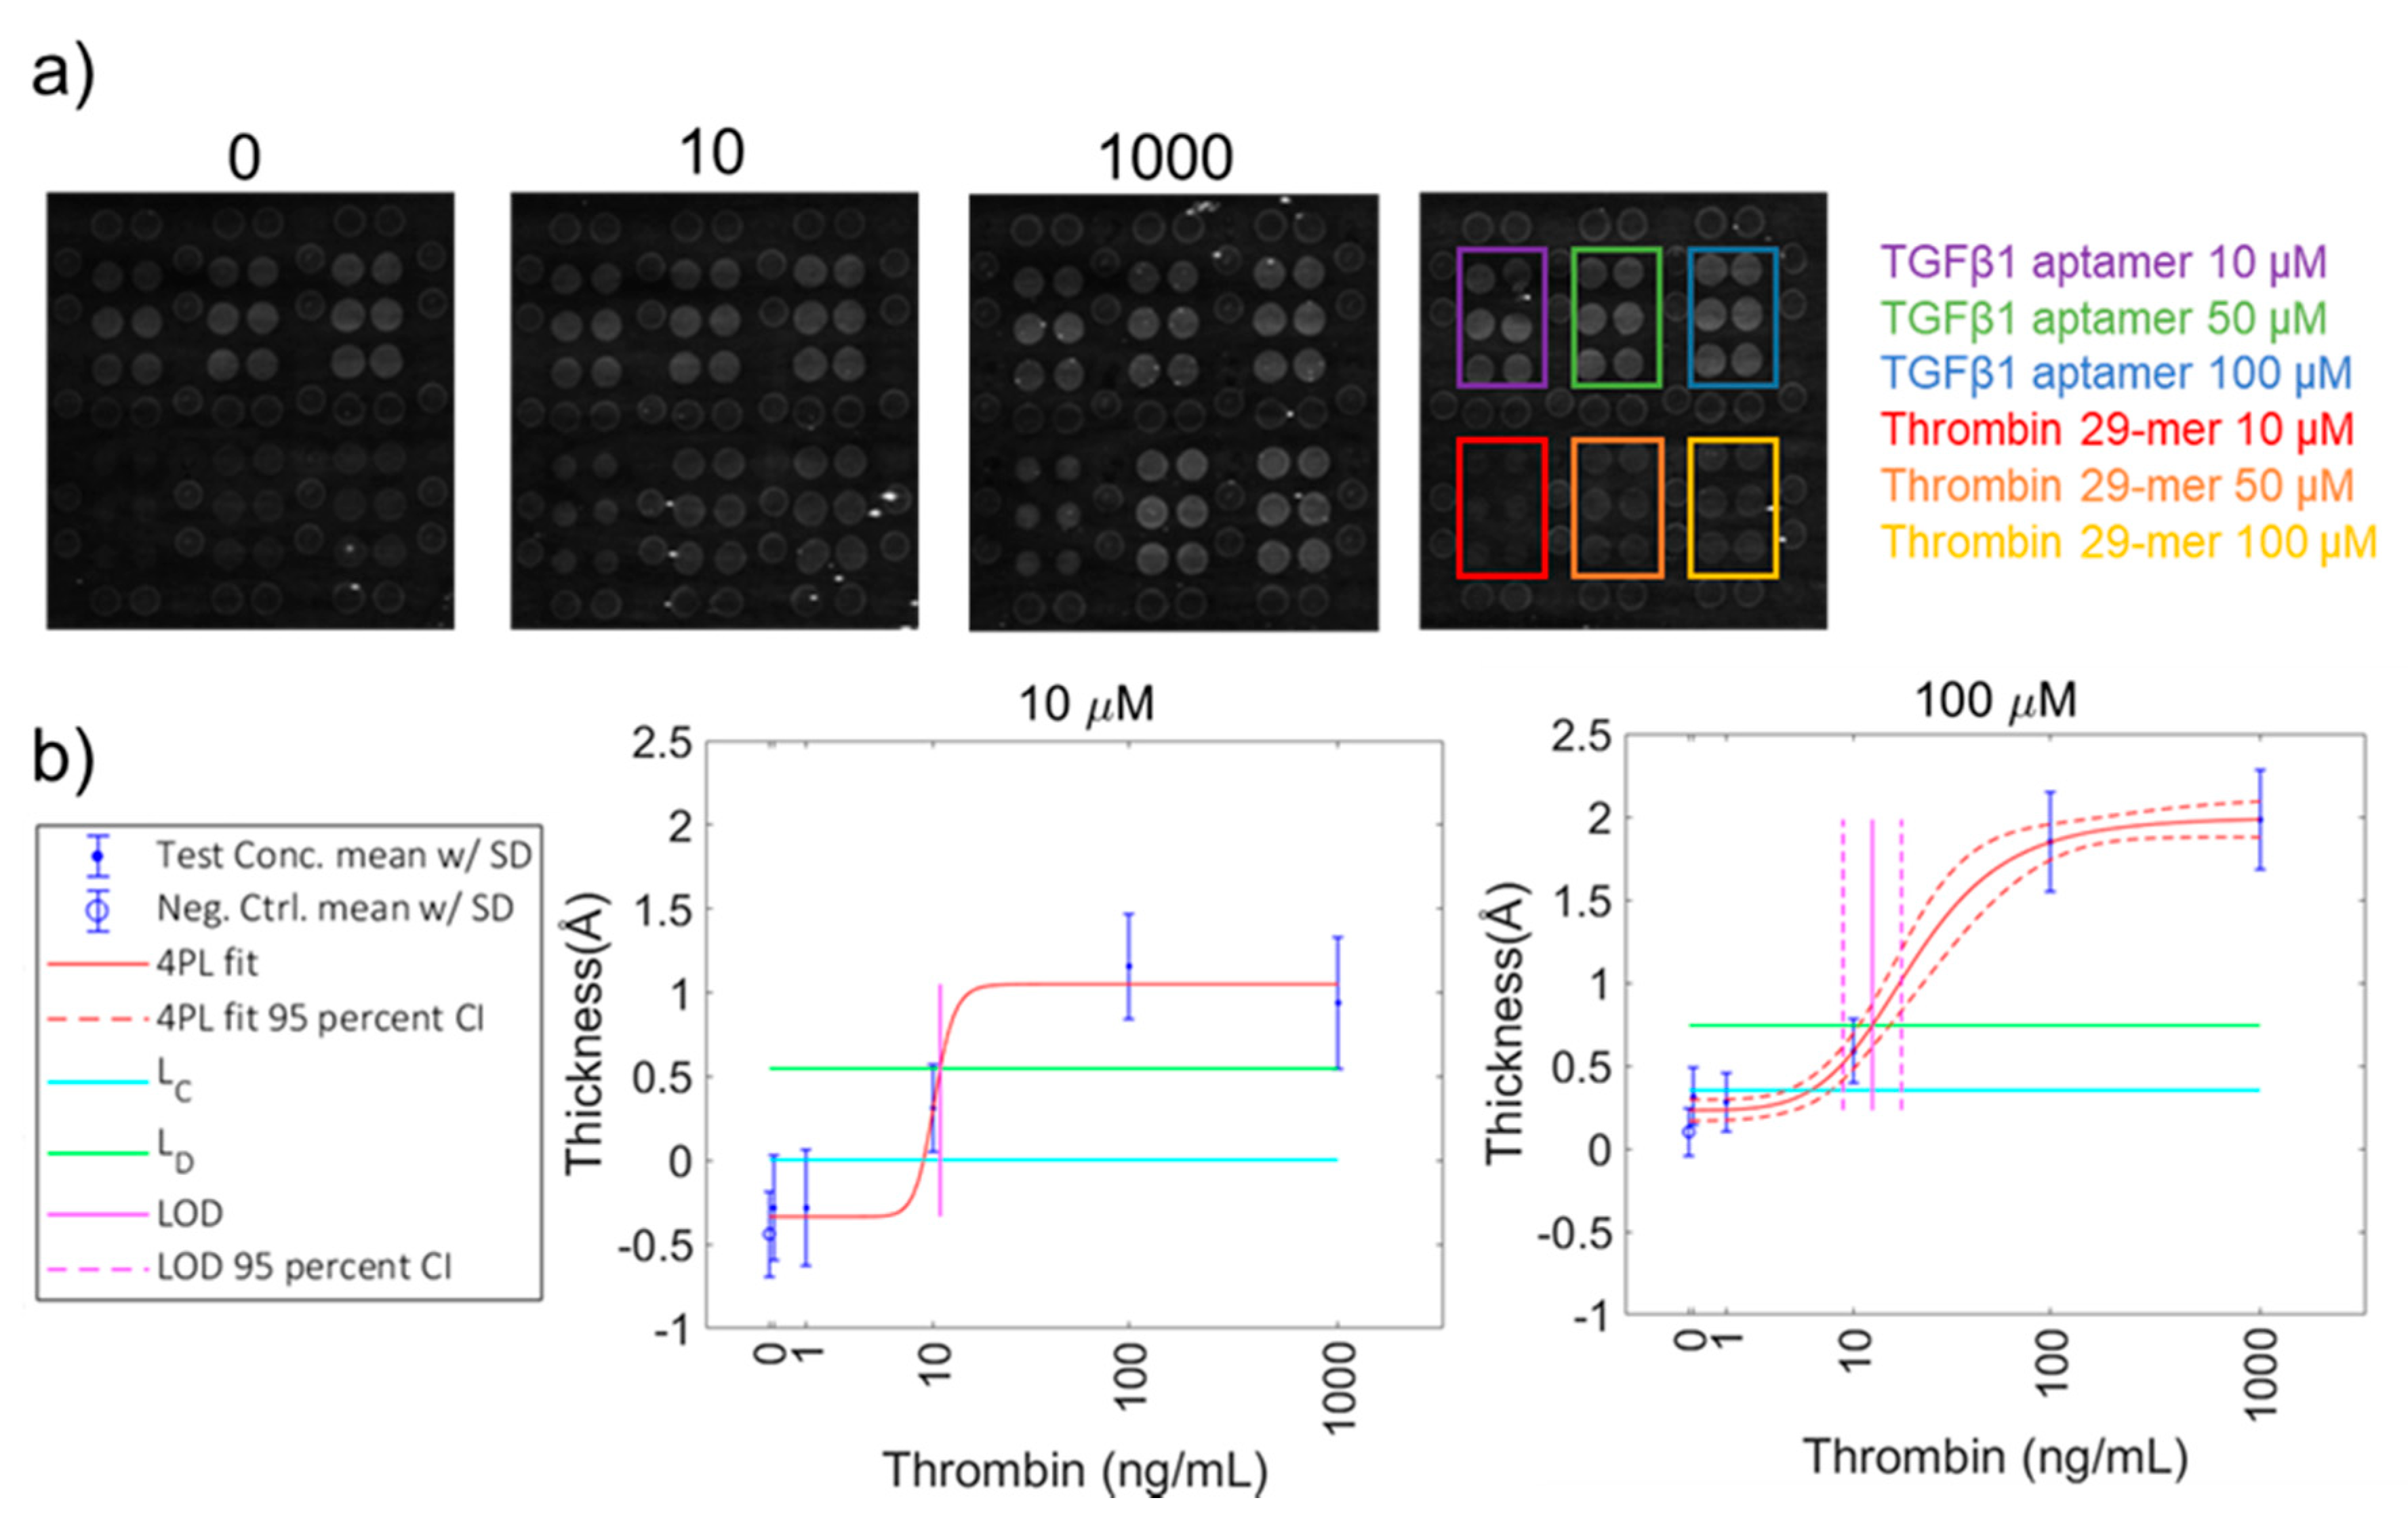
3.5. Target Detection with Biotin-Conjugated Aptamer Arrays
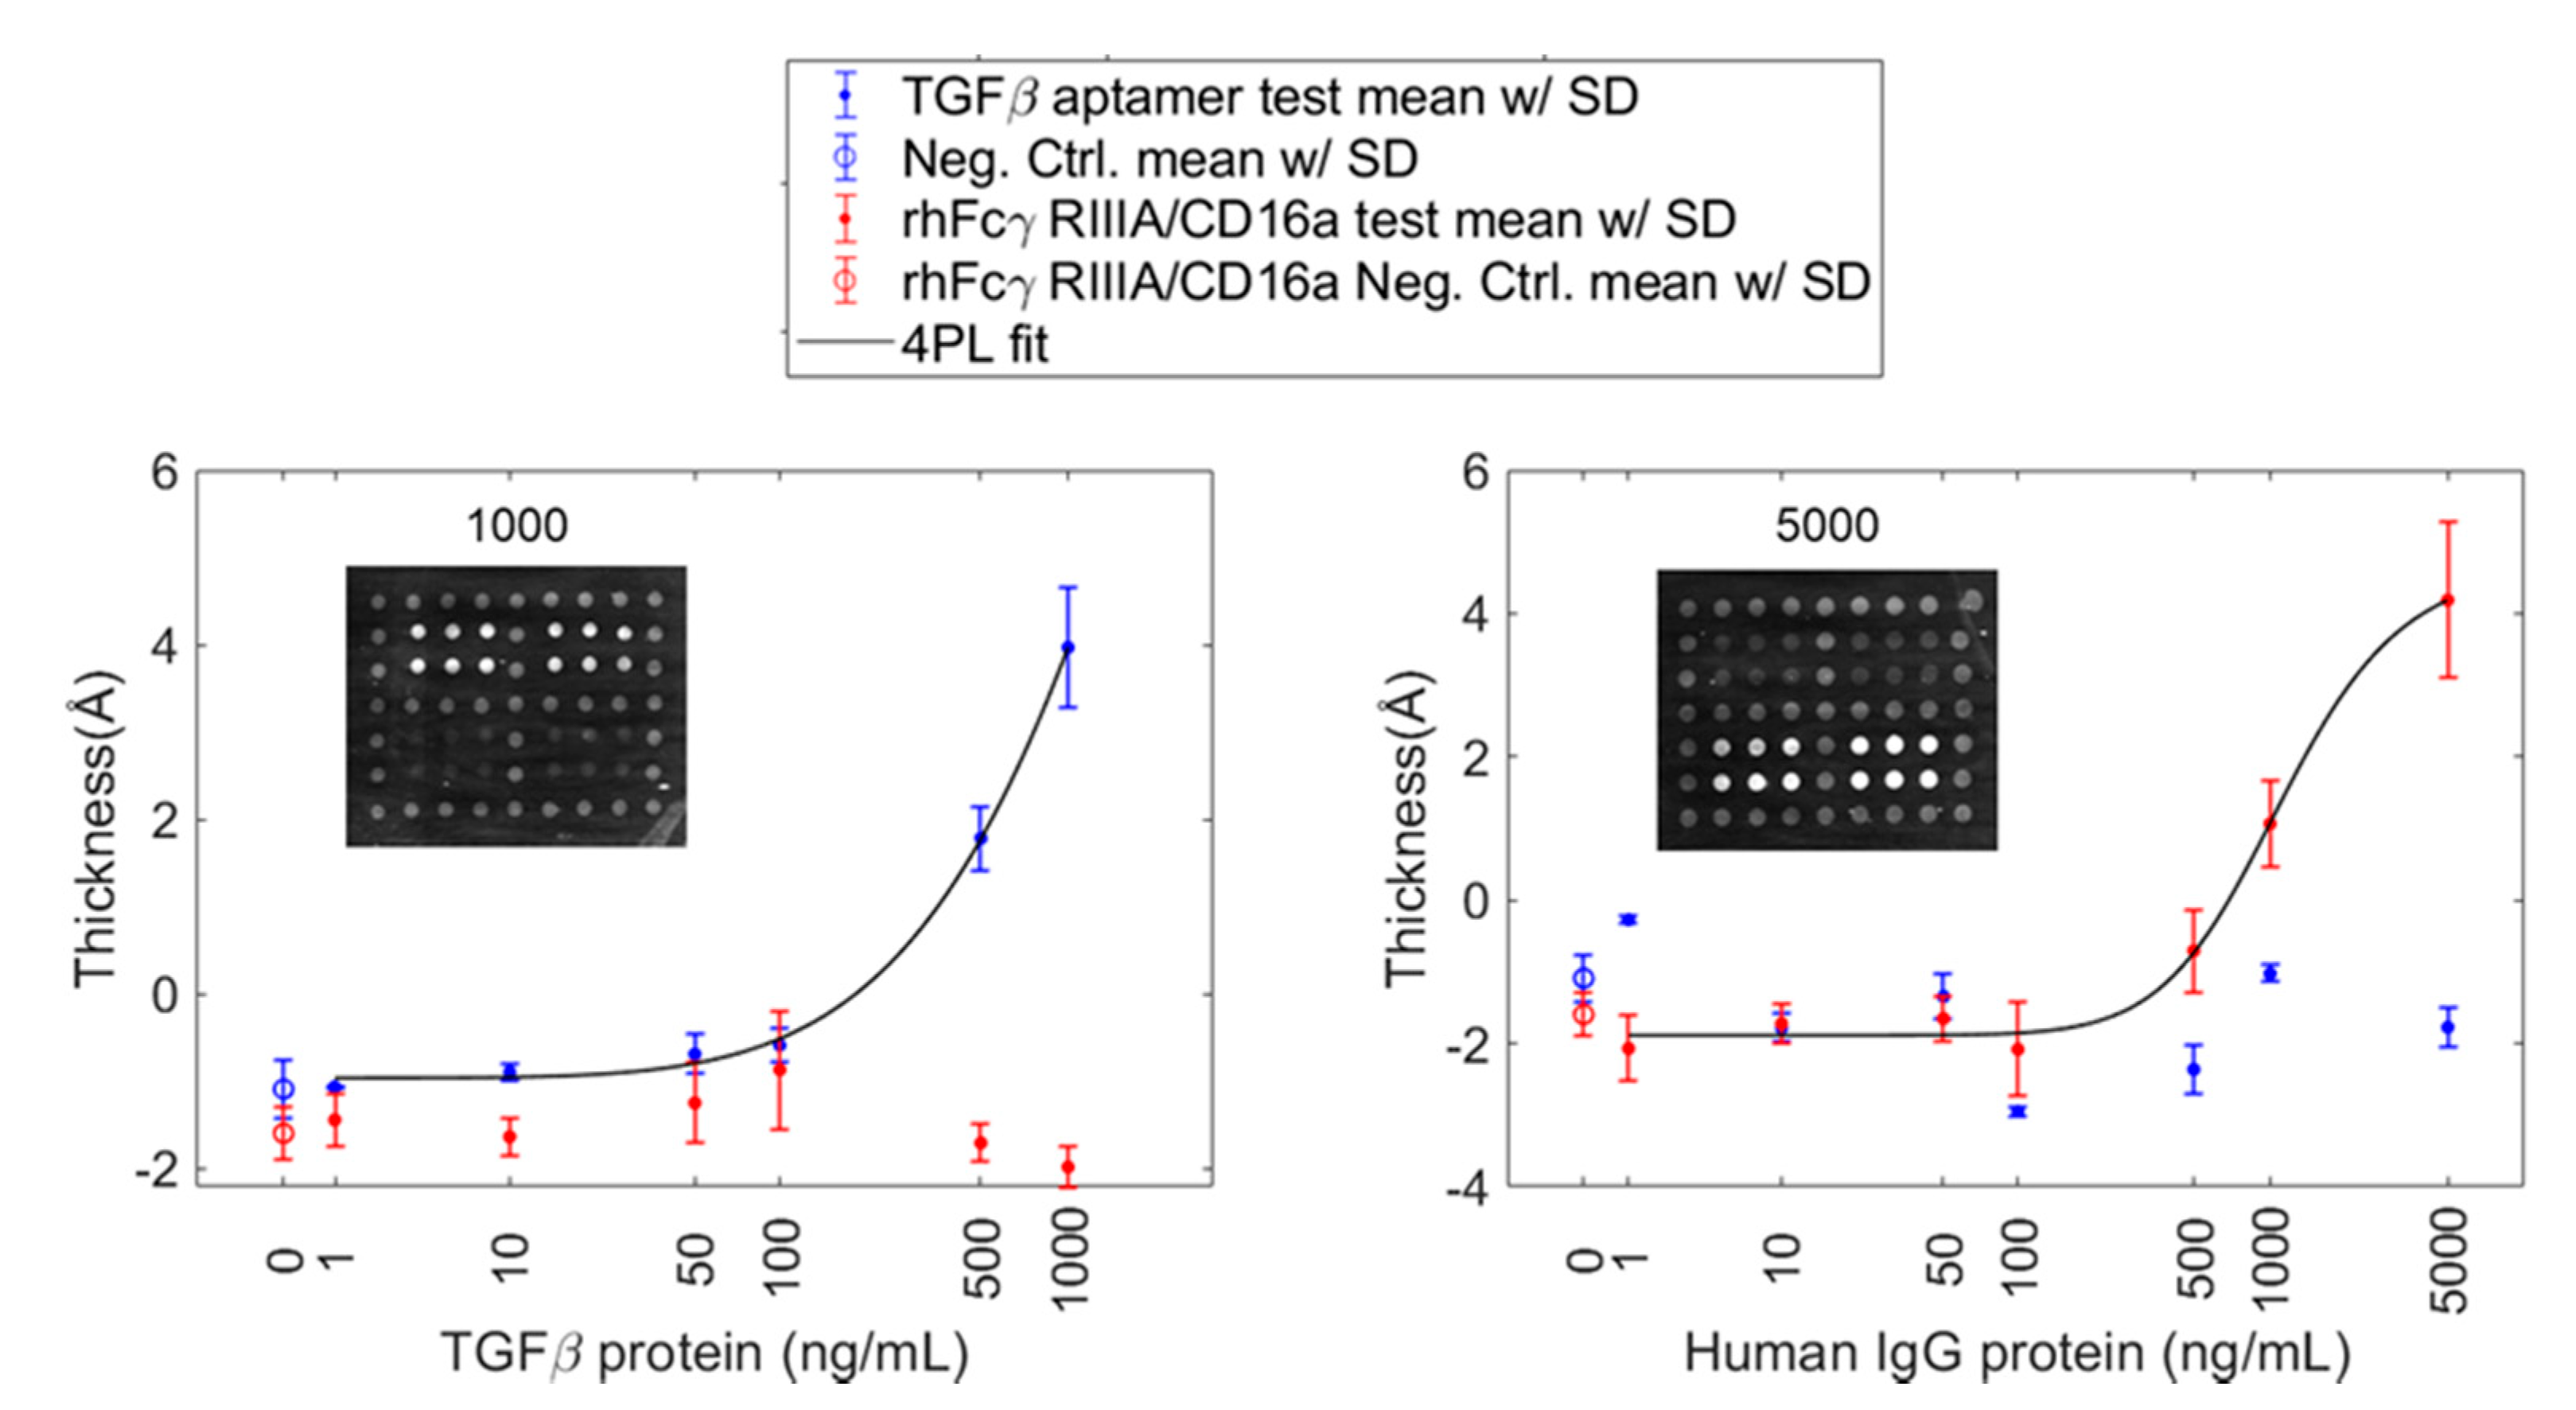
3.6. Aptamer and Protein Mixed Probe Array
4. Conclusions
Supplementary Materials
Author Contributions
Funding
Conflicts of Interest
References
- Zhang, H.; Miller, B.L. Advanced “lab-on-a-chip” to detect viruses—Current challenges and future perspectives. Biosens. Bioelectron. 2019, 141, 111476. [Google Scholar] [CrossRef] [PubMed]
- Sriram, R.; Yadav, A.R.; Mace, C.R.; Miller, B.L. Validation of arrayed imaging reflectometry biosensor response for protein-antibody interactions: Cross-correlation of theory, experiment, and complementary techniques. Anal. Chem. 2011, 83, 3750–3757. [Google Scholar] [CrossRef]
- Mace, C.R.; Striemer, C.C.; Miller, B.L. Theoretical and experimental analysis of arrayed imaging reflectometry as a sensitive proteomics technique. Anal. Chem. 2006, 78, 5578–5583. [Google Scholar] [CrossRef] [PubMed]
- Yadav, A.R.; Mace, C.R.; Miller, B.L. Examining the interactions of the splicing factor MBNL1 with target RNA sequences via a label-free, multiplex method. Anal. Chem. 2014, 86, 1067–1075. [Google Scholar] [CrossRef] [PubMed]
- Luong, J.H.T.; Vashist, S.K. Chemistry of Biotin-Streptavidin and the Growing Concern of an Emerging Biotin Interference in Clinical Immunoassays. ACS Omega 2020, 5, 10–18. [Google Scholar] [CrossRef] [PubMed]
- Dundas, C.M.; Demont, D.; Park, S. Streptavidin-biotin technology: Improvements and innovations in chemical and biological applications. Appl. Microbiol. Biotechnol. 2013, 97, 9343–9353. [Google Scholar] [CrossRef]
- Xia, N.; Shumaker-Parry, J.S.; Zareie, M.H.; Campbell, C.T.; Castner, D.G. A streptavidin linker layer that functions after drying. Langmuir 2004, 20, 3710–3716. [Google Scholar] [CrossRef]
- Bonanno, L.M.; Delouise, L.A. Steric crowding effects on target detection in an affinity biosensor. Langmuir 2007, 23, 5817–5823. [Google Scholar] [CrossRef]
- Lifson, M.A.; Carter, J.A.; Miller, B.L. Functionalized Polymer Microgel Particles Enable Customizable Production of Label-Free Sensor Arrays. Anal. Chem. 2015, 87, 7887–7893. [Google Scholar] [CrossRef]
- Aptagen Aptamer Index. Available online: https://www.aptagen.com/aptamer-index (accessed on 22 July 2019).
- Scneider, C.A.; Rasband, W.S.; Eliceiri, K.W. NIH Image to ImageJ: 25 years of image analysis. Nat. Methods 2012, 9, 671–675. [Google Scholar] [CrossRef]
- Holstein, C.A.; Griffen, M.; Hong, J.; Sampson, P.D. Statistical Method for Determining and Comparing Limits of Detection of Bioassays. Anal. Chem. 2015, 87, 9795–9801. [Google Scholar] [CrossRef] [PubMed]
- J.A. Woolam Co., Inc. CompleteEASETM Software Manual, version 3.6; J.A. Woolam Co., Inc.: Lincoln, NE, USA, 2008; p. 45. [Google Scholar]
- Yadav, A.R.; Sriram, R.; Carter, J.A.; Miller, B.L. Comparative study of solution phase and vapor phase deposition of aminosilanes on silicon dioxide surfaces. Mat. Sci. Eng. C 2014, 35, 283–290. [Google Scholar] [CrossRef] [PubMed]
- Glaeser, R.M.; Han, B. Opinion: Hazards faced by macromolecules when confined to thin aqueous films. Biophys. Rep. 2016, 3, 1–7. [Google Scholar] [CrossRef] [PubMed]
- D’Imprima, E.; Floris, D.; Joppe, M.; Sánchez, R.; Grininger, M.; Kühlbrandt, W. Protein denaturation at the air-water interface and how to prevent it. eLife 2019, 8, e42747. [Google Scholar] [CrossRef]
- Sedlak, S.M.; Schendel, L.C.; Gaub, H.E.; Bernardi, R.C. Streptavidin/biotin: Tethering geometry defines unbinding mechanics. Sci. Adv. 2020, 6, eaay5999. [Google Scholar] [CrossRef] [PubMed]
- Zink, J.; Wyrobnik, T.; Prinz, T.; Schmid, M. Physical, Chemical and Biochemical Modifications of Protein-Based Films and Coatings: An Extensive Review. Int. J. Mol. Sci. 2016, 17, 1376. [Google Scholar] [CrossRef]
- Arrayit Corporation. SuperStreptavidin Activated Substrate Slides for Microarray Manufacturing and Next Generation Sequencing with Biotinylated Samples. Available online: http://www.arrayit.com/Products/Microarray_Slides/Streptavidin_Slides/streptavidin_slides.html (accessed on 22 July 2019).
- Tuerk, C.; Gold, L. Systematic evolution of ligands by exponential enrichment: RNA ligands to bacteriophage T4 DNA polymerase. Science 1990, 249, 505–510. [Google Scholar] [CrossRef]
- Ellington, A.D.; Szostak, J.W. In vitro selection of RNA molecules that bind specific ligands. Nature 1990, 346, 818–822. [Google Scholar] [CrossRef]
- Toh, S.Y.; Citartan, M.; Gopinath, S.C.; Tang, T.H. Aptamers as a replacement for antibodies in enzyme-linked immunosorbent assay. Biosens. Bioelectron. 2015, 64, 392–403. [Google Scholar] [CrossRef]
- Song, K.M.; Lee, S.; Ban, C. Aptamers and their biological applications. Sensors 2012, 12, 612–631. [Google Scholar] [CrossRef]
- Deng, B.; Lin, Y.; Wang, C.; Li, F.; Wang, Z.; Zhang, H.; Li, X.F.; Le, X.C. Aptamer binding assays for proteins: The thrombin example—A review. Anal. Chim. Acta 2014, 837, 1–15. [Google Scholar] [CrossRef] [PubMed]
- Bock, L.C.; Griffin, L.C.; Latham, J.A.; Vermaas, E.H.; Toole, J.J. Selection of single-stranded DNA molecules that bind and inhibit human thrombin. Nature 1992, 355, 564–566. [Google Scholar] [CrossRef] [PubMed]
- Tasset, D.M.; Kubik, M.F.; Steiner, W.J. Oligonucleotide inhibitors of human thrombin that bind distinct epitopes. Mol. Biol. 1997, 272, 688–698. [Google Scholar] [CrossRef] [PubMed]
- Kang, J.; Lee, M.S.; Copland, J.A., 3rd; Luxon, B.A.; Gorenstein, D.G. Combinatorial selection of a single stranded DNA thioaptamer targeting TGF-beta1 protein. Bioorg. Med. Chem. Lett. 2008, 18, 1835–1839. [Google Scholar] [CrossRef]
- Beckett, D.; Kovaleva, E.; Schatz, P.J. A minimal peptide substrate in biotin holoenzyme synthetase-catalyzed biotinylation. Protein Sci. 1999, 8, 921–929. [Google Scholar] [CrossRef]
- Fairhead, M.; Howarth, M. Site-specific biotinylation of purified proteins using BirA. Methods Mol. Biol. 2015, 1266, 171–184. [Google Scholar] [PubMed]


| Aptamer Probe | AIR Probe Concentration (µM) | Greatest Thickness Build from Probe Binding Target, Measured by AIR (Å) | LOB (ng/mL) | LOB (nM) | LOD + SE (ng/mL) | LOD (nM) | Reported KD (nM) |
|---|---|---|---|---|---|---|---|
| Thrombin 29-mer | 10 | 1.4 | 8.8 | 0.24 | 10.9 ± 271.5 | 0.30 | 0.5 |
| Thrombin 29-mer | 50 | 2.1 | 7.6 | 0.21 | 15.3 ± 0.1 | 0.43 | 0.5 |
| Thrombin 29-mer | 100 | 1.9 | 5.6 | 0.16 | 12.7 ± 0.1 | 0.35 | 0.5 |
| Thrombin 15-mer | 10, 50, 100 | N/A | N/A | N/A | N/A | N/A | 25–200 |
| TGFβ1 | 10 | 9.2 | 53.7 | 2.1 | 165.3 ± 0.1 | 6.6 | 90 |
| TGFβ1 | 50 | 10.5 | 62.1 | 2.5 | 135.3 ± 0.1 | 5.4 | 90 |
| TGFβ1 | 100 | 10.5 | 32.2 | 1.3 | 74.5 ± 0.1 | 3.0 | 90 |
© 2020 by the authors. Licensee MDPI, Basel, Switzerland. This article is an open access article distributed under the terms and conditions of the Creative Commons Attribution (CC BY) license (http://creativecommons.org/licenses/by/4.0/).
Share and Cite
Klose, A.M.; Miller, B.L. A Stable Biotin-Streptavidin Surface Enables Multiplex, Label-Free Protein Detection by Aptamer and Aptamer-Protein Arrays Using Arrayed Imaging Reflectometry. Sensors 2020, 20, 5745. https://doi.org/10.3390/s20205745
Klose AM, Miller BL. A Stable Biotin-Streptavidin Surface Enables Multiplex, Label-Free Protein Detection by Aptamer and Aptamer-Protein Arrays Using Arrayed Imaging Reflectometry. Sensors. 2020; 20(20):5745. https://doi.org/10.3390/s20205745
Chicago/Turabian StyleKlose, Alanna M., and Benjamin L. Miller. 2020. "A Stable Biotin-Streptavidin Surface Enables Multiplex, Label-Free Protein Detection by Aptamer and Aptamer-Protein Arrays Using Arrayed Imaging Reflectometry" Sensors 20, no. 20: 5745. https://doi.org/10.3390/s20205745
APA StyleKlose, A. M., & Miller, B. L. (2020). A Stable Biotin-Streptavidin Surface Enables Multiplex, Label-Free Protein Detection by Aptamer and Aptamer-Protein Arrays Using Arrayed Imaging Reflectometry. Sensors, 20(20), 5745. https://doi.org/10.3390/s20205745