1. Introduction
Ultrasonic guided wave (UGW) testing is one of the advanced Non-Destructive Testing (NDT) techniques and is also known as long range ultrasonic testing. It uses a guided wave signal for testing complex structures such as bars, pipes, etc. UGW testing is broadly used for the inspection of pipelines and has the capability to screen long lengths of these structures in a short time and recognize anomalies (if there are any) from a single test location. A couple of dry transducer arrays are placed linearly around the structure’s circumference in this technology, with some distance from each other, to produce pure axisymmetric (Longitudinal or Torsional) wave modes. It propagates waves within the pipe wall and along the pipe’s main axis. However, the scattering of the waves happens once the waves come across discontinuities in wall thickness. The range of frequencies that are used for UGW testing is normally between 20–100 kHz and the pulse–echo principle is a common approach for UGW testing [
1,
2,
3].
Generally, the attenuation characteristics of UGW testing compared with shear and compression ‘bulk’ wave modes used for conventional ultrasonic testing (UT) are inherently low. The test ranges with guided wave technology, in ideal conditions, are around 50 m in each direction for a bar pipe. However, in real life, most of the pipelines are buried in the ground for safety or aesthetic reasons and, in such cases, non-metallic coatings are commonly applied, which are often viscoelastic in nature, as the primary means of corrosion protection for the pipe. Therefore, the propagation characteristics of the UGW are significantly influenced by the presence of such coatings. These coatings isolate sound energy inside the pipe, particularly when the pipe is buried, which reduces the attenuation ratio of axisymmetric wave modes compared to an uncoated buried/unburied pipe. Numerous factors affect the attenuation such as types of coatings, the material properties of the pipes, test frequency, the coating thickness, etc., or how well the coating is bonded to the pipe. In general, the test range is significantly reduced when using a viscoelastic coating that absorbs the sound energy [
4,
5,
6].
In guided wave technology, short pulses are utilized to minimize the dispersion’s effect and increase the resolution among the features. The excited signal is selected from one of the axisymmetric wave modes, either Torsional or Longitudinal, to produce an axisymmetric wave mode. Moreover, to remove the random noise, the system, as a default, averages the received signal over the repeated test [
1,
2]. However, due to the shape of the system and the interaction of the signal with features inside/outside of the pipe, mode conversion happens, which generates other wave modes that are mainly dispersive. Xu et al. [
7] investigated the mode conversions in the steel plate and stated that mode conversion can occur upon encountering defects within the structure, leading to other wave modes rather than the reflected one. They investigated the group velocity and modal energy of the converted modes using a two-dimensional finite difference time domain approach to measure the scattering field and extract numerical trends. The results show that the apparent group velocities of the converted modes depend on the position of the defect and its severity. They claim that mode conversion can be used to localize a hidden defect. For these types of wave modes, the velocities vary with the frequency, so the energy spreads over time and space throughout the propagation, which makes an analysis of the signal complicated and normal signal processing techniques such as low pass and high pass filtering are not able to remove these dispersive signals that lead to the generation of coherent noise.
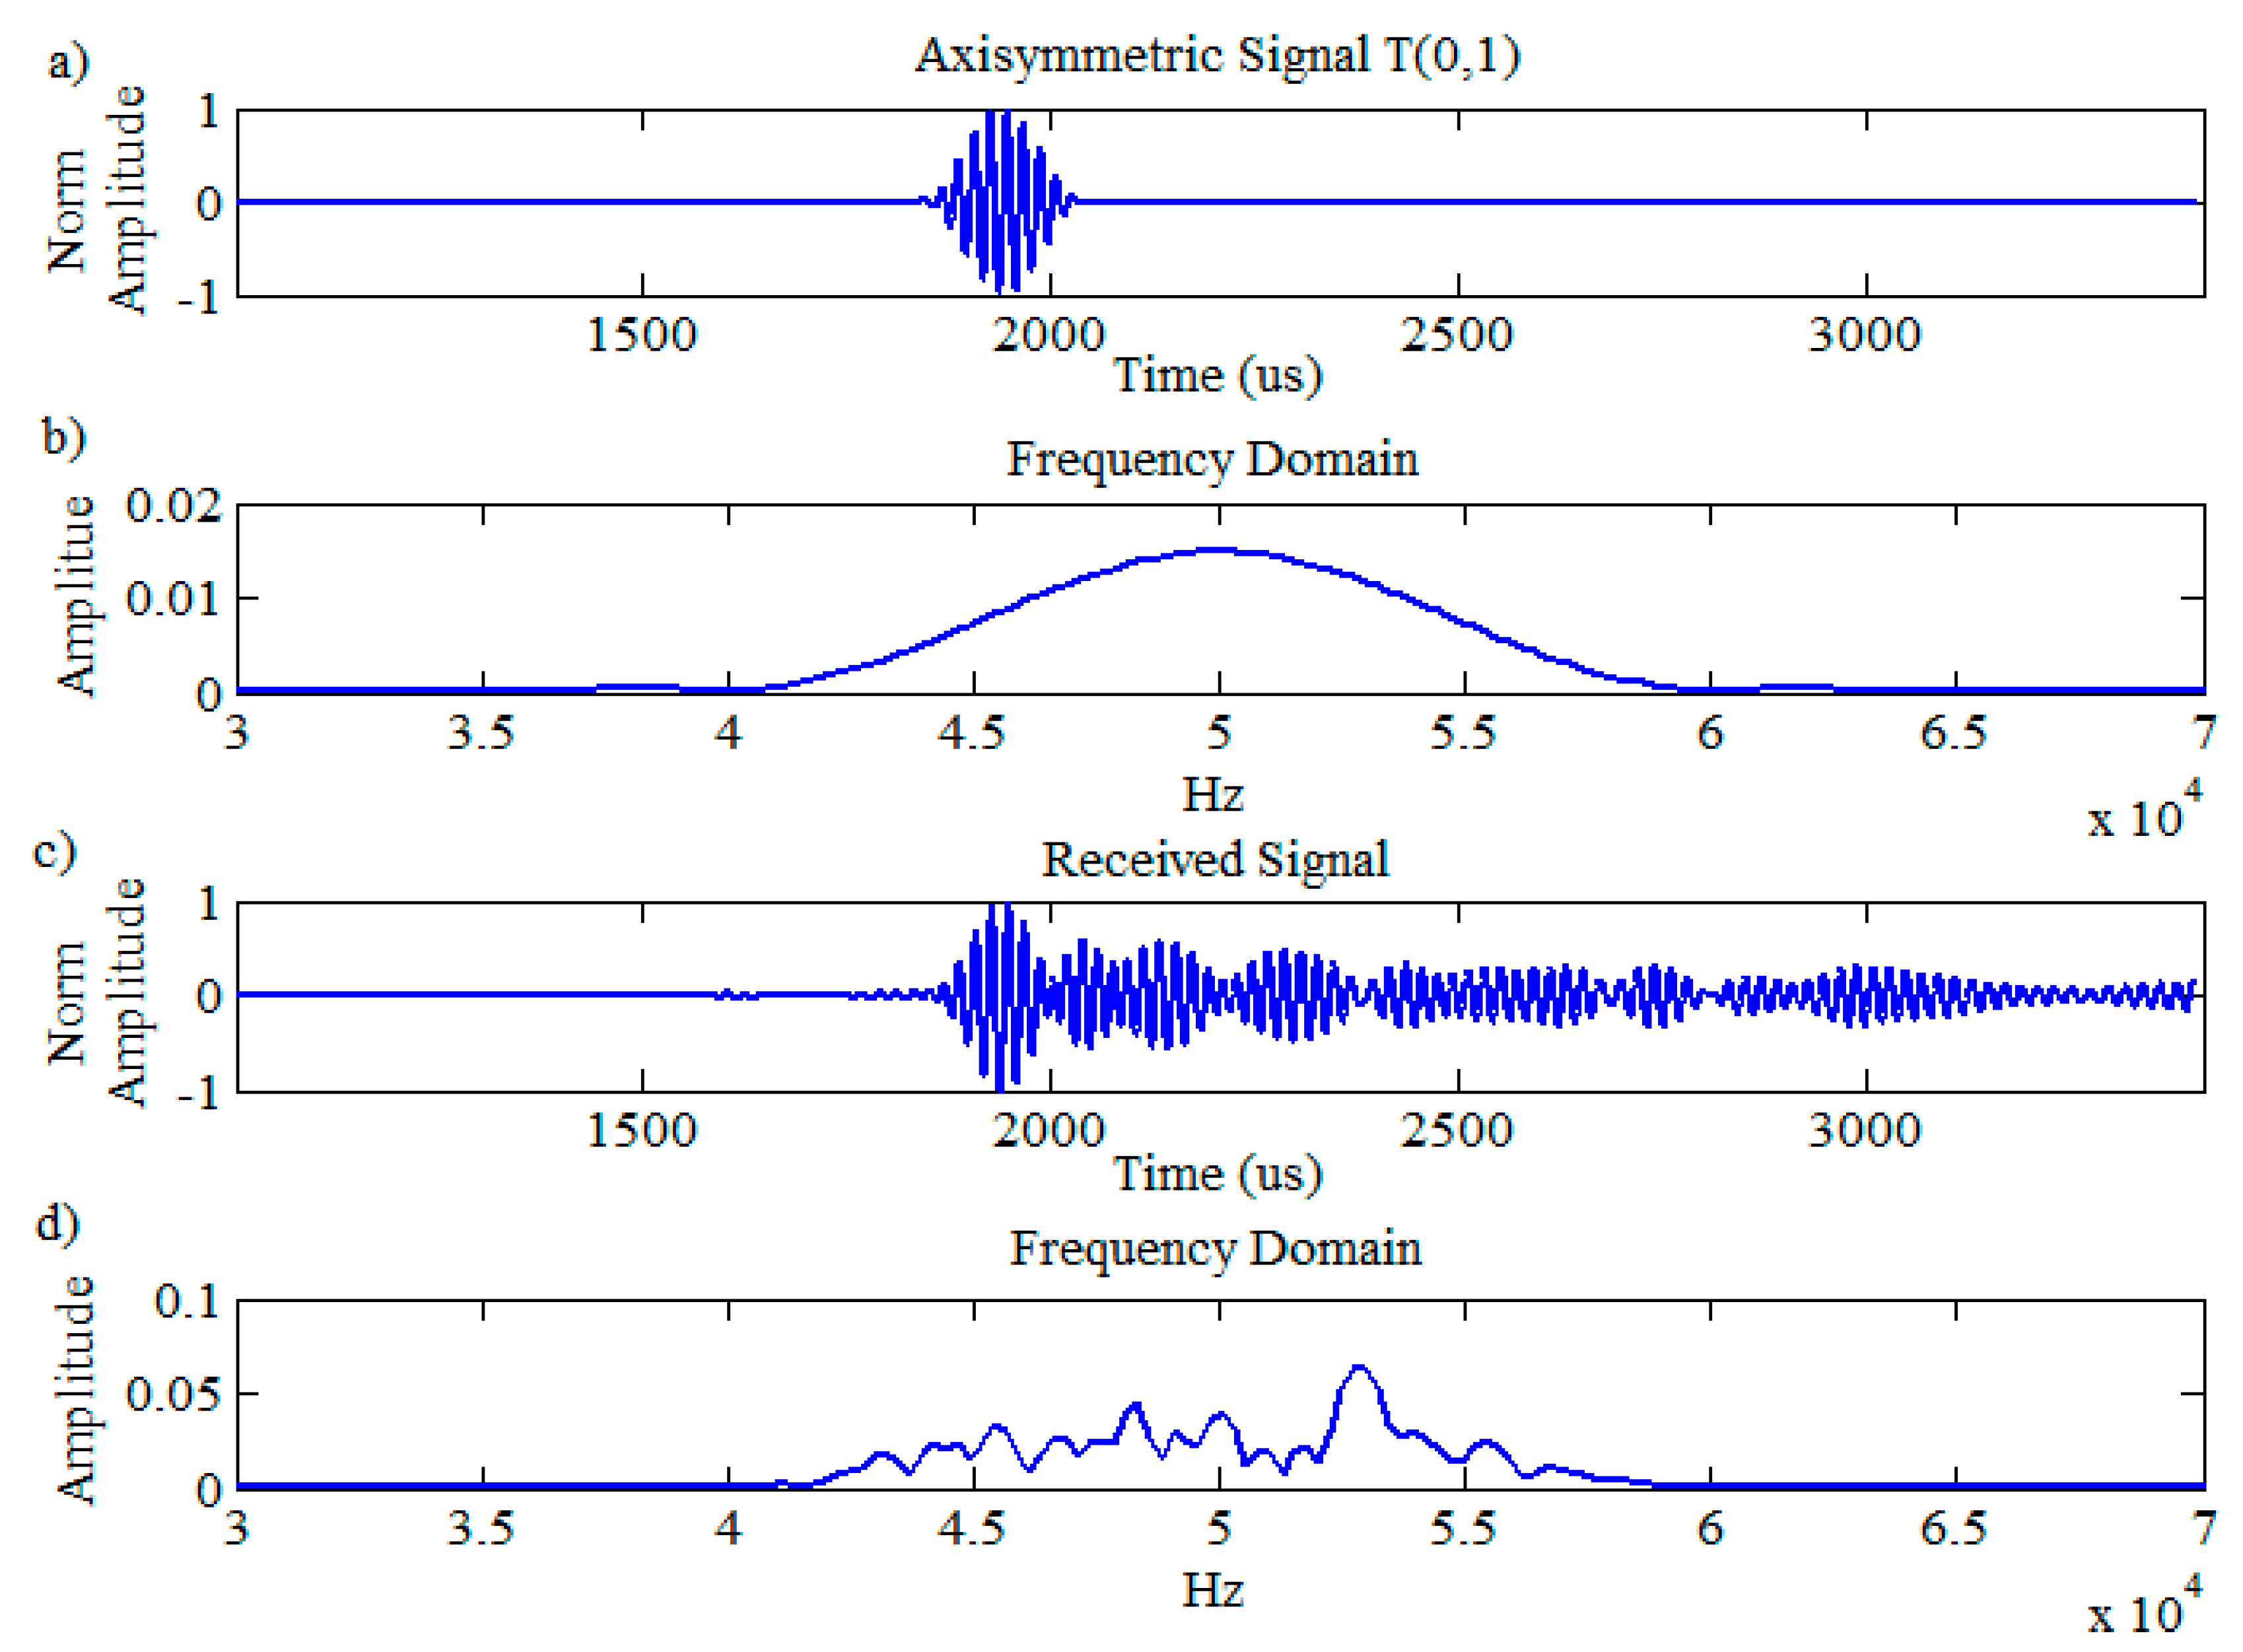
The typical ideal excitation signal of T(0,1) in the time domain and its response in the frequency domain is illustrated in
Figure 1a,b. The received signal which contains the combination of wave modes (T(0,1), its flexural wave mode family F(n,2)) and its frequency response is illustrated in
Figure 1c,d, respectively. The flexural wave modes are frequency dependent and dispersive; hence, the received signal, as presented in
Figure 1c, is spread out in space and time due to the existence of dispersive modes that leads to generation of background noise. Since the desired reflection signal is based on a single axisymmetric wave mode, the flexural families will be considered as noise that degrades the signal-to-noise ratio (SNR) and spatial resolution of the signal response.
Figure 1b,d display the spectra of the ideal reflection and the typical fluctuated received reflection in the frequency domain, respectively. The input pulse is a 50-kHz, 10-cycle, Hann-windowed sine signal. This behavior reduces the sensitivity of guided wave inspection and since it has an equivalent bandwidth to the input signal in the frequency domain, it makes interpretation extremely difficult [
5,
8].
The main challenge is to identify small features that might be covered by the current noise level, which makes signal interpretation difficult. This is mainly happens due to the complexity of the noise signature that is produced by the existence of undesired wave modes. In particular, the issue of identifying defects in buried and coated pipelines is recognized as a major factor affecting plant availability in the oil and gas market. The dispersion is one of the major sources of coherent noise; thus, it is extremely essential to minimize it somehow to be able to enhance the spatial resolution and identify small defects. One way is to modify the hardware of the system, which is highly costly. Another option would be to investigate the post-processing side of this technology to enhance the signal quality by minimizing the coherent noise and increasing the sensitivity to defects, in particular for buried and coated pipes.
In this paper, an advanced signal processing technique is employed as a post-processing algorithm, known as “split-spectrum processing (SSP)” to minimize the effect of dispersive wave modes at the destination. This technique was already tested for limited scenarios on some random ordinary bar pipes in the lab environment without coatings and achieved promising results [
8,
9]. This work investigates coated pipelines that, due to their coating, have a considerably higher attenuation compared to the ordinary pipes, and some challenging scenarios are designed for testing the SSP.
The effect of dispersion on UGW testing has been investigated by researchers over the last few decades, such as Wilcox [
10,
11] and Sicard et al. [
12], to compensate for its behavior, either by reversing the effect of dispersion or employing prior knowledge of its characteristics to map it from the time domain to the frequency domain and then restore it as an undispersed pulse. Dispersion pre-compensation was also considered by Zeng and Lin [
13]. They utilized chirp-based narrowband excitation data to utilize the advantage of chirp excitation in order to calculate the propagation distance by employing their previous knowledge of dispersion behavior.
There are some other approaches such as the pulse compression (PuC) method proposed by Toiyama and Hayashi [
14], the dispersion compensation (DC) approach proposed by Xu et al. [
15,
16] and a combination of these approaches developed by Yucel et al. [
17,
18] to analyze the propagation behaviors of the received signal. Liu et al. [
19] investigated an automatic technique for the individual mode extraction of dispersive UGW signals on plates using inversible synchrosqueezed wavelet transform. They tried to obtain a high-resolution time frequency representation and extract its trajectory for each element, employing image processing algorithms. They stated that this approach was successful for automatic mode separation, both for synthesized and experimental UGW signals. The majority of these techniques were successful somehow for highly dispersive signals, but not that successful for non-dispersive wave modes such as axisymmetric ones or the wave modes that have little dispersion such as lower-order flexural wave modes.
Moreover, several post-processing algorithms such as wavelet de-noising and cross-correlation were also considered by Mallet et al. [
20] for reducing the effect of dispersion, but the results show that these methods were not successful on UGW testing. This was mainly due to the approach of these techniques, in that, in both cases, any signals smaller than the defined threshold were removed regardless of whether they were actual signals or not.
Furthermore, the SSP algorithm was investigated for use in non-destructive testing, mainly for conventional UT, to enhance the signal quality [
21,
22,
23]. The results illustrated some enhancements in terms of the grain scattering that occurs when the received signal splits into a set of sub-band signals with different center frequencies. It has been claimed that this enhancement is achieved only when the appropriate filter bank parameters have been identified for the SSP method in UT inspection. According to their theoretical approach, there is some discrepancy in terms of the value of a parameter that changed the result slightly. This was mainly because of using a Gaussian function for filtering rather than a Sinc function due to its simplicity, while the design was based on Sinc function.
The SSP method, in conjunction with an order statistic, was studied by Saniie et al. [
24] to enhance the flaw-to-clutter ratio of noise. Although the results show some enhancements where there was enough separation between them, their performance is worsened with undesirable information.
Additionally, a modified version of SSP called the complex-plane SSP technique was proposed by Rubbers and Pritchard [
25], which enhanced the SNR in traditional UT testing by employing additional mathematical information. Then, they reviewed the SSP algorithm [
26] and claimed that the use of this approach is limited in practice due to the lack of linearity of the signal’s amplitude; hence, it cannot be used for measuring flaws. SSP, in combination with an order statistic approach, was developed by Syam and Sadanandan [
27] to minimize the effect of reverberation by utilizing a wideband signal in conventional UT. Although it has been claimed that they were successful in identifying flaws, their technique is only verified for a synthesized signal and further validation is required.
A new filter bank strategy was proposed by Rodriguez et al. [
28,
29] by introducing variable bandwidth filters, where the filters are equally spread out in the frequency and their energy gain equalized. The results show that the frequency multiplication (FM) method obtained the highest resolution by reducing the required number of filter bands and the system complexity when used with the proposed filter bank design compared to other approaches. However, it has been claimed that further investigation is required for this approach as it is not evaluated for highly dispersive models, non-stationary structures, or scenarios with a different type of defect.
It has been shown throughout the literature that SSP application could be implemented successfully if appropriate filter bank parameters are selected. These successes were mainly achieved for conventional UT inspection in terms of SNR enhancement. However, these values were soon found not to be suitable for UGW inspection. This is mainly due to the existence of a combination of wave modes that operate in the kHz range (e.g., axisymmetric and non-axisymmetric) with different velocities. In order to find an appropriate parameter of SSP for use in UGW inspection, some parametric studies were carried out in previous works [
9,
30]. The results presented revealed that the optimum parameters were identified for synthesized signals and ordinary bare pipes in a limited trial in the lab that significantly enhanced the signal quality in terms of spatial resolution and SNR.
In this work, the intention is to identify the optimum parameters of SSP to enhance the signal quality and increase the inspection range for more challenging scenarios where the pipe is partially coated and the attenuation compared to the ordinary pipes is quite high. Therefore, two laboratory experiments were carried out on two eight-inch pipes (schedule 40) to evaluate the proposed method. Both pipes were partially coated with Denso Tape, Winn & Coales International Ltd., which is one of the most common coating materials (spiral wrap) utilized in the industry for coating due to its simplicity, as it can be easily applied over a pipe.
A Teletest Focus+ unit was employed for the experiment, which is one of the commercially available tools in the market for the inspection of tubular structures [
31]. The unit was used for data collection to excite and receive the signal. The pulse–echo technique was also used, where sound was transmitted along the axial length of the pipe to inspect inaccessible areas that are not able to be inspected by conventional methods. The results show that the proposed SSP approach enhances the quality of the signal in terms of SNR by roughly 40 dB compared to conventional means, which is a great success in terms of UGW testing to increase the inspection range and enhance the sensitivity of defect detection.
This paper is structured as follows: the application of split-spectrum processing (SSP) and its implementation are described in
Section 2.
Section 3 gives details about the selection of SSP parameters.
Section 4 and
Section 5 provide the lab experiments of the proposed method, followed by field data analysis.
Section 6 provides the discussion, and
Section 7 concludes the paper.
3. Selection of SSP parameters
The parameters that were employed for the traditional UT were not suitable for guided wave testing. This was due to the narrow bandwidth and long duration of the guided wave signal, which runs in the kHz range, whereas the conventional ones run in the MHz range. The most common filter separation calculation in UT led to a huge quantity of sub-band filters [
21,
22,
23] which require either a narrow bandwidth or a large overlap. The signal responses might be lost due to the selection of narrowband filters, whereas large overlaps between the sub-bands led to the outcome of each one becoming highly correlated, which could compromise the performance of the proposed method at minimizing the background signal.
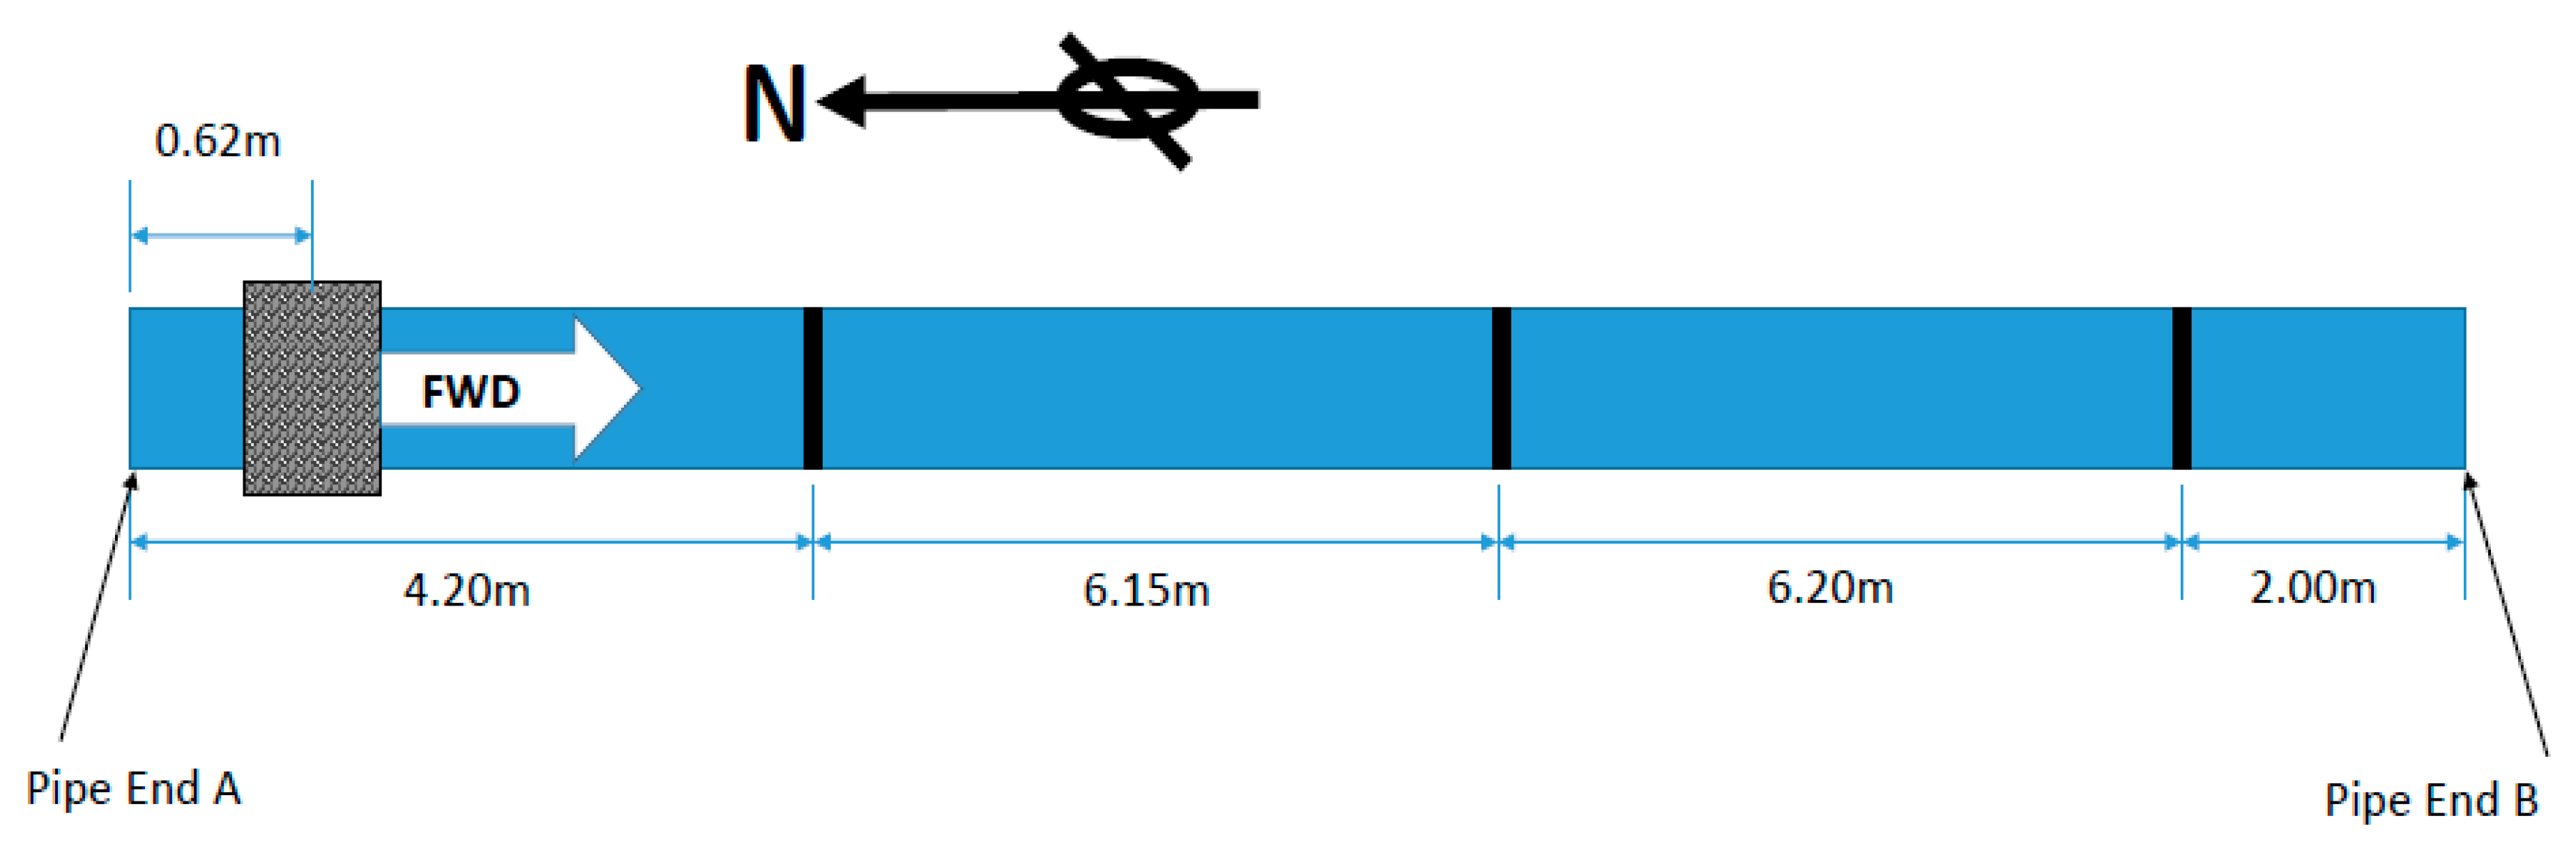
To identify the optimum parameters of the proposed SSP method for UGW testing, a brute force search algorithm was employed across the SSP parameters, i.e., the number of filters (N), the filter crossover point (x), the filter separation (F), the sub-band filter bandwidth (
), and the total bandwidth (B). The full details of these parameters were already discussed in previous papers [
5,
9]. In brief, these parameters are independent of each other, as illustrated in
Figure 3, so if one value changes, the other values are also required to change. Hence, the optimum values need to be identified in parallel. These values were first inspired by the values employed for traditional UT, which provides a suitable range that can be used for different pulse length signals or different frequencies. It is claimed that the processing bandwidths will be increased when choosing higher frequency signal or shorter pulse lengths.
For instance, the number of filters (N), according to
Figure 3, can be calculated by dividing the total bandwidth (B) by the value of the filter separation (F) as shown below:
In addition, the total bandwidth needs to be selected somehow so that the signal’s reflection from real features within the structure stays constant while the reflection from dispersive wave modes varies. Note that if the bandwidth selected is unsuitable, then either some features of reflection will be lost, or some dispersive wave modes will not be removed, which, either way, reduces the spatial resolution. To reduce the effect of dispersive modes, narrowband waveforms up to 10 cycles are utilized as the excitation signals in UGW testing using Hann-windowed sine waves.
Many researchers suggested [
3,
21,
22,
23] that the value of sub-band filters should be set around four times the values of filter separations. It should be noted that selecting the wrong value could lead to a reduction in the temporal resolution as the feature’s reflections will spread out in space/time and cover one another. It was found that [
5,
8] the 3dB cut-off frequency from the center frequency of the input signal could be employed as the band-pass filters in SSP filter design. Note that the overlap between filters needs to be selected accordingly as it affects the correlation between them, which could either cause the signal of interest to be lost or add noise. Hence, overlap needs to minimize the correlation among the background noise in adjacent sub-bands without losing information.
In terms of filter separation, it was claimed by Karpur et al. [
23] that appropriate spectral separation could be obtained by utilizing the frequency sampling theorem. Hence, the SSP filter separation could be calculated as:
where F is the sampling frequency and T is the duration of the input signal. Note that this is based on Sinc function; therefore, the actual value needs to be modified slightly as the Gaussian filter is utilized in this work for its simplicity instead.
As shown in
Figure 3, a part of the frequency spectrum of the unprocessed signal was chosen as the total bandwidth (B) that was fed into the system and the values of the rest are varied to identify appropriate values for them. Moreover, the value of the sub-band filter was selected to be a portion of the total bandwidth able to apply for any UGW signal. The SNR of the signal response was measured as a quantified performance to identify the optimum values of SSP parameters. The main concern was to preserve all the axisymmetric features and minimize the coherent noise reflection as much as possible. As a result, the optimum parameters were identified with the following values: (i) 99% of the total bandwidth, (ii) sub-band filter values equal to the total bandwidth divided by 11, (iii) a filter crossover of 1 dB, and (iv) a filter separation equal to the sub-band filter values divided by 1.5.
Consequently, the proposed values were defined as the optimum parameters of SSP for a 10-cycle Hann-windowed UGW signal with center frequencies of 30 kHz and 35 kHz for an eight-inch pipe. These parameters were subsequently utilized in this work for processing the experimental and field data analysis.
In addition, to estimate the attenuation rate, the relevant acoustic properties of the Denso Tape (Winn & Coales International Ltd.) as a coating material is studied to estimate the realistic values of the attenuation rate, in a similar manner to the study carried out in [
6,
32]. The attenuation of the axisymmetric T(0,1) wave modes, which were employed as the excitation modes, was measured. A trial and error method was employed to extract the material properties by adjusting the properties of the material to obtain a suitable result between the theoretical approach and the measurements for different frequencies. Hence, 3dB/m has been found as an appropriate attenuation rate for the Denso Tape coating and its steps are described in [
32]. It is found that its performance heavily depends on the thickness of the coating as well as the coating acoustic properties. This information could be utilized to identify and optimize testing conditions such as selecting the frequency range where the attenuation is less effective.
Moreover, the attenuation rates give rise to a wide range of amplitudes in the signal response across the examination length, which is potentially several meters long. As an example, if the attenuation rate of an ordinary pipe is 0.2 dB/m, an ultrasonic signal with an initial value of unity after 10m propagation will have an amplitude of 0.8. The 3 dB/m attenuation rate is obtained for the coated pipe of the T(0,1) mode; hence, the amplitude is 0.03, whereas, for 6 dB/m, the amplitude will be 0.001, i.e., 1/1000 of the initial amplitude.
5. Field Data Analysis
In this section, two sets of field inspection data are considered to validate the proposed SSP technique. Teletest technology is utilized to collect data with the narrowband excitation approach. Then the received signal is inspected by a trained UGW inspection personnel to recognize defects such as erosion or corrosion during the inspection using the conventional approach. This result is then compared with the proposed post-processing SSP method with optimum parameters using the PT recombination algorithm. The PT algorithm is claimed to be the best algorithm in terms of SNR improvement in guided wave testing [
9,
30]. A key point of this section is to demonstrate how the SSP method can boost the spatial resolution and SNR of the received field data compared to the traditional approach achieved with Teletest technology.
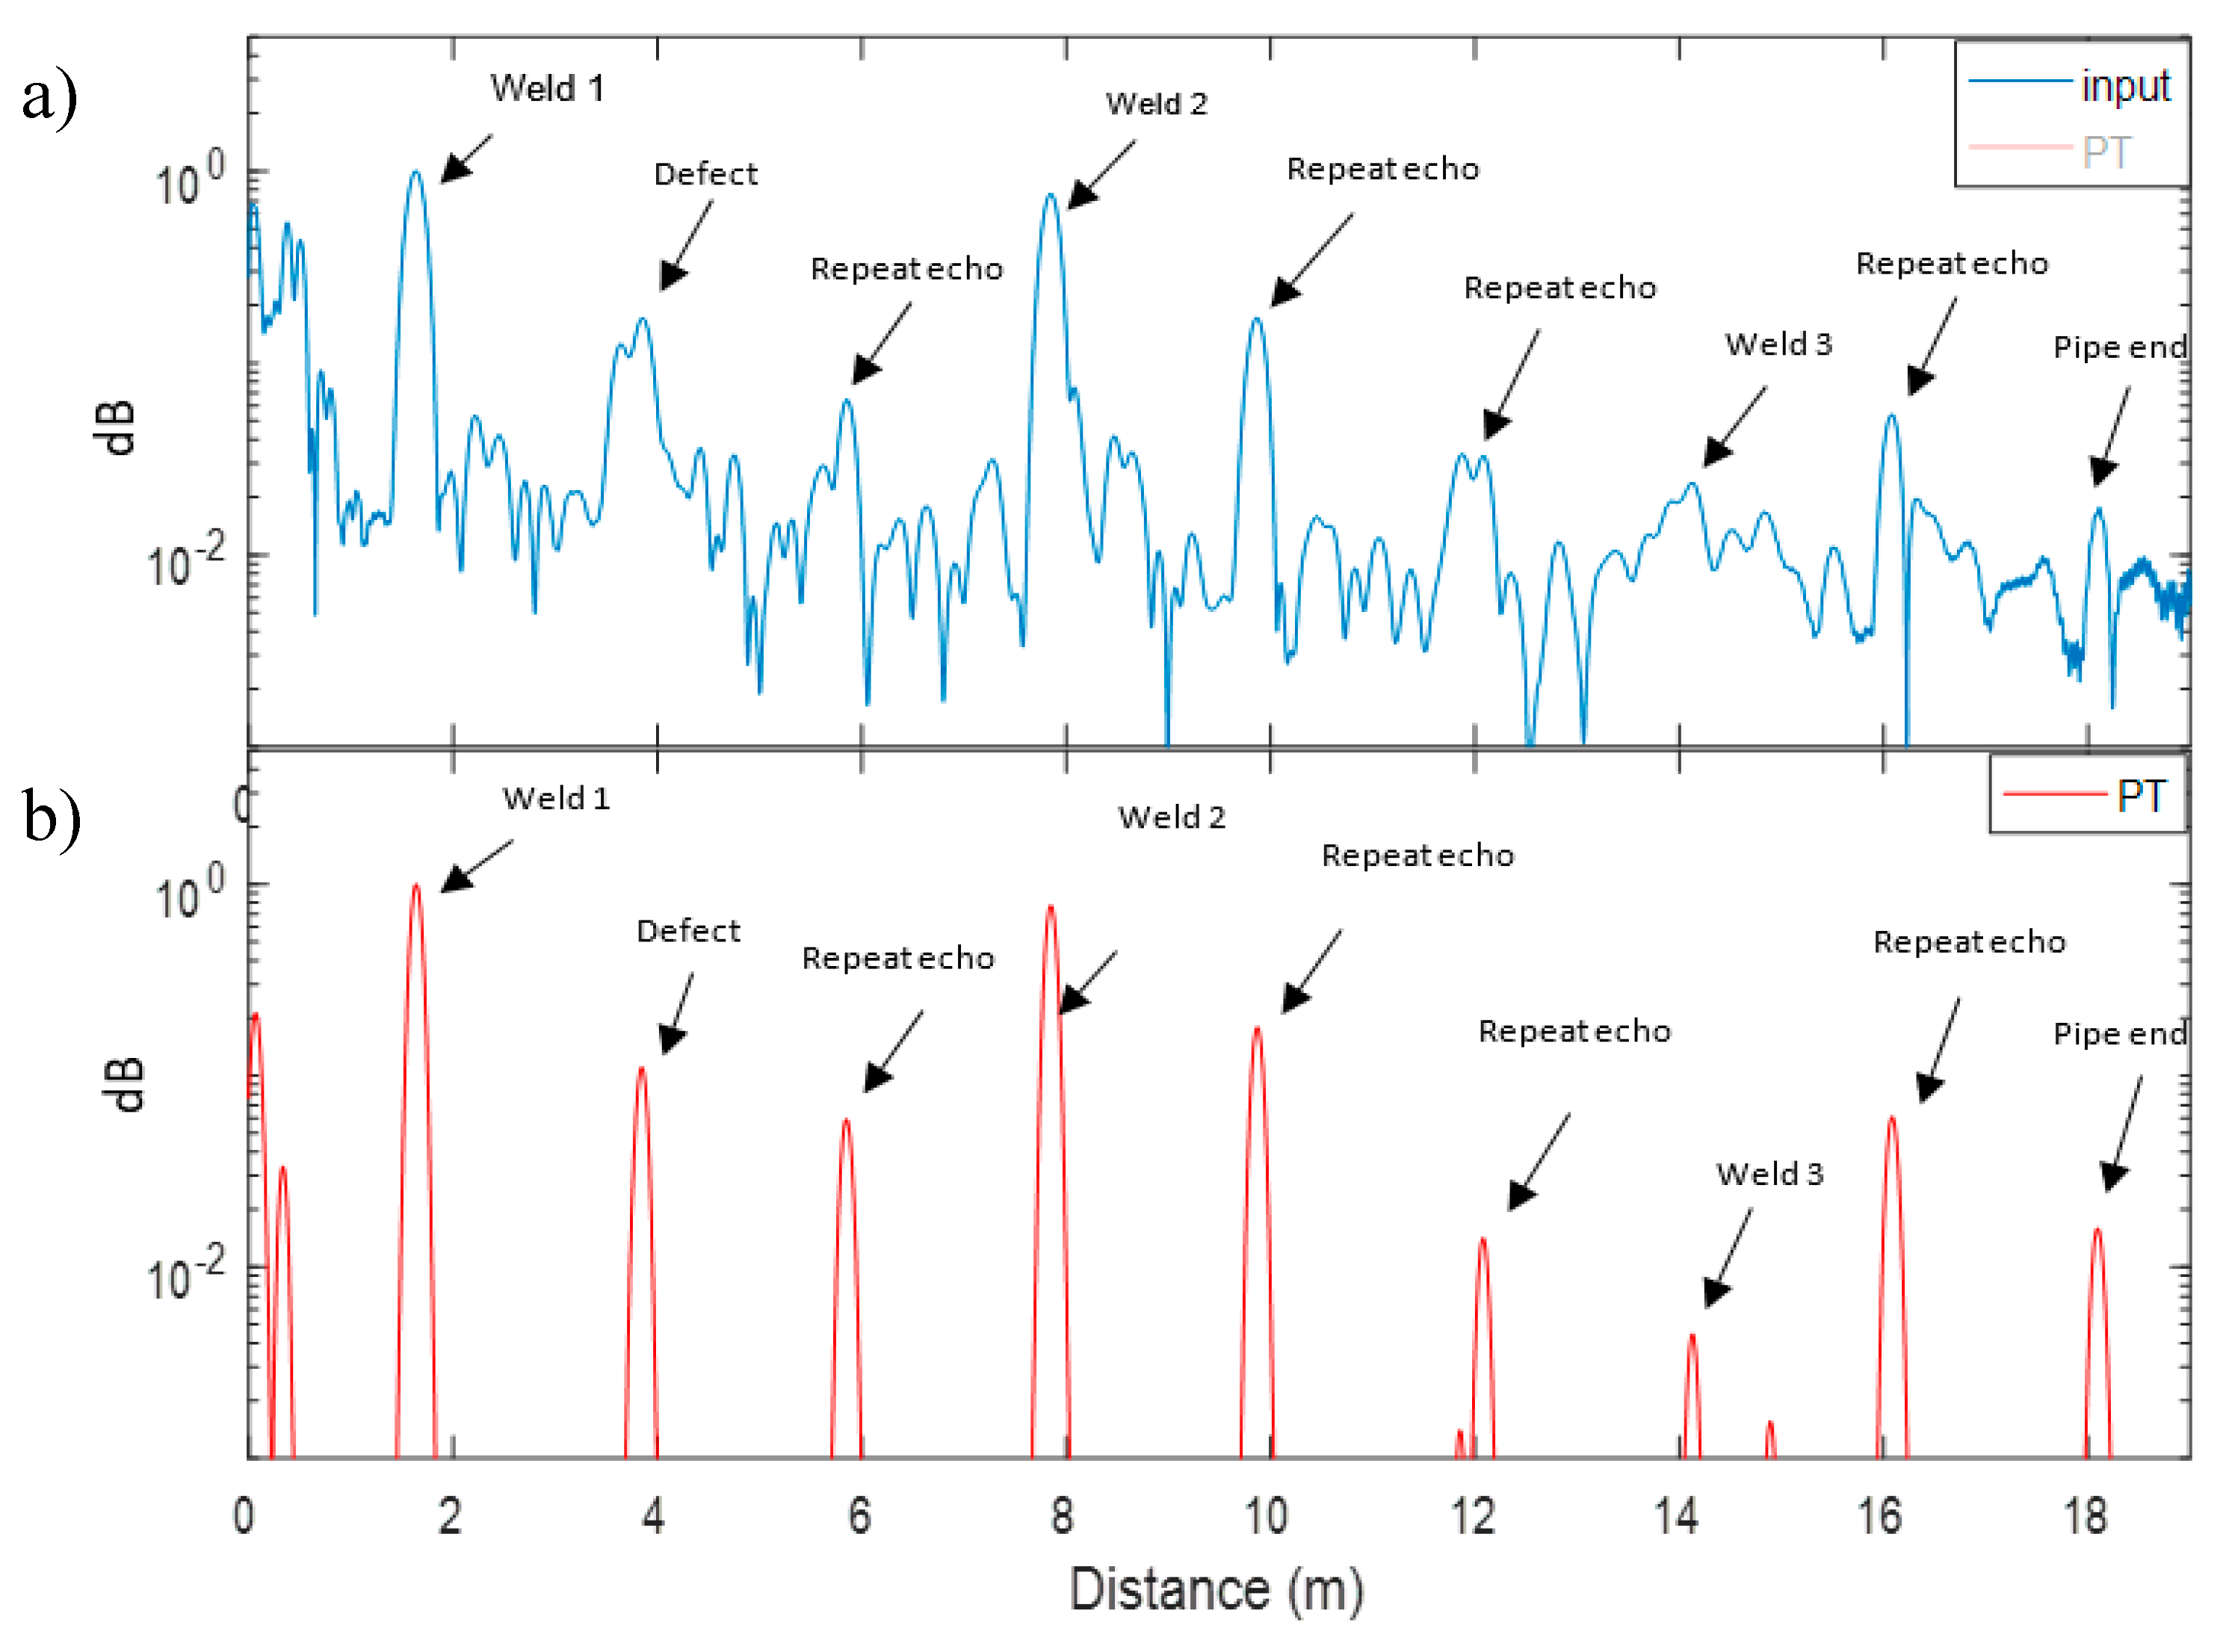
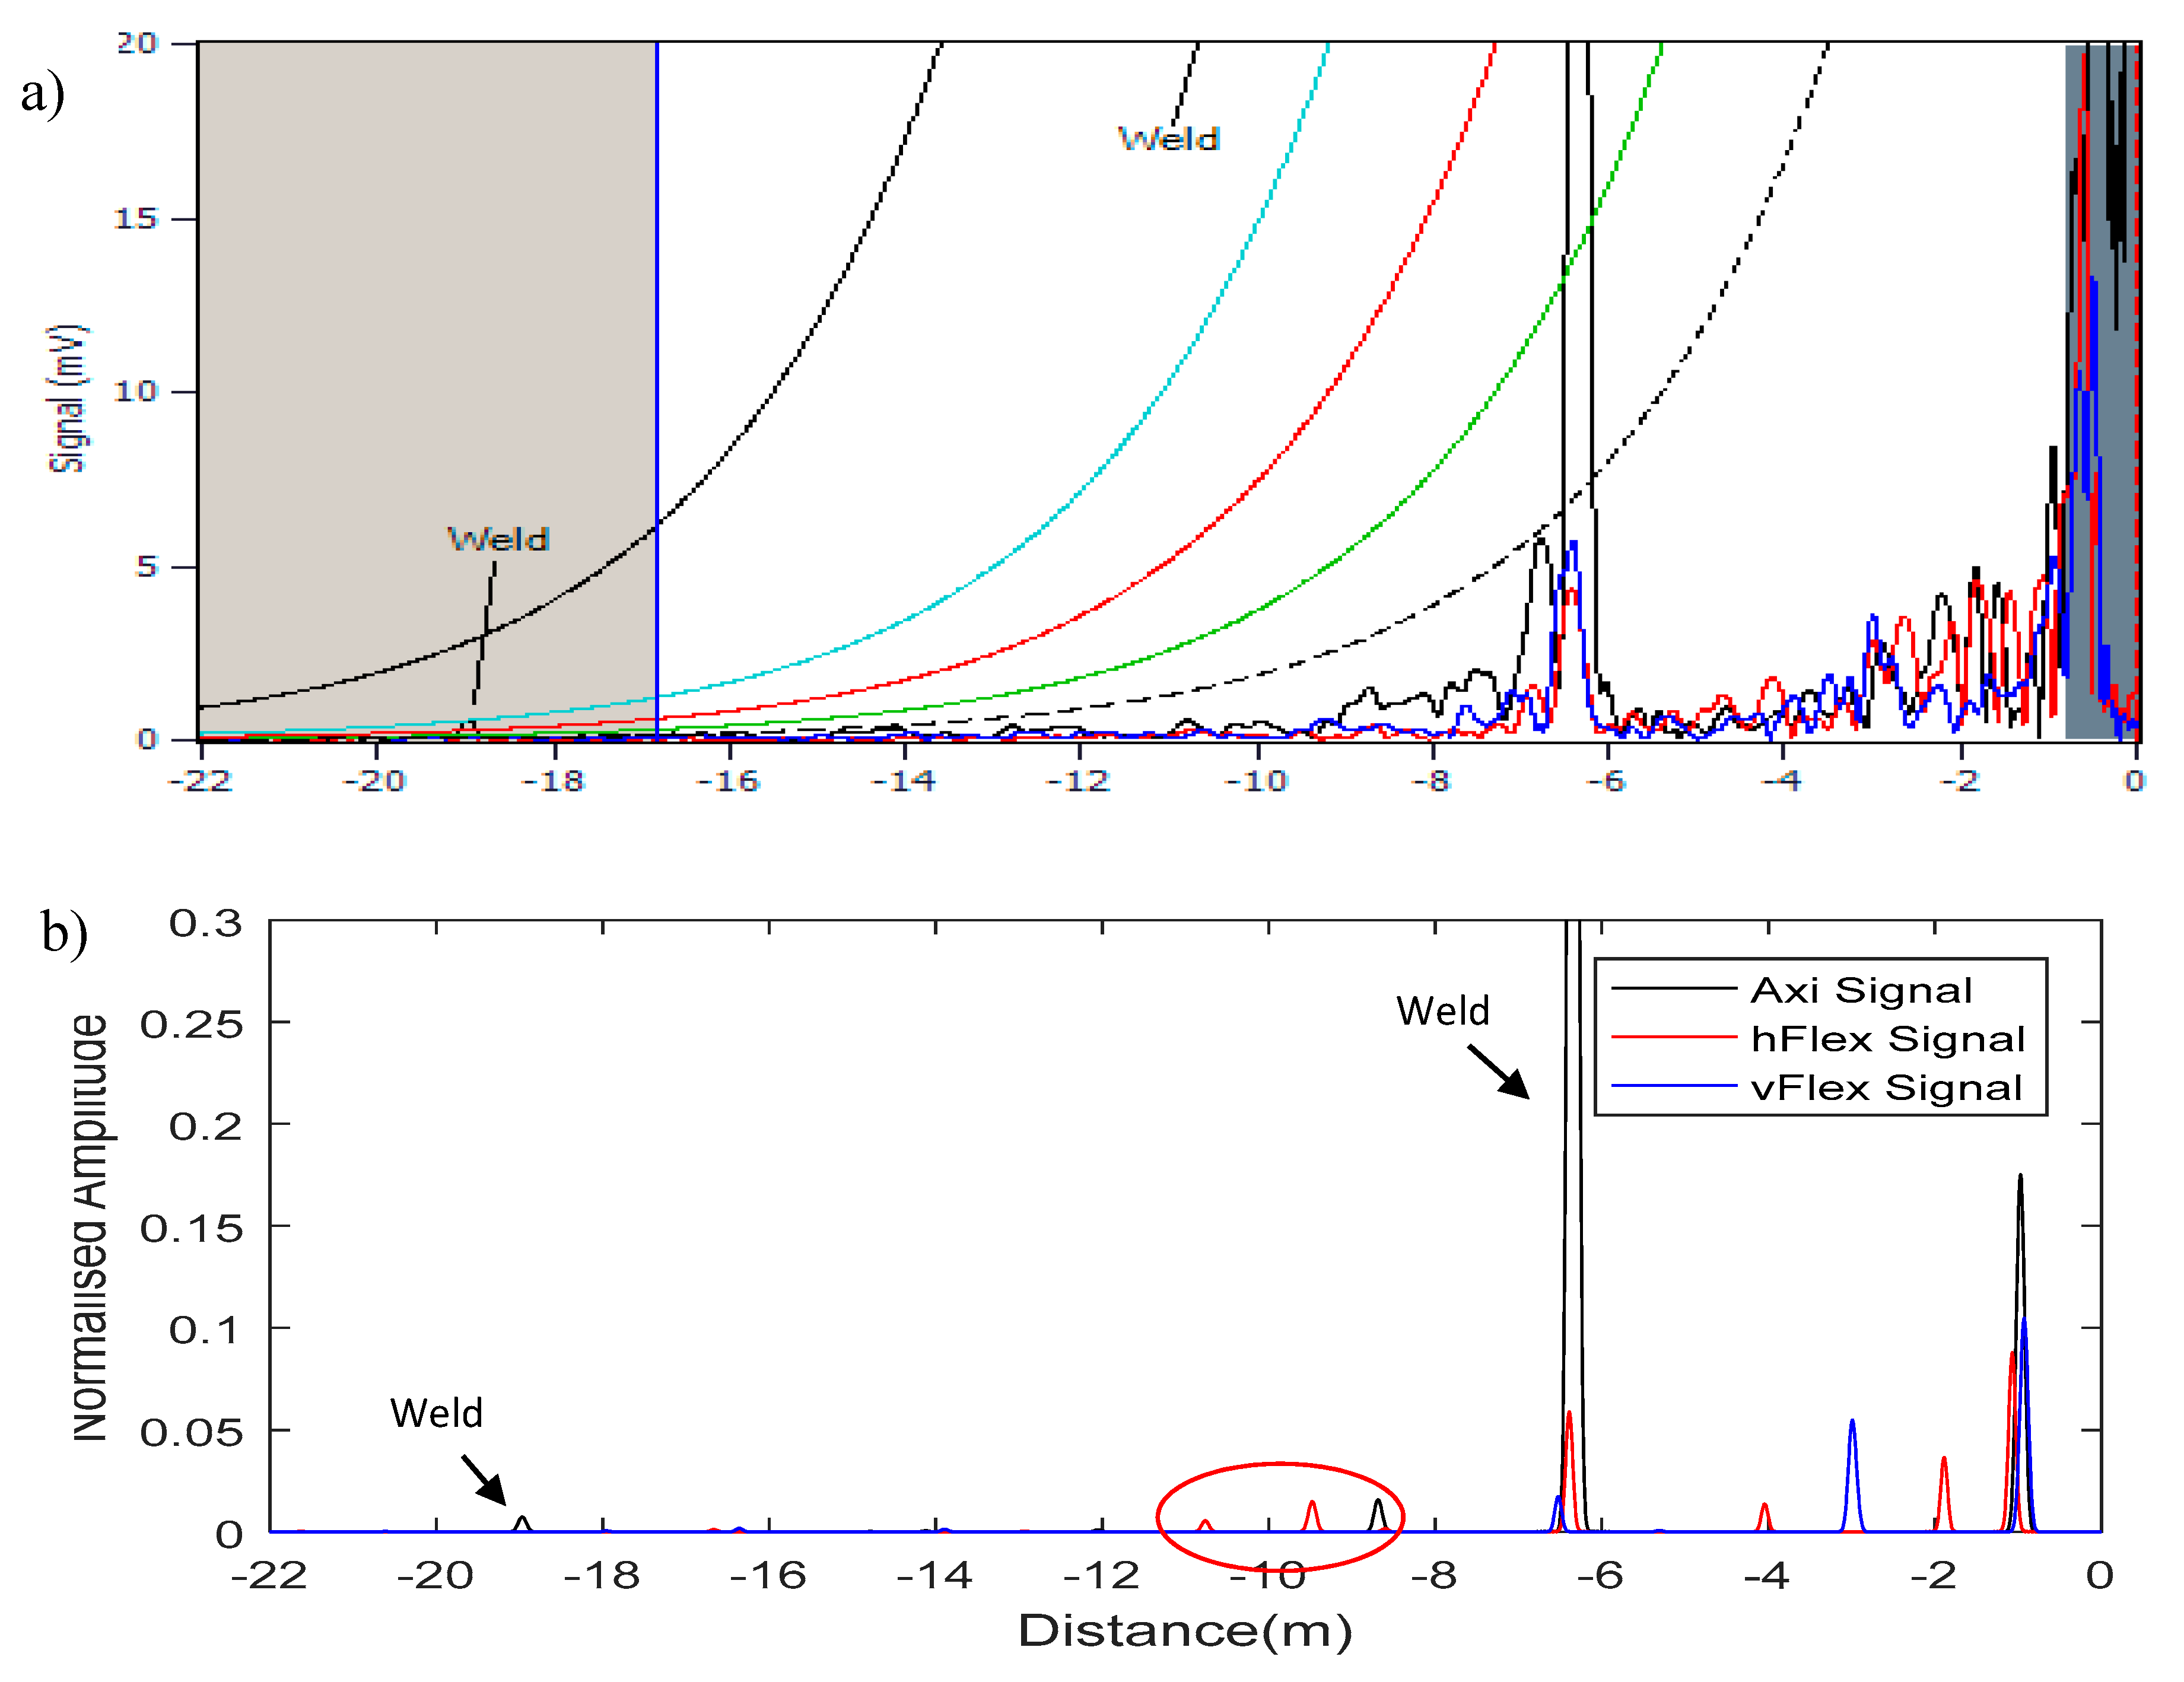
Figure 13 and
Figure 14 illustrate the linear A-scan in the distance domain (
x-axis) and the power amplitude (
y-axis) of the reflection’s signal that the operator utilized to analyze the data and decide whether there were any features within the structure. The black trace displays the axisymmetric T(0,1) wave mode; the blue and red traces present the vertical and horizontal flexural responses of F(1,2) in terms of cross-section displacement, respectively. In addition, distance amplitude correction (DAC) was employed in the Teletest device to set the reference signals for measuring the sensitivity of the scan and categorize the defects that the details are explained in [
1].
Figure 13a shows the conventional result of the field data (#1). The majority of the pipe was placed under the ground. It can be seen from the result that apart from the welds that are already identified, it is highly unlikely that the inspector could identify any other features on this pipe. However, after digging up part of this pipe, it has been reported by the client that there were some small features on the pipe around −8 m to −10 m from the Teletest collar location which was unrecognized by the conventional method. The SSP technique applied to this data and the result presented in
Figure 13b. The results confirm that the SSP technique flagged a few features in the same area reported by the client.
The same scenario occurred for the second set of field data (#2). The results of the conventional technique and SSP method are demonstrated in
Figure 14a,b, respectively. In these data, two welds and two bend welds were identified by both methods. In addition, the SSP results claimed that there were some small features around −10 m to −15 m from the tool location that needed to be investigated further. In the report generated by the client after digging up the pipe, it was mentioned that some features were identified on that region, which could confirm the SSP result flagging up some small peaks in that region.
However, this is a limited trial of field data analysis to confirm that the SSP method has the capability to improve the spatial resolution, SNR and increase the inspection range for pipeline inspection. In order to fully validate this method, more field data analysis is required.
6. Discussion
The results obtained within this work prove that the SSP method, with optimum parameter values, has great potential to enhance the UGW signal’s quality by minimizing the effect of background signals (coherent noise) in the signal’s response, primarily caused by the existence of undesired wave modes. Defect identification is one of the primary benefits of using UGW testing for the inspection of pipelines, but this method is considerably affected by the presence of coherent noise.
Hence, a technique is required in order to address the issue of such noise in UGW testing. As a result, the SSP technique is proposed to address this by minimizing the effect of dispersive wave modes. According to the literature, the outcome of the SSP approach is extremely sensitive to the selection of filter bank parameters and can be effective only if the optimum parameters are employed. To obtain them, a brute force search algorithm was utilized to identify the appropriate values by measuring the SNR of the signal’s response while preserving all the axisymmetric features and minimizing the background signals.
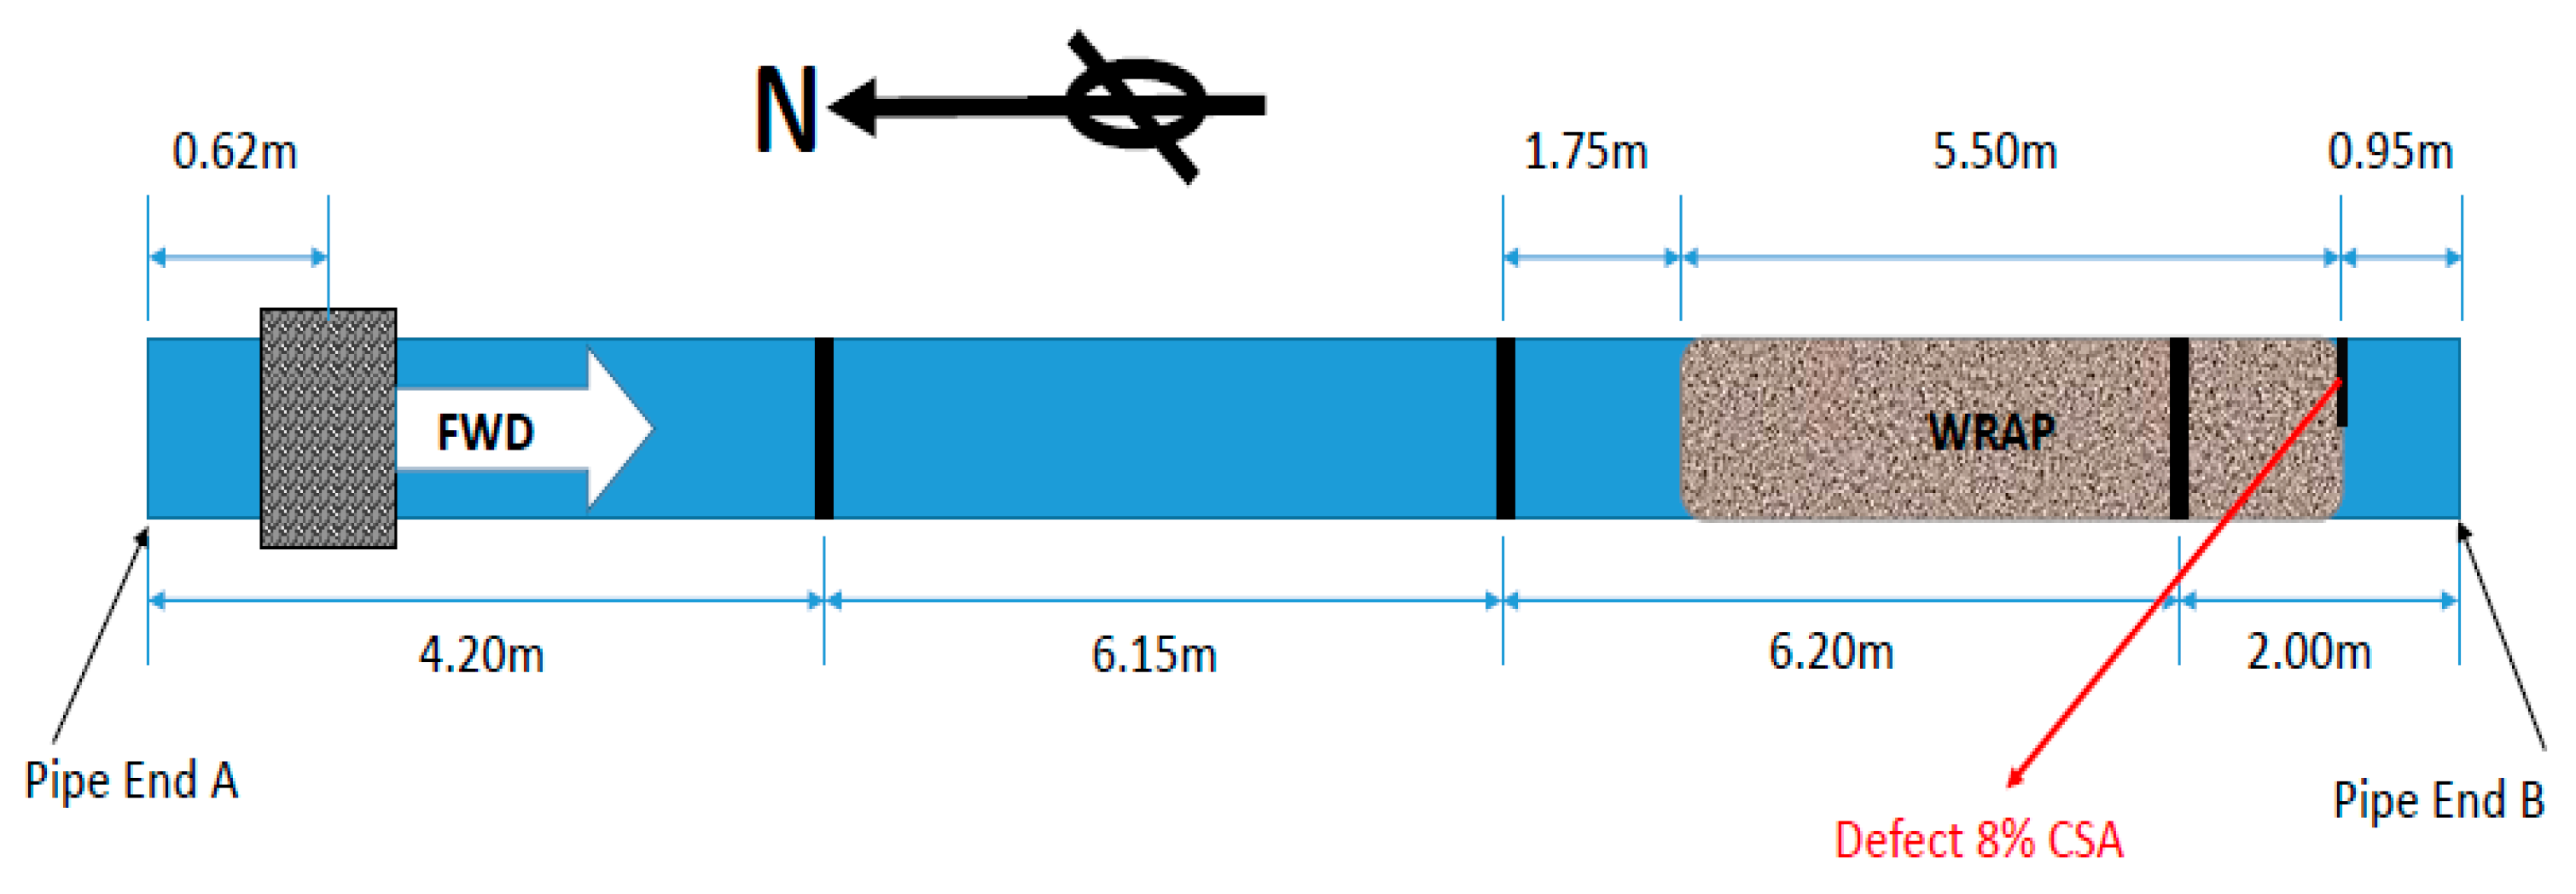
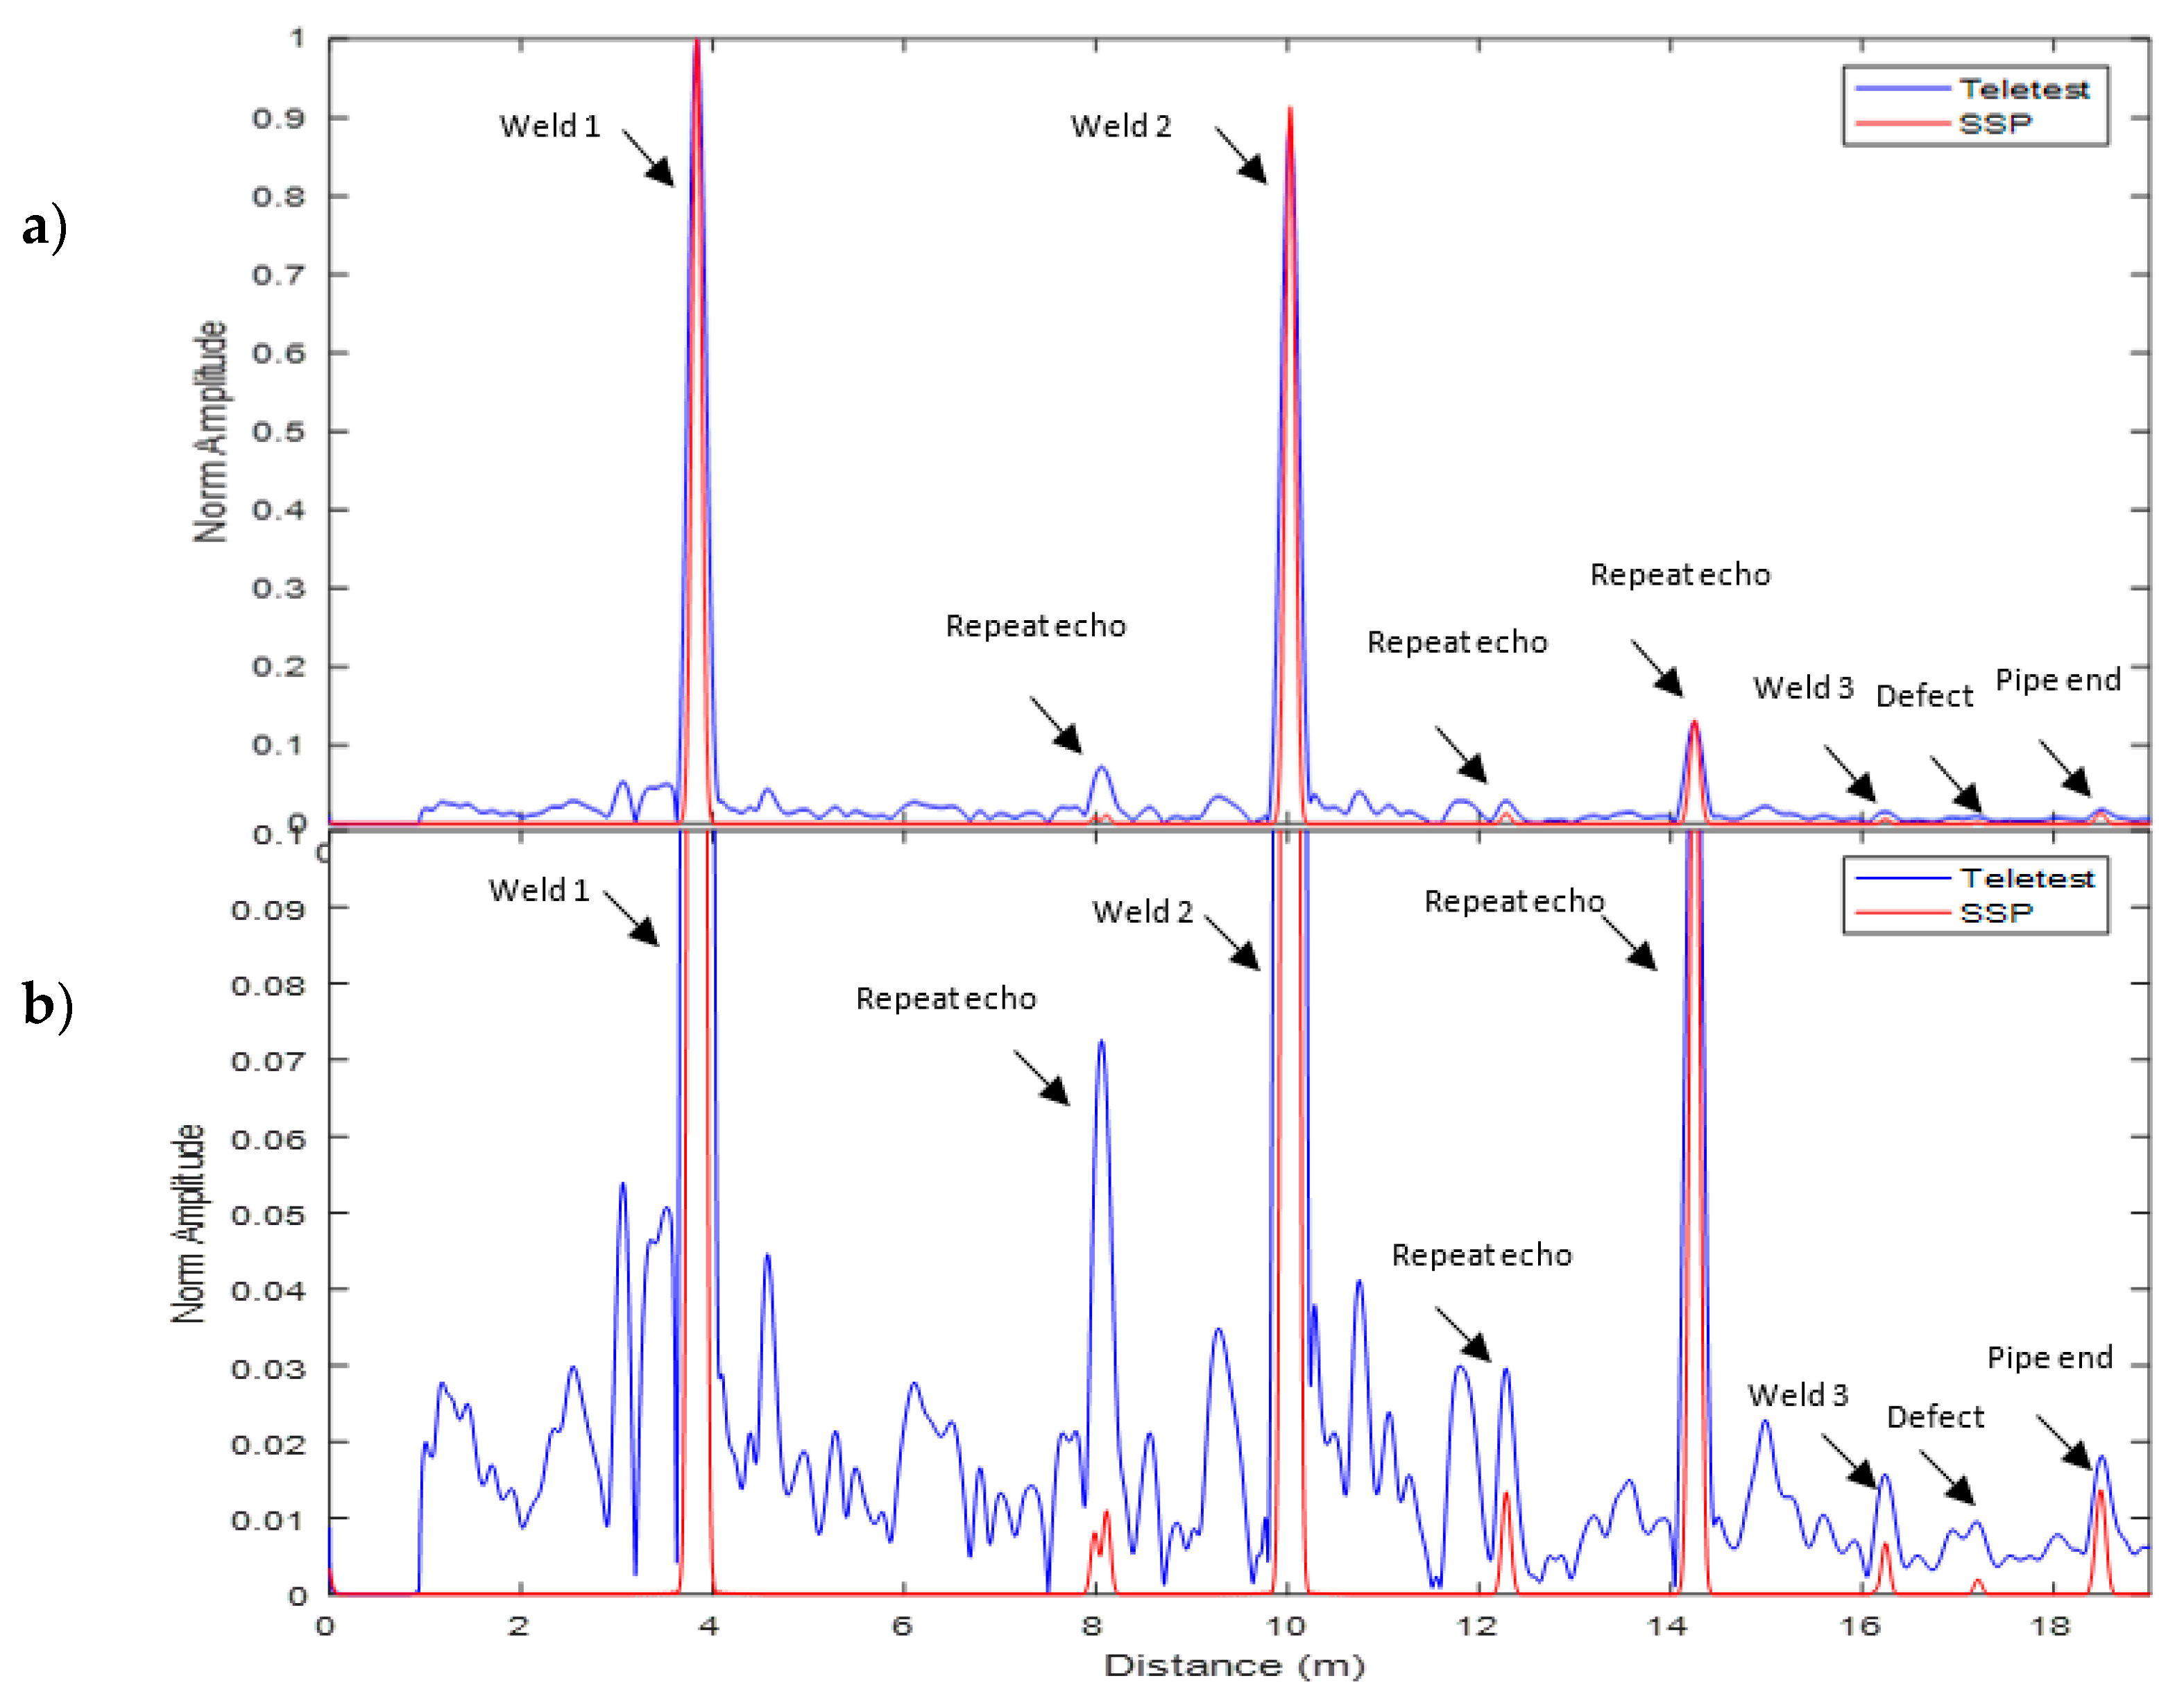
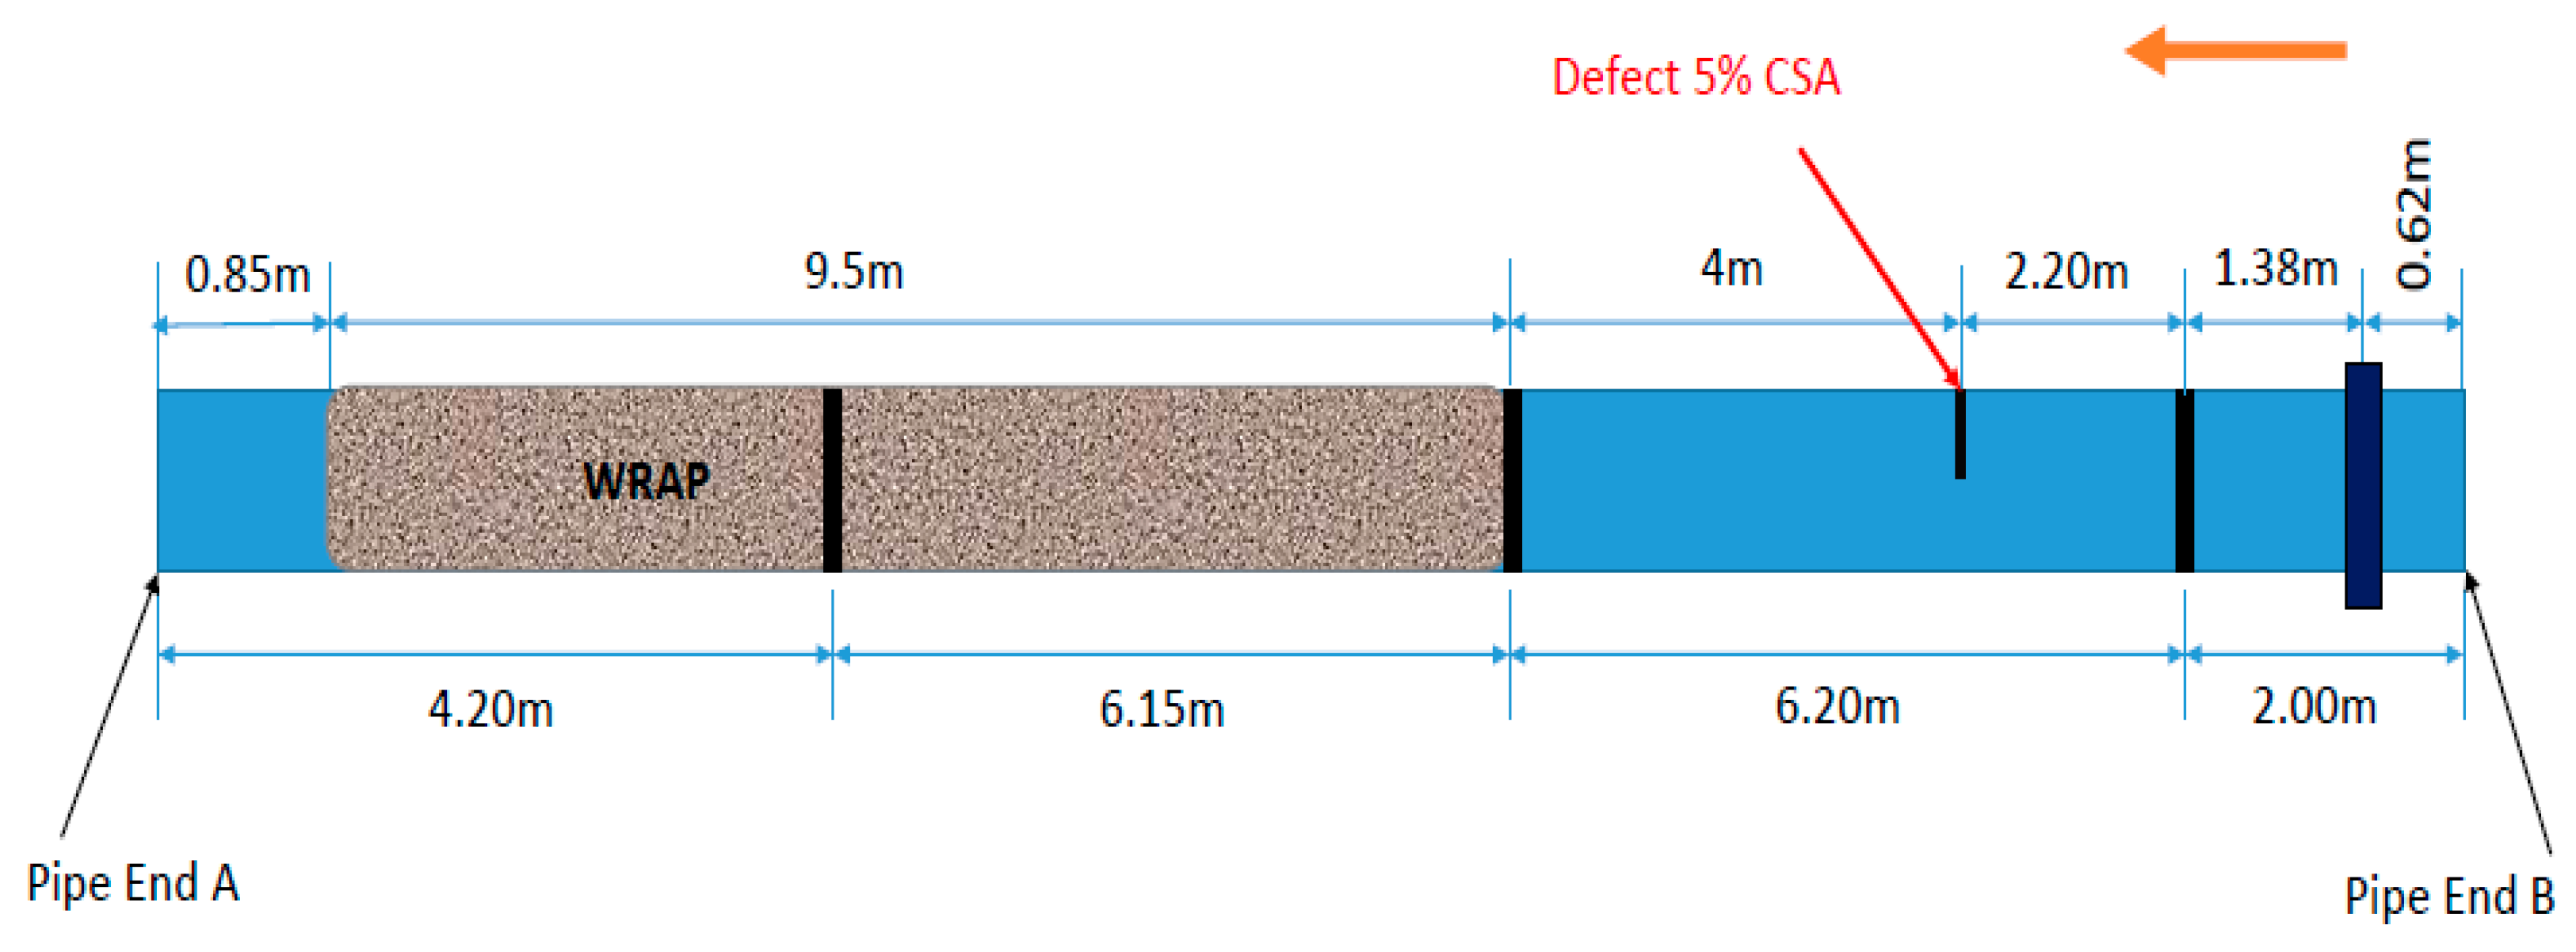
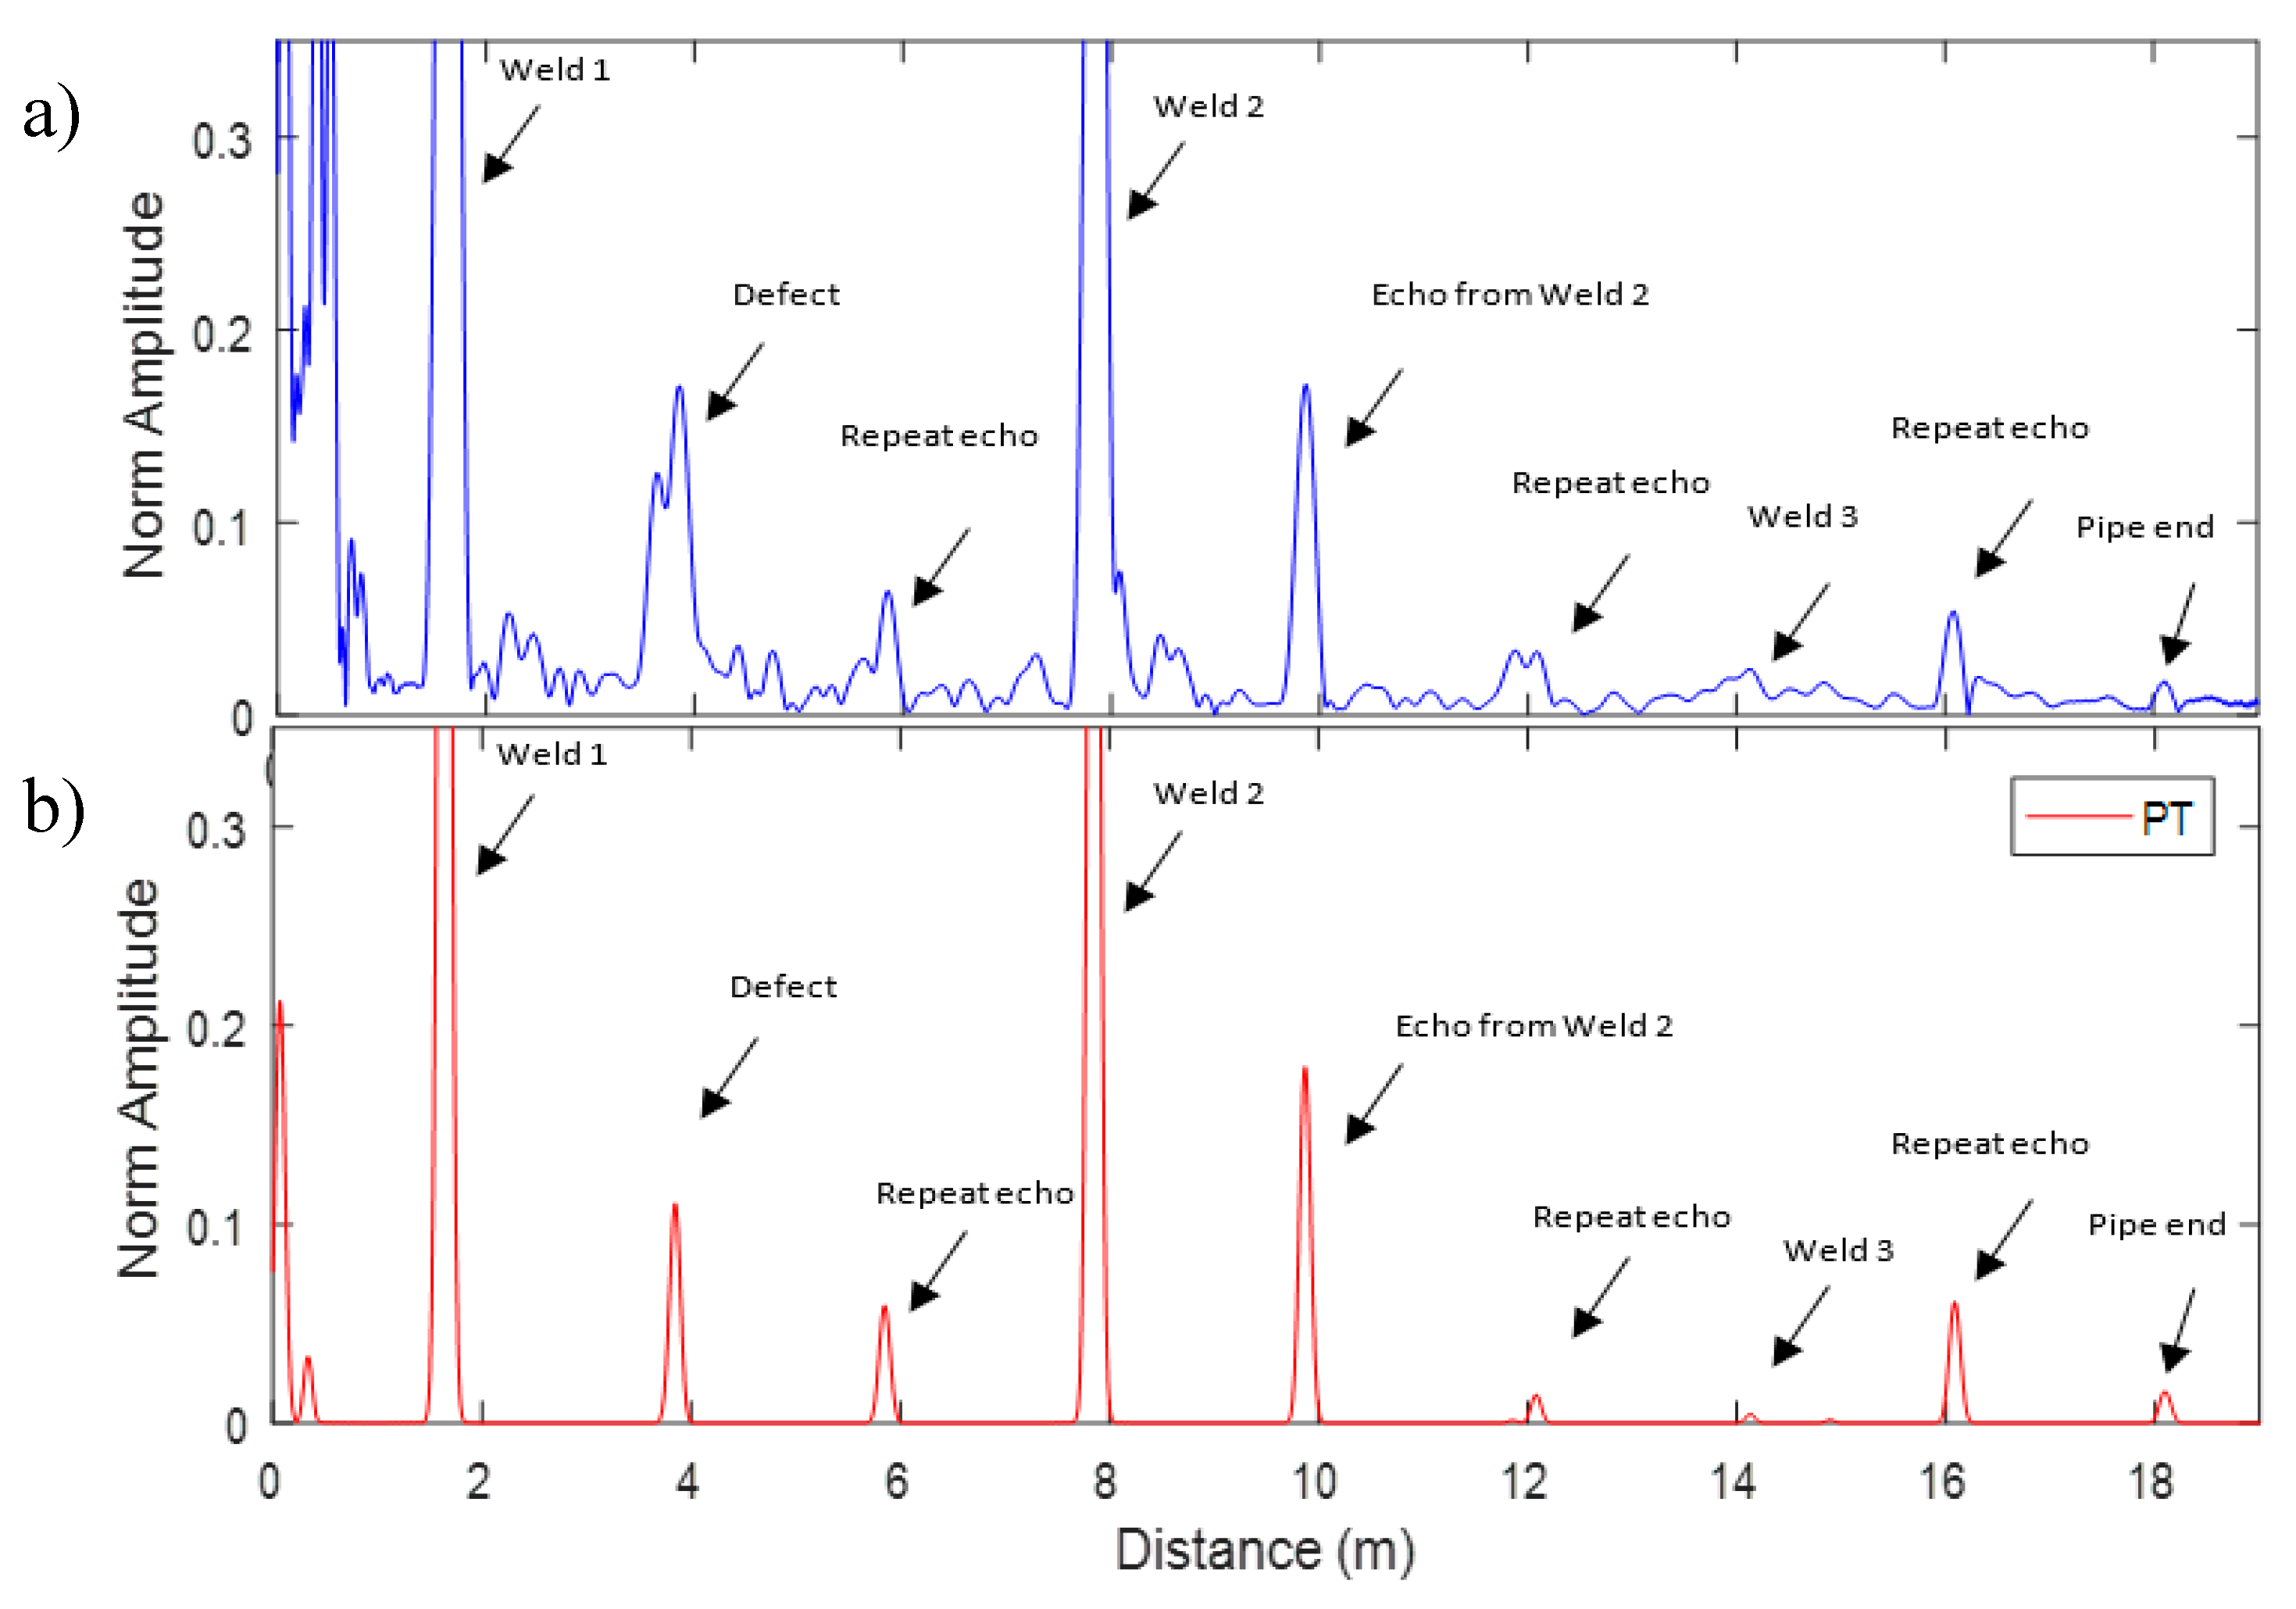
To assess the proposed method, two experiments were performed in the lab on eight-inch pipes with the same size and geometry. Each pipe was partially coated with the Denso Tape and had a different size of saw cut defect. The Teletest technology was employed for excitation and receiving the signal. The excitation signal was the Torsional wave mode, T(0,1), a 10-cycle modulated Hann-windowed signal with a couple of different center frequencies around 30 to 35 kHz. These frequencies were selected due to their superior performance before applying the post-processing technique.
A brute force search algorithm was employed to identify the appropriate values for SSP. The results show that the proposed approach with the optimum parameters was successful in enhancing the signal quality. The SSP result was compared experimentally with the traditional approach currently utilized in the Teletest device for UGW inspection and it was established that the proposed SSP technique increased the SNR by approximately 40 dB without distorting the signal. Guided wave technology is still marked as a new technology and any enhancement in terms of signal quality, extending the inspection range, and increasing the sensitivity to small defects will pave the way for the further validation of this technology in the oil and gas industry.
Moreover, it was demonstrated that the proposed method was successful in identifying an 8% CSA saw cut defect that was hidden below the noise level on Pipe A and identifying a 5% CSA saw cut defect on Pipe B that was partially wrapped with the Denso Tape. Moreover, it was successful in enhancing the signal quality and increasing the SNR of both pipes, which can lead to detecting smaller defects and can increase the inspection range. Furthermore, it was particularly successful in removing the background noise (coherent noise) throughout the trace lengths for both pipes, whereas the conventional technique was ineffective.


