Framework and Methodology for Establishing Port-City Policies Based on Real-Time Composite Indicators and IoT: A Practical Use-Case


Abstract
1. Introduction
- (1)
- To explore how to translate the knowledge of the field of composite indicators to the port-city interface.
- (2)
- To define how to build solid indicators with that purpose, focusing on their calculation and prediction to represent real-world phenomena in the context of a Smart Port-City
- (3)
- To analyse the various technological options to construct an architecture leveraging IoT techniques covering the indicator implementation.
- (4)
- To propose an IoT-based software framework accompanied with a methodology for its co-design and deployment on a real use-case.
- (5)
- To effectively conduct a small scale experiment consisting of implementing a composite indicator use-case reflecting the traffic congestion in the interface between the port and the city of Thessaloniki (Greece).
2. Related Work
2.1. Open Data in Smart Ports and Smart Cities
2.2. Interoperability at Middleware Level of Heterogeneous Data in a City
2.3. Top-Layer Services for Smart Port-Cities Based on IoT
2.4. Real-Time Composite Indicators in Smart Port-Cities
2.5. Machine Learning for Traffic Congestion Forecasting
3. Materials and Methods
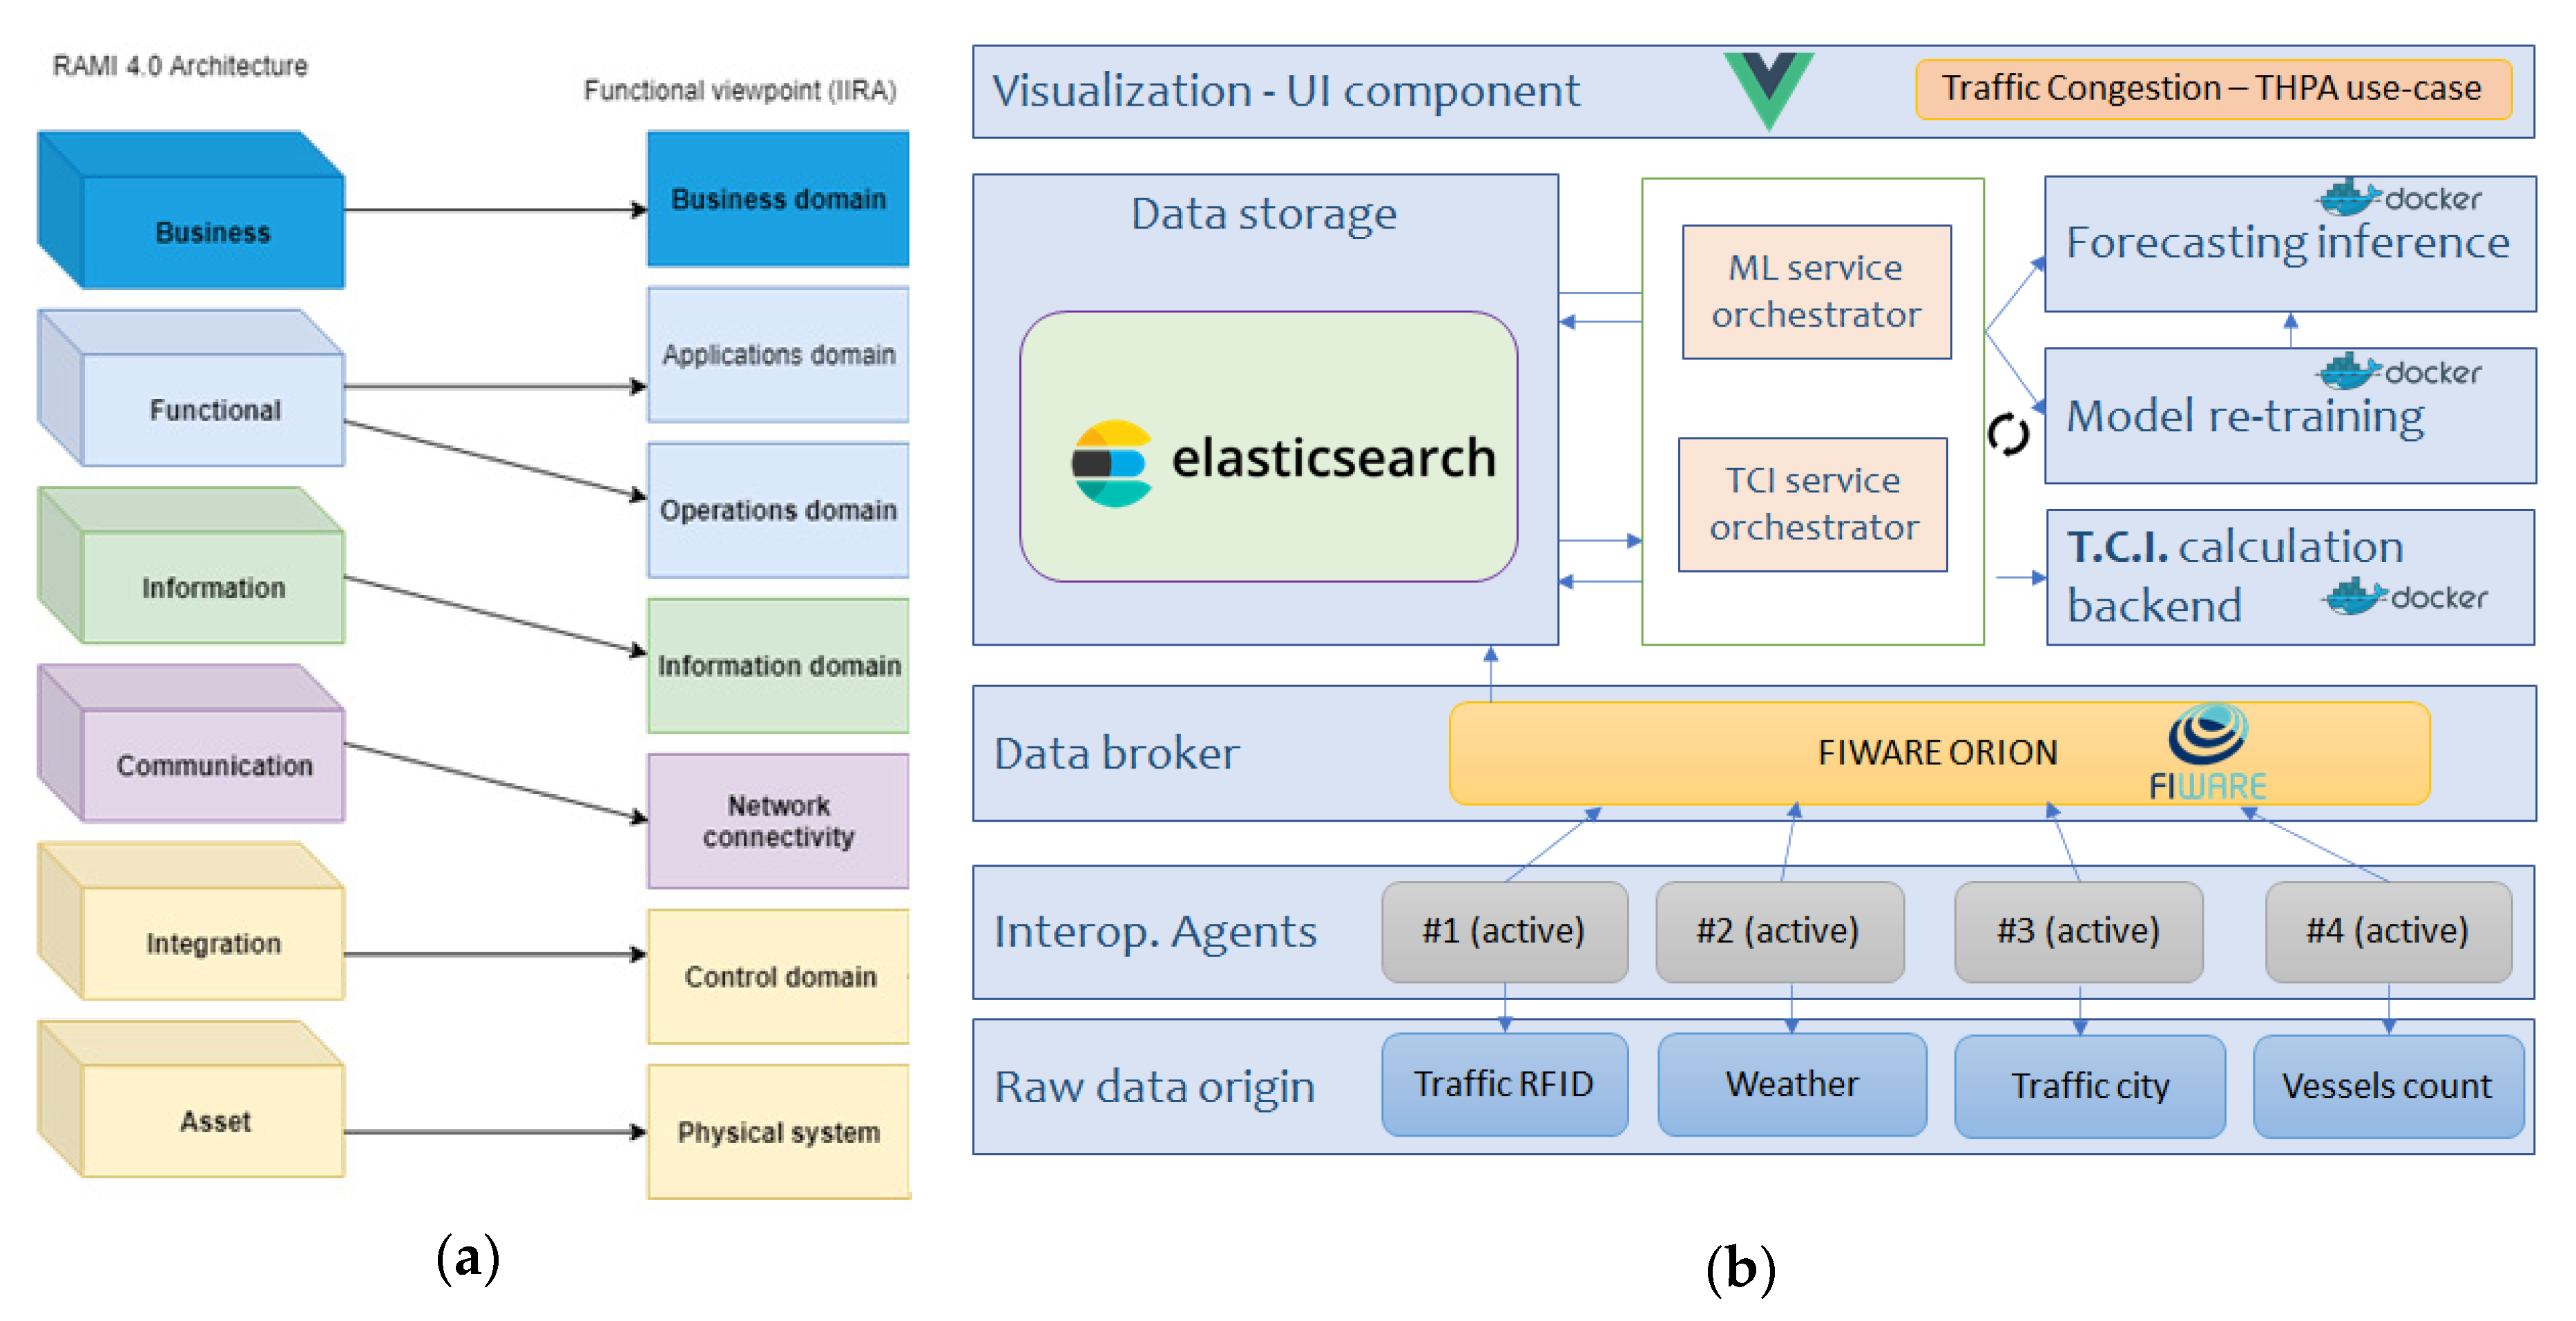
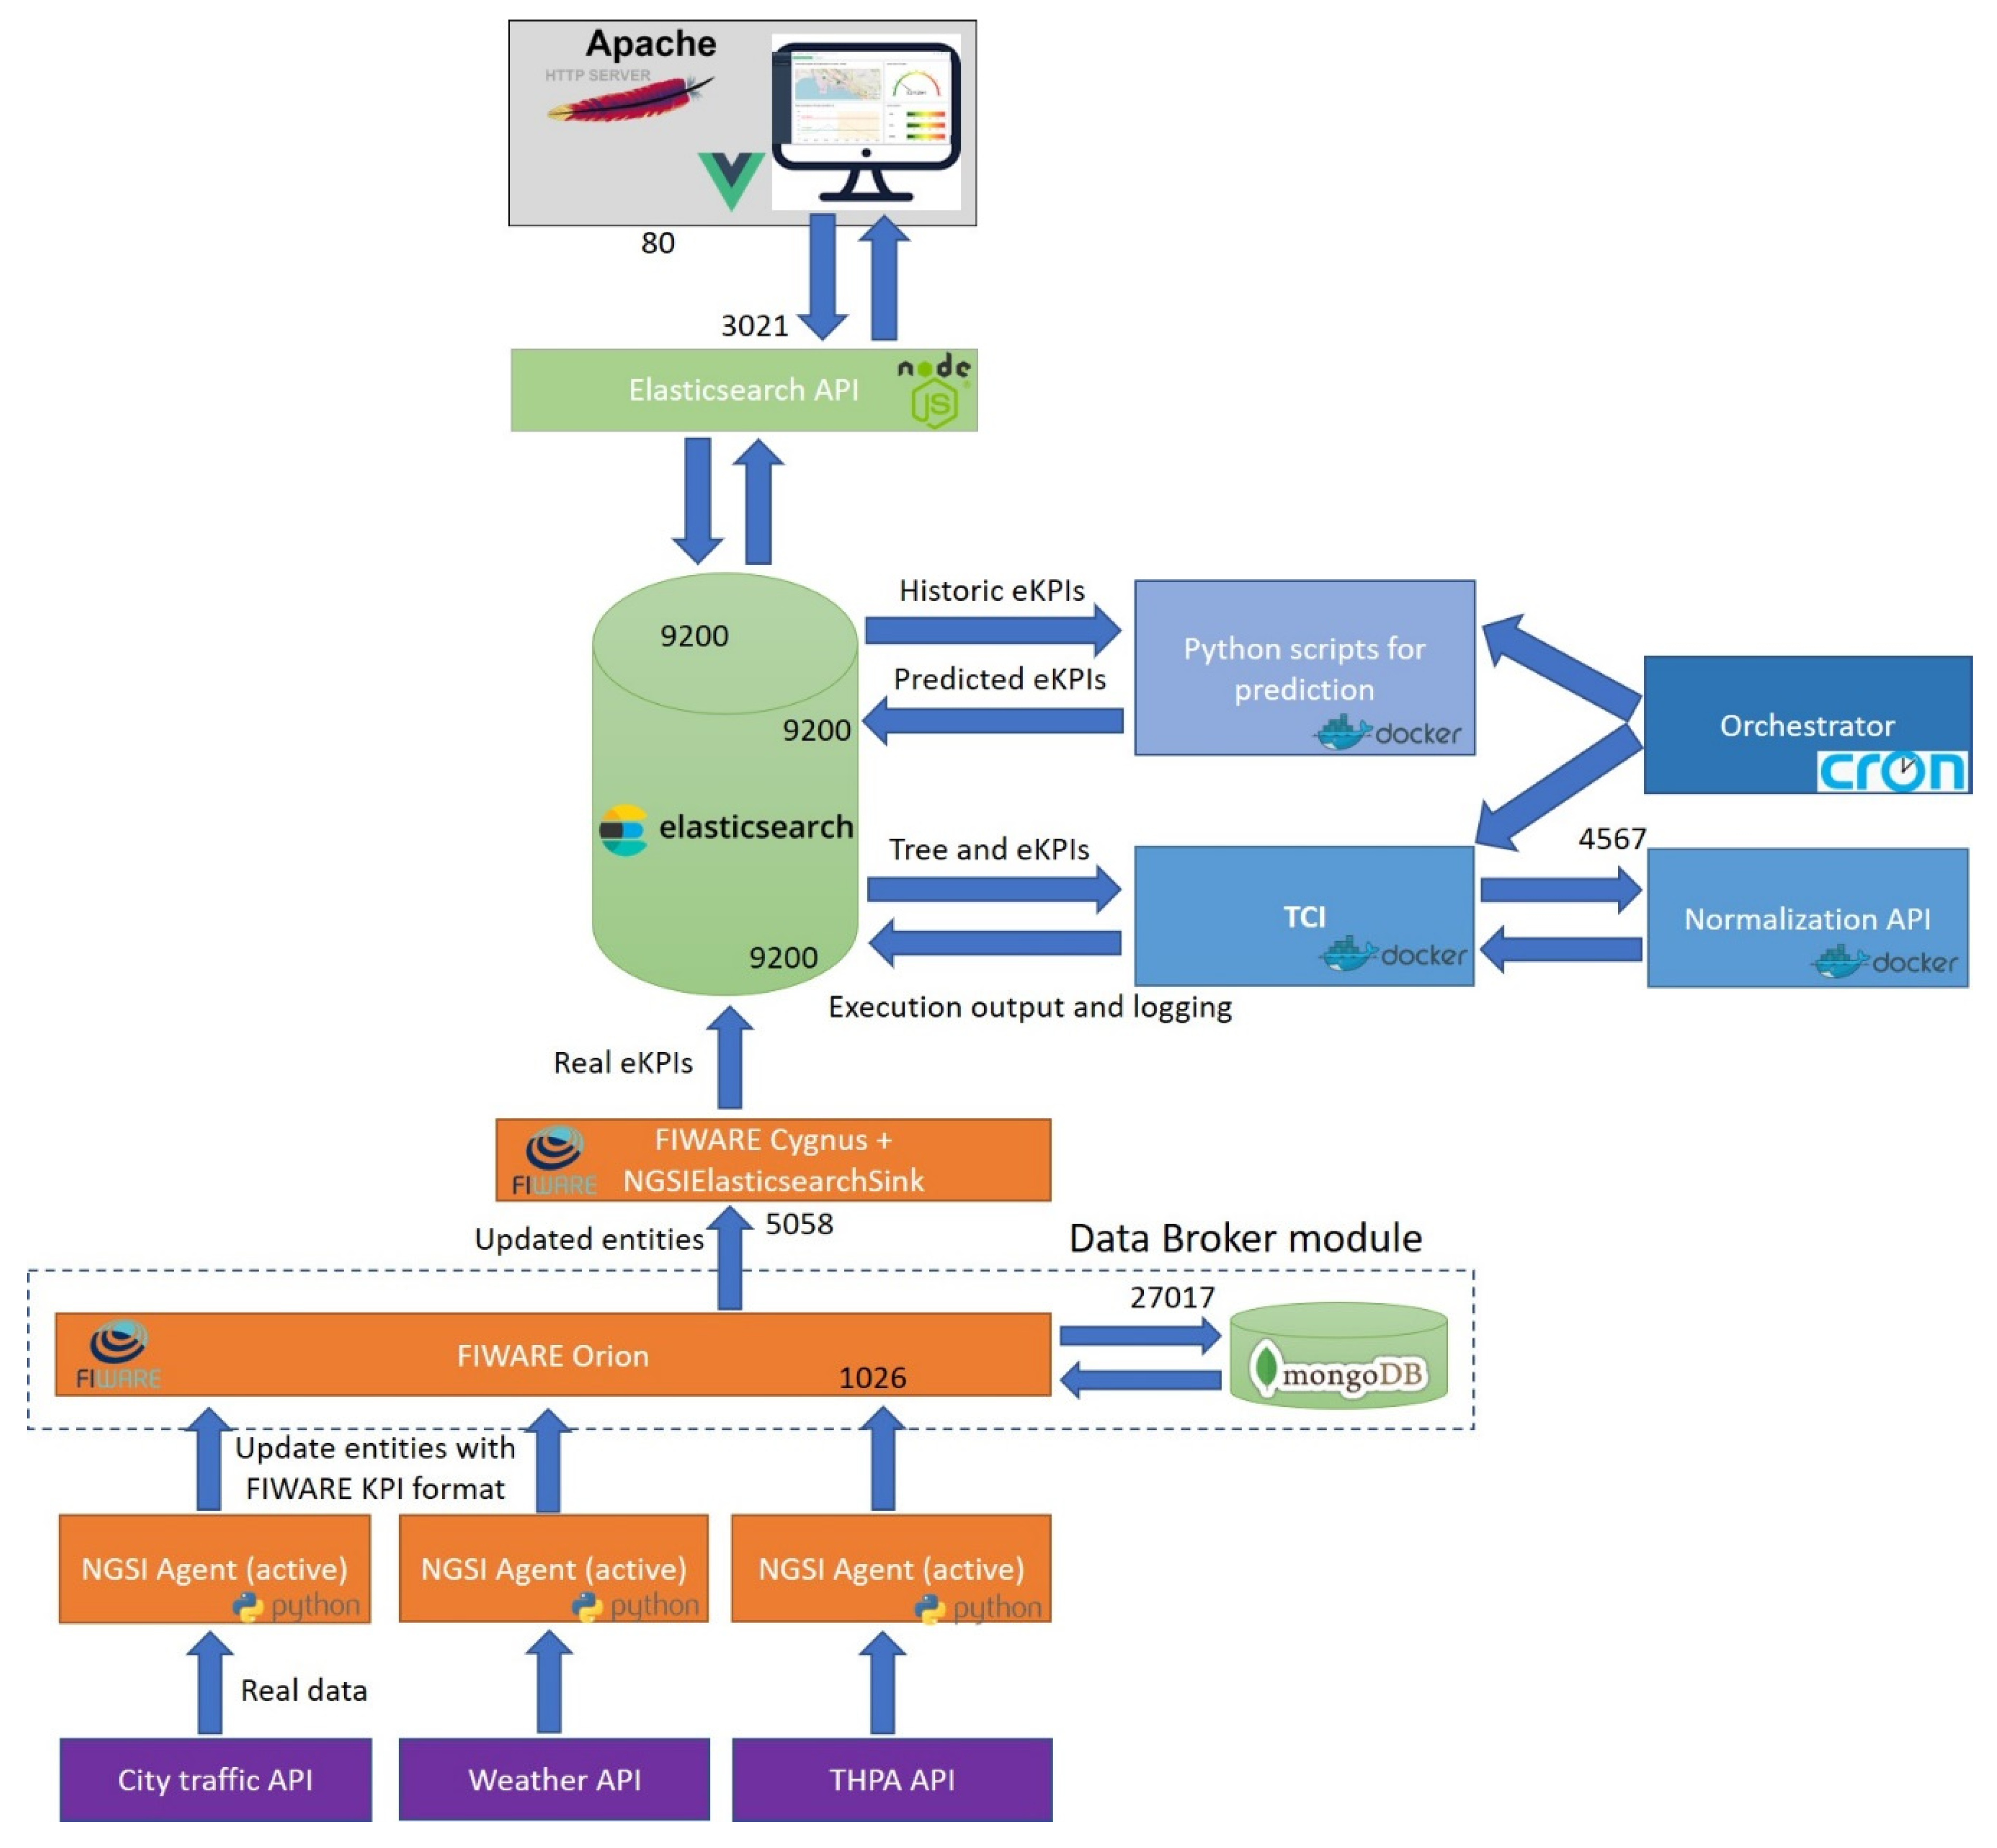
3.1. Framework
3.1.1. Data Broker Module
3.1.2. Data Storage Module
3.1.3. Orchestration Module
3.1.4. Visualization Module
3.1.5. Dual Computing Approach
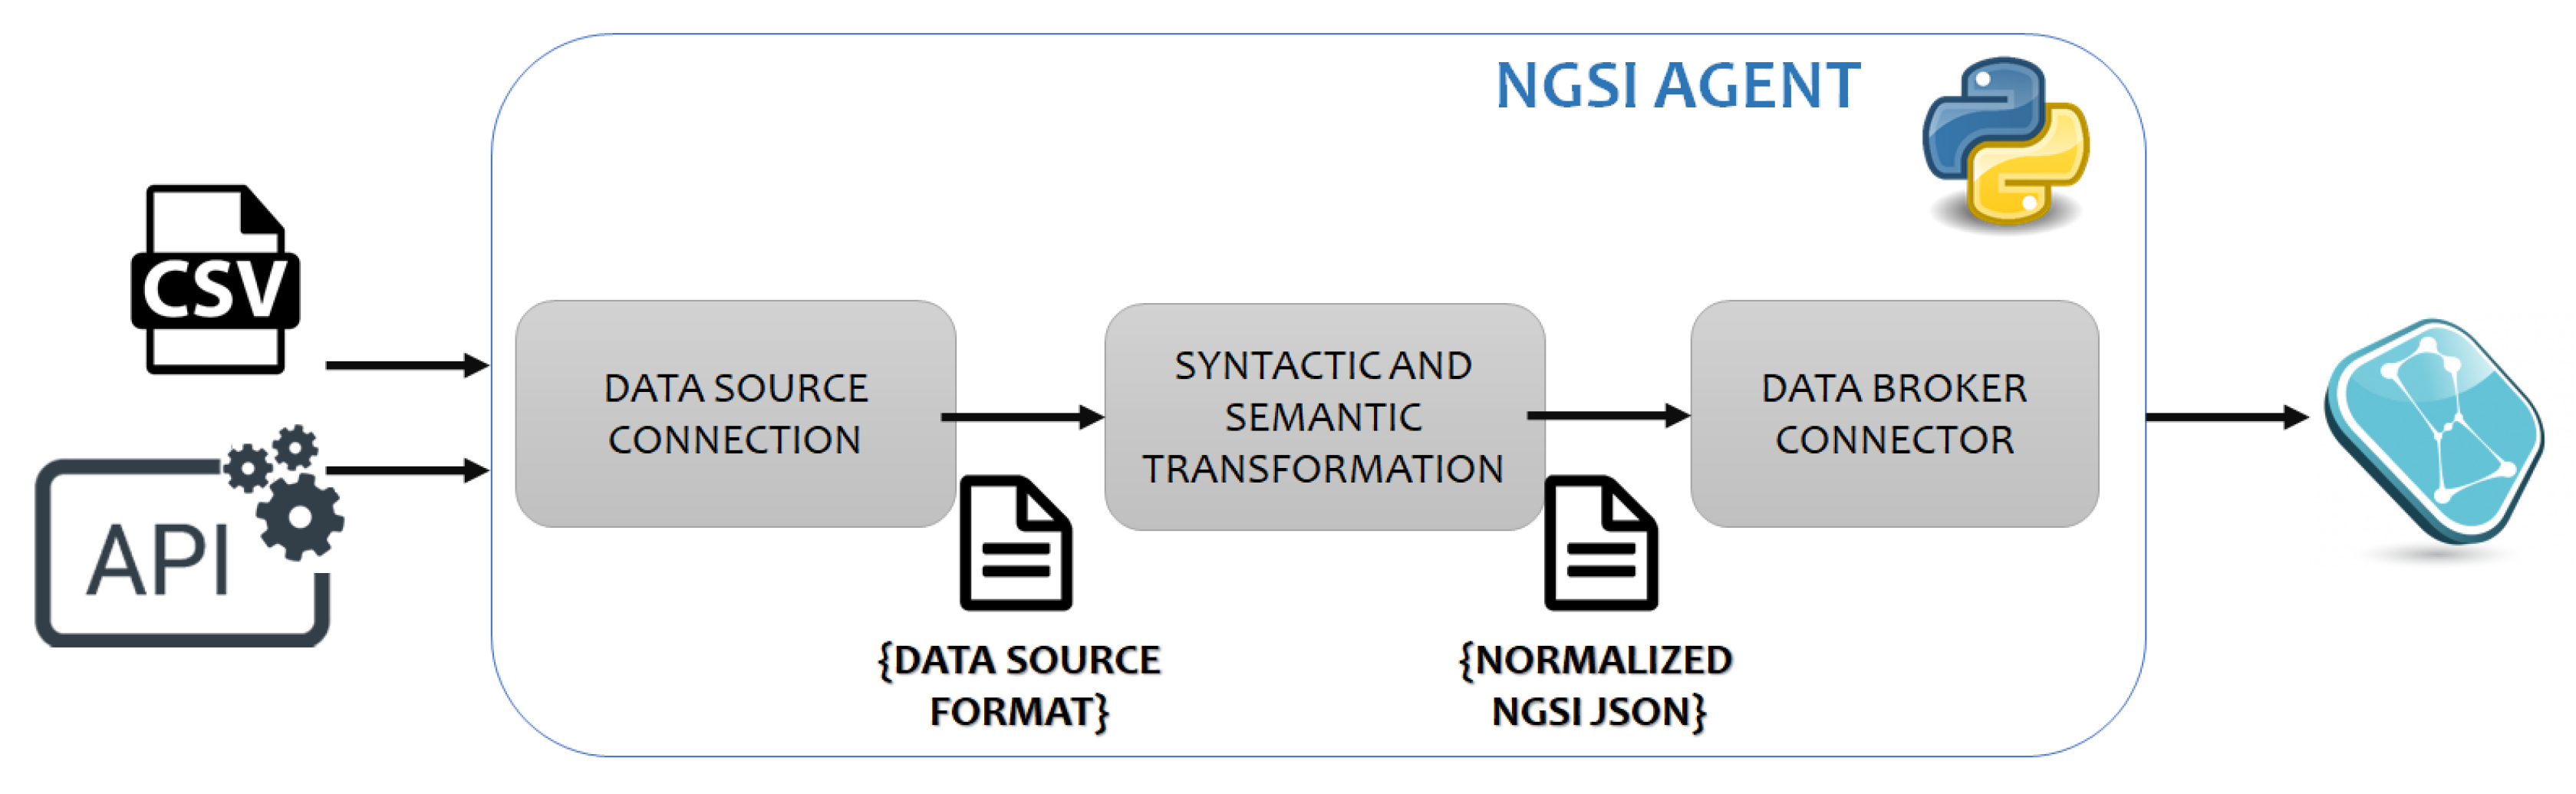
- To retrieve the data from the original source: the framework has been designed to accept a two-fold connection mode: (a) the agent actively queries the data source origin following a periodic pattern. This option will apply whenever the data is behind a reachable API; or (b) the agent includes an embedded data broker so that the active origin can publish on it. This case is usually present in the cases where built-in IoT stations or smart sensors are used.
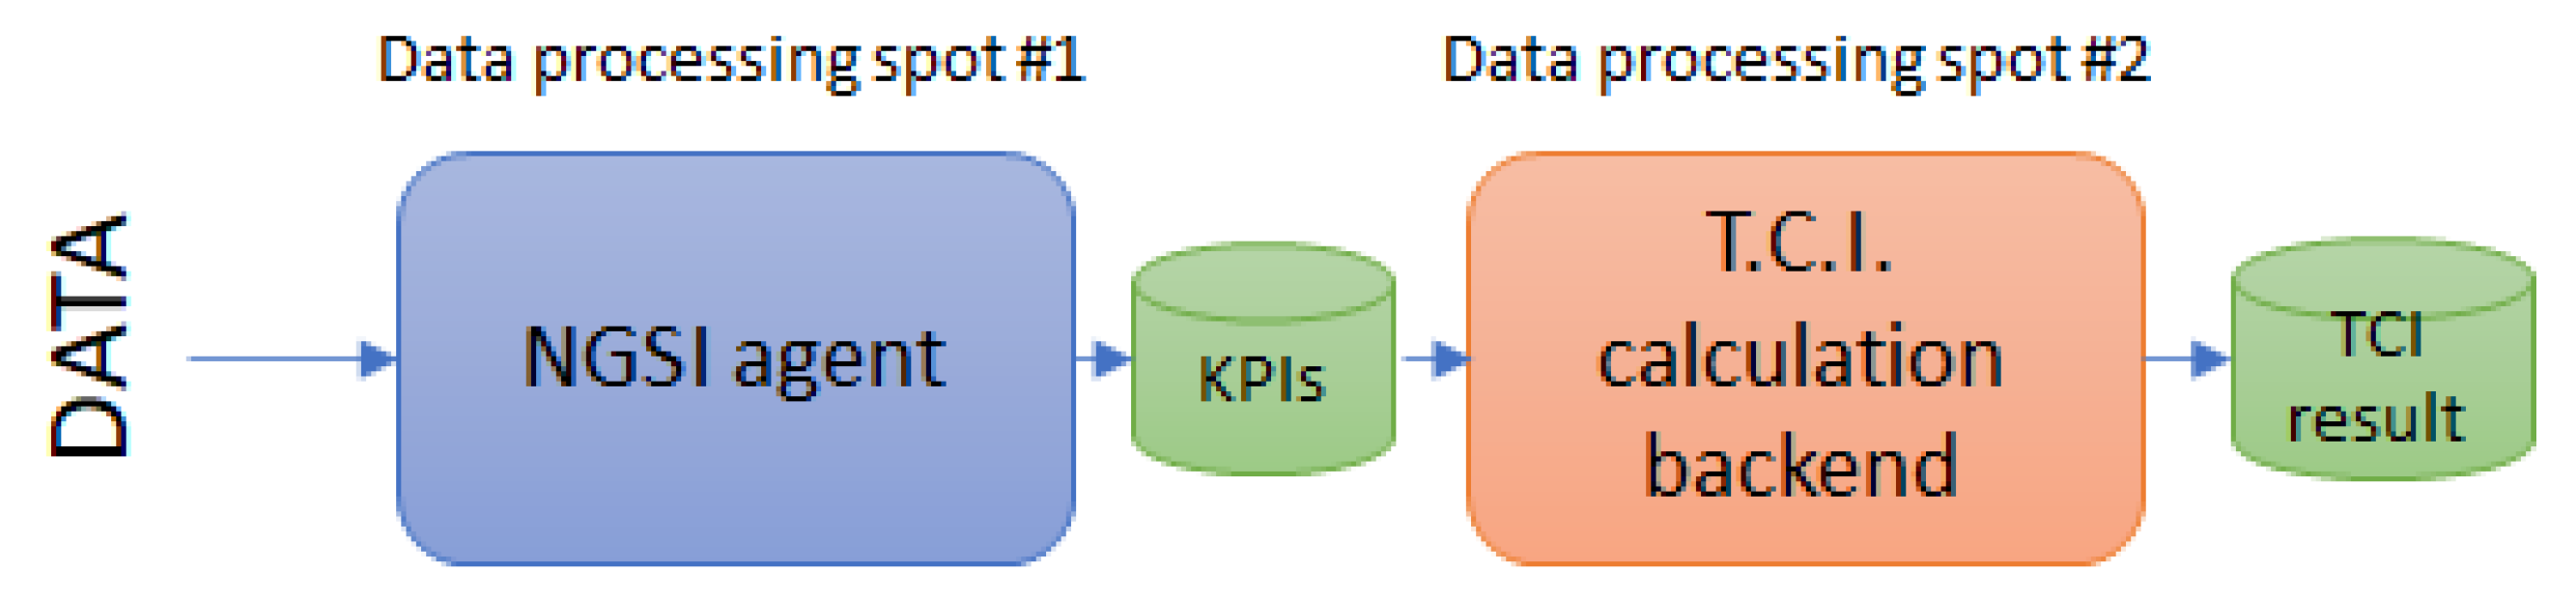
- To process the data and convert it to KPIs: this development will be different for each data source, becoming the most craftsmanship development when a composite indicator tool wishes to be deployed using our framework. It might range from a simple format conversion to a complex data relation, combination, and construction. Additionally, each NGSI agent may have different number of inputs and outputs. Despite the fact that the usual case (see Section 3.4.1) is to realise a 1:1 relation, the framework has been prepared to accept 1:N, N:1 and N:N setups as well.
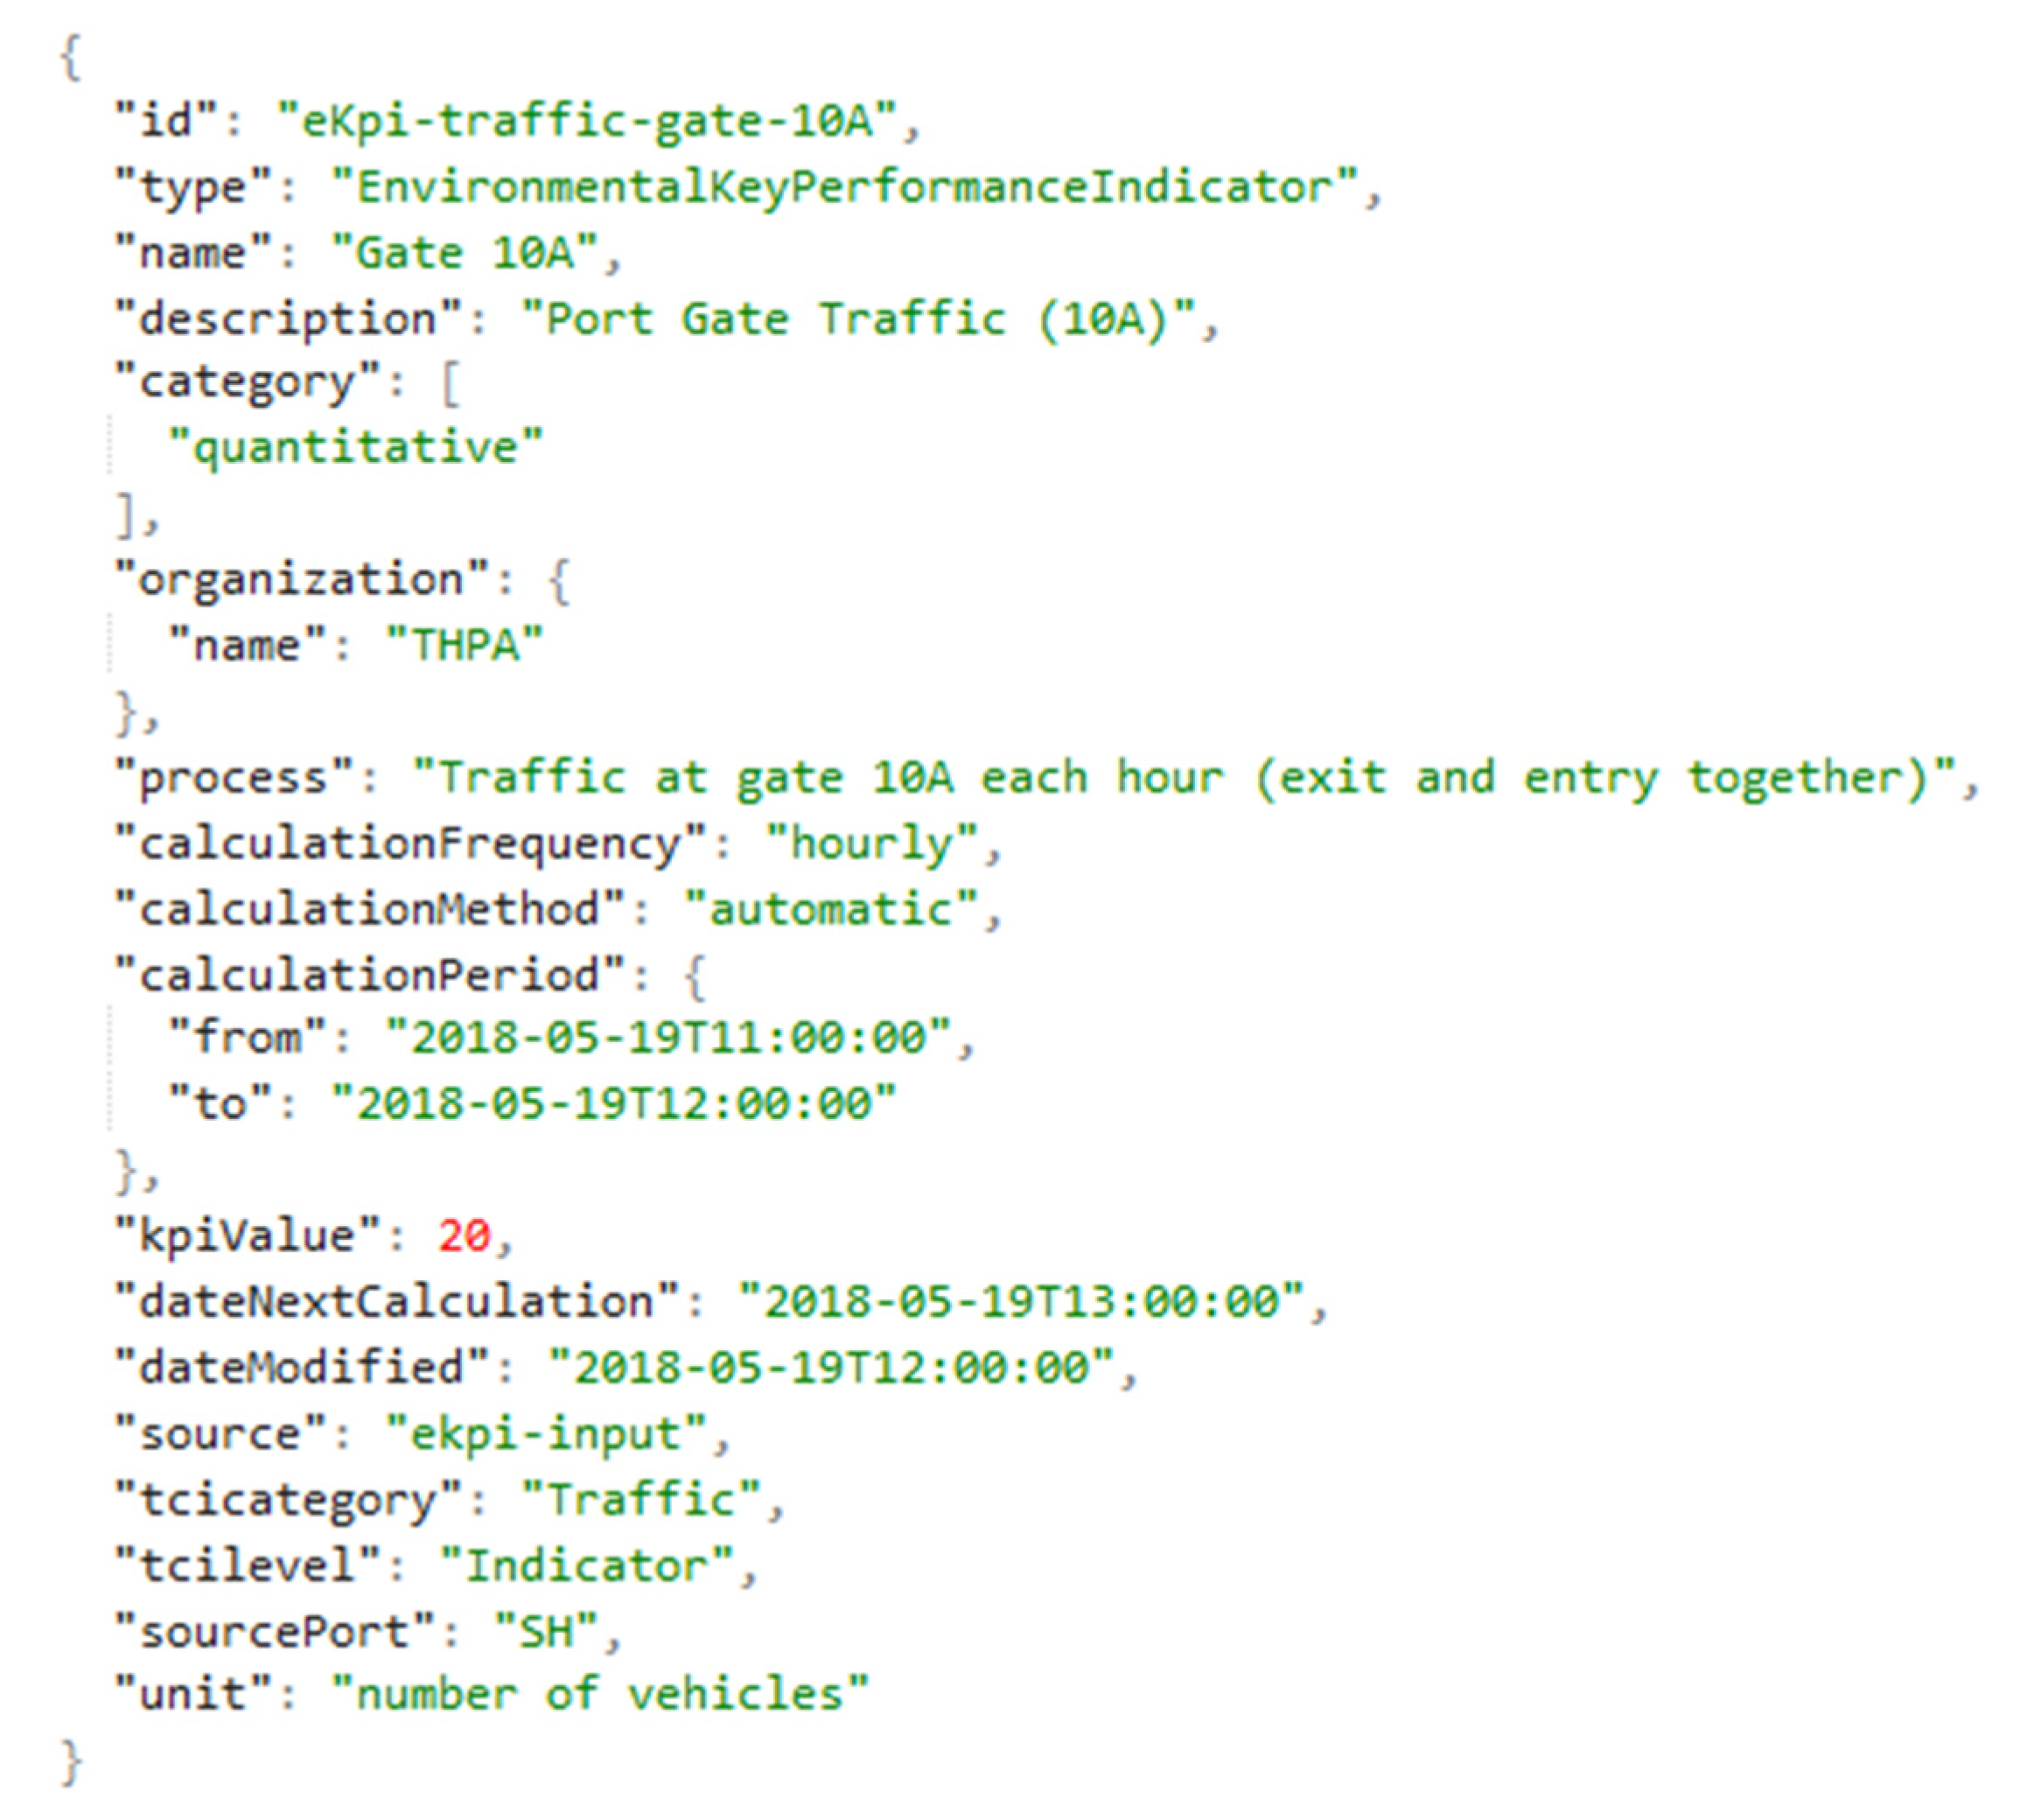
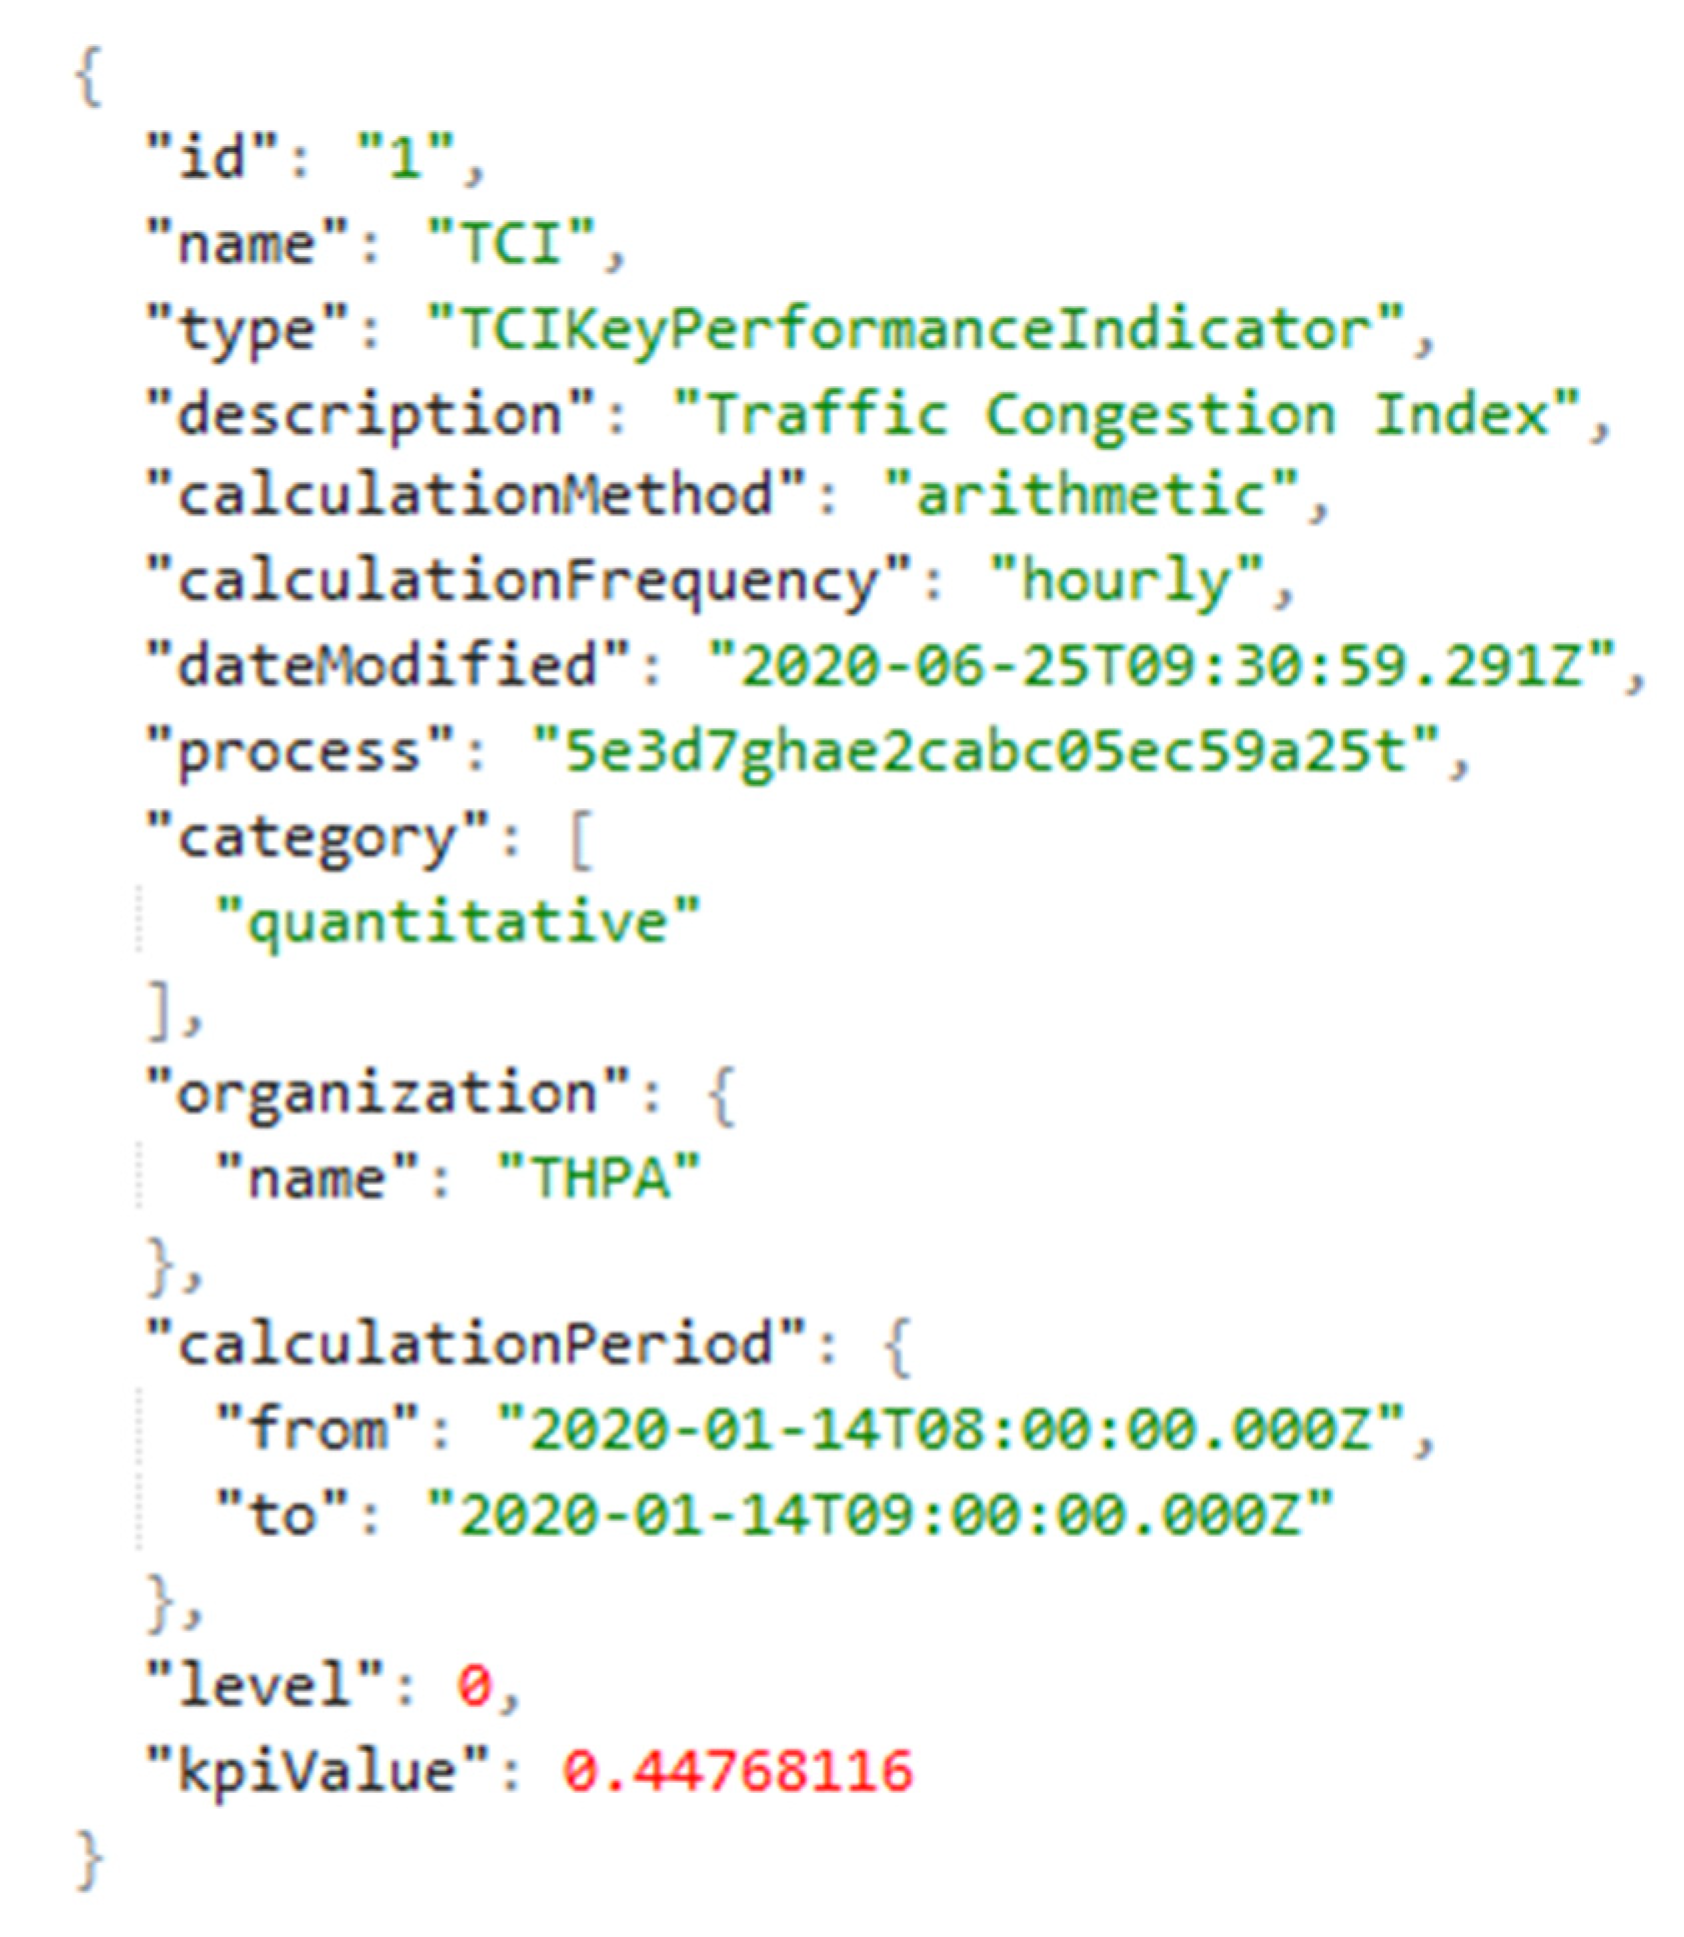
- To update the entity in the Data Broker: The main goal of the agent is to make data reach the information layer of the IoT stack of our framework. Hence, the KPIs obtained are submitted to the Data Broker (ORION) via a PUT HTTP—Hyper Text Transfer Protocol—message in order to update the “KPI entity”. The format selected has been to extend one of the FIWARE Data Models: KeyPerformanceIndicator [100]. More details can be found in Appendix A.
- (1)
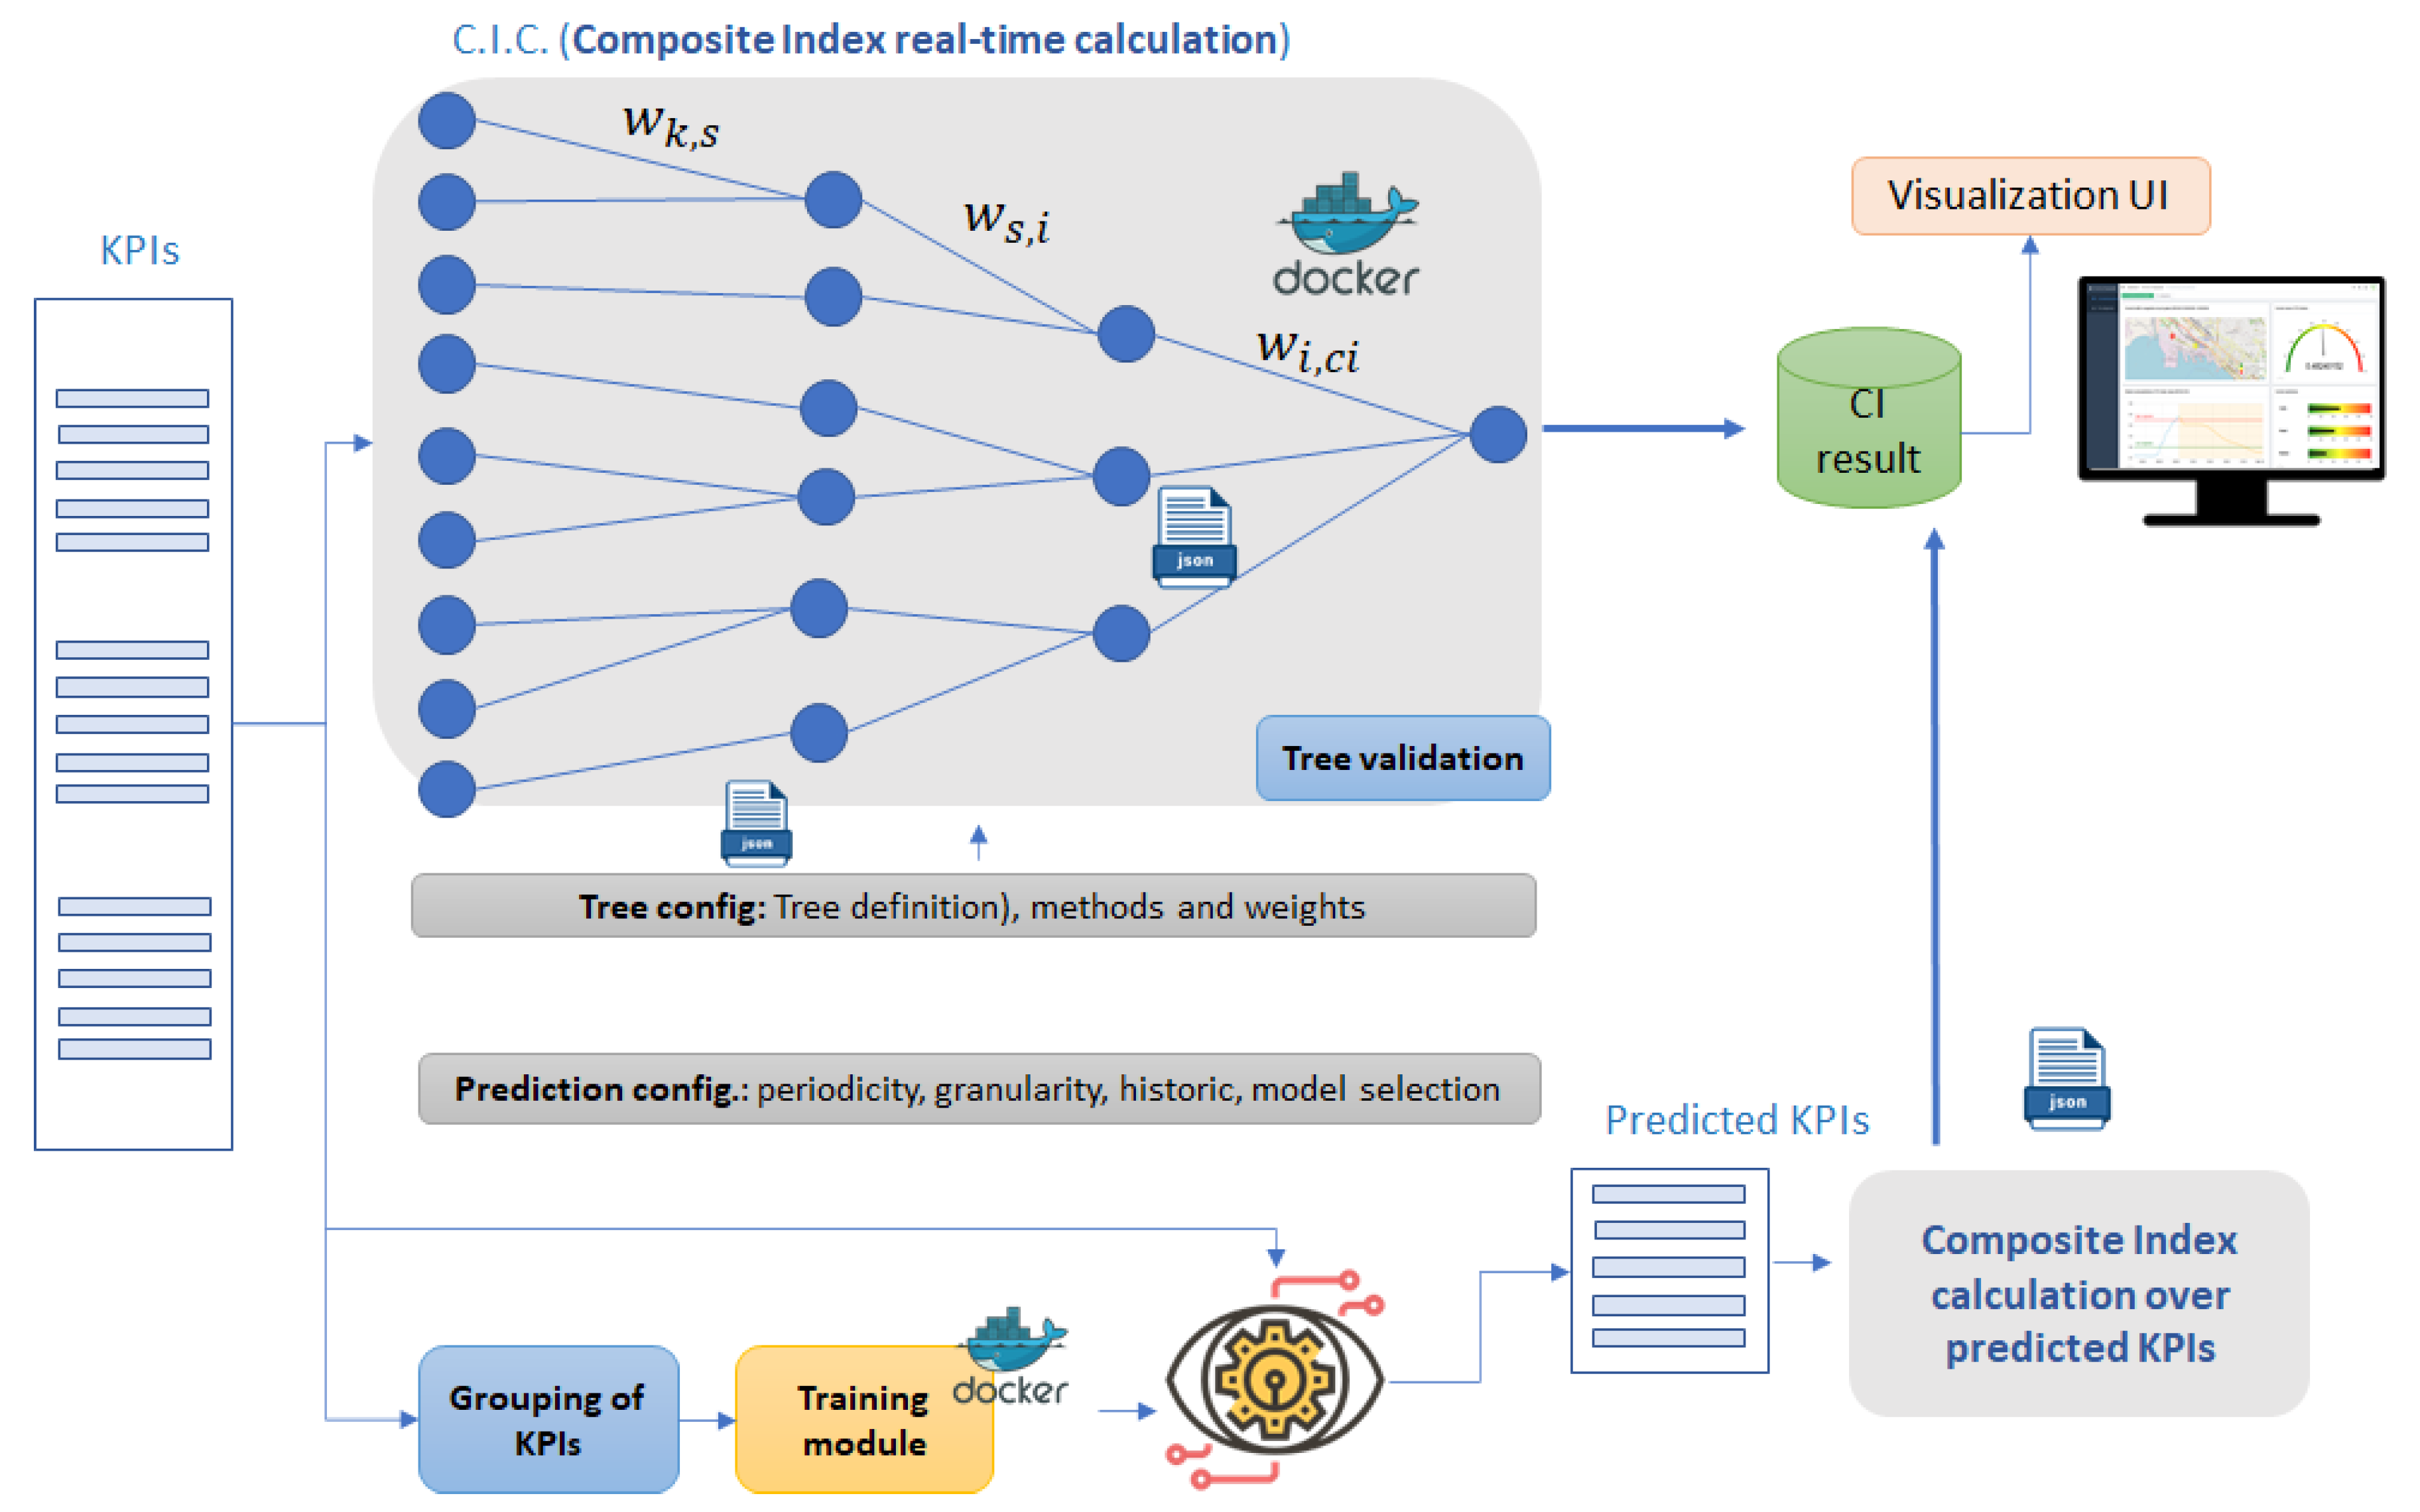
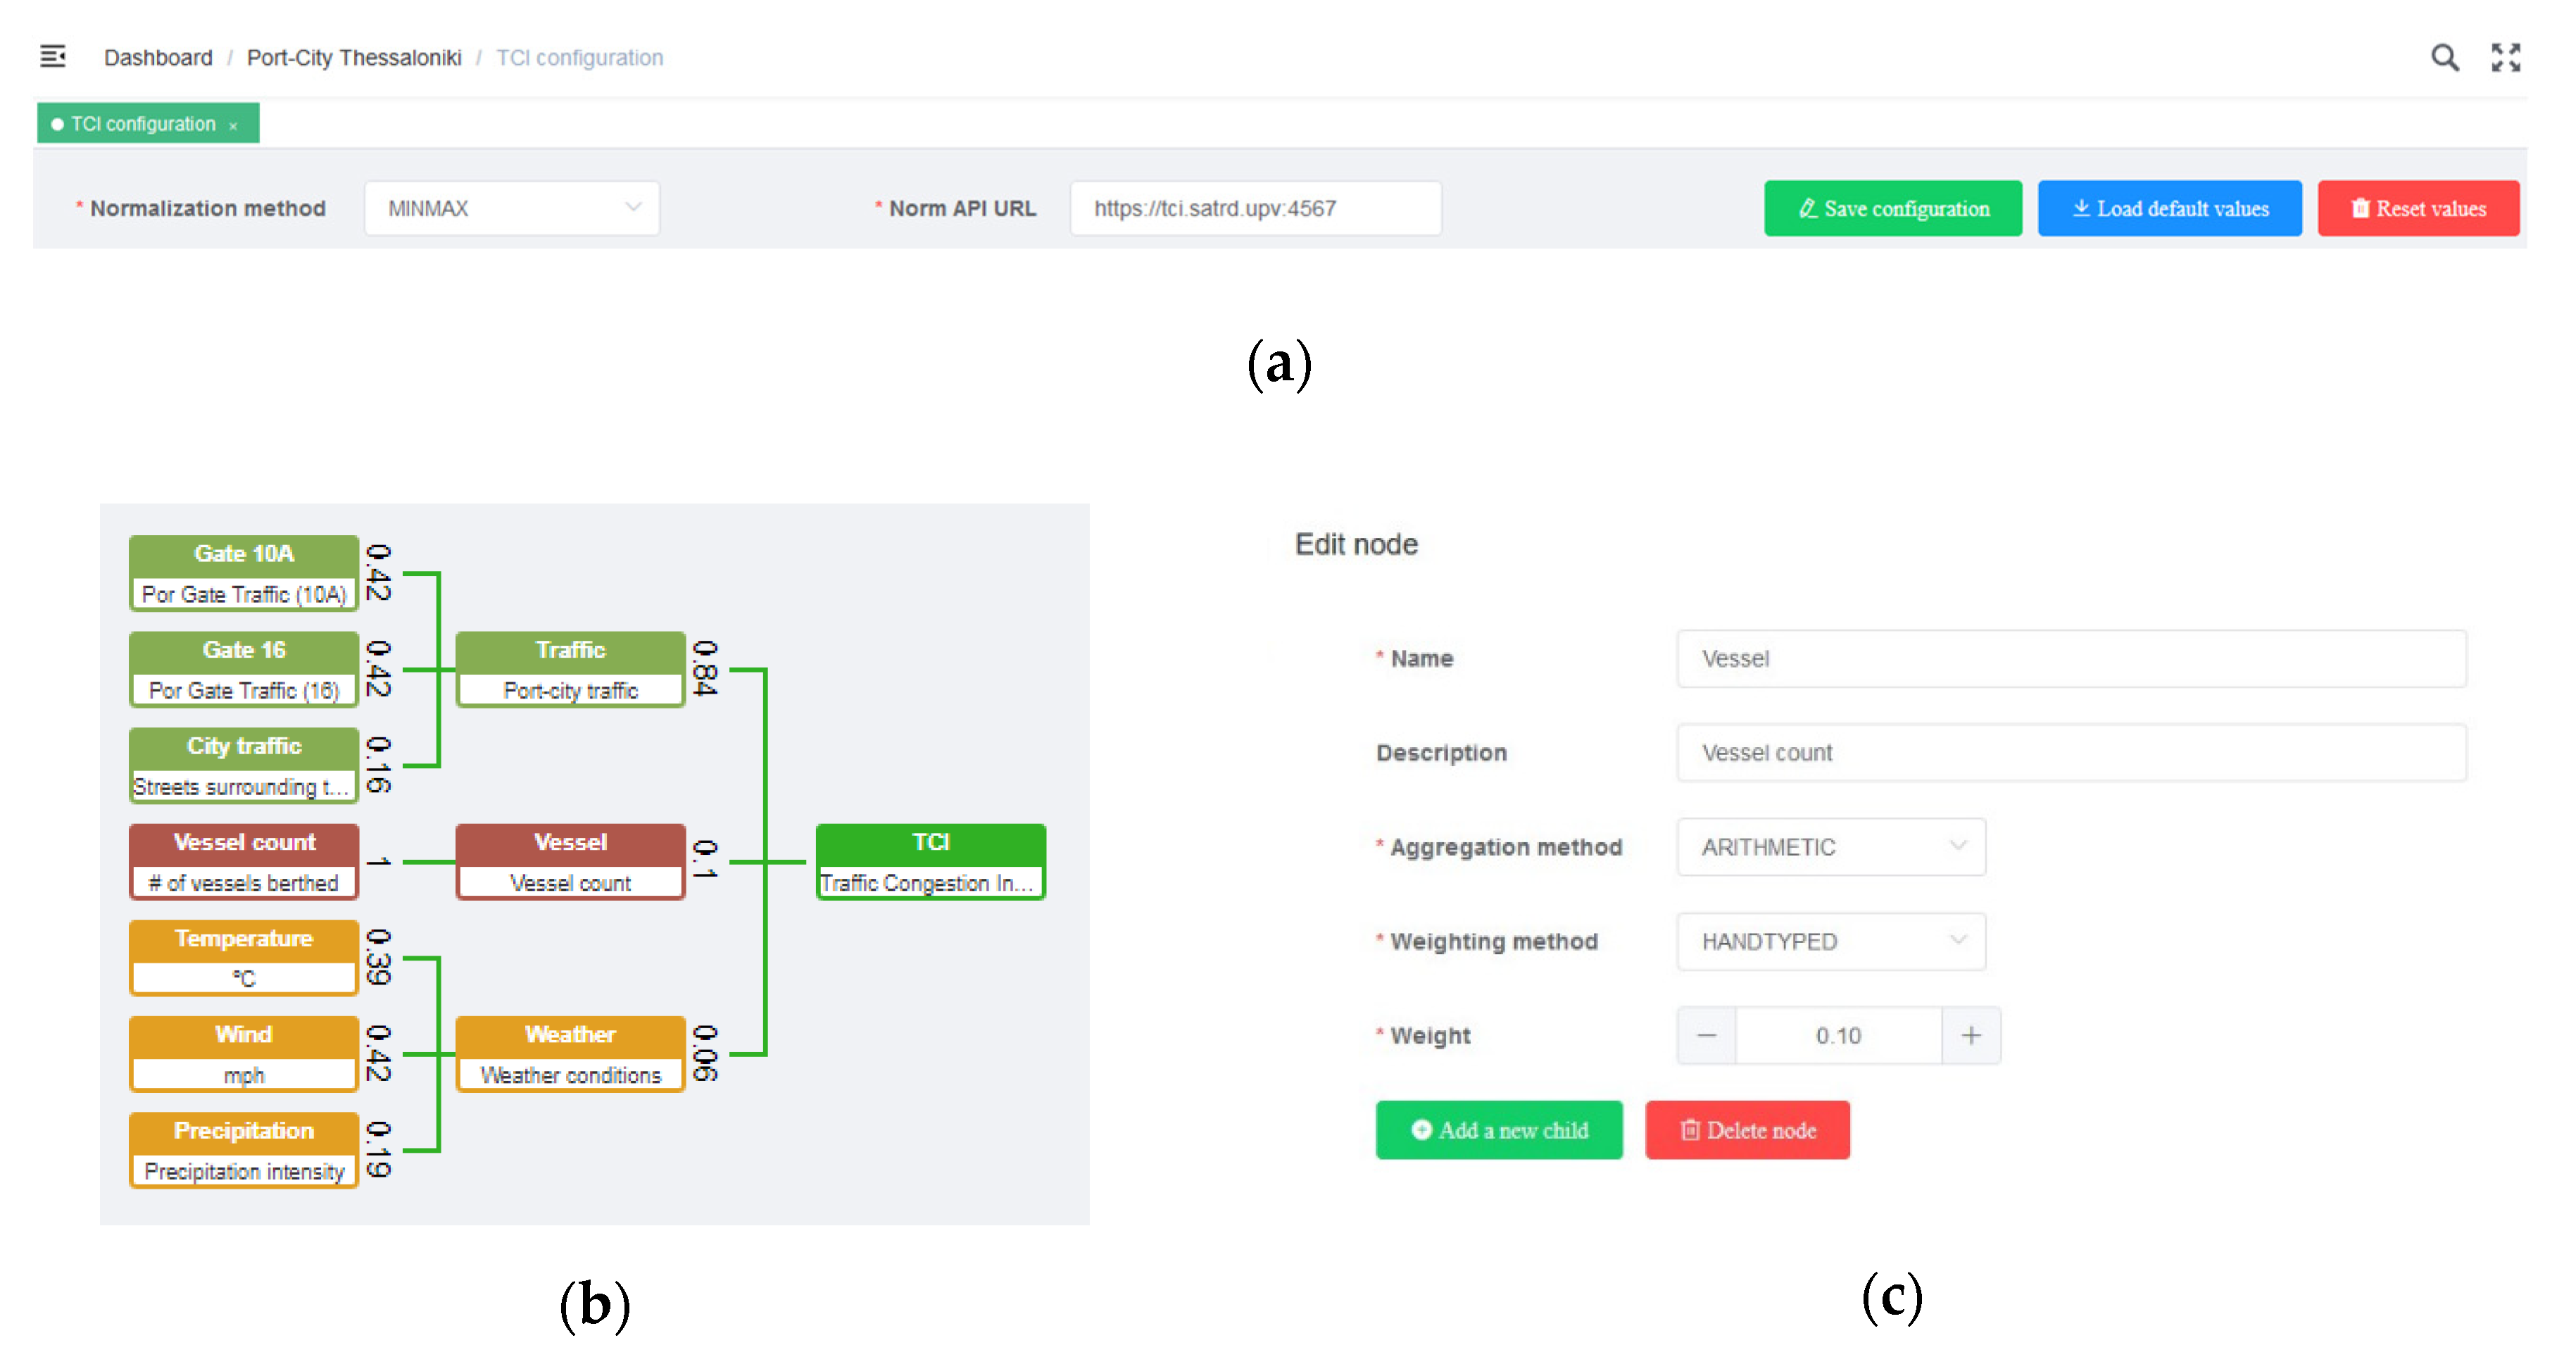
- To configure the CI inputs, the structure of the tree and the associated parameters, such as aggregation methods, normalization methods and weighting values through a developed visual interface. See Section 3.4.4. to discover the utilization of this component.
- (2)
- According to the parameter set in (1), including the scheduling, the periodic calculation of the index. First, the KPI values are properly normalised (crucial step on a CI procedure). Then, starting by the leaf node, a cascading algorithm including aggregation, weighting and combination leads towards a final index value. Technologically, this component has been developed as a dockerised (packaged in a Docker container [101]) standalone Java application.
- (3)
- To configure the predictive component of the framework by the user, specifying batch sizes, periodicities and model to be used for the inference of KPIs.
- (4)
- According to (3), the training module groups the KPIs stored, fits again the pre-trained model selected, updates it, and makes it ready to be used. Technically, this module has been developed as a dockerised Python script.
- (5)
- To apply the prediction over predicted KPIs. This module has also been developed as dockerised Python script.
- (6)
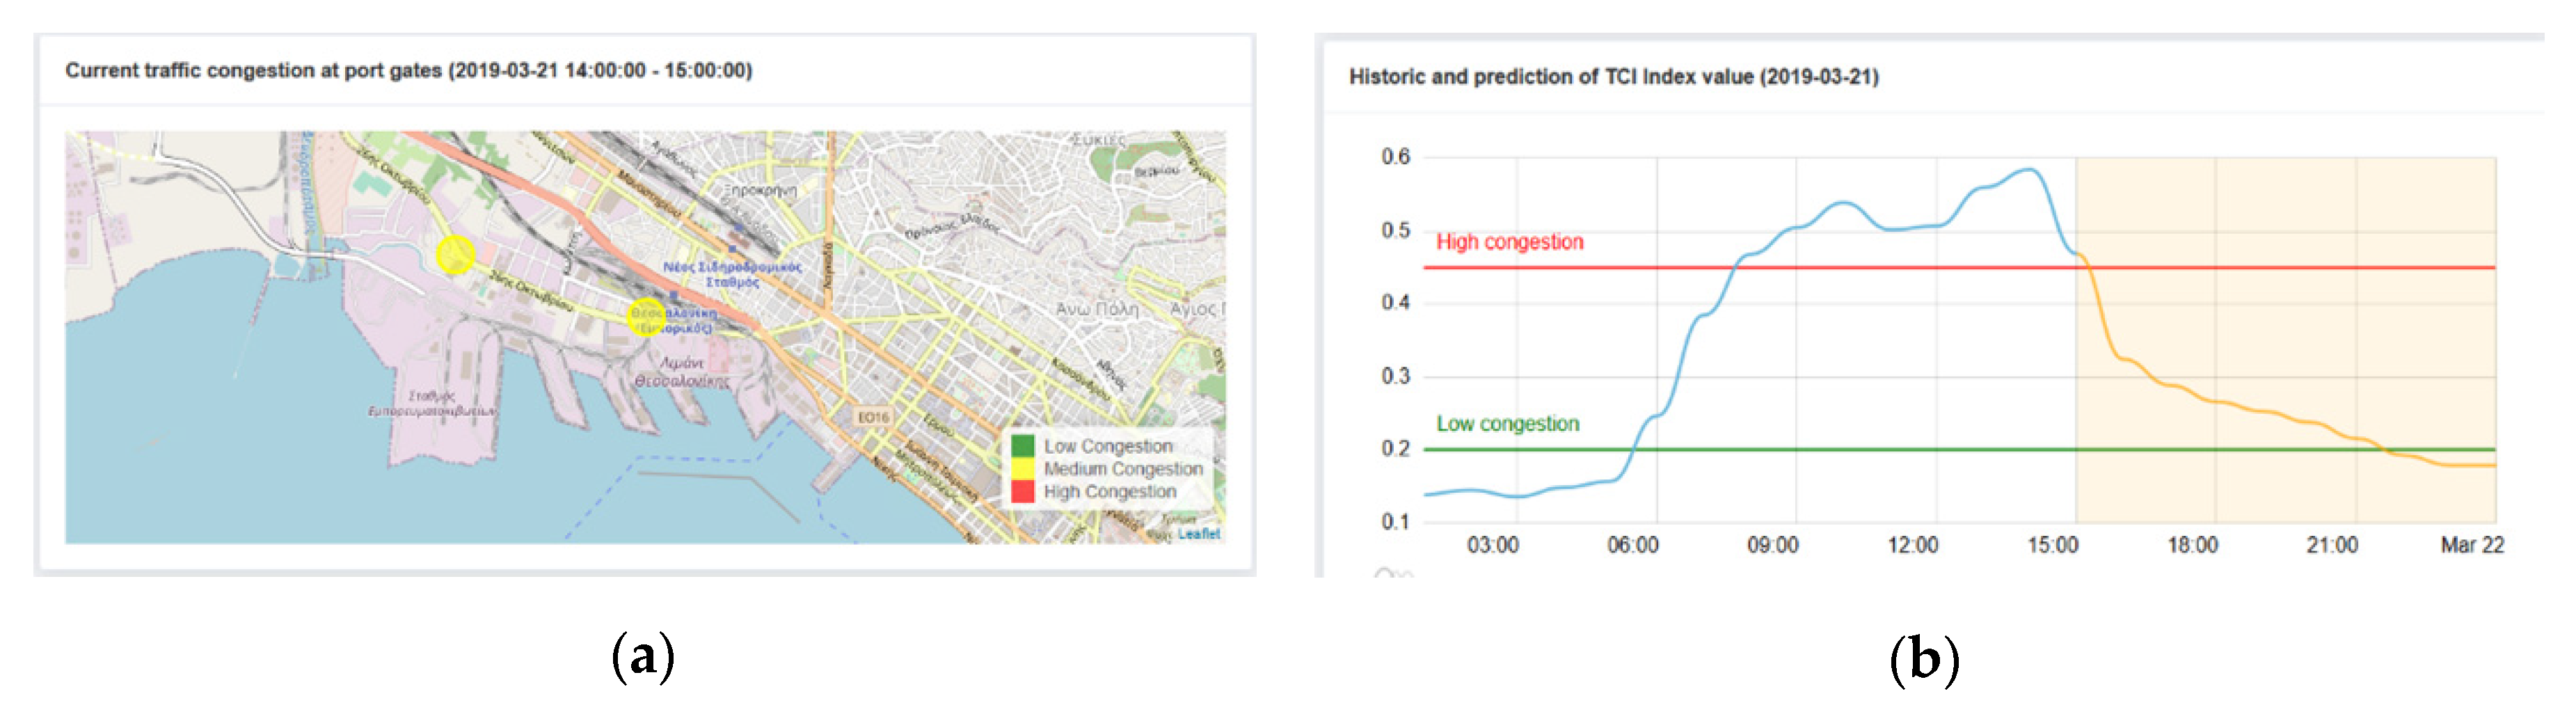
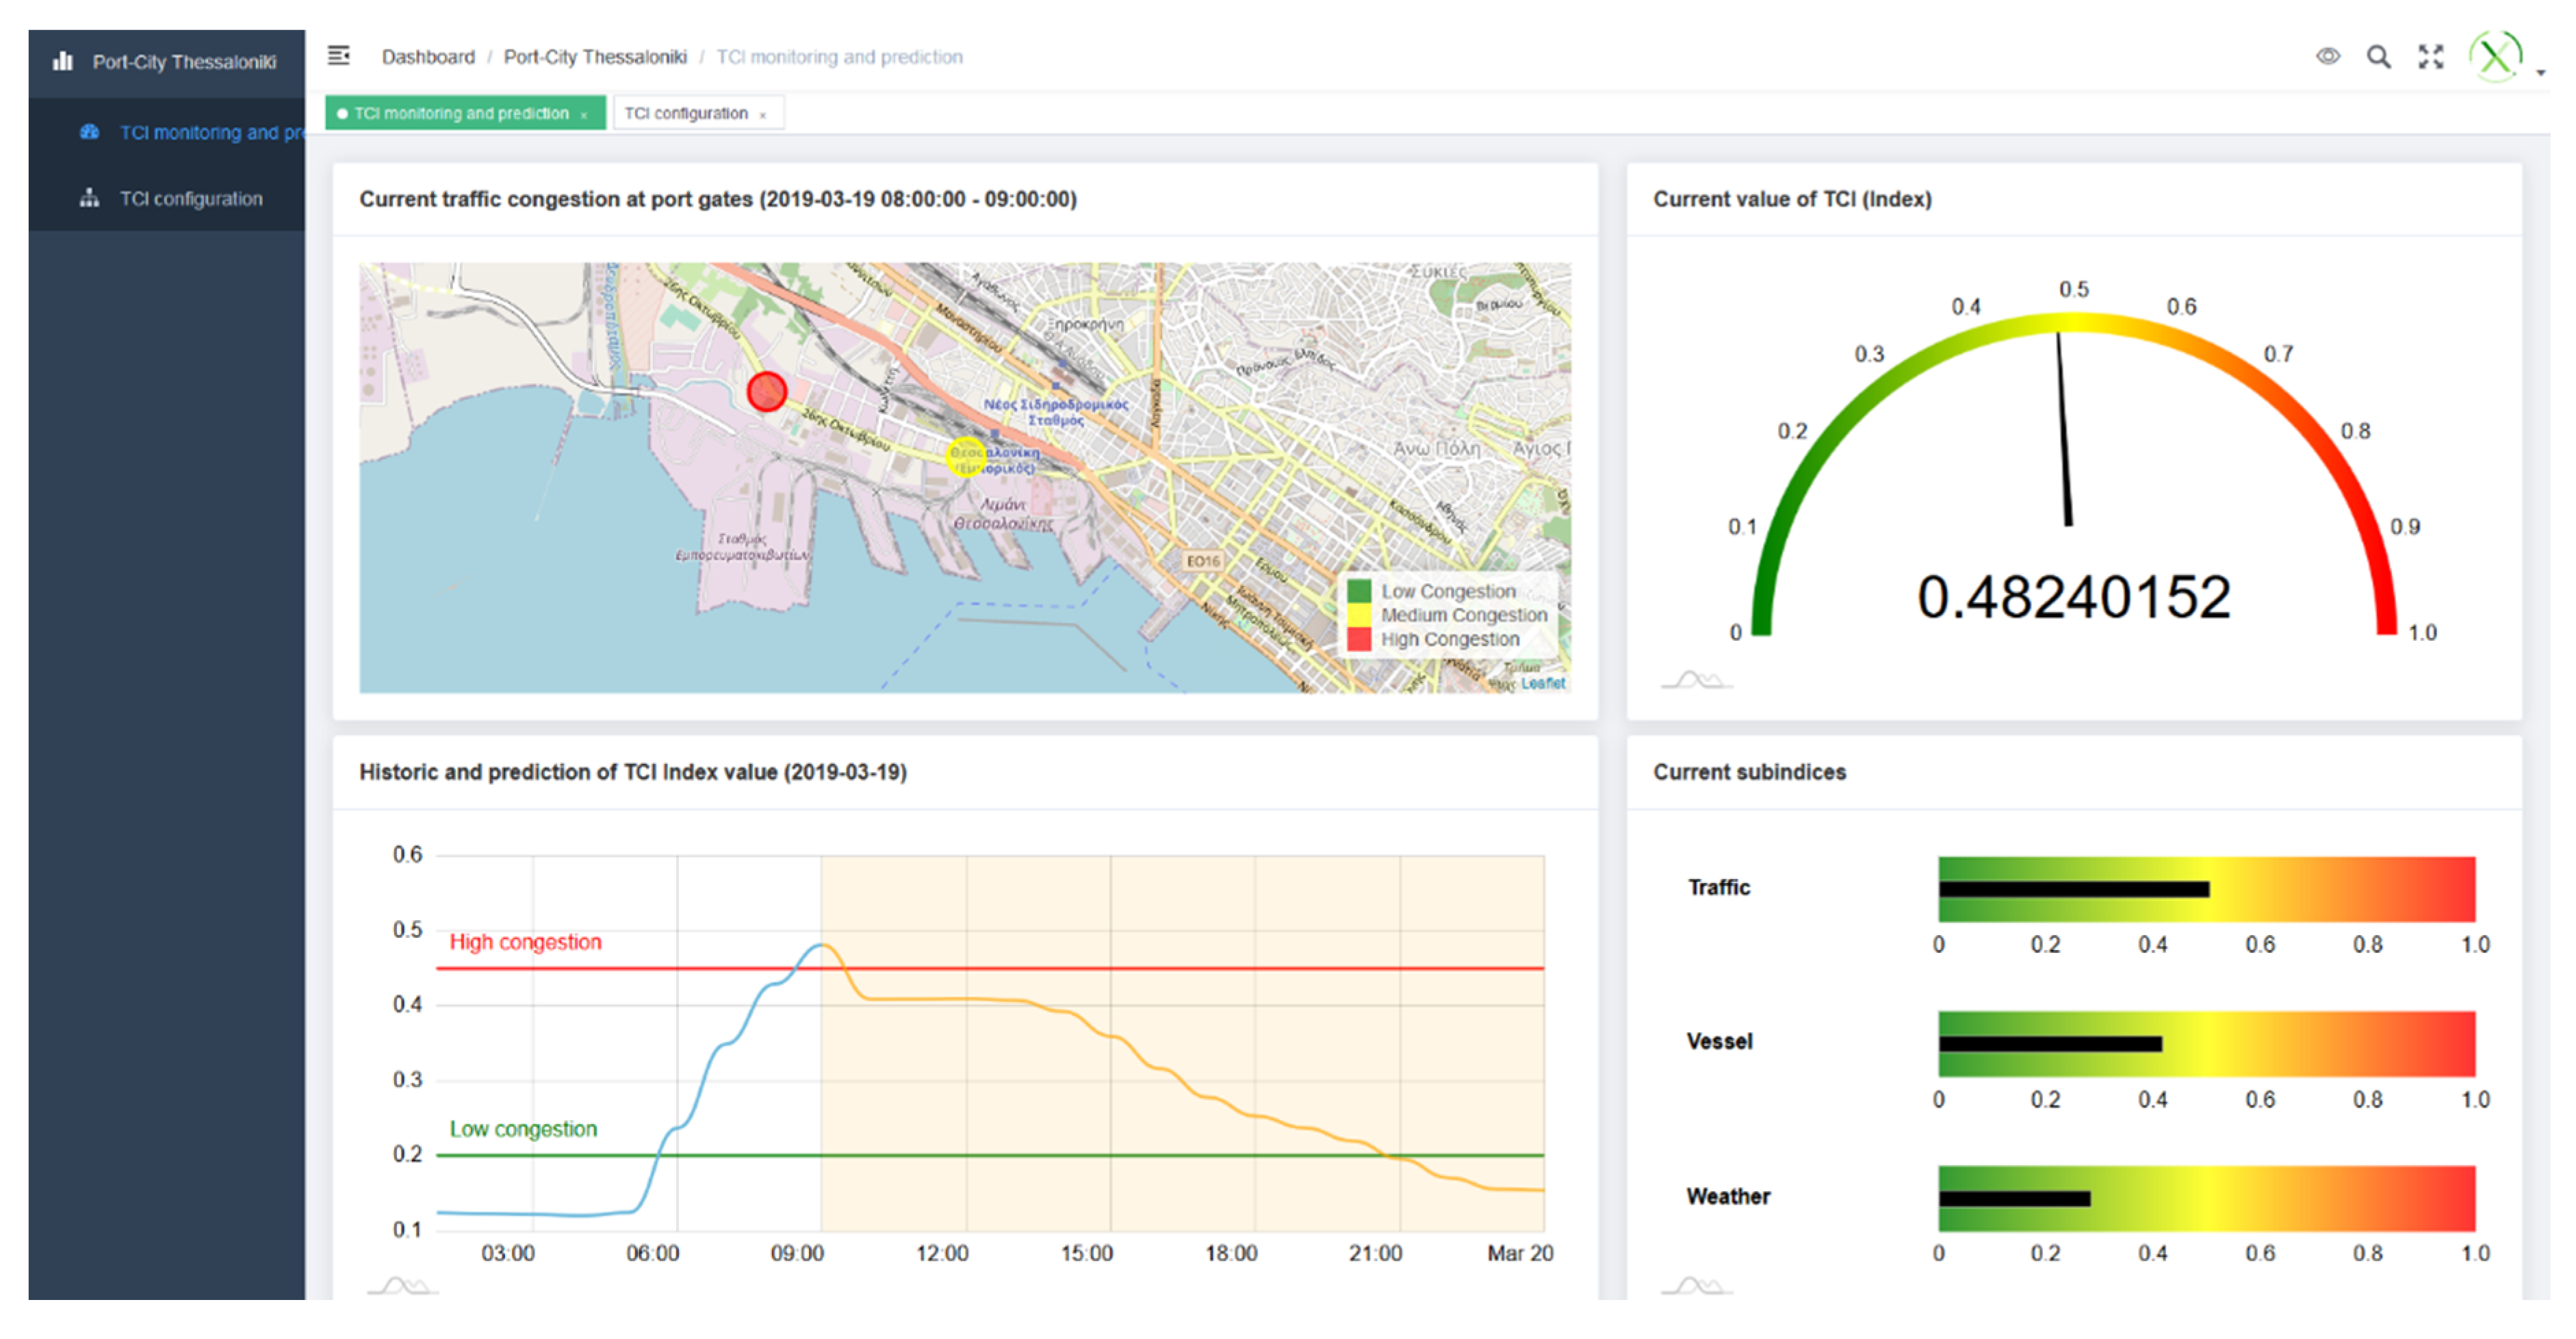
- To visualise the results of both real-time calculation of the composite index (2) and the observation of the predicted evolution of the composite indicator via a specific dynamic graph (5).
3.2. Proposed Use Case
3.3. Data
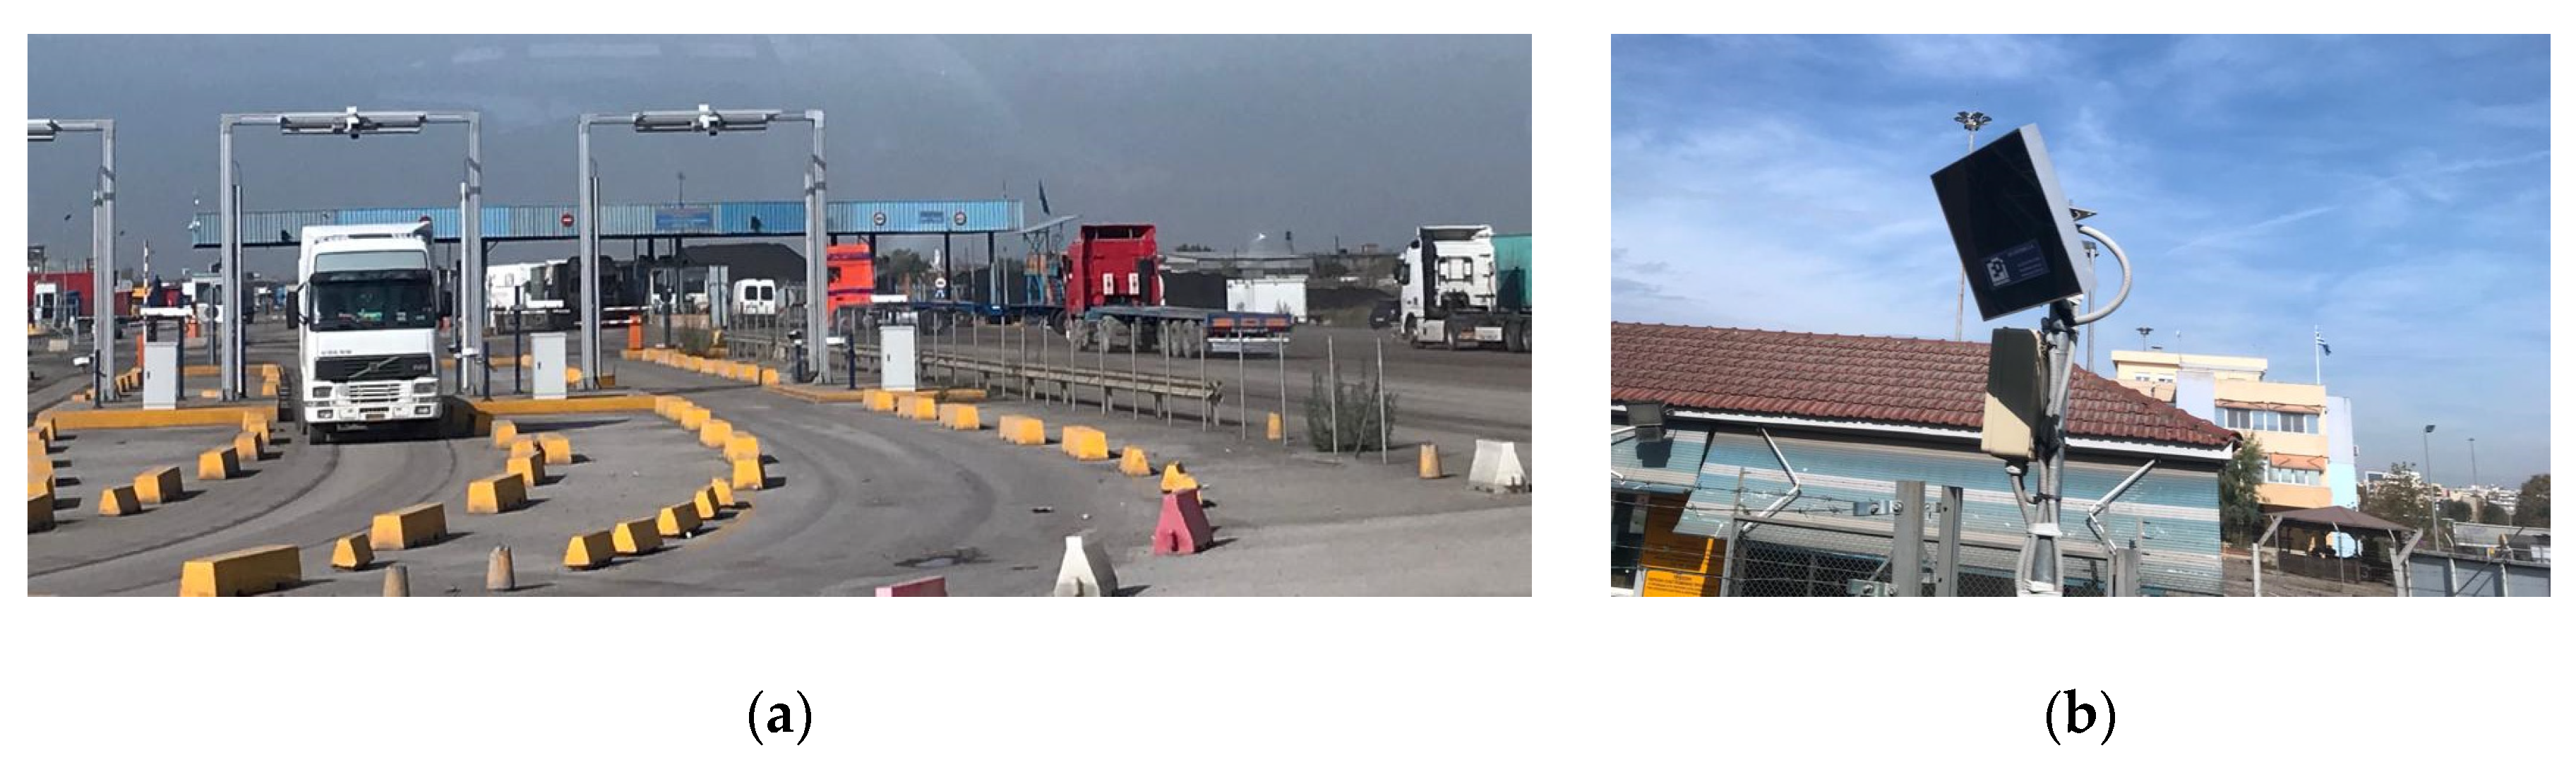
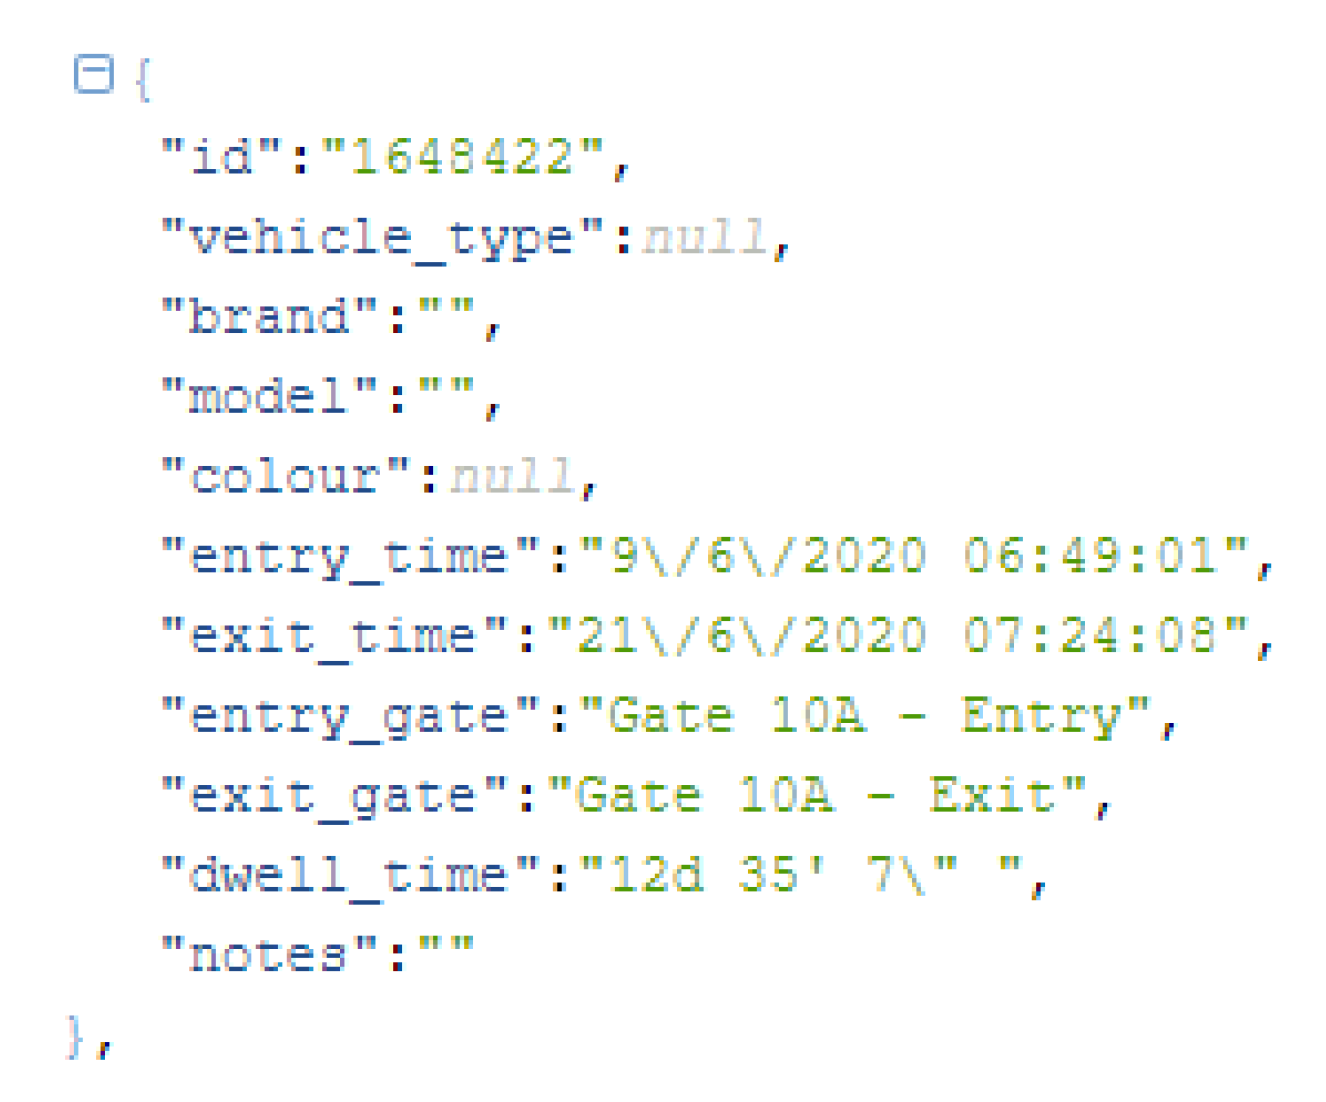
3.3.1. Traffic at the Gates of the Port Using Radio-Frequency Identification—RFID—Sensors
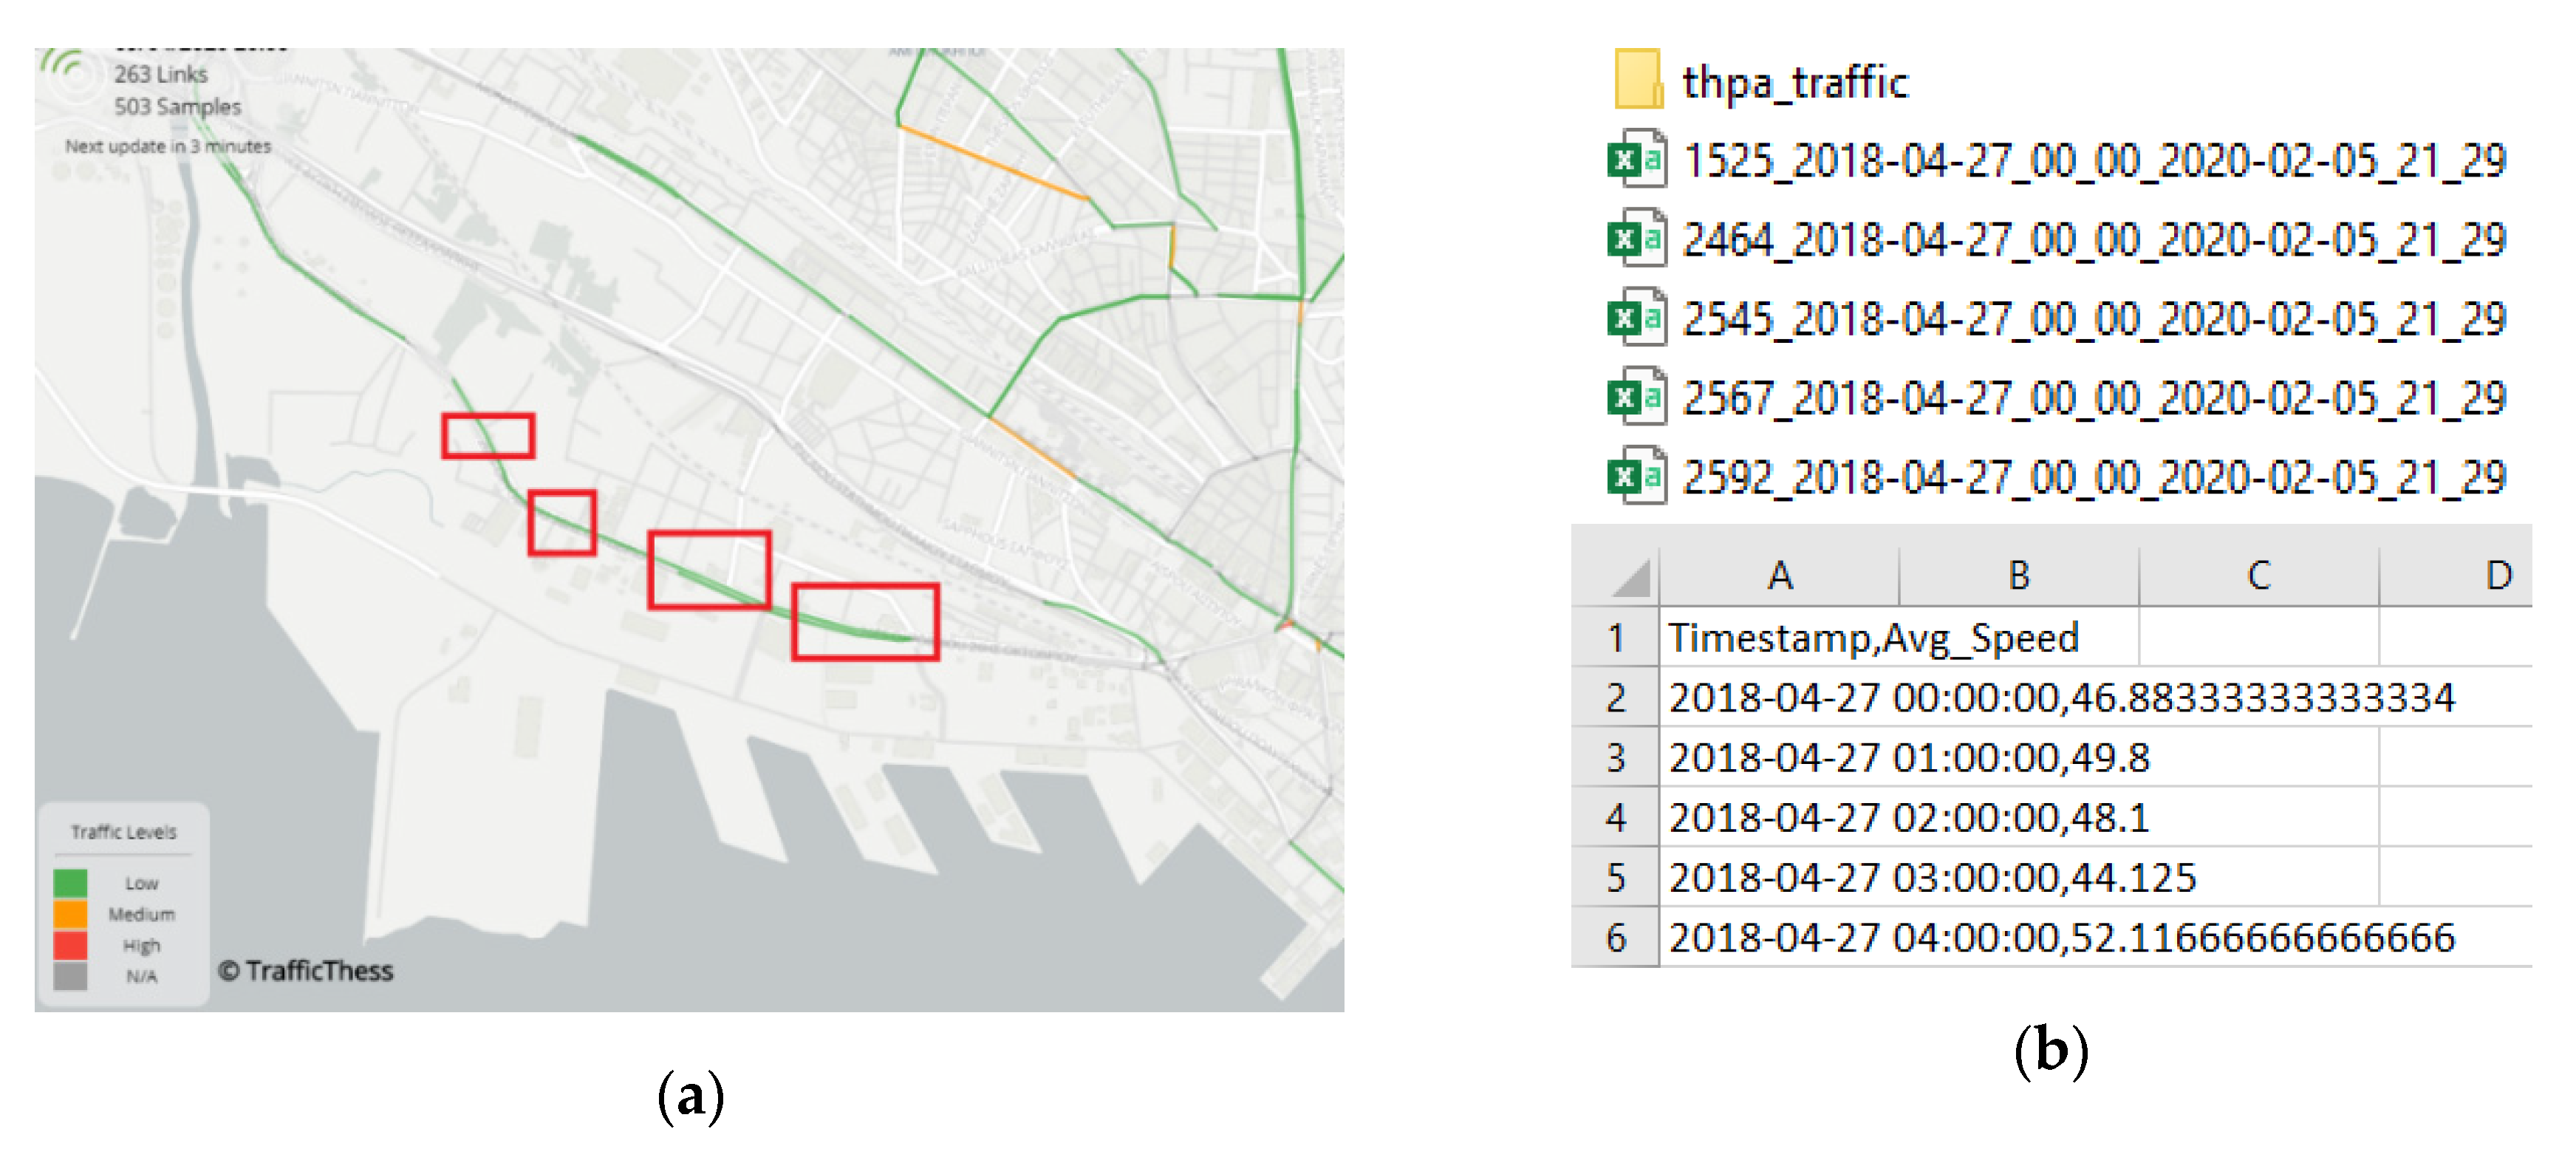
3.3.2. Traffic at the City Provided as Open Data
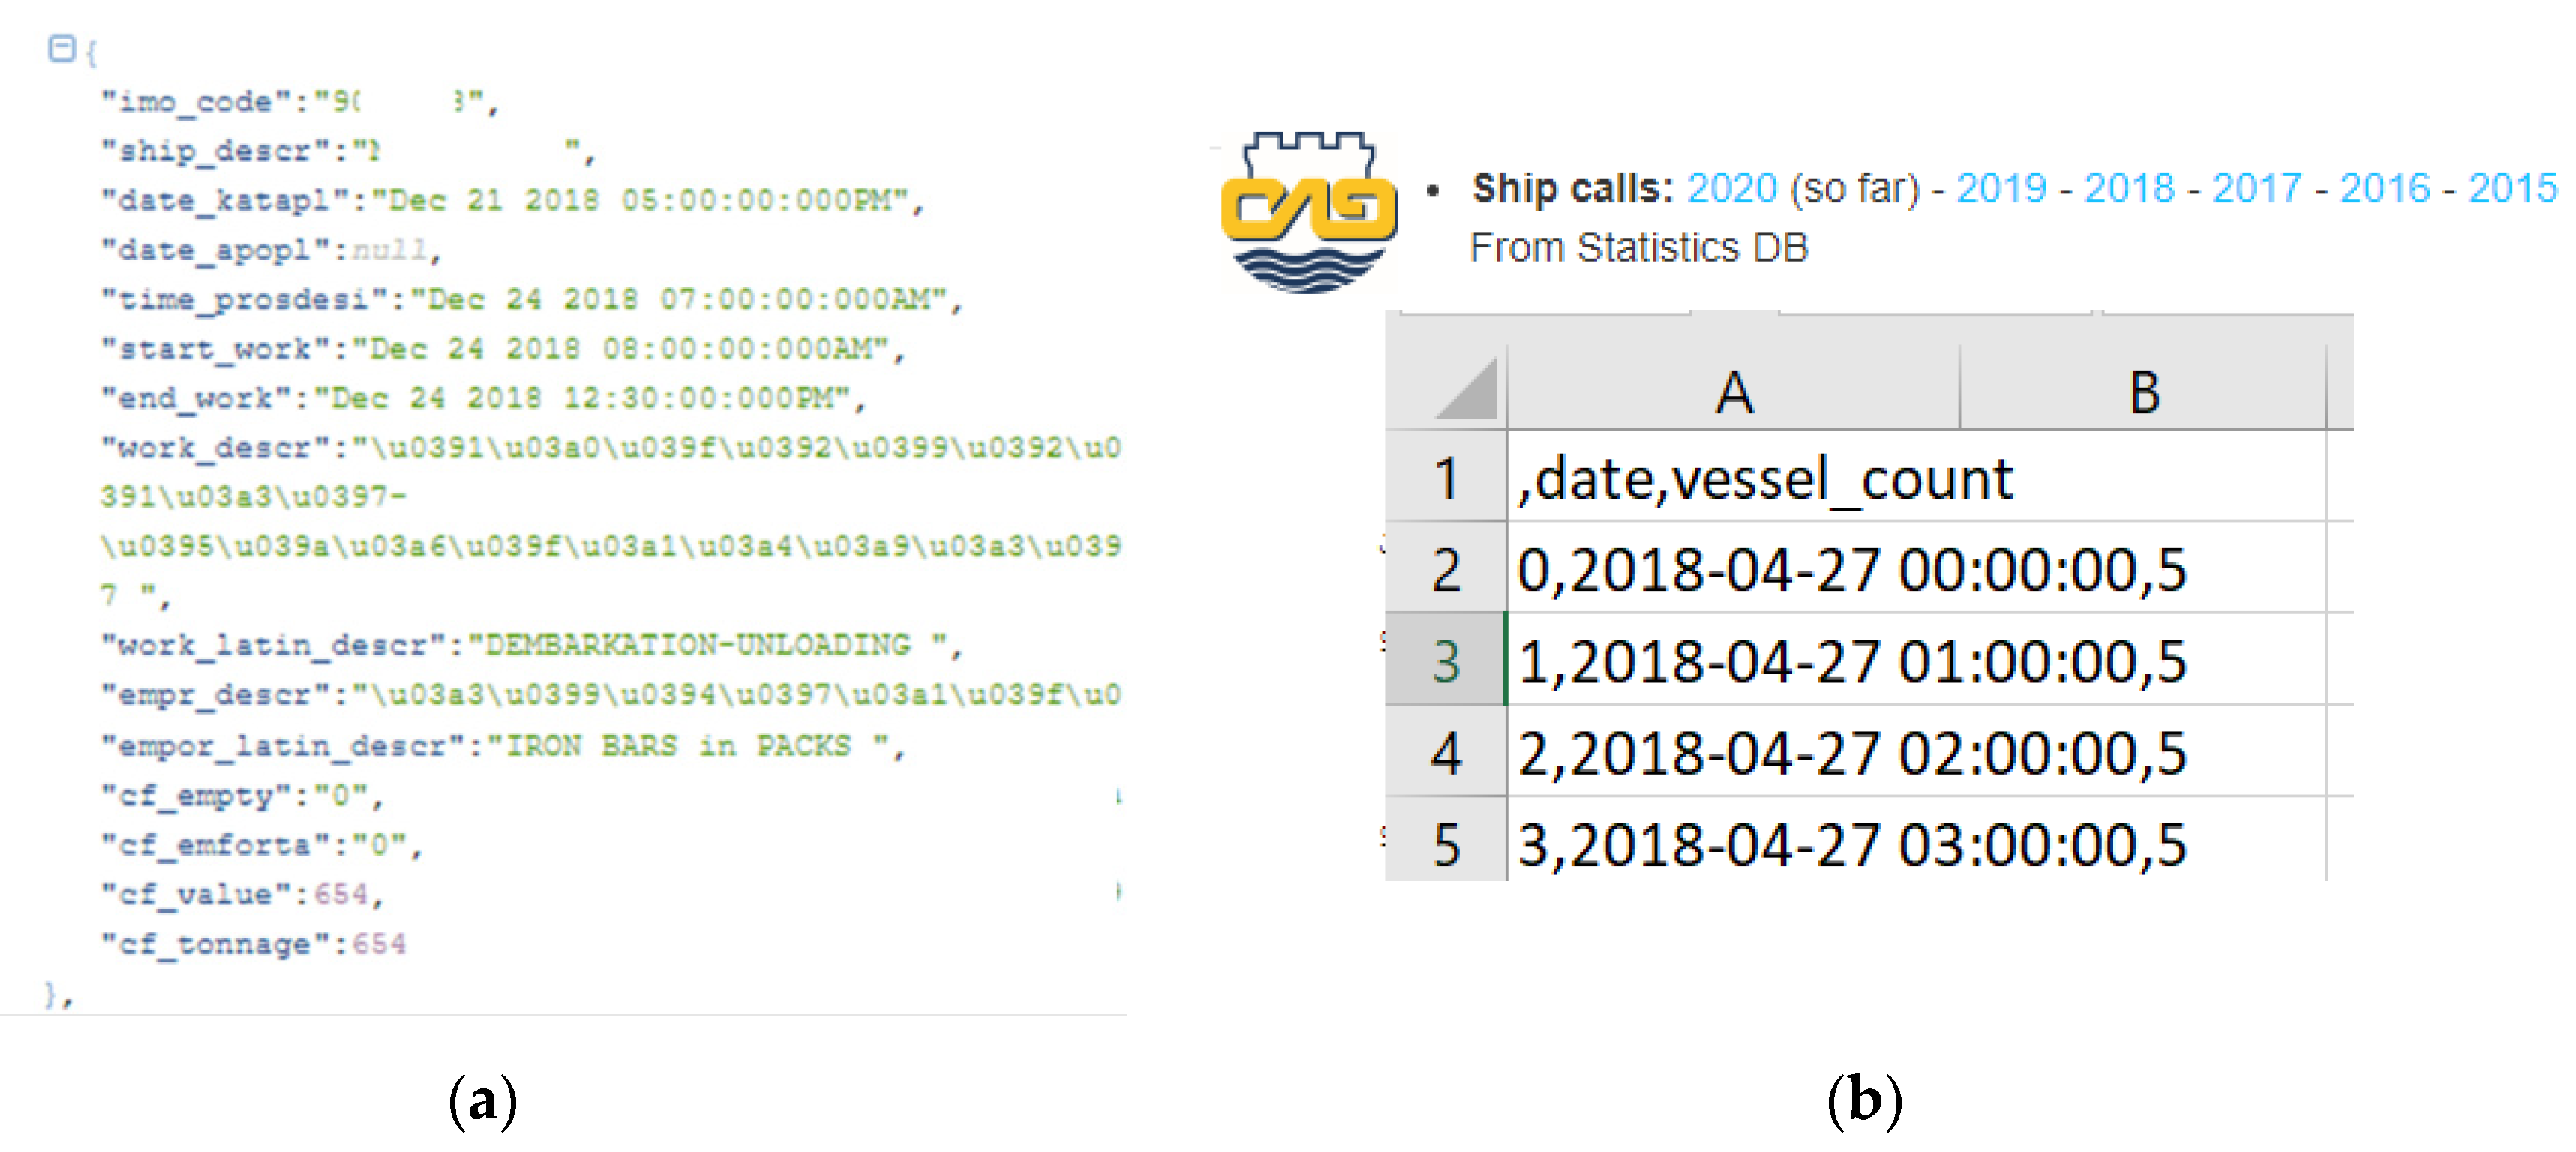
3.3.3. Vessels Berthed in the Port
3.3.4. Weather
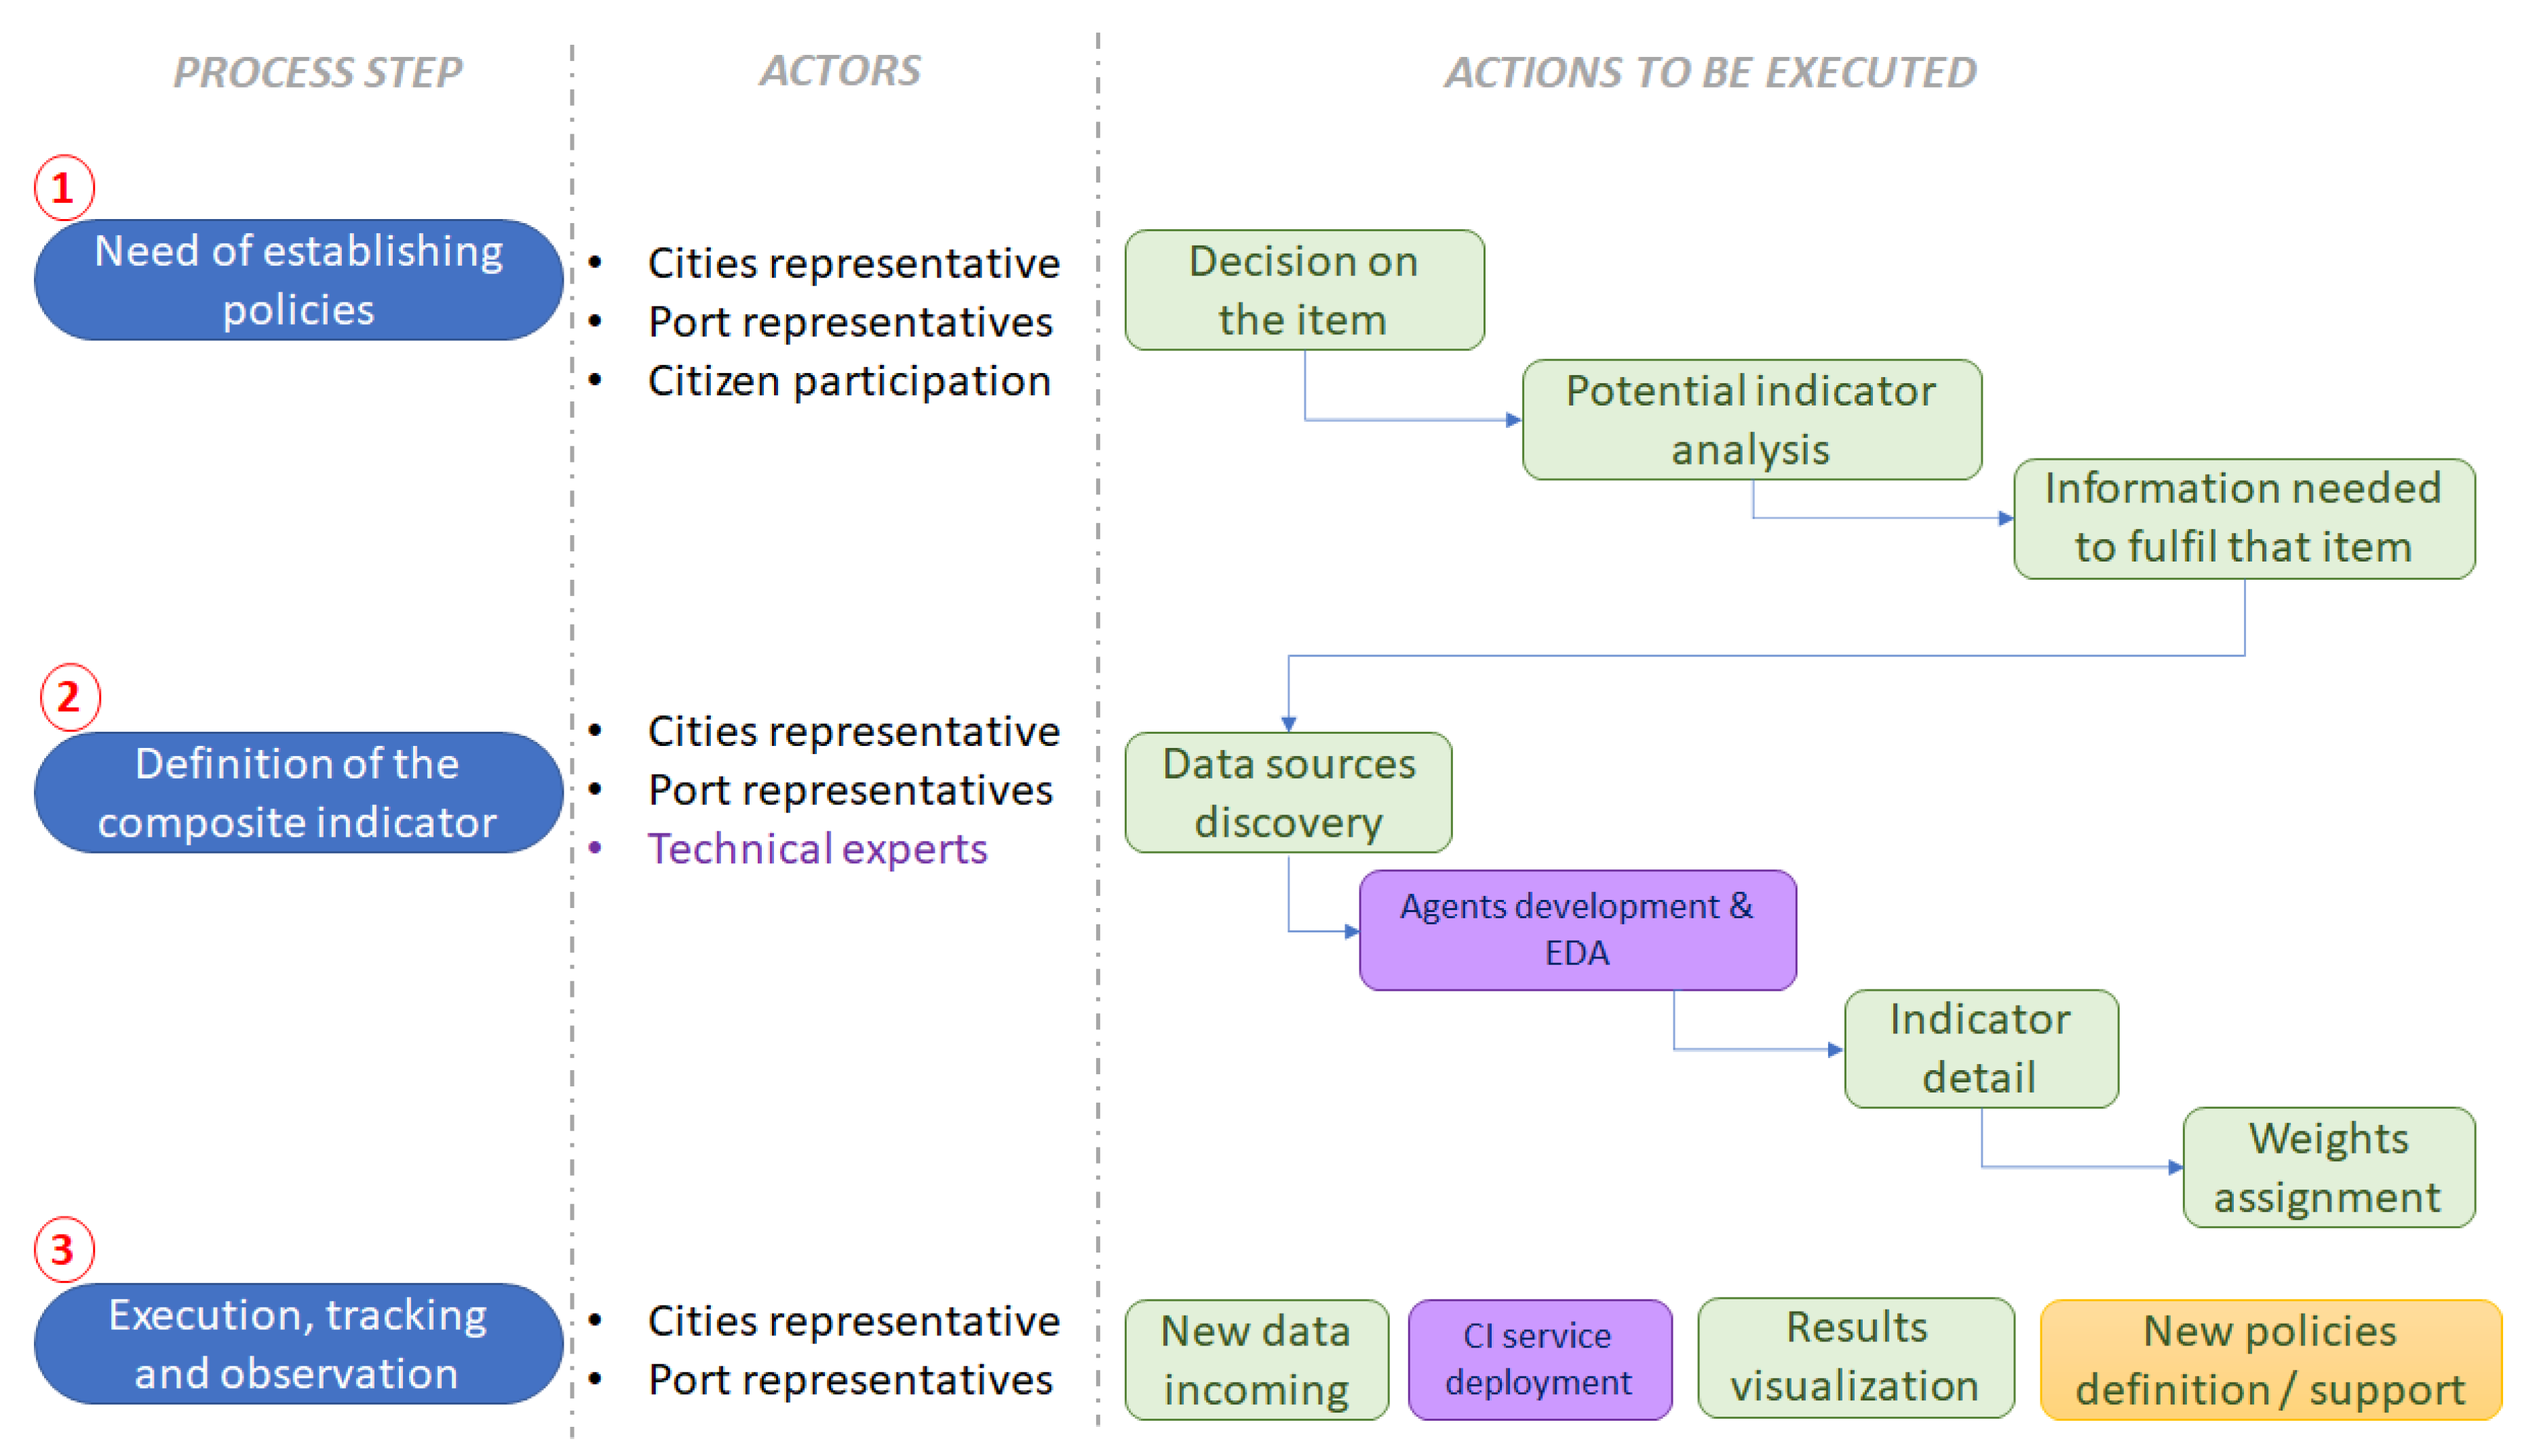
3.4. Methodology of the Experiment
- Definition and development of the NGSI agents: developed by technical experts after gaining information of the data available (see Section 3.2).
- Definition of the composite index (TCI) by stakeholders using the visual interfaces developed in the framework.
- Setup and running of the predictive component, from user parameters to actual software running.
- Configuration, implementation, and integration of all the pieces together to have a real-time composite index calculation.
3.4.1. Definition and Development of NGSI Agents for the TCI
3.4.2. Definition of the Traffic Congestion Index
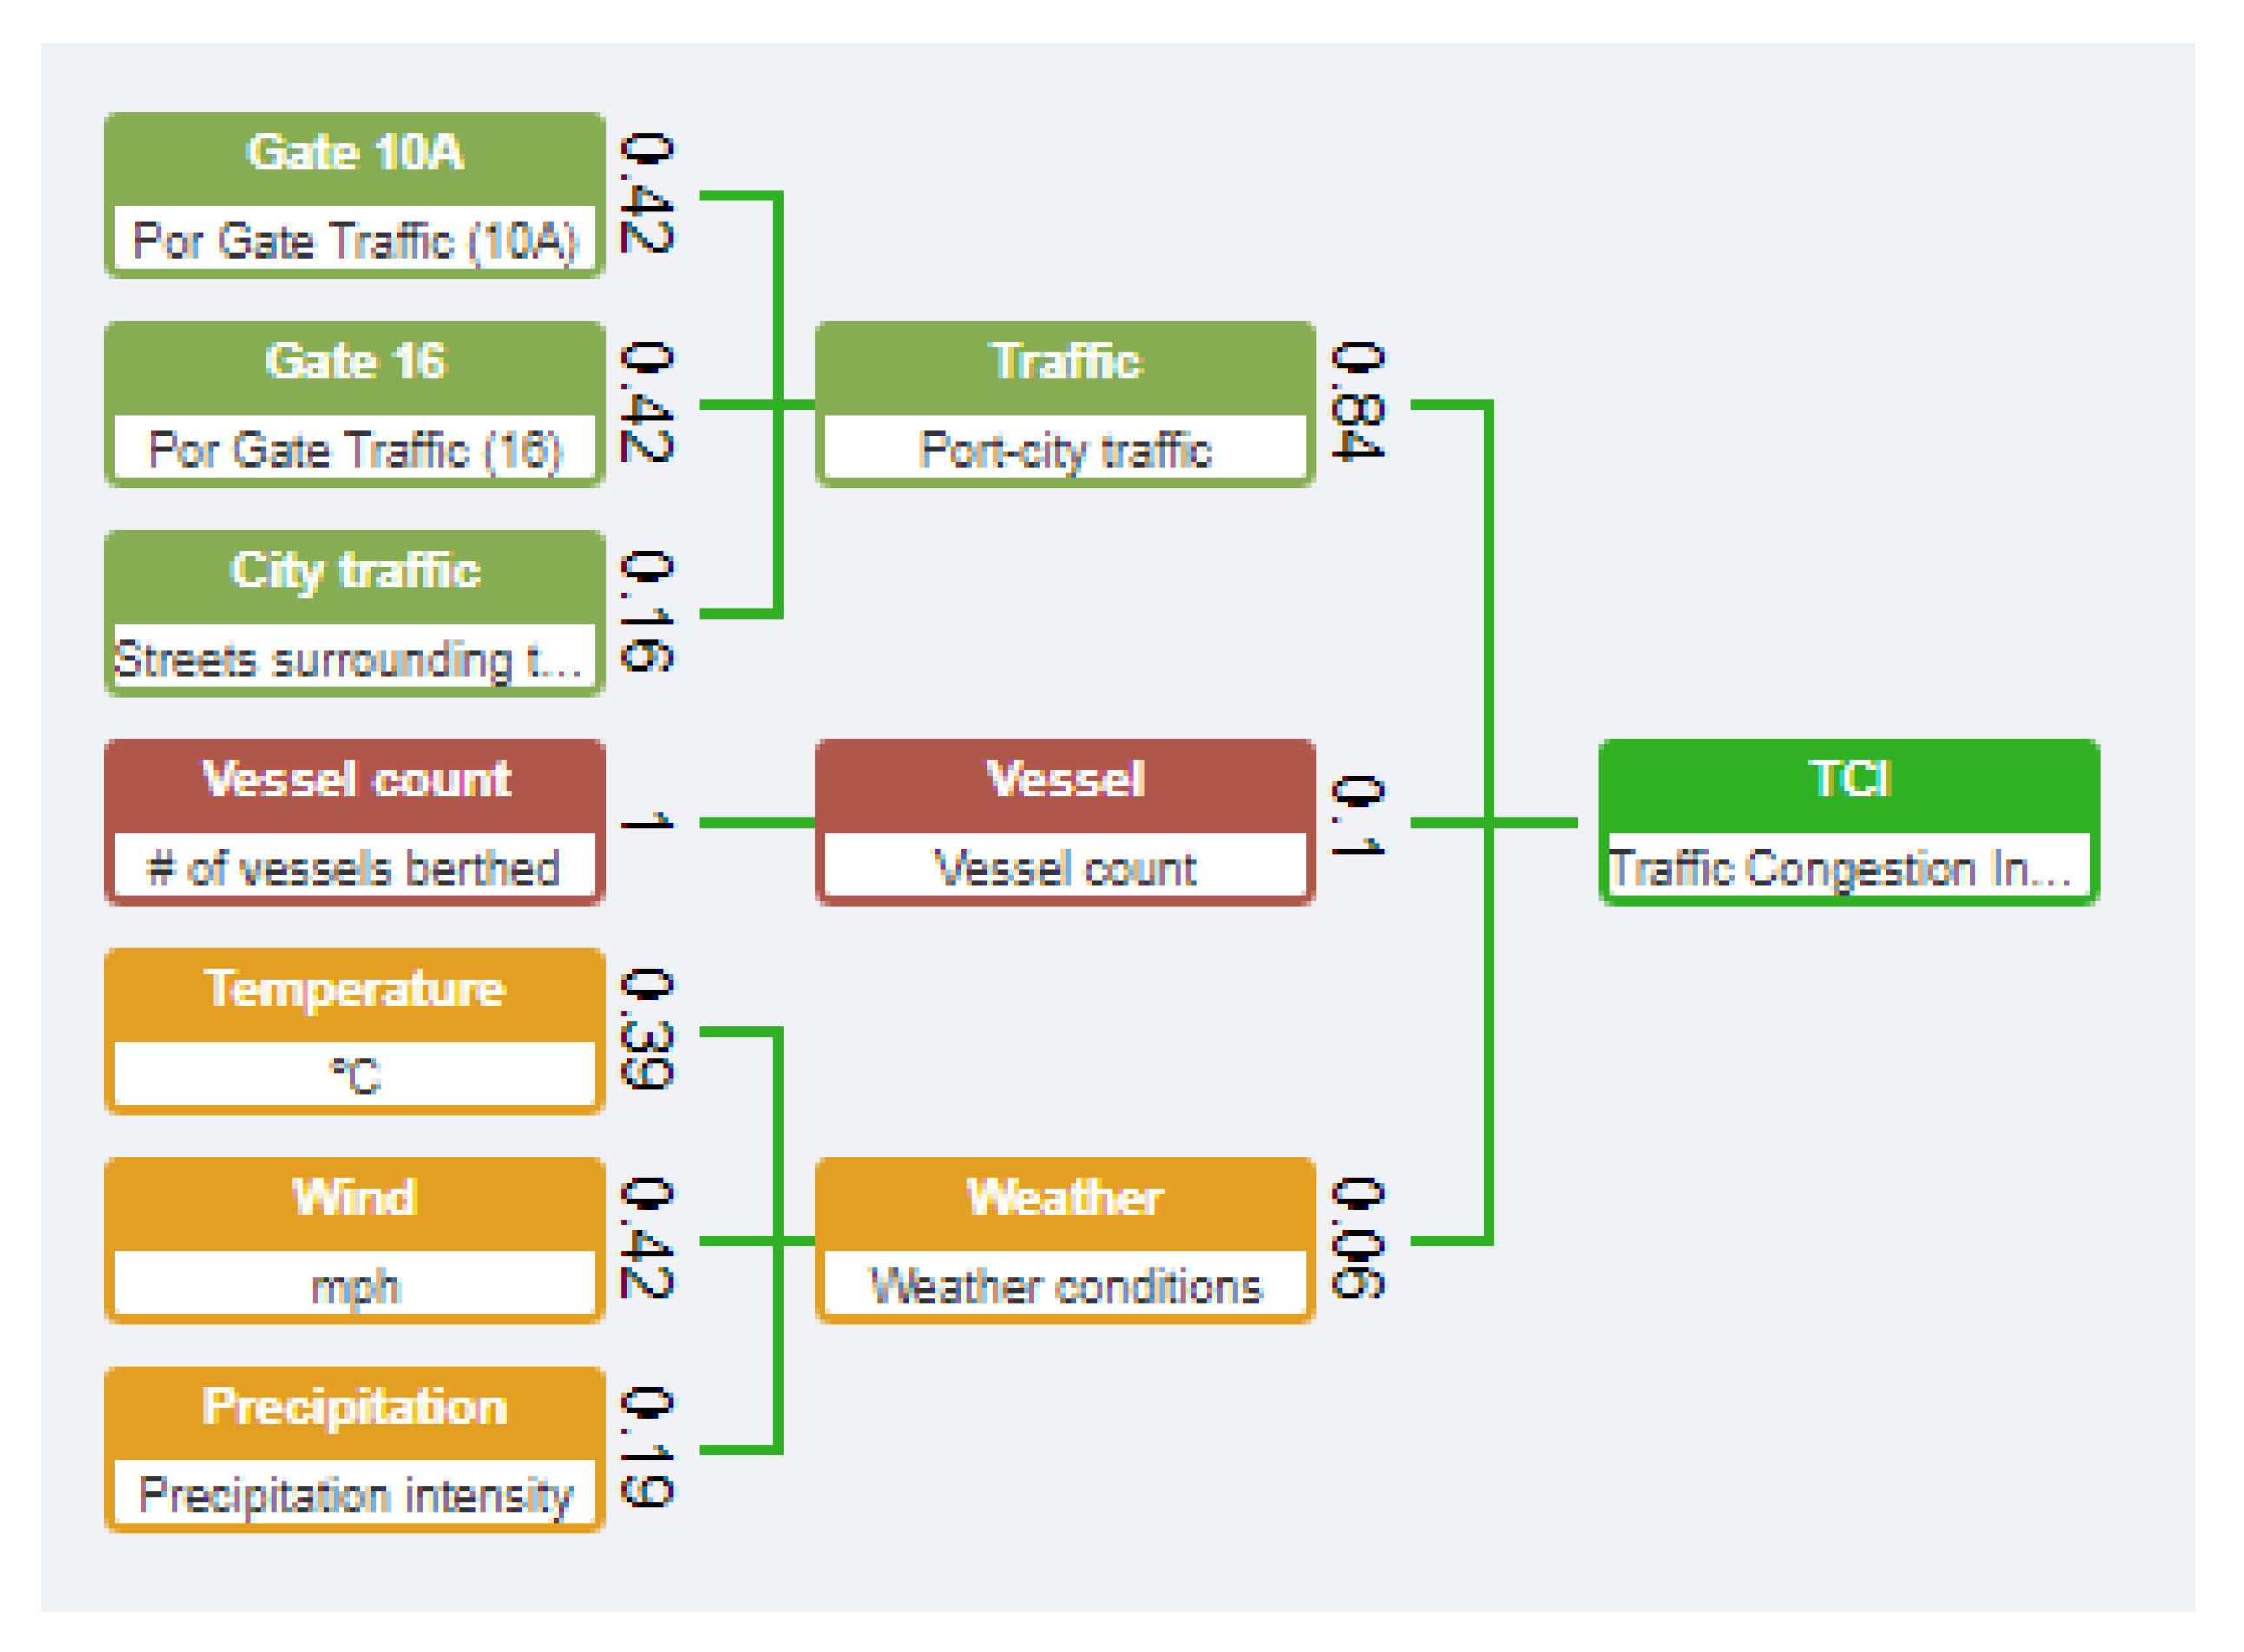
- Grouping of data into KPIs: Following the state of the art analysed in the projects PIXEL and CITYkeys, the authors decided to group the data for feeding KPIs by common origin and meaning [99]. This drove the design to couple the traffic on one side (gates of the port and city), vessel information on other side and weather information on a third and final string. The leaf nodes (KPIs) were also individually separated by isolated pieces of information (Gate 16 of the port, Gate 10A of the port, vessel count, temperature, wind speed and precipitation intensity). This led to a three-levels composition, being the KPIs the leaf nodes, three subindices and the TCI as the root node, resulting in a 7:3:1 matrix.
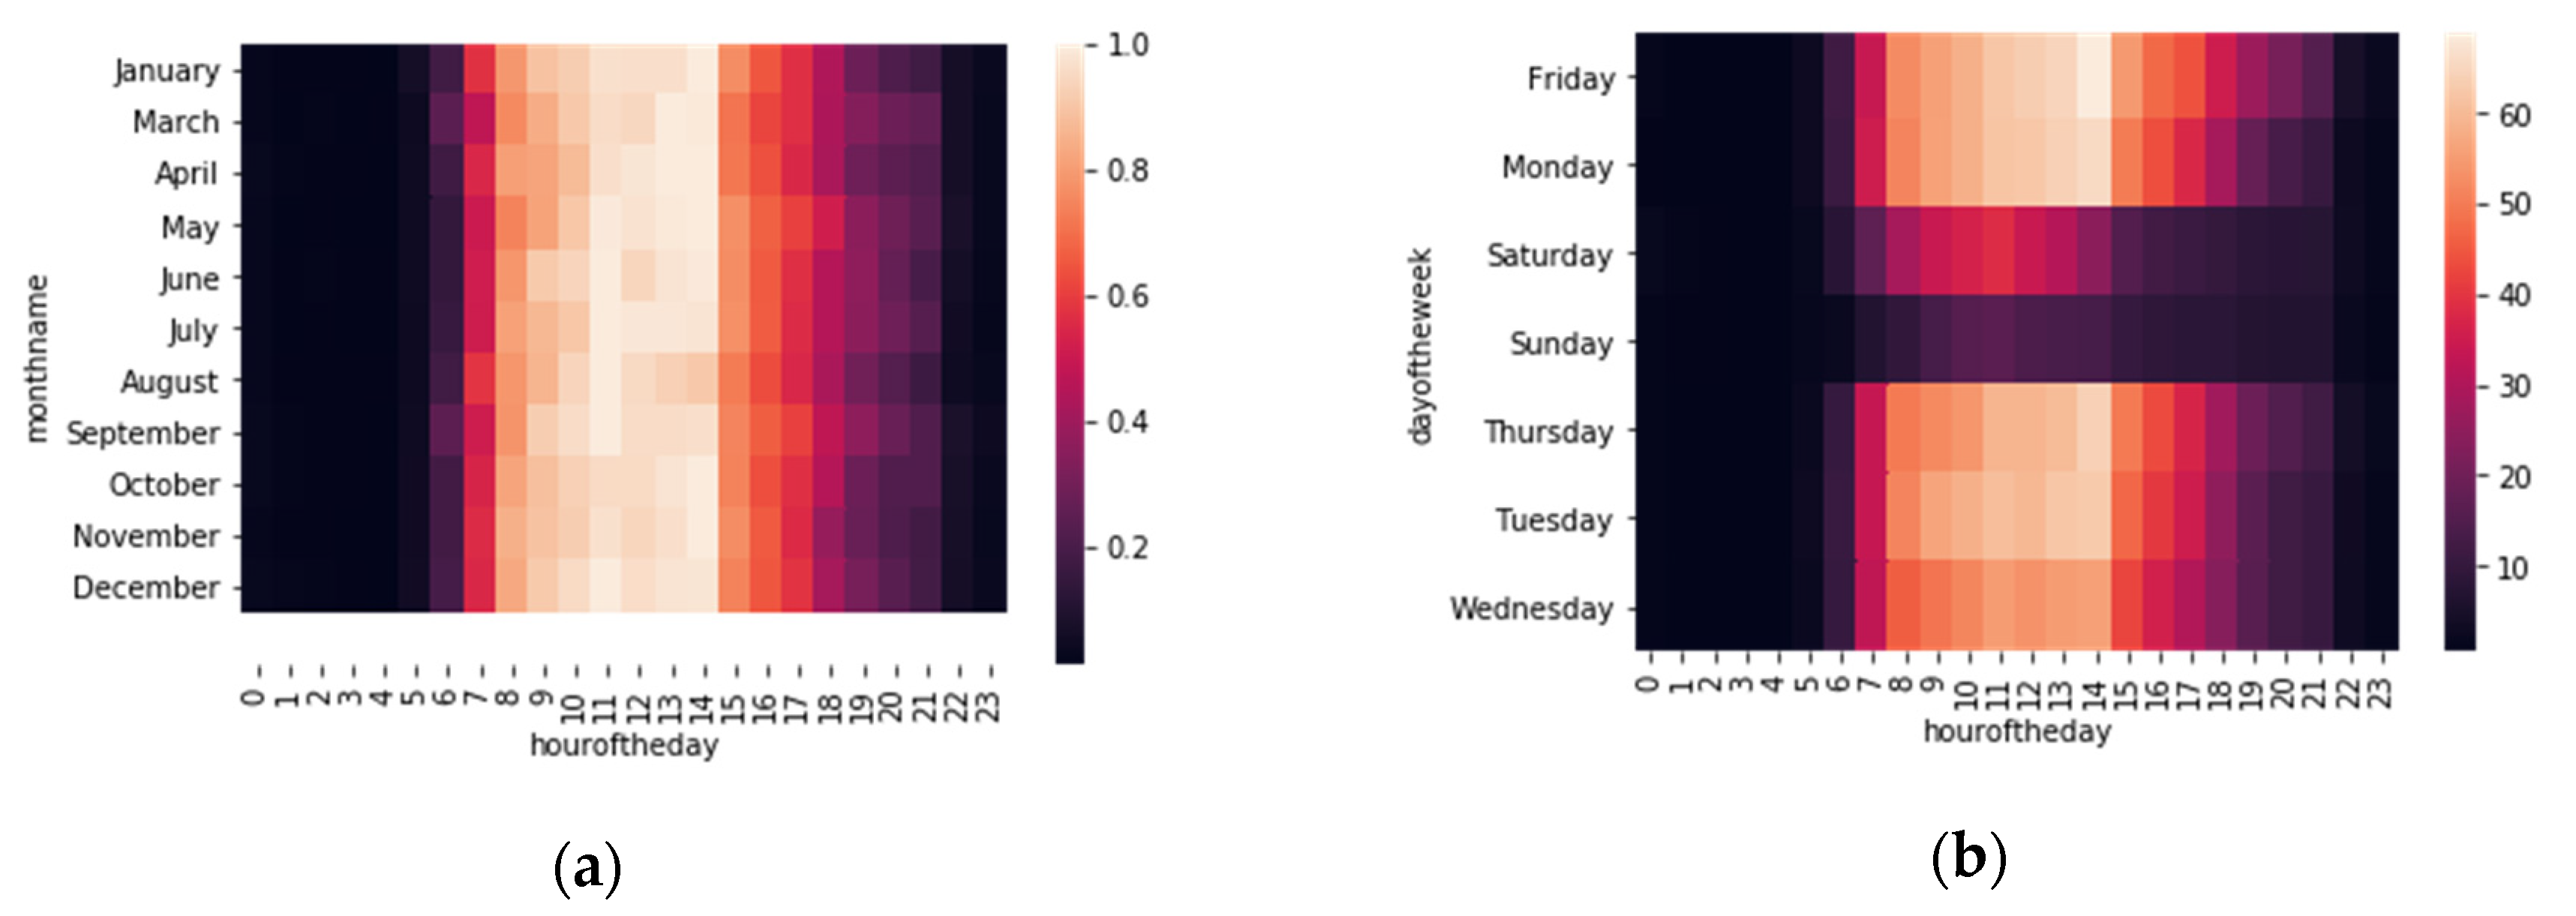
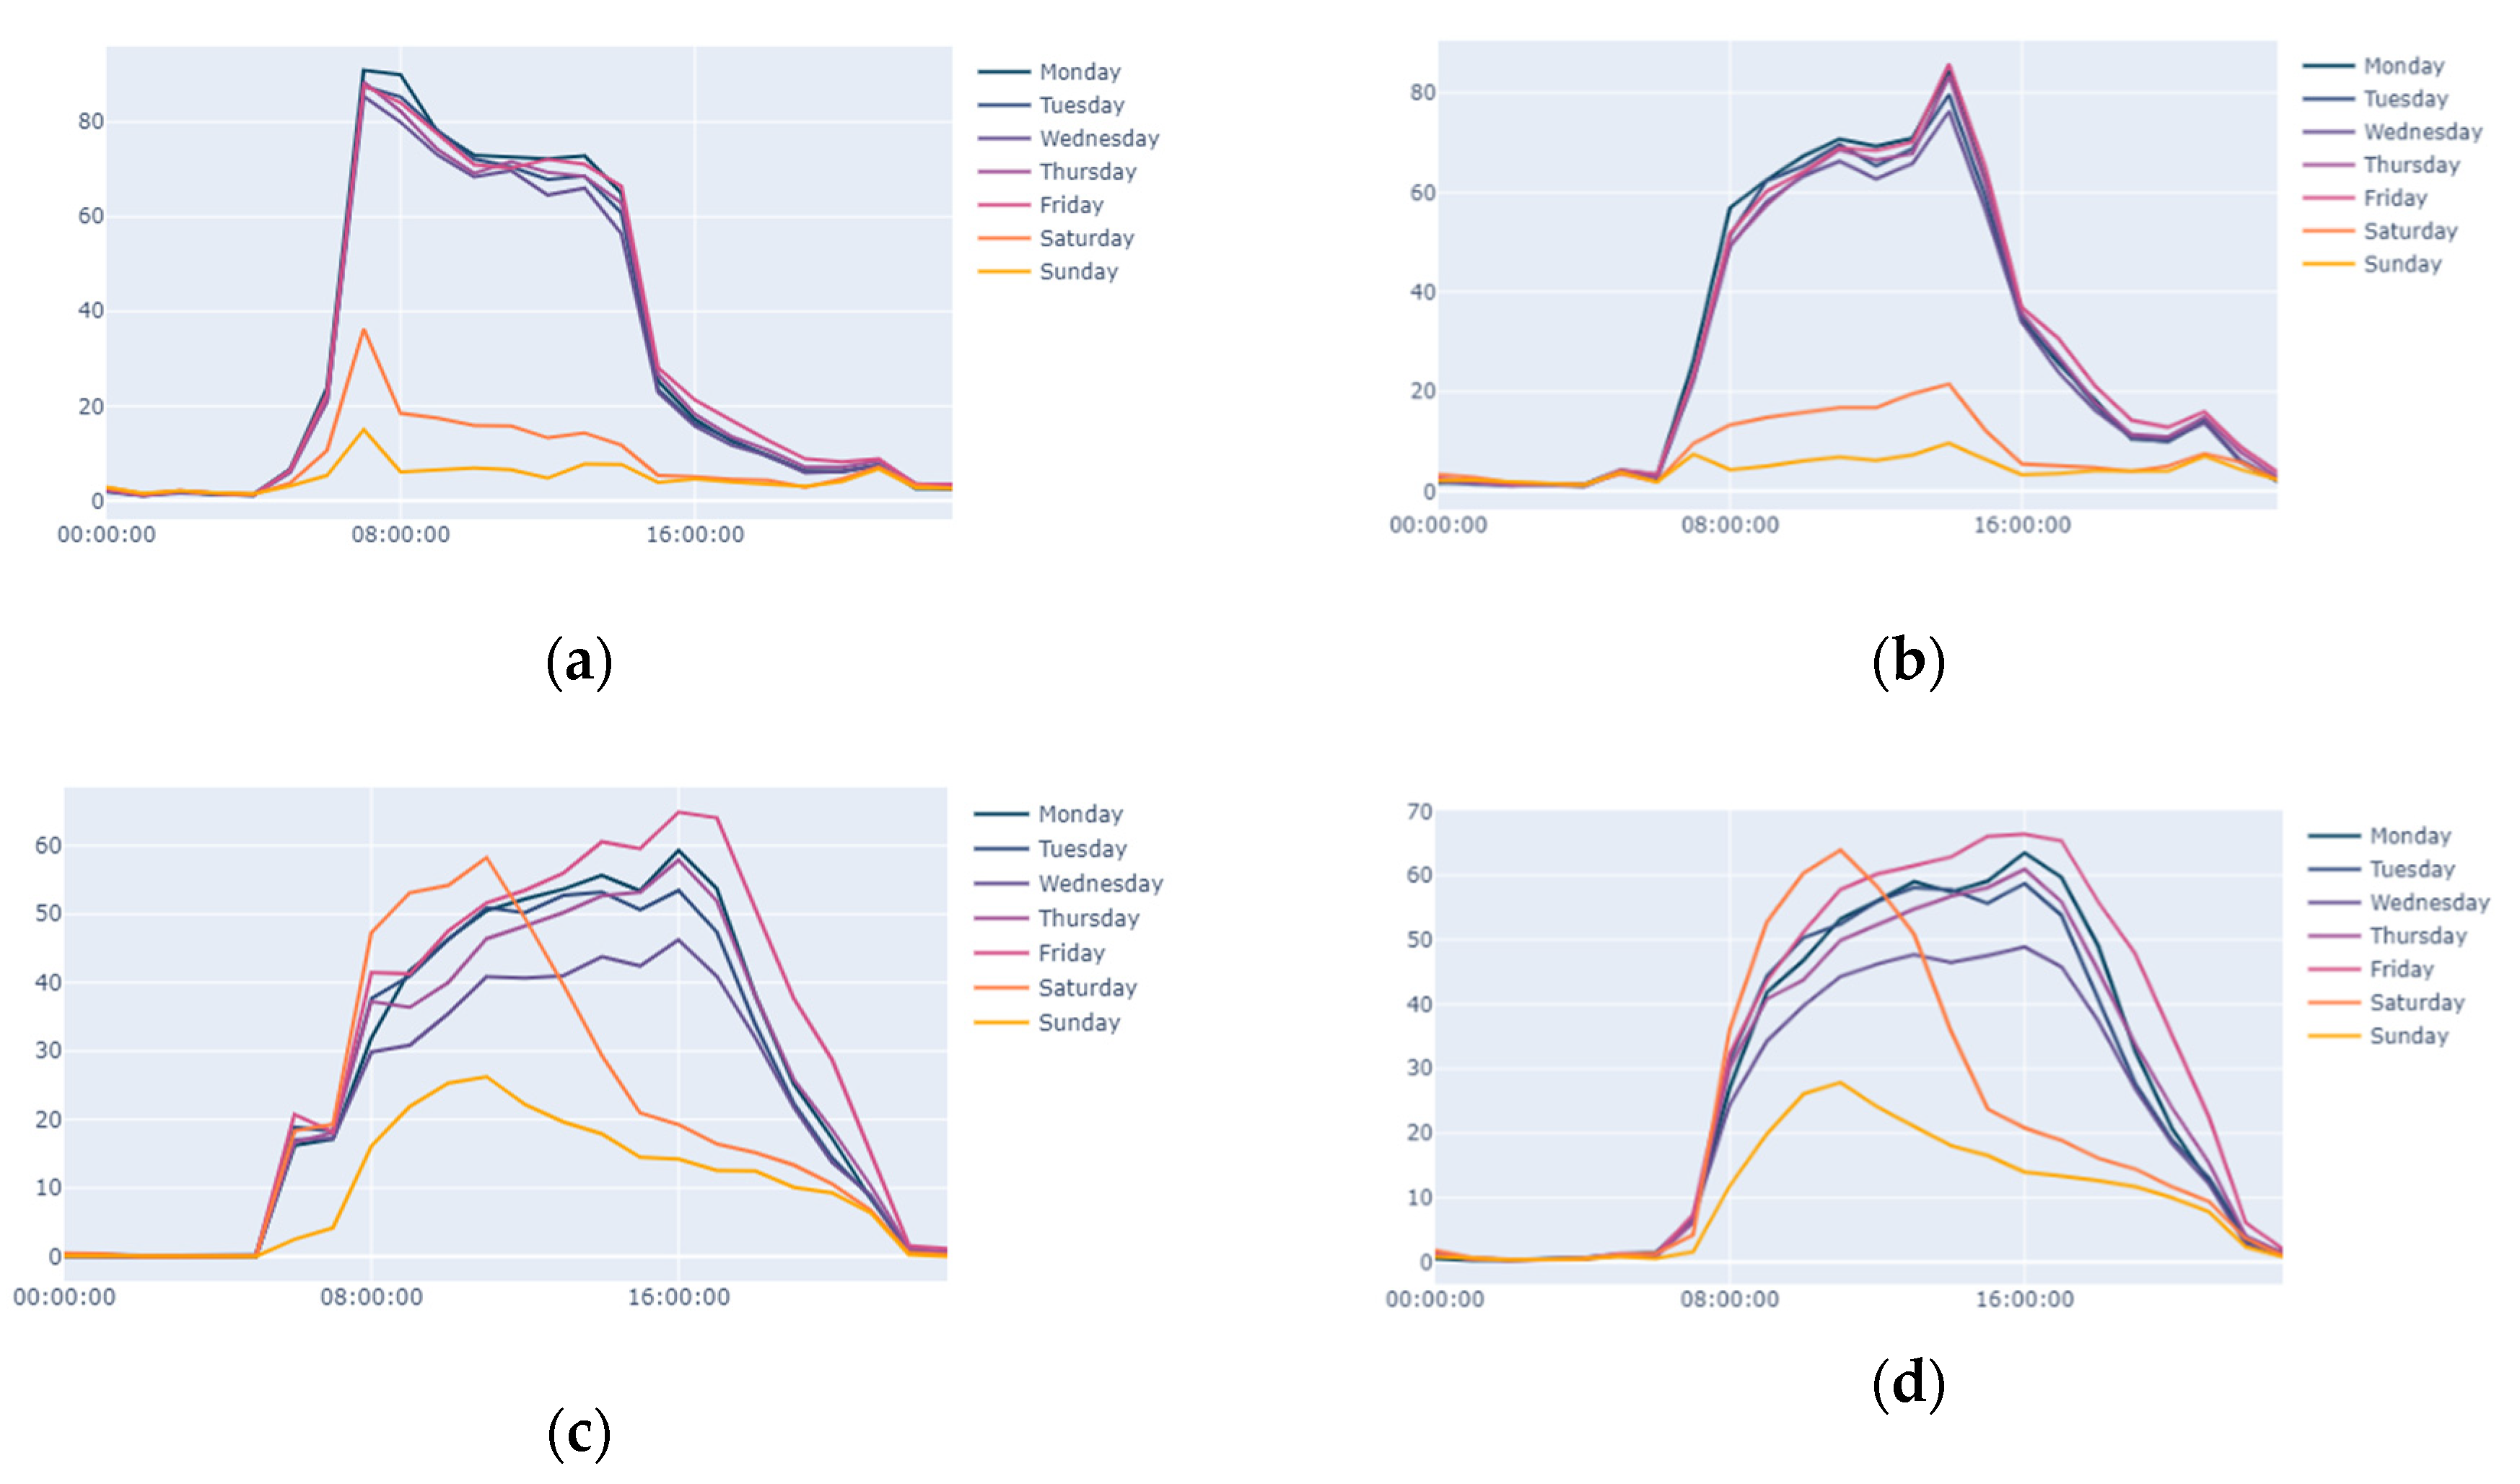
- Exploratory Data Analysis (EDA) of available historical data: Authors carried out a thorough EDA of the historic of data (see Section 3.3). A summary of that EDA is attached in Appendix B. The main aim of this EDA was to discover how the data performs through time, noticing seasonality, and, mainly, to find the correlation between the different data with the main reference source: the traffic at the gates of the port. The results of this correlation were the following:
- Weighting: The last-but-one configuration for the CI was to select the weighting method and values to give to each node. This is a crucial action that has been widely studied in the composition of CIs [108]. There is not a universal weighting method and it must be analysed case by case, introducing a challenging choice [109]. The most used method is equal weighting, followed by analytical methods (regression analysis, benefit-of-doubt, principal component analysis), with opinion-based methods only used marginally. The choice depends on the nature of data and indicator items: (i) equal weighting tends to be used when no historical data is known, (ii) analytical methods are case-to-case analysed depending on the items and (iii) opinion-based methods are mostly used in social sciences (cases where the target indicator is highly subjective). In this experiment, the authors opted for an analytical method driven by the analysis of historic data available. The specific scheme selected was to base the weighting values on the correlation of all items with the main reference item. For establishing those values, g the authors came to map KPI-weight, sub-index-weight, which brought to solve three equations systems (see numbers and structure of the points above).
- Aggregation method: According to the literature, there are three widely used aggregation methods [108]: additive aggregation, geometric aggregation and non-compensatory aggregation, being the first one the most popular by far. Additive aggregation provides transparency and allows a simple understanding of the results, being much dependent on the synergies between items. Geometric aggregation also provides a good understanding of results but requires uniformity in measurement units and scales, being very dependent of synergies as well. Non-compensatory methods are fit for cases where the indicator is going to be deployed in several instances (e.g., ports, countries) and those aim to be compared and ranked. Non-compensatory methods are the most computationally expensive of the three. For this experiment, the authors considered that the relevance of all indicators was not equal, being the traffic at the gates the reference item. Noticing the previous, the choice was to select additive aggregation. However, the framework developed in this paper has been designed to allow the selection of any of them for future uses.
- Normalization method: The items to build the indicator must be comprehended in the same scale in order to be aggregated. Thus, a normalization step was included in this computation. A lot of methods for normalization are available, and to be able to finally select one as definitive several robustness test must be done. The objective of the work in this paper was to demonstrate the use of these calculations using a specific IoT architecture rather than going deep into normalisation arguments. Scale method was discarded due to magnitude variation, as well as the ranking due to its only execution in Thessaloniki. Z-score method and Min-Max were the main candidates and, considering that in this experiment the authors had valuable historic data for more than 18 months, the Min-Max option was selected.
3.4.3. Predictive Component: Training and Validation
- (1)
- To convert and clean the historic CSVs into the accepted data format for training the Prophet model. Here, the attributes had to be adapted and seven different models were created. The framework and methodology designed (see Section 3.1) established that all KPIs must be predicted, and then the CI is calculated after those values. For that reason, one model per each KPI was trained and used. This was developed by the authors using Jupyter Notebooks [113]. The procedure was studied to be replicated in an automated way for (2).
- (2)
- To create Python scripts that gather and group the KPIs data from the data storage and convert, clean, and adapt the information for re-training the seven models. In this experiment, three re-trainings took place, according to the framework usability evaluation depicted at the beginning of Section 4. The outcomes were new models that have used more historic data to be trained, therefore more accurate and usable. For storing and retrieving those models (binary files), the Python built-in library pickle has been used.
- (3)
- To apply the models. As commented, the forecasting horizon was set to 1 day with a 60 min periodicity. This way, each morning, the framework runs the inference over the trained models. Prophet models do not need input data; therefore, a prediction is requested (automated through a Python script) with that periodicity and horizon. The outcome (future timestamps with predicted TCI values) are used to be represented for the user via the UI component.
3.4.4. Component Integration and Deployment
3.4.5. User Configuration
0.2 ≤ TCI < 0.46, Medium congestion
0.46 ≤ TCI < 1, High congestion
4. Results
- (i)
- composite indicator makes global sense and represents the reality,
- (ii)
- predictions are valid and realistic, so that the model can be trusted, and
- (iii)
- the interface usability makes it easy to interpret the information to build Smart Port-City policies upon.
5. Discussion
6. Conclusions and Future Research Lines
Author Contributions
Funding
Acknowledgments
Conflicts of Interest
Appendix A


Appendix B


Appendix C


References
- WHO. Urban Population Growth. Available online: https://www.who.int/gho/urban_health/situation_trends/urban_population_growth_text/en/ (accessed on 29 June 2020).
- United Nations Conference on Trade and Development. Review of Maritime Transport 2019; UN: New York, NY, USA, 2019; ISBN 978-92-1-112958-8. [Google Scholar]
- Smart Port City. Available online: https://maritimestreet.fr/smart-port-city/ (accessed on 29 June 2020).
- The World’s 33 Megacities. Available online: https://www.msn.com/en-us/money/realestate/the-worlds-33-megacities/ar-BBUaR3v (accessed on 29 June 2020).
- DocksTheFuture Project Maritime Traffic Analysis and Forecast Review-Key Results. Available online: https://www.docksthefuture.eu/wp-content/uploads/2020/04/Attachment_0-2019-09-09T135818.886-1.pdf (accessed on 29 June 2020).
- Hamburg Port Authority: SmartPORT. Available online: https://www.hamburg-port-authority.de/en/hpa-360/smartport/ (accessed on 29 June 2020).
- Guo, H.; Wang, L.; Chen, F.; Liang, D. Scientific big data and digital earth. Chin. Sci. Bull. 2014, 59, 5066–5073. [Google Scholar] [CrossRef]
- AIVP Agenda 2030 for Sustainable Port-Cities. Available online: https://www.aivpagenda2030.com/ (accessed on 29 June 2020).
- Rodrigue, J.-P. Urban Transport Challenges. Available online: https://transportgeography.org/?page_id=4621 (accessed on 1 July 2020).
- Passenger Cars in the EU. Available online: https://ec.europa.eu/eurostat/statistics-explained/index.php/Passenger_cars_in_the_EU (accessed on 29 June 2020).
- Average CO2 Emissions from New Cars and Vans Registered in Europe Increased in 2018, Requiring Significant Emission Reductions to Meet the 2020 Targets. Available online: https://ec.europa.eu/clima/news/average-co2-emissions-new-cars-and-vans-registered-europe-increased-2018-requiring-significant_en (accessed on 29 June 2020).
- Perdiguero, J.; Jiménez González, J.L. Policy Options for the Promotion of Electric Vehicles: A Review; IREA—Working Papers; University of Barcelona, Research Institute of Applied Economics: Barcelona, Spain, 2012. [Google Scholar]
- 7 Smart City Solutions to Reduce Traffic Congestion. Available online: https://www.geotab.com/blog/reduce-traffic-congestion/ (accessed on 29 June 2020).
- The Port and the City—Thoughts on the Relation between Cities and Ports. Available online: https://theportandthecity.wordpress.com/ (accessed on 29 June 2020).
- Yau, K.A.; Peng, S.; Qadir, J.; Low, Y.; Ling, M.H. Towards Smart Port Infrastructures: Enhancing Port Activities Using Information and Communications Technology. IEEE Access 2020, 8, 83387–83404. [Google Scholar] [CrossRef]
- Two Projects Led by Valenciaport Win the IAPH World Port Sustainability Awards 2020—Valenciaport. Available online: https://www.valenciaport.com/en/two-projects-led-by-valenciaport-win-the-iaph-world-port-sustainability-awards-2020/ (accessed on 29 June 2020).
- Carpenter, A.; Lozano, R. European Port Cities in Transition; Springer: Berlin, Germany, 2020. [Google Scholar]
- Science for Environment Policy. Indicators for Sustainable Cities. In-Depth Report 12; Produced for the European Commission DG Environment by the Science Communication Unit; UWE: Bristol, UK, 2018; ISBN 978-92-79-85127-8. [Google Scholar]
- Frederiksen, P.; Barankova, Z.; Bauler, T.; Bell, S.; Cassar, L.; Conrad, E.; Eason, K.; Gudmundsson, H.; Sørensen, C.H.; Izakovicova, Z.; et al. POINT—Policy Influence of Indicators; European Commission: Bruxelles, Belgium, 2011; p. 8. [Google Scholar]
- Saisana, M.; Tarantola, S.; Institute for the Protection and Security of the Citizen. Technological and Economic Risk Management Unit. In State-of-the-Art Report on Current Methodologies and Practices for Composite Indicator Development; European Commission, Joint Research Centre, Institute for the Protection and the Security of the Citizen, Technological and Economic Risk Management Unit: Ispra, Italy, 2002; Volume 214. [Google Scholar]
- Mohammadi, A. Critical Infrastructure Management: Ports. In Proceedings of the Canadian Transportation Research Forum 53rd Annual Conference—The Future of Canada’s Transportation System//L’avenir du Systéme de Transport du Canada, Gatineau, QC, Canada, 3–6 June 2018. [Google Scholar]
- Ojo, A.; Curry, E.; Zeleti, F.A. A Tale of Open Data Innovations in Five Smart Cities. In Proceedings of the 2015 48th Hawaii International Conference on System Sciences, Kauai, HI, USA, 5–8 January 2015; pp. 2326–2335. [Google Scholar]
- Ahlgren, B.; Hidell, M.; Ngai, E.C. Internet of Things for Smart Cities: Interoperability and Open Data. IEEE Internet Comput. 2016, 20, 52–56. [Google Scholar] [CrossRef]
- Inkinen, T.; Helminen, R.; Saarikoski, J. Port Digitalization with Open Data: Challenges, Opportunities, and Integrations. J. Open Innov. Technol. Mark. Complex. 2019, 5, 30. [Google Scholar] [CrossRef]
- Carrara, W.; Engbers, W.; Nieuwenhuis, M.; van Steenbergen, E. Analytical Report 4: Open Datain Cities. Available online: https://www.europeandataportal.eu/sites/default/files/edp_analytical_report_n4_-_open_data_in_cities_v1.0_final.pdf (accessed on 29 June 2020).
- Berends, J.; Carrara, W.; Vollers, H. Analytical Report 6: Open Datain Cities 2. Available online: https://www.europeandataportal.eu/sites/default/files/edp_analytical_report_n6_-_open_data_in_cities_2_-_final-clean.pdf (accessed on 29 June 2020).
- INTER-IoT Deliverables. Available online: https://inter-iot.eu/deliverables (accessed on 29 June 2020).
- Activage Project D3.1 Report on IoT European Platforms. Available online: https://www.activageproject.eu/docs/downloads/activage_public_deliverables/ACTIVAGE_D3.1_M3_ReportonIoTEuropeanPlatforms_V1.0.pdf (accessed on 4 June 2020).
- Mulero, R.; Almeida, A.; Azkune, G.; Mainetti, L.; Mighali, V.; Patrono, L.; Rametta, P.; Sergi, I. An AAL system based on IoT technologies and linked open data for elderly monitoring in smart cities. In Proceedings of the 2017 2nd International Multidisciplinary Conference on Computer and Energy Science (SpliTech), Split, Croatia, 12–14 July 2017; pp. 1–6. [Google Scholar]
- Soldatos, J.; Kefalakis, N.; Hauswirth, M.; Serrano, M.; Calbimonte, J.-P.; Riahi, M.; Aberer, K.; Jayaraman, P.P.; Zaslavsky, A.; Žarko, I.P.; et al. OpenIoT: Open Source Internet-of-Things in the Cloud. In Interoperability and Open-Source Solutions for the Internet of Things; Podnar Žarko, I., Pripužić, K., Serrano, M., Eds.; Springer International Publishing: Cham, Switzerland, 2015; pp. 13–25. [Google Scholar]
- The Open Source Platform for Our Smart Digital Future—FIWARE. Available online: https://www.fiware.org/ (accessed on 29 June 2020).
- FIWARE Data Models. Available online: https://fiware-datamodels.readthedocs.io/en/latest/index.html (accessed on 29 June 2020).
- Apache Kafka. Available online: https://kafka.apache.org/ (accessed on 29 June 2020).
- FIWARE Orion Context Broker. Available online: https://fiware-orion.readthedocs.io/en/master/ (accessed on 29 June 2020).
- Saborido, R.; Alba, E. Software systems from smart city vendors. Cities 2020, 101, 102690. [Google Scholar] [CrossRef]
- Santana, E.F.Z.; Chaves, A.P.; Gerosa, M.A.; Kon, F.; Milojicic, D.S. Software Platforms for Smart Cities: Concepts, Requirements, Challenges, and a Unified Reference Architecture. ACM Comput. Surv. 2017, 50, 78. [Google Scholar] [CrossRef]
- Ramparany, F.; Marquez, F.G.; Soriano, J.; Elsaleh, T. Handling smart environment devices, data and services at the semantic level with the FI-WARE core platform. In Proceedings of the 2014 IEEE International Conference on Big Data (Big Data), Washington, DC, USA, 27–30 October 2014; pp. 14–20. [Google Scholar]
- Smart Cities. Available online: https://www.fiware.org/community/smart-cities/ (accessed on 29 June 2020).
- Araujo, V.; Mitra, K.; Saguna, S.; Åhlund, C. Performance evaluation of FIWARE: A cloud-based IoT platform for smart cities. J. Parallel Distrib. Comput. 2019, 132, 250–261. [Google Scholar] [CrossRef]
- Ismagilova, E.; Hughes, L.; Dwivedi, Y.K.; Raman, K.R. Smart cities: Advances in research—An information systems perspective. Int. J. Inf. Manag. 2019, 47, 88–100. [Google Scholar] [CrossRef]
- Albino, V.; Berardi, U.; Dangelico, R.M. Smart Cities: Definitions, Dimensions, Performance, and Initiatives. J. Urban Technol. 2015, 22, 3–21. [Google Scholar] [CrossRef]
- Alavi, A.; Jiao, P.; Buttlar, W.; Lajnef, N. Internet of Things-Enabled Smart Cities: State-of-the-Art and Future Trends. Measurement 2018, 129, 589–606. [Google Scholar] [CrossRef]
- Samih, H. Smart cities and internet of things. J. Inf. Technol. Case Appl. Res. 2019, 21, 3–12. [Google Scholar] [CrossRef]
- Gea, T.; Paradells, J.; Lamarca, M.; Roldan, D. Smart cities as an application of internet of things: Experiences and lessons learnt in barcelona. In Proceedings of the 2013 Seventh International Conference on Innovative Mobile and Internet Services in Ubiquitous Computing, Taichung, Taiwan, 3–5 July 2013; pp. 552–557. [Google Scholar]
- Lanza Calderón, J.; Sánchez González, L.; Gutiérrez Polidura, V.; Galache López, J.A.; Santana Martínez, J.R.; Sotres García, P.; Muñoz Gutiérrez, L. Smart city services over a future Internet platform based on Internet of Things and cloud: The smart parking case. Energies 2016, 9, 719. [Google Scholar] [CrossRef]
- A Novel Architecture for Modelling, Virtualising and Managing the Energy Consumption of Household Appliances|AIM Project|FP7|CORDIS|European Commission. Available online: https://cordis.europa.eu/project/id/224621 (accessed on 29 June 2020).
- Intelligent Use of Buildings’ Energy Information|IntUBE Project|FP7|CORDIS|European Commission. Available online: https://cordis.europa.eu/project/id/224286 (accessed on 29 June 2020).
- Veronica, S.; Alberto, F.; Stefano, B. Internet of Things: Applications and challenges in smart cities. A case study of IBM smart city projects. Bus. Process Manag. J. 2016, 22, 357–367. [Google Scholar] [CrossRef]
- Hao, L.; Lei, X.; Yan, Z.; ChunLi, Y. The application and implementation research of smart city in China. In Proceedings of the 2012 International Conference on System Science and Engineering (ICSSE), Dalian, China, 30 June–2 July 2012; pp. 288–292. [Google Scholar]
- Ilin, I.; Jahn, C.; Weigell, J.; Kalyazina, S. Digital Technology Implementation for Smart City and Smart Port Cooperation. In Proceedings of the International Conference on Digital Technologies in Logistics and Infrastructure (ICDTLI 2019), St. Petersburg, Russia, 4–5 April 2019; Atlantis Press: St. Petersburg, Russia, 2019; pp. 493–496. [Google Scholar]
- Molavi, A.; Lim, G.J.; Race, B. A Framework for Building a Smart Port and Smart Port Index. Int. J. Sustain. Transp. 2020, 14, 686–700. [Google Scholar] [CrossRef]
- Moustaka, V.; Vakali, A.; Anthopoulos, L. A Systematic Review for Smart City Data Analytics. ACM Comput. Surv. 2018, 51, 1–41. [Google Scholar] [CrossRef]
- Nardo, M.; Saisana, M.; Saltelli, A.; Tarantola, S. Tools for composite indicators building. European Commission Joint Research Centre. Inst. Prot. Secur. Citiz. Econom. Stat. Support Antifraud Unit I-21020 Ispra Italy Rep. Number EUR 2005, 21682, 140. [Google Scholar]
- Saisana, M. Composite indicators: A review. In Proceedings of the Second Workshop on Composite Indicators of Country Performance, 26–27 February 2004; OECD: Paris, France, 2004. [Google Scholar]
- Bandura, R. A Survey of Composite Indices Measuring Country Performance: 2008 Update; (UNDP/ODS Work. Pap.); United Nations Development Programme: Ney York, NY, USA, 2008; Volume 96. [Google Scholar]
- Alam, M.; Dupras, J.; Messier, C. A framework towards a composite indicator for urban ecosystem services. Ecol. Indic. 2016, 60, 38–44. [Google Scholar] [CrossRef]
- Amadi, M.; Cadbury, M.; Cisneros, C.E.; Coleman, C.; Freiche, D.-H.; Ganswindt, T.; Gutierrez-Campos, F.; Hands, G.; Harriss-Olson, M.; Kailis, G.M.; et al. 2001 Environmental Sustainability Index. In Proceedings of the An Initiative of the Global Leaders of Tomorrow Environment Task Force, World Economic Forum Annual Meeting 2001, Davos, Switzerland, 27 January 2001. [Google Scholar]
- PIXEL Project D5.1 Environmental Factors and Mapping to Pilots. Available online: https://pixel-ports.eu/wp-content/uploads/2020/05/D5.1-Environmental-aspects-and-mapping-to-pilots.pdf (accessed on 29 June 2020).
- Tarantola, S.; Saisana, M.; Saltelli, A. Internal Market Index 2002: Technical Details of the Methodology; Inst. Prot. Secur. Citiz. Technol. Econ. Risk Manag. Unit I-21020 Ispra Italy; European Commission Joint Research Centre: Ispra, Italy, 2002. [Google Scholar]
- Economic Sentiment Indicator—Eurostat. Available online: https://ec.europa.eu/eurostat/web/products-datasets/product?code=teibs010 (accessed on 29 June 2020).
- Human Development Index (HDI)|Human Development Reports. Available online: http://hdr.undp.org/en/content/human-development-index-hdi (accessed on 29 June 2020).
- Conceição, P. Human Development Report 2019. Beyond Income, beyond Averages, beyond Today: Inequalities in Human Development in the 21st Century; United Nations Development Programme: New York, NY, USA, 2019. [Google Scholar]
- Fagerberg, J. Europe at the Crossroads: The Challenge from Innovation-Based Growth. In Centre for Technology, Innovation and Culture, University of Oslo, Working Papers on Innovation Studies; University of Oslo: Oslo, Norway, 2001; pp. 45–60. ISBN 978-0199241095. [Google Scholar]
- COIN|Competence Centre on Composite Indicators and Scoreboards. Available online: https://composite-indicators.jrc.ec.europa.eu/ (accessed on 29 June 2020).
- CITYkeys Project. Available online: http://www.citykeys-project.eu/citykeys/home (accessed on 29 June 2020).
- Bosch, P.; Jongeneel, S.; Rovers, V.; Neumann, H.-M.; Airaksinen, M.; Huovila, A. CITYkeys D1-4 Indicators for Smart City Projects and Smart Cities. Available online: http://nws.eurocities.eu/MediaShell/media/CITYkeysD14Indicatorsforsmartcityprojectsandsmartcities.pdf (accessed on 29 June 2020).
- Make Healthy Choices Easier Options—Scientific American. Available online: https://www.scientificamerican.com/podcast/episode/make-healthy-choices-easier-options-12-09-20/ (accessed on 29 June 2020).
- Airaksinen, M.; Pinto-Seppä, I.; Huovila, A.; Neumann, H.-M.; Iglar, B.; Bosch, P. Smart city performance measurement framework CITYkeys. In Proceedings of the 2017 International Conference on Engineering, Technology and Innovation, Madeira Island, Portugal, 27–29 June 2017; Mendonca, J.P., Jardim-Goncalves, R., Martins, J., Zarli, A., Marques, M., Pallot, M., Eds.; Wiley: Hoboken, NJ, USA, 2018; pp. 718–723. [Google Scholar]
- FIWARE E Interoperabilidad Para Smart Cities. Available online: https://www.apegr.org/images/descargas/J7OctESMARTCITY/2PresentacionFIWARE.pdf (accessed on 29 June 2020).
- Chen, G.; Govindan, K.; Yang, Z. Managing truck arrivals with time windows to alleviate gate congestion at container terminals. Int. J. Prod. Econ. 2013, 141, 179–188. [Google Scholar] [CrossRef]
- Patel, N.; Mukherjee, A.B. Assessment of network traffic congestion through Traffic Congestability Value (TCV): A new index. Bull. Geogr. Socio Econ. Ser. 2015, 30, 123–134. [Google Scholar] [CrossRef][Green Version]
- Aimsun Live: Model Every Movement at Every Moment. Available online: https://www.aimsun.com/aimsun-live/ (accessed on 29 June 2020).
- PTV Vissim: Traffic Simulation Software. Available online: https://www.ptvgroup.com/en/solutions/products/ptv-vissim/ (accessed on 29 June 2020).
- IBM Traffic Prediction Tool. Available online: https://researcher.watson.ibm.com/researcher/view_group_subpage.php?id=1248 (accessed on 29 June 2020).
- Veins: The Open Source Vehicular Network Simulation Framework. Available online: https://veins.car2x.org/ (accessed on 29 June 2020).
- Mena-Yedra, R.; Gavaldà, R.; Casas, J. Adarules: Learning rules for real-time road-traffic prediction. Transp. Res. Procedia 2017, 27, 11–18. [Google Scholar] [CrossRef]
- Karimpour, M.; Karimpour, A.; Kompany, K.; Karimpour, A. Online Traffic Prediction Using Time Series: A Case study. In Integral Methods in Science and Engineering, Volume 2: Practical Applications; Constanda, C., Dalla Riva, M., Lamberti, P.D., Musolino, P., Eds.; Springer International Publishing: Cham, Switzerland, 2017; pp. 147–156. [Google Scholar]
- PIXEL Project. Available online: https://pixel-ports.eu (accessed on 29 June 2020).
- Lacalle, I.; Llorente, M.Á.; Palau, C.E. Towards Environmental Impact Reduction Leveraging IoT Infrastructures: The PIXEL Approach. In Internet and Distributed Computing Systems; Montella, R., Ciaramella, A., Fortino, G., Guerrieri, A., Liotta, A., Eds.; Springer International Publishing: Cham, Switzerland, 2019; pp. 33–45. [Google Scholar]
- Reference Architectural Model Industrie 4.0 (rami 4.0). Available online: https://www.plattform-i40.de/PI40/Navigation/EN/Home/home.html (accessed on 29 June 2020).
- Industrial Internet Consourtium The Industrial Internet of Things. Volume G1: Reference Architecture; IIC PUB G1 V1. 80 20170131; Internet Consortium: Needham, MA, USA, 2017; Volume 58. [Google Scholar]
- Sethi, P.; Sarangi, S.R. Internet of things: Architectures, protocols, and applications. J. Electr. Comput. Eng. 2017, 2017, 1–25. [Google Scholar] [CrossRef]
- Containers & Containerization—The Pros and Cons. Available online: https://spin.atomicobject.com/2019/05/24/containerization-pros-cons/ (accessed on 29 June 2020).
- Pyngsi Framework. Available online: https://github.com/pixel-ports/pyngsi (accessed on 29 June 2020).
- PIXEL Project D6.2 PIXEL Information System Architecture and Design—Version 2. Available online: https://pixel-ports.eu/wp-content/uploads/2020/05/D6.2-PIXEL-Information-System-architecture-and-design-v2.pdf (accessed on 29 June 2020).
- Apache Hive. Available online: https://hive.apache.org/ (accessed on 29 June 2020).
- MySQL. Available online: https://www.mysql.com/ (accessed on 29 June 2020).
- MariaDB Server. Available online: https://mariadb.org/ (accessed on 29 June 2020).
- Elasticsearch. Available online: https://www.elastic.co/elasticsearch/ (accessed on 29 June 2020).
- MongoDB. Available online: https://www.mongodb.com/ (accessed on 29 June 2020).
- Node-RED. Available online: https://nodered.org/ (accessed on 29 June 2020).
- Swarm Mode Overview | Docker Documentation. Available online: https://docs.docker.com/engine/swarm/ (accessed on 29 June 2020).
- Kubernetes. Available online: https://kubernetes.io/ (accessed on 29 June 2020).
- PIXEL Project D6.3 PIXEL Data Acquisition, Information Hub and Data Representation v1. Available online: https://pixel-ports.eu/wp-content/uploads/2020/05/D6.3_PIXEL-data-acquisition-information-hub-and-data-representation-v1.pdf (accessed on 29 June 2020).
- Overview of Docker Compose|Docker Documentation. Available online: https://docs.docker.com/compose/ (accessed on 29 June 2020).
- Kibana: Explore, Visualize, Discover Data. Available online: https://www.elastic.co/kibana (accessed on 29 June 2020).
- Grafana: The Open Observability Platforms. Available online: https://grafana.com/ (accessed on 29 June 2020).
- Vue.js. Available online: https://vuejs.org/ (accessed on 29 June 2020).
- PIXEL Project D5.2 PEI Definition and Algorithms v1. Available online: https://pixel-ports.eu/wp-content/uploads/2020/05/D5.2-PEI-Definition-and-Algorithms-v1.pdf (accessed on 29 June 2020).
- KeyPerformanceIndicator—FIWARE Data Models. Available online: https://fiware-datamodels.readthedocs.io/en/latest/KeyPerformanceIndicator/doc/spec/index.html (accessed on 29 June 2020).
- What Is a Container?|App Containerization|Docker. Available online: https://www.docker.com/resources/what-container (accessed on 29 June 2020).
- Garcia-Alonso, L.; Moura, T.G.Z.; Roibas, D. The effect of weather conditions on port technical efficiency. Mar. Policy 2020, 113, 103816. [Google Scholar] [CrossRef]
- Shang, P.; Li, R.; Liu, Z.; Li, X. Inclement weather impacts on urban traffic conditions. In Proceedings of the 15th COTA International Conference of Transportation Professionals Chinese Overseas Transportation Association (COTA) Beijing Jiaotong UniversityTransportation Research Board Institute of Transportation Engineers (ITE) American Society of Civil Engineers, Beijing, China, 24–27 July 2015; pp. 2213–2227. [Google Scholar]
- Koźlak, A.; Wach, D. Causes of traffic congestion in urban areas. Case of Poland. In Proceedings of the SHS Web of Conferences, Samara, Russia, 26–27 November 2018; Volume 57, p. 1019. [Google Scholar]
- TrafficThess—LIVE Traffic in Thessaloniki, Greece. Available online: https://www.trafficthess.imet.gr/ (accessed on 29 June 2020).
- National Observatory of Athens—Meteo—Stations’ Live Data and Database. Available online: http://stratus.meteo.noa.gr/front (accessed on 29 June 2020).
- How to Use Smart Data Models in Your Projects—FIWARE Data Models. Available online: https://fiware-datamodels.readthedocs.io/en/latest/howto/index.html (accessed on 29 June 2020).
- Gan, X.; Fernandez, I.C.; Guo, J.; Wilson, M.; Zhao, Y.; Zhou, B.; Wu, J. When to use what: Methods for weighting and aggregating sustainability indicators. Ecol. Indic. 2017, 81, 491–502. [Google Scholar] [CrossRef]
- Wilson, M.C.; Wu, J. The problems of weak sustainability and associated indicators. Int. J. Sustain. Dev. World Ecol. 2017, 24, 44–51. [Google Scholar] [CrossRef]
- Kumar, S.V.; Vanajakshi, L. Short-term traffic flow prediction using seasonal ARIMA model with limited input data. Eur. Transp. Res. Rev. 2015, 7, 21. [Google Scholar] [CrossRef]
- Prophet: Forecastig at Scale. Available online: https://facebook.github.io/prophet/ (accessed on 29 June 2020).
- PIXEL Project D4.4 PredictiveAlgorithms v2. Available online: https://pixel-ports.eu/wp-content/uploads/2020/05/PIXEL_D4.4_Predictive-Algorithms_v2.0_Final.pdf (accessed on 29 June 2020).
- Project Jupyter. Available online: https://jupyter.org/ (accessed on 29 June 2020).
- FIWARE Cygnus. Available online: https://fiware-cygnus.readthedocs.io/en/latest/ (accessed on 29 June 2020).
- NGSIElasticsearchSink—FIWARE Cygnus. Available online: https://fiware-cygnus.readthedocs.io/en/latest/cygnus-ngsi/flume_extensions_catalogue/ngsi_elasticsearch_sink/index.html (accessed on 29 June 2020).
- Node.js. Available online: https://nodejs.org/ (accessed on 29 June 2020).
- Elasticsearch Node.js Client [7.x]. Available online: https://www.elastic.co/guide/en/elasticsearch/client/javascript-api/current/index.html (accessed on 29 June 2020).
- Apache HTTP Server Project. Available online: https://httpd.apache.org/ (accessed on 29 June 2020).
- Everything You Need to Know about Min-Max Normalization: A Python Tutorial. Available online: https://towardsdatascience.com/everything-you-need-to-know-about-min-max-normalization-in-python-b79592732b79 (accessed on 29 June 2020).
- OpenStreetMap. Available online: https://www.openstreetmap.org/ (accessed on 29 June 2020).
- Leaflet—A JavaScript Library for Interactive Maps. Available online: https://leafletjs.com/ (accessed on 29 June 2020).
- AmCharts: JavaScript Charts & Maps. Available online: https://www.amcharts.com/ (accessed on 29 June 2020).
- FIWARE Catalogue. Available online: https://www.fiware.org/developers/catalogue/ (accessed on 29 June 2020).
- Findlow, S. ‘Citizenship’ and ‘Democracy Education’: Identity politics or enlightened political participation? Br. J. Sociol. Educ. 2019, 40, 1004–1013. [Google Scholar] [CrossRef]
- Mouradian, C.; Naboulsi, D.; Yangui, S.; Glitho, R.H.; Morrow, M.J.; Polakos, P.A. A comprehensive survey on fog computing: State-of-the-art and research challenges. IEEE Commun. Surv. Tutor. 2017, 20, 416–464. [Google Scholar] [CrossRef]


| Requirement | Type 1 | Coverage by Module |
|---|---|---|
| Short- and long-term storage of the data | Technical | Data storage |
| Automatic scheduled execution | Technical | Orchestrator |
| Flexibility for filtering, selecting the data | Technical | Data storage |
| Semantic interoperability and common syntax | Technical | Data Broker, agents |
| Agile integration and deployment | Technical | Containerisation |
| To be able to add new data sources | Functional | Data Broker, agents |
| To train a predictive model and use it for inferring CI | Functional | Training, inference |
| To setup the weights and methods to calculate the CI | Functional | CI, orchestrator, UI |
| To visualise the current value of the indicator (real-time) | Usability | UI – User interface |
| To visualise the evolution of the indicator during a day | Usability | UI |
| To visualise the predicted evolution of the indicator | Usability | UI, training, inference |
| To make the framework as configurable as possible | Usability | UI |
| Event to Model | Actor Intervening | Relevant Data | Further Usage of Index |
|---|---|---|---|
| Traffic congestion at the interface of the port with the city—TCI | Port Authority | - Traffic at the gates of the port - Vessels berthed at the port | Internal process- and relationship-centric practices, leading to less traffic and pollution. |
| City Municipality | - Traffic in the city - Weather in the city | Monitoring and auditing. | |
| Public/citizens | Knowledge and port acceptance. |
| Data Source | Technology Used | Relevant Parameters | Refresh Frequency of Pre-Processed Data | Units | History Available |
|---|---|---|---|---|---|
| Gates’ traffic | RFID | Vehicles | Per hour | Vehicles/hour | April 2018 |
| Weather | Meteo station | Temp, wind speed, precipitation intensity | Per day | °C, kmh, mm | September 2018 |
| City traffic | GPS | Average speed | Per hour | Kmh/vehicle | April 2018 |
| Vessels in port | Vessel calls | Time ranges | Per hour | # of vessels | April 2018 |
| Data | Agent Type | Format | Transformation | RT | kpiName |
|---|---|---|---|---|---|
| Gates traffic—Historic | Active over static file | CSV | Pre-processing explained in Section 3.3. | - | Kpi-traffic-gate-10A/16 |
| Gates traffic—real-time | Active over dynamic source | REST API | Filtering, grouping and JSON conversion. | 60′ | Kpi-traffic-gate-10A/16 |
| City traffic | Active over external website | CSV | Pre-processing explained in Section 3.3 | 60′ | Kpi-traffic-city |
| Weather | Active over external website | CSV | Pre-processing explained in Section 3.3 | 24 h | Kpi-weather-temperature -windSpeed -precipIntensity |
| Vessel count—historic | Active over static file | CSV | Pre-processing explained in Section 3.3 | - | Kpi-vessel-count |
| Vessel count—real-time | Active over dynamic source | REST API | Filtering, grouping and JSON conversion. | 60′ | Kpi-vessel-count |
| Source | Correlation | Explanation |
|---|---|---|
| Average speed in nearby streets | −19.2% | As the cars move slower (less speed), the more traffic at the gates is experienced, being the most statistically relevant factor influencing the congestion |
| Number of vessels berthed | +11.7% | More vessels at the berth, more traffic at the gates. Although the correlation is not high, this % is significant. |
| Temperature | −7.7% | The colder, the more traffic, which under a logical point of view: summer-less traffic. Not much statistical impact. |
| Wind speed | −8.6% | The winder, the less traffic, but with no relevant relation to be conclusive. |
| Precipitation intensity | +3.7% | Very loosely coupled, almost no statistical correlation. |
| Item | Specifications |
|---|---|
| CPU | 4 CPUs x Intel® Xeon® CPU E3-1220 v5 @ 3.00 GHz |
| Storage Memory | HDD 100 GB |
| RAM Memory | 16.05 GB |
| Cluster | FUJITSU PRIMERGY TX1330 M2 |
| Item | Specifications/Version |
|---|---|
| Server OS | Ubuntu Server 18.04.4 LTS |
| Java | OpenJDK 1.8.0_252 |
| Apache Maven | 3.5.4 |
| Node.js + npm | 12.18.1 LTS + 6.14.5 |
| Python + pip | 3.8.3 + 20.1.1 |
| Docker + Compose | 18.09.7 + 1.17.1 |
| Apache Server | 2.4.43 |
| Elasticsearch | 7.8.0 |
| MongoDB | 3.6.3 |
| FIWARE Orion | 3.4.0 |
| FIWARE Cygnus | 2.2.0 |
| Development IDEs | Eclipse IDE for Enterprise Java Developers (v. 2020-06) Visual Studio Code (version 1.46) |
| Sc.# | Date | TCI Value | Explanation and Evolution |
|---|---|---|---|
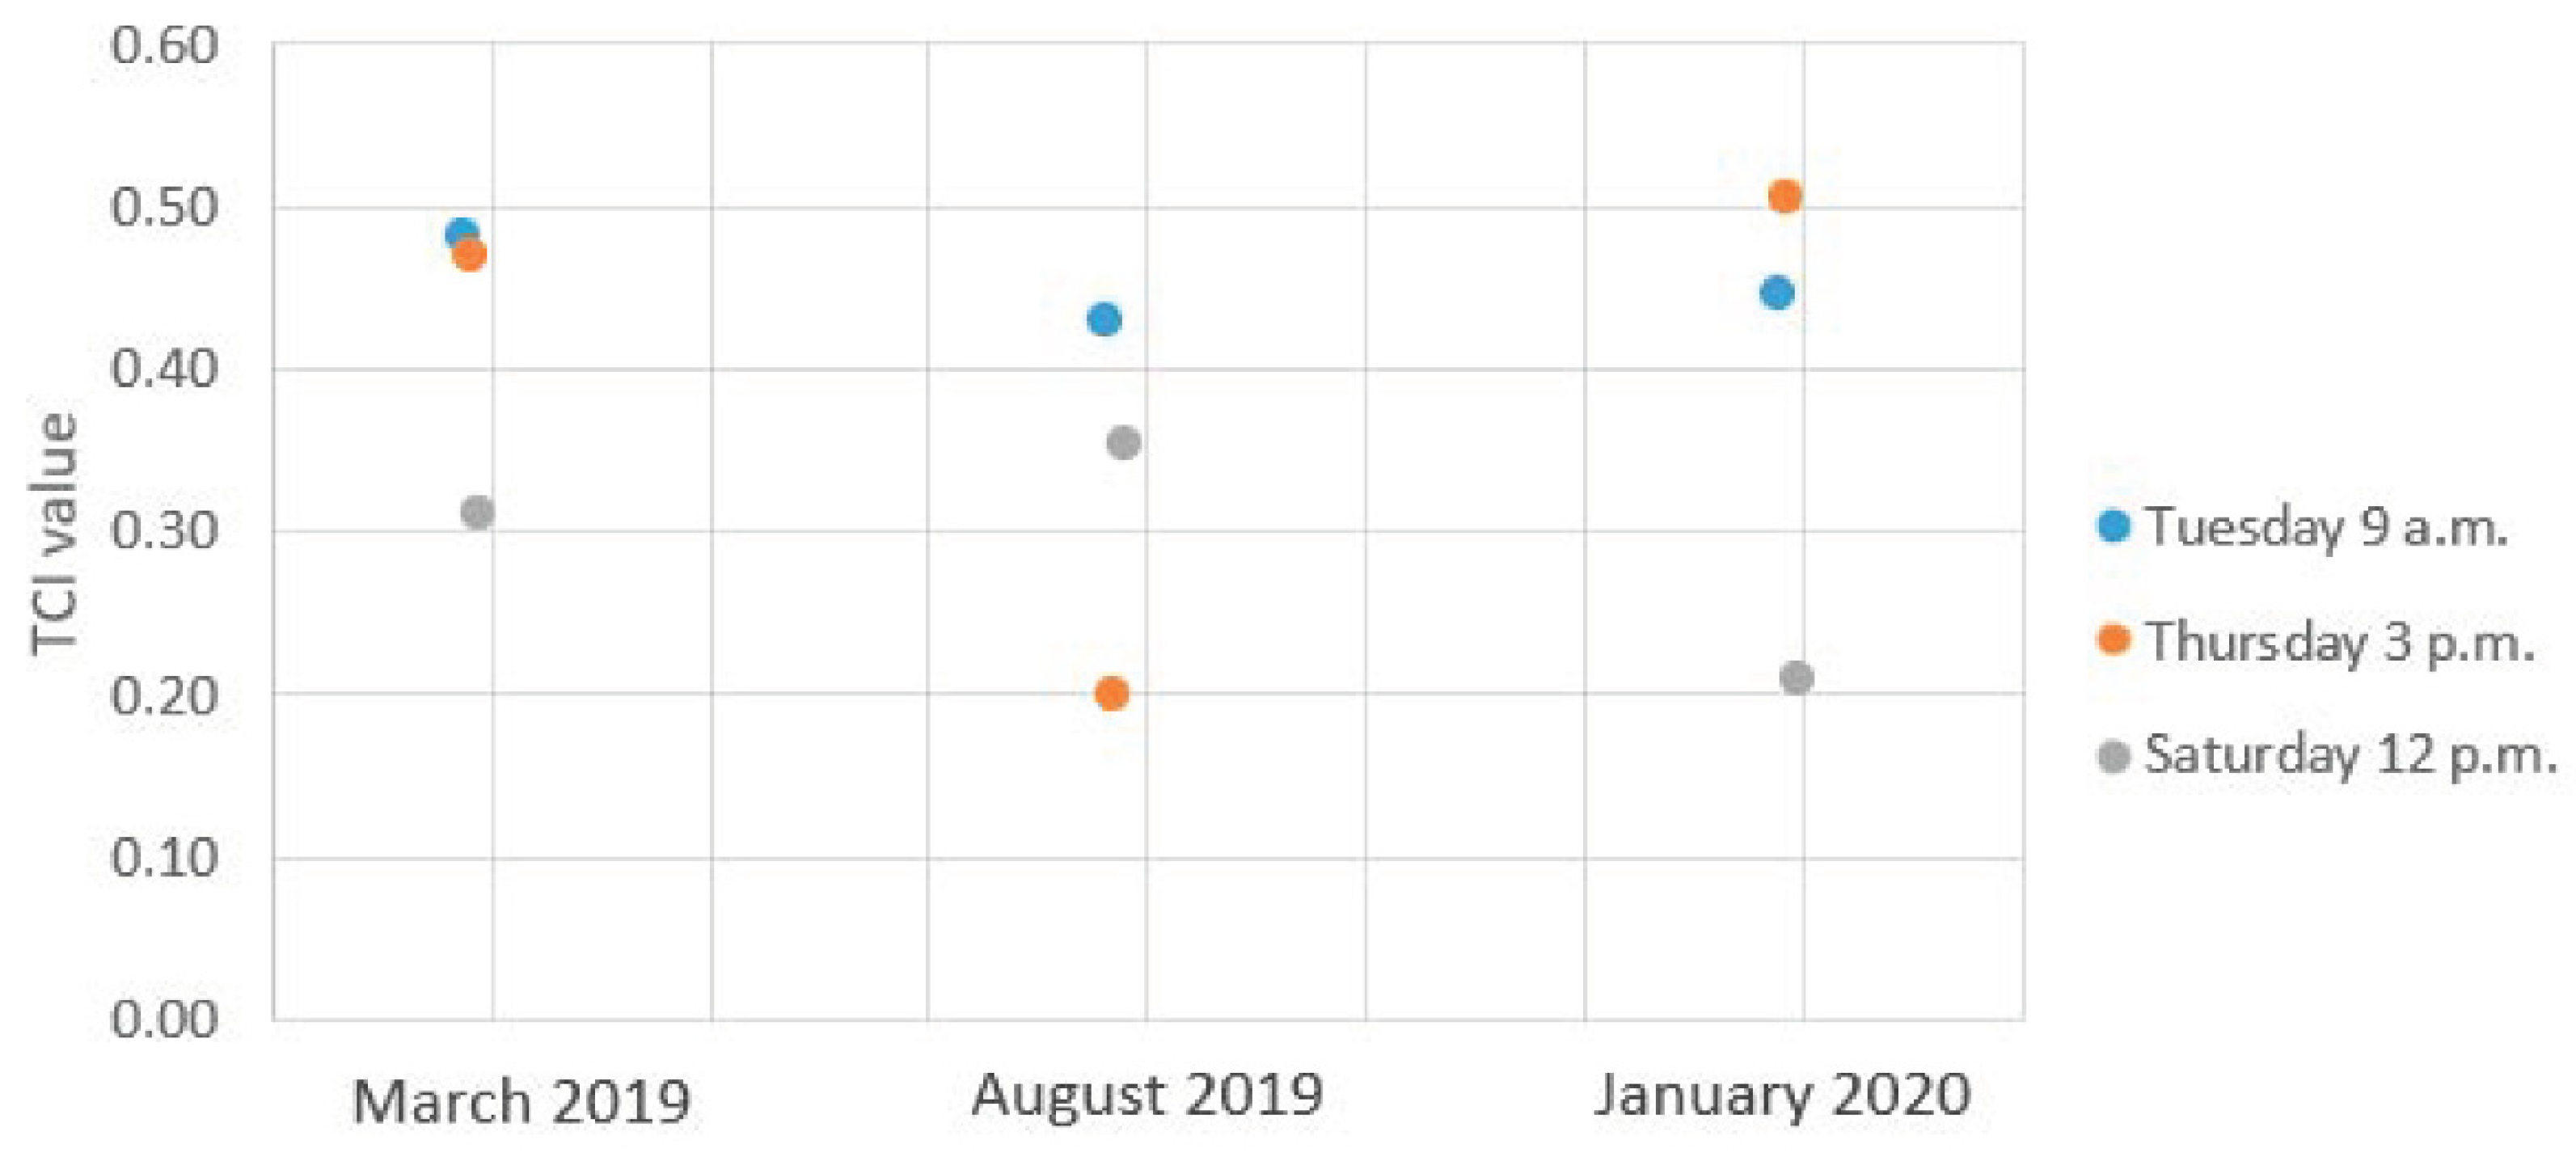
| 1.1 | 19 March 2019 9 a.m. | 0.48240252 | Peak is observed at the hour of the scenario execution, which is aligned with the EDA and the expected situation. The curve is a bit more flattened than logically expected, but downwards timing seems proper. |
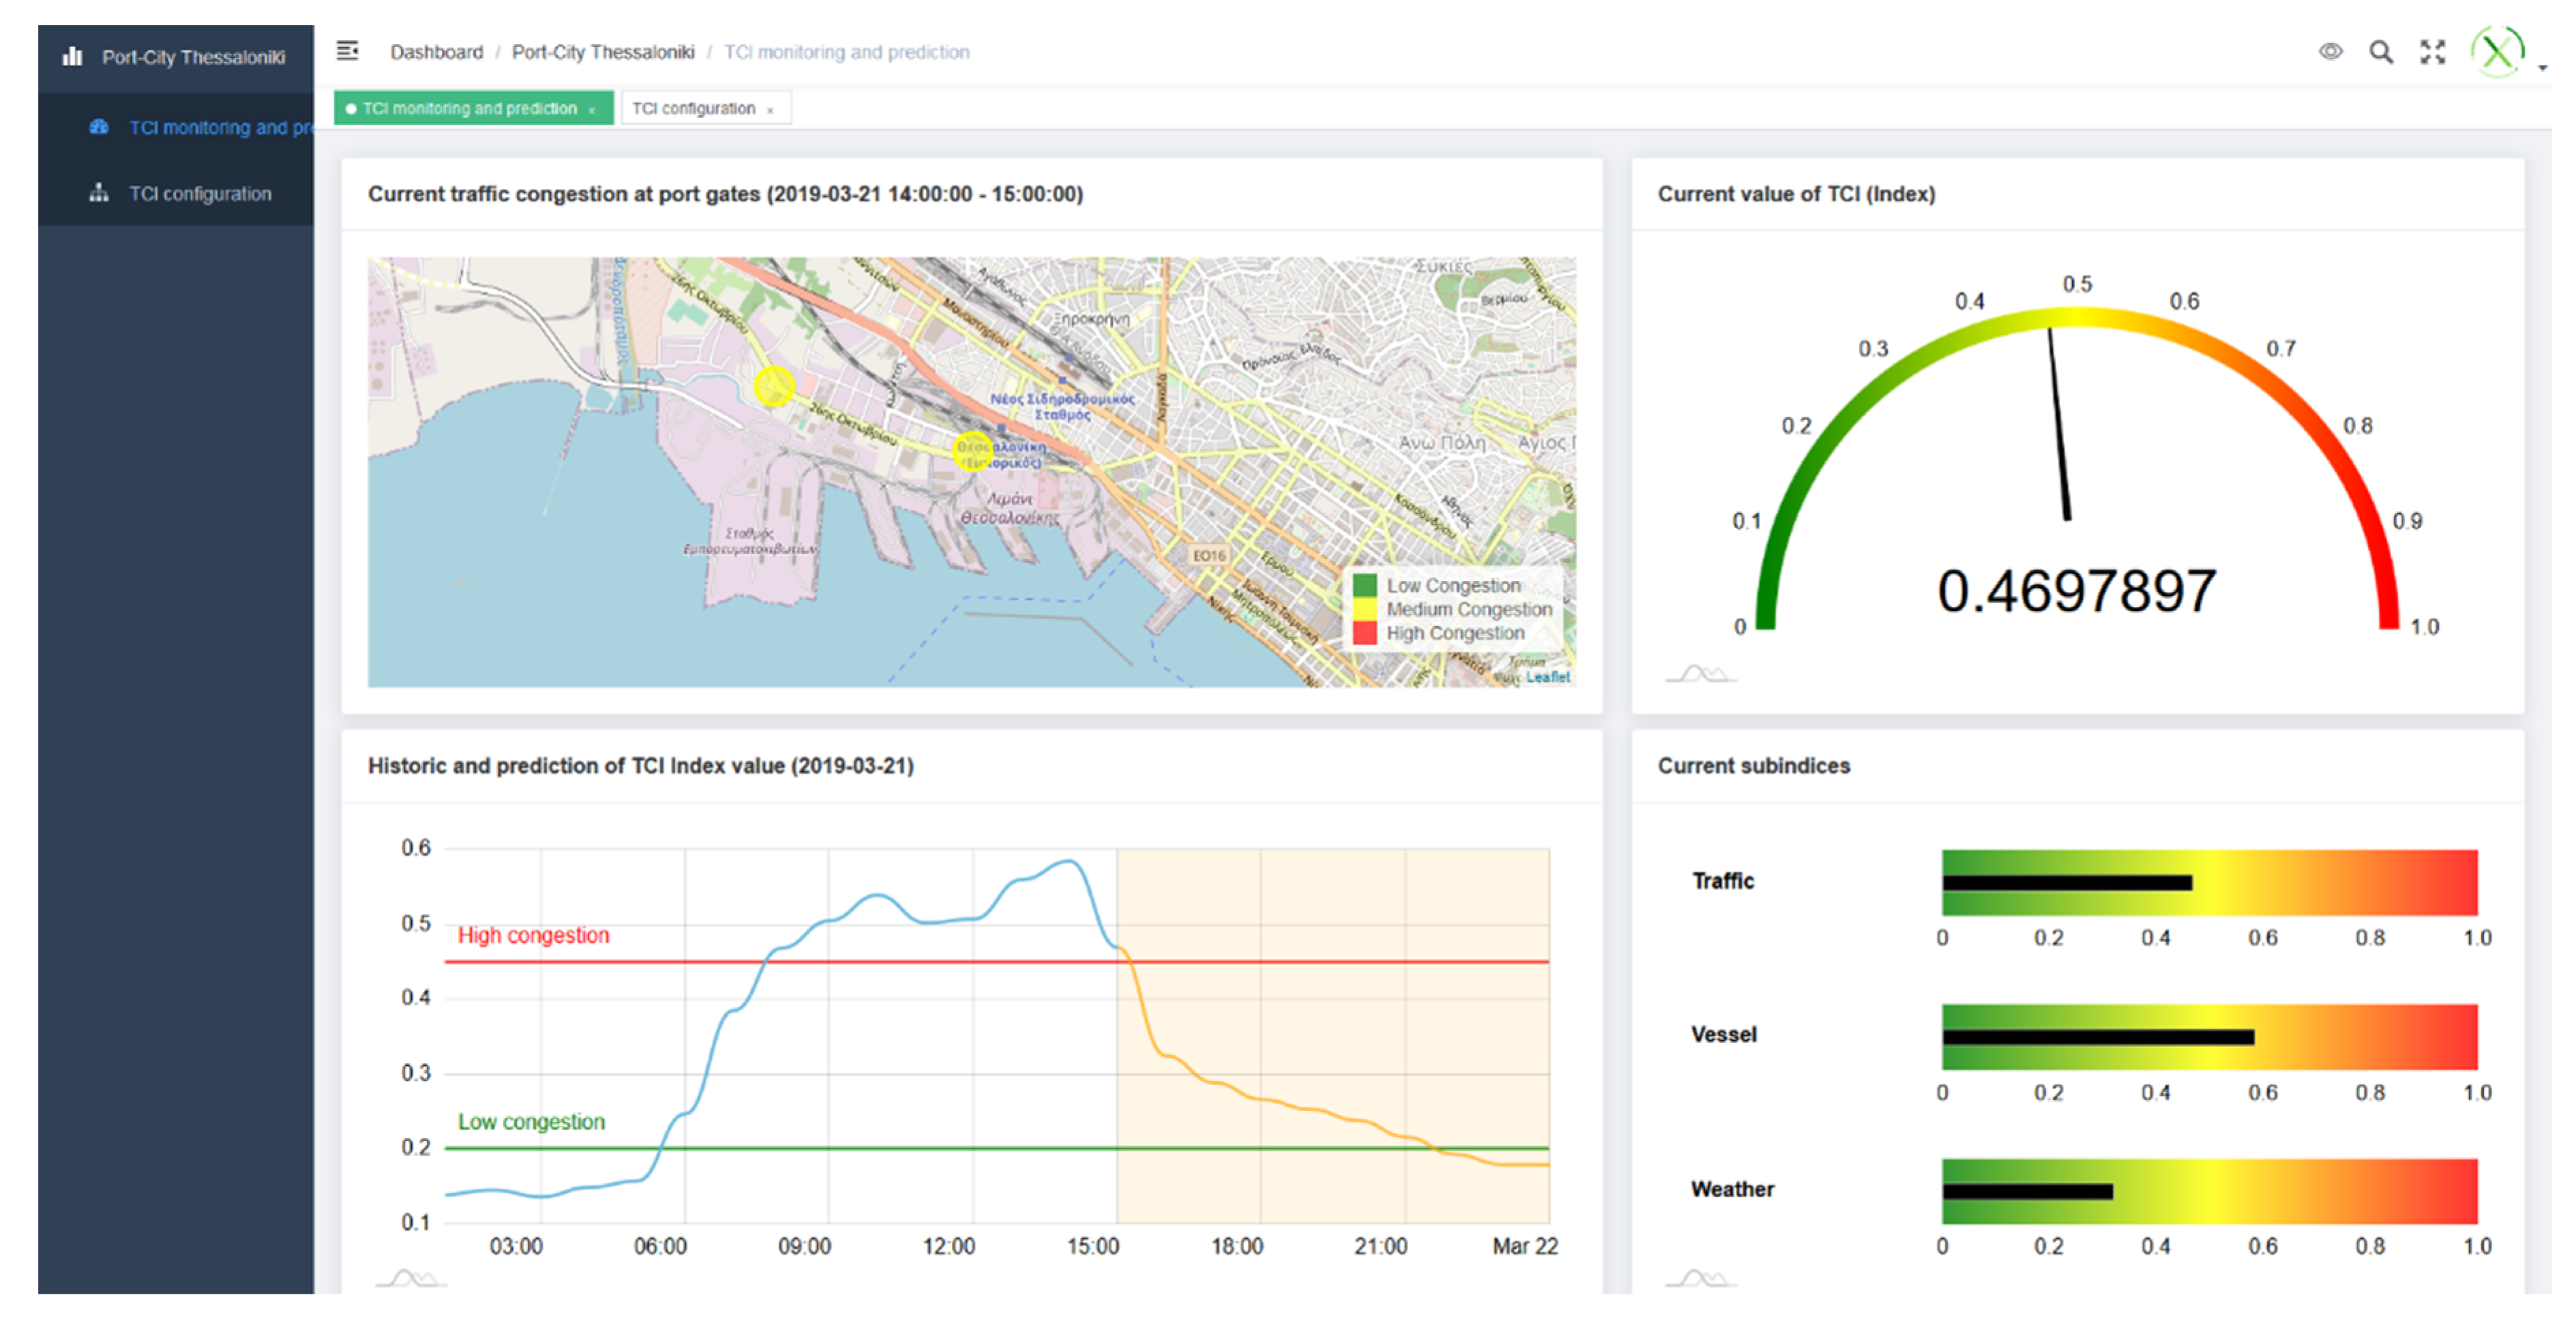
| 1.2 | 21 March 2019 3 p.m. | 0.46978970 | The hour of the scenario is exactly experiencing the start of congestion dawn, where the peak was reach just before 3 p.m. The prediction curve looks proper. |
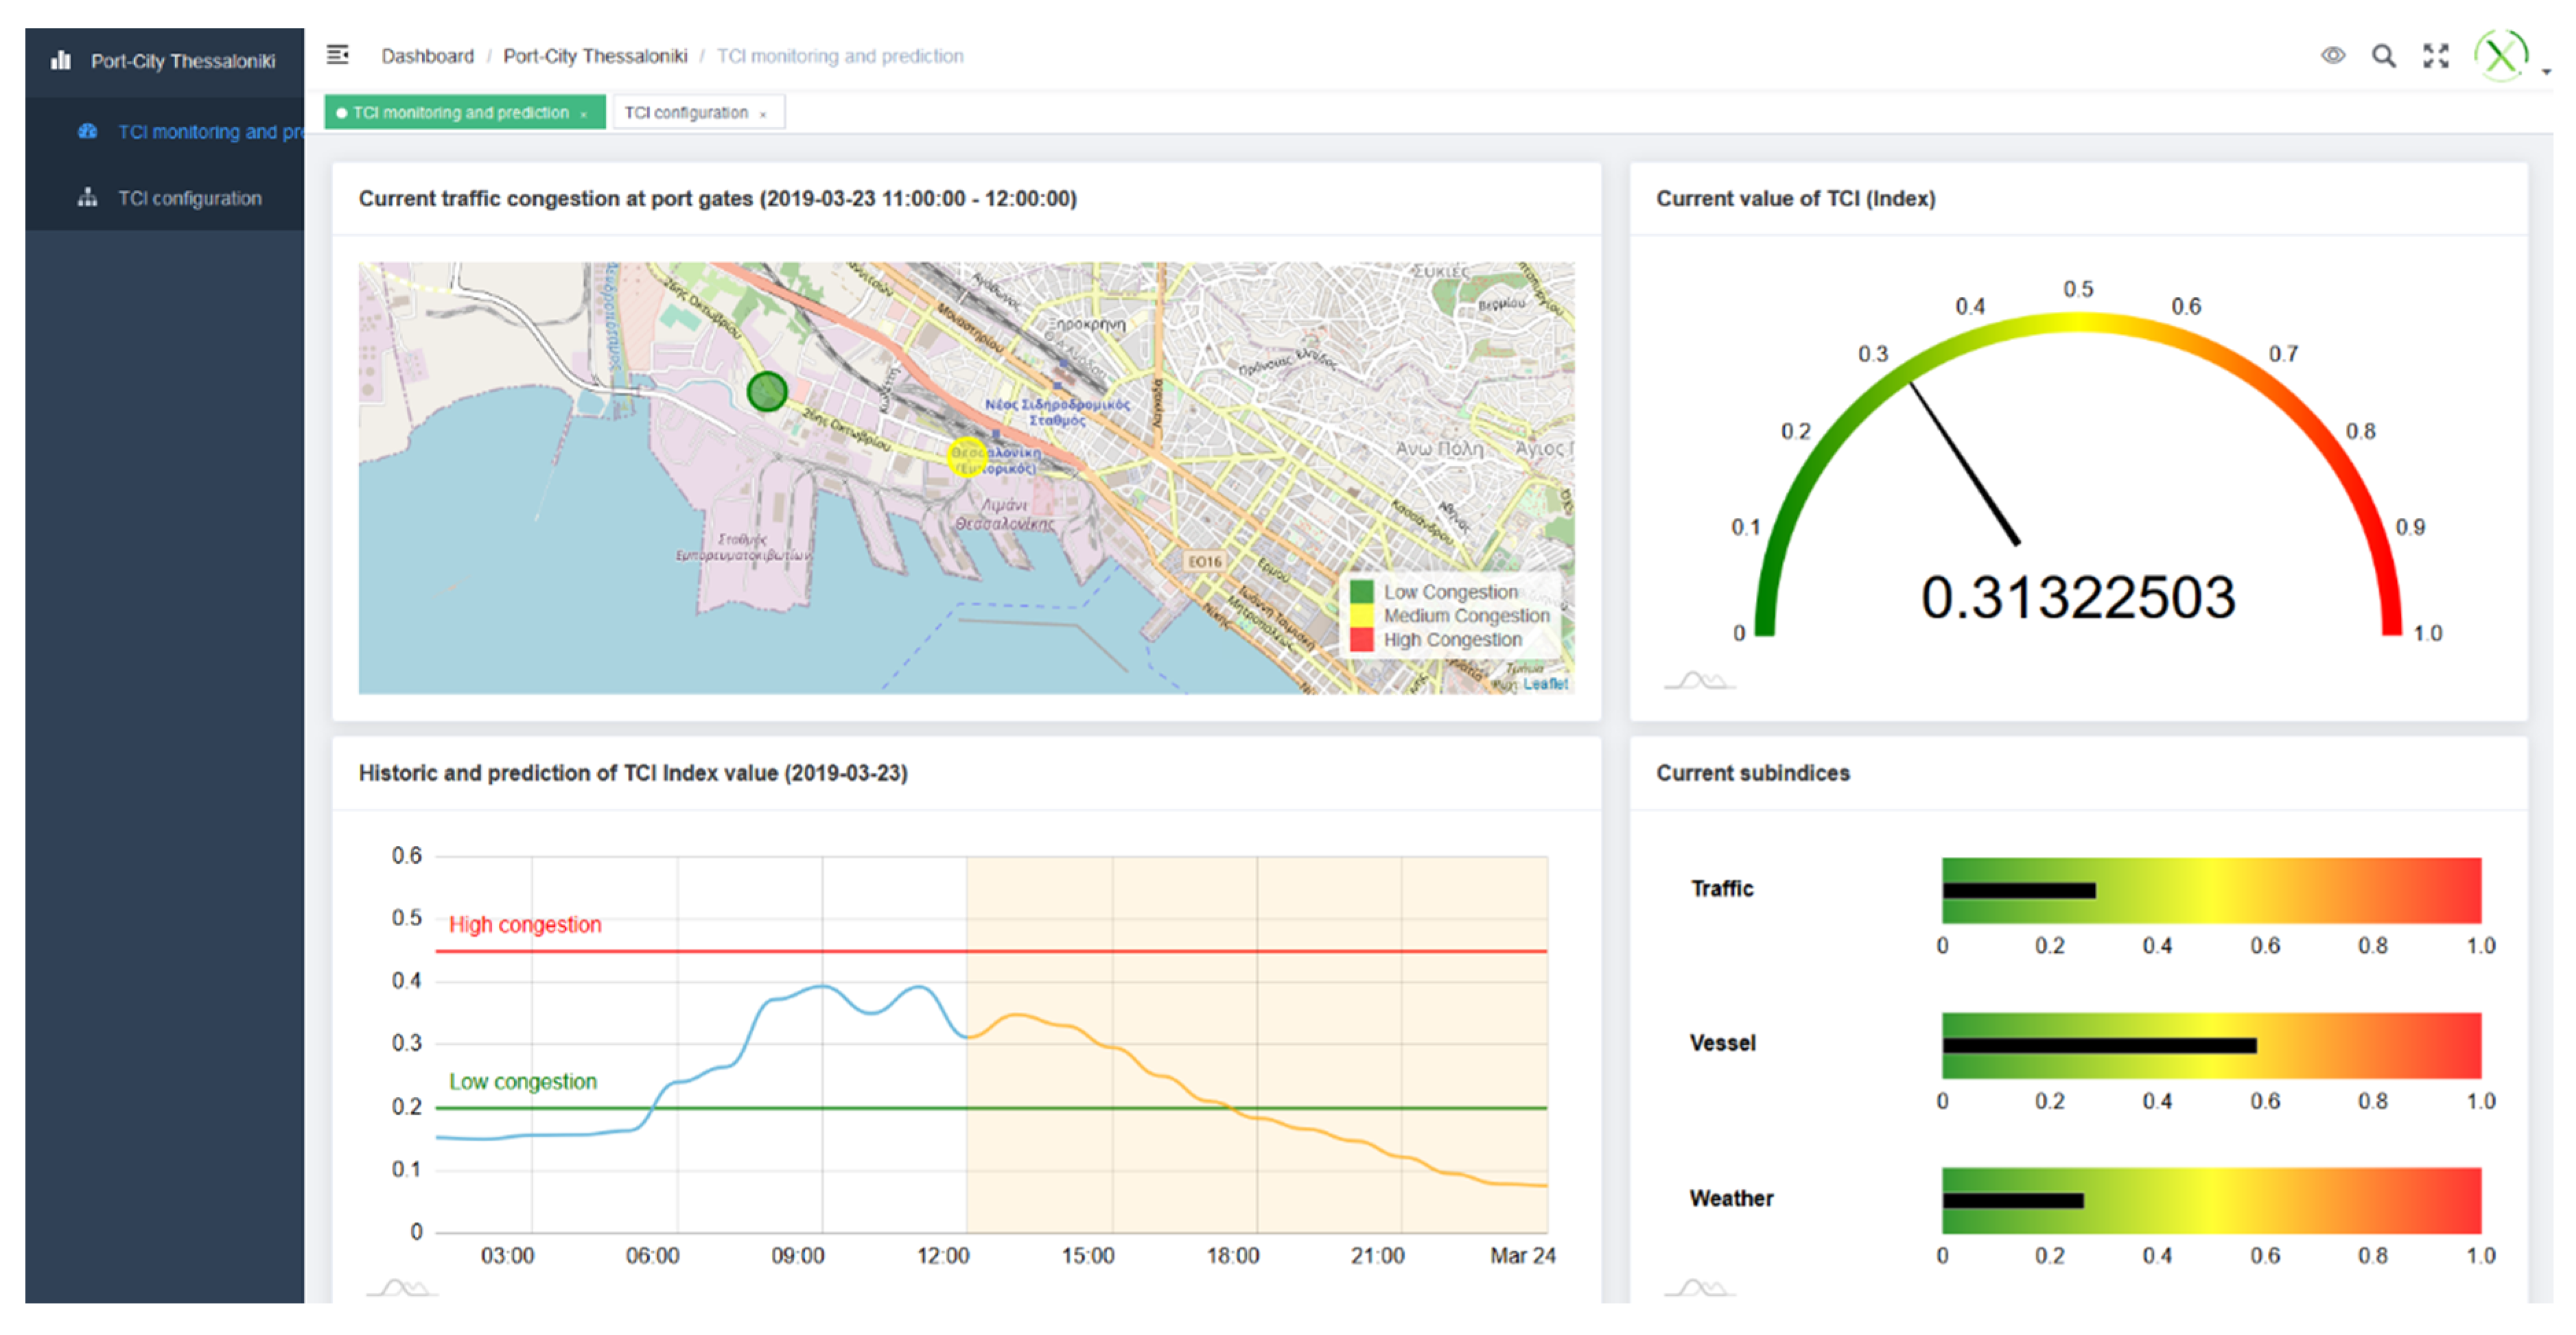
| 1.3 | 23 March 2019 12 p.m. | 0.31322503 | Scenario 1.3 can be trusted as well as the prediction for the central hours (9 to 15) experiences usual up and downs and it is kept between mid-congestion margins. |
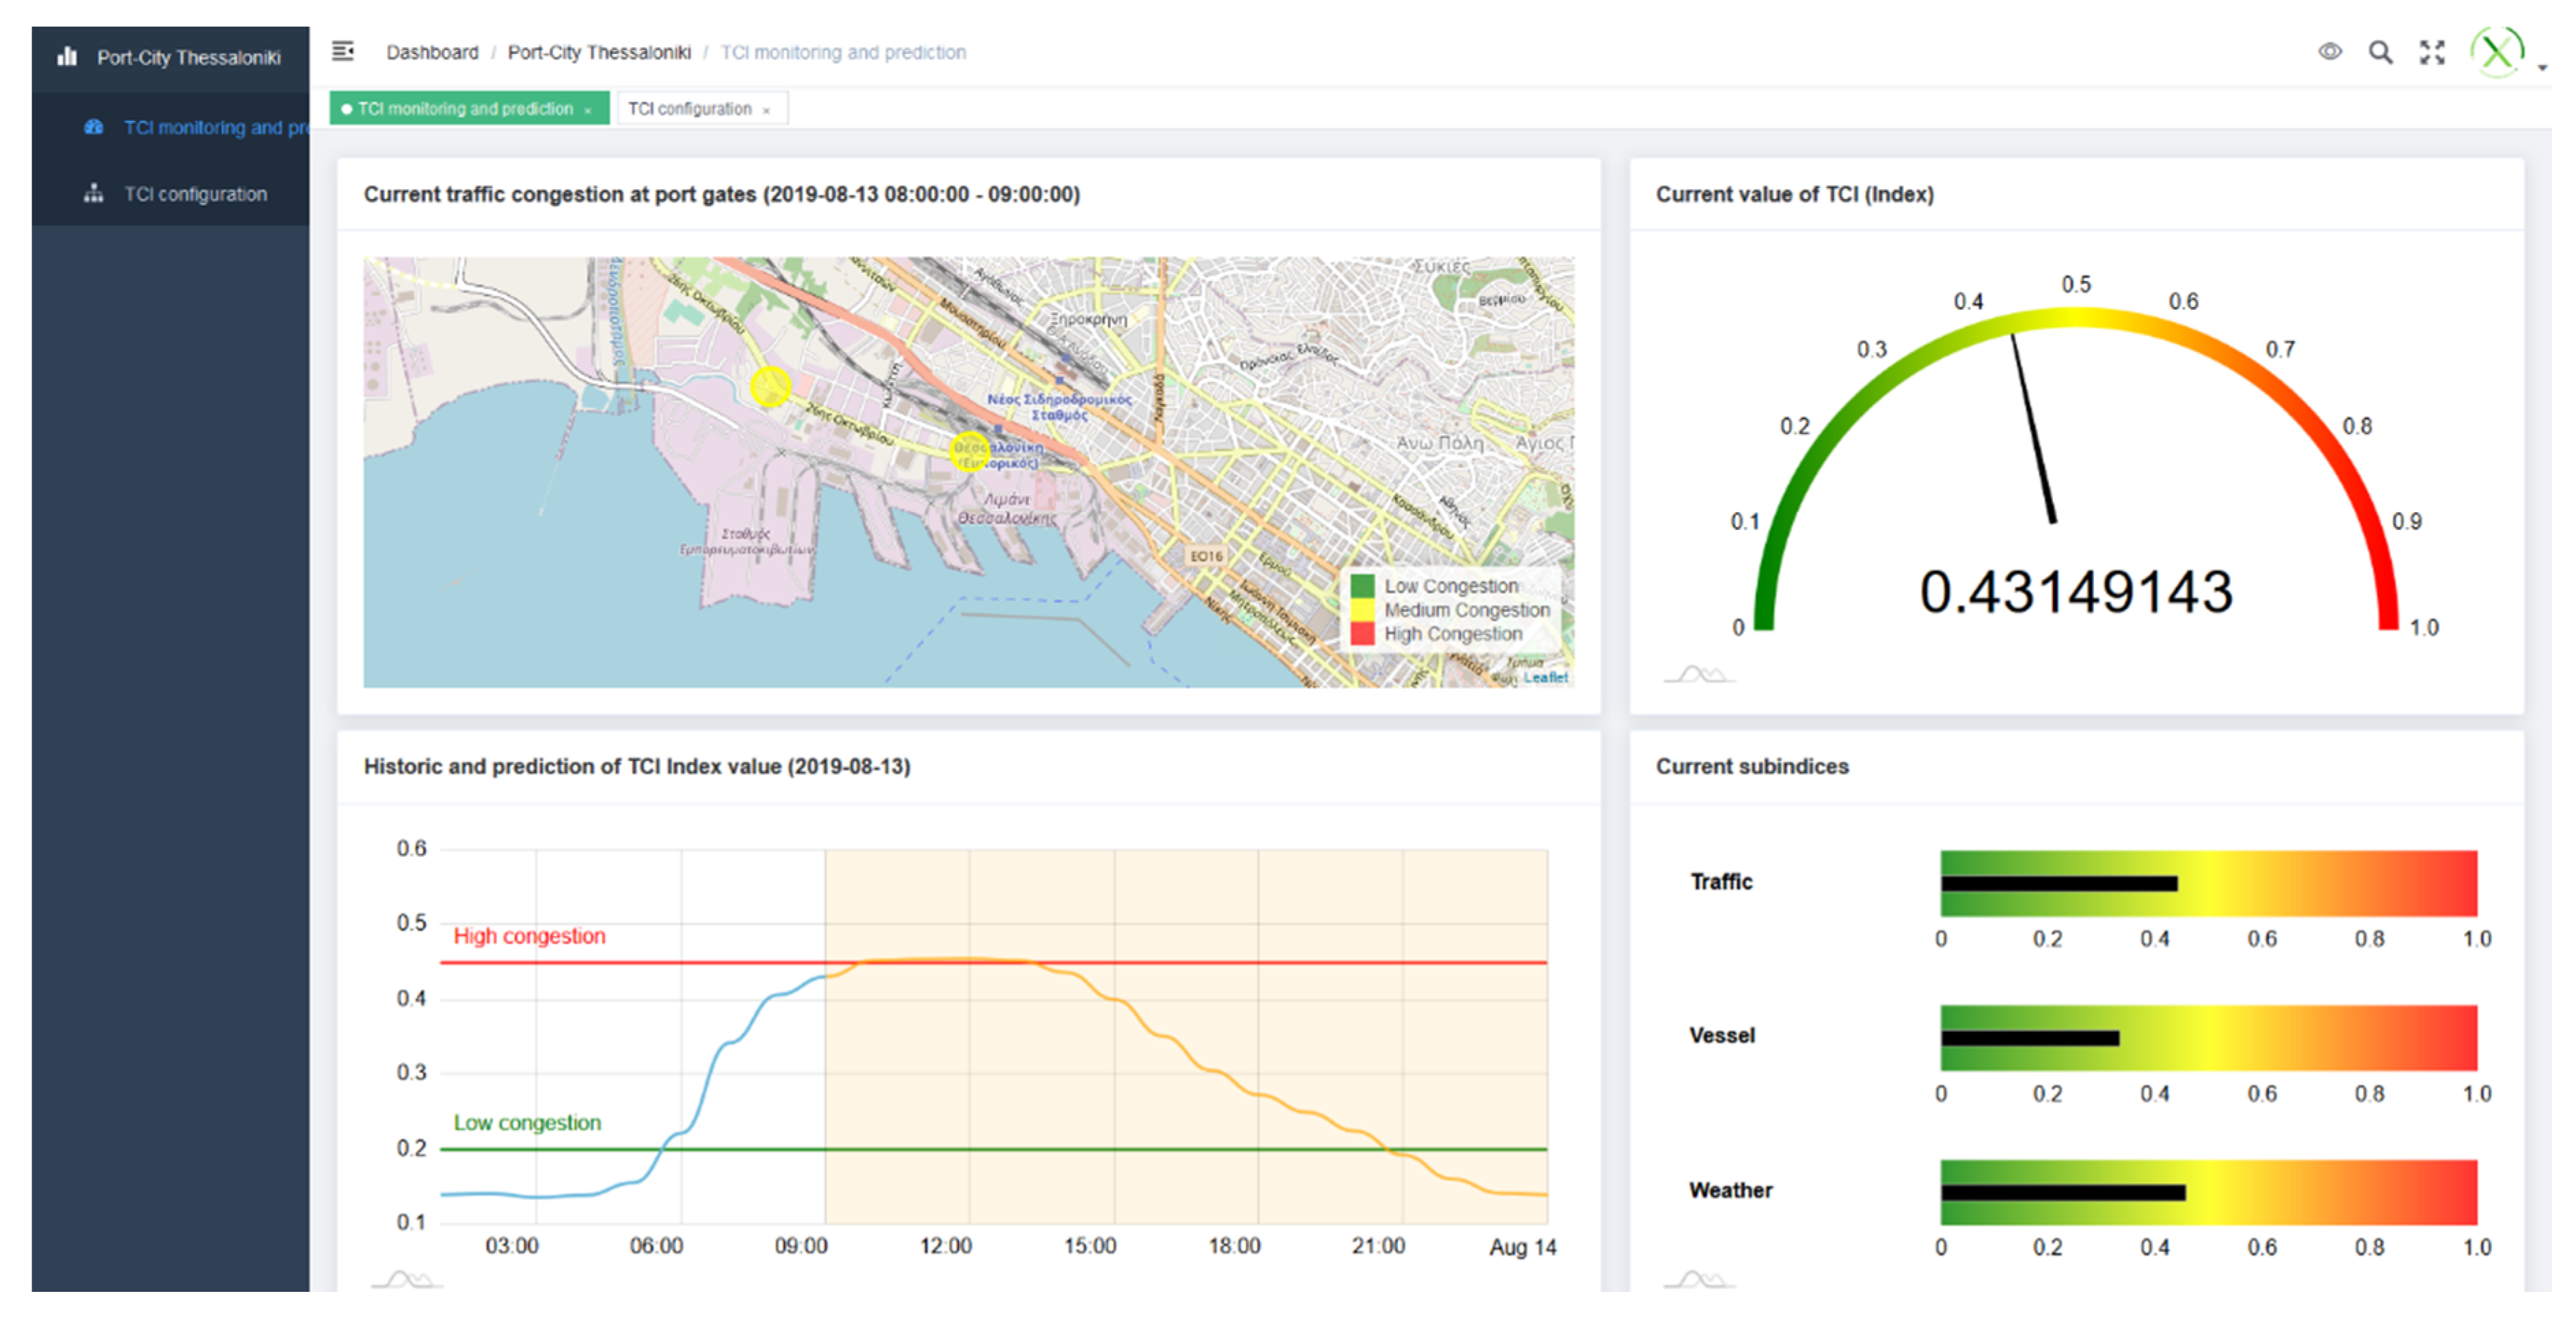
| 2.1 | 13 August 2019 9 a.m. | 0.43149143 | As a usual Tuesday, levels of congestion remain constant high levels during the labor days. Curve reflects with high accuracy the usual picture in vessel-operations busy months. |
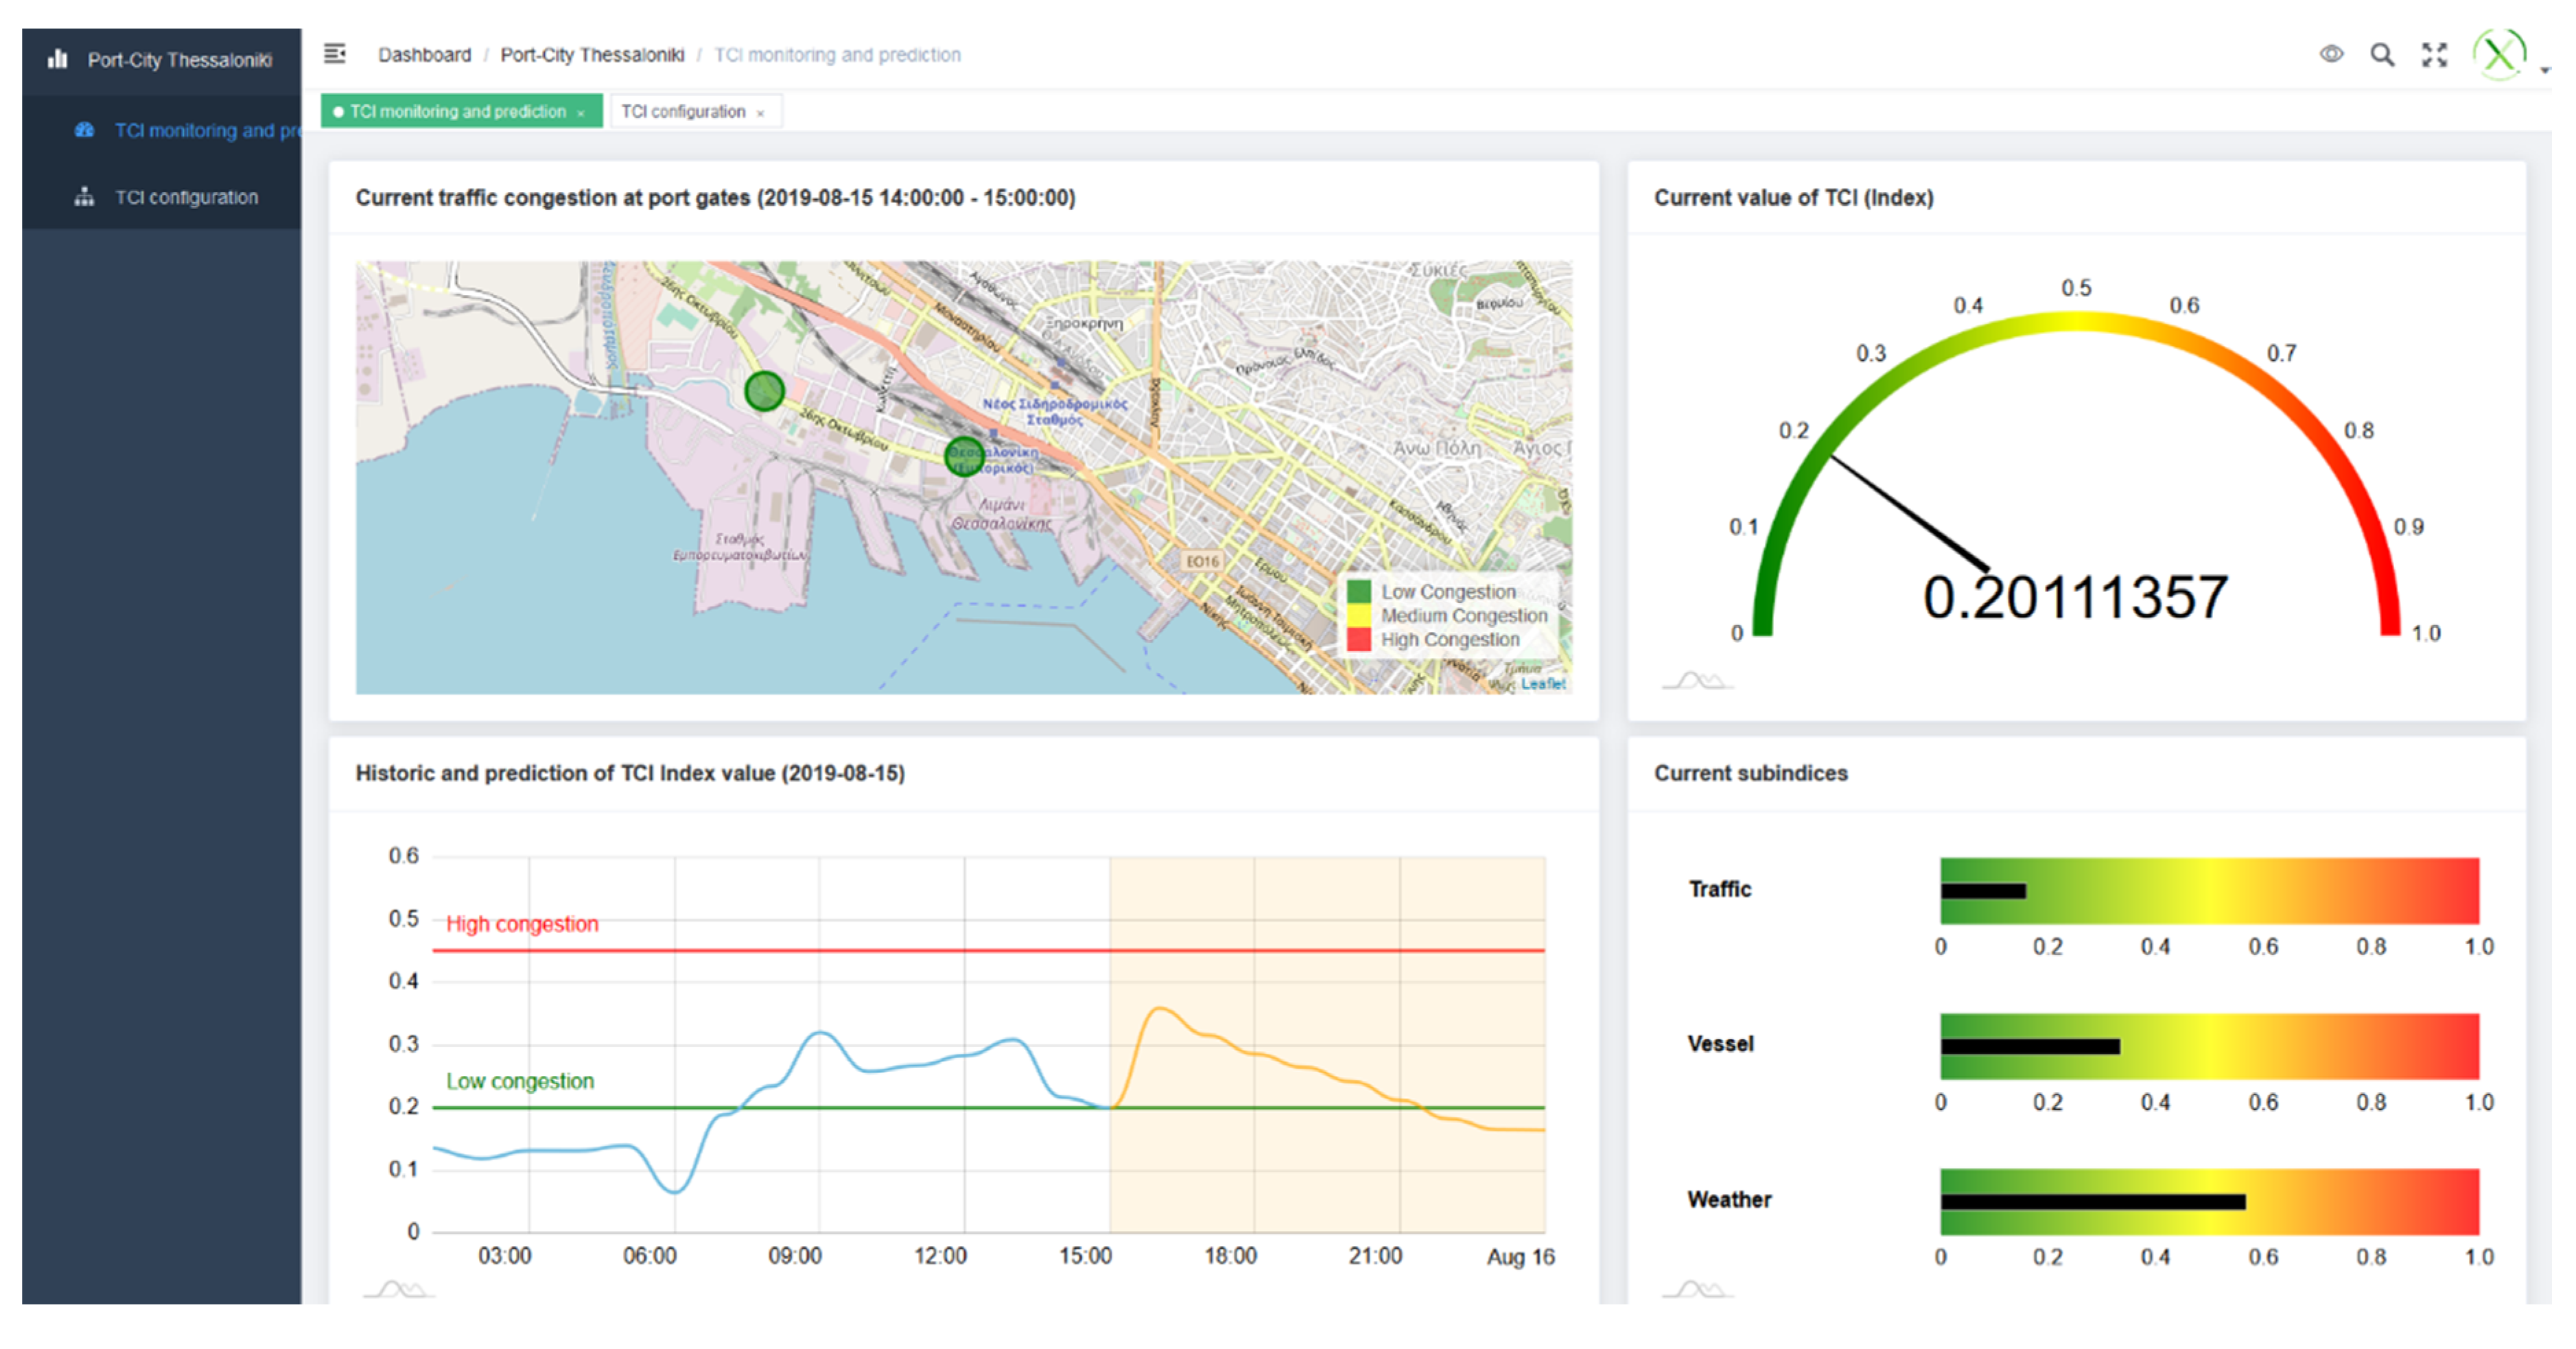
| 2.2 | 15 August 2019 3 p.m. | 0.20111357 | Scenario 2.2 shows unusual representation: despite being a Thursday, the traffic congestion is experienced and predicted between 0.2 and 0.3. However, this must be considered nothing but a good functioning of the framework and the prediction, as the 15th August is national holy day in Greece. |
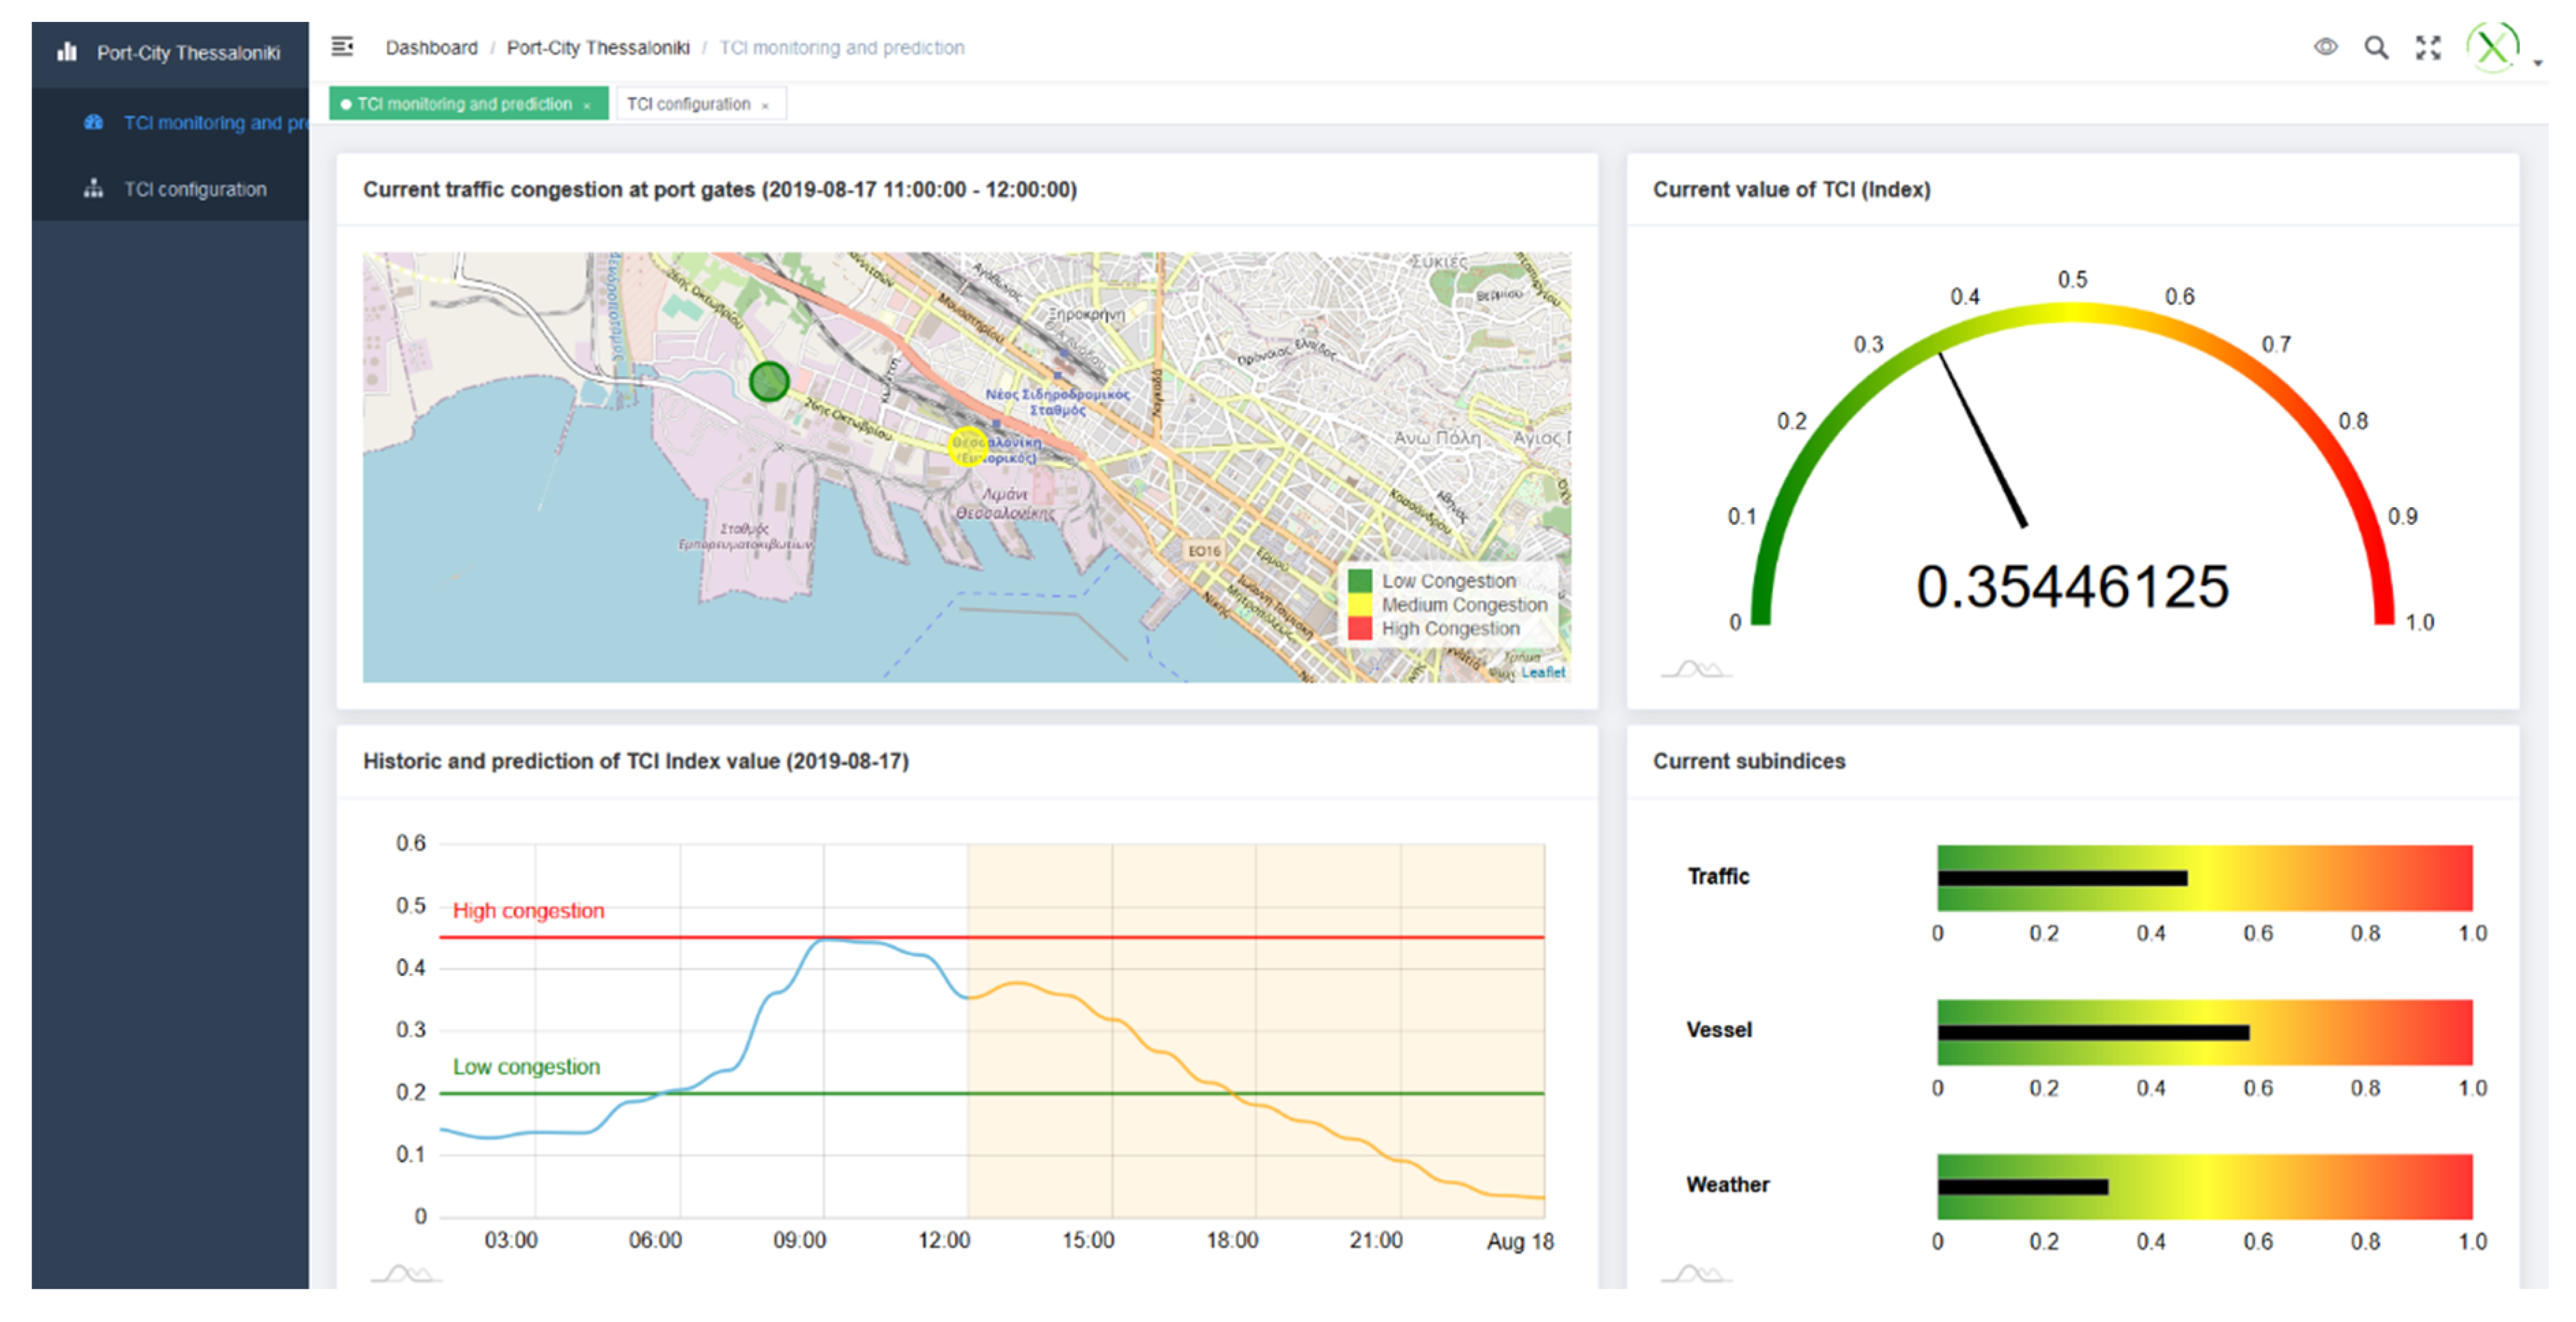
| 2.3 | 17 August 2019 12 p.m. | 0.35446125 | Scenario 2.3 follows the same rationale than 1.3, therefore it is valid. The only addition is that more traffic congestion (in general), is perceived and forecasted. This makes sense as 17th August is summer period and, normally, more traffic is experienced in the city on Saturdays at central hours. |
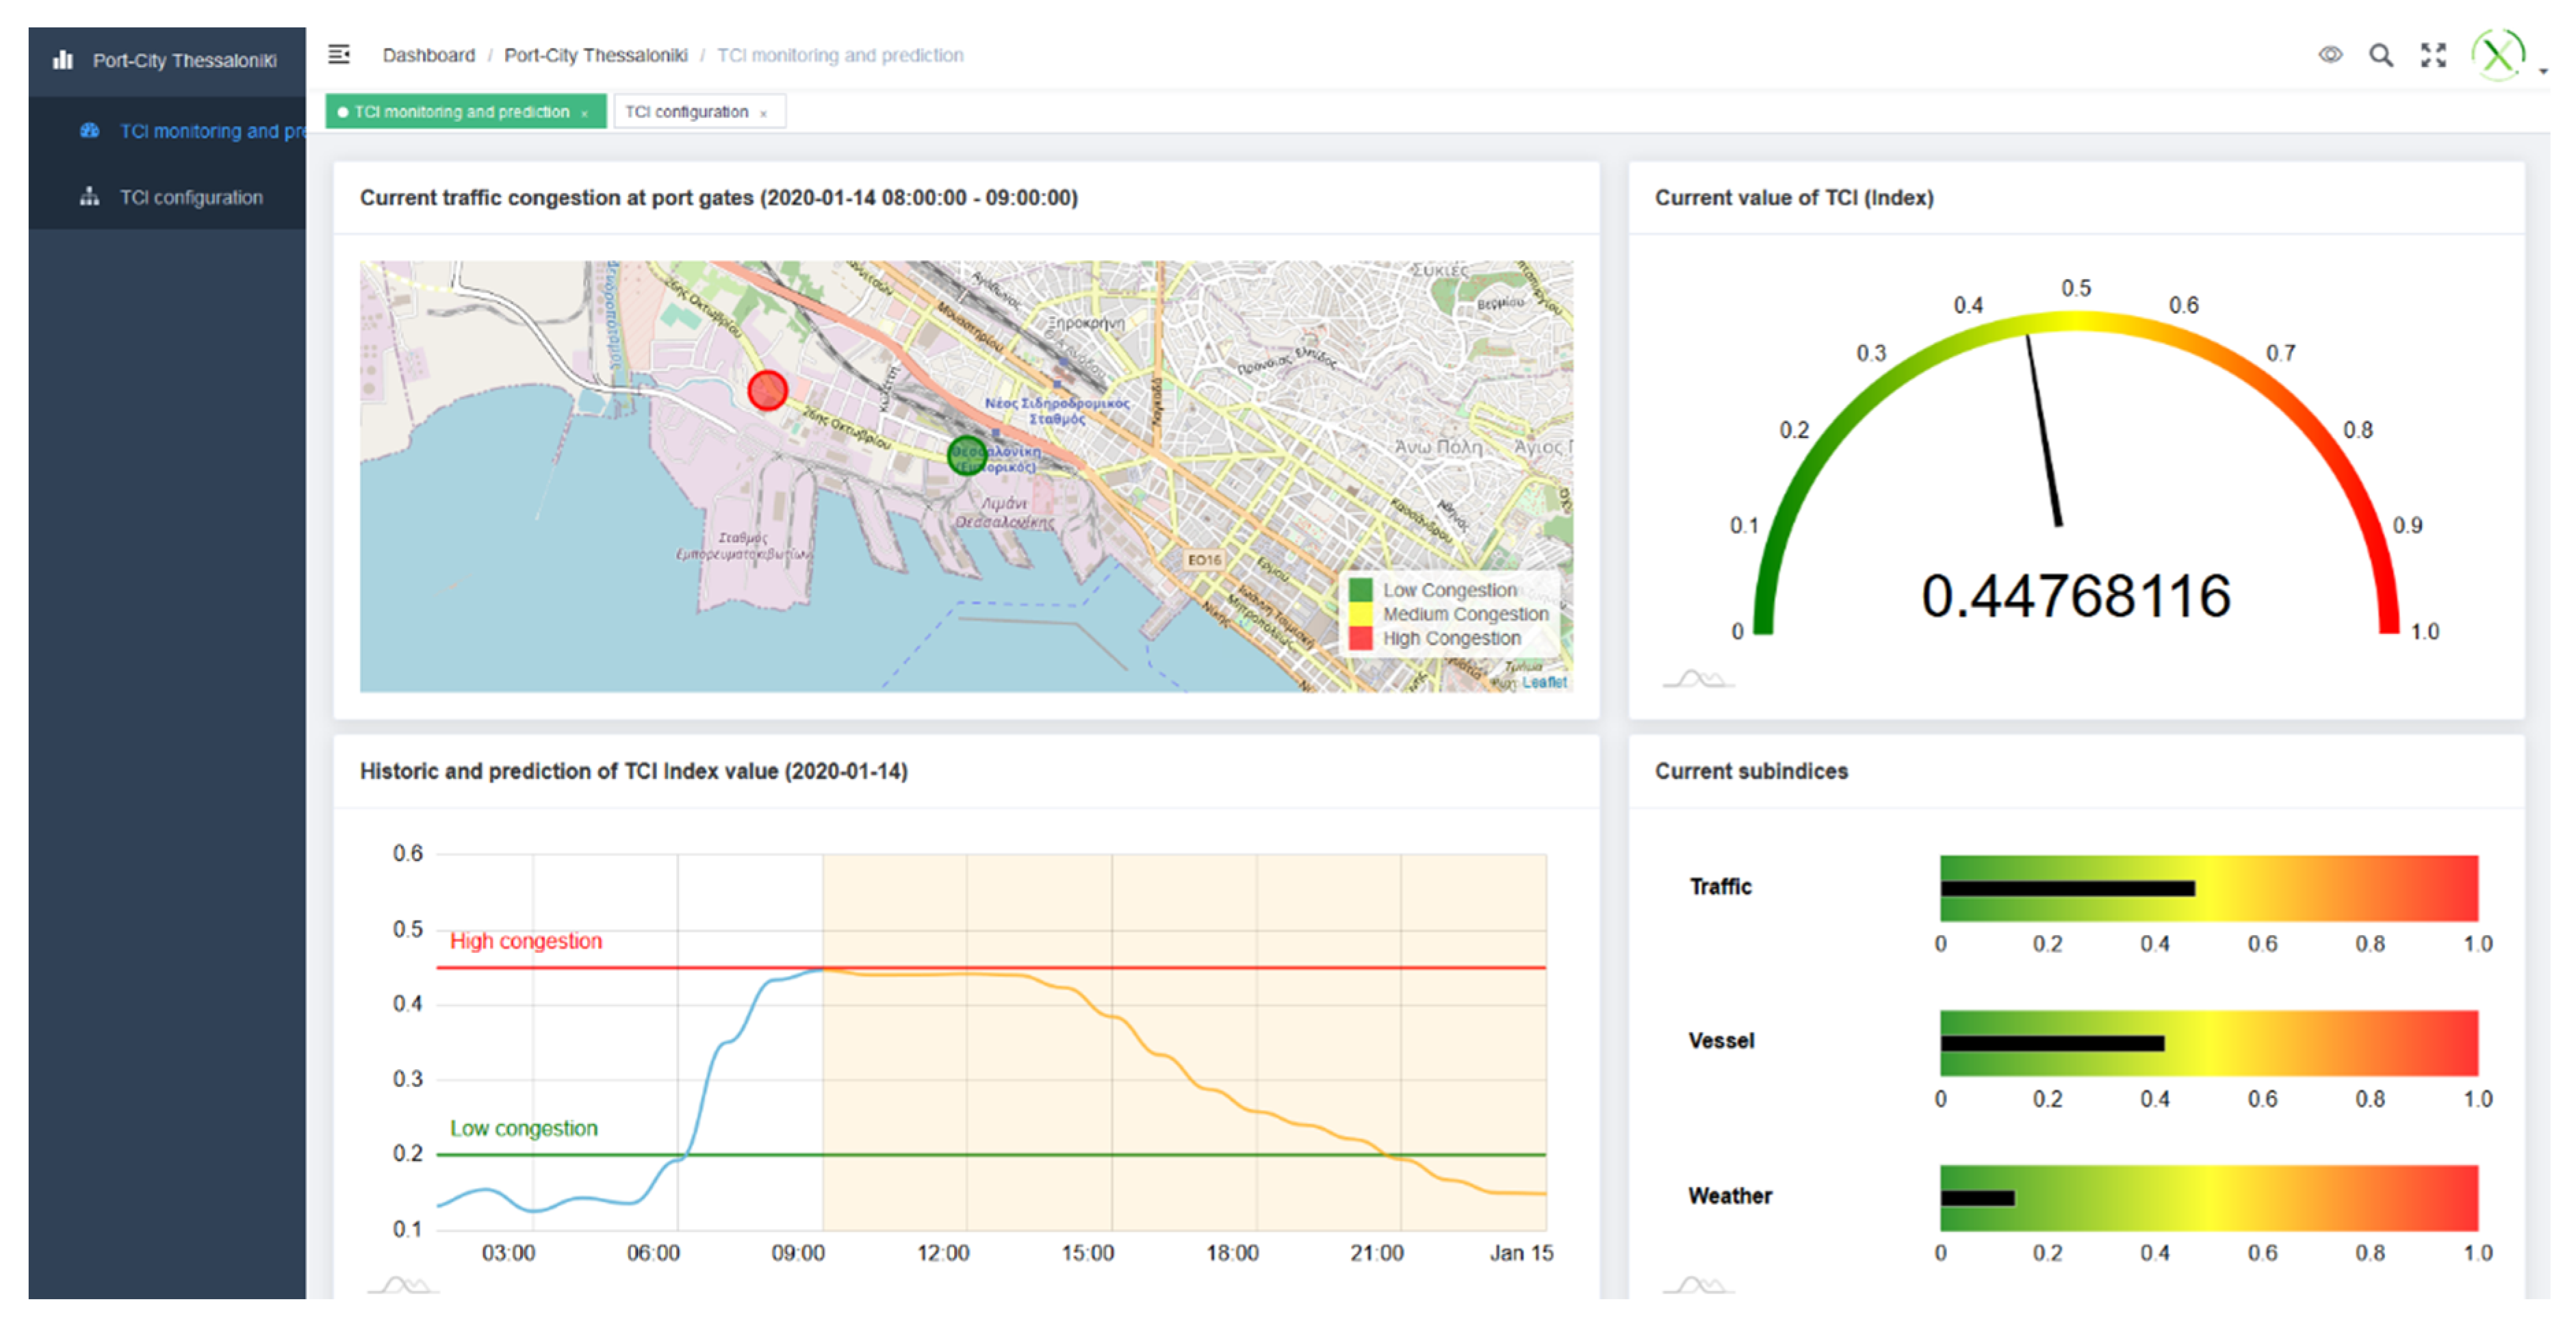
| 3.1 | 14 January 2020 9 a.m. | 0.44768116 | Same exact observation, thus rationale than 2.1. |
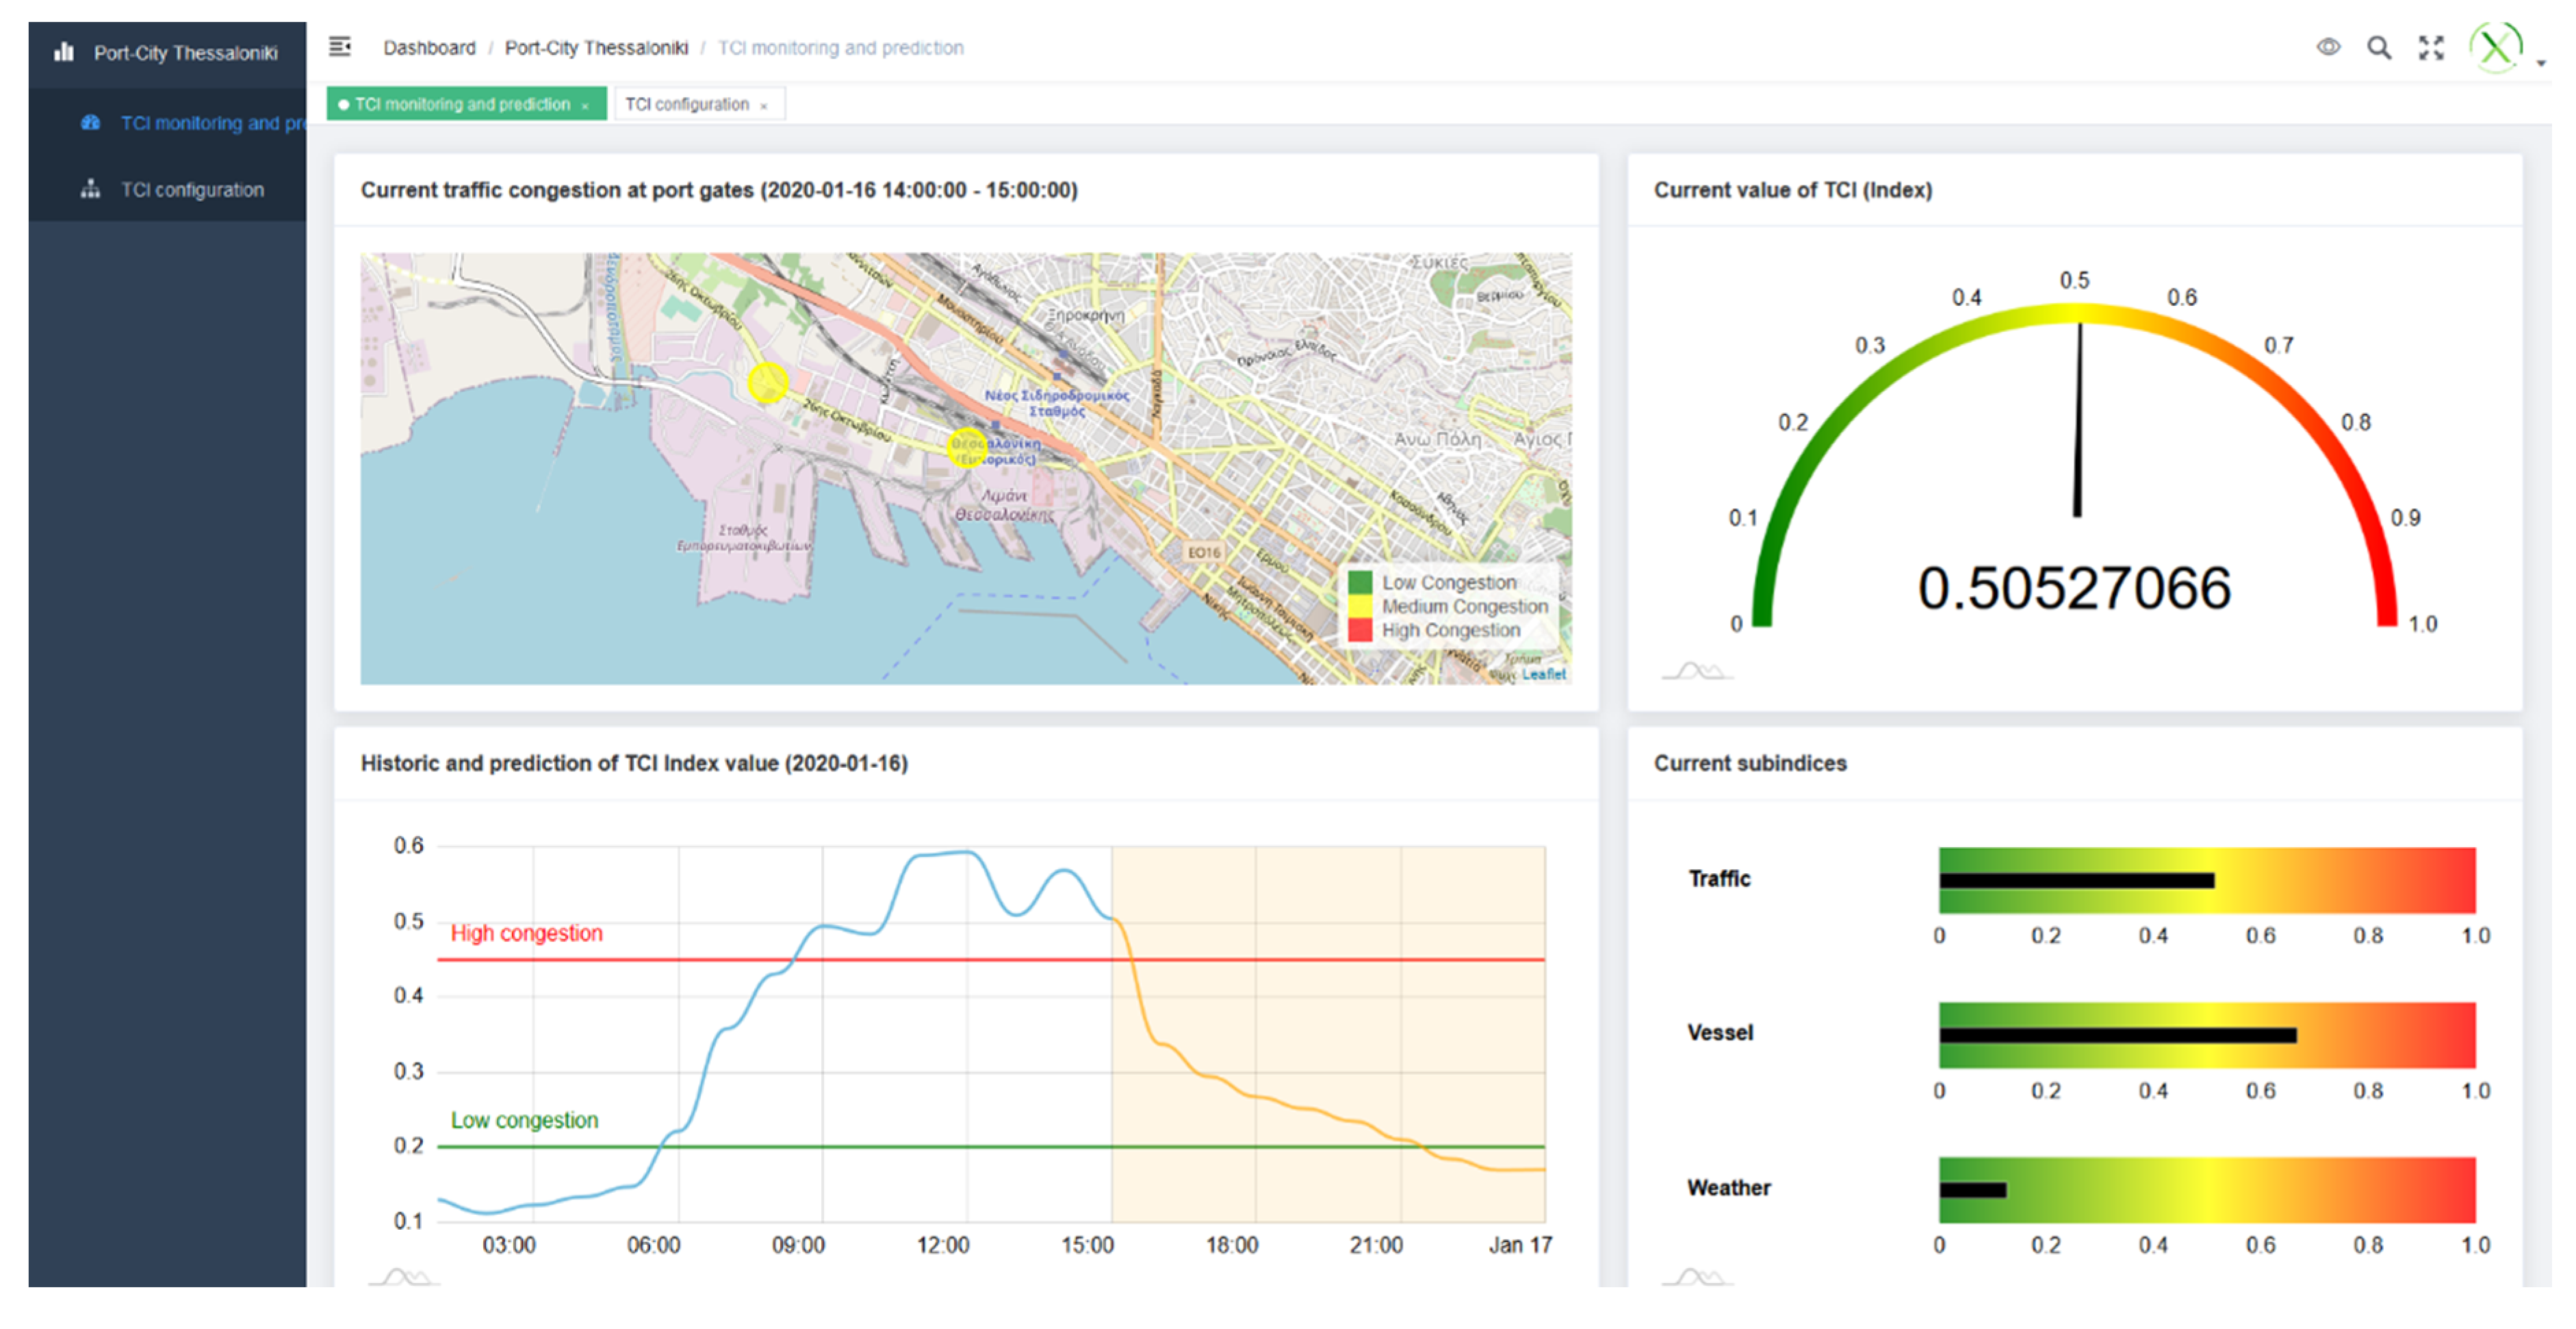
| 3.2 | 16 January 2020 3 p.m. | 0.50527066 | As in 1.2, hour of experiment coincides with congestion dawn. Curve looks legit. |
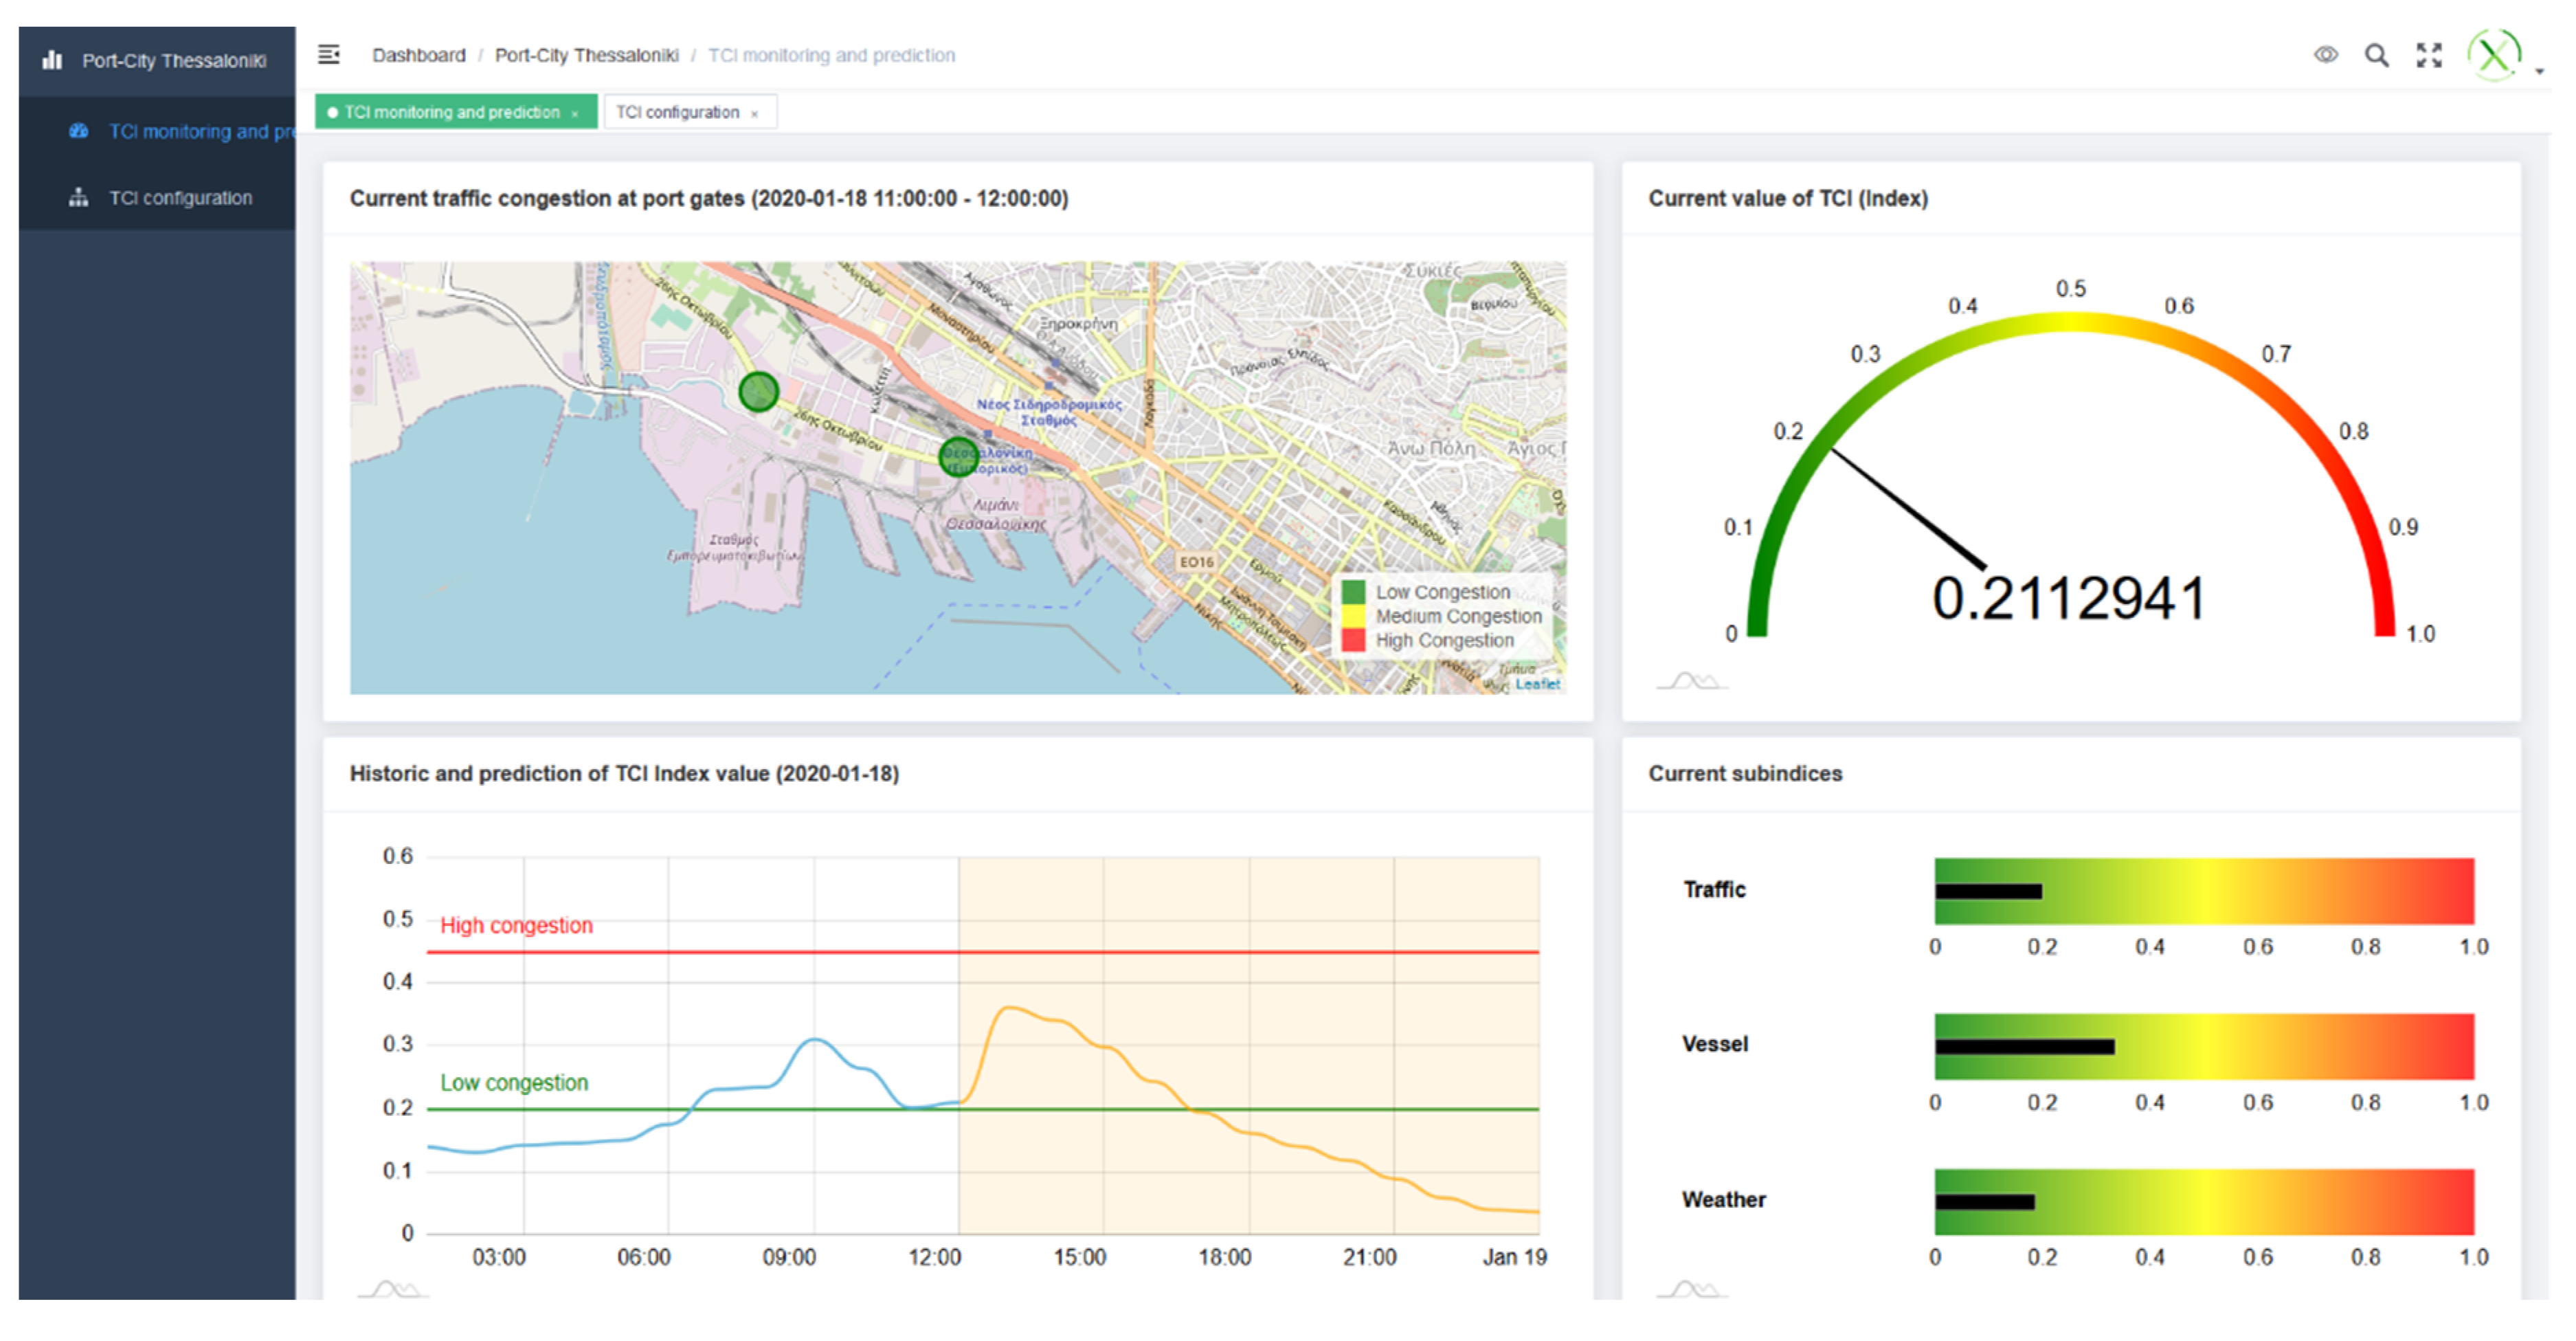
| 3.3 | 18 January 2020 12 p.m. | 0.21129410 | Scenario 3.3 registered one of the lowest TCIs, both at the measurement hour and in the real-time previous values and the forecasted (max. 0.3). This makes sense as winter’s Saturdays are less congested (in general) than the rest of the days. City’s weekend tourist life is not as vibrant as at summer. |
© 2020 by the authors. Licensee MDPI, Basel, Switzerland. This article is an open access article distributed under the terms and conditions of the Creative Commons Attribution (CC BY) license (http://creativecommons.org/licenses/by/4.0/).
Share and Cite
Lacalle, I.; Belsa, A.; Vaño, R.; Palau, C.E. Framework and Methodology for Establishing Port-City Policies Based on Real-Time Composite Indicators and IoT: A Practical Use-Case. Sensors 2020, 20, 4131. https://doi.org/10.3390/s20154131
Lacalle I, Belsa A, Vaño R, Palau CE. Framework and Methodology for Establishing Port-City Policies Based on Real-Time Composite Indicators and IoT: A Practical Use-Case. Sensors. 2020; 20(15):4131. https://doi.org/10.3390/s20154131
Chicago/Turabian StyleLacalle, Ignacio, Andreu Belsa, Rafael Vaño, and Carlos E. Palau. 2020. "Framework and Methodology for Establishing Port-City Policies Based on Real-Time Composite Indicators and IoT: A Practical Use-Case" Sensors 20, no. 15: 4131. https://doi.org/10.3390/s20154131
APA StyleLacalle, I., Belsa, A., Vaño, R., & Palau, C. E. (2020). Framework and Methodology for Establishing Port-City Policies Based on Real-Time Composite Indicators and IoT: A Practical Use-Case. Sensors, 20(15), 4131. https://doi.org/10.3390/s20154131