A Distributed Stream Processing Middleware Framework for Real-Time Analysis of Heterogeneous Data on Big Data Platform: Case of Environmental Monitoring


Abstract
:1. Introduction
- It presents a distributed stream processing middleware framework for real-time analysis of heterogeneous data sources based on open source big data analysis techniques.
- Each component of the stream processing framework was presented in a layered level to emphasise the unified data pipeline.
- The presented framework is implemented in an environmental management and monitoring domain to demonstrate the effectiveness and adaptability of the proposed framework.
2. Motivation Goal and Scenario
3. Related Work
3.1. Background
3.1.1. Stream Processing Engines and Platforms
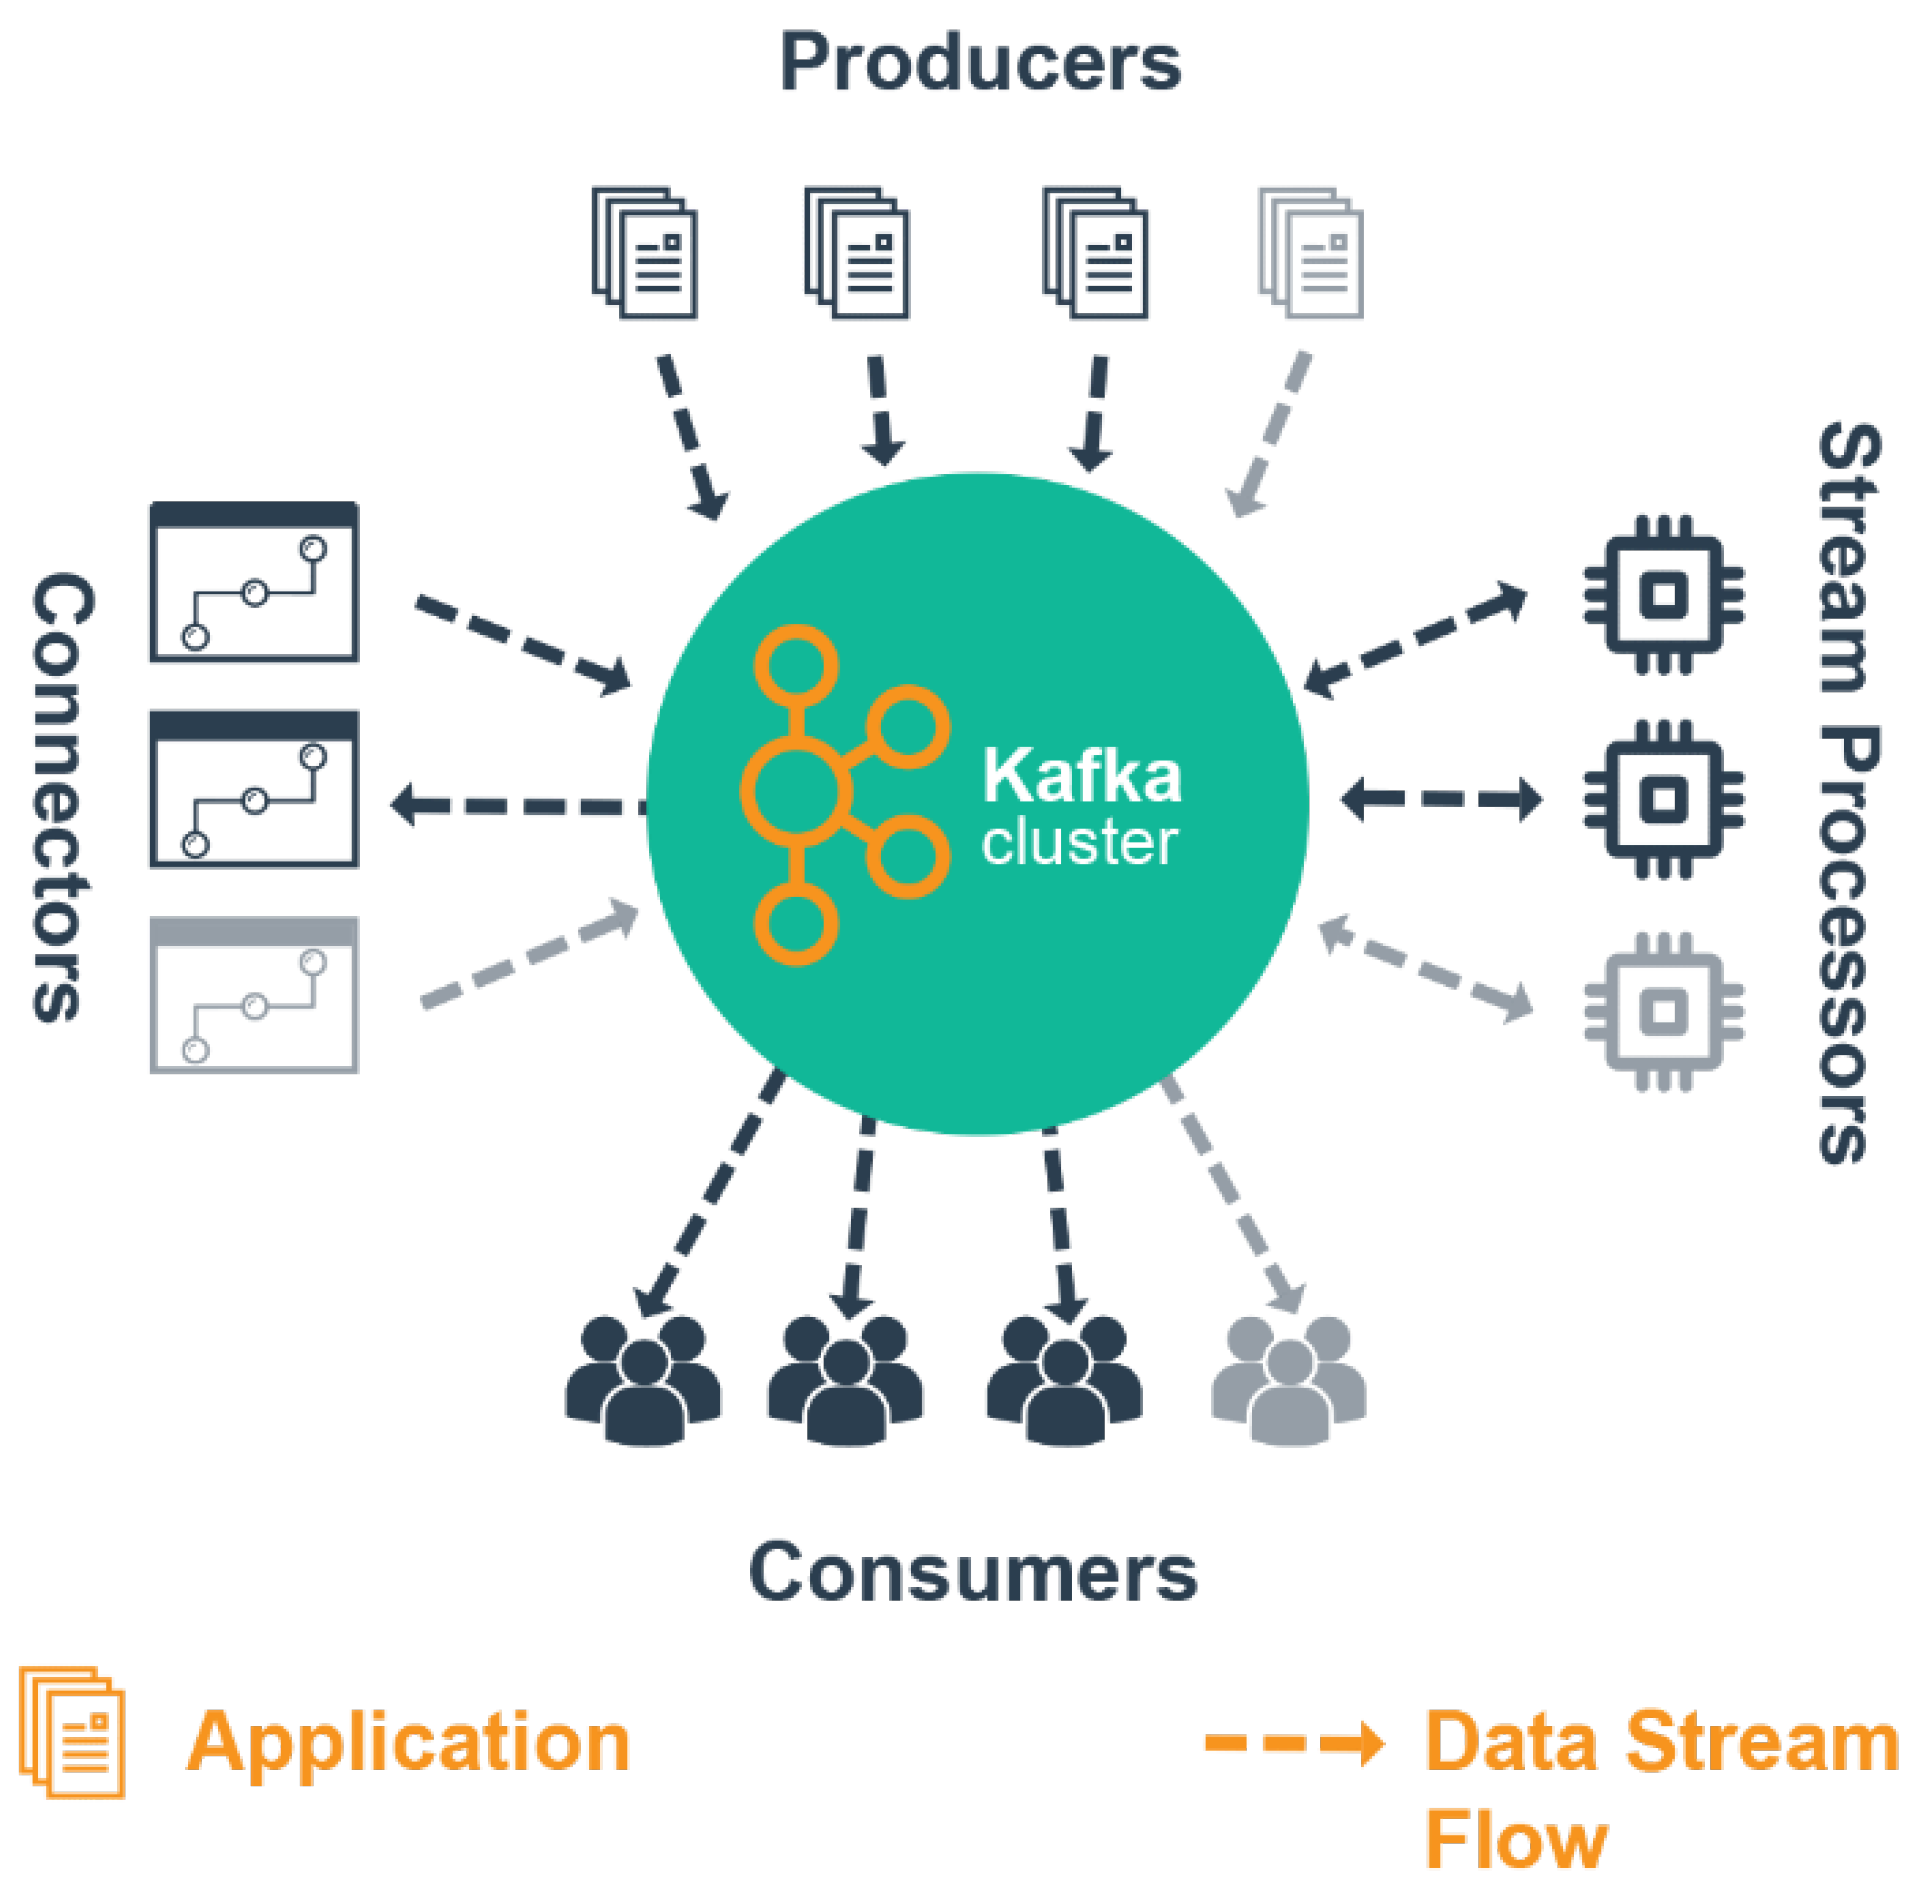
3.1.2. Apache Kafka
3.1.3. Apache Kafka Features
Topics
Brokers
Producers
Consumers
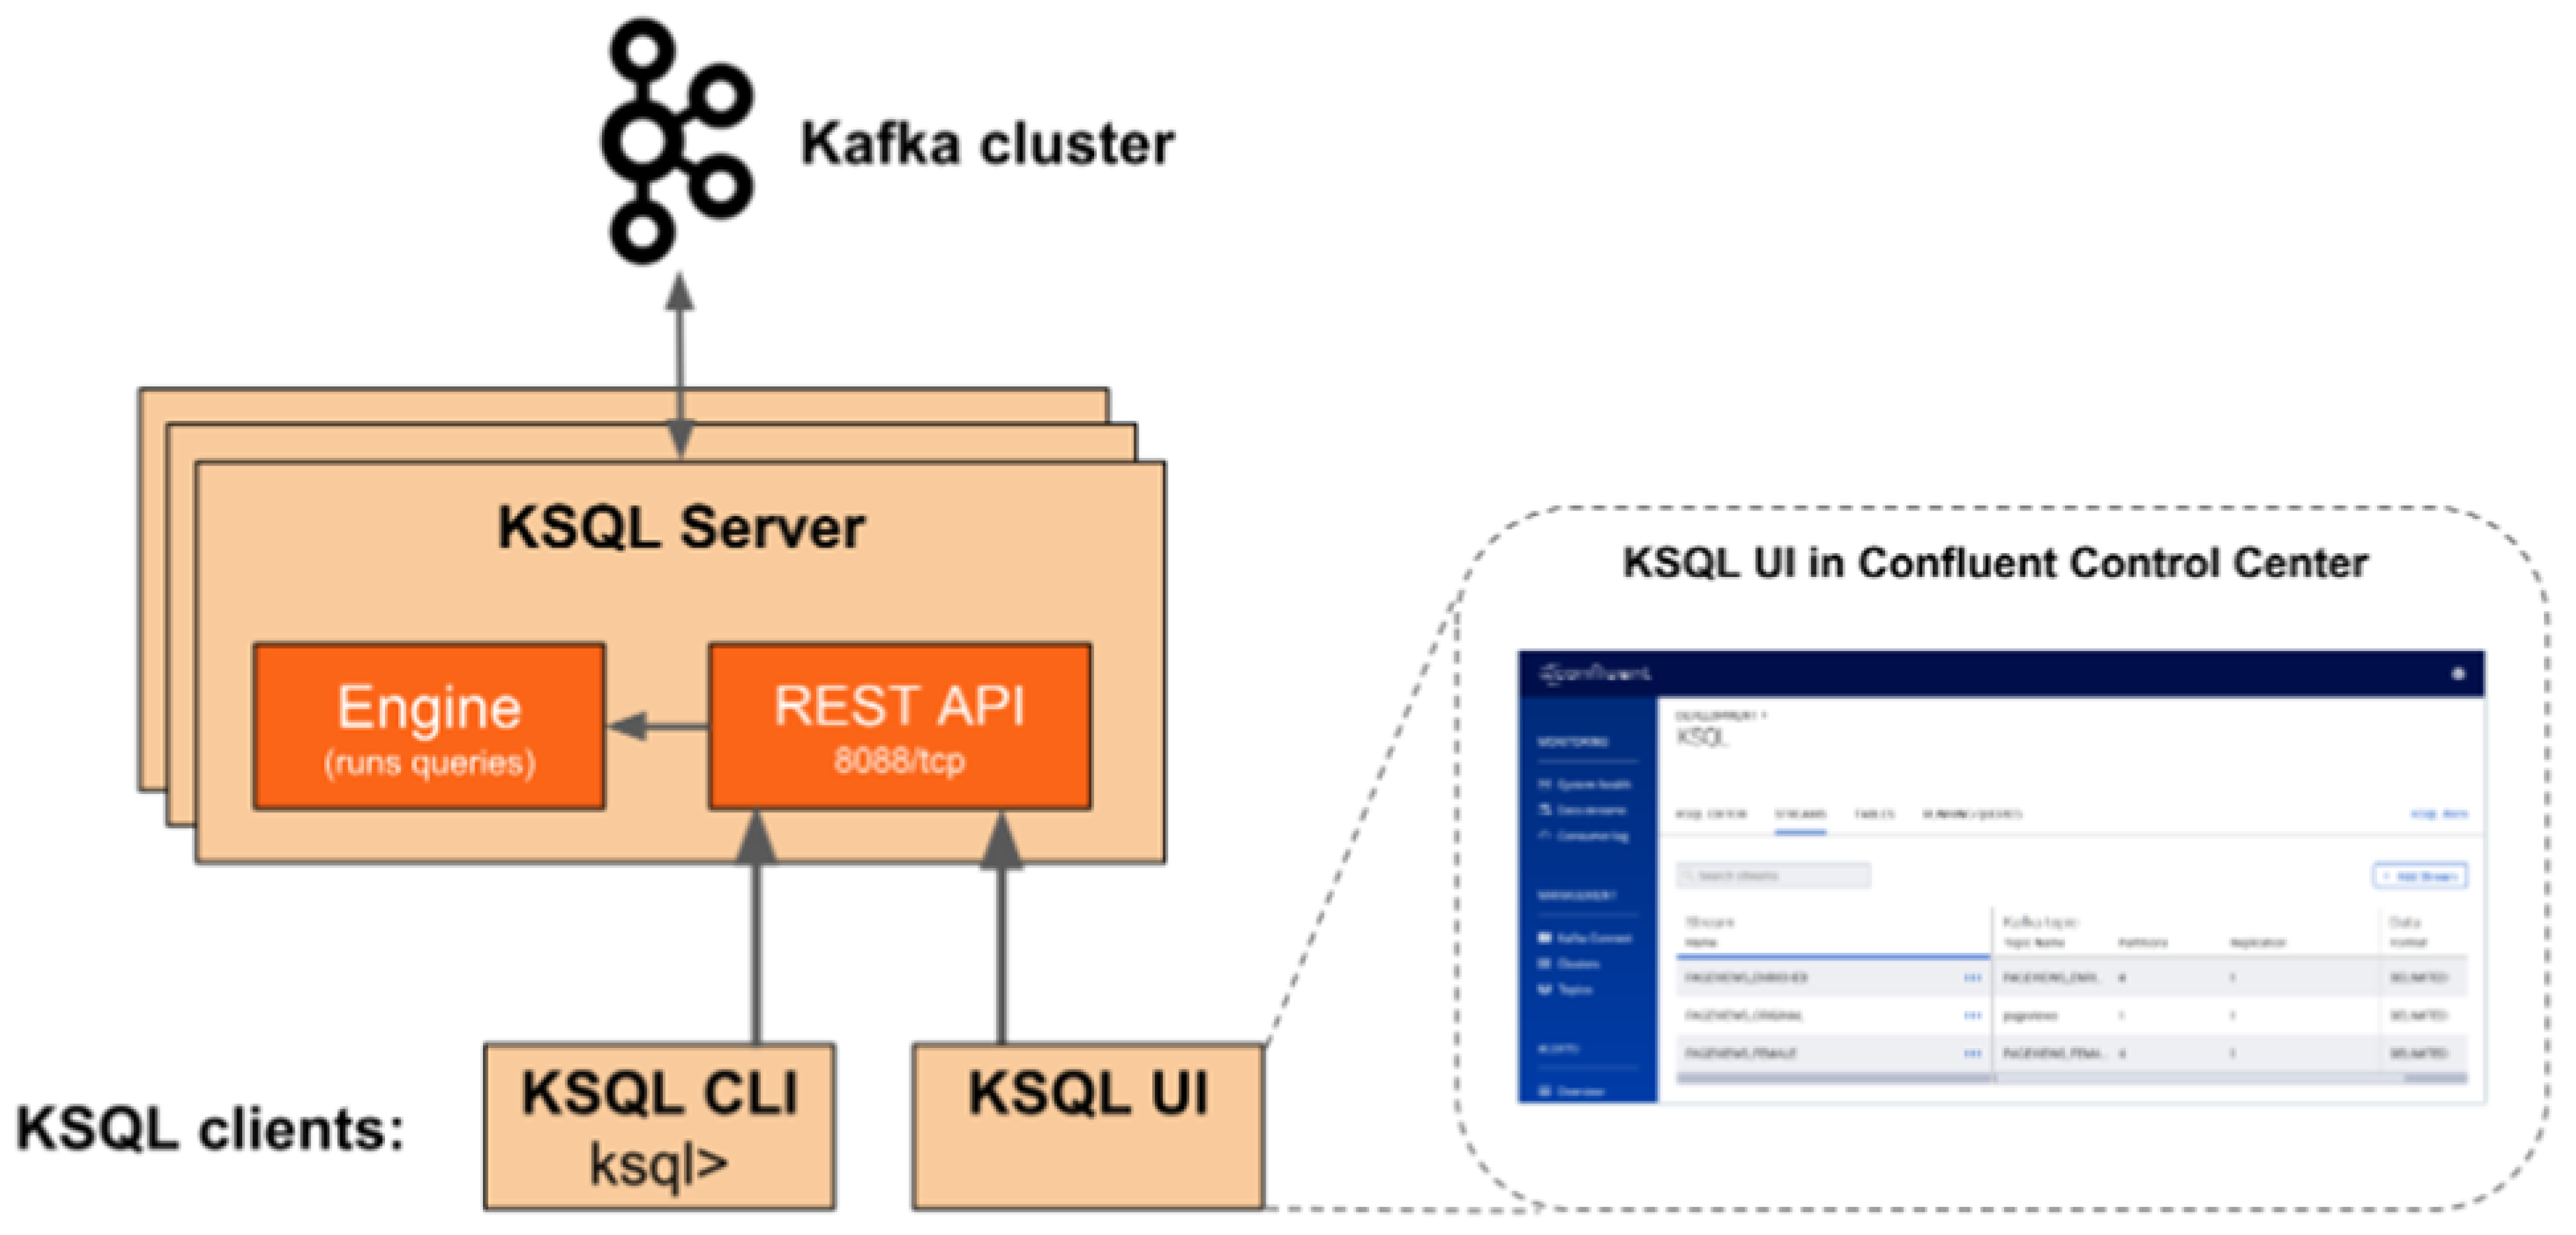
KSQL
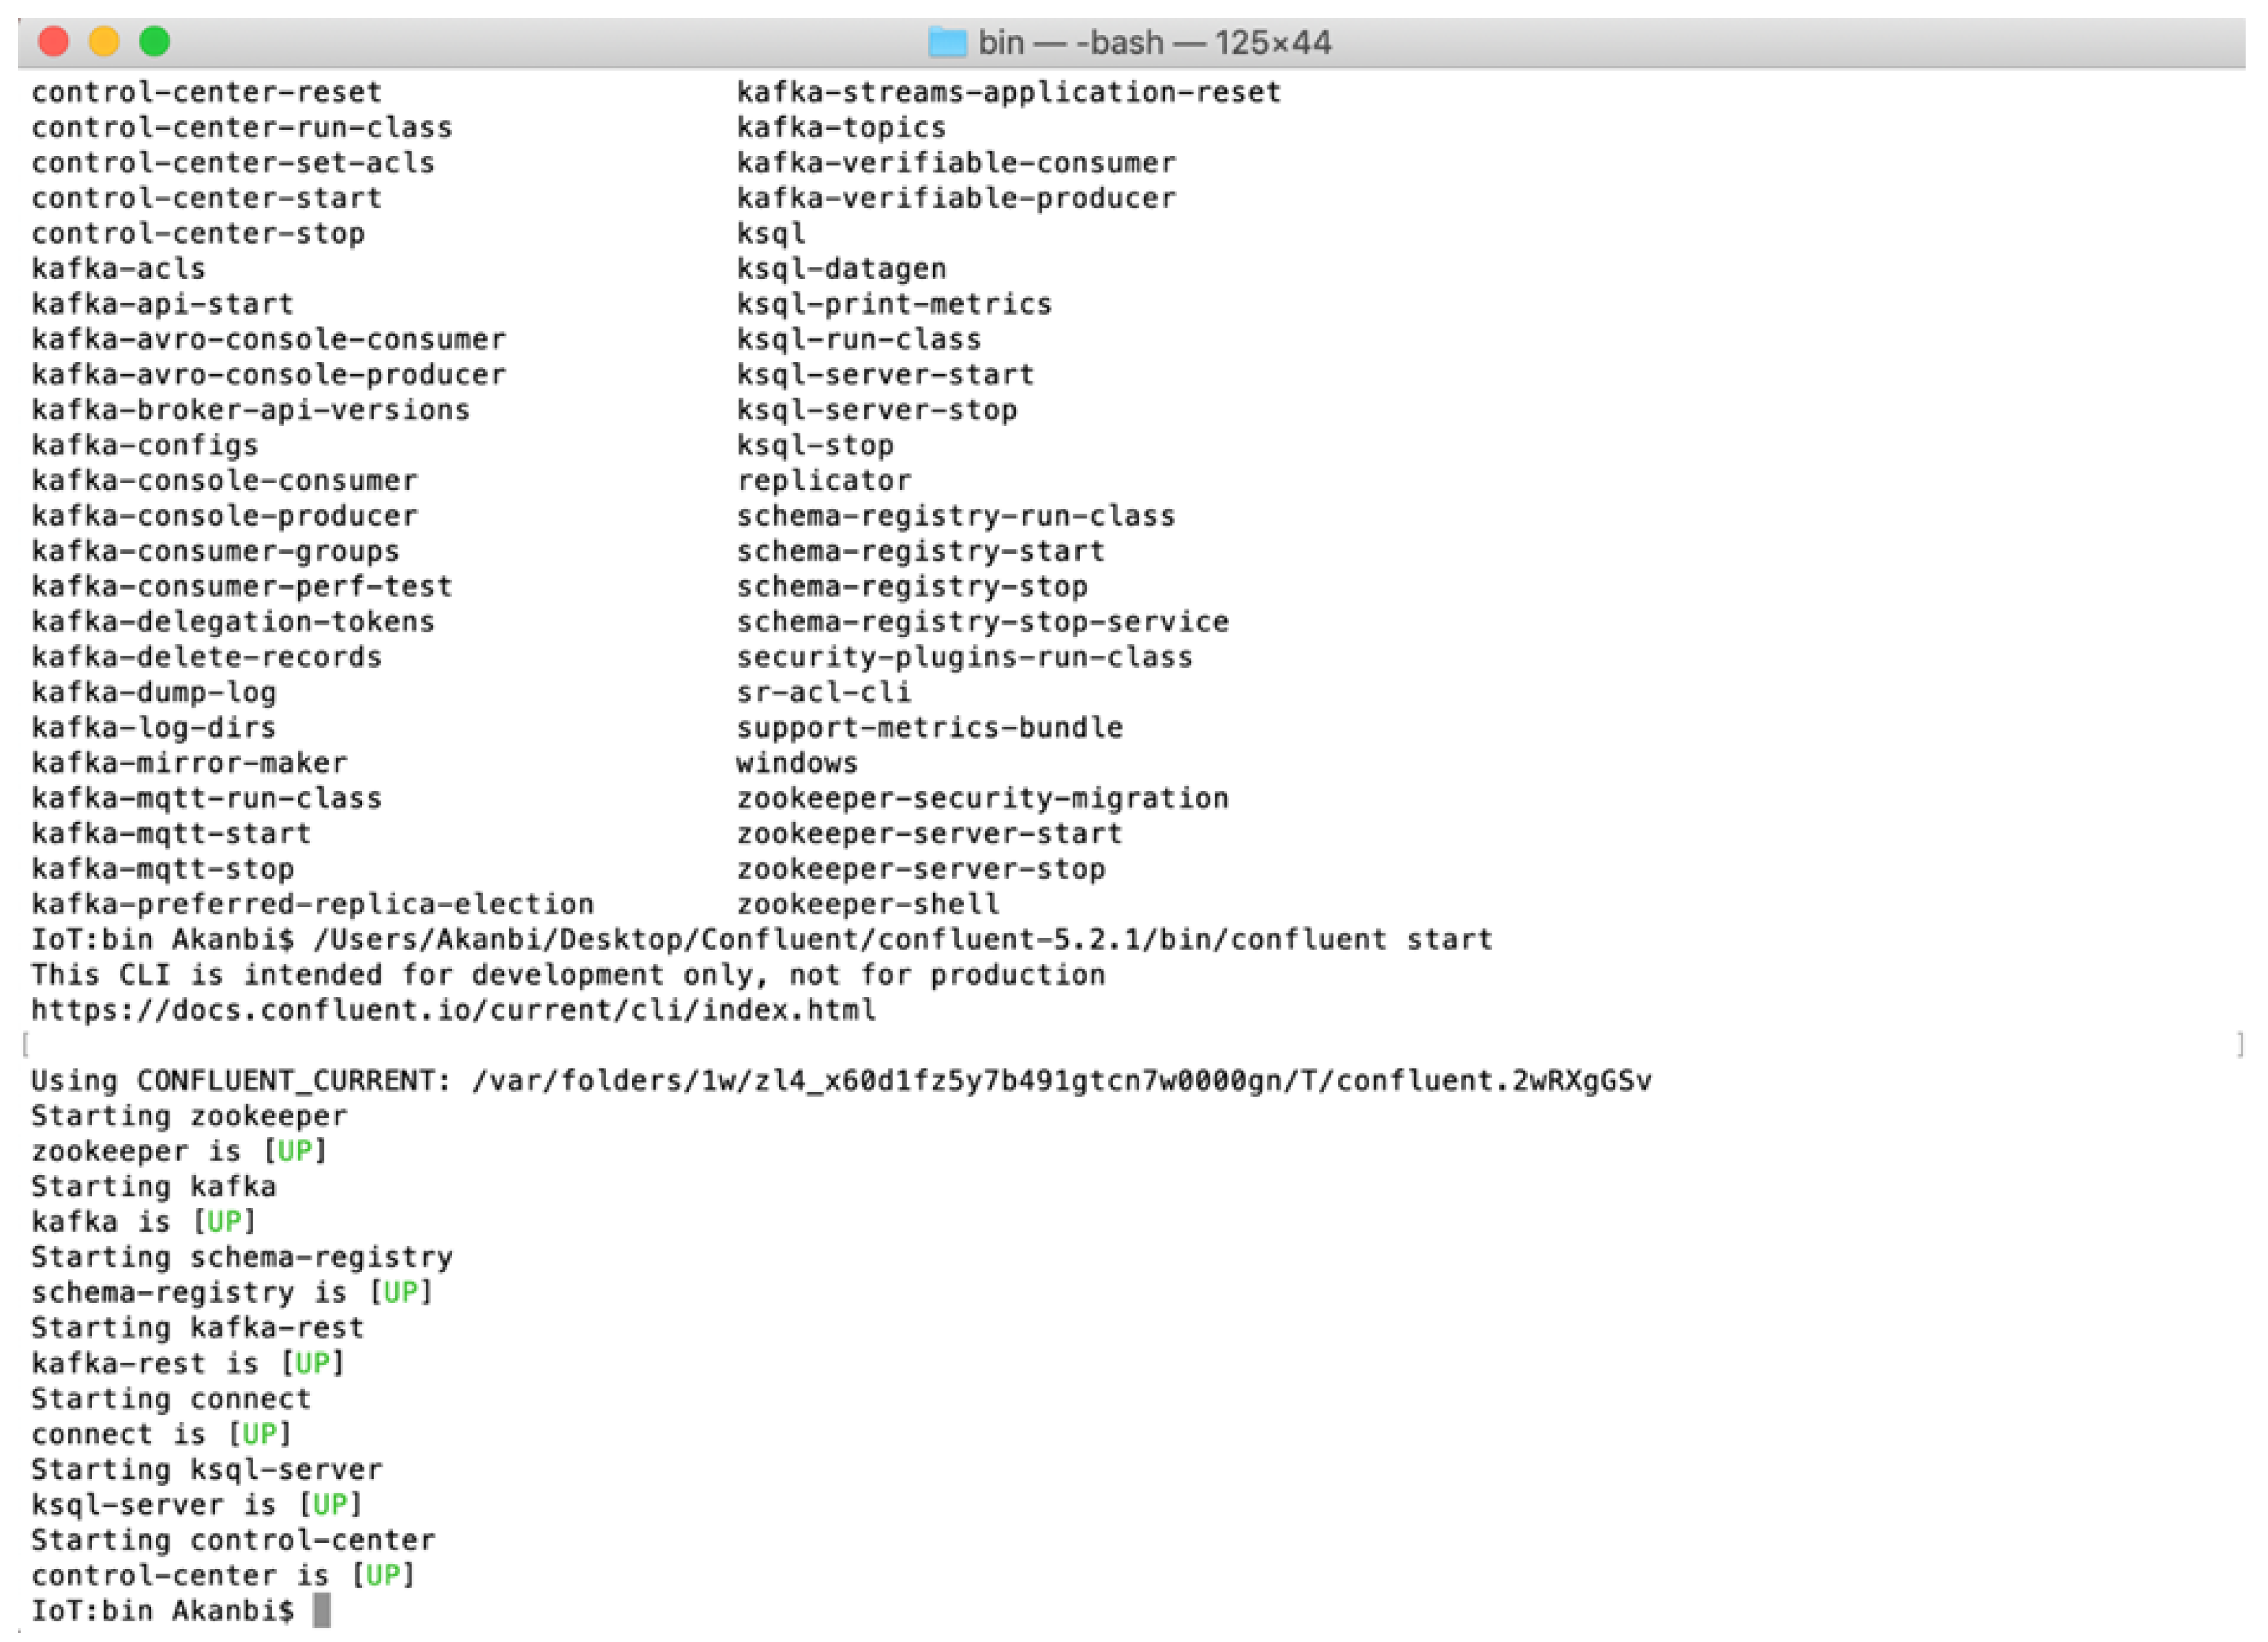
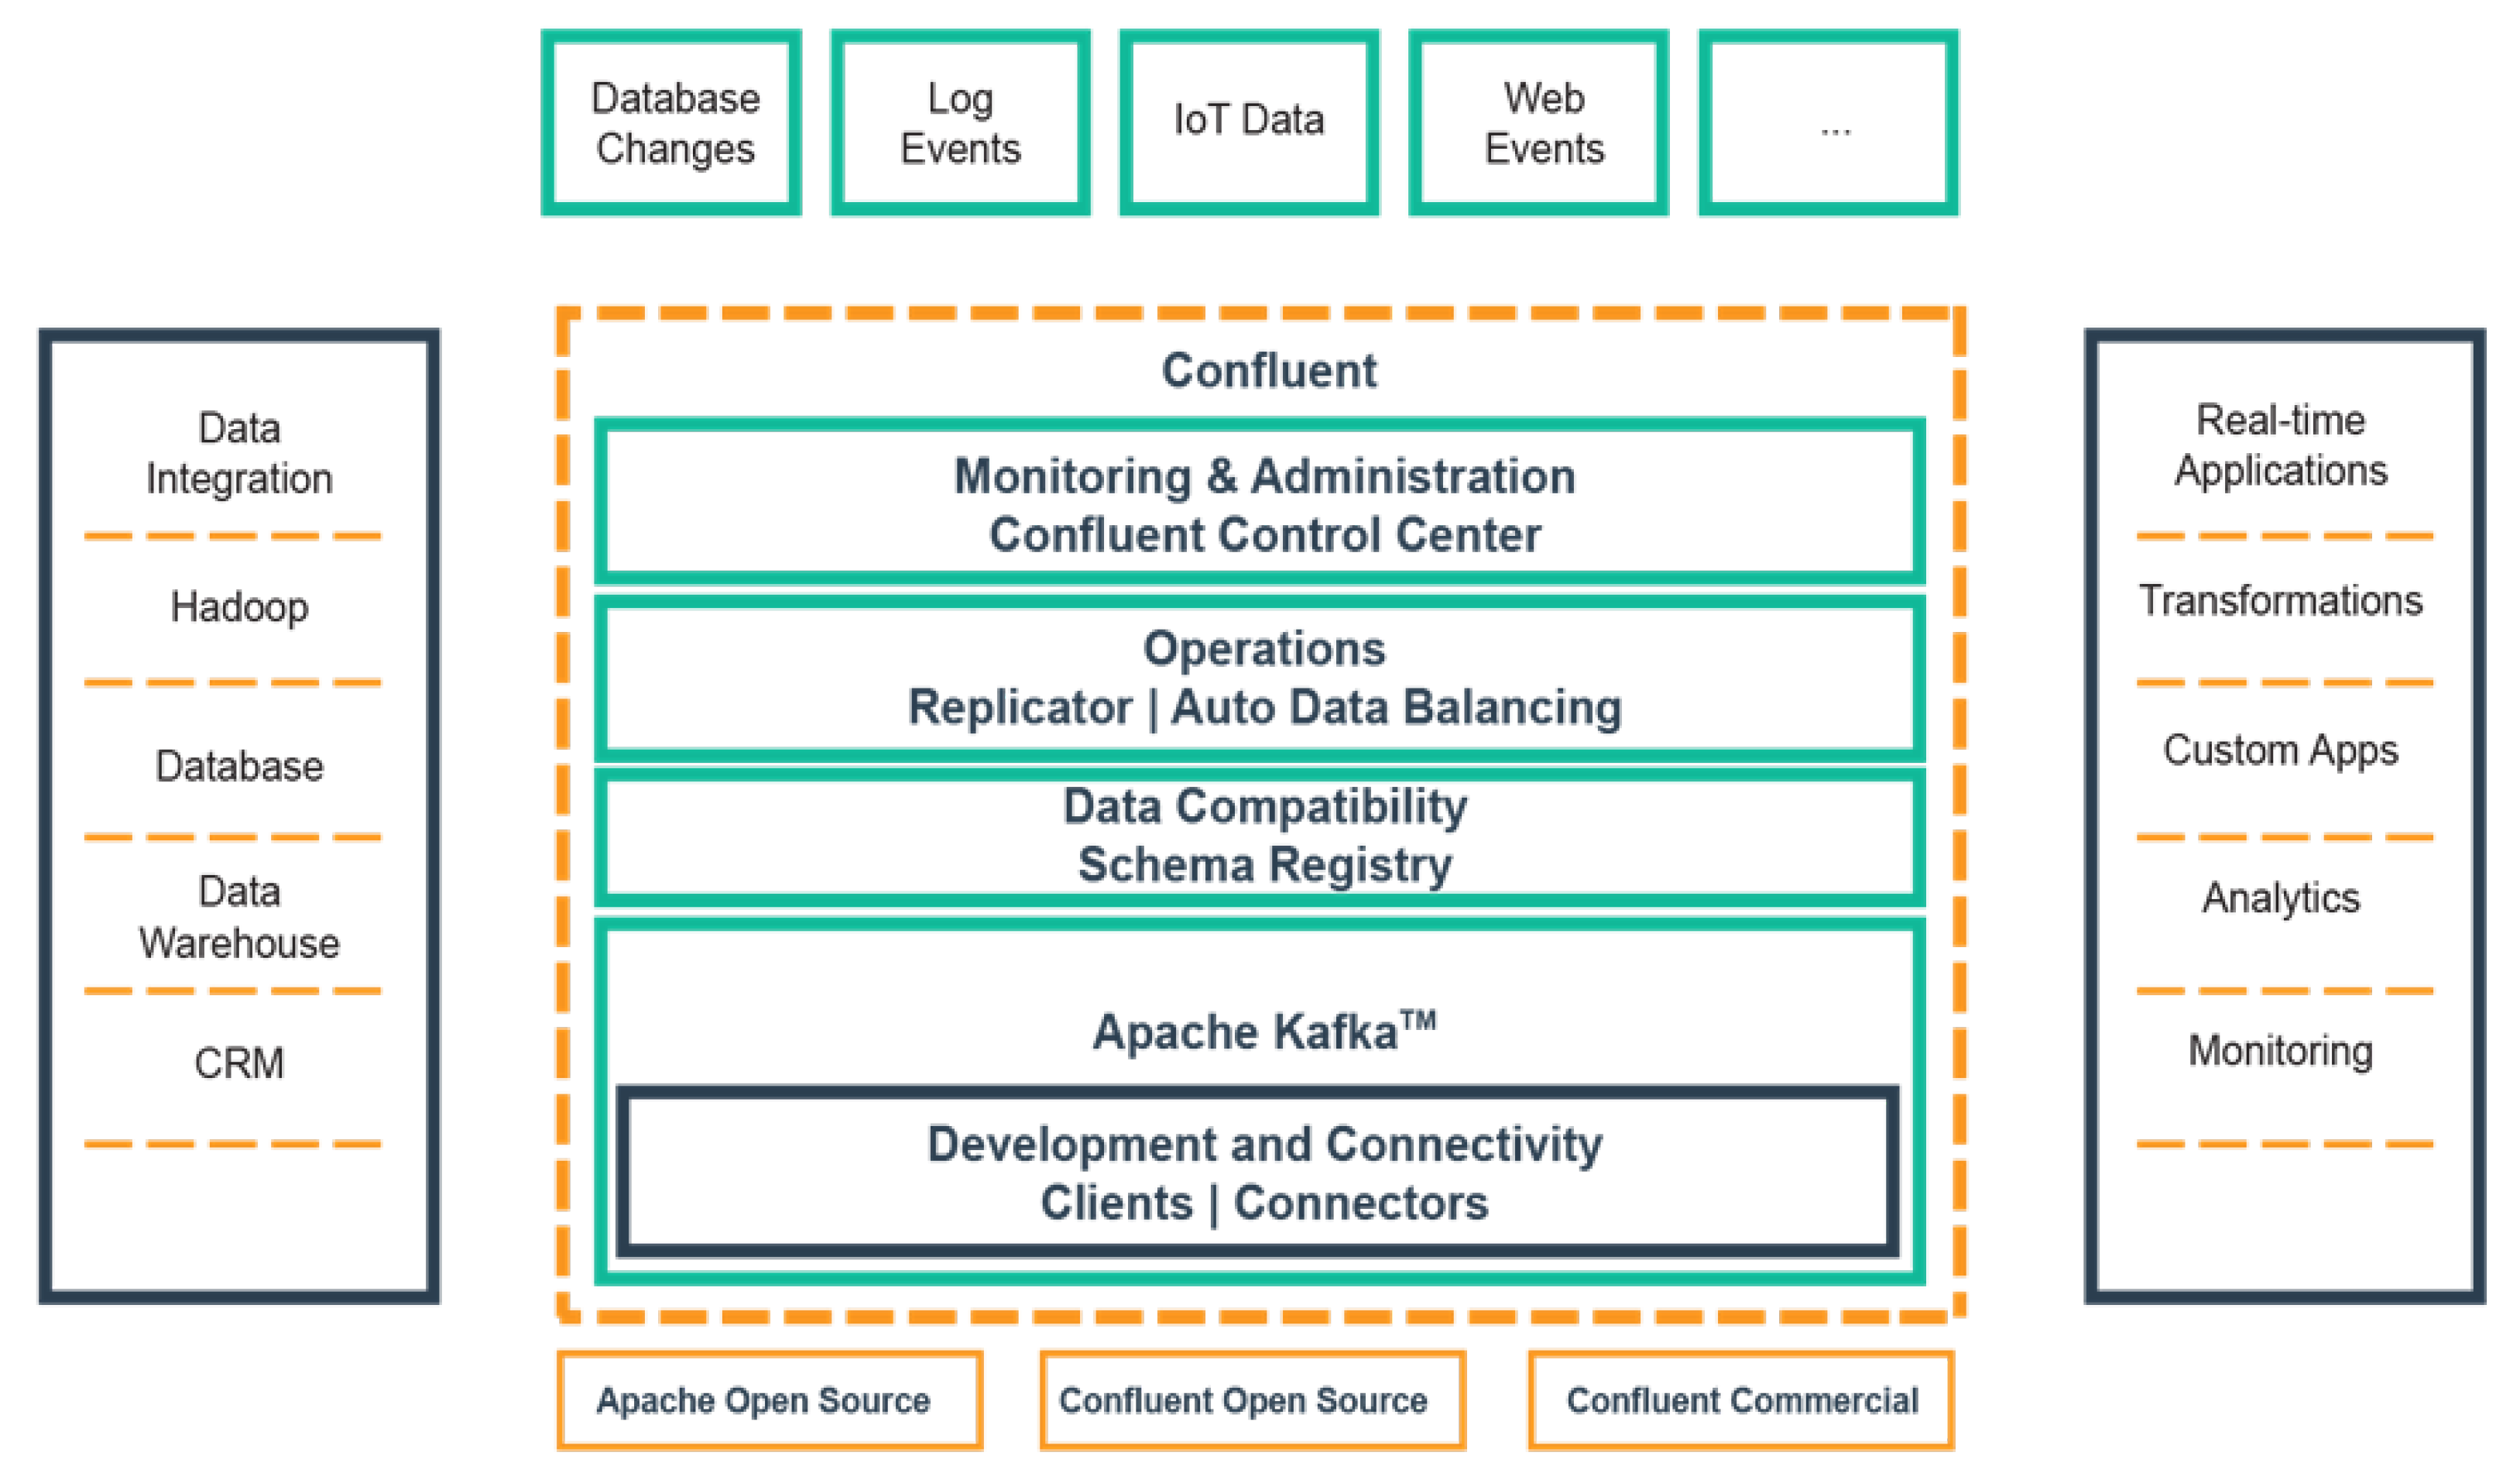
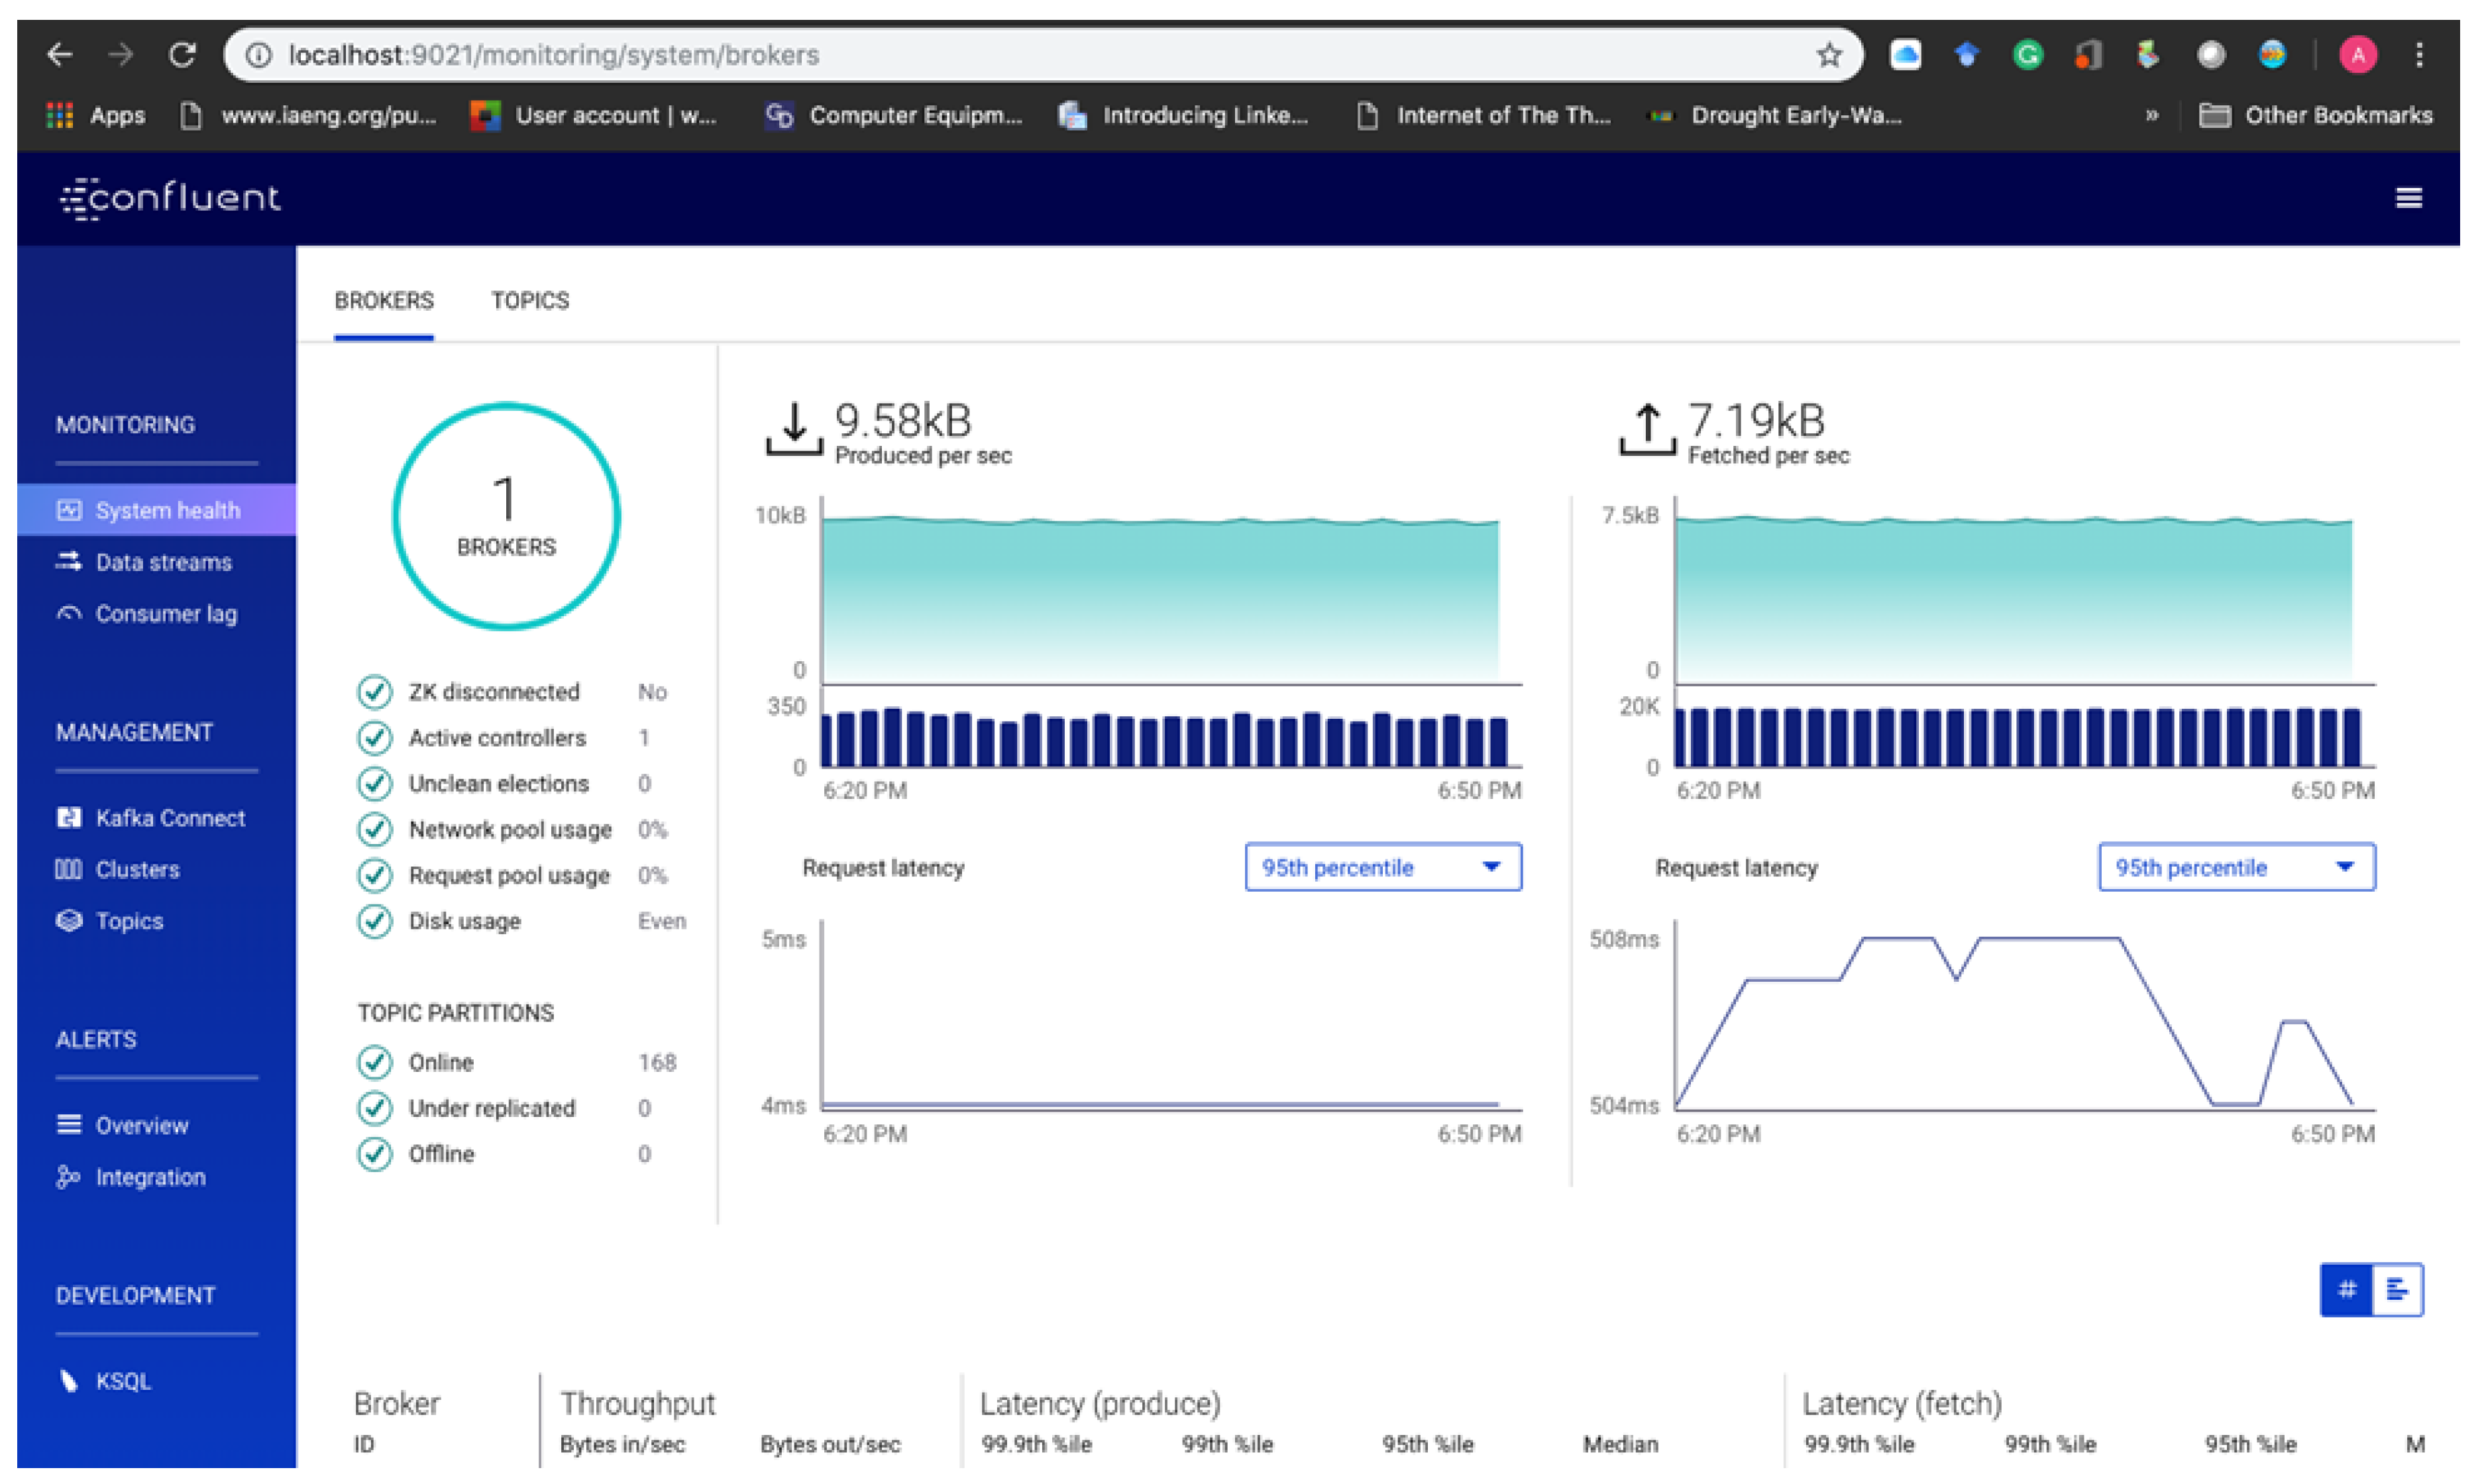
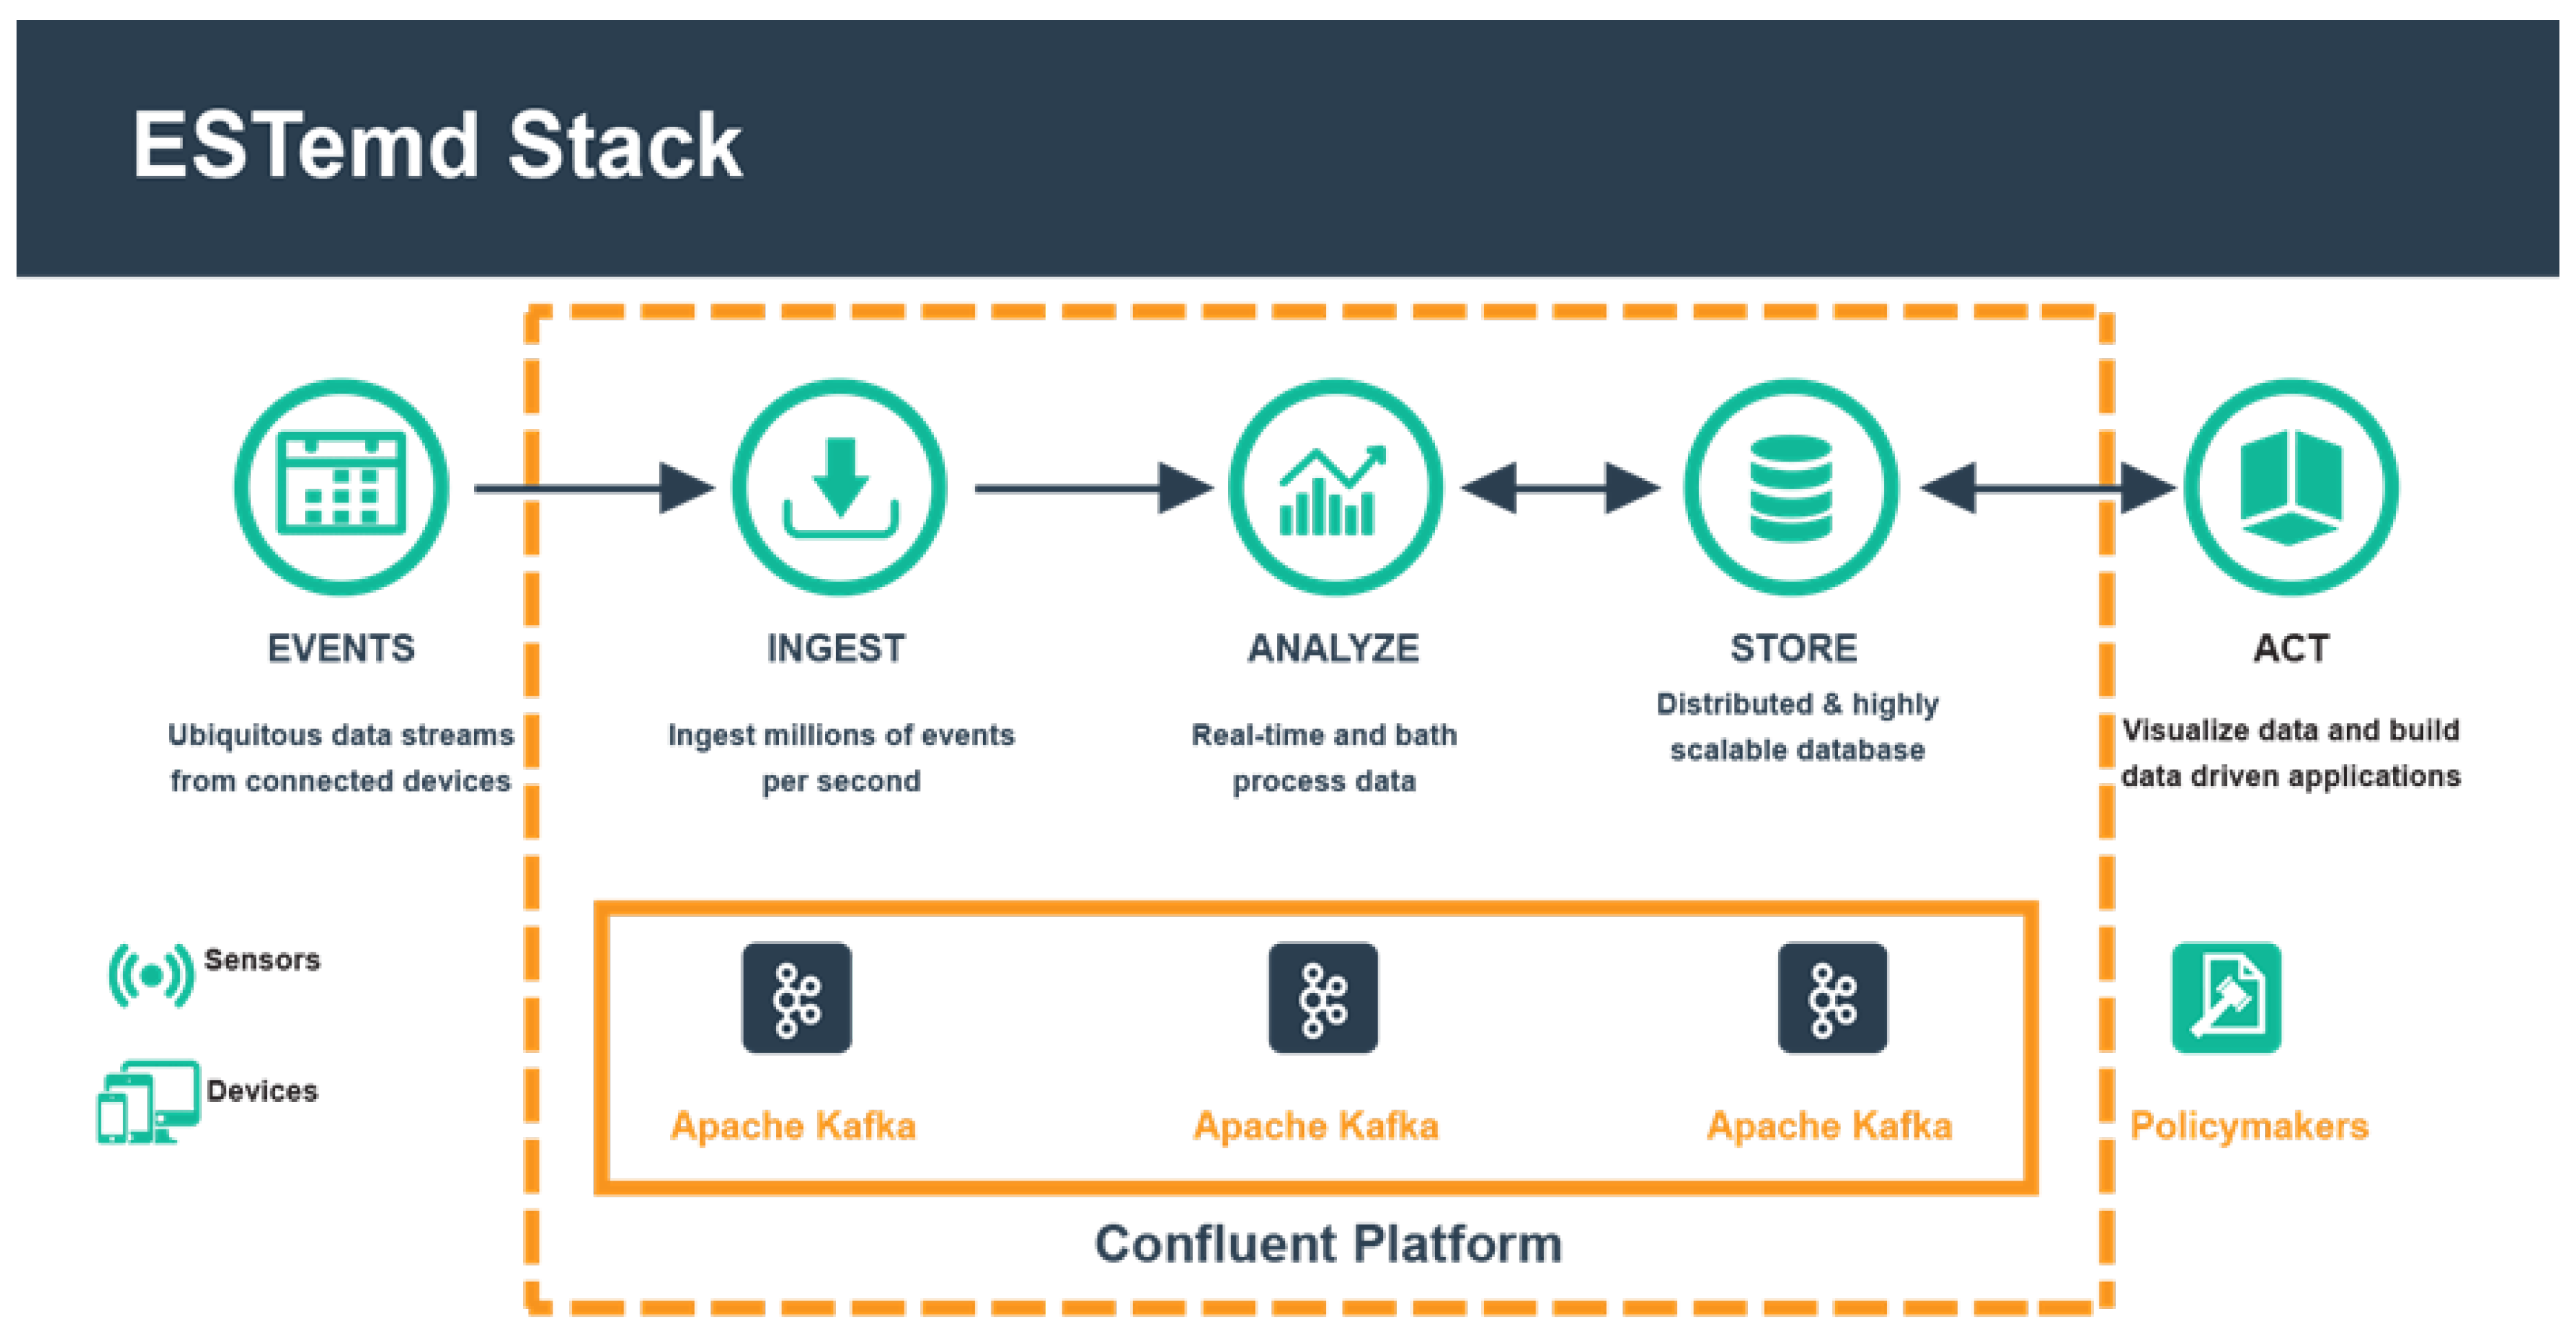
3.1.4. Confluent
3.2. Related Research on the Application of Big Data Analytics
4. Distributed Stream Processing Framework Design
4.1. High-Level Architecture
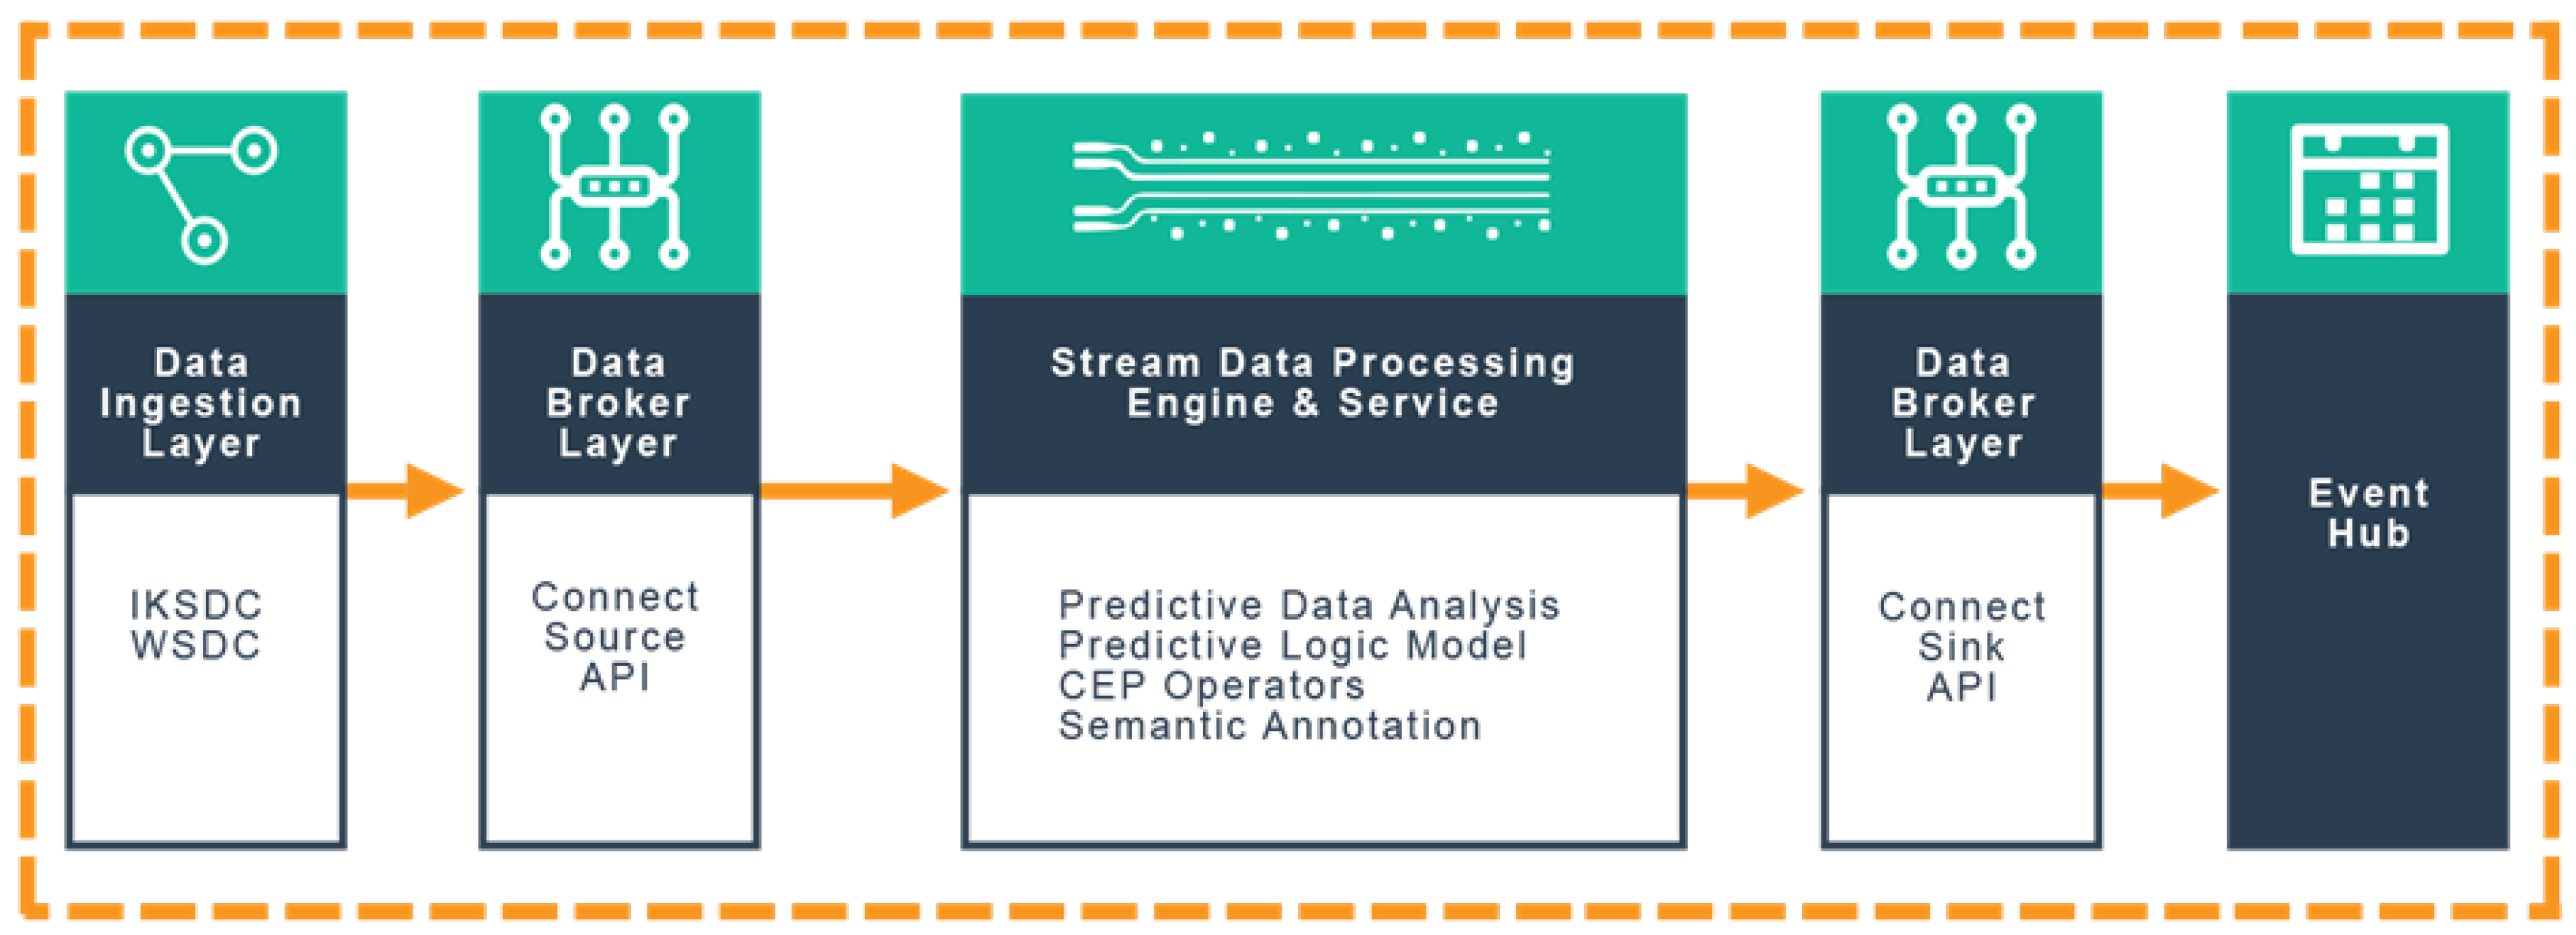
4.2. ESTemd Framework Layers
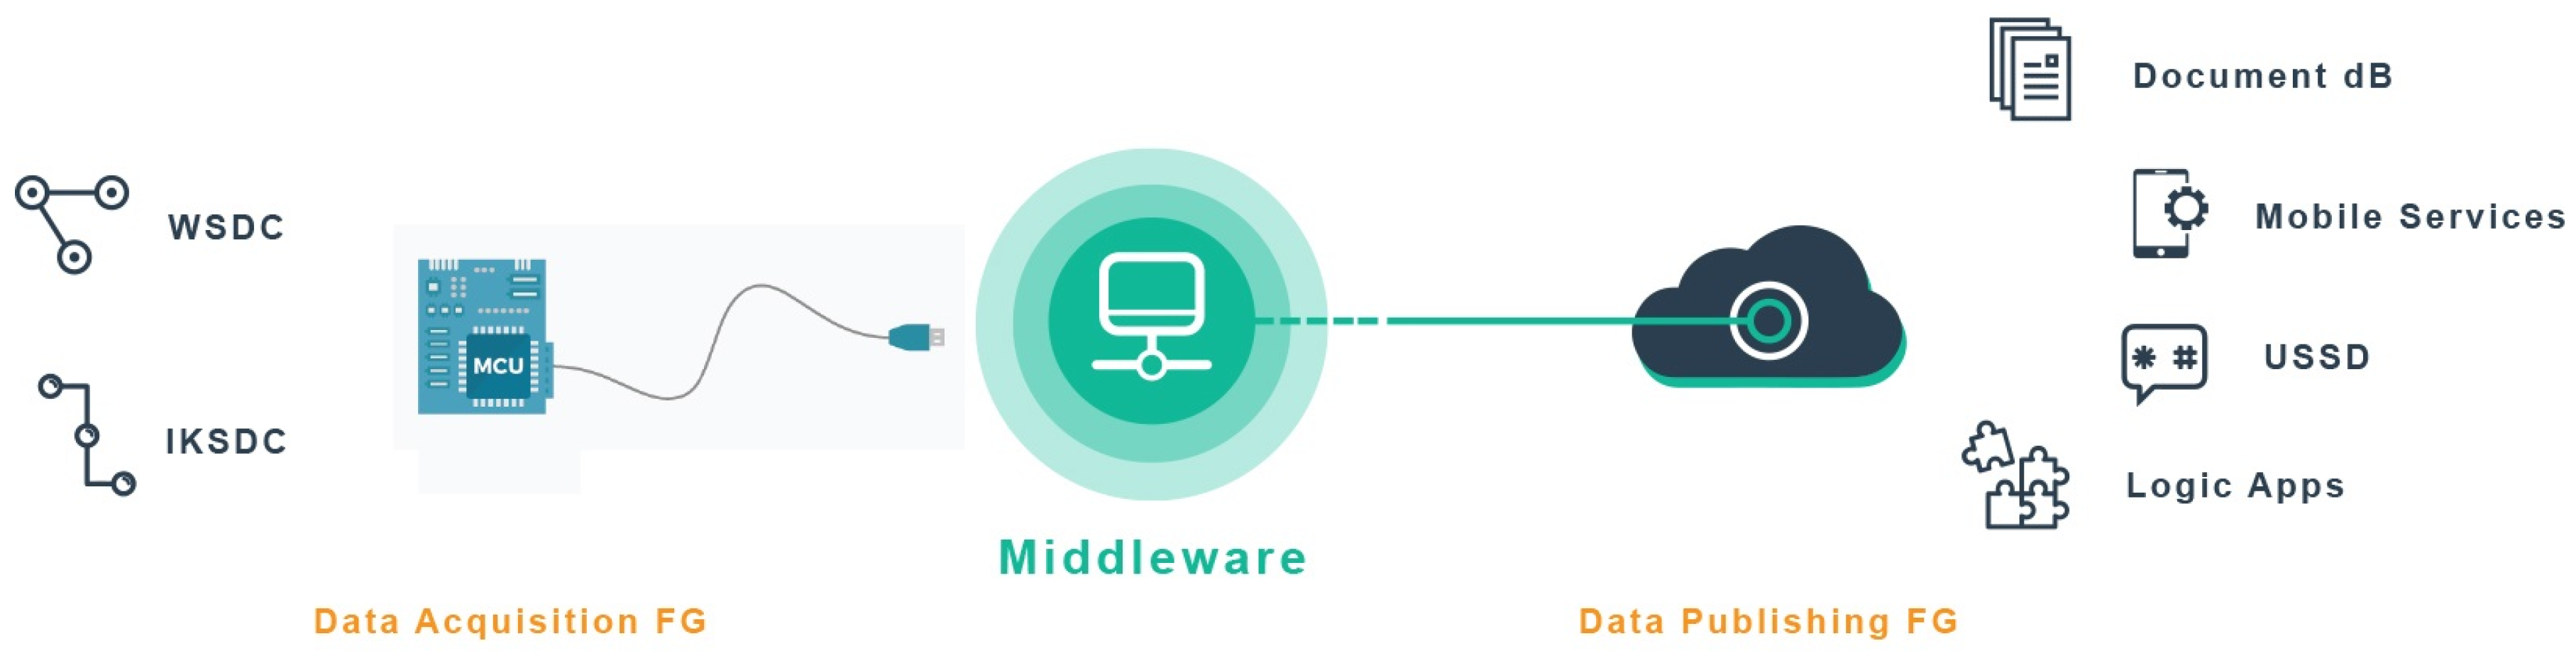
4.2.1. Data Ingestion Layer
4.2.2. Data Broker Layer (Source)
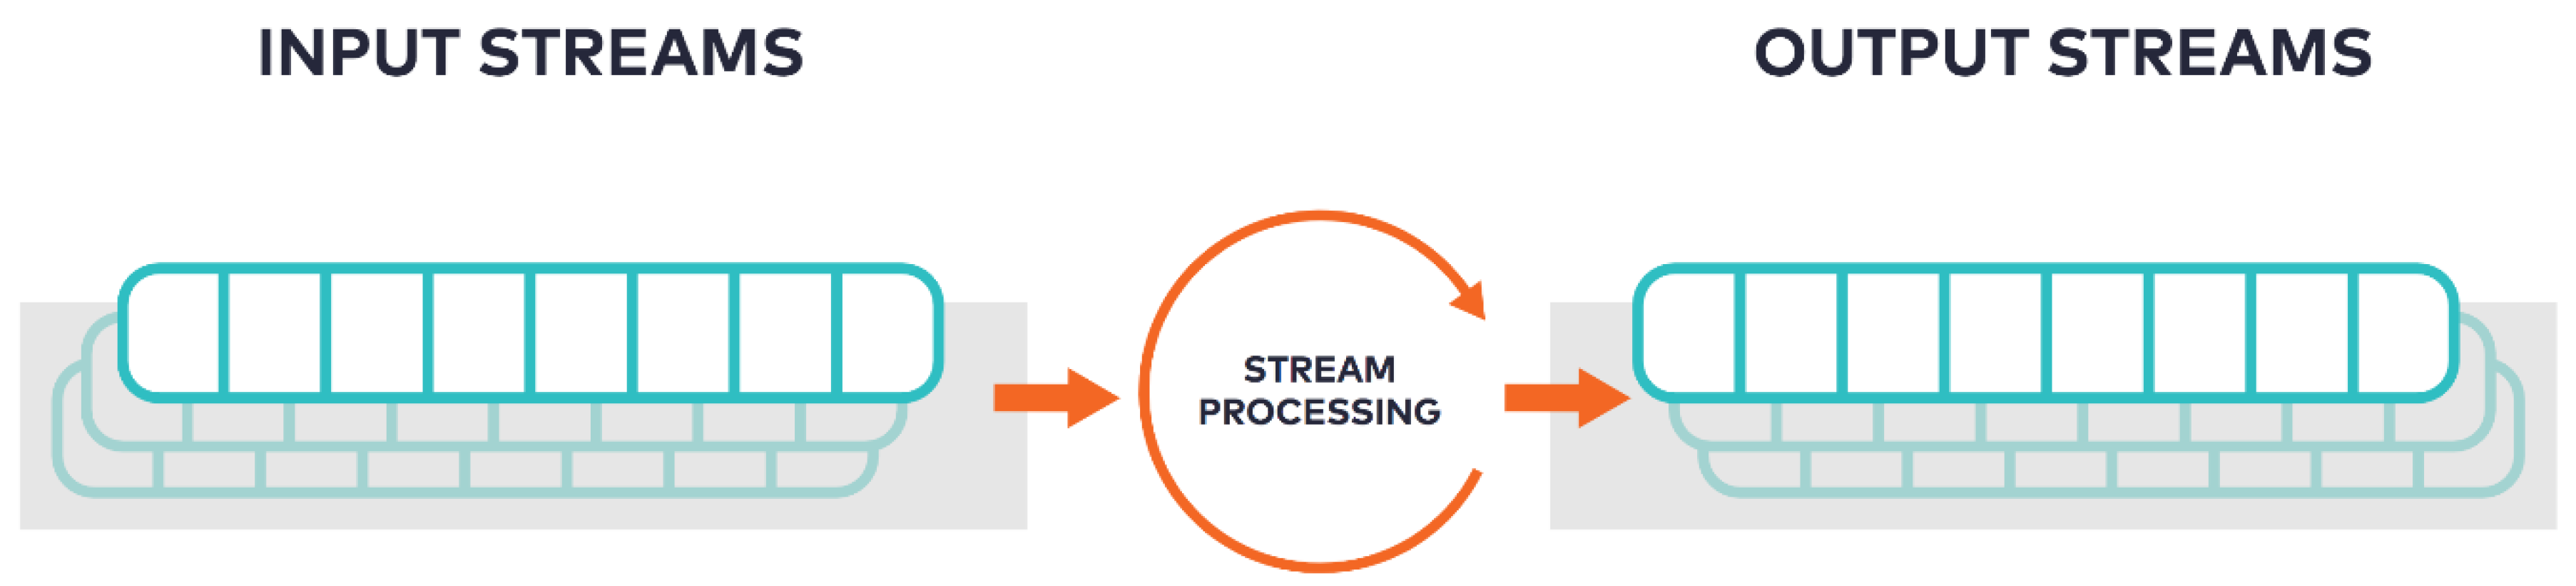
4.2.3. Stream Data Processing Engine and Service Layer
Predictive Data Analytics
Kafka CEP Operators
4.2.4. Data Broker Layer (Sink)
4.2.5. Event Hub
5. Use Case
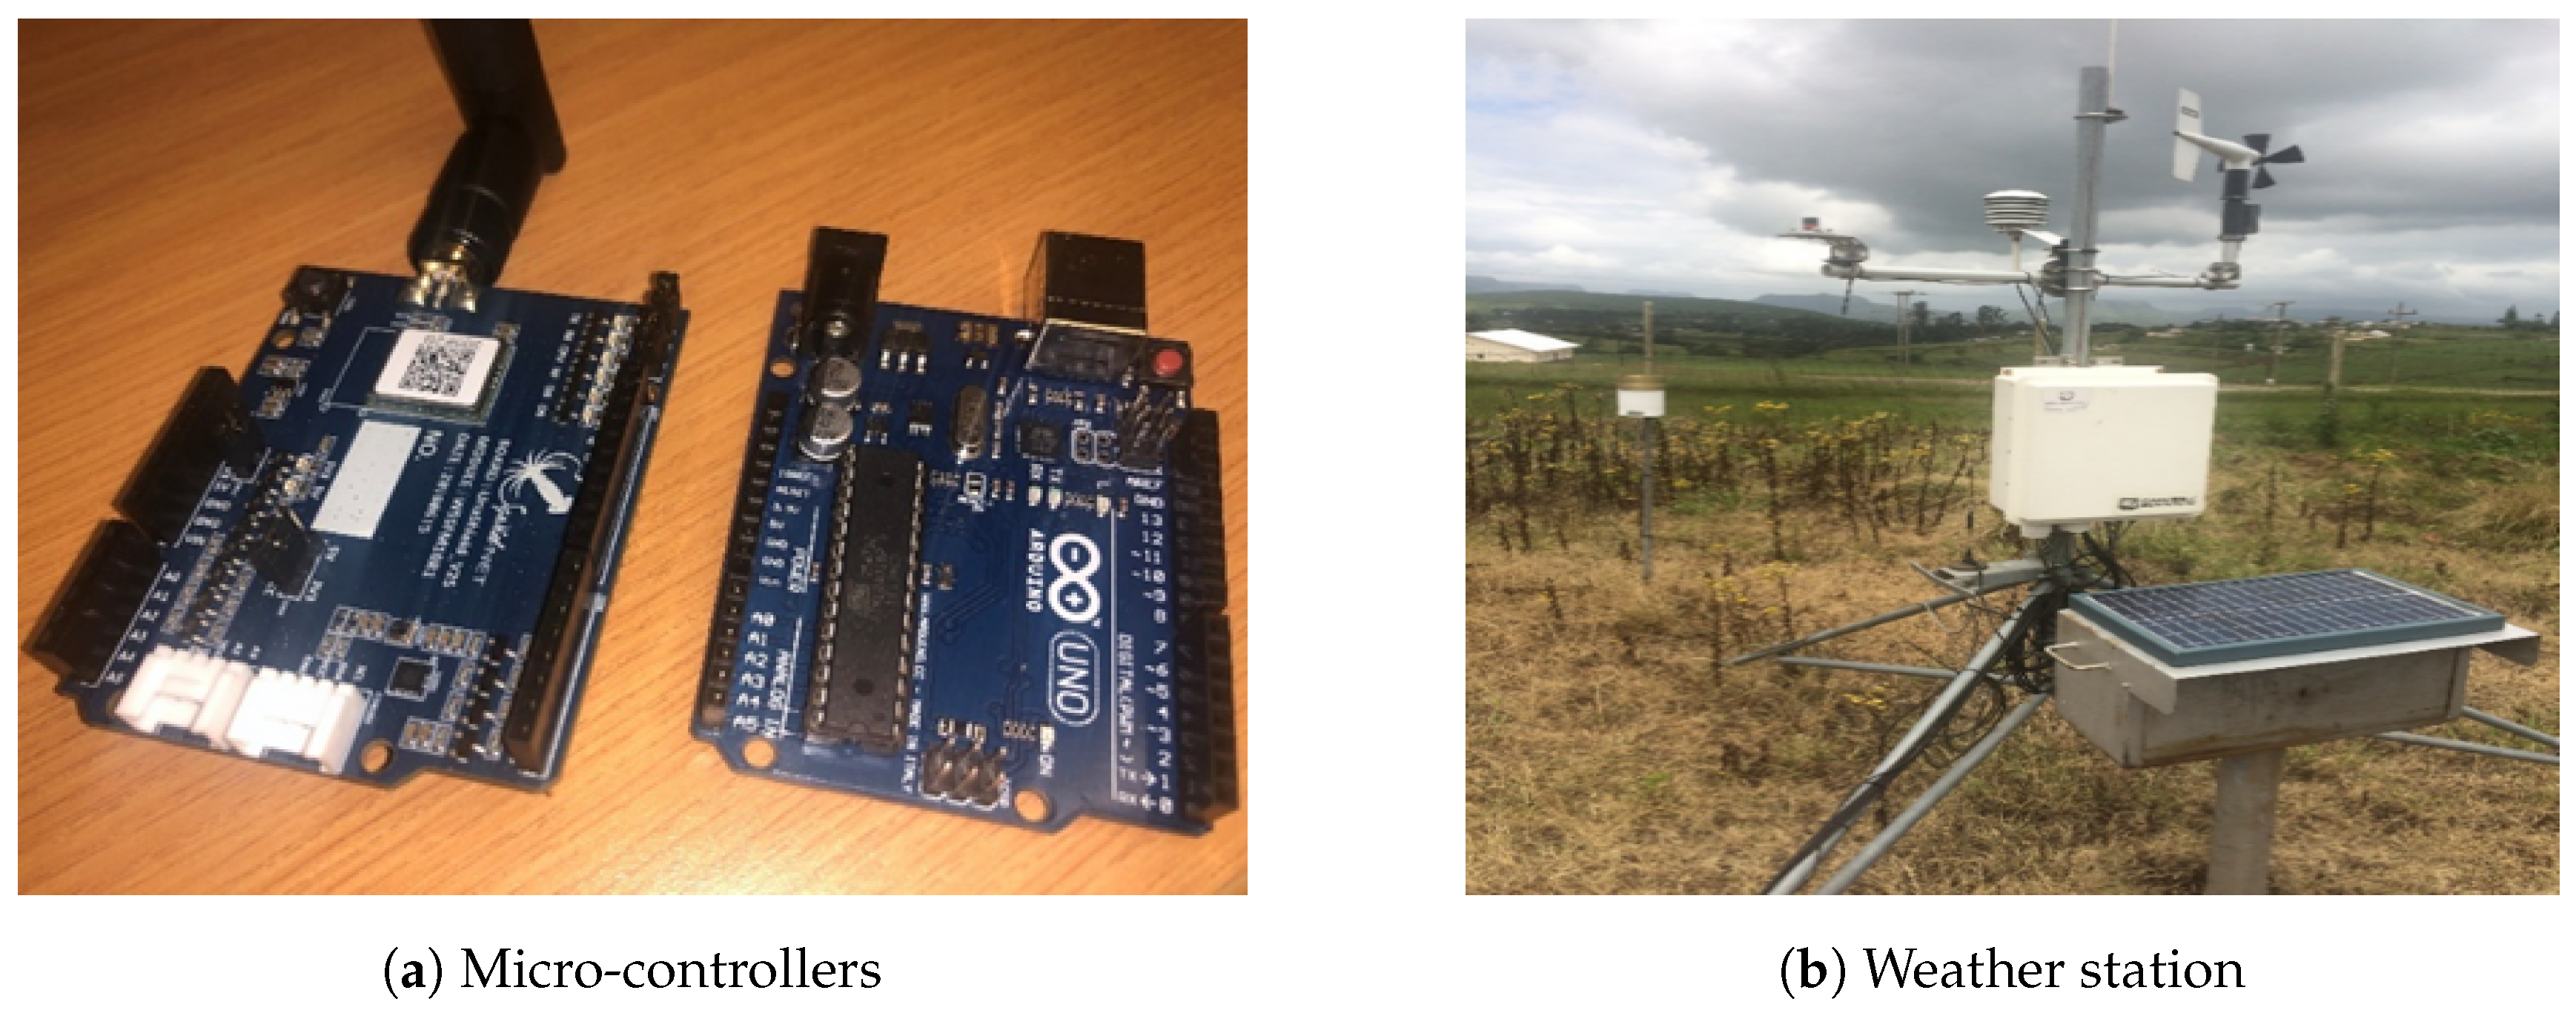
5.1. Experimental Setup
5.2. Data Sources
5.3. Predictive Model Logic—Effective Drought Indices (EDI)
5.4. Methods
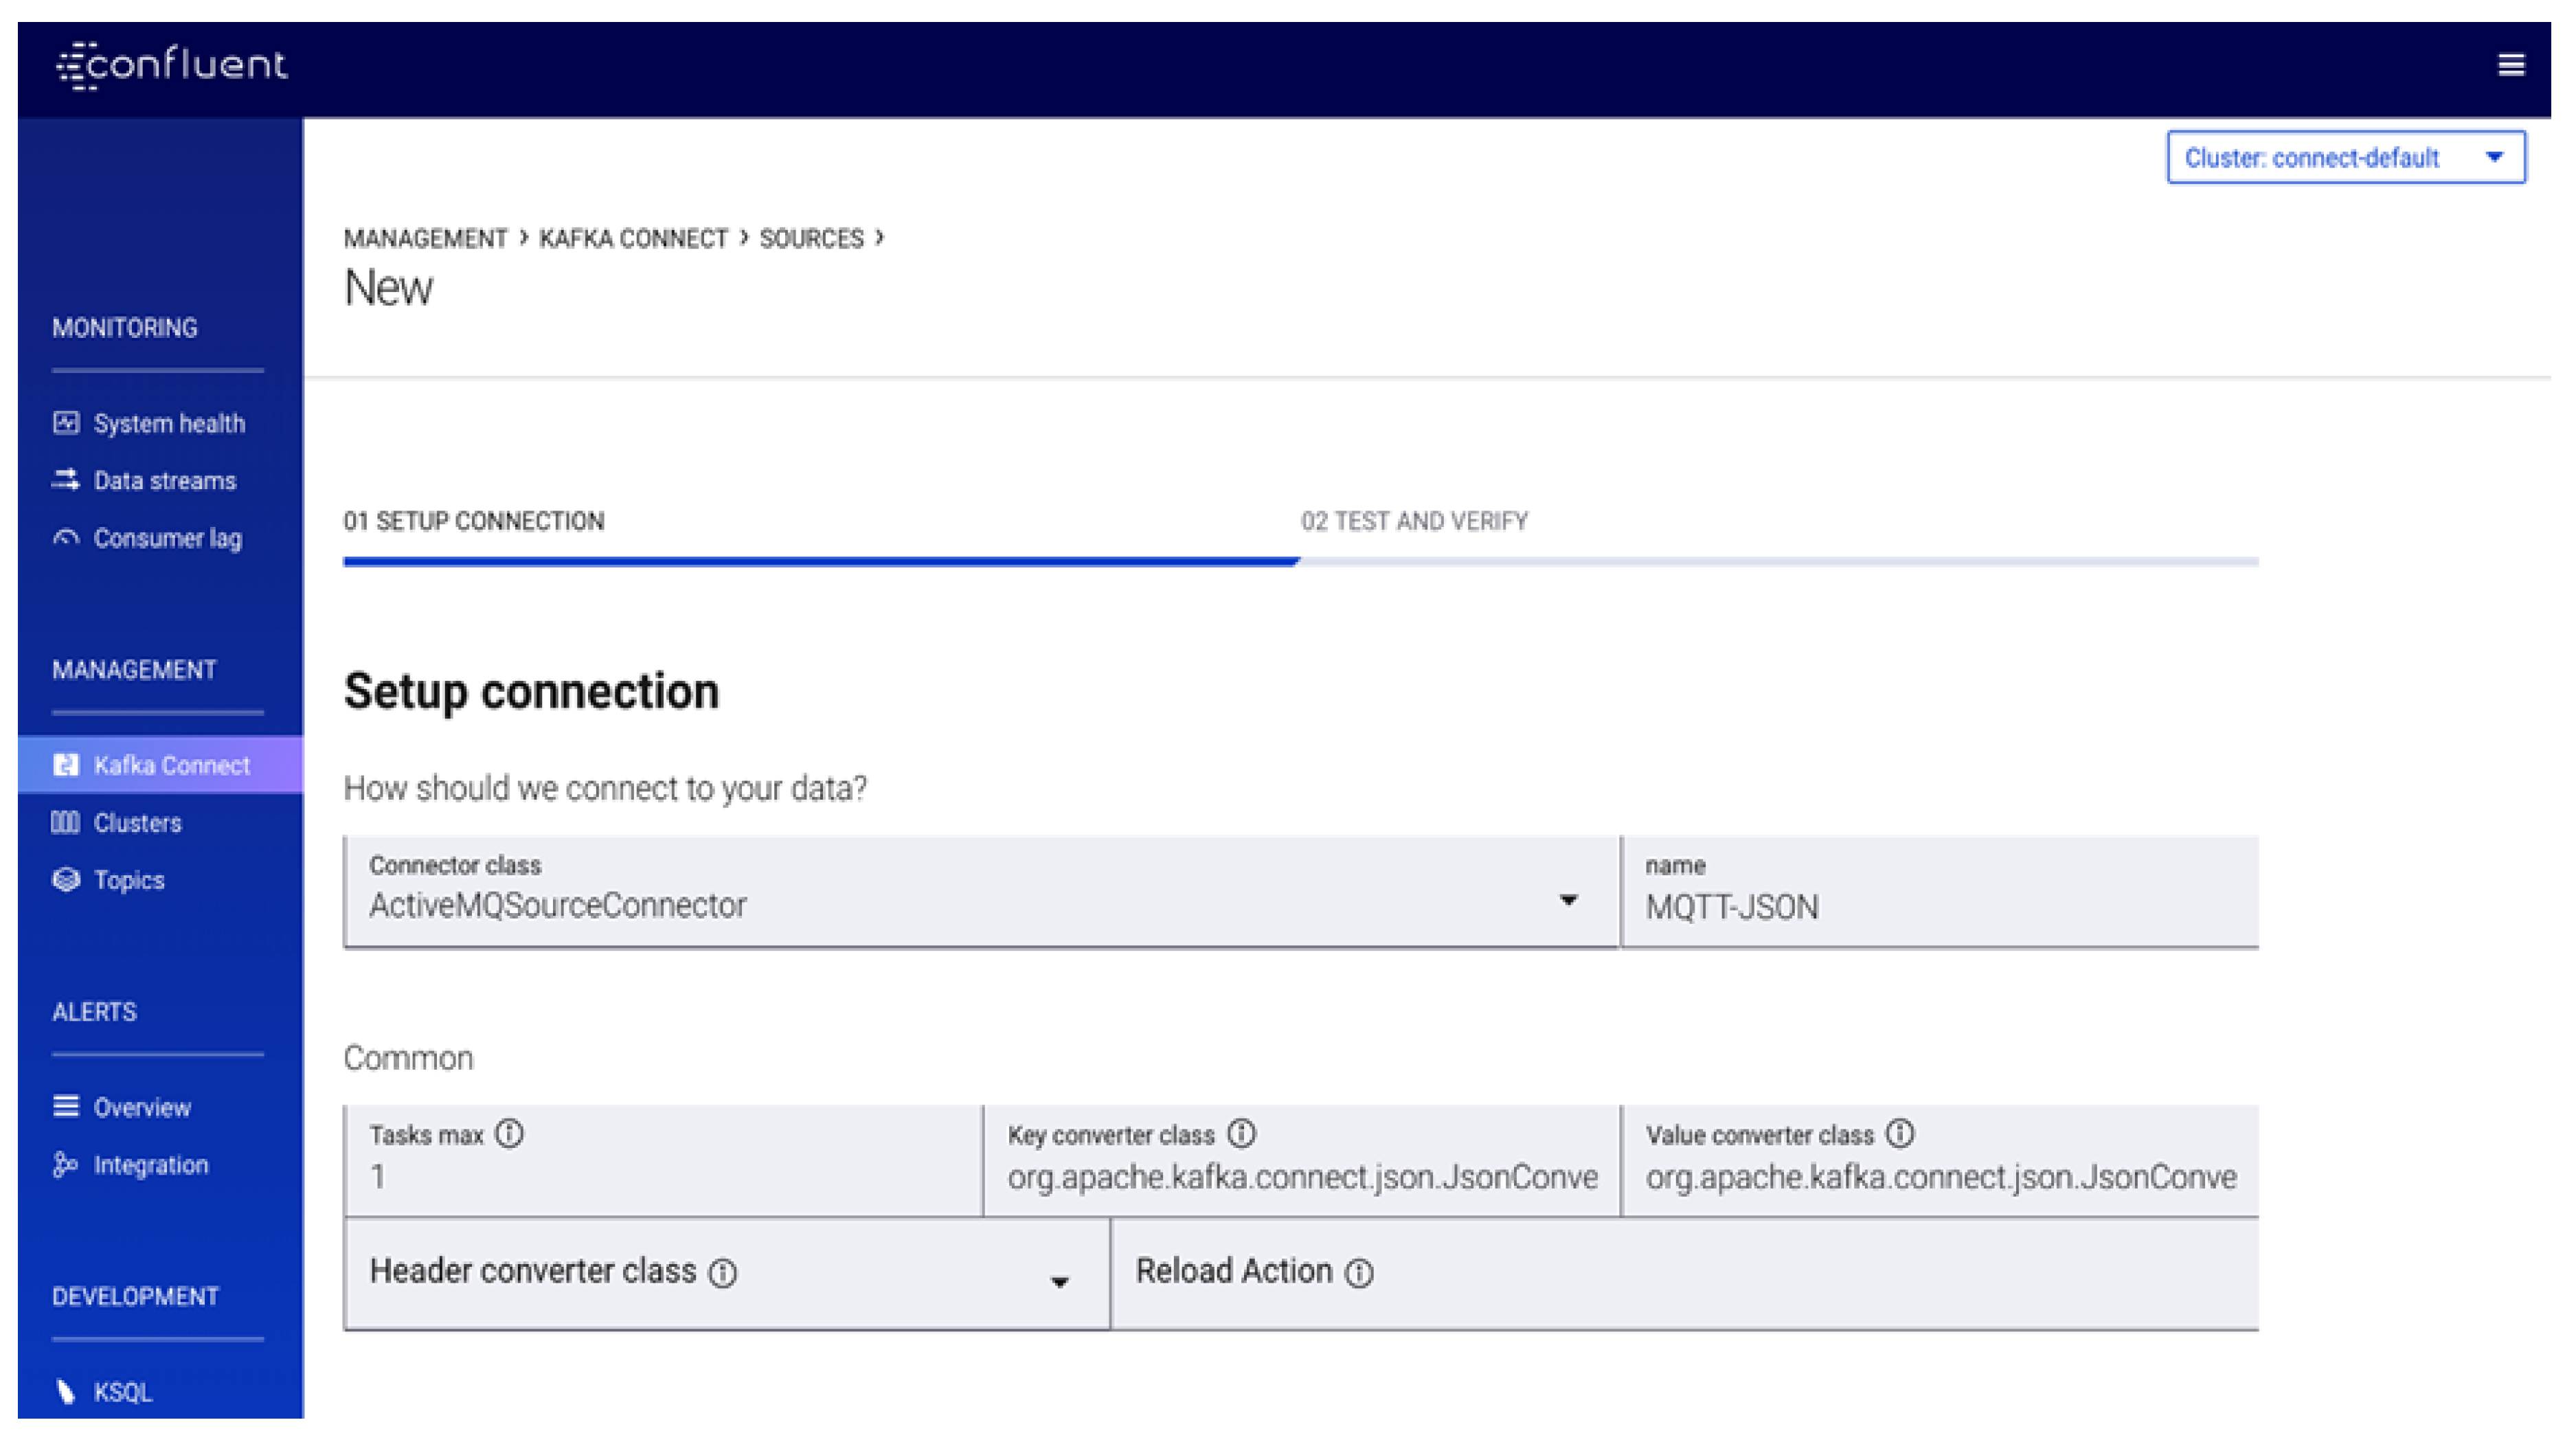
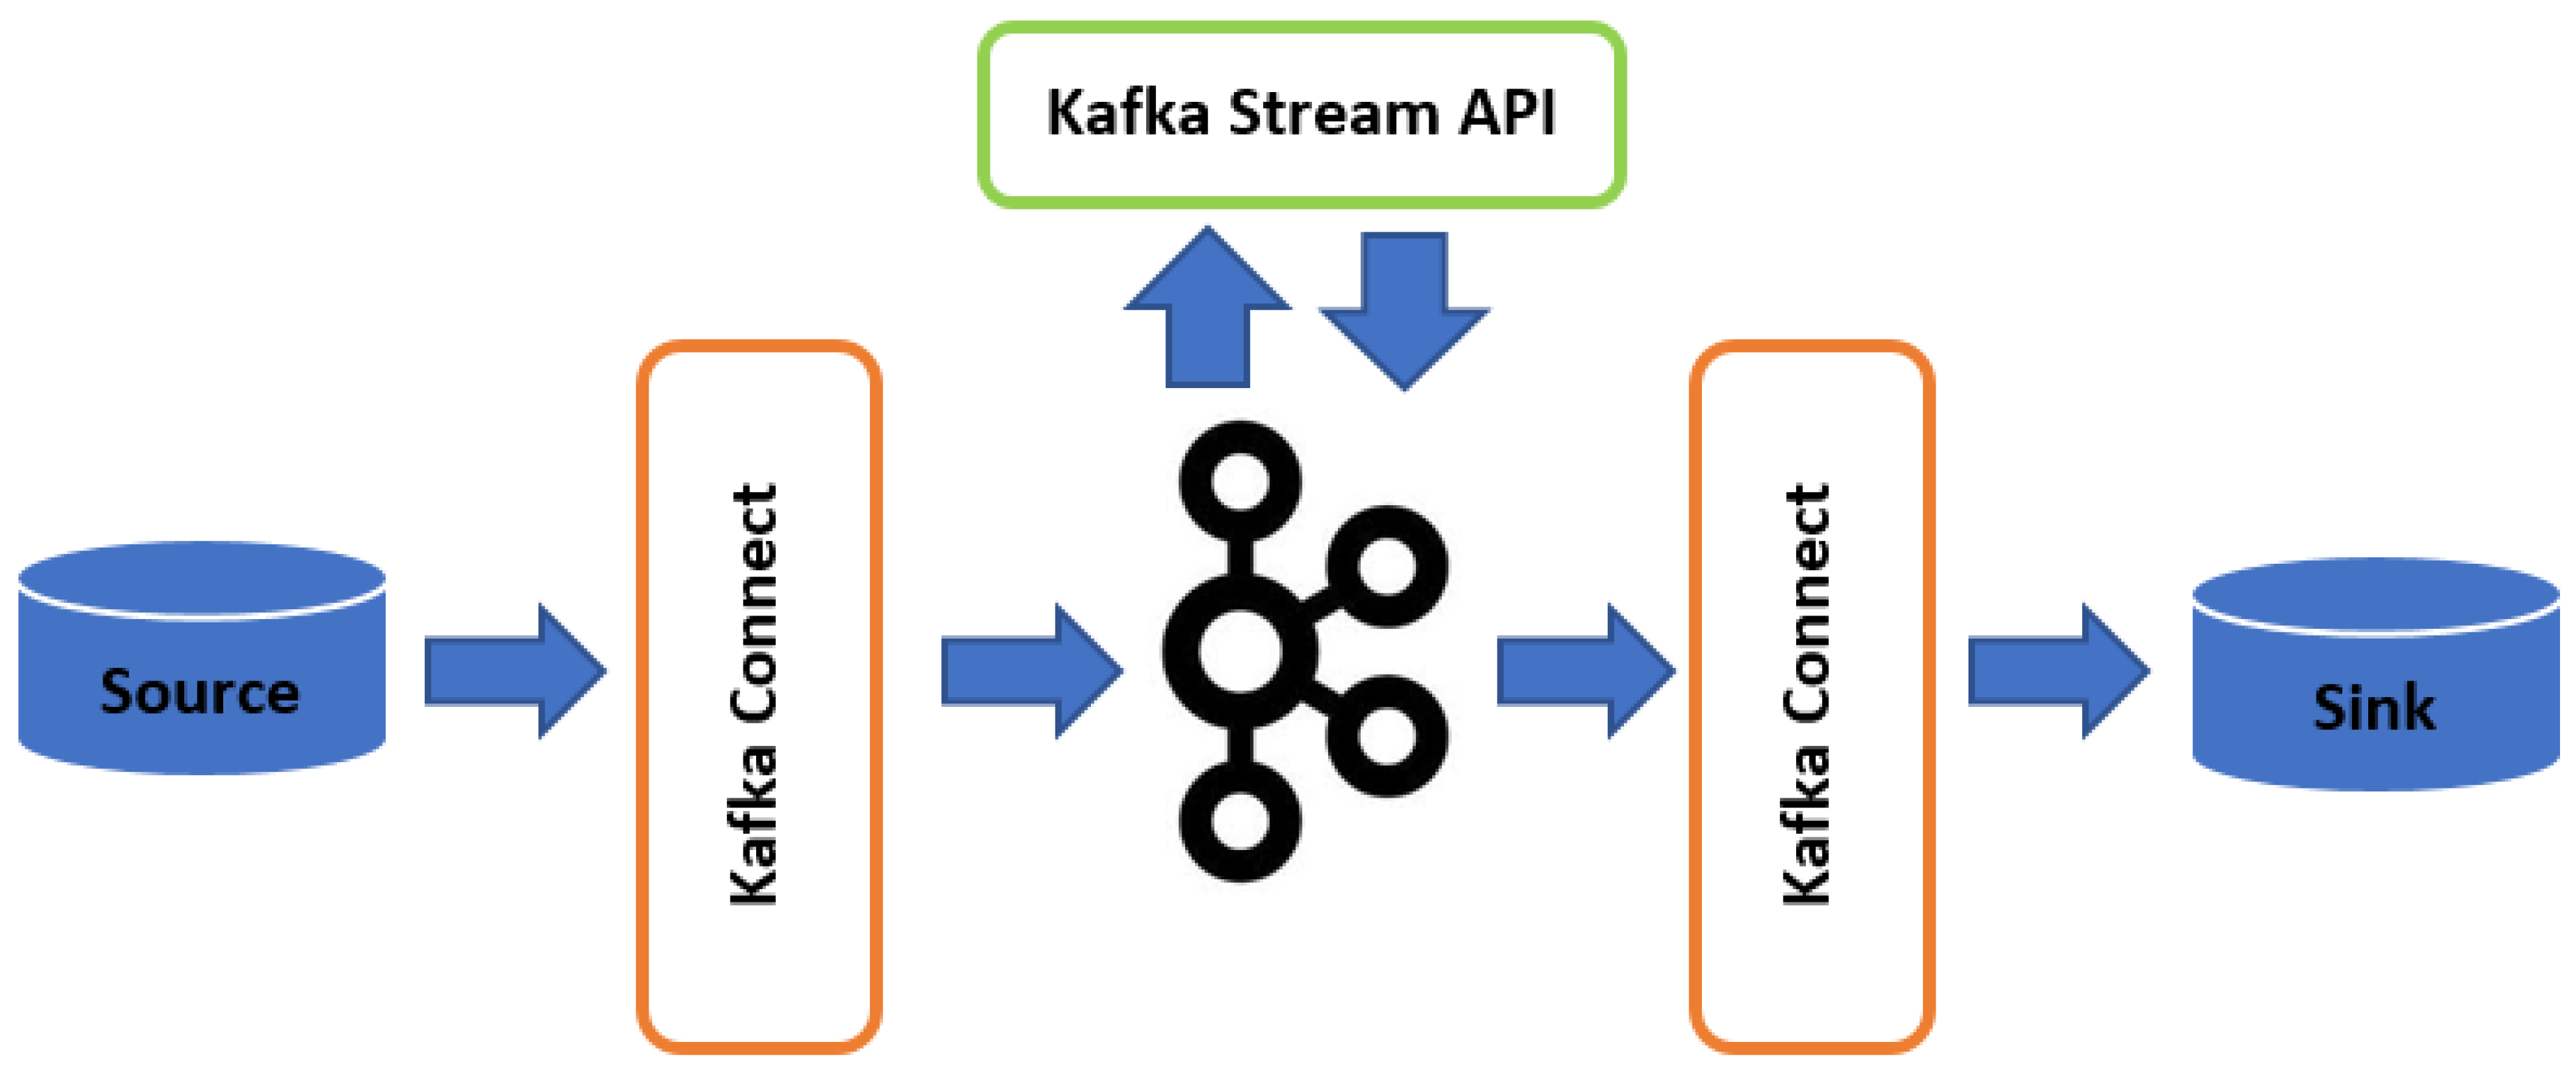
5.4.1. Configuring Unified Data Pipelines Using Kafka Connect
5.4.2. Producers Messages
5.4.3. Workflows
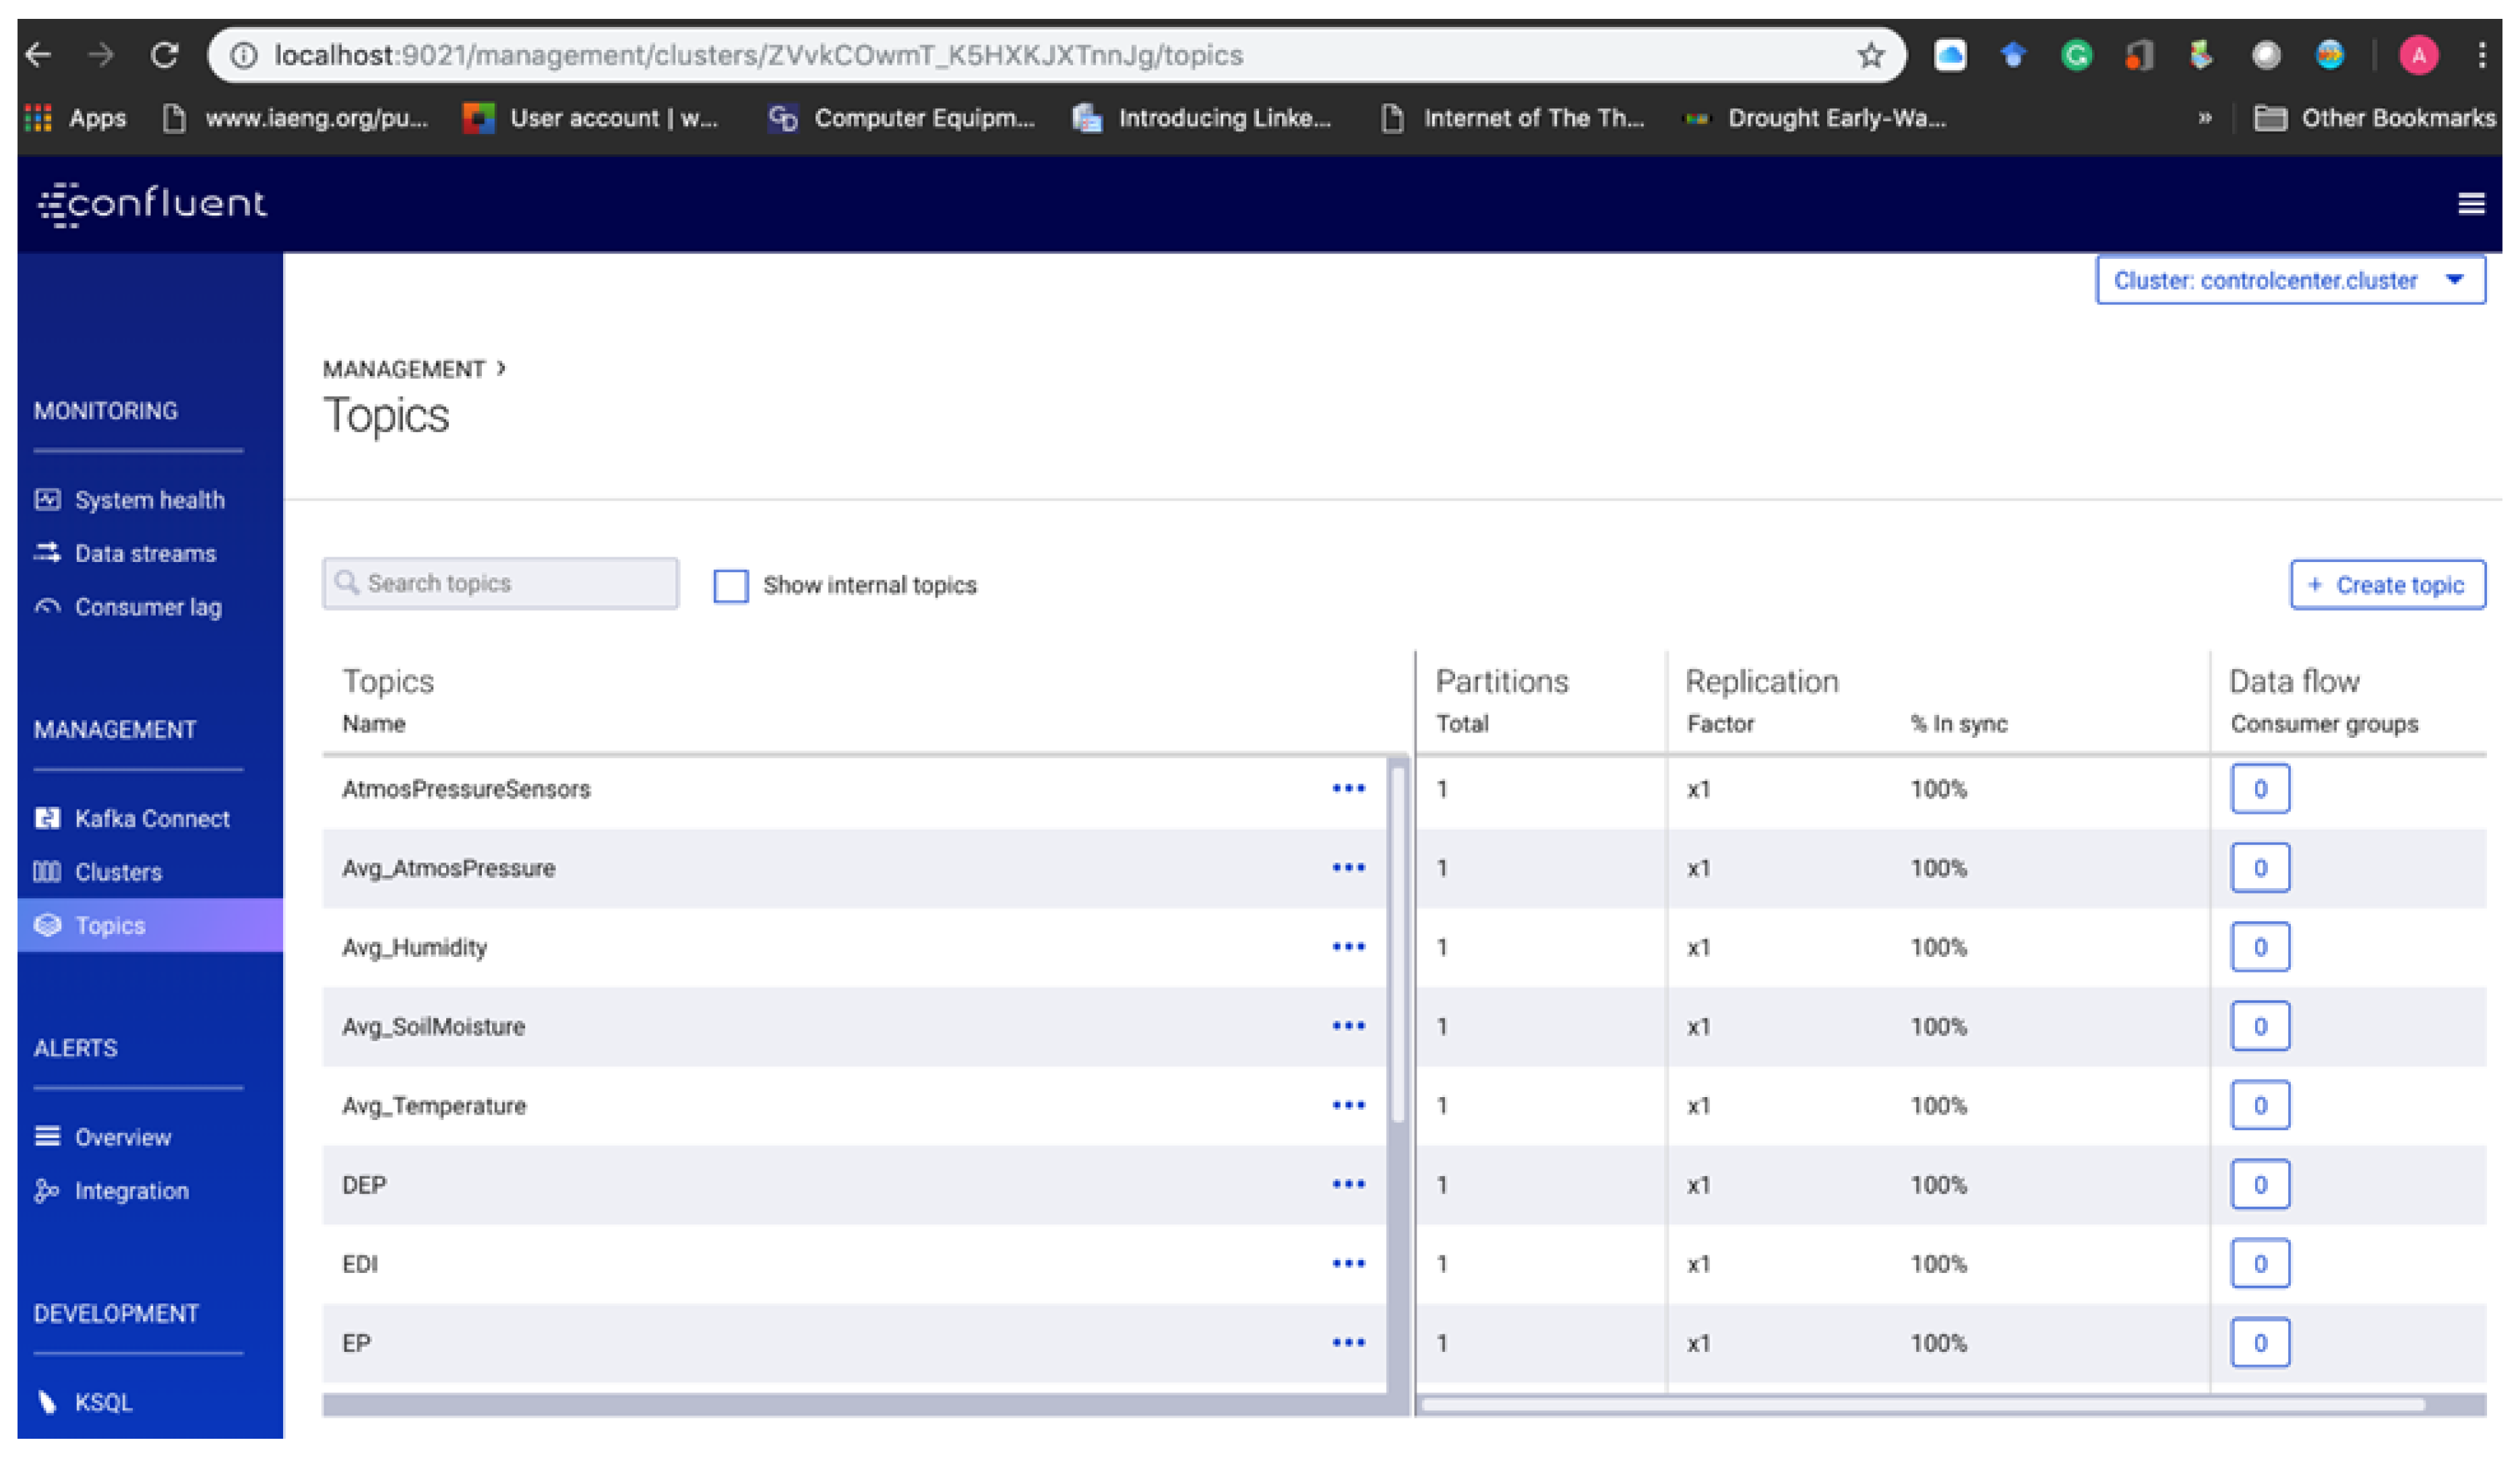
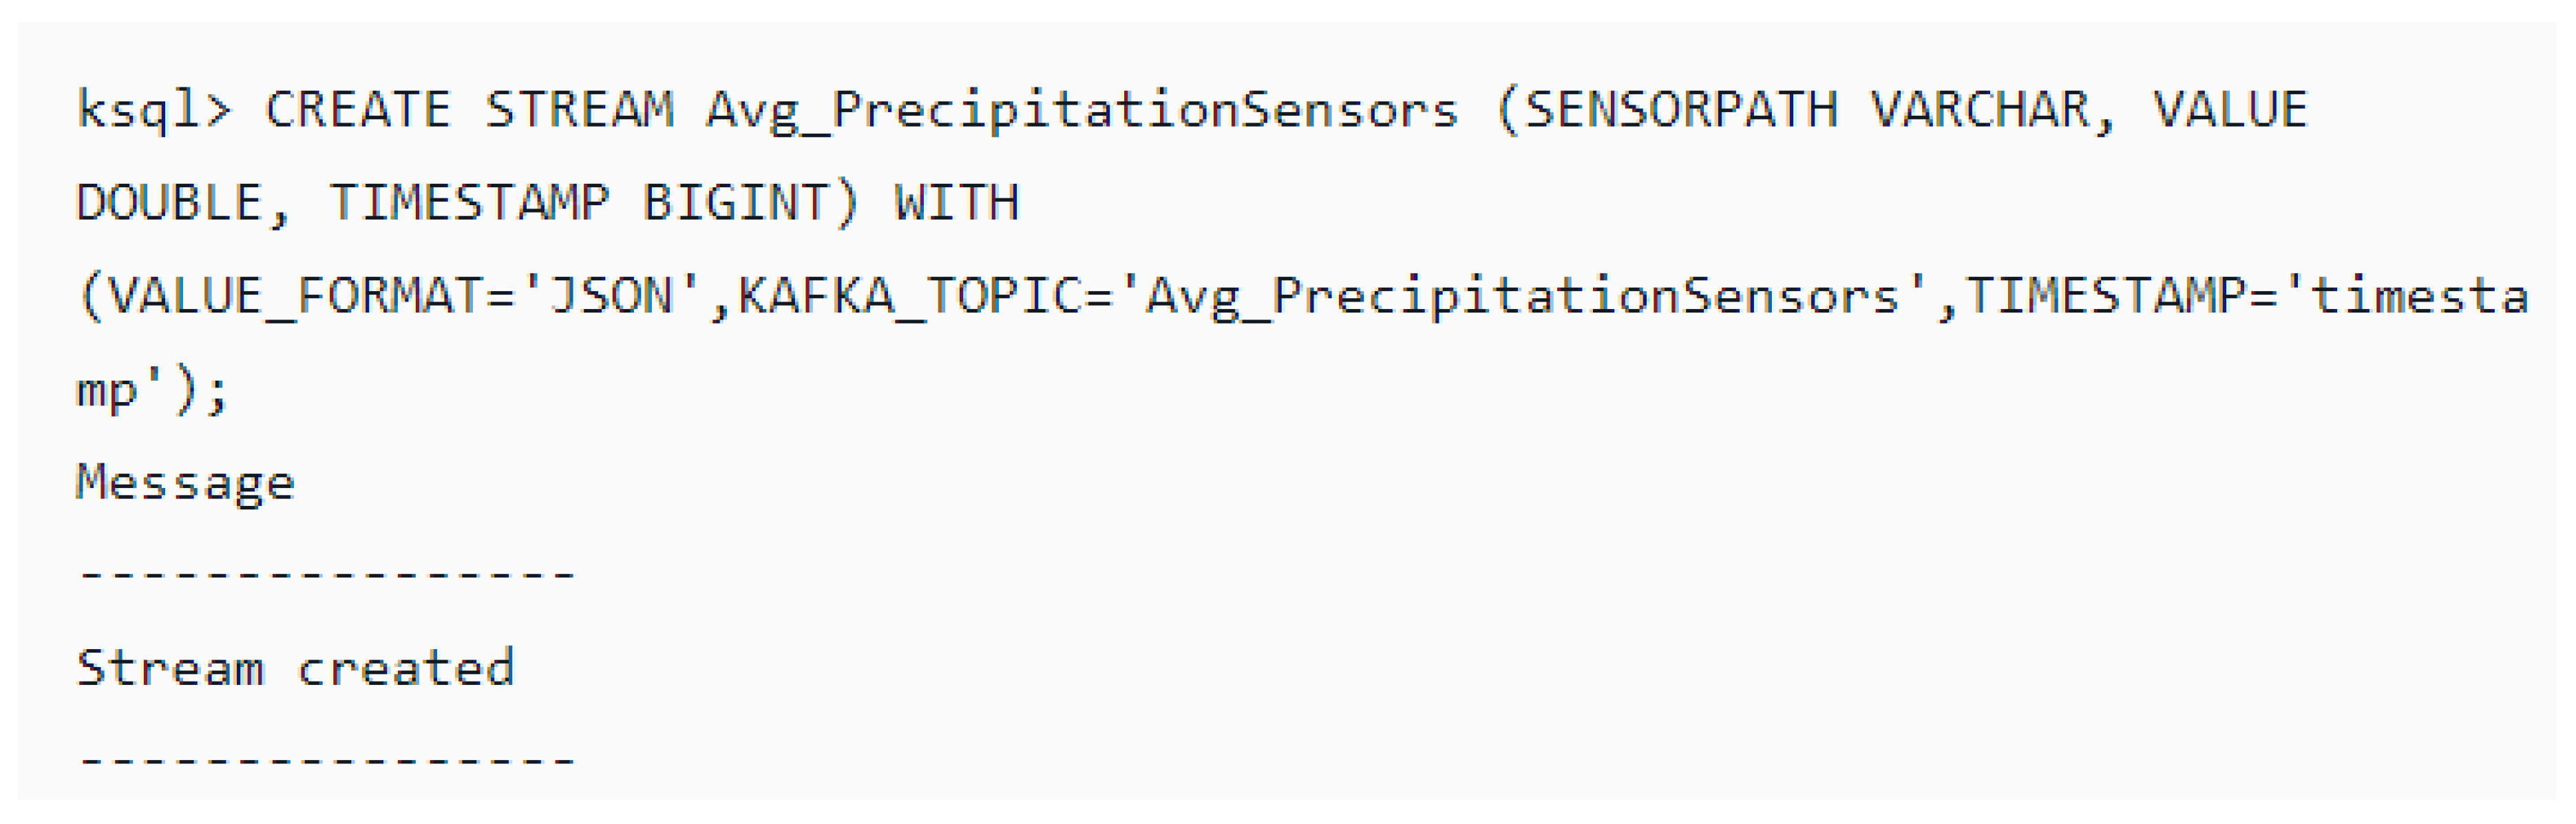
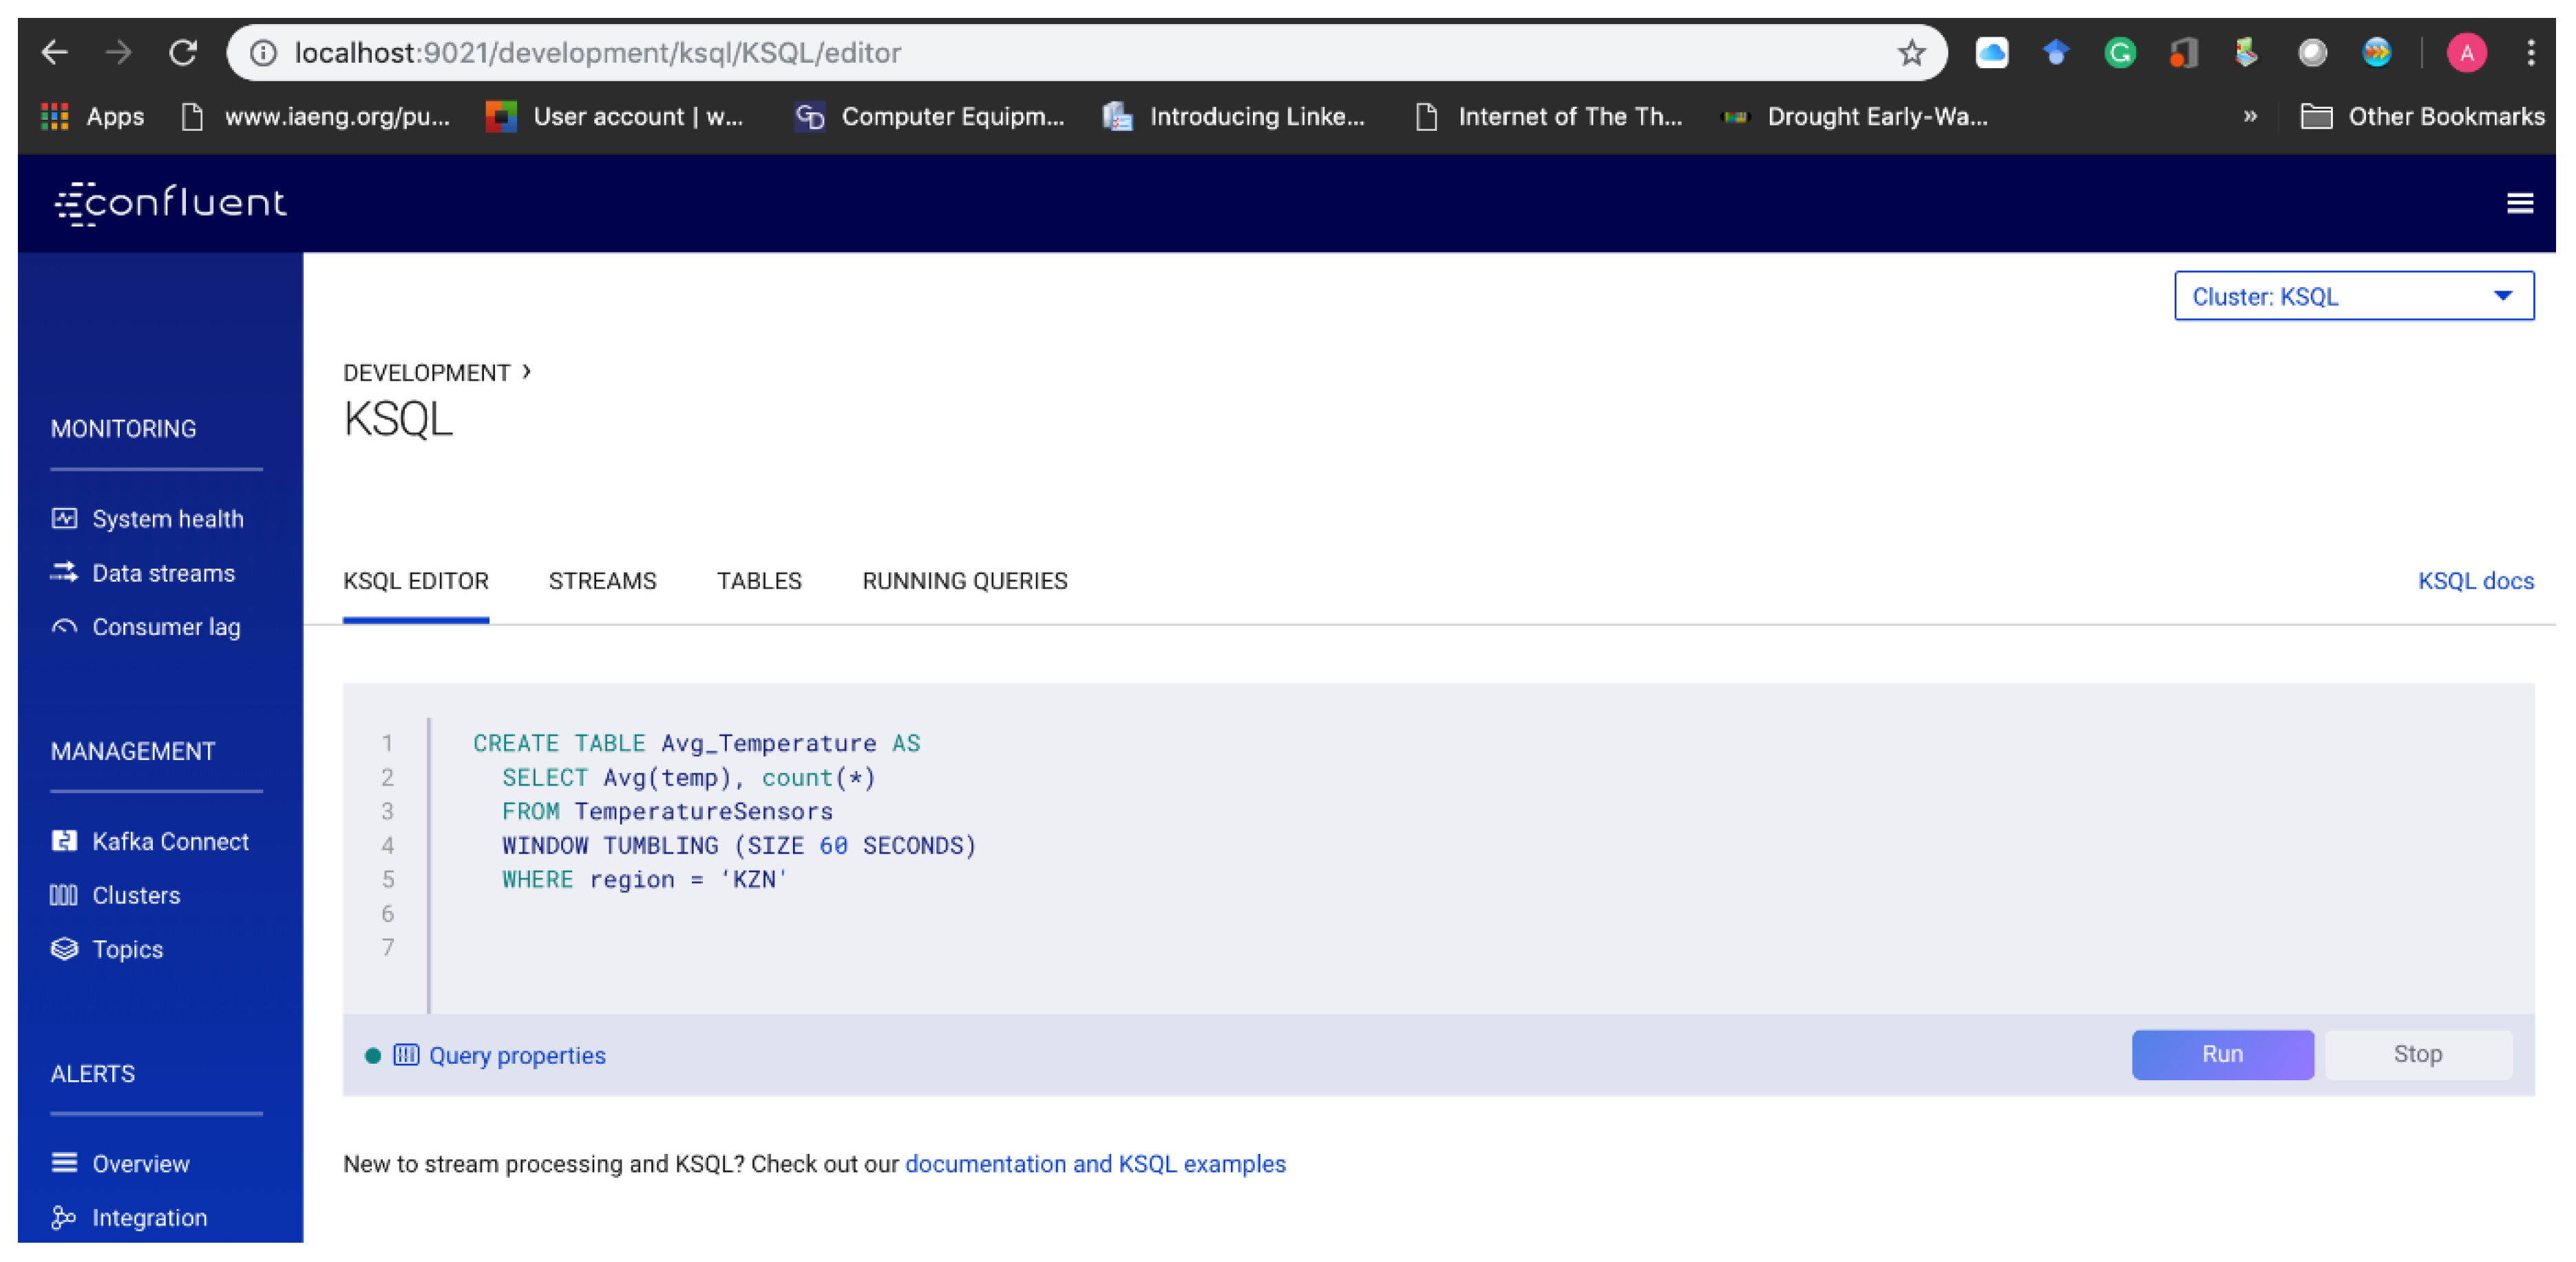
5.4.4. Persistent Querying/Analysis of the Data Streams Using KSQL
| Algorithm 1: KSQL Querying Algorithm | |
| The querying algorithm is a logic generated from the EDI model Formula (1)–(3): | |
| Generate KSQL (DStream) | |
| STEP (1) | FOR historical precipitation dataset |
| IF dataset is Filesystem WHERE file format is. xslv | |
| READ file (.csv) | |
| CREATE Table “HistoricalPrecipitation” | |
| SAVE file (.csv) to Table “HistoricalPrecipitation” | |
| (2) | FOR Sum_Precipitation = SUM (PrecipitationSensors) |
| CREATE Table “Sum_Precipitation” | |
| SAVE “Sum_Precipitation” to Table “Sum_Precipitation” | |
| (3) | FOR EP = (Sum_Precipitation)/(Time Frame) |
| CREATE Table “EP” | |
| SAVE “EP” values to Table “EP” | |
| (4) | FOR MEP = Mean (HistoricalPrecipitation) |
| CREATE Table “MEP” | |
| SAVE “MEP” values to Table “MEP” | |
| (5) | FOR DEP = EP - MEP |
| CREATE Table “DEP” | |
| SAVE “DEP” values to Table “DEP” | |
| (6) | FOR SD(DEP) = Standard deviation (DEP) |
| CREATE Table “SD(DEP)” | |
| SAVE “SD(DEP)” values to Table “SD(DEP)” | |
| (7) | FOR EDI = DEP/(SD(DEP)) |
| CREATE Table “EDI” | |
| SAVE “EDI” values to Table “EDI” | |
| (8) | RETURN persistent KSQL query |
6. Result and Discussion
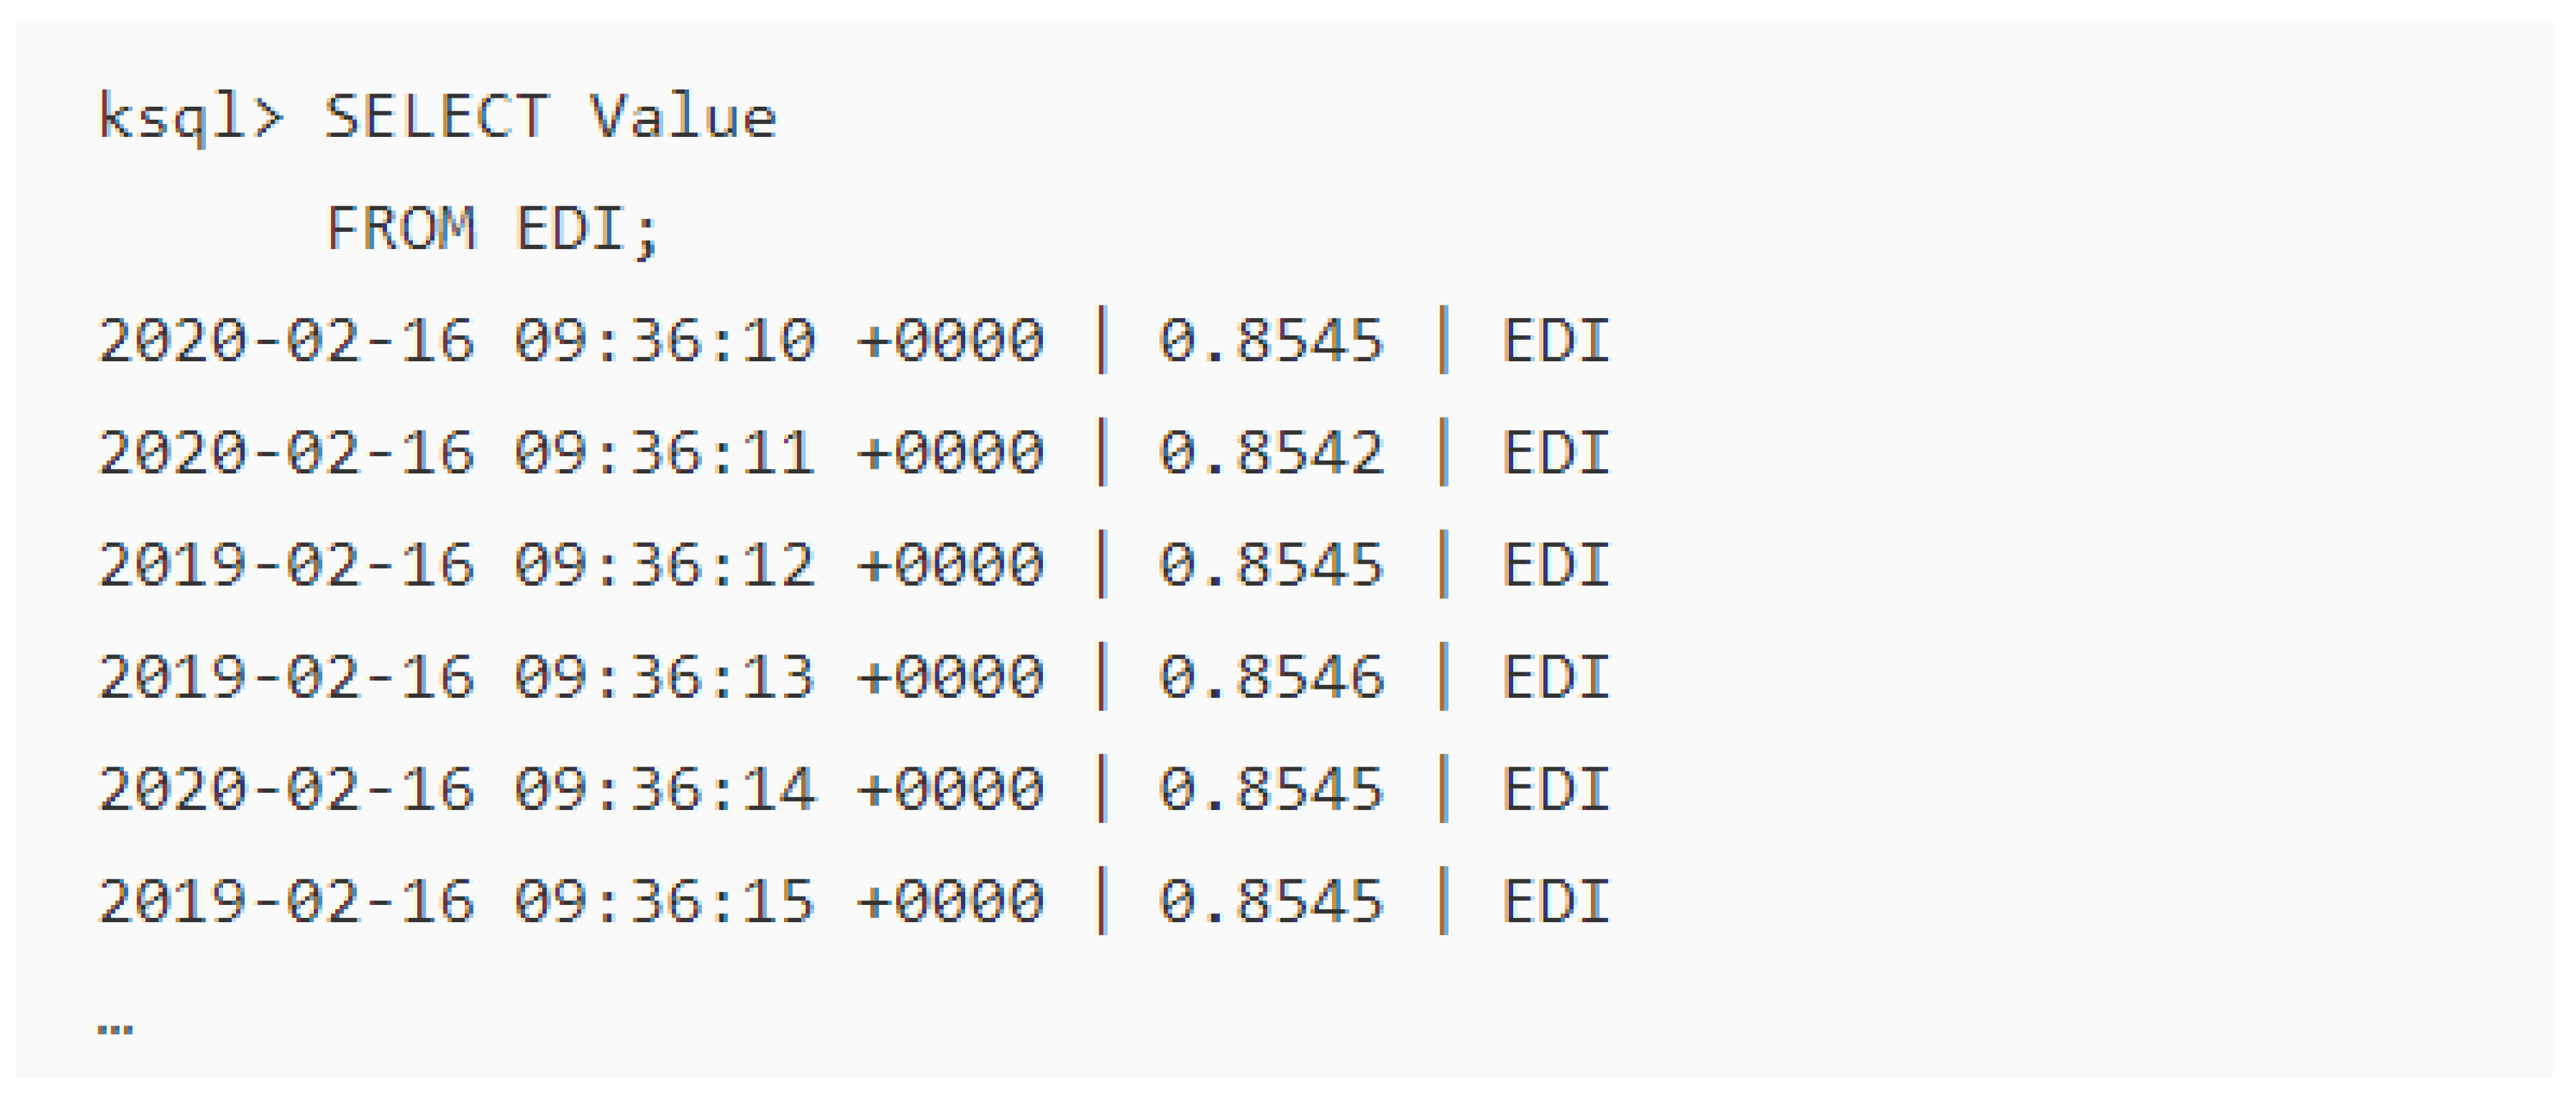
6.1. Output Data and Visualisation
6.2. Scalability Of Kafka Cluster
7. Conclusions
Author Contributions
Funding
Acknowledgments
Conflicts of Interest
References
- Hsu, C.L.; Lin, J.C.C. An empirical examination of consumer adoption of Internet of Things services: Network externalities and concern for information privacy perspectives. Comput. Hum. Behav. 2016, 62, 516–527. [Google Scholar] [CrossRef]
- Kitchin, R. The real-time city? Big data and smart urbanism. GeoJournal 2014, 79, 1–14. [Google Scholar] [CrossRef] [Green Version]
- Ed-daoudy, A.; Maalmi, K. A new Internet of Things architecture for real-time prediction of various diseases using machine learning on big data environment. J. Big Data 2019, 6, 104. [Google Scholar] [CrossRef]
- Marcu, O.C.; Costan, A.; Antoniu, G.; Pérez-Hernández, M.; Tudoran, R.; Bortoli, S.; Nicolae, B. Storage and Ingestion Systems in Support of Stream Processing: A Survey; HAL: Bengaluru, India, 2018. [Google Scholar]
- Carbone, P.; Katsifodimos, A.; Ewen, S.; Markl, V.; Haridi, S.; Tzoumas, K. Apache flink: Stream and batch processing in a single engine. Bull. IEEE Comput. Soc. Tech. Comm. Data Eng. 2015, 36, 4. [Google Scholar]
- Ari, I.; Olmezogullari, E.; Çelebi, Ö.F. Data stream analytics and mining in the cloud. In Proceedings of the 4th IEEE International Conference on Cloud Computing Technology and Science Proceedings, Taipei, Taiwan, 3–6 December 2012; pp. 857–862. [Google Scholar]
- Strohbach, M.; Ziekow, H.; Gazis, V.; Akiva, N. Towards a big data analytics framework for IoT and smart city applications. In Modeling and Processing for Next-Generation Big-Data Technologies; Springer: Berlin/Heidelberg, Germany, 2015; pp. 257–282. [Google Scholar]
- Cortés, R.; Bonnaire, X.; Marin, O.; Sens, P. Stream processing of healthcare sensor data: Studying user traces to identify challenges from a big data perspective. Procedia Comput. Sci. 2015, 52, 1004–1009. [Google Scholar] [CrossRef] [Green Version]
- Kaisler, S.; Armour, F.; Espinosa, J.A.; Money, W. Big data: Issues and challenges moving forward. In Proceedings of the 2013 46th Hawaii International Conference on System Sciences, Wailea, HI, USA, 7–10 January 2013; pp. 995–1004. [Google Scholar]
- Ishwarappa; Anuradha, J. A brief introduction on Big Data 5Vs characteristics and Hadoop technology. Procedia Comput. Sci. 2015, 48, 319–324. [Google Scholar] [CrossRef] [Green Version]
- Cumbane, S.P.; Gidófalvi, G. Review of Big Data and Processing Frameworks for Disaster Response Applications. ISPRS Int. J. Geo-Inf. 2019, 8, 387. [Google Scholar] [CrossRef] [Green Version]
- Habiba, M.; Akhter, S. A cloud based natural disaster management system. In Proceedings of the International Conference on Grid and Pervasive Computing, Seoul, Korea, 9–11 May 2013; pp. 152–161. [Google Scholar]
- Akanbi, A.K.; Masinde, M. Semantic interoperability middleware architecture for heterogeneous environmental data sources. In Proceedings of the 2018 IST-Africa Week Conference (IST-Africa), Gaborone, Botswana, 9–11 May 2018; p. 1. [Google Scholar]
- Apache Storm. Available online: https://storm.apache.org/ (accessed on 14 January 2020).
- Apache Flink. Available online: https://flink.apache.org (accessed on 6 October 2019).
- Apache Kafka. Available online: https://kafka.apache.org/ (accessed on 12 January 2020).
- Apache Spark. Available online: https://spark.apache.org (accessed on 10 November 2019).
- Amazon EC2. Available online: https://aws.amazon.com/ec2/ (accessed on 21 November 2019).
- Microsoft Azure. Available online: https://azure.microsoft.com/en-us/ (accessed on 15 December 2019).
- Google Cloud. Available online: https://cloud.google.com (accessed on 15 December 2019).
- Confluent. Available online: https://www.confluent.io. (accessed on 23 November 2019).
- Garg, N. Apache Kafka; Packt Publishing Ltd.: Mumbai, India, 2013. [Google Scholar]
- Crowcroft, J.; Bacon, J.; Pietzuch, P.; Coulouris, G.; Naguib, H. Channel islands in a reflective ocean: Large-scale event distribution in heterogeneous networks. IEEE Commun. Mag. 2002, 40, 112–115. [Google Scholar] [CrossRef]
- Akanbi, A.K.; Masinde, M. Towards semantic integration of heterogeneous sensor data with indigenous knowledge for drought forecasting. In Proceedings of the Doctoral Symposium of the 16th International Middleware Conference, Vancouver, BC, Canada, 7–11 December 2015; pp. 1–5. [Google Scholar]
- Akanbi, A.K.; Masinde, M. A Framework for Accurate Drought Forecasting System Using Semantics-Based Data Integration Middleware. In Proceedings of the International Conference on e-Infrastructure and e-Services for Developing Countries, Ouagadougou, Burkina Faso, 6–7 December 2015; pp. 106–110. [Google Scholar]
- Henricksen, K.; Indulska, J.; McFadden, T.; Balasubramaniam, S. Middleware for distributed context-aware systems. In Proceedings of the OTM Confederated International Conferences On the Move to Meaningful Internet Systems, Agia Napa, Cyprus, 31 October–4 November 2005; pp. 846–863. [Google Scholar]
- Yu, X.; Niyogi, K.; Mehrotra, S.; Venkatasubramanian, N. Adaptive middleware for distributed sensor environments. IEEE Distrib. Syst. Online 2003, 5. [Google Scholar] [CrossRef]
- Clemente, P.J.; Lozano-Tello, A. Model driven development applied to complex event processing for near real-time open data. Sensors 2018, 18, 4125. [Google Scholar] [CrossRef] [Green Version]
- Dai, H.N.; Wong, R.C.W.; Wang, H.; Zheng, Z.; Vasilakos, A.V. Big data analytics for large-scale wireless networks: Challenges and opportunities. ACM Comput. Surv. (CSUR) 2019, 52, 1–36. [Google Scholar] [CrossRef] [Green Version]
- Ballard, C.; Farrell, D.M.; Lee, M.; Stone, P.D.; Thibault, S.; Tucker, S. IBM Infosphere Streams Harnessing Data in Motion; IBM Redbooks: Endicott, NY, USA, 2010. [Google Scholar]
- Noghabi, S.A.; Paramasivam, K.; Pan, Y.; Ramesh, N.; Bringhurst, J.; Gupta, I.; Campbell, R.H. Samza: Stateful scalable stream processing at LinkedIn. Proc. VLDB Endow. 2017, 10, 1634–1645. [Google Scholar] [CrossRef]
- Chintapalli, S.; Dagit, D.; Evans, B.; Farivar, R.; Graves, T.; Holderbaugh, M.; Liu, Z.; Nusbaum, K.; Patil, K.; Peng, B.J.; et al. Benchmarking streaming computation engines: Storm, flink and spark streaming. In Proceedings of the 2016 IEEE International Parallel and Distributed Processing Symposium Workshops (IPDPSW), Chicago, IL, USA, 23–27 May 2016; pp. 1789–1792. [Google Scholar]
- Inoubli, W.; Aridhi, S.; Mezni, H.; Maddouri, M.; Nguifo, E. A Comparative Study on Streaming Frameworks for Big Data; HAL: Bengaluru, India, 2018. [Google Scholar]
- Dayarathna, M.; Perera, S. Recent advancements in event processing. ACM Comput. Surv. (CSUR) 2018, 51, 1–36. [Google Scholar] [CrossRef]
- Tun, M.T.; Nyaung, D.E.; Phyu, M.P. Performance Evaluation of Intrusion Detection Streaming Transactions Using Apache Kafka and Spark Streaming. In Proceedings of the 2019 International Conference on Advanced Information Technologies (ICAIT), Zurich, Switzerland, 30–31 March 2019; pp. 25–30. [Google Scholar]
- Jafarpour, H.; Desai, R. KSQL: Streaming SQL Engine for Apache Kafka. In Proceedings of the EDBT, Lisbon, Portugal, 26–29 March 2019; pp. 524–533. [Google Scholar]
- Perera, C.; Zaslavsky, A.; Christen, P.; Georgakopoulos, D. Context aware computing for the internet of things: A survey. IEEE Commun. Surv. Tutor. 2013, 16, 414–454. [Google Scholar] [CrossRef] [Green Version]
- Cao, Y.; Chen, S.; Hou, P.; Brown, D. FAST: A fog computing assisted distributed analytics system to monitor fall for stroke mitigation. In Proceedings of the 2015 IEEE International Conference on Networking, Architecture and Storage (NAS), Boston, MA, USA, 6–7 August 2015; pp. 2–11. [Google Scholar]
- Korhonen, T. Using Kafka to Build Scalable and Fault Tolerant Systems. Bachelor’s Thesis, Laurea University of Applied Sciences, Helsinki, Finland, November 2019. [Google Scholar]
- Garg, N. Learning Apache Kafka; Packt Publishing Ltd.: Mumbai, India, 2015. [Google Scholar]
- Narkhede, N.; Shapira, G.; Palino, T. Kafka: The Definitive Guide: Real-Time Data and Stream Processing at Scale; O’Reilly Media, Inc.: Newton, MA, USA, 2017. [Google Scholar]
- Russom, P. Big Data Analytics. TDWI Best Practices Report; Fourth Quarter 2011; TDWI: Seattle, WA, USA, 2011. [Google Scholar]
- Tin, P.; Zin, T.T.; Toriu, T.; Hama, H. An integrated framework for disaster event analysis in big data environments. In Proceedings of the 2013 Ninth International Conference on Intelligent Information Hiding and Multimedia Signal Processing, Beijing, China, 16–18 October 2013; pp. 255–258. [Google Scholar]
- Wang, Q.; Shang, Y. A Distributed Complex Event Processing System Based on Publish/Subscribe. In Recent Developments in Intelligent Computing, Communication and Devices; Springer: Berlin/Heidelberg, Germany, 2019; pp. 981–990. [Google Scholar]
- Bartolini, I.; Patella, M. Real-Time Stream Processing in Social Networks with RAM3S. Future Internet 2019, 11, 249. [Google Scholar] [CrossRef] [Green Version]
- Amarasinghe, G.; de Assunção, M.D.; Harwood, A.; Karunasekera, S. ECSNeT++: A simulator for distributed stream processing on edge and cloud environments. Future Gener. Comput. Syst. 2019. [Google Scholar] [CrossRef] [Green Version]
- Lindquist, K.G.; Vernon, F.L.; Harvey, D.; Quinlan, D.; Orcutt, J.; Rajasekar, A.; Hansen, T.S.; Foley, S. The Data Acquisition Core of the ROADNet Real-Time Monitoring System. In Proceedings of the Data Sharing and Interoperability on the World-Wide Sensor Web, Cambridge, MA, USA, 25–27 April 2007. [Google Scholar]
- Vitolo, C.; Elkhatib, Y.; Reusser, D.; Macleod, C.J.; Buytaert, W. Web technologies for environmental Big Data. Environ. Model. Softw. 2015, 63, 185–198. [Google Scholar] [CrossRef] [Green Version]
- REAP Project. Available online: http://reap.ecoinformatics.org/ (accessed on 14 March 2020).
- Wang, J.; Crawl, D.; Altintas, I. Kepler+ Hadoop: A general architecture facilitating data-intensive applications in scientific workflow systems. In Proceedings of the 4th Workshop on Workflows in Support of Large-Scale Science, Portland, OR, USA, 16 November 2009; pp. 1–8. [Google Scholar]
- Eleftherakis, G.; Pappas, D.; Lagkas, T.; Rousis, K.; Paunovski, O. Architecting the IoT Paradigm: A Middleware for Autonomous Distributed Sensor Networks. Int. J. Distrib. Sens. Netw. 2015, 2015, 1–17. [Google Scholar] [CrossRef] [Green Version]
- Wetz, P.; Trinh, T.D.; Do, B.L.; Anjomshoaa, A.; Kiesling, E.; Tjoa, A.M. Towards an Environmental Information System for Semantic Stream Data. In Proceedings of the EnviroInfo, Oldenburg, Germany, 10–12 September 2014; pp. 637–644. [Google Scholar]
- Dia, A.F.; Kazi-Aoul, Z.; Boly, A.; Chabchoub, Y. C-SPARQL extension for sampling RDF graphs streams. In Advances in Knowledge Discovery and Management; Springer: Berlin/Heidelberg, Germany, 2018; pp. 23–40. [Google Scholar]
- Anicic, D.; Fodor, P.; Rudolph, S.; Stojanovic, N. EP-SPARQL: A unified language for event processing and stream reasoning. In Proceedings of the 20th International Conference on World Wide Web, Hyderabad, India, 28 March–1 April 2011; pp. 635–644. [Google Scholar]
- Rjoub, G.; Bentahar, J.; Wahab, O.A. BigTrustScheduling: Trust-aware big data task scheduling approach in cloud computing environments. Future Gener. Comput. Syst. 2019. [Google Scholar] [CrossRef]
- Kalim, F.; Xu, L.; Bathey, S.; Meherwal, R.; Gupta, I. Henge: Intent-driven multi-tenant stream processing. In Proceedings of the ACM Symposium on Cloud Computing, Carlsbad, CA, USA, 11–13 October 2018; pp. 249–262. [Google Scholar]
- Yang, Z.; Nguyen, P.; Jin, H.; Nahrstedt, K. MIRAS: Model-based Reinforcement Learning for Microservice Resource Allocation over Scientific Workflows. In Proceedings of the 2019 IEEE 39th International Conference on Distributed Computing Systems (ICDCS), Richardson, TX, USA, 7–9 July 2019; pp. 122–132. [Google Scholar]
- Thein, K.M.M. Apache kafka: Next generation distributed messaging system. Int. J. Sci. Eng. Technol. Res. 2014, 3, 9478–9483. [Google Scholar]
- Kafka, A. A High-Throughput Distributed Messaging System. Available online: https://blog.csdn.net/macyang/article/details/8546941 (accessed on 18 May 2020).
- Greco, L.; Ritrovato, P.; Xhafa, F. An edge-stream computing infrastructure for real-time analysis of wearable sensors data. Future Gener. Comput. Syst. 2019, 93, 515–528. [Google Scholar] [CrossRef]
- Reelsen, A. Using Elasticsearch, Logstash and Kibana to Create Realtime Dashboards. Dostupné z. Available online: https://speakerdeck.com/elasticsearch/using-elasticsearch-logstash-and-kibana-to-create-realtime-dashboards?slide=8 (accessed on 10 March 2020).
- MongoDB. Available online: https://www.mongodb.com (accessed on 21 November 2019).
- Cassandra. Available online: http://cassandra.apache.org (accessed on 21 November 2019).
- Akka. Available online: https://akka.io (accessed on 12 November 2019).
- Zeppelin. Available online: https://zeppelin.apache.org (accessed on 12 November 2019).
- Byun, H.R.; Wilhite, D.A. Daily quantification of drought severity and duration. J. Clim. 1996, 5, 1181–1201. [Google Scholar]
- Byun, H.R.; Wilhite, D.A. Objective quantification of drought severity and duration. J. Clim. 1999, 12, 2747–2756. [Google Scholar] [CrossRef]
- Shree, R.; Choudhury, T.; Gupta, S.C.; Kumar, P. KAFKA: The modern platform for data management and analysis in big data domain. In Proceedings of the 2017 2nd International Conference on Telecommunication and Networks (TEL-NET), Noida, India, 10–11 August 2017; pp. 1–5. [Google Scholar]
- Kafka Connect. Available online: https://www.confluent.io/connectors (accessed on 23 October 2019).


| Features | Storm | Kafka | Samza | Flink | Spark | RabbitMQ |
|---|---|---|---|---|---|---|
| Scalability | Yes | Yes | Yes | Yes | Yes | |
| High availability | High | High | High | High | High | High |
| Performance | High | Very high | High | High | High | High |
| Replication | No | Yes | Yes | No | ||
| Latency | Low | Low | Low | High | ||
| Cluster Manager | Zookeeper | Zookeeper | YARN | YARN, Mesos | YARN, Mesos | |
| SQL Querying | No | KSQL | SamzaSQL | No | SparkSQL | No |
| EP Engine | Yes | Yes | Yes | Yes | ||
| Message Broker | Yes | Yes | No | No | No | Yes |
| Throughput | High | Very high | Very high | High | High | High |
| Drought Classes | Criterion |
|---|---|
| Extreme Drought | EDI ≤ 2.0 |
| Severe drought | −2.0 ≤ EDI ≤ −1.5 |
| Moderate drought | −1.5 ≤ EDI ≤ −1.0 |
| Near normal drought | −1.0 ≤ EDI ≤ 1.0 |
| Type of Readings | Kafka Topic |
|---|---|
| Temperature | TemperatureSensors |
| Humidity | HumiditySensors |
| Precipitation | PrecipitationSensors |
| Atmospheric Pressure | AtmosPressureSensors |
| Soil Moisture | SoilMoistureSensors |
© 2020 by the authors. Licensee MDPI, Basel, Switzerland. This article is an open access article distributed under the terms and conditions of the Creative Commons Attribution (CC BY) license (http://creativecommons.org/licenses/by/4.0/).
Share and Cite
Akanbi, A.; Masinde, M. A Distributed Stream Processing Middleware Framework for Real-Time Analysis of Heterogeneous Data on Big Data Platform: Case of Environmental Monitoring. Sensors 2020, 20, 3166. https://doi.org/10.3390/s20113166
Akanbi A, Masinde M. A Distributed Stream Processing Middleware Framework for Real-Time Analysis of Heterogeneous Data on Big Data Platform: Case of Environmental Monitoring. Sensors. 2020; 20(11):3166. https://doi.org/10.3390/s20113166
Chicago/Turabian StyleAkanbi, Adeyinka, and Muthoni Masinde. 2020. "A Distributed Stream Processing Middleware Framework for Real-Time Analysis of Heterogeneous Data on Big Data Platform: Case of Environmental Monitoring" Sensors 20, no. 11: 3166. https://doi.org/10.3390/s20113166
APA StyleAkanbi, A., & Masinde, M. (2020). A Distributed Stream Processing Middleware Framework for Real-Time Analysis of Heterogeneous Data on Big Data Platform: Case of Environmental Monitoring. Sensors, 20(11), 3166. https://doi.org/10.3390/s20113166