Urban Planning and Smart City Decision Management Empowered by Real-Time Data Processing Using Big Data Analytics

Abstract
1. Introduction
2. Related Works
3. Proposed Scheme
3.1. Overview of the Proposed Architecture
3.2. Data Aggregation Layer
3.3. Data Management and Storage Layer
| Algorithm 1 Data Normalization with Min-Max Approach |
| BEGIN |
| Input: Data value K, Minimum acceptable value Kmin, Maximum acceptable value Kmax |
| Output: Normalized data value Knorm |
| 1. Define normalization range (0 to 1) |
| 2. Define boundaries for Kmin and Kmax |
| 3. Check if (Kmin == Kmax ∥ Kmax < Kmin |
| ● Go back to step 2 and continue |
| 4. For each K, |
| ● |
| ● If (0 ≤ Knorm ≤ 1) |
| Add K to initial dataset for analysis |
| ● Else |
| Discard K value |
| END |
3.4. Service Management Layer
4. Results and Data Analysis
4.1. Dataset Information
4.2. Simulation Scenario for Data Analyzing
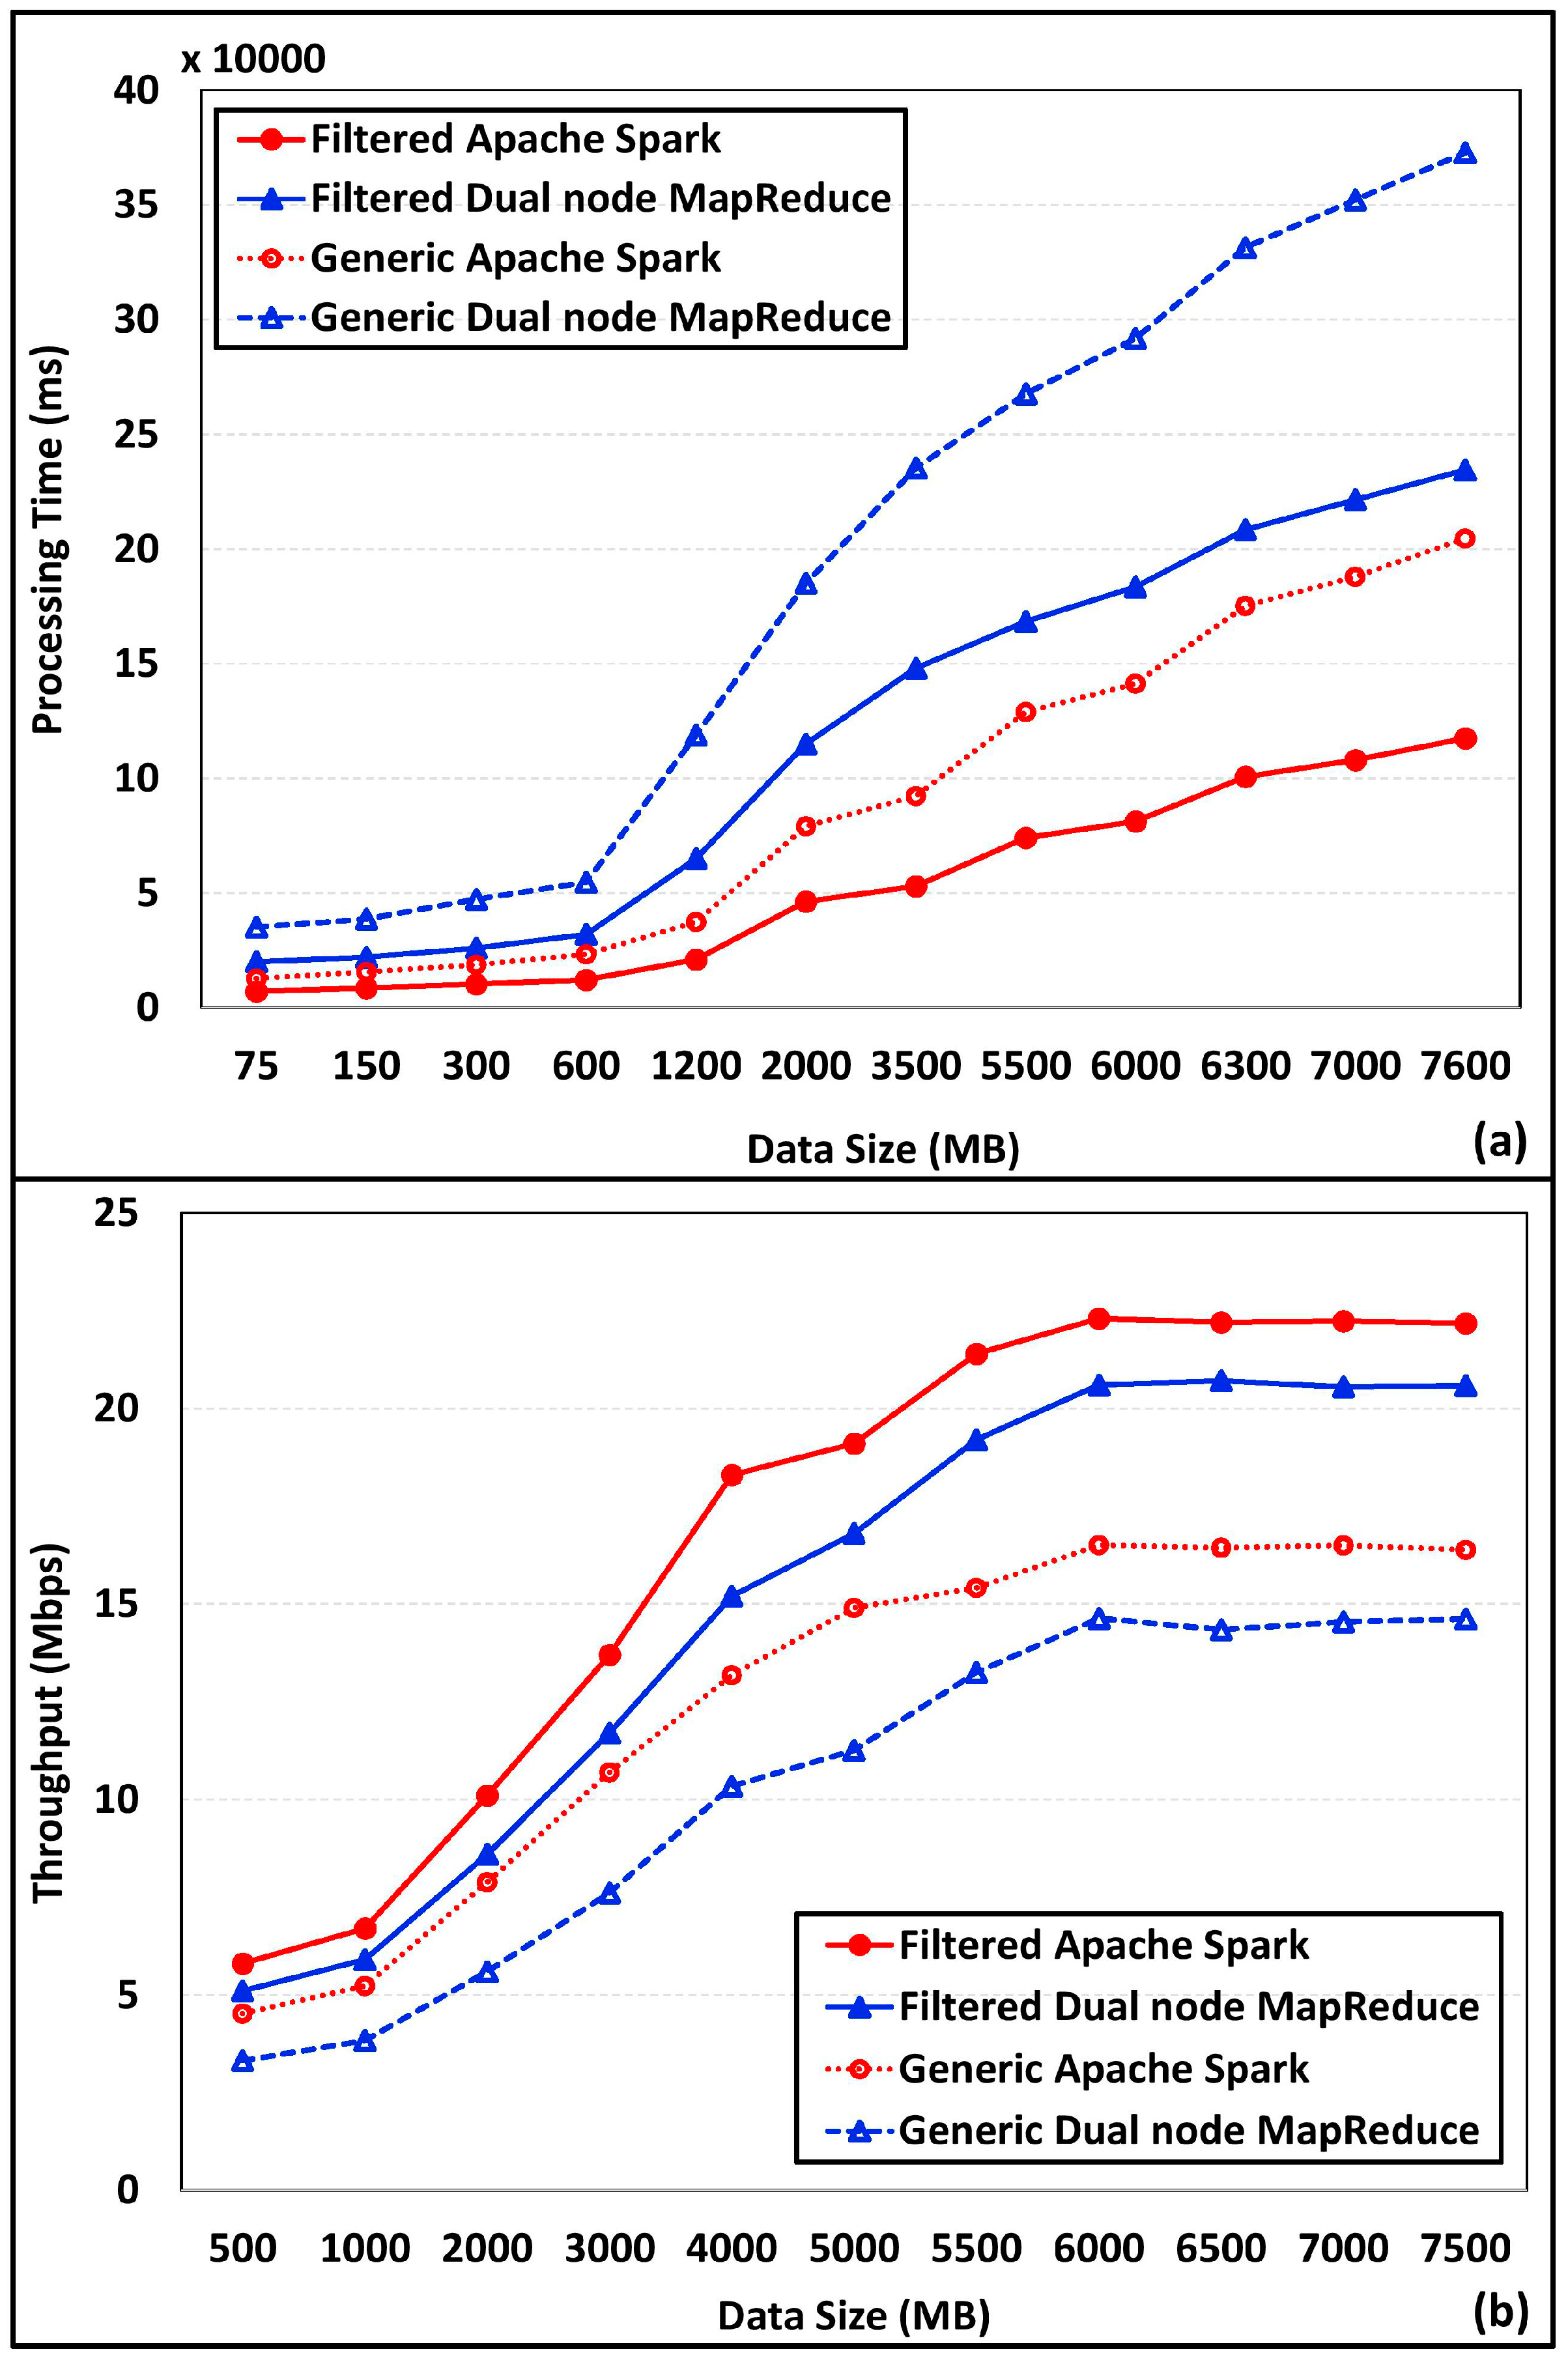
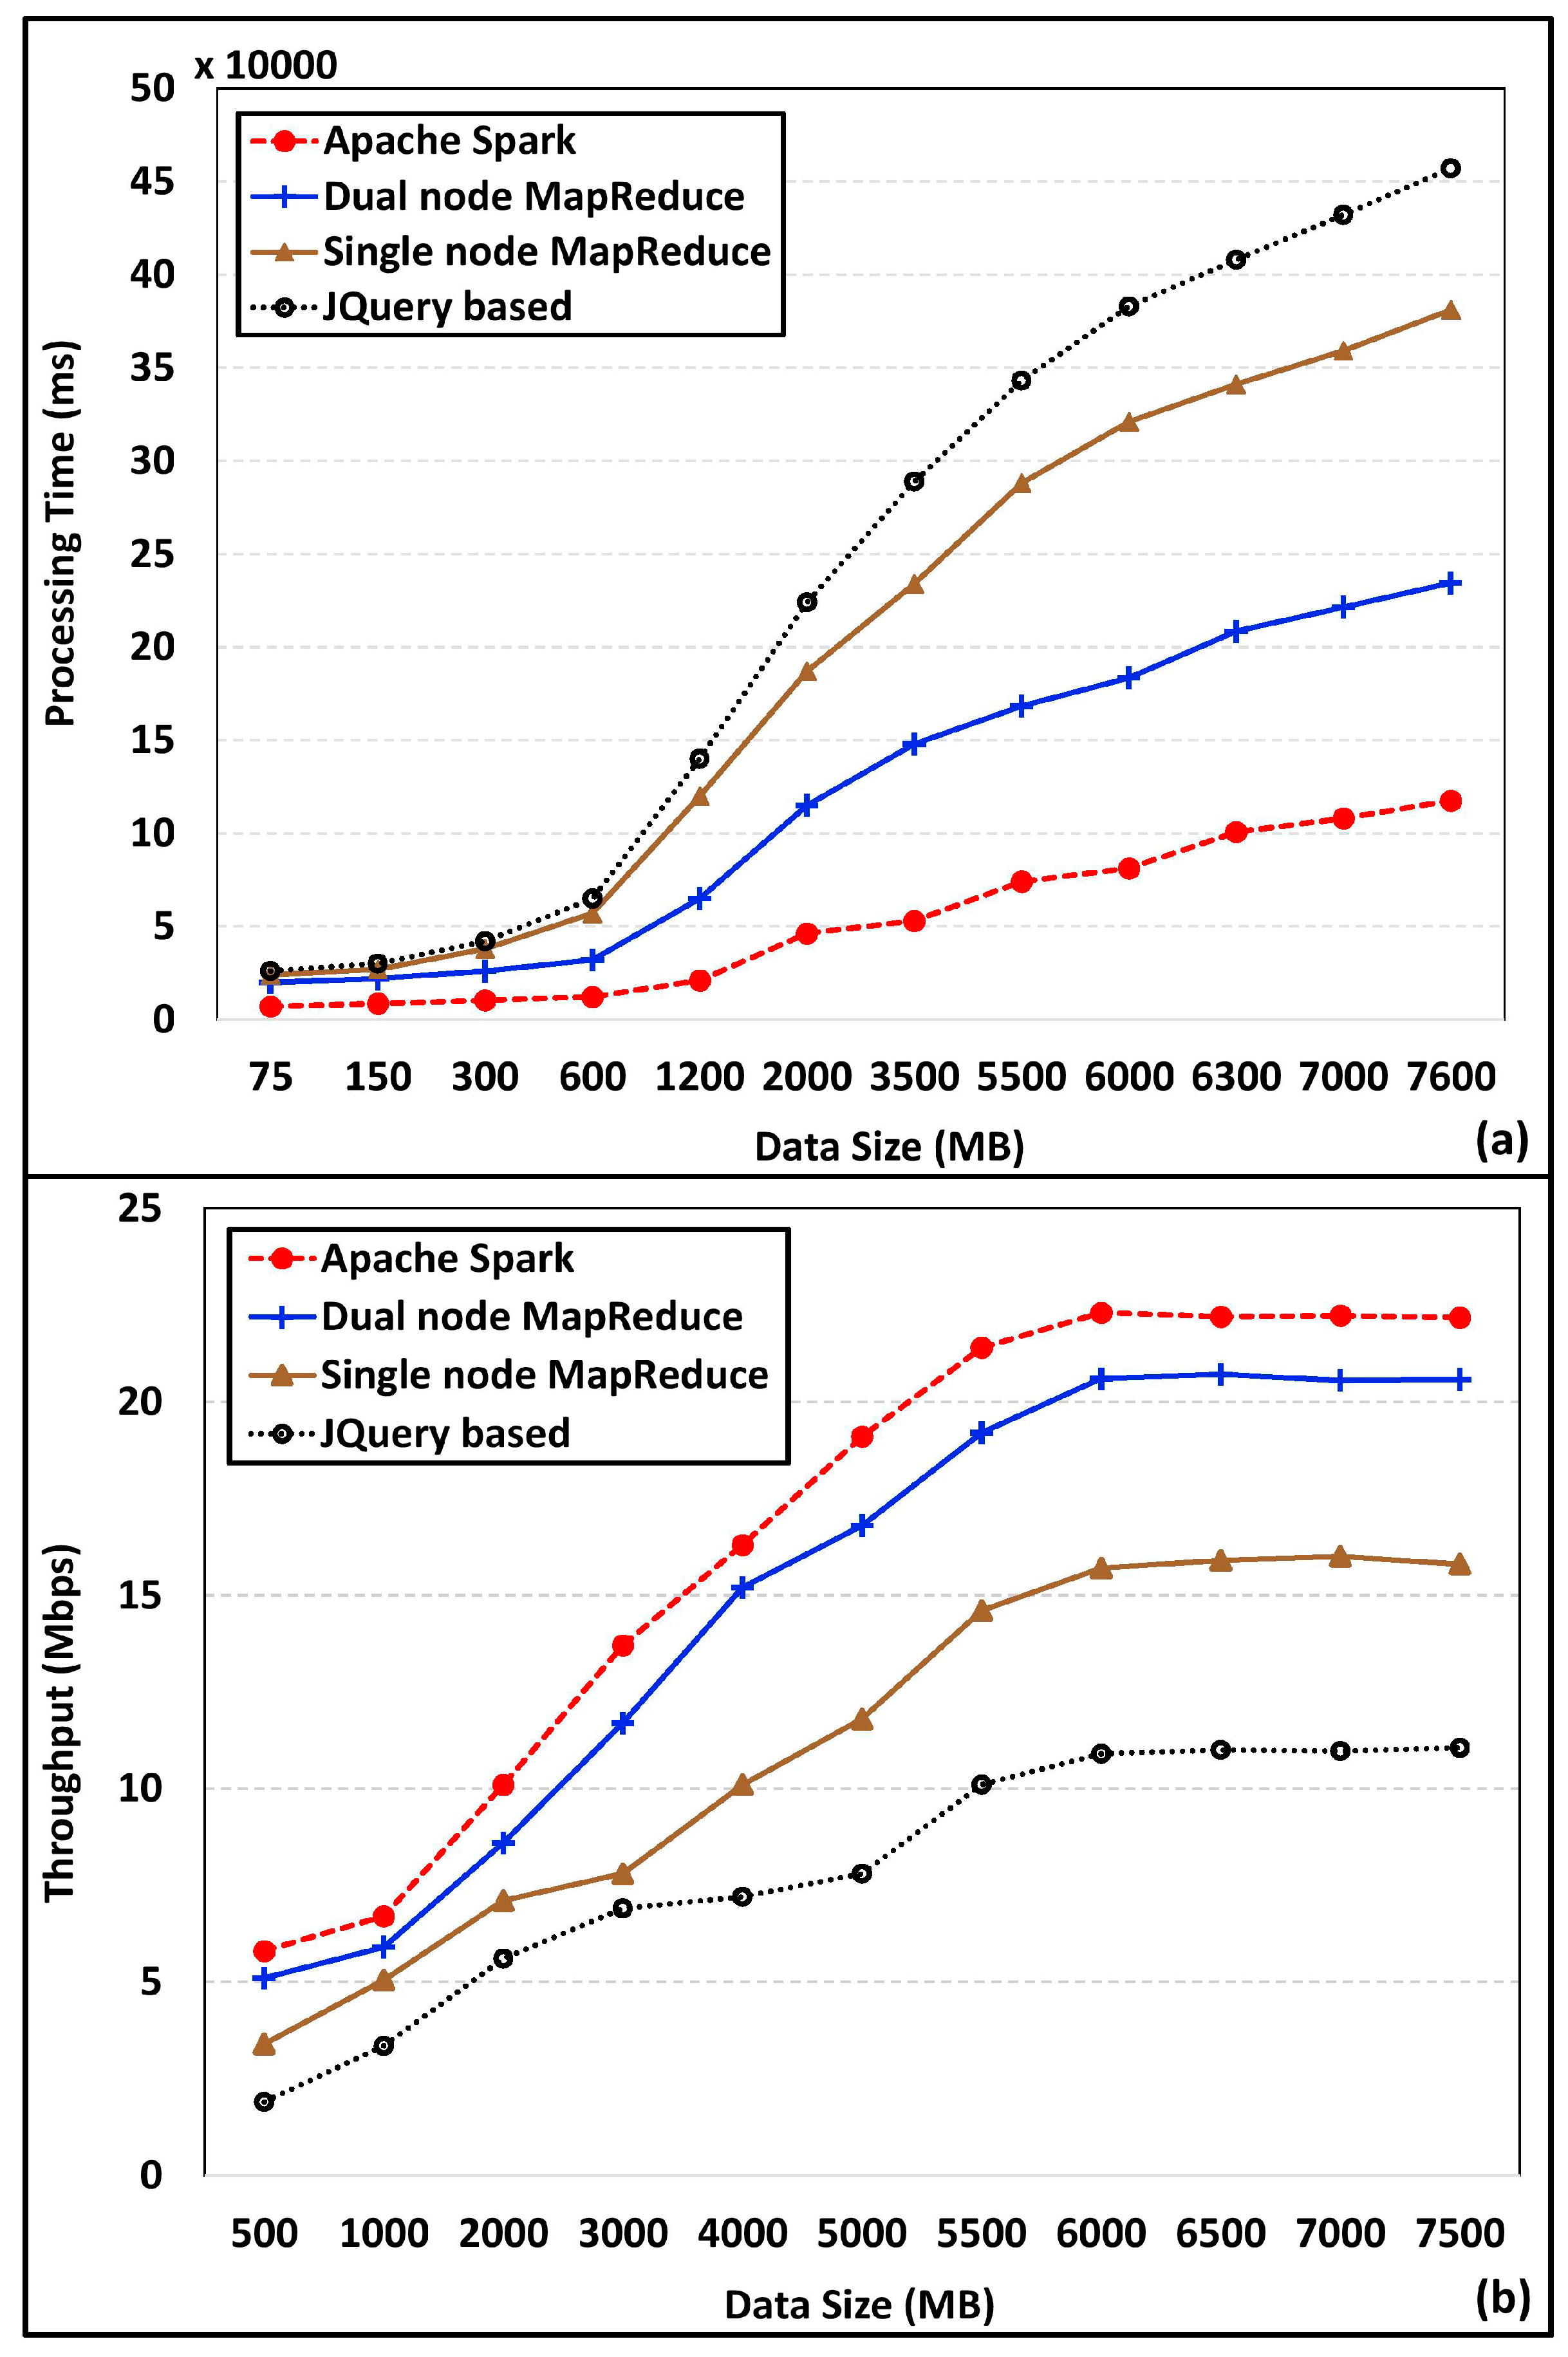
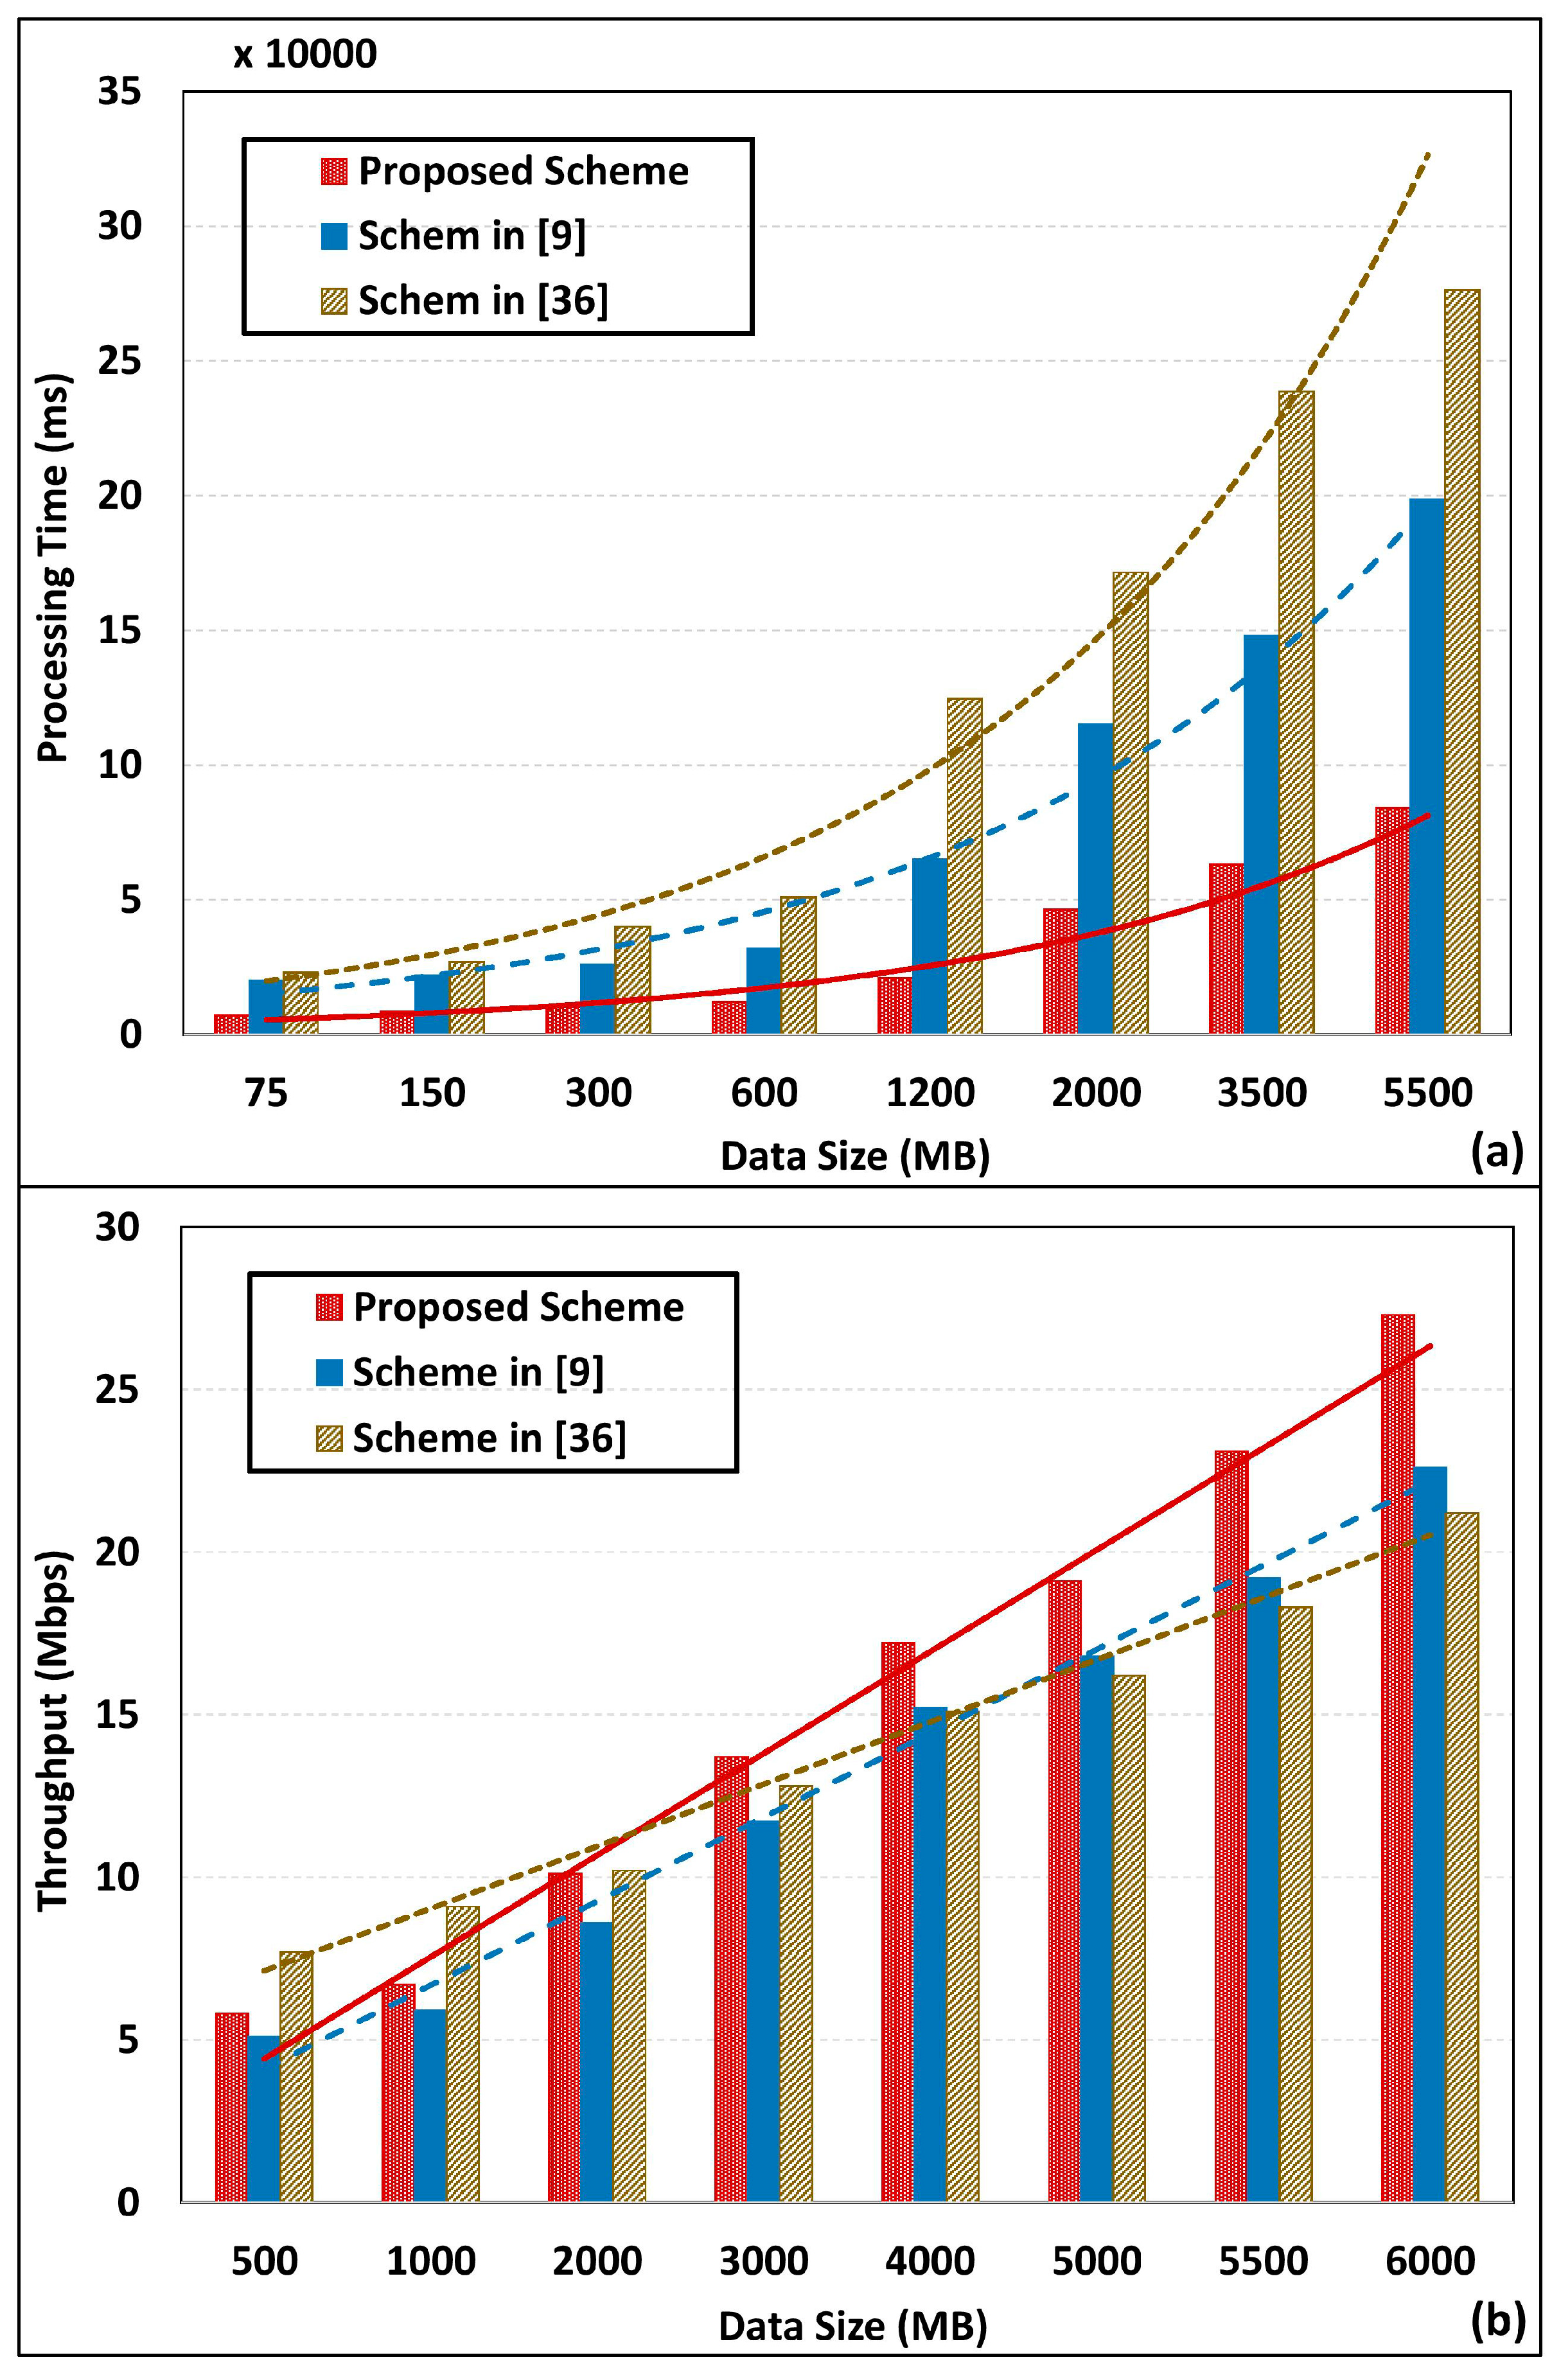
4.3. Dataset Analysis and Processing Performance Analysis
5. Conclusions
Author Contributions
Funding
Conflicts of Interest
References
- Silva, B.N.; Khan, M.; Han, K. Internet of Things: A Comprehensive Review of Enabling Technologies, Architecture, and Challenges. IETE Tech. Rev. 2017, 1–16. [Google Scholar] [CrossRef]
- Brar, G.S.; Rani, S.; Chopra, V.; Malhotra, R.; Song, H.; Ahmed, S.H. Energy efficient direction-based PDORP routing protocol for WSN. IEEE Access 2016, 4, 3182–3194. [Google Scholar] [CrossRef]
- Jin, J.; Gubbi, J.; Marusic, S.; Palaniswami, M. An information framework for creating a smart city through internet of things. IEEE Internet Things J. 2014, 1, 112–121. [Google Scholar] [CrossRef]
- Rani, S.; Talwar, R.; Malhotra, J.; Ahmed, S.H.; Sarkar, M.; Song, H. A novel scheme for an energy efficient Internet of Things based on wireless sensor networks. Sensors 2015, 15, 28603–28626. [Google Scholar] [CrossRef] [PubMed]
- Jung, C.; Kim, K.; Seo, J.; Silva, B.; Han, K. Topology Configuration and Multihop Routing Protocol for Bluetooth Low Energy Networks. IEEE Access 2017, 5, 9587–9598. [Google Scholar] [CrossRef]
- Islam, S.R.; Kwak, D.; Kabir, M.H.; Hossain, M.; Kwak, K.-S. The internet of things for health care: A comprehensive survey. IEEE Access 2015, 3, 678–708. [Google Scholar] [CrossRef]
- Khan, M.; Silva, B.N.; Han, K. Internet of Things Based Energy Aware Smart Home Control System. IEEE Access 2016, 4, 7556–7566. [Google Scholar] [CrossRef]
- Jabbar, S.; Khan, M.; Silva, B.N.; Han, K. A REST-based industrial web of things’ framework for smart warehousing. J. Supercomput. 2016. [Google Scholar] [CrossRef]
- Silva, B.N.; Khan, M.; Han, K. Big Data Analytics Embedded Smart City Architecture for Performance Enhancement through Real-Time Data Processing and Decision-Making. Wirel. Commun. Mob. Comput. 2017, 2017. [Google Scholar] [CrossRef]
- Khan, M.; Silva, B.N.; Han, K. A Web of Things-Based Emerging Sensor Network Architecture for Smart Control Systems. Sensors 2017, 17, 332. [Google Scholar] [CrossRef] [PubMed]
- Silva, B.N.; Khan, M.; Han, K. Load Balancing Integrated Least Slack Time-Based Appliance Scheduling for Smart Home Energy Management. Sensors 2018, 18, 685. [Google Scholar] [CrossRef] [PubMed]
- Bouk, S.H.; Ahmed, S.H.; Kim, D.; Song, H. Named-data-networking-based ITS for smart cities. IEEE Commun. Mag. 2017, 55, 105–111. [Google Scholar] [CrossRef]
- Siembab, W. Telecity Development Strategy for Sustainable, Livable Communities. The Blue Line Televillage in Compton, California; Siembab Corporation: Los Angeles, CA, USA, 1996. [Google Scholar]
- Silva, B.N.; Khan, M.; Han, K. Towards sustainable smart cities: A review of trends, architectures, components, and open challenges in smart cities. Sustain. Cities Soc. 2018, 38, 697–713. [Google Scholar] [CrossRef]
- Alvi, A.N.; Bouk, S.H.; Ahmed, S.H.; Yaqub, M.A.; Sarkar, M.; Song, H. BEST-MAC: Bitmap-Assisted Efficient and Scalable TDMA-Based WSN MAC Protocol for Smart Cities. IEEE Access 2016, 4, 312–322. [Google Scholar] [CrossRef]
- Zanella, A.; Bui, N.; Castellani, A.; Vangelista, L.; Zorzi, M. Internet of things for smart cities. IEEE Internet Things J. 2014, 1, 22–32. [Google Scholar] [CrossRef]
- Wenge, R.; Zhang, X.; Dave, C.; Chao, L.; Hao, S. Smart city architecture: A technology guide for implementation and design challenges. China Commun. 2014, 11, 56–69. [Google Scholar] [CrossRef]
- Nandury, S.V.; Begum, B.A. Smart WSN-based ubiquitous architecture for smart cities. In Proceedings of the 2015 International Conference on Advances in Computing, Communications and Informatics (ICACCI), Kochi, India, 10–13 August 2015; pp. 2366–2373. [Google Scholar]
- Chen, M.; Mao, S.; Liu, Y. Big data: A survey. Mob. Netw. Appl. 2014, 19, 171–209. [Google Scholar] [CrossRef]
- Gandomi, A.; Haider, M. Beyond the hype: Big data concepts, methods, and analytics. Int. J. Inf. Manag. 2015, 35, 137–144. [Google Scholar] [CrossRef]
- Fan, J.; Han, F.; Liu, H. Challenges of big data analysis. Natl. Sci. Rev. 2014, 1, 293–314. [Google Scholar] [CrossRef] [PubMed]
- Cheng, B.; Longo, S.; Cirillo, F.; Bauer, M.; Kovacs, E. Building a big data platform for smart cities: Experience and lessons from santander. In Proceedings of the IEEE International Congress on Big Data (BigData Congress), New York, NY, USA, 27 June–2 July 2015; pp. 592–599. [Google Scholar]
- Silva, B.N.; Khan, M.; Han, K. Integration of Big Data analytics embedded smart city architecture with RESTful web of things for efficient service provision and energy management. Futur. Gener. Comput. Syst. 2017. [Google Scholar] [CrossRef]
- Bouk, S.H.; Ahmed, S.H.; Kim, D. Vehicular content centric network (VCCN): A survey and research challenges. In Proceedings of the 30th Annual ACM Symposium on Applied Computing, Salamanca, Spain, 13–17 April 2015; pp. 695–700. [Google Scholar]
- Ahmed, S.H.; Bouk, S.H.; Yaqub, M.A.; Kim, D.; Song, H.; Lloret, J. CODIE: Controlled data and interest evaluation in vehicular named data networks. IEEE Trans. Veh. Technol. 2016, 65, 3954–3963. [Google Scholar] [CrossRef]
- Jara, A.J.; Genoud, D.; Bocchi, Y. Big data in smart cities: From poisson to human dynamics. In Proceedings of the 2014 28th International Conference on Advanced Information Networking and Applications Workshops (WAINA), Victoria, BC, Canada, 13–16 May 2014; pp. 785–790. [Google Scholar]
- Sanchez, L.; Muñoz, L.; Galache, J.A.; Sotres, P.; Santana, J.R.; Gutierrez, V.; Ramdhany, R.; Gluhak, A.; Krco, S.; Theodoridis, E. SmartSantander: IoT experimentation over a smart city testbed. Comput. Netw. 2014, 61, 217–238. [Google Scholar] [CrossRef]
- Mora-Mora, H.; Gilart-Iglesias, V.; Gil, D.; Sirvent-Llamas, A. A computational architecture based on RFID sensors for traceability in smart cities. Sensors 2015, 15, 13591–13626. [Google Scholar] [CrossRef] [PubMed]
- Suciu, G.; Vulpe, A.; Halunga, S.; Fratu, O.; Todoran, G.; Suciu, V. Smart cities built on resilient cloud computing and secure internet of things. In Proceedings of the 2013 19th International Conference on Control Systems and Computer Science (CSCS), Bucharest, Romania, 29–31 May 2013; pp. 513–518. [Google Scholar]
- Talari, S.; Shafie-khah, M.; Siano, P.; Loia, V.; Tommasetti, A.; Catalão, J.P. A review of smart cities based on the internet of things concept. Energies 2017, 10, 421. [Google Scholar] [CrossRef]
- Ng, S.T.; Xu, F.J.; Yang, Y.; Lu, M. A master data management solution to unlock the value of big infrastructure data for smart, sustainable and resilient city planning. Procedia Eng. 2017, 196, 939–947. [Google Scholar] [CrossRef]
- Mohamed, N.; Al-Jaroodi, J.; Jawhar, I.; Lazarova-Molnar, S.; Mahmoud, S. SmartCityWare: A service-oriented middleware for cloud and fog enabled smart city services. IEEE Access 2017, 5, 17576–17588. [Google Scholar] [CrossRef]
- Dunne, T. Big Data, Analytics, and Energy Consumption; Lavastorm Agle Analytics: Boston, MA, USA, 2012. [Google Scholar]
- Bestavros, A.C.C.; Hutyra, L.; Terzi, E. SCOPE: Smart-city Cloud Based Open Platform and Ecosystem; Boston University: Boston, MA, USA, 2016. [Google Scholar]
- FIWARE FIWARE Consolidates as Open Source IoT-enabled Smart Services Platform. Available online: https://www.fiware.org/news/fiware-consolidates-as-open-source-iot-enabled-smart-services-platform-of-reference-with-launch-of-fiware-foundation/ (accessed on 26 March 2017).
- Rathore, M.M.; Ahmad, A.; Paul, A.; Rho, S. Urban planning and building smart cities based on the internet of things using big data analytics. Comput. Netw. 2016, 101, 63–80. [Google Scholar] [CrossRef]
- Tang, B.; Chen, Z.; Hefferman, G.; Wei, T.; He, H.; Yang, Q. A hierarchical distributed fog computing architecture for big data analysis in smart cities. In Proceedings of the ASE BigData & SocialInformatics 2015, Kaohsiung, Taiwan, 7–9 October 2015; p. 28. [Google Scholar]
- Naccarati, F.; Hobson, S. IBM Smarter City Solutions on Cloud. In IBM Global Services White Paper-Government Solutions; IBM: Somers, NY, USA, 2011. [Google Scholar]
- Strohbach, M.; Ziekow, H.; Gazis, V.; Akiva, N. Towards a big data analytics framework for IoT and smart city applications. In Modeling and Processing for Next-Generation Big-Data Technologies; Springer: Cham, Switzerland, 2015; pp. 257–282. [Google Scholar]
- Goldstein, M.; Uchida, S. A comparative evaluation of unsupervised anomaly detection algorithms for multivariate data. PLoS ONE 2016, 11, e0152173. [Google Scholar] [CrossRef] [PubMed]
- Babar, M.; Arif, F. Smart urban planning using Big Data analytics to contend with the interoperability in Internet of Things. Futur.Gener. Comput. Syst. 2017, 77, 65–76. [Google Scholar] [CrossRef]
- CityPulse, Vehicle Traffic. Available online: http://iot.ee.surrey.ac.uk:8080/datasets.html#traffic (accessed on 17 September 2016).
- CityPulse, Parking Data Stream. Available online: http://iot.ee.surrey.ac.uk:8080/datasets.html#parking (accessed on 17 September 2016).
- CityPulse, Pollution Measurements. Available online: http://iot.ee.surrey.ac.uk:8080/datasets.html#pollution (accessed on 17 September 2016).
- City of Surrey, Water Meters. Available online: http://data.surrey.ca/dataset/water-meters/resource/99fe8786-6329-49f7-ae92-2c3b8f6e4778 (accessed on 19 September 2016).
- Hamra, G.B.; Laden, F.; Cohen, A.J.; Raaschou-Nielsen, O.; Brauer, M.; Loomis, D. Lung cancer and exposure to nitrogen dioxide and traffic: A systematic review and meta-analysis. Environ. Health Perspect. 2015, 123, 1107. [Google Scholar] [CrossRef] [PubMed]
- Lakey, P.S.; Wisthaler, A.; Berkemeier, T.; Mikoviny, T.; Pöschl, U.; Shiraiwa, M. Chemical kinetics of multiphase reactions between ozone and human skin lipids: Implications for indoor air quality and health effects. Indoor Air 2017, 27, 816–828. [Google Scholar] [CrossRef] [PubMed]


| Frequency | 1/day | 1/hour | 1/30 min | 1/15 min |
|---|---|---|---|---|
| Records Collected | 365 m | 8.75 b | 17.52 b | 35.04 b |
| Terabytes Collected | 1.82 TB | 730 TB | 1460 TB | 2920 TB |
| Sources | Dataset | Size |
|---|---|---|
| Aarhus City, Denmark [42] | Traffic Data | 3.04 GB |
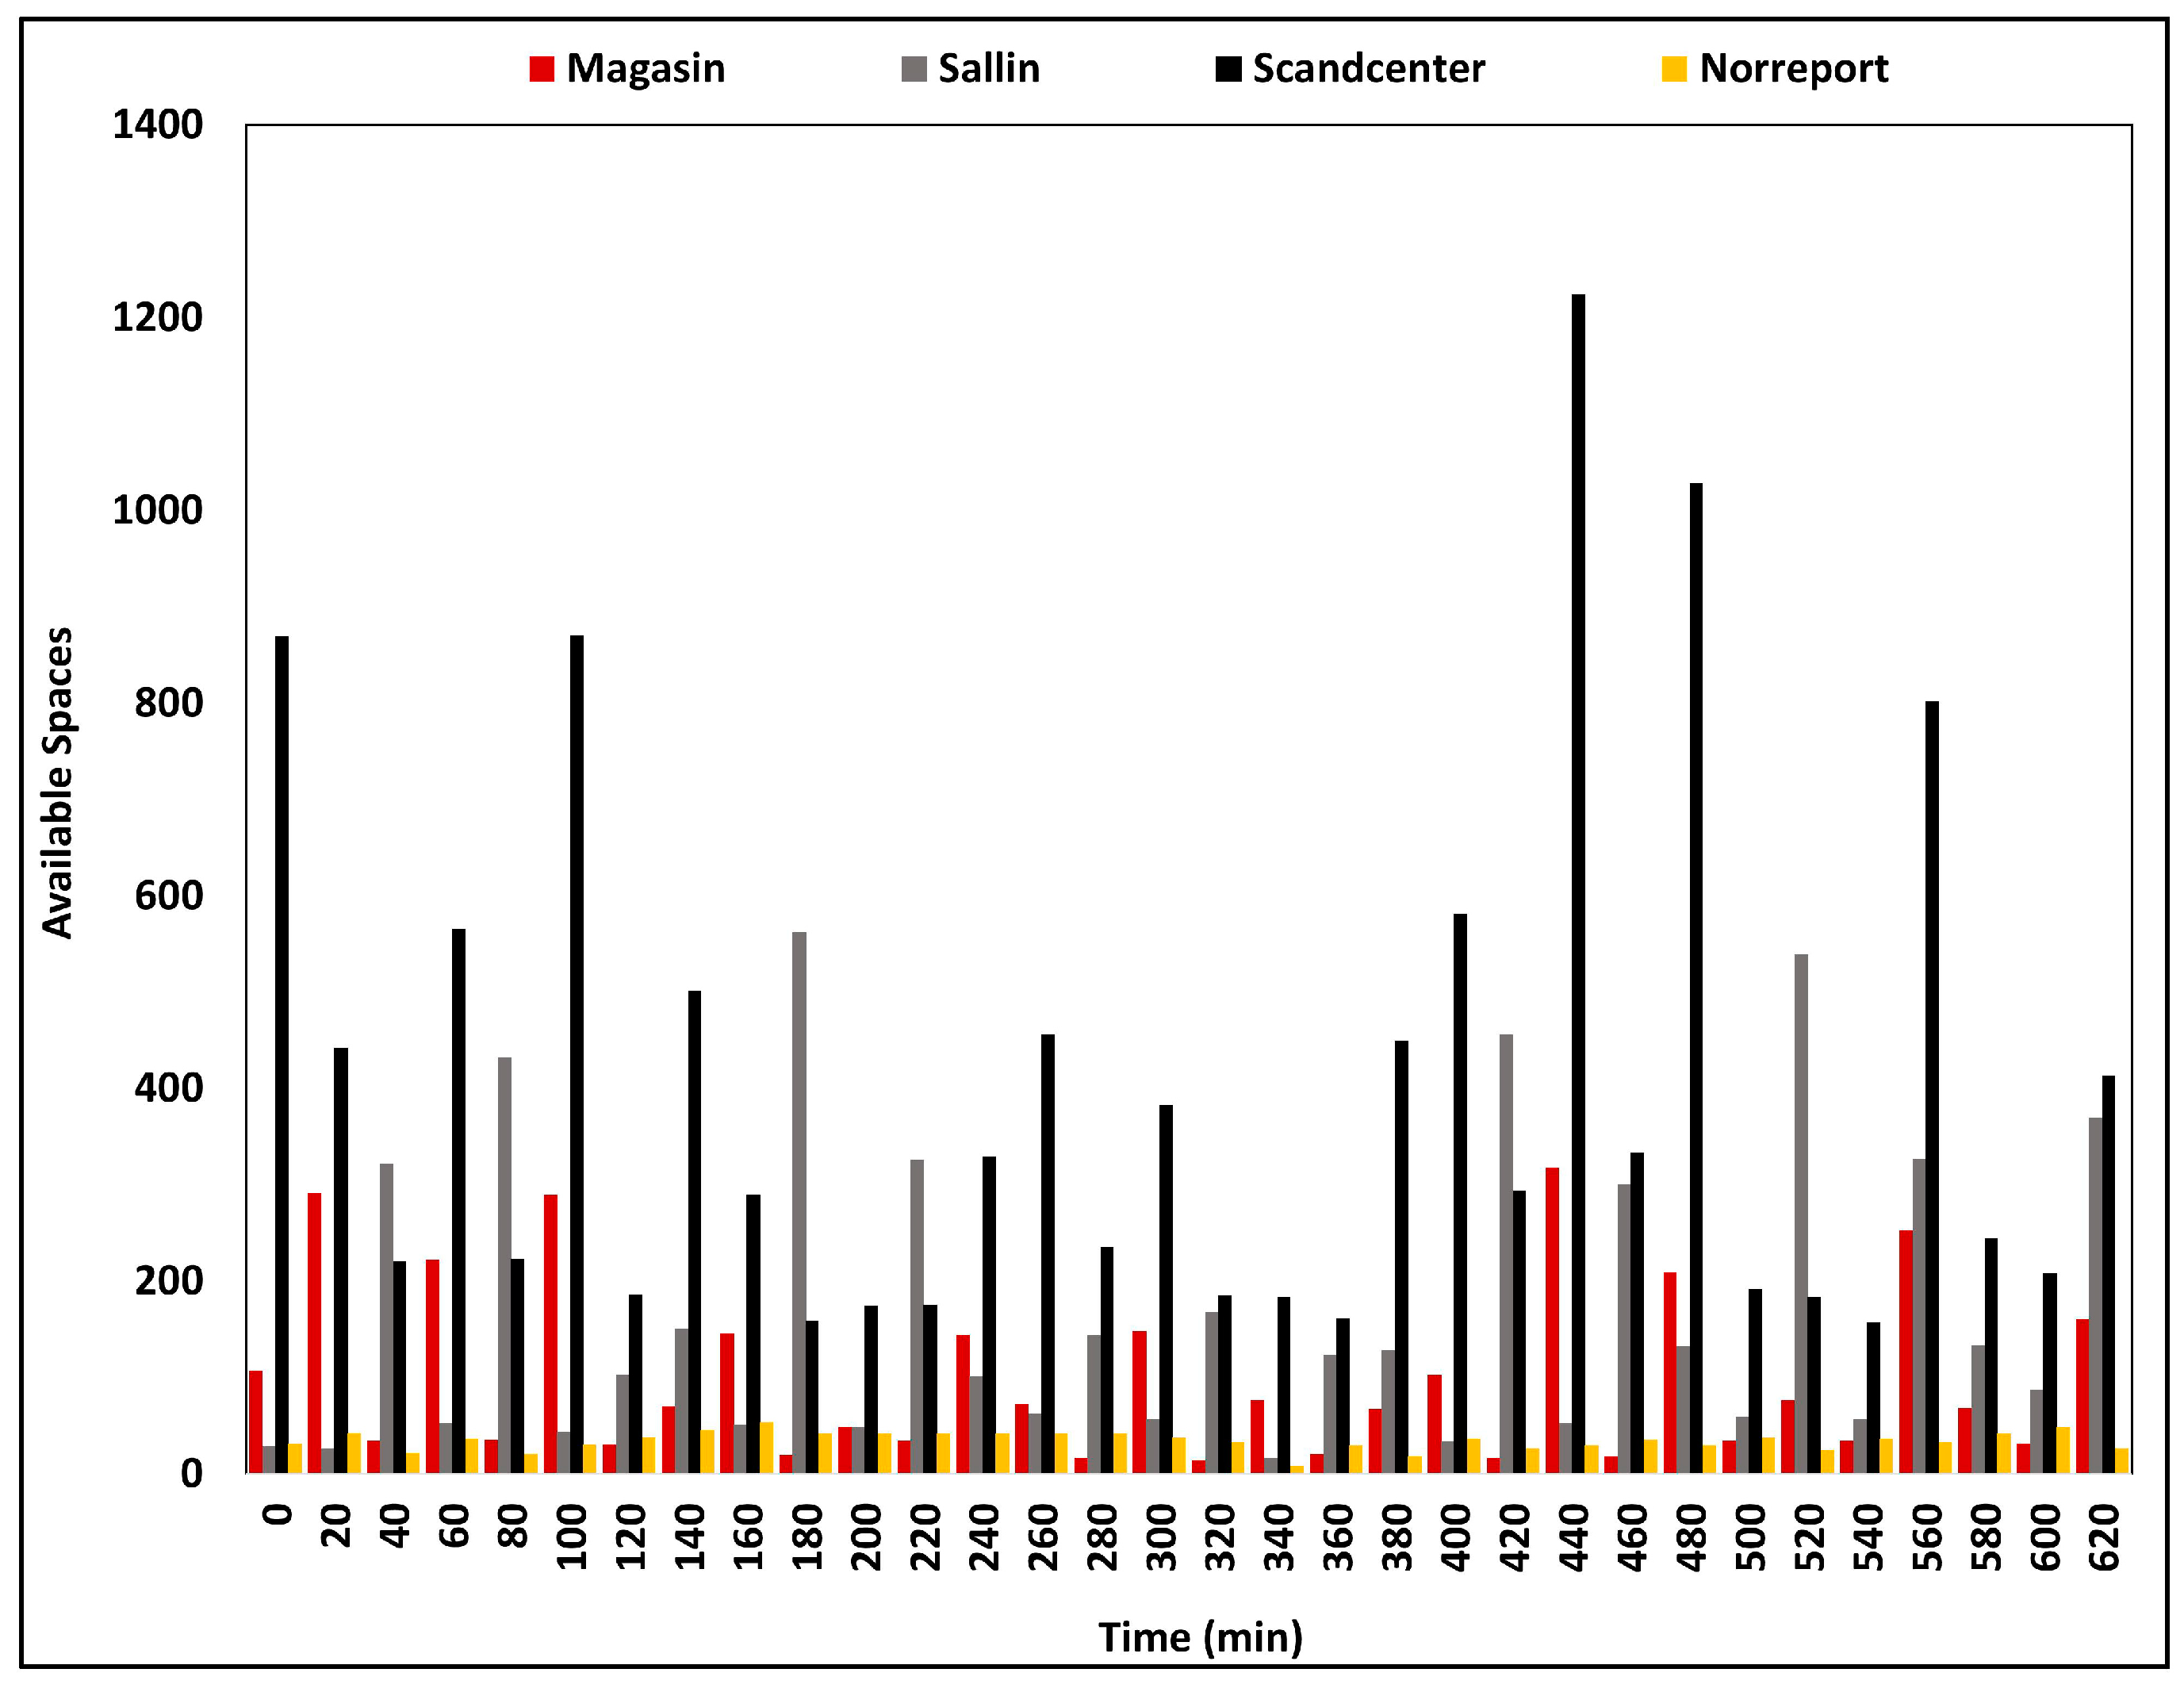
| Aarhus City, Denmark [43] | Parking lots | 0.20 MB |
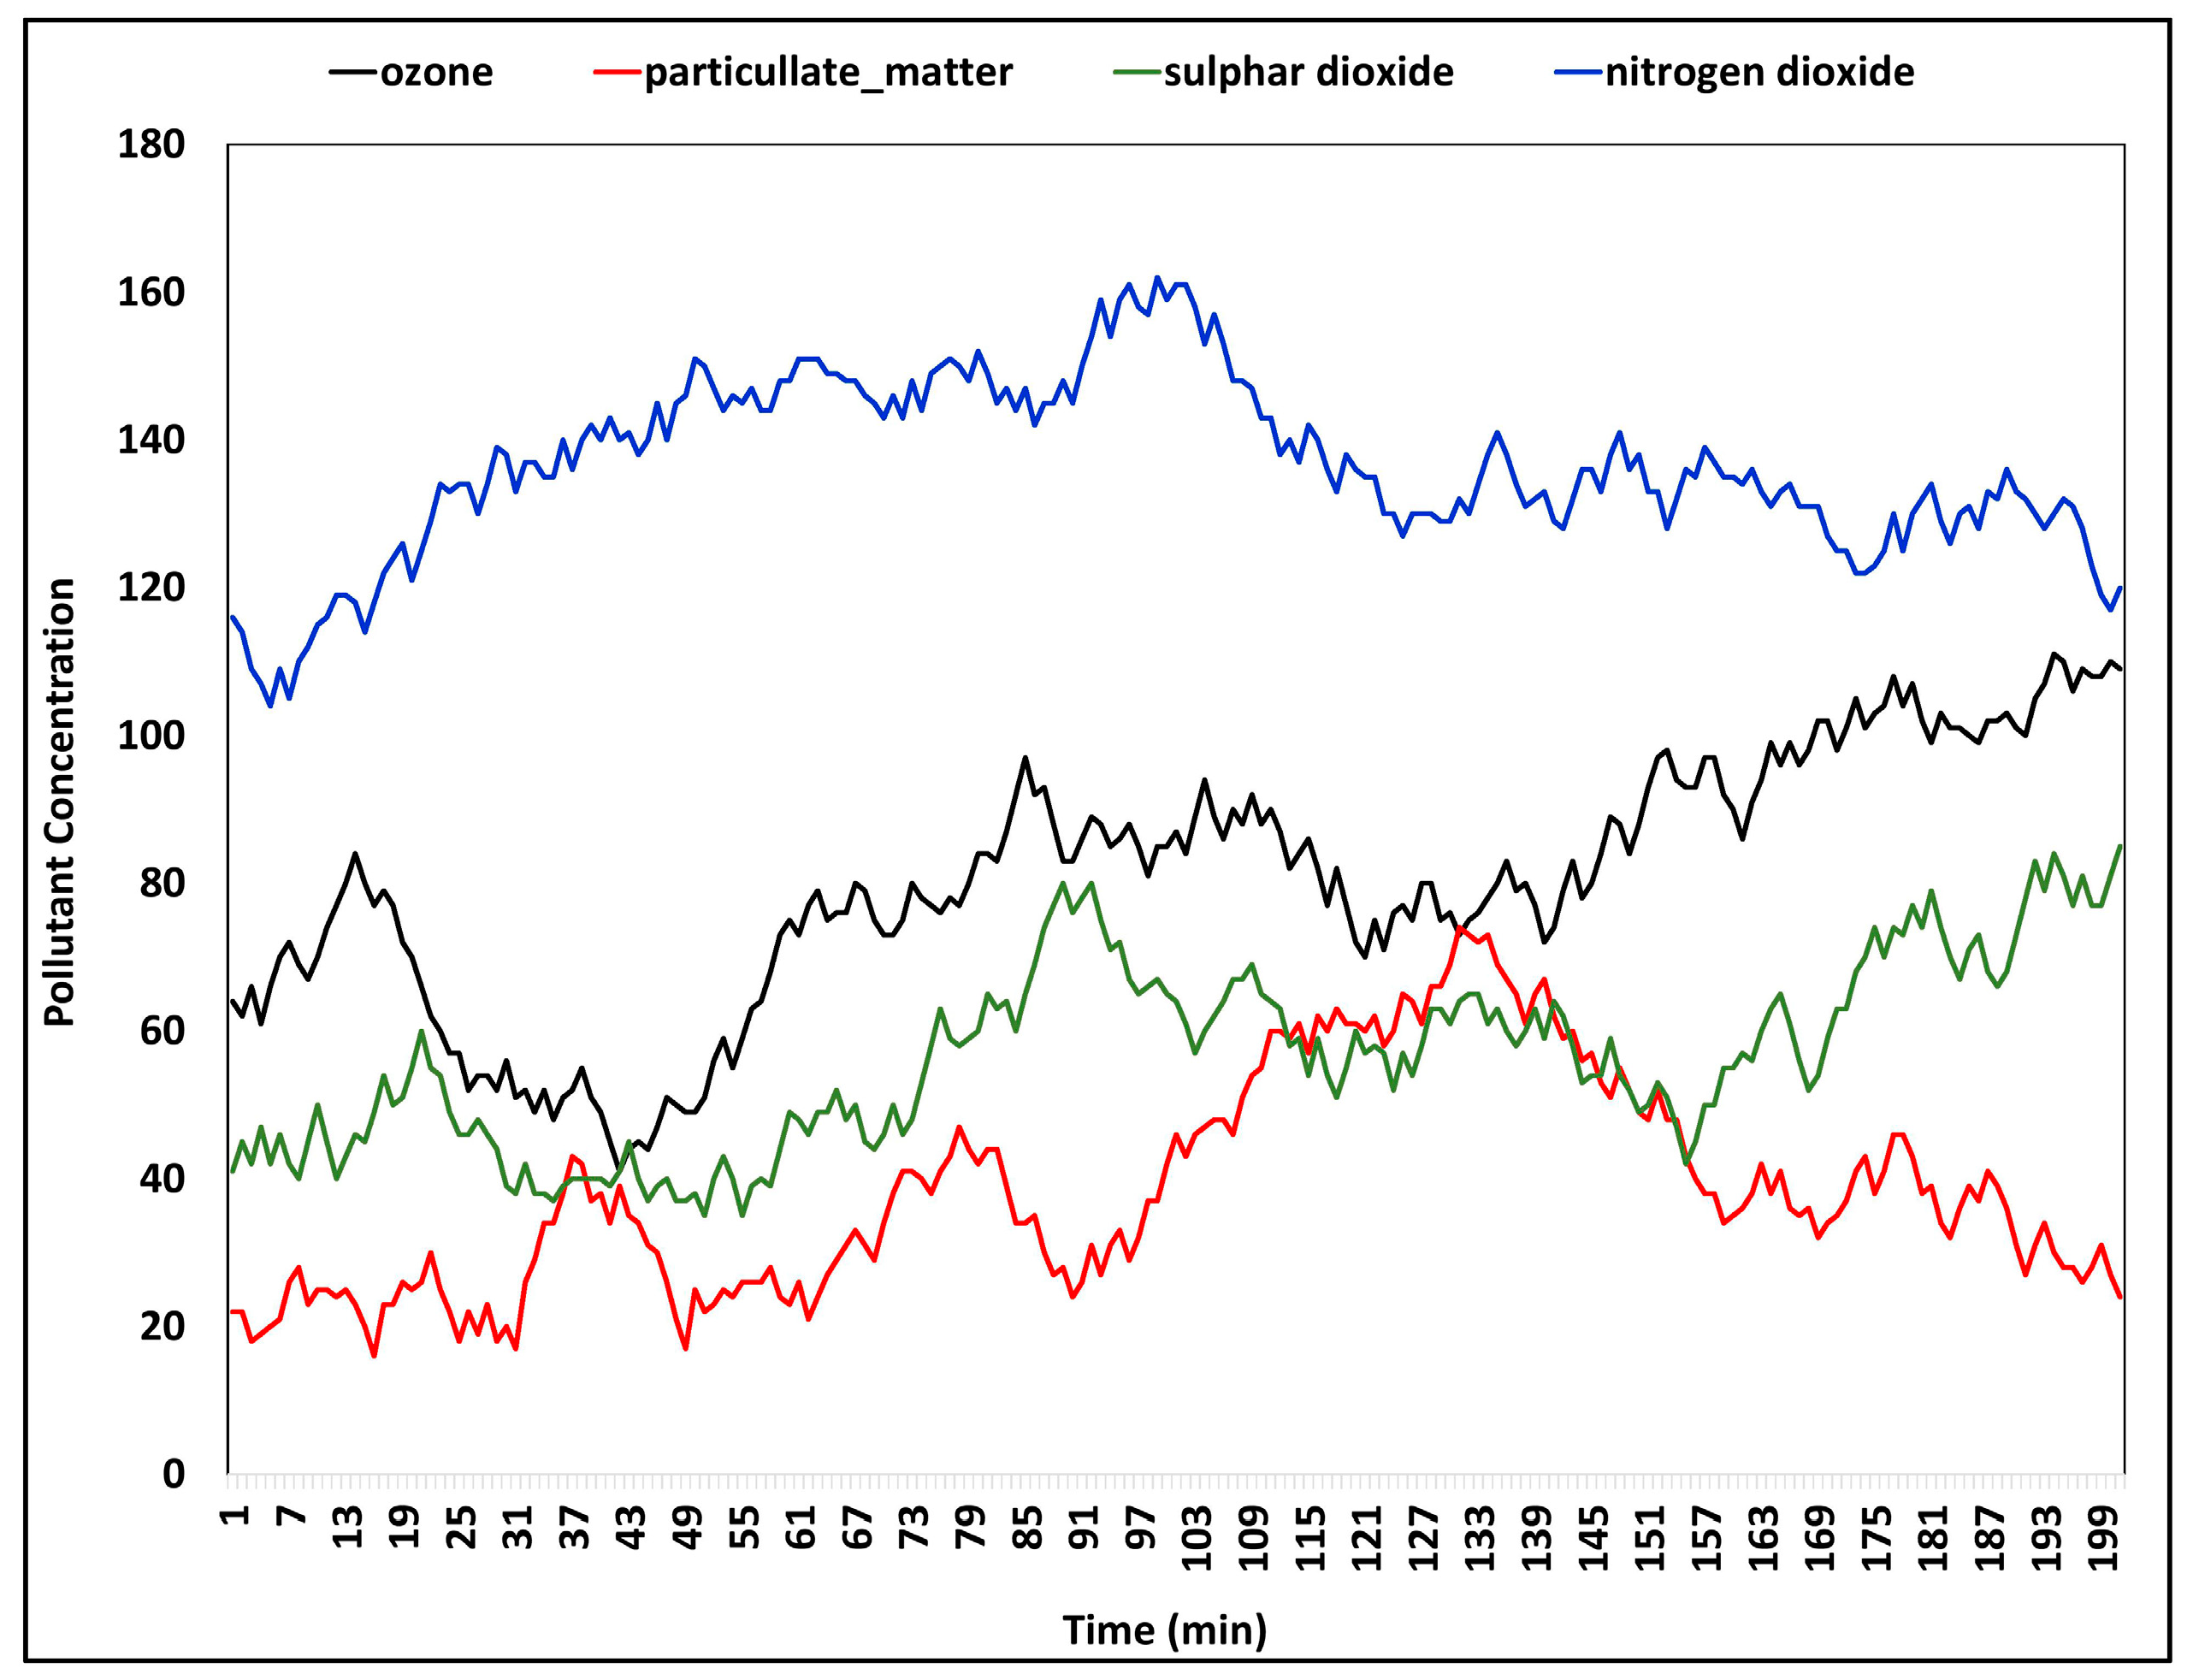
| Aarhus City, Denmark [44] | Pollution Data | 77.25 MB |
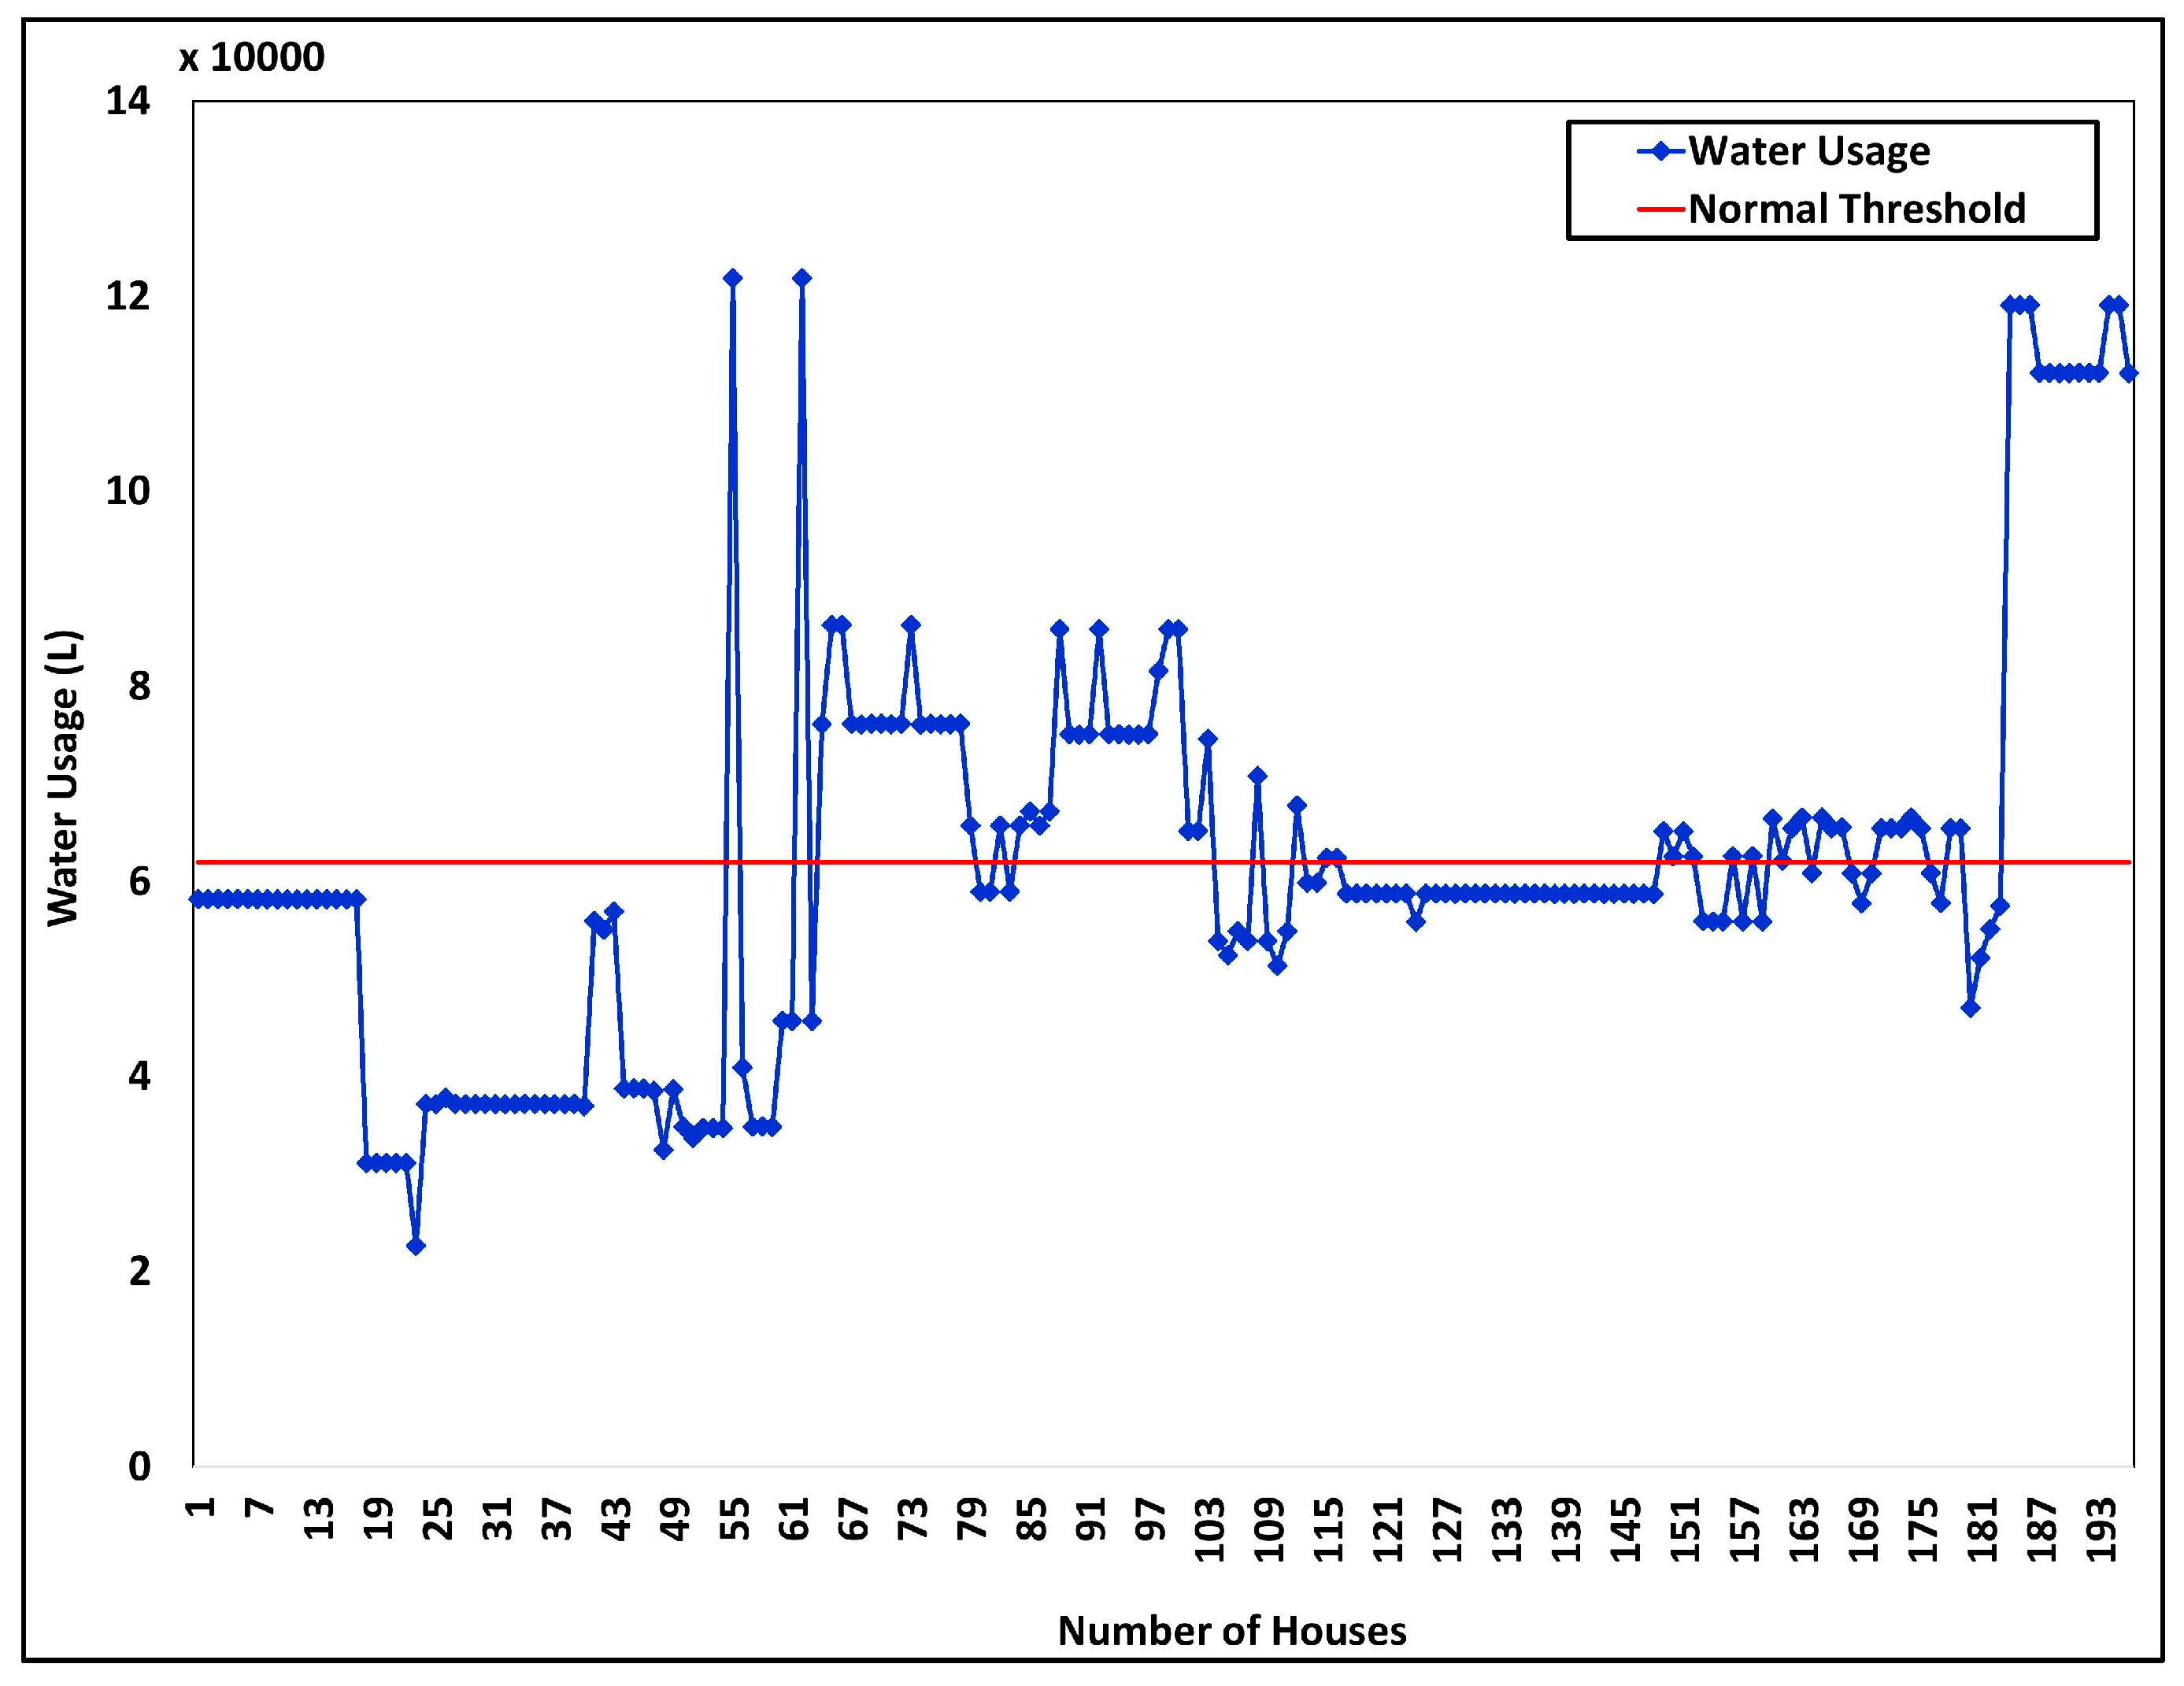
| Surrey City, Canada [45] | Water Consumption | 4 MB |
| Dataset | Size | Threshold | θ |
|---|---|---|---|
| Water Consumption | 4 MB | 80 Cubic Liters | 11.23 s |
| Traffic Data | 3.04 GB | Varies with time | 212.88 s |
| Pollution Data | 77.25 MB | 80% | 16.97 s |
| Parking lots | 0.20 MB | <10/parking garage | 3.67 s |
© 2018 by the authors. Licensee MDPI, Basel, Switzerland. This article is an open access article distributed under the terms and conditions of the Creative Commons Attribution (CC BY) license (http://creativecommons.org/licenses/by/4.0/).
Share and Cite
Silva, B.N.; Khan, M.; Jung, C.; Seo, J.; Muhammad, D.; Han, J.; Yoon, Y.; Han, K. Urban Planning and Smart City Decision Management Empowered by Real-Time Data Processing Using Big Data Analytics. Sensors 2018, 18, 2994. https://doi.org/10.3390/s18092994
Silva BN, Khan M, Jung C, Seo J, Muhammad D, Han J, Yoon Y, Han K. Urban Planning and Smart City Decision Management Empowered by Real-Time Data Processing Using Big Data Analytics. Sensors. 2018; 18(9):2994. https://doi.org/10.3390/s18092994
Chicago/Turabian StyleSilva, Bhagya Nathali, Murad Khan, Changsu Jung, Jihun Seo, Diyan Muhammad, Jihun Han, Yongtak Yoon, and Kijun Han. 2018. "Urban Planning and Smart City Decision Management Empowered by Real-Time Data Processing Using Big Data Analytics" Sensors 18, no. 9: 2994. https://doi.org/10.3390/s18092994
APA StyleSilva, B. N., Khan, M., Jung, C., Seo, J., Muhammad, D., Han, J., Yoon, Y., & Han, K. (2018). Urban Planning and Smart City Decision Management Empowered by Real-Time Data Processing Using Big Data Analytics. Sensors, 18(9), 2994. https://doi.org/10.3390/s18092994