Development of Potentiometric Sensors for C2H4 Detection


Abstract
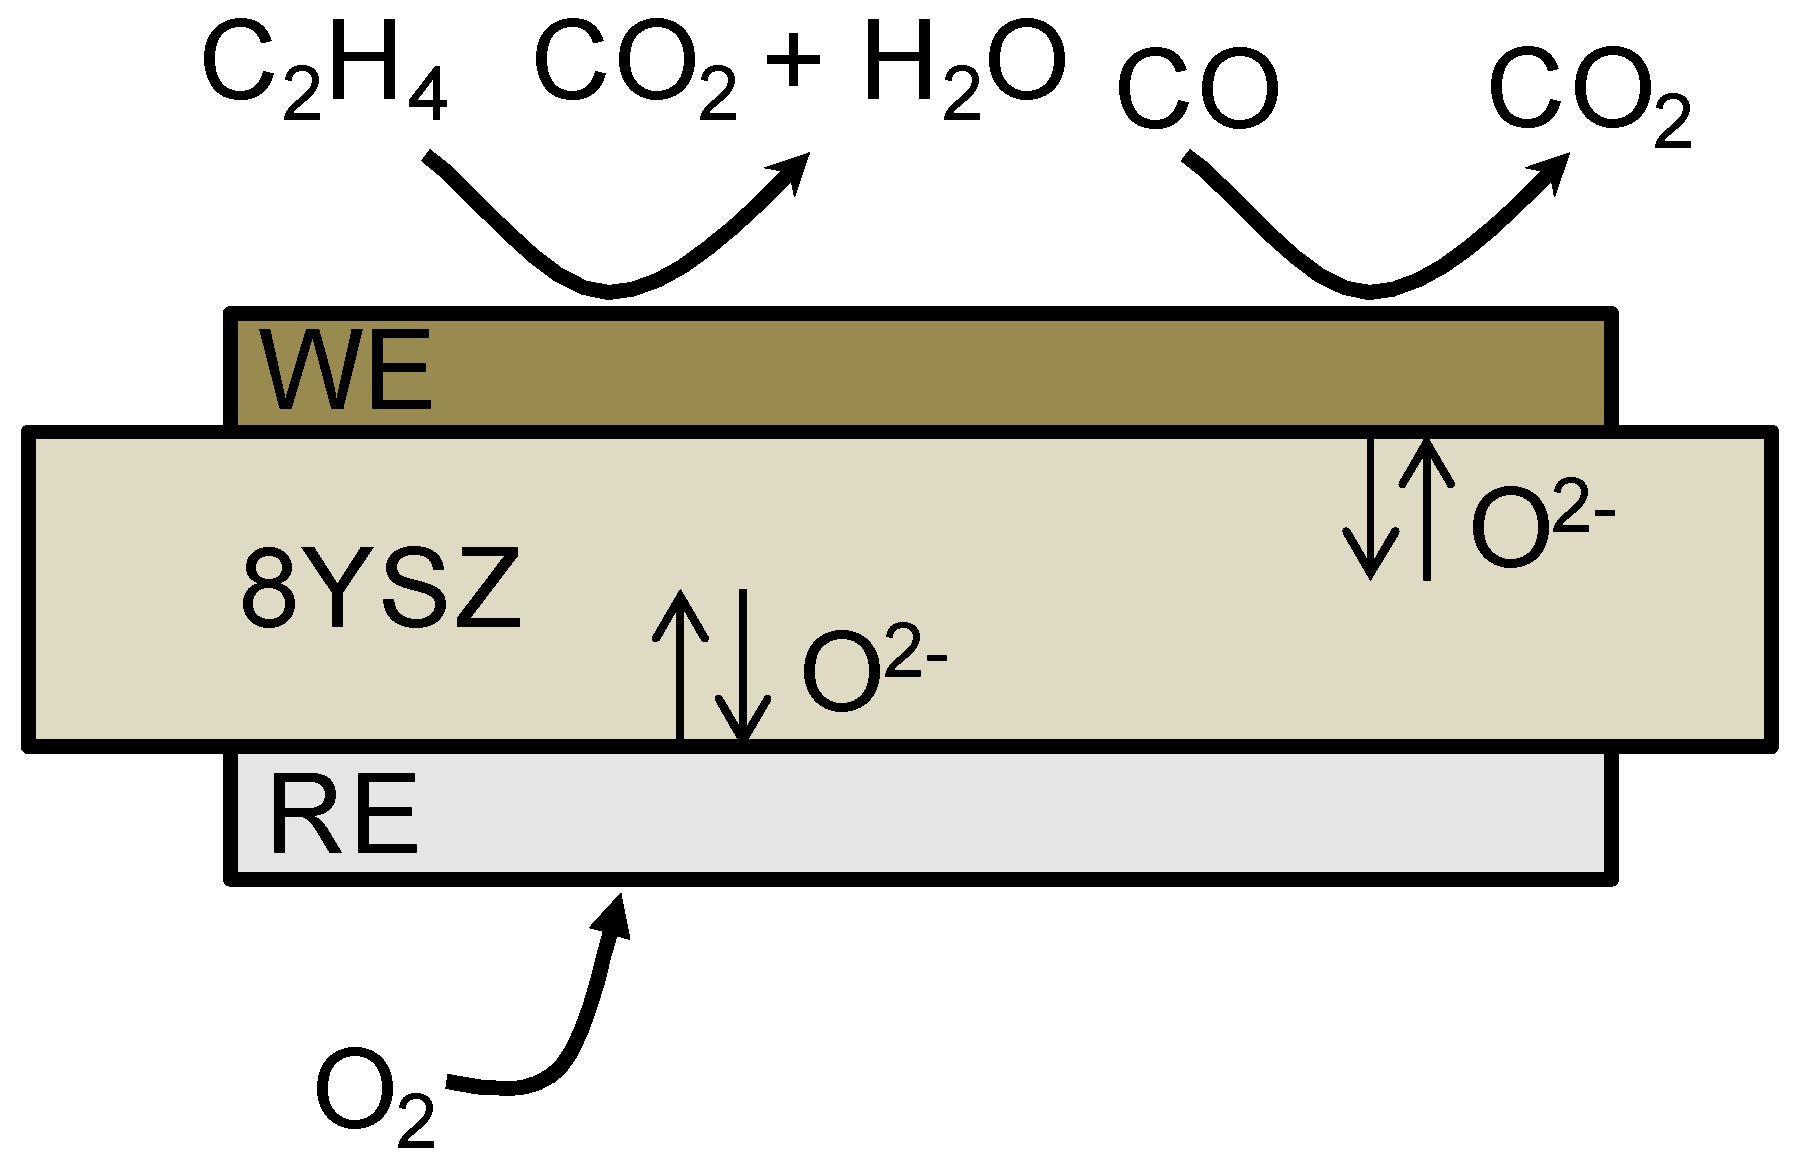
1. Introduction
2. Materials and Methods
2.1. Synthesis of Electrode Materials
2.2. Fabrication of the Sensor Device
2.3. Characterization of Materials and Sensor Device
3. Results and Discussion
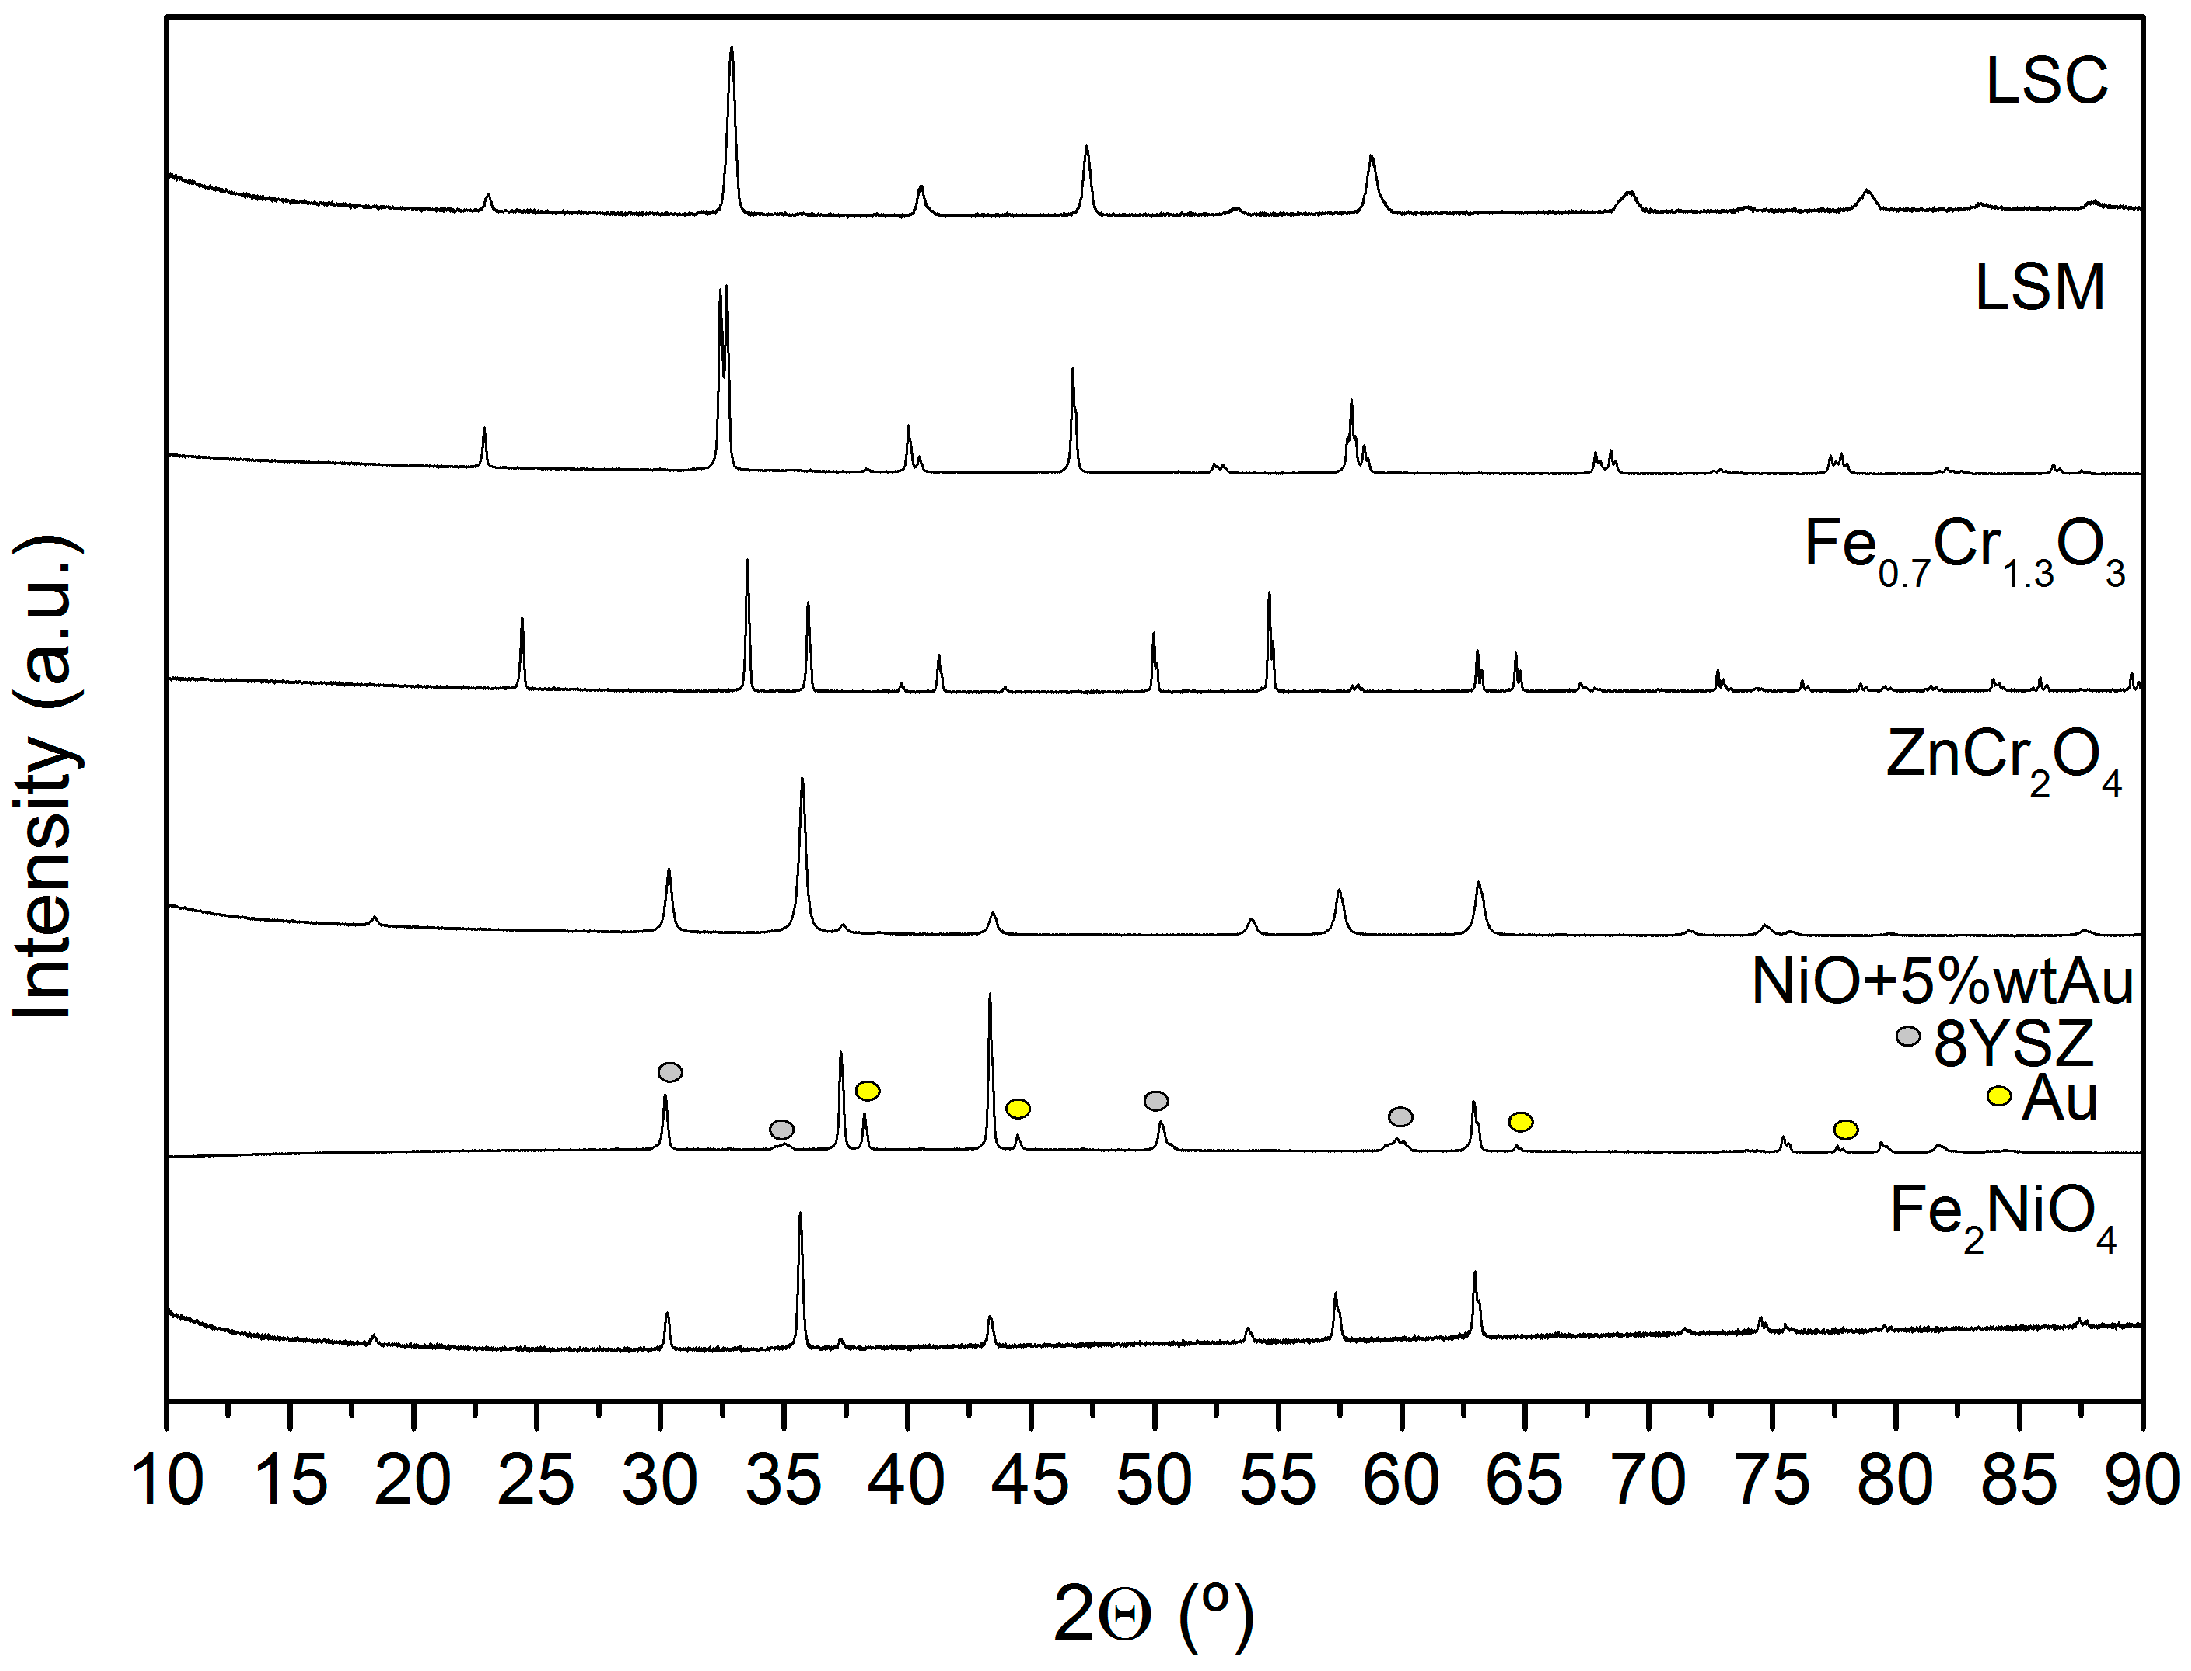
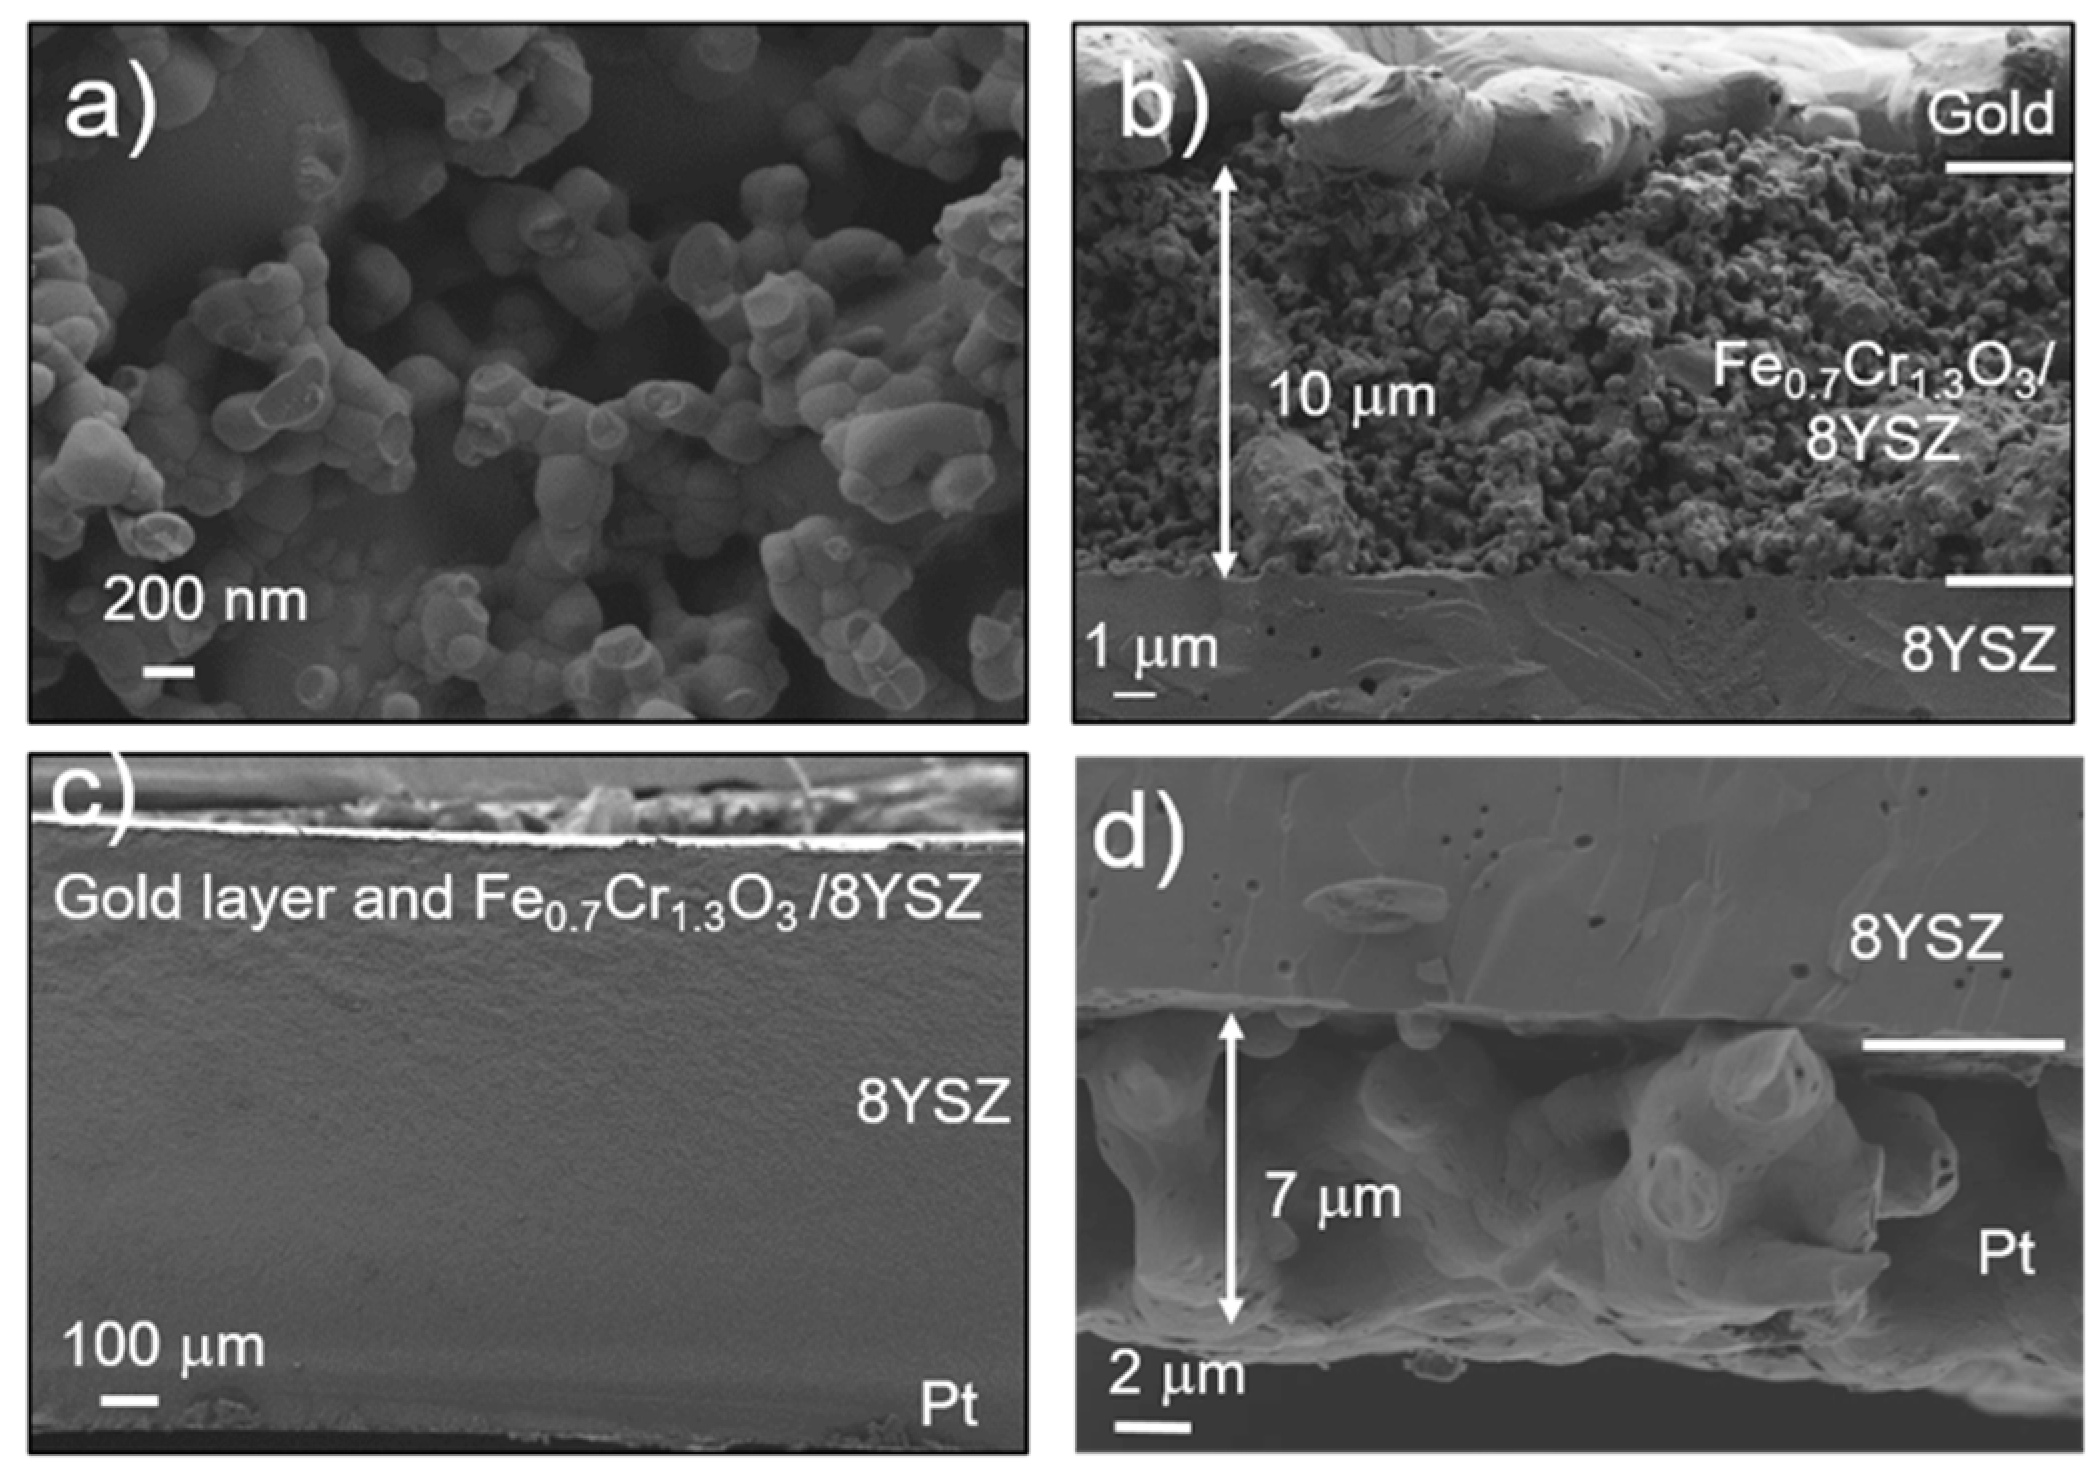
3.1. Microstructural Characterization
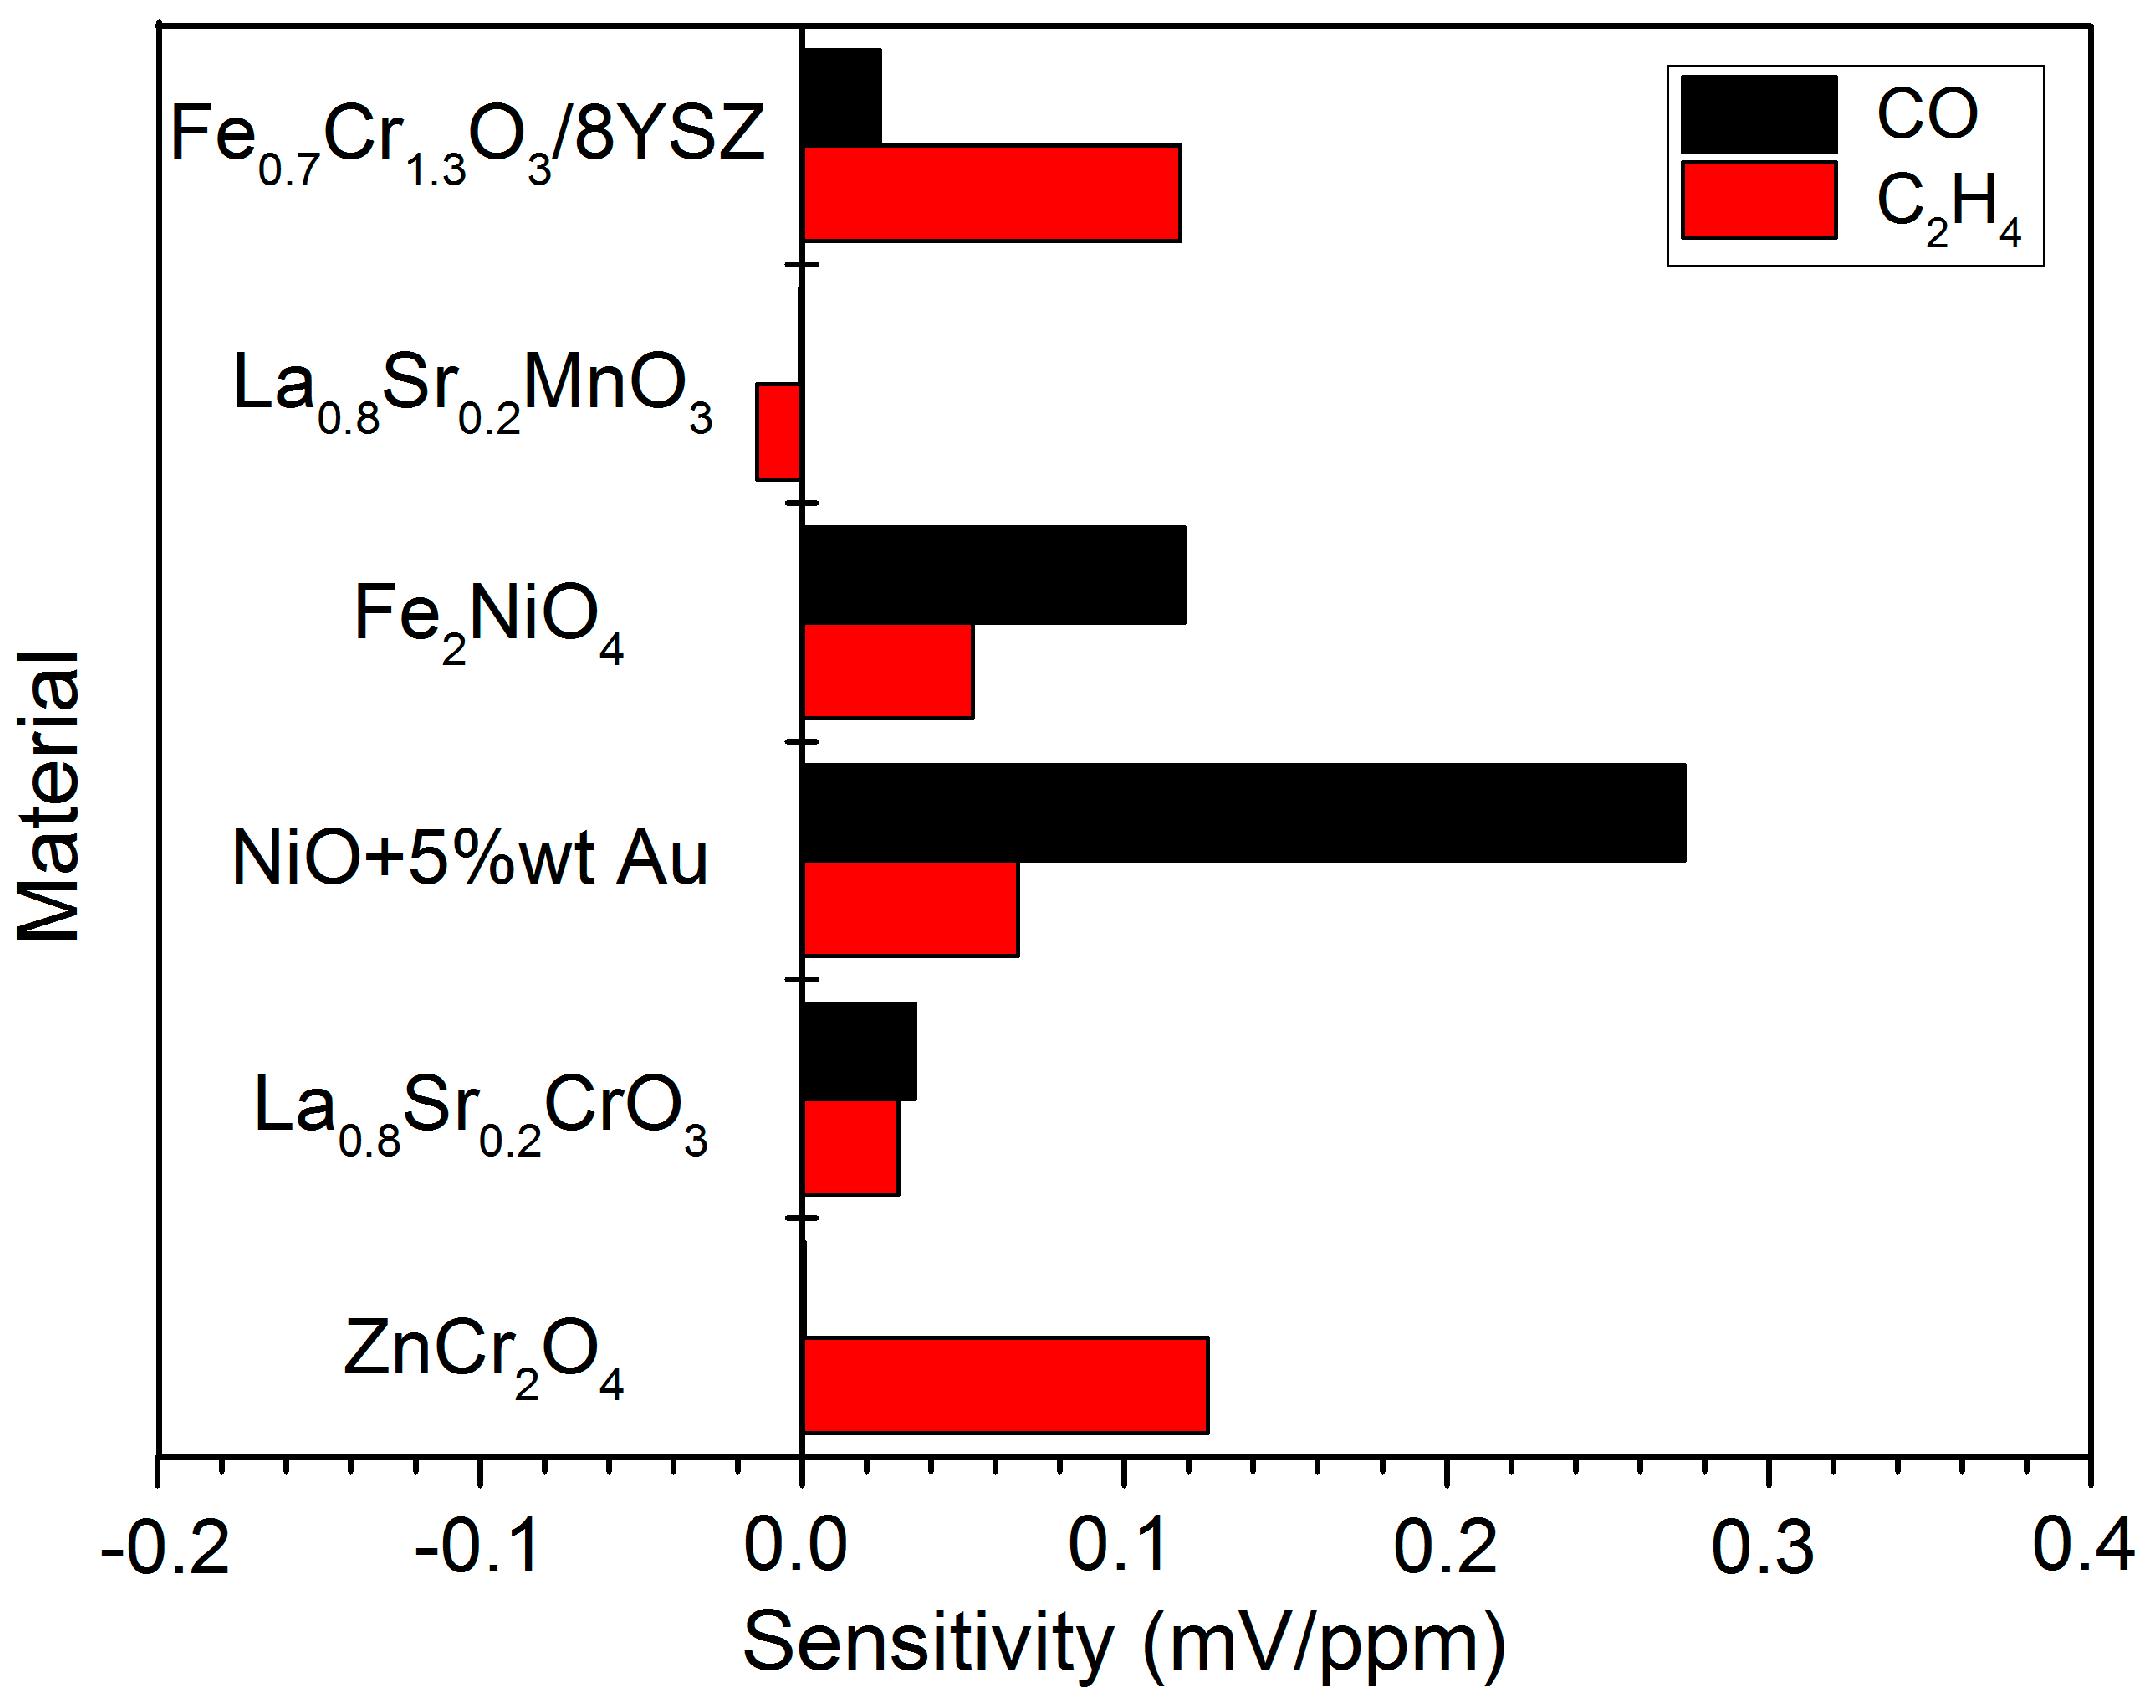
3.2. Electrochemical Characterization
4. Conclusions
Supplementary Materials
Author Contributions
Funding
Acknowledgments
Conflicts of Interest
References
- World Health Organization. Health Effects of Transport-Related Air Pollution; Krzyzanowski, M., Kuna-Dibbert, B., Schneider, J., Eds.; World Health Organization, Regional Office for Europe: Denmark, Germany, 2005; ISBN 92 890 1373 7. [Google Scholar]
- Emission Standards: Europe: Cars and Light Trucks. Available online: https://dieselnet.com/standards/eu/ld.php#stds (accessed on 28 June 2018).
- Sekhar, P.K.; Subramaniyam, K. Electrical characterization of a mixed potential propylene sensor. Sens. Actuators B Chem. 2013, 188, 367–371. [Google Scholar] [CrossRef]
- Reşitoğlu, İ.A.; Altinişik, K.; Keskin, A. The pollutant emissions from diesel-engine vehicles and exhaust aftertreatment systems. Clean Technol. Environ. Policy 2015, 17, 15–27. [Google Scholar] [CrossRef]
- Guth, U.; Zosel, J. Electrochemical solid electrolyte gas sensors—Hydrocarbon and NOx analysis in exhaust gases. Ionics 2004, 10, 366–377. [Google Scholar] [CrossRef]
- Fadeyev, G.; Kalakin, A.; Demin, A.; Volkov, A.; Brouzgou, A.; Tsiakaras, P. Electrodes for solid electrolyte sensors for the measurement of CO and H2 content in air. Int. J. Hydrogen Energy 2013, 38, 13484–13490. [Google Scholar] [CrossRef]
- Yoo, J.; Chatterjee, S.; Wachsman, E.D. Sensing properties and selectivities of a WO3/YSZ/Pt potentiometric NOx sensor. Sens. Actuators B Chem. 2007, 122, 644–652. [Google Scholar] [CrossRef]
- Romanytsia, I.; Viricelle, J.P.; Vernoux, P.; Pijolat, C. Application of advanced morphology Au–X (X = YSZ, ZrO2) composites as sensing electrode for solid state mixed-potential exhaust NOx sensor. Sens. Actuators B Chem. 2015, 207, 391–397. [Google Scholar] [CrossRef]
- Iio, A.; Ikeda, H.; Anggraini, S.A.; Miura, N. Potentiometric YSZ-based oxygen sensor using BaFeO3 sensing-electrode. Electrochem. Commun. 2014, 48, 134–137. [Google Scholar] [CrossRef]
- Plashnitsa, V.V.; Elumalai, P.; Fujio, Y.; Miura, N. Zirconia-based electrochemical gas sensors using nano-structured sensing materials aiming at detection of automotive exhausts. Electrochim. Acta 2009, 54, 6099–6106. [Google Scholar] [CrossRef]
- Brosha, E.L.; Mukundan, R.; Brown, D.R.; Garzon, F.H.; Visser, J.H.; Zanini, M.; Zhou, Z.; Logothetis, E.M. CO/HC sensors based on thin films of LaCoO3 and La0.8Sr0.2CoO3−δ metal oxides. Sens. Actuators B Chem. 2000, 69, 171–182. [Google Scholar] [CrossRef]
- Chevallier, L.; Dibartolomeo, E.; Grilli, M.; Traversa, E. High temperature detection of CO/HCs gases by non-Nernstian planar sensors using Nb2O5 electrode. Sens. Actuators B Chem. 2008, 130, 514–519. [Google Scholar] [CrossRef]
- Yamaguchi, M.; Anggraini, S.A.; Fujio, Y.; Sato, T.; Breedon, M.; Miura, N. Stabilized zirconia-based sensor utilizing SnO2-based sensing electrode with an integrated Cr2O3 catalyst layer for sensitive and selective detection of hydrogen. Int. J. Hydrogen Energy 2013, 38, 305–312. [Google Scholar] [CrossRef]
- MacAm, E.R.; White, B.M.; Blackburn, B.M.; Di Bartolomeo, E.; Traversa, E.; Wachsman, E.D. La2CuO4 sensing electrode configuration influence on sensitivity and selectivity for a multifunctional potentiometric gas sensor. Sens. Actuators B Chem. 2011, 160, 957–963. [Google Scholar] [CrossRef]
- Fujio, Y.; Sato, T.; Miura, N. Sensing performance of zirconia-based gas sensor using titania sensing-electrode added with palladium. Solid State Ionics 2014, 262, 266–269. [Google Scholar] [CrossRef]
- Zosel, J.; Müller, R.; Vashook, V.; Guth, U. Response behavior of perovskites and Au/oxide composites as HC-electrodes in different combustibles. Solid State Ionics 2004, 175, 531–533. [Google Scholar] [CrossRef]
- Mori, M.; Sadaoka, Y.; Nakagawa, S.; Kida, M.; Kojima, T. Development of ethanol and toluene sensing devices with a planar-type structure based on YSZ and modified Pt electrodes. Sens. Actuators B Chem. 2013, 187, 509–513. [Google Scholar] [CrossRef]
- Elumalai, P.; Plashnitsa, V.V.; Fujio, Y.; Miura, N. Highly sensitive and selective stabilized zirconia-based mixed-potential-type propene sensor using NiO/Au composite sensing-electrode. Sens. Actuators B Chem. 2010, 144, 215–219. [Google Scholar] [CrossRef]
- Fergus, J.W. Sensing mechanism of non-equilibrium solid-electrolyte-based chemical sensors. J. Solid State Electrochem. 2011, 15, 971–984. [Google Scholar] [CrossRef]
- Haruta, M. When Gold Is Not Noble: Catalysis by Nanoparticles. Chem. Rec. 2003, 3, 75–87. [Google Scholar] [CrossRef] [PubMed]
- Shaikhutdinov, S.K.; Meyer, R.; Naschitzki, M.; Baümer, M.; Freund, H.-J. Size and support effects for CO adsorption on gold model catalysts. Catal. Lett. 2003, 86, 211–219. [Google Scholar] [CrossRef]
- De Souza, C.V.; Corr, S.M. Polycyclic aromatic hydrocarbon emissions in diesel exhaust using gas chromatographye-mass spectrometry with programmed temperature vaporization and large volume injection. Atmos. Environ. 2015, 103, 222–230. [Google Scholar] [CrossRef]
- Miguel, A.H.; Kirchstetter, T.W.; Harley, R.A.; Hering, S.V. On-Road Emissions of Particulate Polycyclic Aromatic Hydrocarbons and Black Carbon from Gasoline and Diesel Vehicles. Environ. Sci. Technol. 1998, 32, 450–455. [Google Scholar] [CrossRef]
- Storey, J.M.; Lewis, S.A.; West, B.H.; Huff, S.P.; Sluder, C.S.; Wagner, R.M.; Domingo, N.; Thomas, J.; Kass, M. Hydrocarbon Species in The Exhaust of Diesel Engines Equipped with Advanced Emissions Control Devices. Final Report CRC Project No. AVFL-10b-2. Available online: www.crcao.org/reports/recentstudies2005/AVFL-10b-2%20Final%20Report%20January%2031%202005.pdf (accessed on 20 October 2017).
- Miura, N.; Sato, T.; Anggraini, S.A.; Ikeda, H.; Zhuiykov, S. A review of mixed-potential type zirconia-based gas sensors. Ionics 2014, 20, 901–925. [Google Scholar] [CrossRef]
- Striker, T.; Ramaswamy, V.; Armstrong, E.N.; Willson, P.D.; Wachsman, E.D.; Ruud, J.A. Effect of nanocomposite Au–YSZ electrodes on potentiometric sensor response to NOx and CO. Sens. Actuators B. Chem. 2013, 181, 312–318. [Google Scholar] [CrossRef]
- Stranzenbach, M.; Saruhan, B. Equivalent circuit analysis on NOx impedance-metric gas sensors. Sens. Actuators B Chem. 2009, 137, 154–163. [Google Scholar] [CrossRef]
- Hagen, G.; Dubbe, A.; Fischerauer, G.; Moos, R. Thick-film impedance based hydrocarbon detection based on chromium(III) oxide/zeolite interfaces. Sens. Actuators B Chem. 2006, 118, 73–77. [Google Scholar] [CrossRef]
- Miura, N.; Nakatou, M.; Zhuiykov, S. Impedancemetric gas sensor based on zirconia solid electrolyte and oxide sensing electrode for detecting total NOx at high temperature. Sens. Actuators B Chem. 2003, 93, 221–228. [Google Scholar] [CrossRef]
- Nakatou, M.; Miura, N. Detection of propene by using new-type impedancemetric zirconia-based sensor attached with oxide sensing-electrode. Sens. Actuators B Chem. 2006, 120, 57–62. [Google Scholar] [CrossRef]
- Ikeda, H.; Iio, A.; Anggraini, S.A.; Miura, N. Impedancemetric YSZ-based oxygen sensor using BaFeO3 sensing-electrode. Sens. Actuators B Chem. 2017, 243, 279–282. [Google Scholar] [CrossRef]
- Jäger, B.; Wermann, A.; Scholz, P.; Müller, M.; Reislöhner, U.; Stolle, A.; Ondruschka, B. Iron-containing defect-rich mixed metal oxides for Friedel–Crafts alkylation. Appl. Catal. A 2012, 443, 87–95. [Google Scholar] [CrossRef]
- Ghorpade, S.P.; Darshane, V.S.; Dixit, S.G. Liquid-phase Friedel-Crafts alkylation using CuCr2−xFexO4 spinel catalysts. Appl. Catal. A 1998, 166, 135–142. [Google Scholar] [CrossRef]
- Jadhav, H.S.; Kalubarme, R.S.; Jadhav, A.H.; Seo, J.G. Iron-nickel spinel oxide as an electrocatalyst for non-aqueous rechargeable lithium-oxygen batteries. J. Alloys Compd. 2016, 666, 476–481. [Google Scholar] [CrossRef]
- Samarasingha, P.B.; Andersen, N.H.; Sørby, M.H.; Kumar, S.; Nilsen, O.; Fjellvåg, H. Neutron diffraction and Raman analysis of LiMn1.5Ni0.5O4 spinel type oxides for use as lithium ion battery cathode and their capacity enhancements. Solid State Ionics 2016, 284, 28–36. [Google Scholar] [CrossRef]
- Tian, B.; Światowska, J.; Maurice, V.; Zanna, S.; Seyeux, A.; Marcus, P. Binary iron-chromium oxide as negative electrode for lithium-ion micro-batteries—Spectroscopic and microscopic characterization. Appl. Surf. Sci. 2015, 353, 1170–1178. [Google Scholar] [CrossRef]
- Veres, M.; Füle, M.; Tóth, S.; Koós, M.; Pócsik, I. Surface enhanced Raman scattering (SERS) investigation of amorphous carbon. Diamond Relat. Mater. 2004, 13, 1412–1415. [Google Scholar] [CrossRef]
- De la Chapelle, M.L.; Lefrant, S.; Journet, C.; Maser, W.; Bernier, P.; Loiseau, A. Raman studies on single walled carbon nanotubes produced by the electric arc technique. Carbon 1998, 36, 705–708. [Google Scholar] [CrossRef]
- Dutta, A.; Kaabbuathong, N.; Grilli, M.L.; Di Bartolomeo, E.; Traversa, E. Study of YSZ-Based Electrochemical Sensors with WO3 Electrodes in NO2 and CO Environments. J. Electrochem. Soc. 2003, 150, H33–H37. [Google Scholar] [CrossRef]
- Yin, C.; Guan, Y.; Zhu, Z.; Liang, X.; Wang, B.; Diao, Q.; Zhang, H.; Ma, J.; Liu, F.; Sun, Y.; et al. Highly sensitive mixed-potential-type NO2 sensor using porous double-layer YSZ substrate. Sens. Actuators B Chem. 2013, 183, 474–477. [Google Scholar] [CrossRef]
- Cai, H.; Sun, R.; Yang, X.; Liang, X.; Wang, C.; Sun, P.; Liu, F.; Zhao, C.; Sun, Y.; Lu, G. Mixed-potential type NOx sensor using stabilized zirconia and MoO3–In2O3 nanocomposites. Ceram. Int. 2016, 42, 12503–12507. [Google Scholar] [CrossRef]


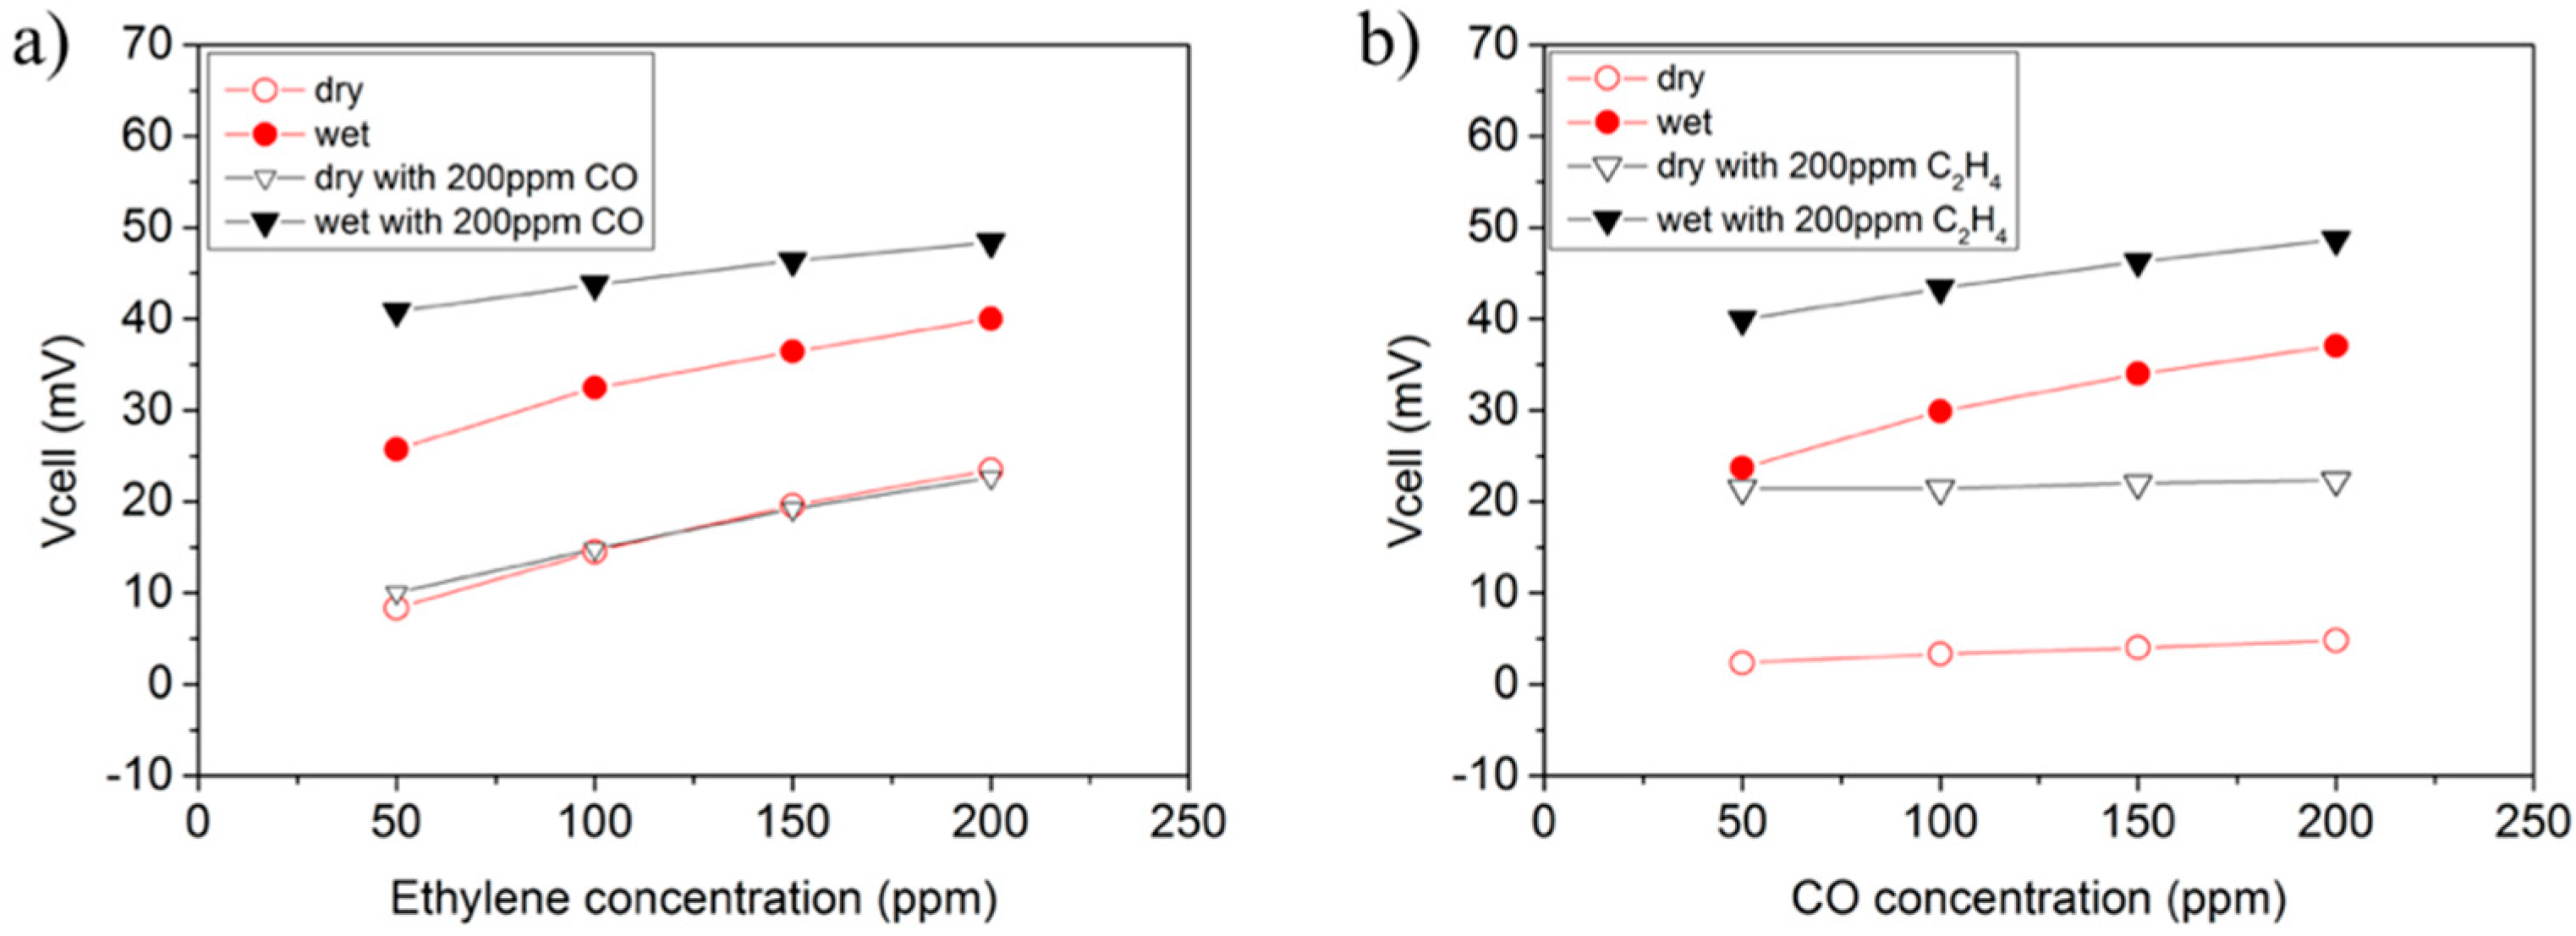
| Analyte | Dry Sensitivity (mV/ppm) | Wet Sensitivity (mV/ppm) | C14H10 Sensitivity (mV/ppm) |
|---|---|---|---|
| C2H4 | 1.2 × 10⁻¹ | 9.4 × 10⁻² | 9.0 × 10⁻² |
| CO | 2.4 × 10⁻² | 8.8 × 10⁻² | 7.1 × 10⁻² |
| C2H4 with 200 ppm of CO | 8.4 × 10⁻² | 5.1 × 10⁻² | 6.1 × 10⁻² |
| CO with 200 ppm of C2H4 | 6.6 × 10⁻³ | 5.8 × 10⁻² | 5.1 × 10⁻² |
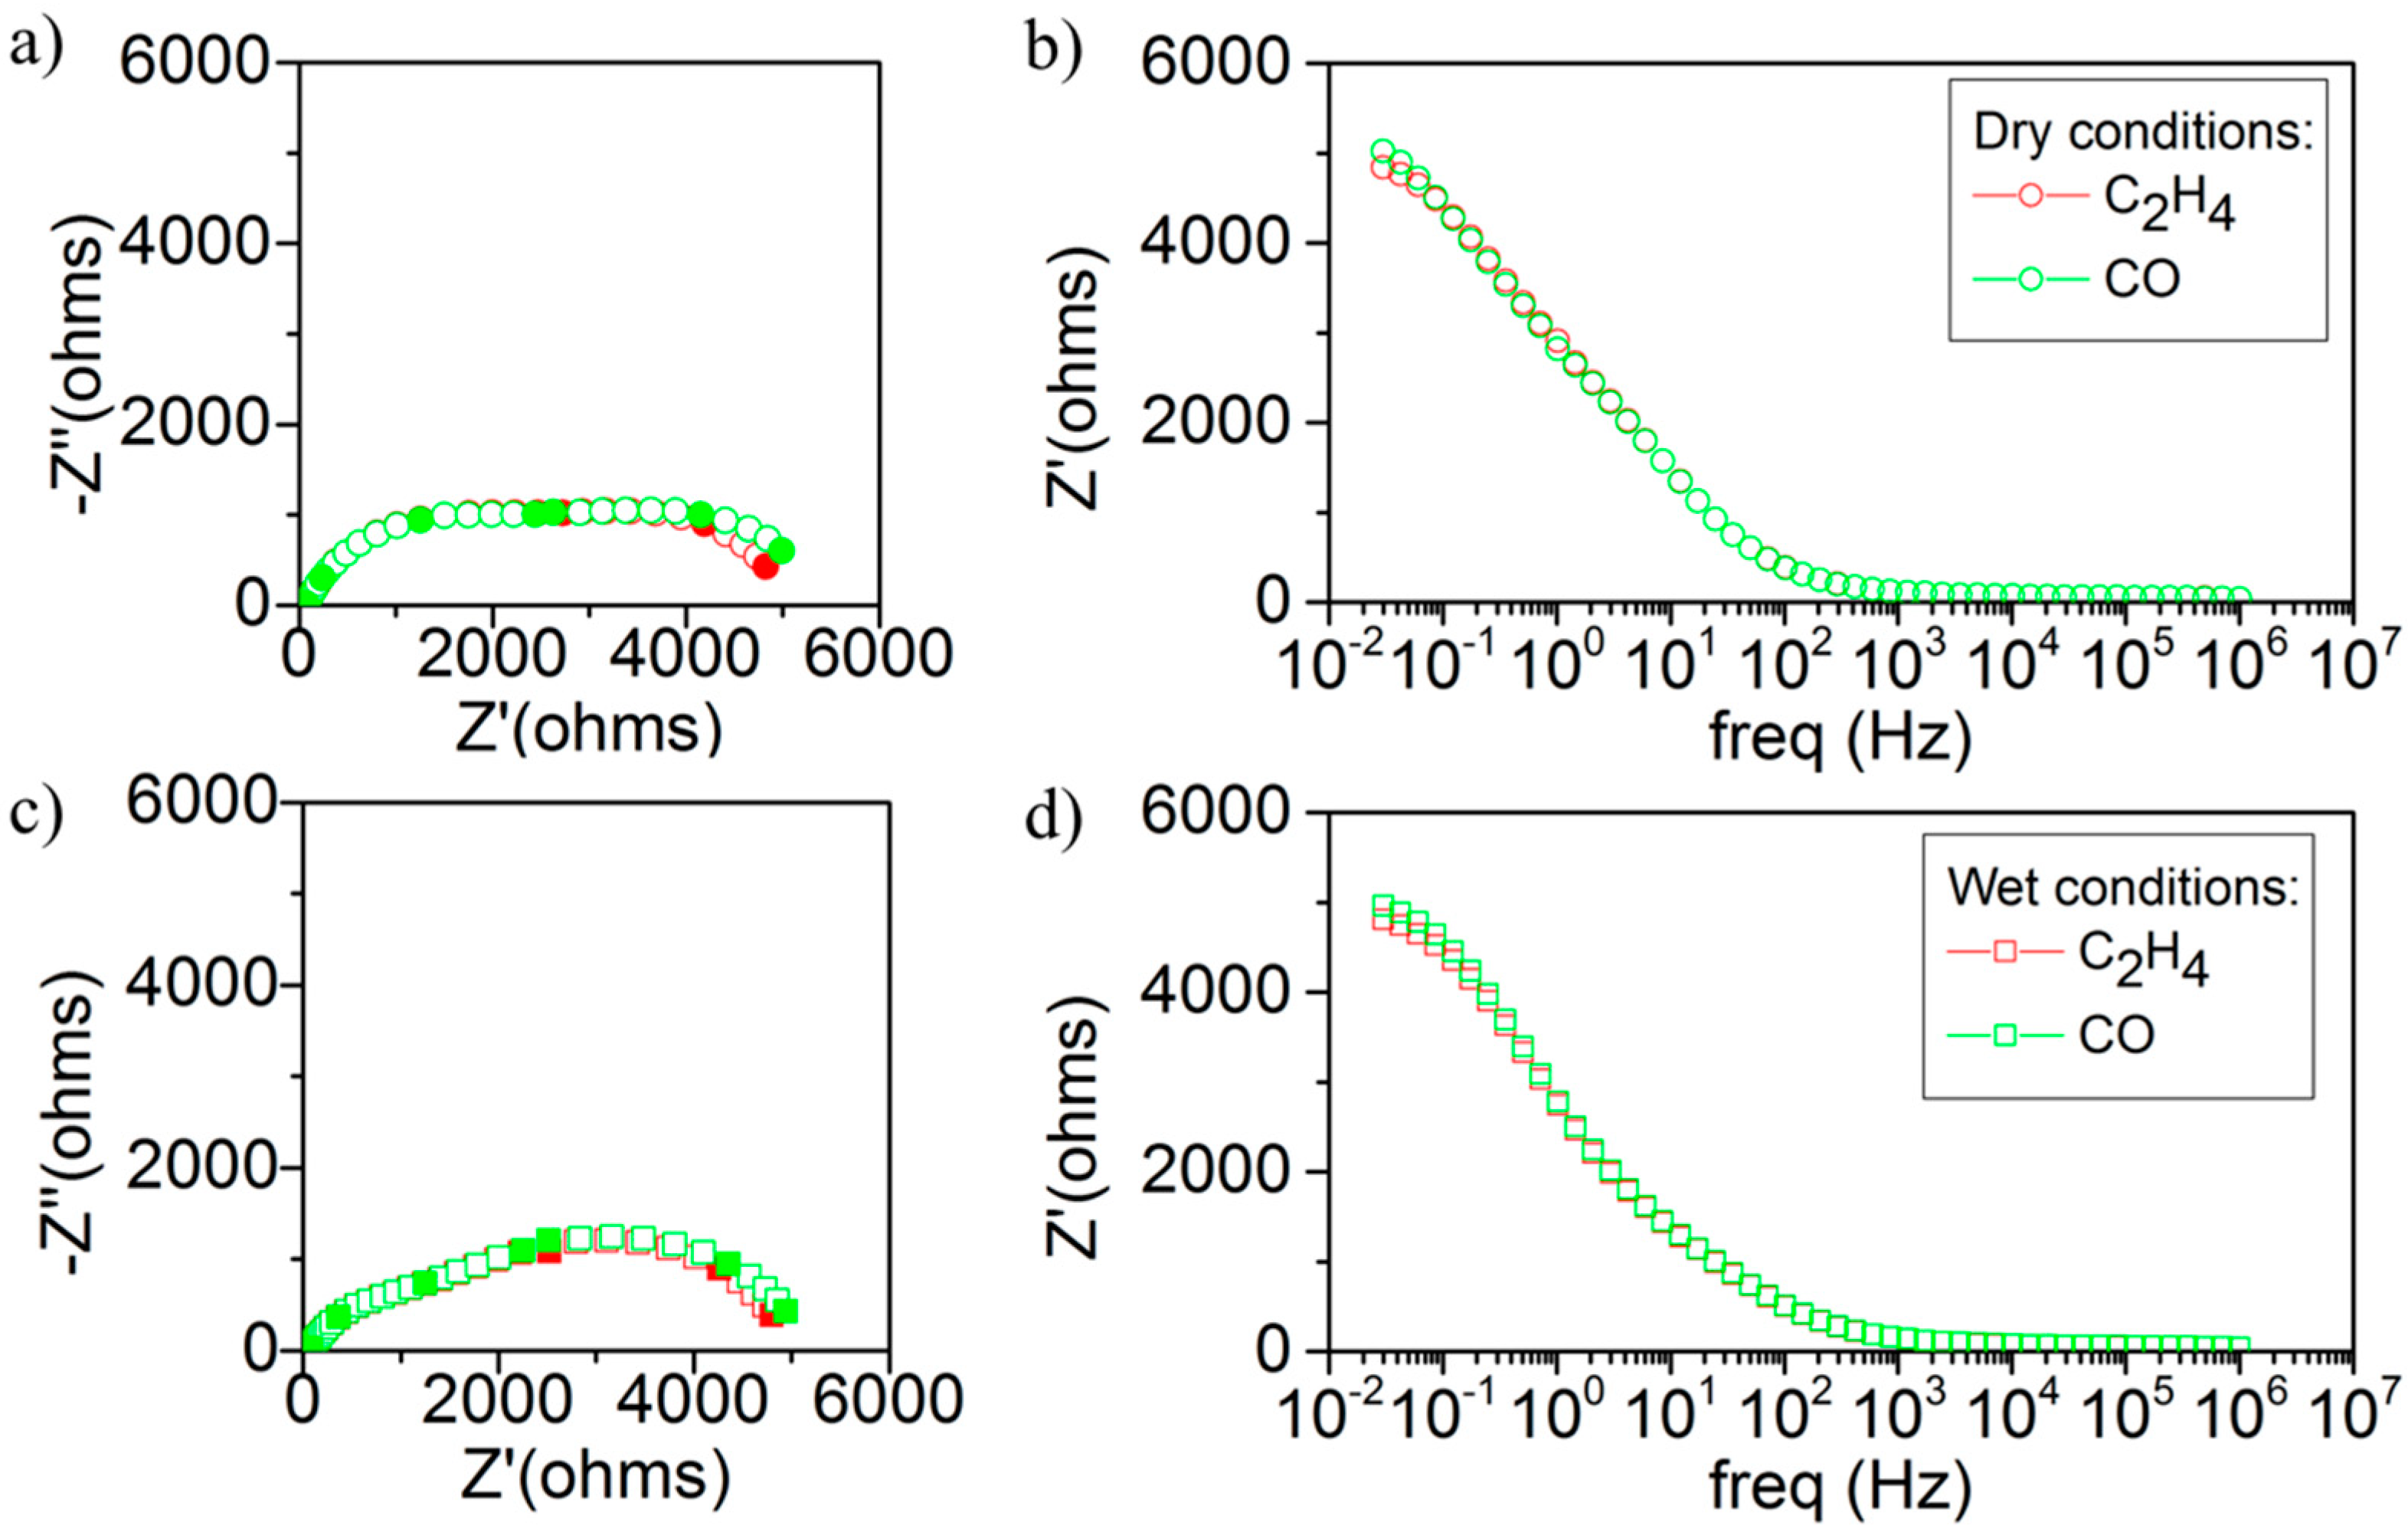
| Analyte (200 ppm) | Rp (ohm) | |
|---|---|---|
| dry | C2H4 | 5112.52 |
| CO | 5548.20 | |
| wet | C2H4 | 5079.02 |
| CO | 5257.03 |
| Compound | Cell Voltage (mV) | Concentration (ppm) | Sensitivity (mV/ppm) |
|---|---|---|---|
| Ar+6%O2 | 0.03 | - | - |
| C7H8 | 119.16 | 28,947.37 | 0.004 |
| C11H10 | −158.75 | 88.16 | −1.80 |
| C14H10 | 0.23 | 0.16 | 1.44 |
| C2H4 | 23.49 | 200 | 0.12 |
| CO | 4.82 | 200 | 0.02 |
© 2018 by the authors. Licensee MDPI, Basel, Switzerland. This article is an open access article distributed under the terms and conditions of the Creative Commons Attribution (CC BY) license (http://creativecommons.org/licenses/by/4.0/).
Share and Cite
Toldra-Reig, F.; Serra, J.M. Development of Potentiometric Sensors for C2H4 Detection. Sensors 2018, 18, 2992. https://doi.org/10.3390/s18092992
Toldra-Reig F, Serra JM. Development of Potentiometric Sensors for C2H4 Detection. Sensors. 2018; 18(9):2992. https://doi.org/10.3390/s18092992
Chicago/Turabian StyleToldra-Reig, Fidel, and Jose M. Serra. 2018. "Development of Potentiometric Sensors for C2H4 Detection" Sensors 18, no. 9: 2992. https://doi.org/10.3390/s18092992
APA StyleToldra-Reig, F., & Serra, J. M. (2018). Development of Potentiometric Sensors for C2H4 Detection. Sensors, 18(9), 2992. https://doi.org/10.3390/s18092992