Article

Sensitive Hg2+ Sensing via Quenching the Fluorescence of the Complex between Polythymine and 5,10,15,20-tetrakis(N-methyl-4-pyridyl) Porphyrin (TMPyP)

College of Chemistry and Chemical Engineering, Central South University, Changsha 410083, China
*
Author to whom correspondence should be addressed.
Sensors 2018, 18(11), 3998; https://doi.org/10.3390/s18113998
Submission received: 26 October 2018 / Revised: 8 November 2018 / Accepted: 14 November 2018 / Published: 16 November 2018
(This article belongs to the Section Biosensors)

Abstract

:
The interaction between polythymine (dTn) and 5,10,15,20-tetrakis(N-methyl-4-pyridyl) porphyrin (TMPyP) was systematically studied using various techniques. dTn remarkably enhanced the fluorescence intensity of TMPyP as compared to other oligonucleotides. The enhanced fluorescence intensity and the shift of the emission peaks were ascribed to the formation of a π-π complex between TMPyP and dTn. And the quenching of the dTn-enhanced fluorescence by Hg2+ through a synergistic effect occurs due to the heavy atom effect. The binding of Hg2+ to TMPyP plays an important role in the Hg-TMPyP-dT30 ternary complex formation. A TMPyP-dT30-based Hg2+ sensor was developed with a dynamic range of Hg2+ from 5 nM to 100 nM. The detection limit of 1.3 nM was low enough for Hg2+ determination. The sensor also exhibited good selectivity against other metal ions. Experiments for tap water and river water demonstrated that the detection method was applicable for Hg2+ determination in real samples. The Hg2+ sensor based on oligonucleotide dT30-enhanced TMPyP fluorescence was fast and low-cost, presenting a promising platform for practical Hg2+ determination.

1. Introduction

As one of the most important conjugated organic molecules, porphyrins play a crucial role in the metabolism of living organisms [1]. For example, porphyrins are responsible for the production of singlet oxygen, which could damage DNA in tumor cells [2]. The interaction between porphyrins or their derivatives and nucleic acids has been extensively investigated [3,4,5], in which three binding types including intercalation, external or groove binding, and outside stacking were involved [6].
5,10,15,20-tetrakis(N-methyl-4-pyridyl)porphyrin (TMPyP) is a water-soluble cationic porphyrin, which contains a porphyrin core and N-methylpyridinium side chains [7]. Due to their planarity and hydrophobicity, the porphyrin rings can intercalate into the base pairs of DNA and in the same time, the positively charged side chains can electrostatically interact with the negatively charged nucleic acids [8]. For example, evidenced by nuclear magnetic resonance spectroscopy, TMPyP can intercalate into GC-rich regions of duplex DNA [9,10]. However, the binding of TMPyP to the major groove of the AT-rich regions has also been proposed [11]. TMPyP has been reported to interact with triplex DNA, in which the third strand could inhibit the assembly of TMPyP with duplex DNA [12]. TMPyP can also bind to the G-quadruplex structure through external stacking rather than intercalation between the G-tetrads [13,14,15]. As probably the most flexible form, the single stranded DNA enables unrivaled access to individual bases [6], which facilitates the interaction with TMPyP.
Mercuric ion (Hg2+) possesses serious immunotoxic, genotoxic, and neurotoxic effects, causing damage to the central nervous system, endocrine system and other organs such as the kidney, liver, heart, and lung [16]. Hg2+ usually serves as a fluorescent quencher through enhancement of spin-orbit coupling [17]. A colorimetric method for Hg2+ determination through platinum nanoparticles with limit of detection 8.5 pM and a linear range from 0.01 to 4 nM has been reported by Aragay et al. [18]. MoS2 nanosheet/DNA/carbon dot-based fluorescence method has been reported to detect Hg2+ [19]. However, most of the methods were based on synthesized nanometer materials such as nanoparticle, quantum dots, nanosheet, which were hard to be modified. Herein, the interaction between TMPyP and polyadenine (dAn), polycytosine (dCn), polyguanine (dGn) and polythymine (dTn) were investigated. dTn was found to substantially enhance the fluorescence intensity of TMPyP due to the formation of a TMPyP-dTn complex. The incorporation of Hg2+ significantly quenched the fluorescence of the complex and a fluorescent sensor for Hg2+ was developed. The sensing strategy is shown in Figure 1.

2. Materials and Methods

2.1. Reagents and Chemicals

5,10,15,20-tetrakis(N-methyl-4-pyridyl)porphyrin (TMPyP) was purchased from Sigma-Aldrich (St. Louis, MO, USA). The oligonucleotides (ODNs), such as polyadenine dA13, polycytosine dC13, polyguanine dG6TG6 and polythymine dT5, dT10, dT13, dT15, dT20, dT30, dT40, dT50 were synthesized by Sangon Biotechnology Co., Ltd. (Shanghai, China). Hg(NO3)2, Cd(NO3)2·4H2O, Cr(NO3)3·9H2O, Cu(NO3)2·3H2O, Fe(NO3)3·9H2O, FeSO4·7H2O, Mn(CH3COO)2·4H2O, MgCl2·6H2O, NiCl2·6H2O, Pb(NO3)2, ZnCl2, Tris-HCl, CH3COOH, NaCl and NaOH were acquired from Sinopharm Chemical Reagent Co., Ltd. (Shanghai, China). All the ODNs were prepared with Tris-HCl buffer (10 mM Tris, 100 mM NaCl, pH 7.4). All reagents were of analytical grade and used as received. Ultrapure water was obtained from a Millipore water purification system (≥18 MΩ, Milli-Q, Millipore).

2.2. Apparatus

UV-vis spectra and circular dichroism (CD) spectra were recorded on a UV-2450 spectrophotometer (Shimadzu, Japan) and a Jasco-815 spectropolarimeter (Jasco, Japan), respectively. Fluorescence spectra were collected on a Hitachi F-4600 spectrofluorometer (Hitachi, Japan). Fluorescence lifetime was measured on a compact FluoTime 100 fluorescence lifetime spectrometer (PicoQuant GmbH, Germany).

2.3. Procedure

The TMPyP-ODN complex was formed by mixing 1 μM TMPyP and 2 μM ODN, followed by dilution to 200 μL with Tris-HCl buffer and stirring for 50 min. For the Hg2+ assay, Hg2+ with various concentrations was added into the solution of TMPyP-dT30 complex under stirring for 1 min. For the fluorescence, measurement with excitation was 422 nm and emission was at 660 nm. The fluorescence lifetimes were determined from the data obtained from a compact FluoTime 100 fluorescence lifetime spectrometer. The data could be analyzed by exponential fits. The solution of Hg2+, TMPyP and dT30 were mixed by 1 μM Hg2+ and 1 μM TMPyP for Hg-TMPyP; 1 μM TMPyP and 2 μM dT30 for TMPyP-dT30; 1 μM Hg2+, 1 μM TMPyP and 2 μM dT30 for Hg-TMPyP-dT30. The solutions were followed by dilution to 200 μL with Tris-HCl buffer and stirring for 120 min. All the lifetime measurements were with an excitation at 422 nm.

3. Results and Discussion

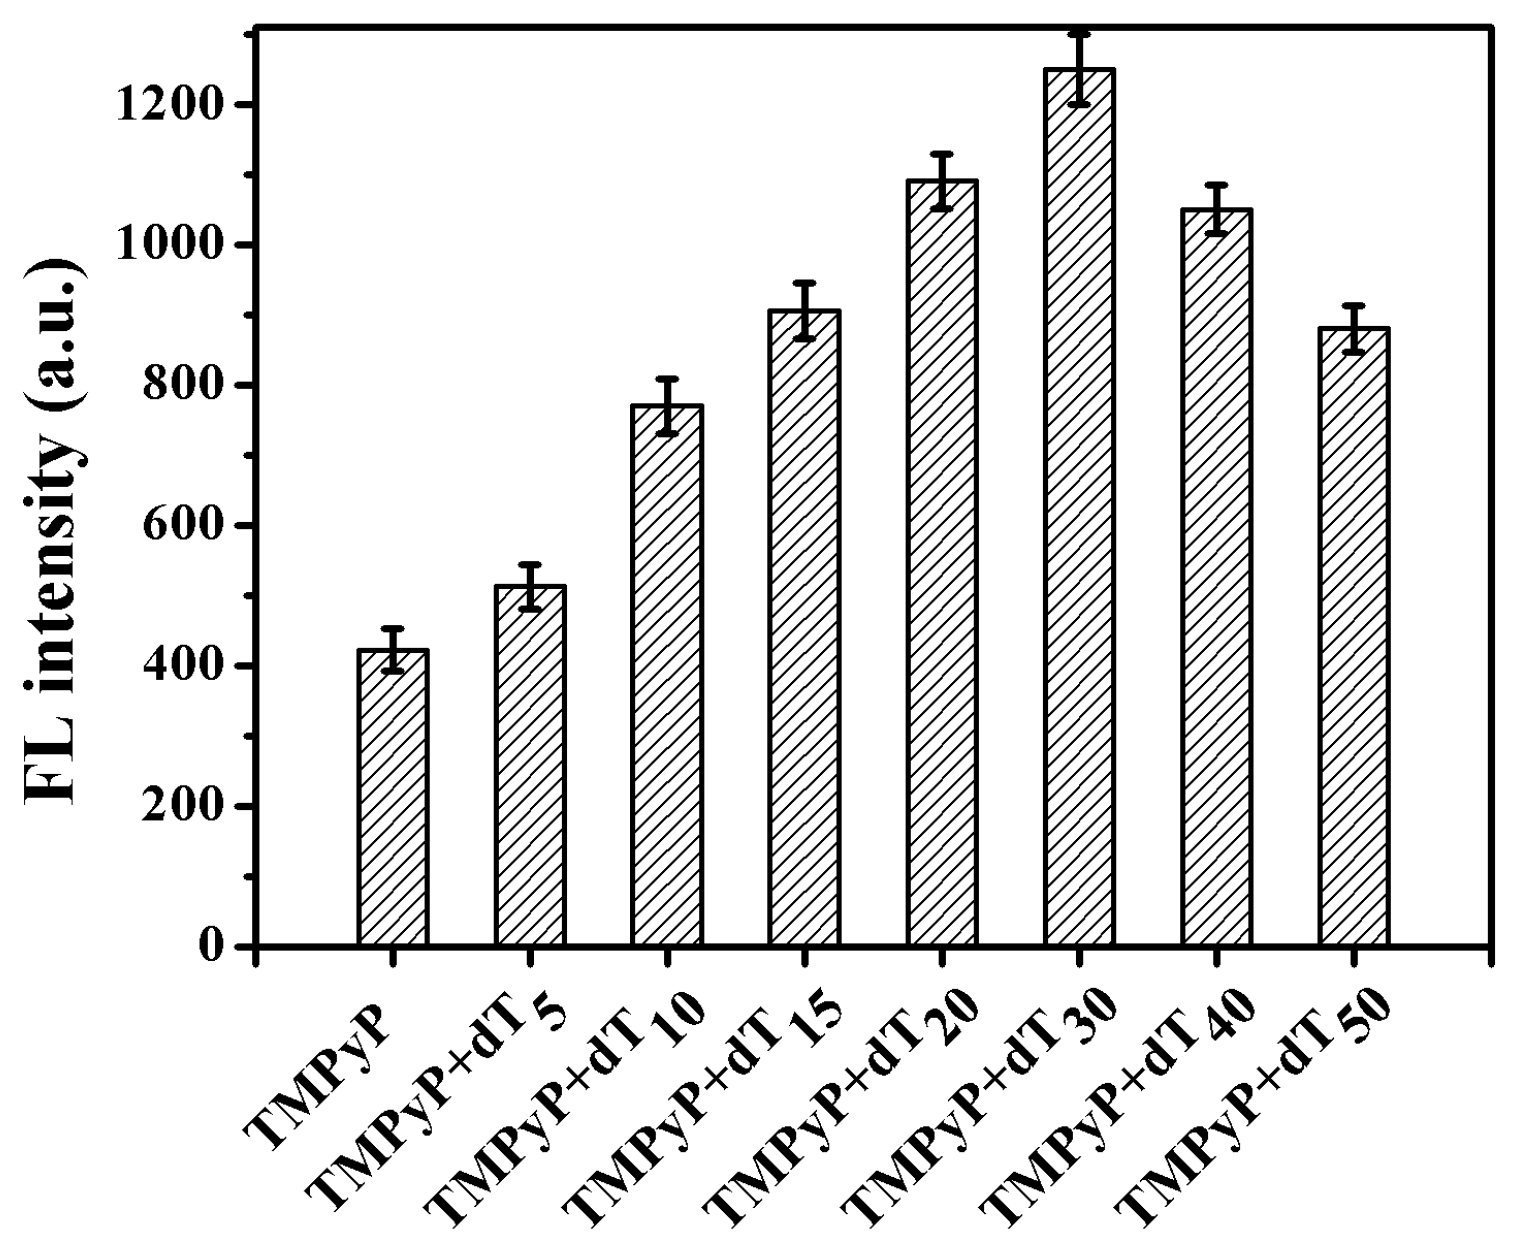
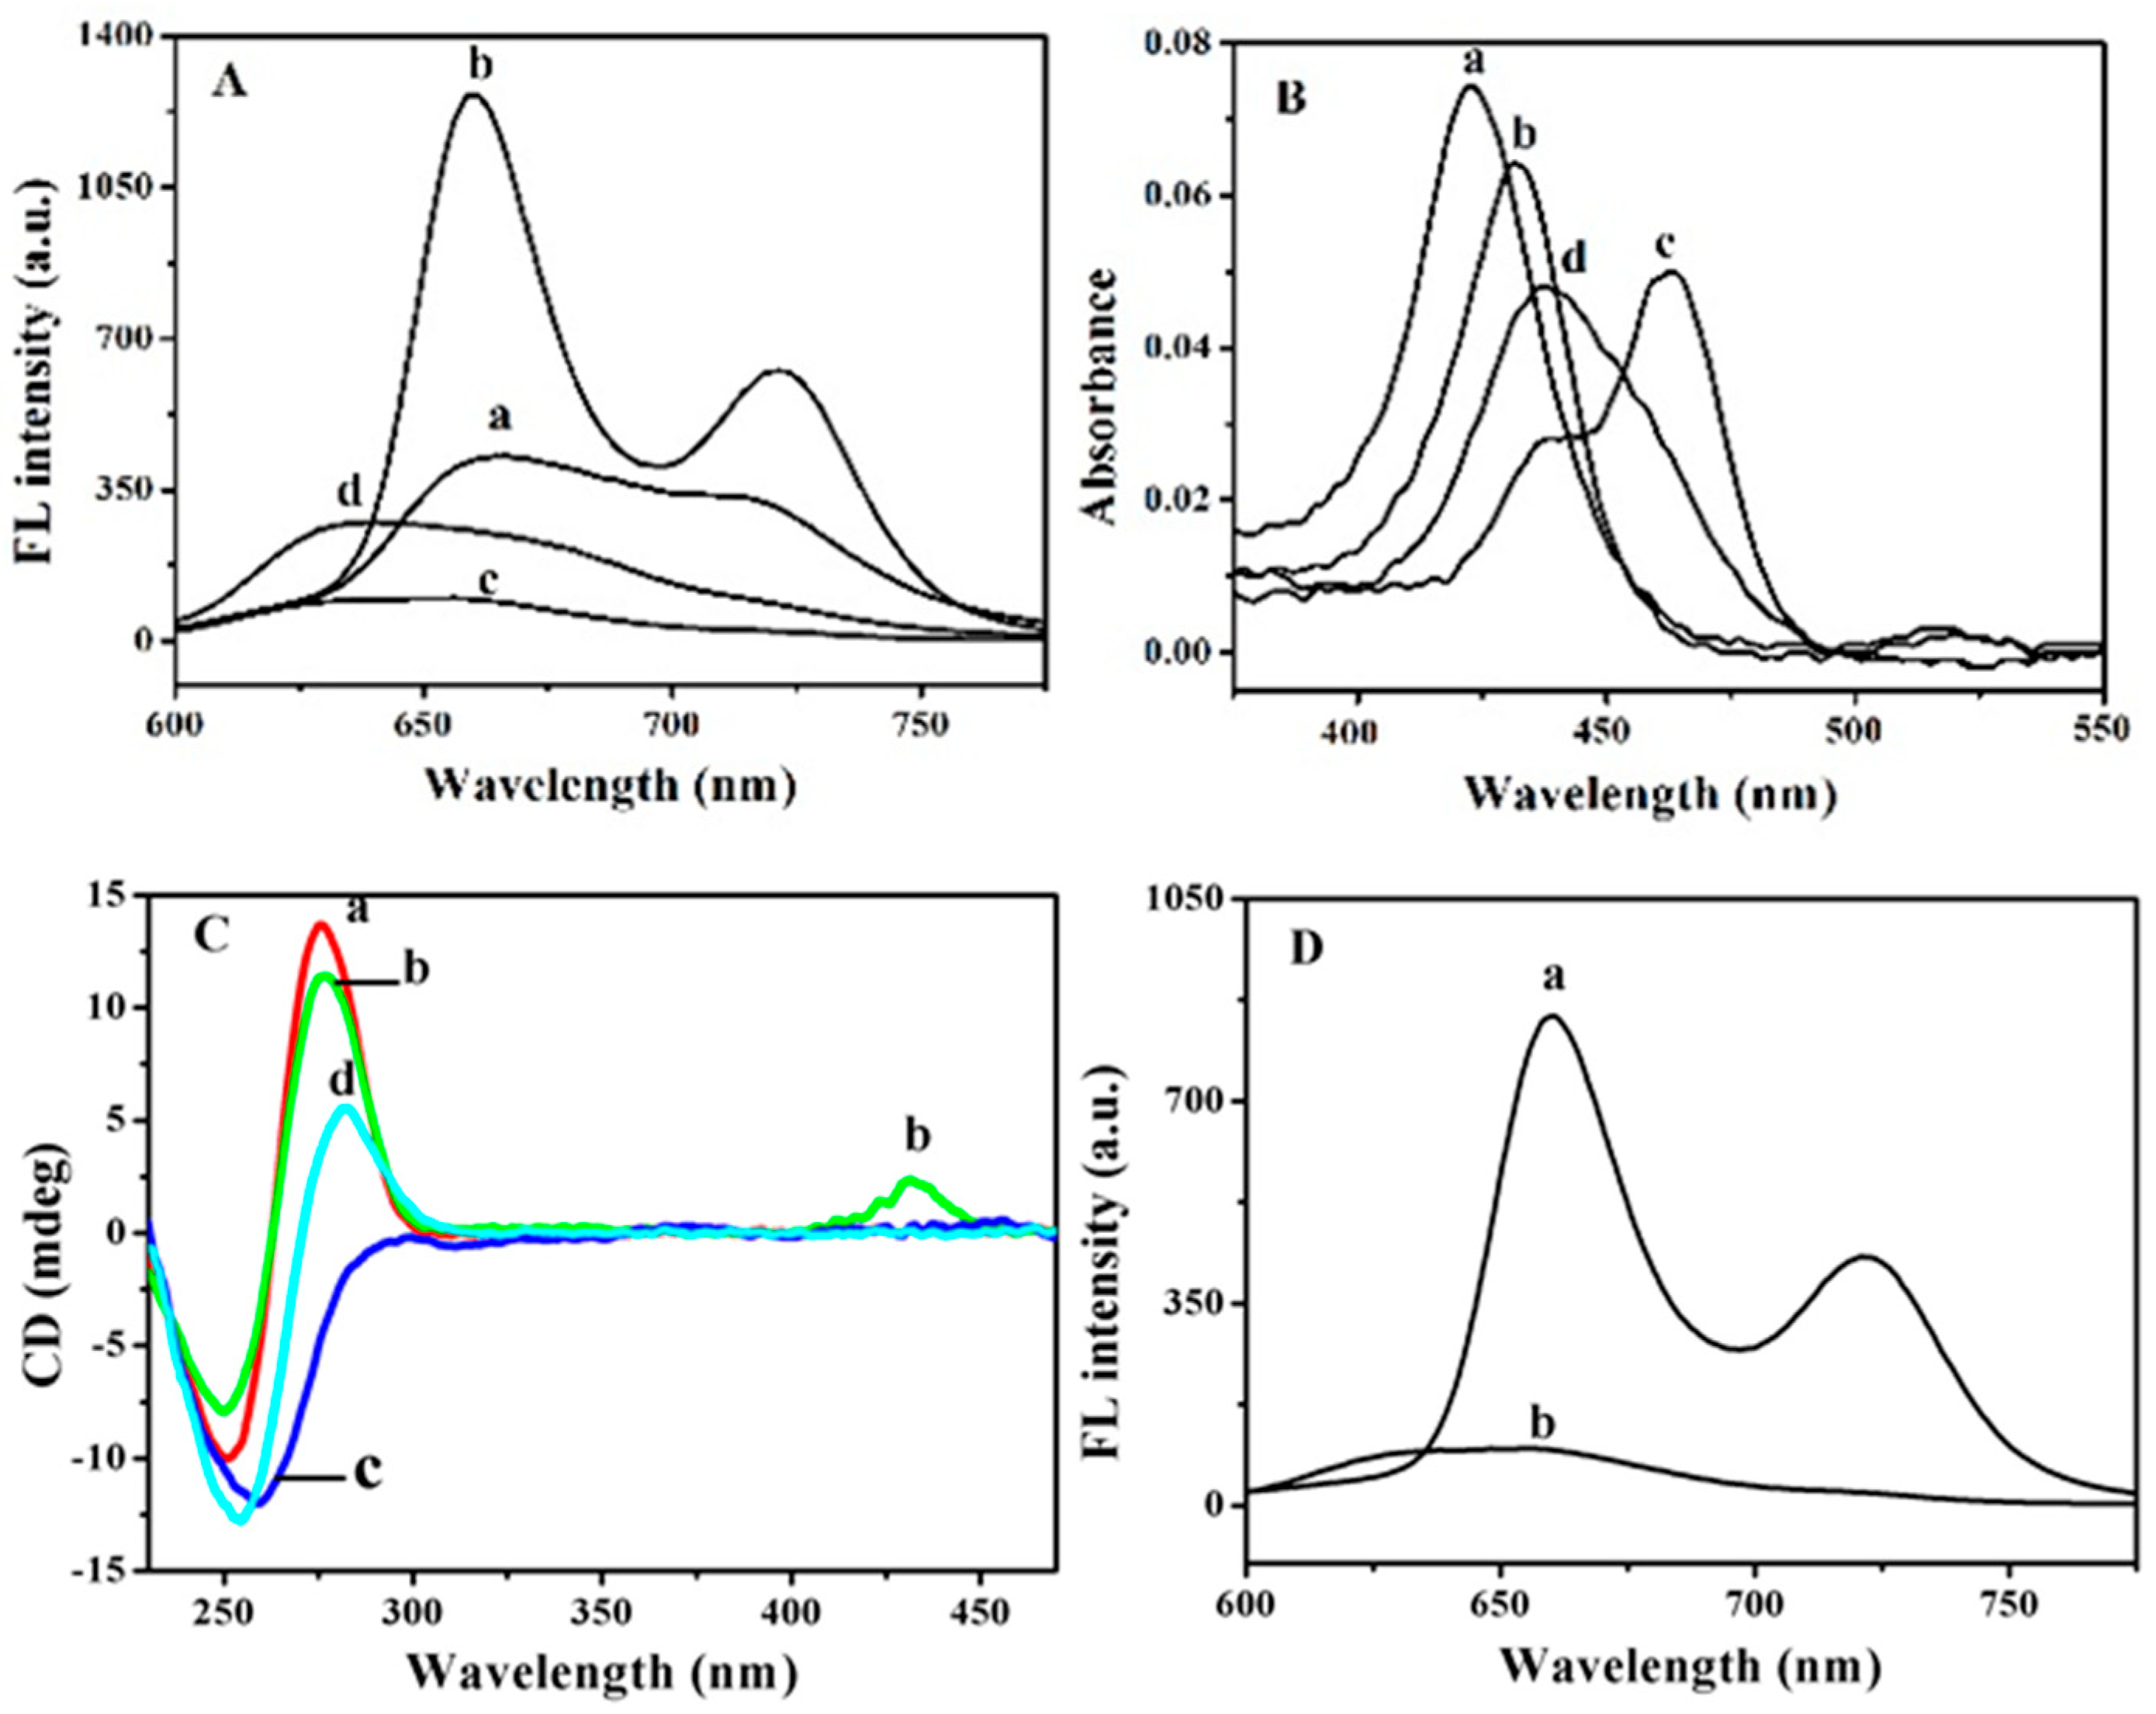
3.1. Interaction between ODNs and TMPyP

The interaction between TMPyP and ODNs was characterized by fluorescence and UV-vis absorption spectroscopy. As shown in Figure 2A, upon excitation at 422 nm, TMPyP exhibited two broad peaks at around 665 nm and 715 nm (curve a). With the addition of dG6TG6, the fluorescence of TMPyP decreased due to the electron transfer from guanine to TMPyP (curve b) [20]. However, the incorporation of dA13 (curve c), dC13 (curve d) and dT13 (curve e) increased the fluorescence of TMPyP, and the emission wavelengths were shifted to 660 nm and 720 nm. The enhanced fluorescence intensity and the shift of the emission peaks were ascribed to the formation of a π-π complex between TMPyP and ODNs [20]. The above results were consistent with those in the cases of mononucleotides. Mononucleotides interacted differently with TMPyP, in which adenine, thymine, and cytosine increased the fluorescence intensity of TMPyP, while guanine substantially quenched the fluorescence intensity of TMPyP [20]. The higher fluorescence of TMPyP by dT13 than that by dA13 or dC13 indicated that TMPyP binded to dT13 with stronger affinity [21].
TMPyP displayed a characteristic absorption peak at 422 nm known as the Soret band (curve a in Figure 2B), which originated from the S0S2 transition [22]. The incorporation of dG6TG6 (curve b), dA13 (curve c), dC13 (curve d) and dT13 (curve e) decreased the absorption of TMPyP, and the absorbance peak of TMPyP was red-shifted to 426 nm and 431 nm in the case of dC13 (curve d) and dT13 (curve e), respectively. The larger bathochromic shift in curve e suggested the higher binding affinity between TMPyP and dT13.
The length of polythymine also influenced the fluorescence enhancement of TMPyP (Figure 3). The incorporation of different lengths of polythymine resulted in increased fluorescence and began to level off with the length of dT30. Thus, the length of dT30 might have been more favorable for π-π stacking between TMPyP and polythymine.

3.2. Fluorescence Quenching of TMPyP-dT30 Complex by Hg2+

In comparison with the fluorescence of TMPyP at 665 nm and 715 nm (curve a in Figure 4A), the fluorescence of the TMPyP-dT30 complex at 660 nm and 720 nm (curve b in Figure 4A) was significantly enhanced. With the addition of Hg2+, the fluorescence of the TMPyP-dT30 complex at 660 nm was greatly quenched and in the same time, a tiny and broad emission peak at 635 nm was attained (curve c). The emission peak at 635 nm was ascribed to that of Hg-TMPyP, as evidenced by the emission of Hg-TMPyP in curve d. Porphyrins have been reported to bind to Hg2+ with the formation of metalloporphyrin [23], and the fluorescence of porphyrins could be quenched by Hg2+ due to the heavy atom effect [24]. Based on the results above, a new ternary complex of Hg-TMPyP-dT30 might have formed [25], providing the possibility for a Hg2+ assay.
To further demonstrate the formation of the ternary complex, UV-vis absorption spectra were investigated (Figure 4B). With the addition of dT30, the Soret band of TMPyP at 422 nm (curve a) was red-shifted to 431 nm (curve b). The electrostatic interaction and π-π stacking facilitated the formation of the TMPyP-dT30 complex [20]. The formation of the ternary complex of Hg-TMPyP-dT30 led to a larger bathochromic shift of the Soret band to 462 nm, and in the same time, a new and small peak appeared at 437 nm (curve c). The new peak originated from the absorption of Hg-TMPyP (curve d) [26].
The conformational change of dT30 induced by TMPyP was studied by CD measurements (Figure 4C). The dT30 exhibited a negative peak at 250 nm and a positive peak at 275 nm (curve a). Upon adding TMPyP to the solution of dT30, both peaks decreased slightly and in the same time, a new positive peak at 430 nm appeared (curve b), which indicated the binding of TMPyP to dT30 through π-π stacking [27,28]. Note that TMPyP did not show any detectable CD signal. With the incorporation of Hg2+ to the TMPyP-dT30 complex, the 275 nm-peak disappeared and the negative peak at 250 nm shifted to 260 nm (curve c). Furthermore, the 430 nm-peak disappeared. The results above suggested that the binding of TMPyP to dT30 was interrupted by Hg2+. Such an interruption might have been ascribed to the alteration of the planarity of the TMPyP core induced by Hg2+ [5]. When adding Hg2+ to dT30 solution, the formation of the T–Hg–T complex was characterized by the negative peak at 255 nm and the positive peak at 280 nm (curve d). No positive peak at 280 nm in curve c was shown compared to the T–Hg–T complex, which indicated the different structure of dT30 in T–Hg–T and the Hg-TMPyP-dT30 complex.
The fluorescence lifetime measurement provided deep insight into the ternary complex formation. The lifetime of TMPyP determined from the decay curve was 4.6 ns, consistent with that reported previously [26]. The lifetime was increased to 10.2 ns upon formation of TMPyP-dT30. However, the ternary complex of Hg-TMPyP-dT30 possessed a much shorter lifetime of 2.0 ns. Upon adding Hg2+ to the solution of TMPyP, a lifetime of 1.2 ns was observed, indicating the binding of Hg2+ to TMPyP [26].
As reported previously, the binding of TMPyP to dT30 possessed high binding affinity (binding constant of 107 M−1), while the coordination of Hg2+ to dT30 was a slow dynamic process at low concentrations of Hg2+ [29]. The binding of Hg2+ to TMPyP plays an important role in the Hg-TMPyP-dT30 ternary complex formation. Upon addition of Hg2+ to the solution of TMPyP-dC30, the ternary complex of Hg-TMPyP-dC30 was also formed, as evidenced by the quenching of the fluorescence of TMPyP-dC30 by Hg2+ (Figure 4D). Considering the relatively lower affinity between Hg2+ and dC30 than that between Hg2+ and TMPyP [26,30], the coordination of Hg2+ to TMPyP was essential for the formation of the Hg-TMPyP-dC30 complex. The quenching of the fluorescence of TMPyP-dT30 by Hg2+ provided the possibility for a Hg2+ assay.

3.3. Calibration Curve of The Hg2+ Assay

The fluorescence intensity of TMPyP-dT30 at 660 nm gradually decreased with an increased Hg2+ concentration (Figure 5A). The dependence of (F0 − F)/F0 on the concentration of Hg2+ was shown in Figure 5B, where F0 and F represented the fluorescence intensities in the absence and presence of Hg2+, respectively. The inset of Figure 5B depicted the linear portion of the curve with Hg2+ concentrations ranging from 5 nM to 100 nM and the linear regression equation was presented as (F0 − F)/F0 = 3.22 [Hg2+] (μM) + 0.05 (R2 = 0.9605). The detection limit was estimated to be 1.3 nM, being much lower than those by the 8-amino BODIPY-based fluorescence assay (49 nM) [31], Raman spectroscopic method (10 nM) [32], colorimetric assay employing plasmonic gold nanoparticles (50 nM [33] and 17.3 nM [34]), colorimetric assay based on Cu2-xSe nanoparticles (2.7nM) [35] and the fluorescence polarization assay based on CdTe/CdS quantum dots (8.6 nM) [36]. Such a concentration level was also comparable with those by fluorescent assay based on phosphorothioate RNA modifications (1.7 nM) [37]. The comparison of the proposed sensor with other methods is shown in Table 1. Because the maximum permissible level of Hg2+ in drinking water and food, set by the U.S. Environmental Protection Agency and World Health Organization, is at 2 ppb (10 nM) [38], the sensing protocol serves as a viable alternative for a practical Hg2+ assay.

3.4. Selectivity of the Assay

The selectivity of the method was evaluated by the addition of various metal ions of 4.0 µM (Figure 6). Hg2+ quenched about 90% of the fluorescence intensity of the TMPyP-dT30 complex at 660 nm. However, other metal ions, such as Cu2+, Fe3+, Fe2+, Cd2+, Cr3+, Mg2+, Mn2+ and Ni2+ exerted negligible influence on the fluorescence intensity of TMPyP-dT30. Pb2+ caused 30% quenching of the fluorescence intensity due to the formation of the unstable Pb2+-TMPyP-dT30 [39]. The proposed fluorescence method possessed good selectivity toward Hg2+ determination.

3.5. Practical Samples for the Hg2+ Assay

The practical application of this method for Hg2+ determination was evaluated by the standard addition method through adding different concentration of Hg2+ in tap water and river water. As shown in Table 2, the recoveries were between 96–105%. The recovery suggested that the method was largely free from the matrix effect of the complex real water samples and could be served for Hg2+ determination in tap water and river water.

4. Conclusions

The fluorescence quenching capability of Hg2+ on the TMPyP-dT30 has been proposed, enabling a sensitive and selective Hg2+ assay. The formation of the Hg-TMPyP-dT30 ternary complex was characterized by various techniques. The mechanism inherent in the fluorescence quenching of TMPyP-dT30 by Hg2+ involved a synergistic effect. The detection limit of the proposed method was obtained as 1.3 nM. Experiments for tap water and river water demonstrated that the detection method was applicable for Hg2+ determination in real samples. The Hg2+ sensor based on oligonucleotide dT30-enhanced TMPyP fluorescence was fast and low-cost, presenting a promising platform for practical Hg2+ determination. In addition, this is the first time dT30 enhanced TMPyP fluorescence intensity was used for Hg2+ determination. The sensing protocol may provide useful information on the interaction among porphyrins, DNA and heavy metal ions.

Author Contributions

Conceptualization, D.W.; methodology, S.H.; investigation, D.W., Y.H. and S.H.; data curation, D.W. and Y.H.; writing—original draft preparation, D.W.; writing—review and editing, X.Y. and J.W.; supervision, X.Y. and J.W.; project administration, X.Y. and J.W.; funding acquisition, J.W.

Funding

The authors thank the National Natural Science Foundation of China (Nos. 21705166 and 21575166) for the financial support of this work.

Conflicts of Interest

The authors declare no conflicts of interest.

References

  1. Biesaga, M.; Pyrzynska, K.; Trojanowicz, M. Porphyrins in analytical chemistry. A review. Talanta 2000, 51, 209–224. [Google Scholar] [CrossRef]
  2. Zhang, L.; Lei, J.; Ma, F.; Ling, P.; Liu, J.; Ju, H. A porphyrin photosensitized metal-organic framework for cancer cell apoptosis and caspase responsive theranostics. Chem. Commun. 2015, 51, 10831–10834. [Google Scholar] [CrossRef] [PubMed]
  3. Pasternack, R.F.; Gibbs, E.J.; Villafranca, J.J. Interactions of porphyrins with nucleic acids. Biochemistry 1983, 22, 5409–5417. [Google Scholar] [CrossRef] [PubMed]
  4. Pasternack, R.F.; Gibbs, E.J.; Gaudemer, A.; Antebi, A.; Bassner, S.; De Poy, L.; Turner, D.H.; Williams, A.; Laplace, F.; Lansard, M.H.; et al. Molecular complexes of nucleosides and nucleotides with a monomeric cationic porphyrin and some of its metal derivatives. J. Am. Chem. Soc. 1985, 107, 8179–8186. [Google Scholar] [CrossRef] [PubMed]
  5. Kuroda, R.; Tanaka, H. DNA-porphyrin interactions probed by induced CD spectroscopy. J. Chem. Soc. Chem. Commun. 1994, 13, 1575–1576. [Google Scholar] [CrossRef]
  6. Gaier, A.J.; Ghimire, S.; Fix, S.E.; McMillin, D.R. Internal versus external binding of cationic porphyrins to single-stranded DNA. Inorg. Chem. 2014, 53, 5467–5473. [Google Scholar] [CrossRef] [PubMed]
  7. Kano, K.; Fukuda, K.; Wakami, H.; Nishiyabu, R.; Pasternack, R.F. Factors influencing self-aggregation tendencies of cationic porphyrins in aqueous solution. J. Am. Chem. Soc. 2000, 122, 7494–7502. [Google Scholar] [CrossRef]
  8. Kubát, P.; Lang, K.; Anzenbacher, P., Jr.; Jursíková, K.; Král, V.; Ehrenberg, B. Interaction of novel cationic meso-tetraphenylporphyrins in the ground and excited states with DNA and nucleotides. J. Chem. Soc. Perkin. Trans. 2000, 6, 933–941. [Google Scholar] [CrossRef]
  9. Guliaev, A.B.; Leontis, N.B. Cationic 5,10,15,20-tetrakis(N-methylpyridinium-4-yl)porphyrin fully intercalates at 5′-CG-3′ steps of duplex DNA in solution. Biochemistry 1999, 38, 15425–15437. [Google Scholar] [CrossRef] [PubMed]
  10. Novy, J.; Urbanova, M. Vibrational and electronic circular dichroism study of the interactions of cationic porphyrins with (dG-dC)10 and (dA-dT)10. Biopolymers 2007, 85, 349–358. [Google Scholar] [CrossRef] [PubMed]
  11. Ohyama, T.; Mita, H.; Yamamoto, Y. Binding of 5,10,15,20-tetrakis(N-methylpyridinium-4-yl)-21H,23H-porphyrin to an AT-rich region of a duplex DNA. Biophys. Chem. 2005, 113, 53–59. [Google Scholar] [CrossRef] [PubMed]
  12. Lee, Y.; Kim, J.; Cho, T.; Song, R.; Kim, S.K. Binding of meso-Tetrakis(-methylpyridium-4-yl)porphyrin to triplex oligonucleotides: Evidence for the porphyrin stacking in the major groove. J. Am. Chem. Soc. 2003, 125, 8106–8107. [Google Scholar] [CrossRef] [PubMed]
  13. Lubitz, I.; Borovok, N.; Kotlyar, A. Interaction of monomolecular G4-DNA nanowires with TMPyP: Evidence for intercalation. Biochemistry 2007, 46, 12925–12929. [Google Scholar] [CrossRef] [PubMed]
  14. Zhang, L.; Zhu, J.; Ai, J.; Zhou, Z.; Jia, X.; Wang, E. Label-free G-quadruplex-specific fluorescent probe for sensitive detection. Biosens. Bioelectron. 2013, 39, 268–273. [Google Scholar] [CrossRef] [PubMed]
  15. Gaier, A.J.; McMillin, D.R. Binding studies of G-quadruplex DNA and porphyrins: Cu(T4) vs sterically friendly Cu(tD4). Inorg. Chem. 2015, 54, 4504–4511. [Google Scholar] [CrossRef] [PubMed]
  16. Dave, N.; Chan, M.Y.; Huang, P.J.; Smith, B.D.; Liu, J. Regenerable DNA-functionalized hydrogels for ultrasensitive, instrument-free mercury(II) detection and removal in Water. J. Am. Chem. Soc. 2010, 132, 12668–12673. [Google Scholar] [CrossRef] [PubMed]
  17. McClure, D.S. Spin-orbit interaction in aromatic molecules. J. Chem. Phys. 1952, 20, 682–686. [Google Scholar] [CrossRef]
  18. Wu, G.W.; He, S.B.; Peng, H.P.; Deng, H.H.; Liu, A.L.; Lin, X.H.; Xia, X.H.; Chen, W. Citrate-capped platinum nanoparticle as a smart probe for ultrasensitive mercury sensing. Anal. Chem. 2014, 86, 10955–10960. [Google Scholar] [CrossRef] [PubMed]
  19. Srinivasan, K.; Subramanian, K.; Murugan, K.; Dinakaran, K. Sensitive fluorescence detection of mercury(II) in aqueous solution by the fluorescence quenching effect of MoS2 with DNA functionalized carbon dots. Analyst 2016, 141, 6344–6352. [Google Scholar] [CrossRef] [PubMed]
  20. Jasuja, R.; Jameso, D.M.; Nishijo, C.K.; Larsen, R.W. Singlet excited state dynamics of tetrakis(4-N-methylpyridyl)porphine associated with DNA nucleotides. J. Phys. Chem. B 1997, 101, 1444–1450. [Google Scholar] [CrossRef]
  21. Zhu, K.; Hu, X.; Ge, Q.; Sun, Q. Fluorescent recognition of deoxyribonucleic acids by a quantum dot/meso-tetrakis(N-methylpyridinium-4-yl)porphyrin complex based on a photo induced electron-transfer mechanism. Anal. Chim. Acta 2014, 812, 199–205. [Google Scholar] [CrossRef] [PubMed]
  22. Paulo, P.R.; Costa, S.B. Interactions in noncovalent PAMAM/TMPyP systems studied by fluorescence spectroscopy. J. Phys. Chem. B 2005, 109, 13928–13940. [Google Scholar] [CrossRef] [PubMed]
  23. Yang, R.; Li, K.; Wang, K.; Zhao, F.; Li, N.; Liu, F. Porphyrin assembly on β-cyclodextrin for selective sensing and detection of a zinc ion based on the dual emission fluorescence ratio. Anal. Chem. 2003, 75, 612–621. [Google Scholar] [CrossRef] [PubMed]
  24. Schulman, S.G. (Ed.) Molecular Luminescence Spectroscopy. Methods and Applications, Part 1; Wiley: New York, NY, USA, 1988. [Google Scholar]
  25. Choi, J.K.; Sargsyan, G.; Olive, A.M.; Balaz, M. Highly sensitive and selective spectroscopic detection of mercury(II) in water by using pyridylporphyrin-DNA conjugates. Chem. Eur. J. 2013, 19, 2515–2522. [Google Scholar] [CrossRef] [PubMed]
  26. Delmarre, D.; Méallet, R.; Bied-Charreton, C.; Pansu, R.B. Heavy metal ions detection in solution, in Sol-gel and with grafted porphyrin monolayers. J. Photochem. Photobiol. A 1999, 124, 23–28. [Google Scholar] [CrossRef]
  27. Xu, J.; Wu, J.; Zong, C.; Ju, H.; Yan, F. Manganese porphyrin-dsDNA complex: A mimicking enzyme for highly efficient bioanalysis. Anal. Chem. 2013, 85, 3374–3379. [Google Scholar] [CrossRef] [PubMed]
  28. Nový, J.; Urbanová, M.; Volka, K. Vibrational and electronic circular dichroism and absorption spectral study of the DNA-5,10,15,20-tetrakis(1-methylpyridinium-4-yl)porphyrin interaction. J. Mol. Struct. 2005, 748, 17–25. [Google Scholar] [CrossRef]
  29. Guo, L.; Hu, H.; Sun, R.; Chen, G. Highly sensitive fluorescent sensor for mercury ion based on photoinduced charge transfer between fluorophore and π-stacked T–Hg(II)-T base pairs. Talanta 2009, 79, 775–779. [Google Scholar] [CrossRef] [PubMed]
  30. Torigoe, H.; Ono, A.; Kozasa, T. HgII ion specifically binds with T:T mismatched base pair in duplex DNA. Chem. Eur. J. 2010, 16, 13218–13225. [Google Scholar] [CrossRef] [PubMed]
  31. Wang, Y.; Pan, F.; Zhang, Y.; Peng, F.; Huang, Z.; Zhang, W.; Zhao, W. A dual-mode turn-on fluorescent BODIPY-based probe for visualization of mercury ions in living cells. Analyst 2016, 141, 4789–4795. [Google Scholar] [CrossRef] [PubMed]
  32. Chen, L.; Zhao, Y.; Wang, Y.; Zhang, Y.; Liu, Y.; Han, X.X.; Zhao, B.; Yang, J. Mercury species induced frequency-shift of molecular orientational transformation based on SERS. Analyst 2016, 141, 4782–4788. [Google Scholar] [CrossRef] [PubMed]
  33. Chen, G.H.; Chen, W.Y.; Yen, Y.C.; Wang, C.W.; Chang, H.T.; Chen, C.F. Detection of mercury(II) ions using colorimetric gold nanoparticles on paper-based analytical devices. Anal. Chem. 2014, 86, 6843–6849. [Google Scholar] [CrossRef] [PubMed]
  34. Wei, Q.; Nagi, R.; Sadeghi, K.; Steve, F.; Yan, E.; Ki, S.J.; Caire, R.; Tseng, D.; Ozcan, A. Detection and spatial mapping of mercury contamination in water samples using a Smart-Phone. ACS Nano 2014, 8, 1121–1129. [Google Scholar] [CrossRef] [PubMed]
  35. Zhang, H.; Xia, Y. Ratiometry, wavelength, and intensity: Triple signal readout for colorimetric sensing of mercury ions by plasmonic Cu2-xSe nanoparticles. ACS Sens. 2016, 1, 384–391. [Google Scholar] [CrossRef]
  36. Zhang, J.; Tian, J.; He, Y.; Zhao, Y.; Zhao, S. A K+-mediated G-quadruplex formation enhancement fluorescence polarization system based on quantum dots for detection of Hg2+ and biothiols. Chem. Commun. 2014, 50, 2049–2051. [Google Scholar] [CrossRef] [PubMed]
  37. Huang, P.J.; Wang, F.; Liu, J. Cleavable molecular beacon for Hg2+ detection based on phosphorothioate RNA modifications. Anal. Chem. 2015, 87, 6890–6895. [Google Scholar] [CrossRef] [PubMed]
  38. Aragay, G.; Pons, J.; Merkoçi, A. Recent trends in macro-, micro-, and nanomaterial-based tools and strategies for heavy-metal detection. Chem. Rev. 2011, 111, 3433–3458. [Google Scholar] [CrossRef] [PubMed]
  39. Lemon, C.M.; Brothers, P.J.; Boitrel, B. Porphyrin complexes of the period 6 main group and late transition metals. Dalton Trans. 2011, 40, 6591–6609. [Google Scholar] [CrossRef] [PubMed]
Figure 1. Schematic of Hg2+ assay by quenching the fluorescence of TMPyP-dT30.
Sensors 18 03998 g001
Figure 2. (A) Fluorescence and (B) UV-vis absorption spectra of 1.0 μM TMPyP in the (a) absence and (b) presence of 2.0 μM dG6TG6, (c) dA13, (d) dC13 or (e) dT13.
Sensors 18 03998 g002
Figure 3. Dependence of fluorescence intensity on the sequence length of poly T. The fluorescence was excited at 422 nm and measured at 660 nm. The absolute errors deduced from three replicate measurements are shown as the error bars.
Sensors 18 03998 g003
Figure 4. (A) Fluorescence and (B) UV-vis absorption spectra of (a) 1.0 μM TMPyP, (b) 1.0 μM TMPyP + 2.0 μM dT30, (c) 1.0 μM TMPyP + 2.0 μM dT30 + 4.0 μM Hg2+, (d) 1.0 μM TMPyP + 4.0 μM Hg2+. (C) CD spectra of (a) 20 μM dT30, (b) 20 μM dT30 + 100 μM TMPyP, (c) b + 100 μM Hg2+, (d) a + 100 μM Hg2+. (D) Fluorescence spectra of (a) 1.0 μM TMPyP + 2.0 μM dC30, (b) a + 4.0 μM Hg2+. The fluorescence was excited at 422 nm and measured at 660 nm.
Sensors 18 03998 g004
Figure 5. (A) Fluorescence spectra of TMPyP-dT30 in the presence of Hg2+ with various concentrations: 0, 0.025, 0.1, 0.25, 0.5, 1.0, 2.0 and 4.0 μM (from a to h). (B) Calibration curve for Hg2+ assay. F0 and F represent the fluorescence intensities in the absence and presence of Hg2+, respectively. The inset shows the linear portion of the curve with Hg2+ concentrations ranging from 5 nM to 100 nM. The vertical bars designate the standard deviation for the mean of three replicate measurements.
Sensors 18 03998 g005
Figure 6. Selectivity of the fluorescence assay of Hg2+. The fluorescence intensity of TMPyP-dT30 was attained in the absence (Blank) and presence of 4.0 μM of Hg2+, Pb2+, Cu2+, Fe3+, Fe2+, Cd2+, Cr3+, Mg2+, Mn2+ or Ni2+. The vertical bars designate the standard deviation of the mean of three replicate measurements.
Sensors 18 03998 g006
Table 1. A comparison of the proposed sensor with other detection methods.
MethodToolLinear RangeLODTimeReal SampleRef.
colorimetricplatinum nanoparticles0.01–4 nM0.0085 nM10 mintap water[18]
colorimetricgold nanoparticles25–750 nM50 nM40 minpond and river water[33]
colorimetricCu2-xSe nanoparticles0–800 nM2.7 nM10 mintap, pond and river water[35]
colorimetricgold nanoparticles and aptamer10–1000 nM17.3 nM20 mintap, rivers, lakes and ocean water[34]
Raman spectroscopysilver nanoparticles1–1000 μM10 nM30 mindrinking mineral water[32]
fluorescencePhosphorothioate RNA Modifications0–50 nM1.7 nM20 minlake water[37]
fluorescenceMoS2 nanosheet/DNA/
carbon dot
0–10 nM1.02 nM15 mintap and lake water[19]
fluorescencefluorescent 8-amino
BODIPY-based probe
0.5–5 μM49 nM50 minSMMC-7721 cells[31]
fluorescence polarizationCdTe/CdS QDs10–800 nM8.6 nM2.0 hlake and spiked
lake water
[36]
fluorescencepolyT-TMPyP5–100 nM1.3 nM60 sTap and river waterthis work
Table 2. Determination of Hg2+ in water samples with the proposed method.
SampleAdded (nM)Measured (nM) aRecovery (%)
tap water2.02.1 ± 0.17105 ± 0.085
5.04.9 ± 0.3298 ± 0.064
10.09.6 ± 0.6296 ± 0.062
river water2.02.1 ± 0.11105 ± 0.055
5.05.1 ± 0.43102 ± 0.086
10.09.7 ± 0.6597 ± 0.065
a Mean values and standard deviations were obtained from three independent experiments.

