Article

Gold Nanoplates for a Localized Surface Plasmon Resonance-Based Boric Acid Sensor

by
Marlia Morsin
1,2,*,
Muhamad Mat Salleh
3,
Akrajas Ali Umar
3 and
Mohd Zainizan Sahdan
1,2
1
Microelectronics & Nanotechnology-Shamsuddin Research Centre (MiNT-SRC), Institute of Integrated Engineering (I2E), Universiti Tun Hussien Onn Malaysia, Batu Pahat, Johor 86400, Malaysia
2
Department of Electronic Engineering, Faculty of Electronic and Electrical Engineering, Universiti Tun Hussien Onn Malaysia, Batu Pahat, Johor 86400, Malaysia
3
Institute of Microengineering and Nanoelectronics (IMEN), Universiti Kebangsaan Malaysia, Bangi, Selangor 43600, Malaysia
*
Author to whom correspondence should be addressed.
Sensors 2017, 17(5), 947; https://doi.org/10.3390/s17050947
Submission received: 28 February 2017 / Revised: 6 April 2017 / Accepted: 19 April 2017 / Published: 25 April 2017
(This article belongs to the Section Biosensors)

Abstract

:
Localized surface plasmon resonance (LSPR) properties of metallic nanostructures, such as gold, are very sensitive to the dielectric environment of the material, which can simply be adjusted by changing its shape and size through modification of the synthesizing process. Thus, these unique properties are very promising, particularly for the detection of various types of chemicals, for example boric acid which is a non-permitted preservative employed in food preparations. For the sensing material, gold (Au) nanoplates with a variety of shapes, i.e., triangular, hexagonal, truncated pentagon and flat rod, were prepared using a seed-mediated growth method. The yield of Au nanoplates was estimated to be ca. 63% over all areas of the sensing material. The nanoplates produced two absorption bands, i.e., the transverse surface plasmon resonance (t-SPR) and the longitudinal surface plasmon resonance (l-SPR) at 545 nm and 710 nm, respectively. In the sensing study, these two bands were used to examine the response of gold nanoplates to the presence of boric acid in an aqueous environment. In a typical process, when the sample is immersed into an aqueous solution containing boric acid, these two bands may change their intensity and peak centers as a result of the interaction between the boric acid and the gold nanoplates. The changes in the intensities and peak positions of t-SPR and l-SPR linearly correlated with the change in the boric acid concentration in the solution.

Graphical Abstract

1. Introduction

Surface plasmon is a collective oscillation of free electrons at the surface of a metal stimulated by the electric field of light. Typical metals that commonly demonstrate this plasmonic phenomenon are gold [1,2], silver [3,4], platinum [5] and palladium [6,7,8]. Surface plasmon is very sensitive and responsive to changes in the dielectric constant of the surrounding medium [9,10] making it potential for sensing applications [11,12]. Furthermore, surface plasmon is noted to be more unique when it is locally confined in a nanostructure which generates a localized surface plasmon resonance (LSPR) effect [1,3,4,5,6,7,8,9,10,11,12,13,14]. It promises enhanced sensitivity to even small changes in the properties of the surrounding medium, due to its localized nature that spreads over an enhanced field. In addition, LSPR is also strongly influenced by the size and shape of the nanostructure sensing materials [15], improving their sensitivity and selectivity in the sensing applications.
Metal nanostructures, especially gold, have attracted the attention of many researchers because of their unique surface plasmon resonance (SPR) properties, high bio-compatibility, and high-reactivity. They have been widely used in surface-enhanced Raman scattering (SERS) [16,17], photoelectronic devices [18], catalysis [19], and biomedical applications [9,10]. In sensor applications, gold nanosphericals are widely used as sensing materials [20,21,22,23]. The single absorption band that is associated with the transverse SPR (t-SPR) is produced from the sample and is normally used as a key parameter in the detection of analytes, such as gaseous molecules. Since morphology influences the LSPR properties of metal nanostructures, the use of nanostructures with different morphologies, such as nanorods [21,24,25] and nanoplates [26,27,28], is expected could increase the sensitivity as well as expand the selectivity properties of such metal nanostructures.
This paper reports the LSPR sensing properties of gold nanoplates in the presence of boric acid. Au nanoplates were grown on a quartz substrate surface using the seed-mediated growth method [27,28,29]. The implementation of Au nanoplates in an LSPR sensor gave an additional parameter, namely longitudinal SPR (l-SPR), to measure the sensitivity of the sensor other than transverse SPR (t-SPR). Commonly, the gold nanorods are employed as the sensing material to obtain two response peaks of an LSPR sensor [21,26]. Meanwhile, boric acid is a pesticide that is normally used to kill termites, wood decay fungi, plants and insects such as cockroaches [30]. However, boric acid has been misused in food processing as well as used as a preservative and an additive in various foods [31] such as noodles, seafood, dairy and meat products, especially by small-scale producers. Thus, the proposed LSPR sensor demonstrates an alternative approach for high-sensitivity detection of boric acid, compared to the conventional technique [32] that uses time-consuming analytical methods.

2. Materials and Methods

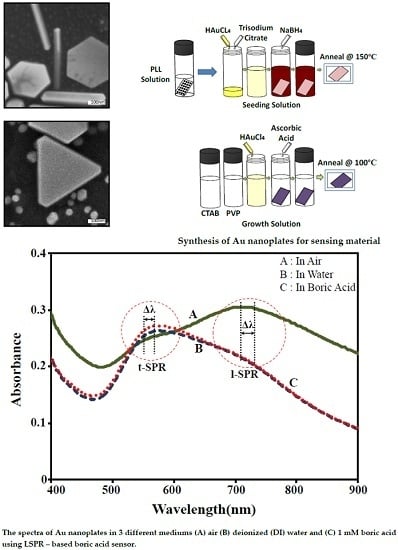
2.1. Preparation of Gold Nanoplates

The sensing material of Au nanoplates was prepared using the seed-mediated growth method, as previously reported [33]. The preparation of Au nanoplates involves two main steps, which are the seeding and growth processes. The seeding process was done to attach the seeds onto the surface of the substrate. The substrate was immersed into a seeding solution consisting of 0.5 mL of 0.01 M HAuCl4 (Sigma Aldrich, St. Louis, MO, USA), 2 mL of 0.01 M trisodium citrate (Wako Pure Chemical Industries, Ltd., Osaka, Japan), 0.5 mL of 0.1 M iced-cold aqueous NaBH4 (Sigma Aldrich, St. Louis, MO, USA), and 18 mL deionized water (DI water) for 2 h at room temperature. This process was followed by 5 h of the growth process. In this process, the growth solution consisting of 0.5 mL of 0.01 M HAuCl4, 10 mL of 1 mM PVP (Sigma Aldrich, St. Louis, MO, USA), 8 mL of 0.1 M CTAB (Sigma Aldrich, St. Louis, MO, USA), 0.1 mL of 0.1 M ascorbic acid (Wako Pure Chemical Industries, Ltd., Osaka, Japan) and 2 mL DI water was prepared to immerse the substrate with the nanoseeds. The anneal processes were completed after each seeding and growth process.

2.2. Optical Sensor System Setup

The prepared Au nanoplates were used as a sensing material to detect the presence of boric acid in the solution. A sensor setup was developed to evaluate the sensing properties of the Au nanoplates for the boric acid [33,34]. The setup consisted of a sensor chamber with two inlets and a drawer, a light source (LS-1 tungsten halogen lamp), a duplex fiber optical probe system, a USB-2000 Ocean Optics spectrometer (Ocean Optics, Dunedin, FL, USA) and a computer with OOIBase32 software (Ocean Optics, Dunedin, Florida, USA) as the spectrum analyzer tool. The Au nanoplates sample was placed on the drawer inside the sensor chamber. The light source beam was transmitted using one of the fiber arms directed towards Au nanoplates sample, and was subsequently reflected back. The reflected light was collected by the other fiber arm and transmitted to the spectrometer. The sensing sensitivity was based on the change in the optical absorbance of the Au nanoplates upon the presence of boric acid (purchased from R&M Chemicals, Selangor, Malaysia) in the solution.

3. Results and Discussion

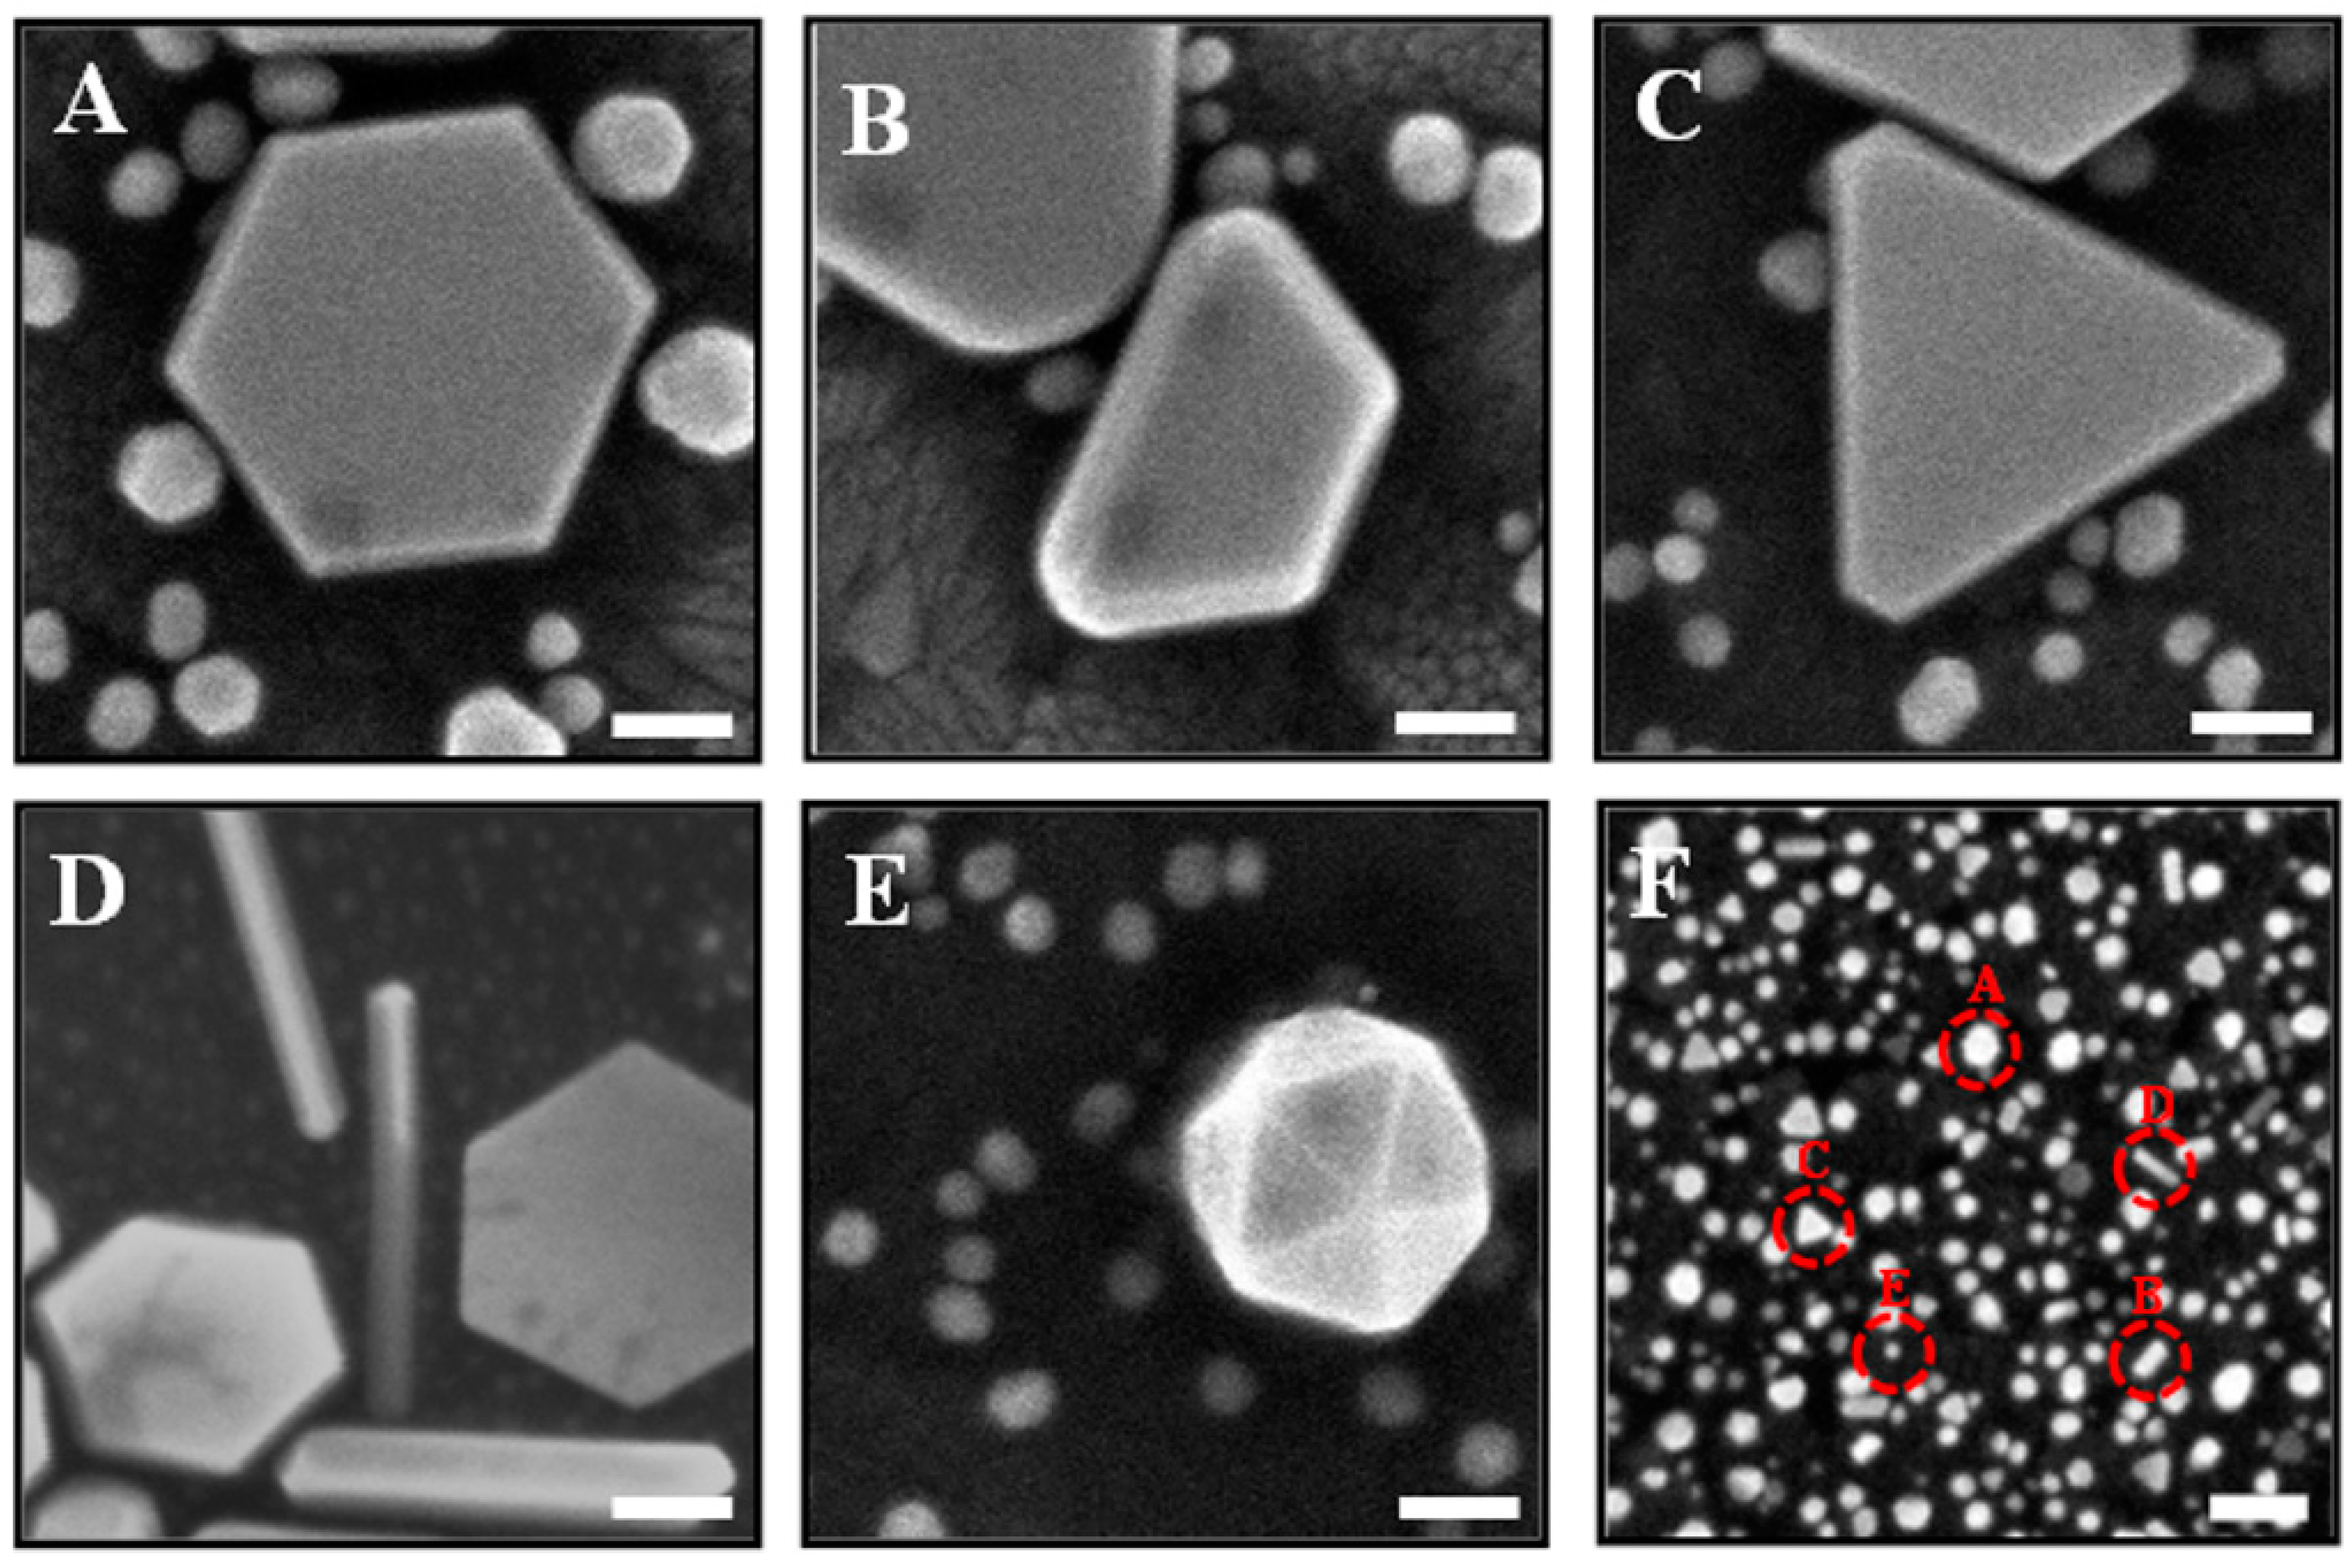
3.1. Gold Nanoplates Characterization

The Au nanoplates formation on the quartz substrate was confirmed by X-ray diffraction (XRD) (D8 Advance) and field emission scanning electron microscopy (FESEM) analysis (Zeiss Supra 55VP). The XRD result [33] has been compared to the JCPDS-004-0784 file for bulk Au. An exceedingly high peak at 38.15° that can be indexed as the (111)-crystallographic planes of face-centered cubic (fcc) Au nanocrystals was observed in the spectrum. There was another peak with a lower intensity observed at 44.25°, which is related to (200) fcc lattice planes. Thus, the product was characterized by (111) facet [27], indicating that the plane prefers to orient in parallel to the surface of the substrate.
The morphology of the Au nanoplates on the substrate was characterized using FESEM and is shown in Figure 1A–F. The figure shows that Au nanoplates with various shapes were grown on the substrate surface, such as triangular, truncated hexagonal, asymmetric hexagonal, symmetric hexagonal, truncated pentagon and flat rod. Moreover, spherical Au nanoparticles and irregular Au shapes were also observed. In this study, the growth time was fixed at 5 h. For the growth of Au nanoplates, plate formation started with a triangular shape and grew to a hexagonal shape. It was found that the hexagonal shapes make up the majority of the product. As seen from this figure, there are two groups of Au nanoplates with different sizes. The first group includes the Au nanoplates with an edge length of more than 150 nm, with a yield percentage of approximately 23% all over the surface area. The analysis was done by measuring the area covered by nanogold. Three different areas were measured and analyzed and the average of surface density was calculated. The second group includes the Au nanoplates with a smaller edge length (less than 50 nm), with a yield of up to ca. 40%. The bigger nanoplates are dominated by hexagonal shapes with an edge length of ca. 250 nm. The height of the Au nanoplates for both groups is between 10–30 nm. Moreover, the Au flat rod is also observed. The yield of the nanoplates can be estimated to be covering is about 63% of the surface area.

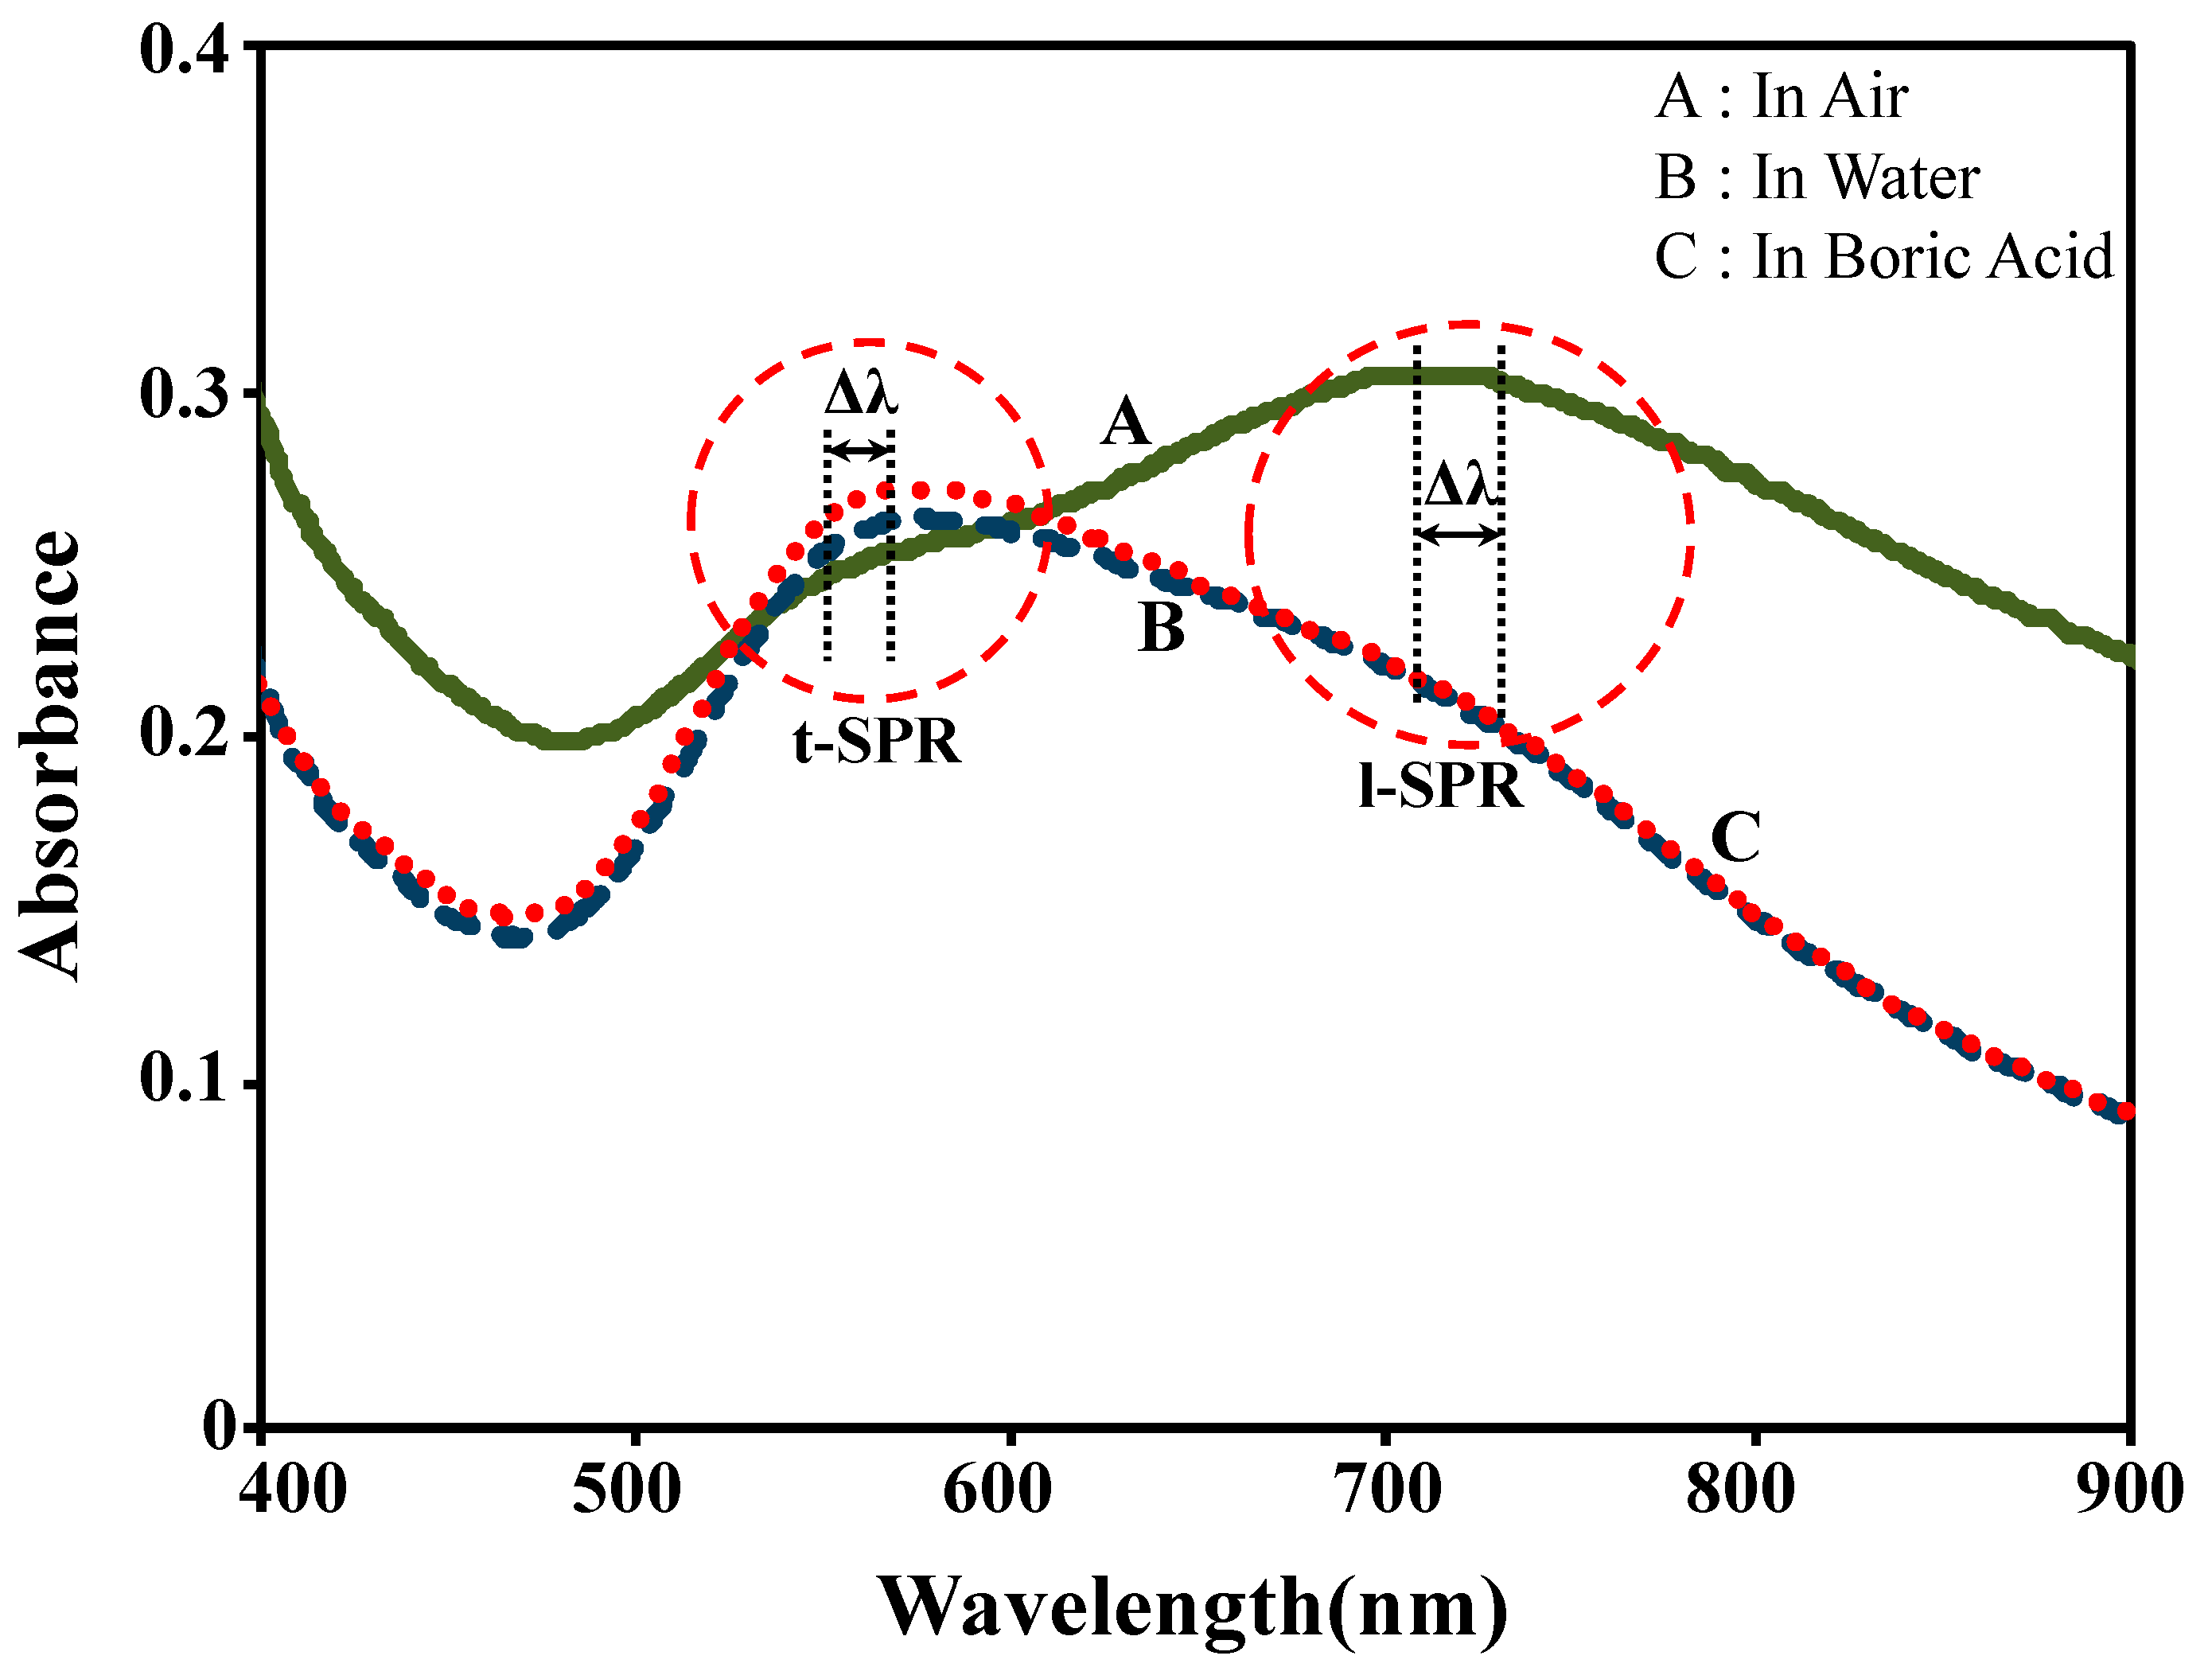
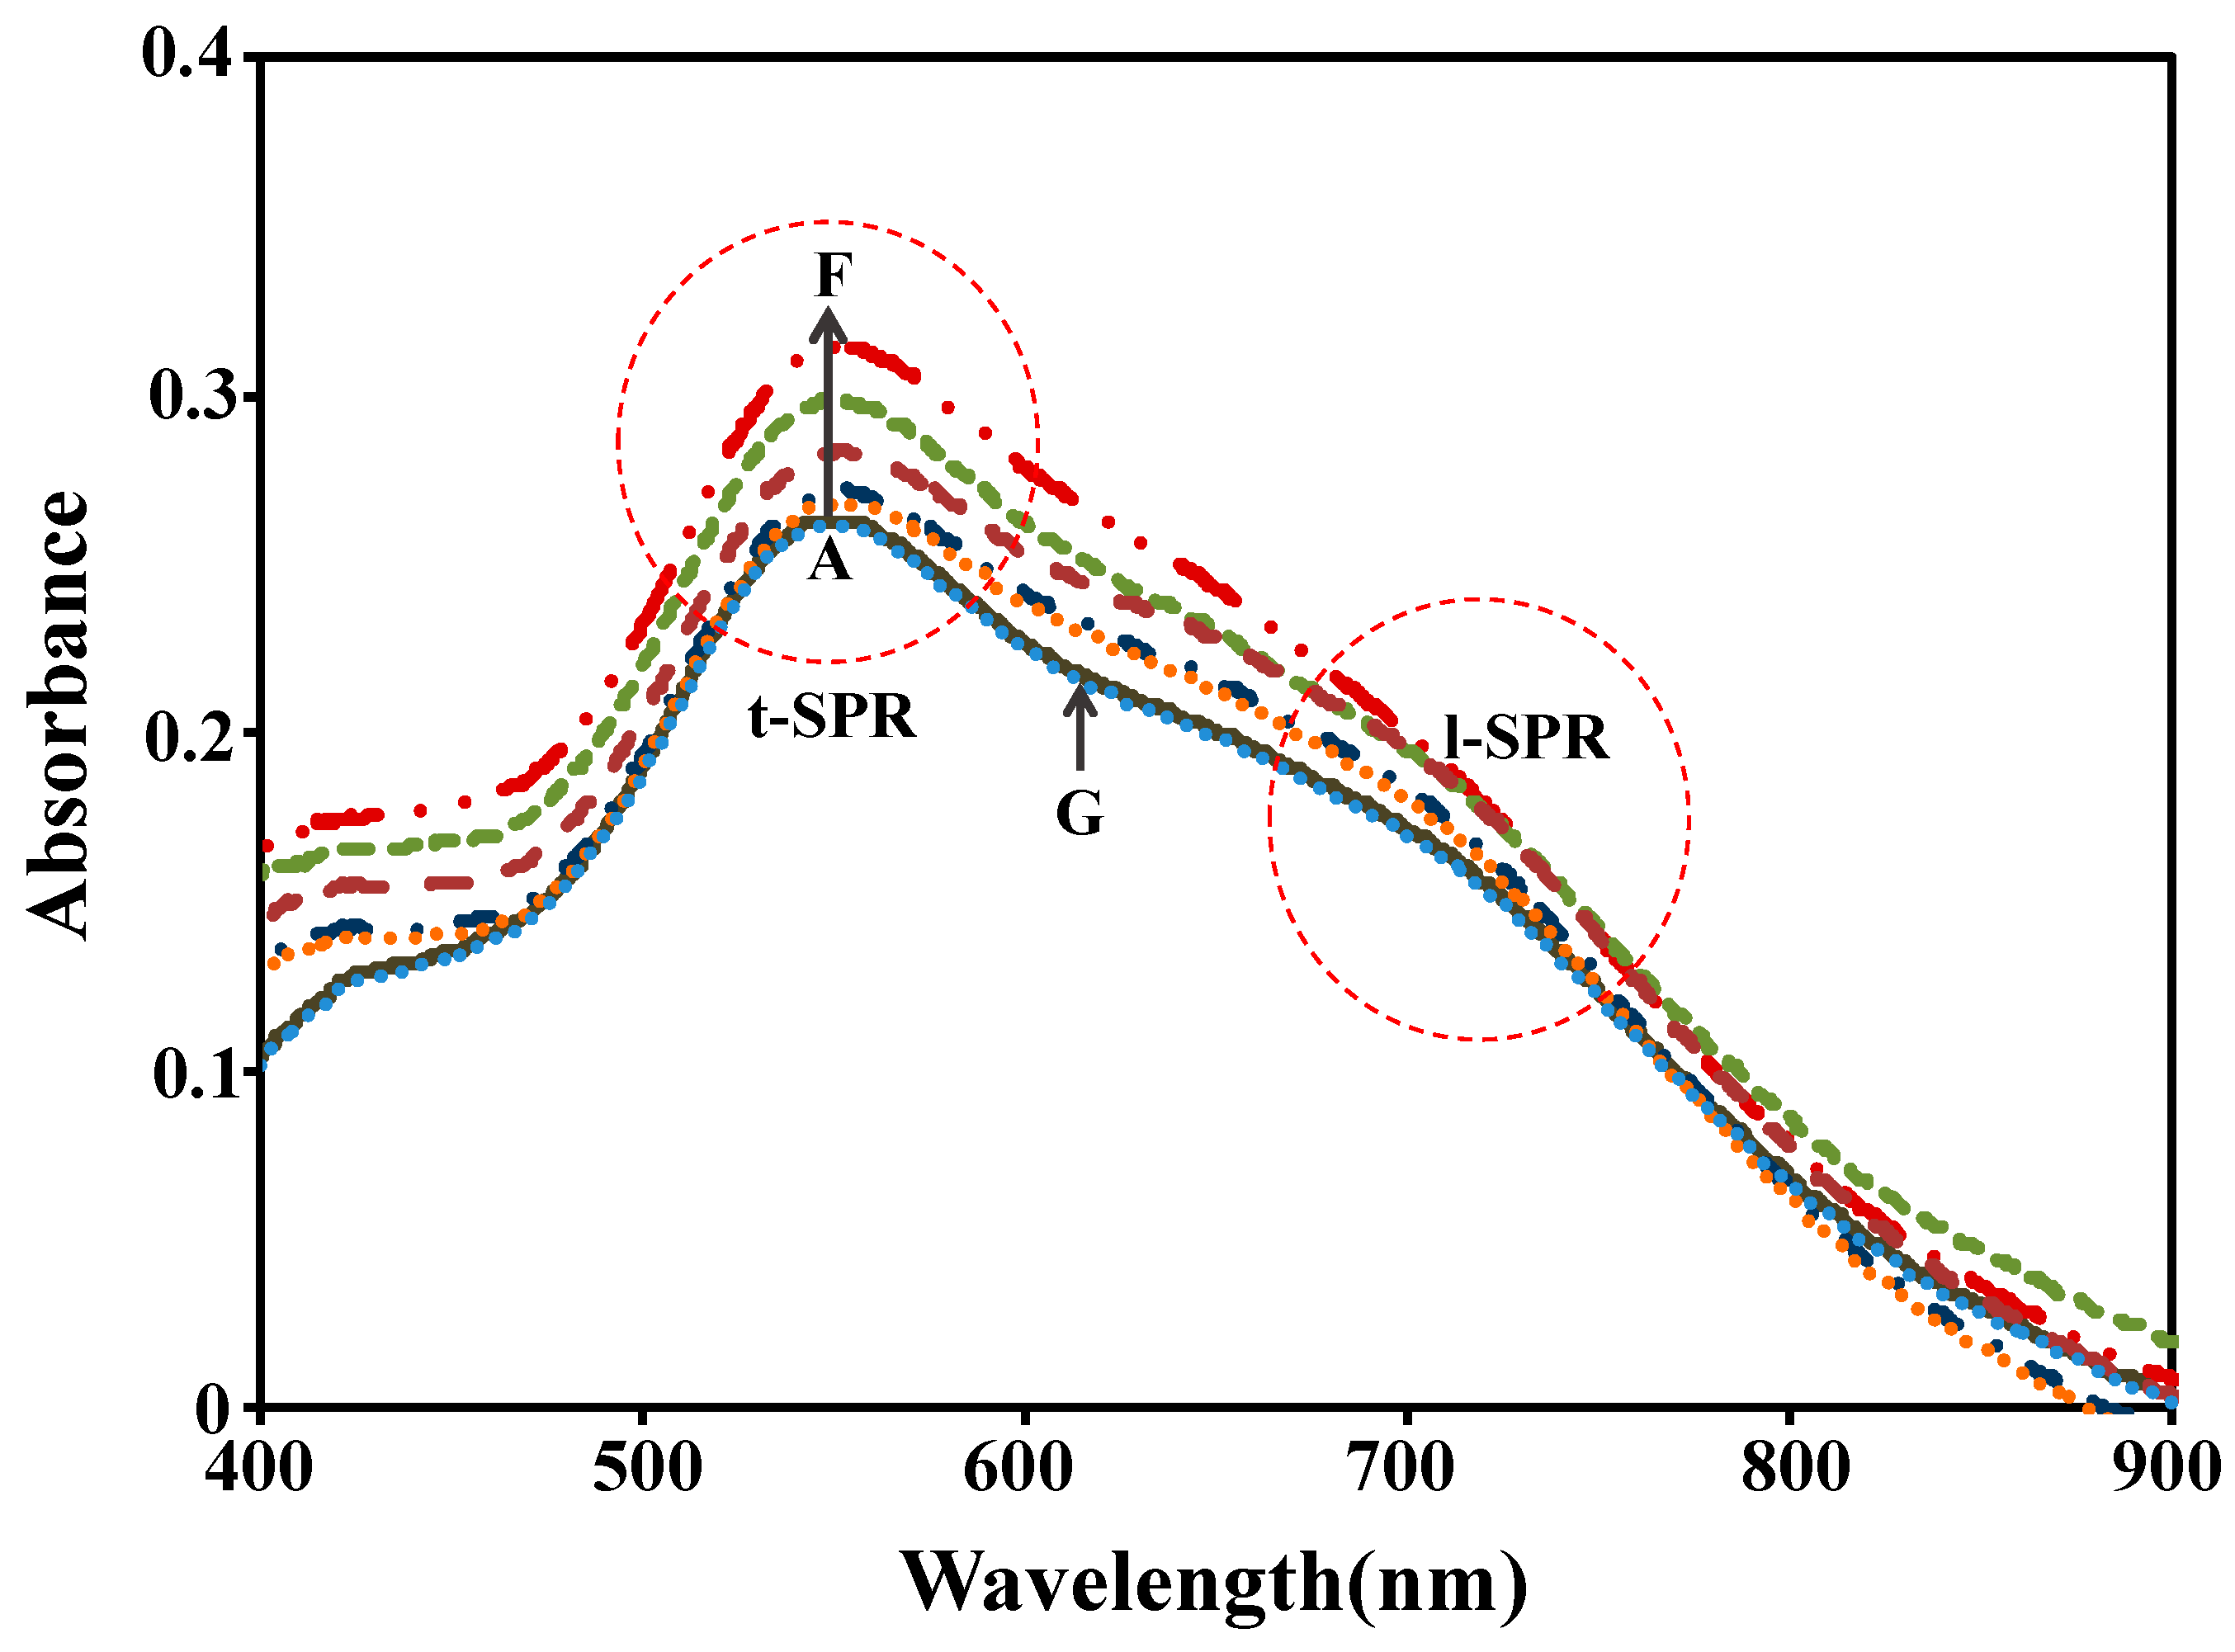
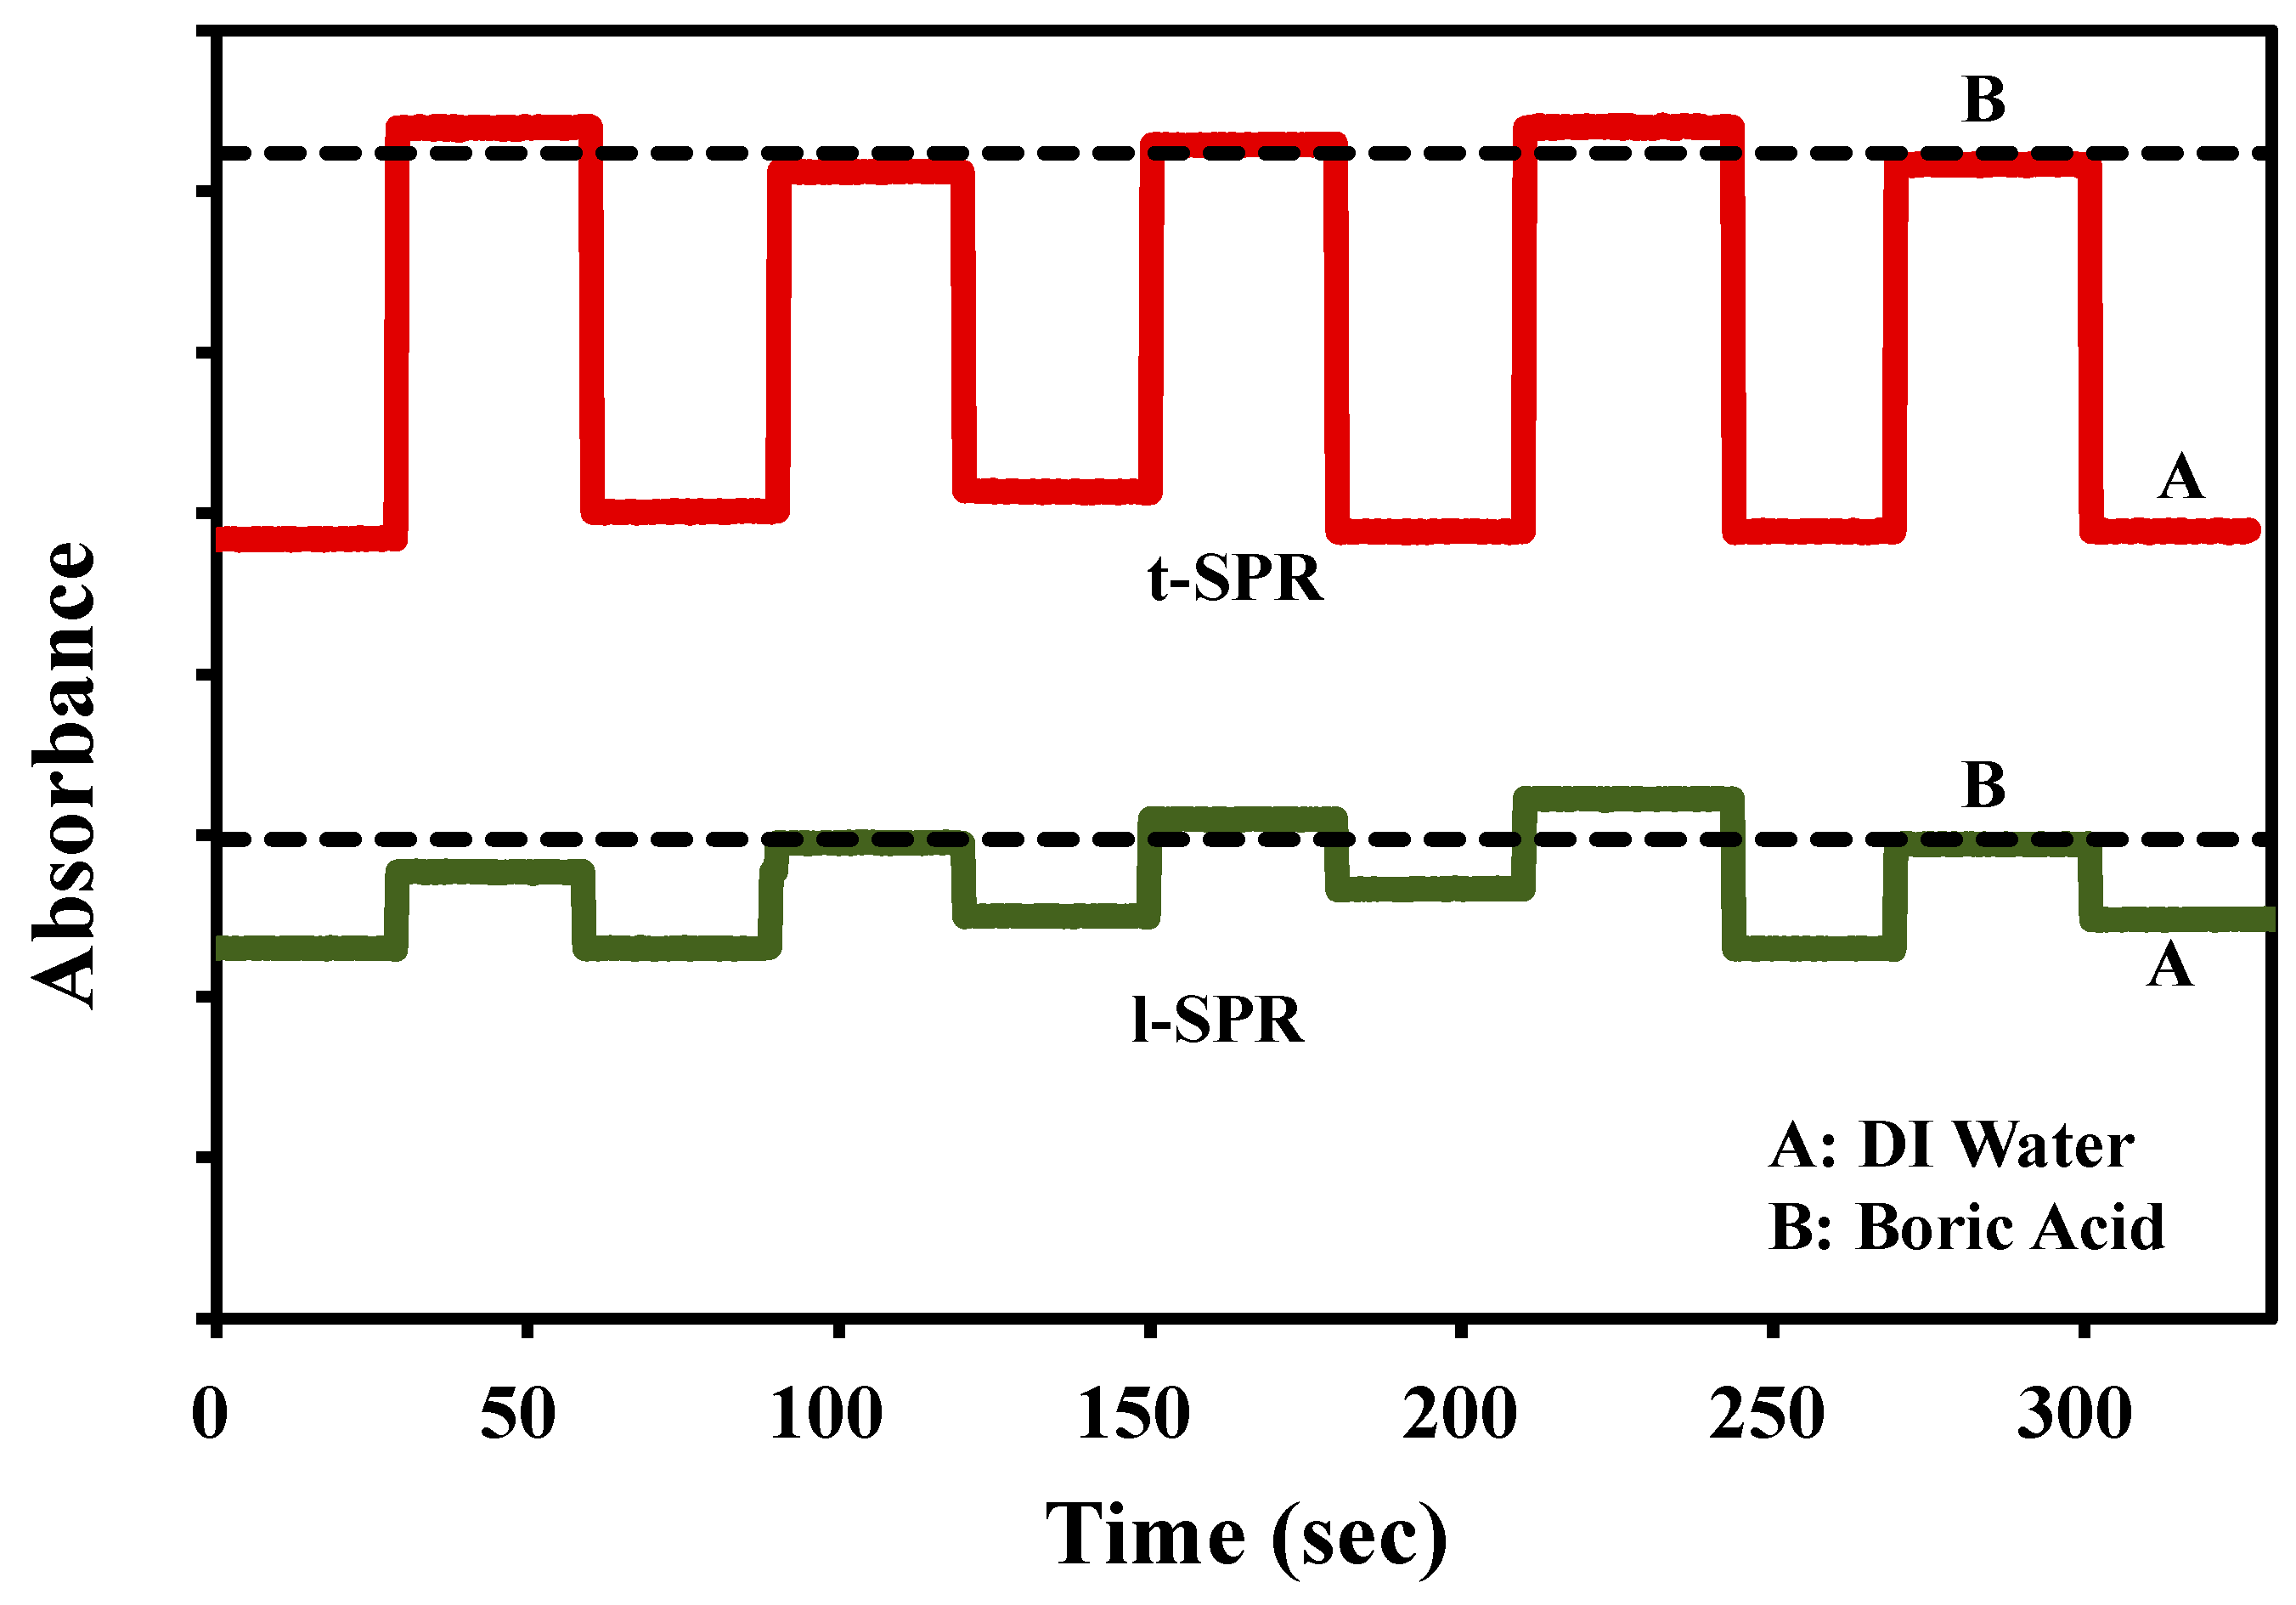
3.2. Plasmonic Sensing Response

The absorption spectra of Au nanoplates were studied in three mediums; air, DI water and 1 mM boric acid (H3BO3). The results for all spectra are shown in Figure 2. In the air medium, there are two absorption bands observed at 545 nm and 710 nm. The first peak is assigned as transverse SPR (t-SPR) and the second peak is assigned as longitudinal SPR (l-SPR) [19]. The t-SPR represents free charges vibration into the short axis (vertical direction), while l-SPR is the vibration of free charges into the longer axis (horizontal direction), which is parallel to the substrate surface. The t-SPR band agrees with previous observations of the spectrum of spherical shaped Au nanoparticles [21], and the l-SPR band agrees with the Au nanoplates spectrum [27,28]. Besides, it can be seen that the spectrum peak is broad and not very sharp due to the various shapes and sizes of Au nanoplates grown on the substrate. When the sample was immersed into the solution media, both DI water and boric acid (10 mM), two changes occurred in the spectrum that altered the peaks’ intensity and position. The peaks were increased at t-SPR, but attenuated at l-SPR when the medium was changed from air to solution. The presence of water and boric acid molecules in the surrounding medium influenced the resonance of the Au nanoplates samples. Instead of changes in intensity, it can be observed that the peak position tended to red-shifted with the change of medium. All these spectral changes can be described by the classical Mie theory [35], as shown in Equation (1):
E ( λ ) = 24 π N A a 3 ε m 3 / 2 λ l n ( 10 ) [ ε i ( ε r + 2 ε m ) 2 + ε i 2 ]
where |E(λ)| is the extinction equal to the sum of absorption and Rayleigh scattering, NA is the area density of nanoparticles, a is the radius of the metallic nanosphere, εm is the dielectric constant of the medium surrounding the metallic nanosphere, λ is the wavelength of the absorbing radiation, and εi and εr are the imaginary and the real portion of the metallic nanosphere dielectric function, respectively. The extinction coefficient depends on the nanoparticle’s in-plane diameter, out-of-plane height, and shape that can be shown by replacing the resonance term (εr + 2εm)2 with (εr + χεm)2 where χ is a shape factor term that describes the nanoparticle’s aspect ratio. Meanwhile, for arbitrary shapes of small metal nanoparticles, Pennypacker and Purcell [35] presented a method called Discrete-Dipole Approximation (DDA) to compute scattering and absorption by particles. The DDA method is done by dividing nanoparticles to small particles as a set of small cubic subdensity which is also referred as bipolar. The dipole size must be smaller than the wavelength of the electromagnetic wave. The dipoles will interact with each other and the incident field. In this method, the response to light is measured by calculating the response of a dipole at the center of each cube to the absorbed and scattered light. The effects of the reaction depend on the size, shape and cubic dimensions. The improvement of this method has been continued by Draine et al. [36,37].
The change of the refractive index of the medium [38,39,40] can be measured using the following equation:
Δλmax = mΔn(1 − exp(−2d/ld))
where Δλmax is the wavelength shift, m is the refractive index sensitivity, Δn is the change in refractive index induced by an adsorbate, d is the effective adsorbate layer thickness, and ld is the characteristic electromagnetic field decay length.
To analyze the sensitivity of Au nanoplates, the concentration of boric acid was varied from 0.01 mM (0.614 mg/L) to 200 mM (12 368 mg/L). The Arago-Biot equation [41] as shown below, was used to determine the refractive index for each boric acid concentration:
n12 = n1ϕ1 + n2ϕ2
where n12 is the refractive index of the liquids mixture, n1 is the refractive index of the first liquid, n2 is the refractive index of the second liquid, ϕ1 is the mole fraction of the first liquid and ϕ2 is the mole fraction of the second liquid.
From the results, it was found that two changes in the spectra were recorded, namely, the change in the SPR peak position (see Figure 3) and its intensity. For the SPR intensity, we observed that the changes of intensity at t-SPR are almost the same as those at l-SPR for each boric acid concentration.
Similarly, it appears that the sensing responses of t-SPR are linearly correlated with the increasing of the boric acid concentration, where the linear correlation coefficient (r) is greater than 0.90. The (r) was generated by data samples from 0.01 mM to 100 mM. In addition, it was observed that the l-SPR response is not very fine because of uneven homogeneity of Au nanoplates, but this can be controlled and improved further. Then, it was found that when the sample of Au nanoplates was immersed into 150 mM and 200 mM of boric acid concentration, the intensity of the spectrum became attenuated. This can be explained as follows; when the solution becomes more concentrated, the boric acid will tend to silt in the bottom of the solution. This condition causes the properties of the solution to turn into particles. These particles will act as seeds that attract other seeds to thus clump together. Solubility properties of these materials will decrease and thus affect the sensitivity of the sensing being performed. In addition, these conditions may occur due to the weak resonance of particles caused by the close positioning of molecules, since the total energy from the light source used is constant. The increase of large molecules in the solution is caused by a high concentration of boric acid. Repeating sample testing for boric acid ≤100 mM has shown that similar output response can still be obtained. Thus, we confirmed that the sample was not damaged. In the case of peak position (see Figure 4), the change of t-SPR is slightly larger than l-SPR with almost the same (r). All changes in the SPR peak position and intensity are summarized in Table 1. The refractive index of pure boric acid was obtained from the manufacturer. In order to vary the concentration of boric acid, the solutions were diluted using DI water and the Refractive Index Unit (RIU) was calculated using the Arago-Biot equation.
Then, a repeatability study of the sensing property of the Au nanoplates sample towards boric acid was carried out. Figure 5 shows the time responses of the Au nanoplates to the presence of 10 mM boric acid that was measured at both t-SPR and l-SPR. The reference used was DI water. In this study, the Au nanoplates sample was immersed in DI water and boric acid alternately every 30 s. The results indicate that the sensor gave fast response and recovery for at least five cycles. The stability of the response depends on the transmitted beam from the light source; hence, if the source is hot, the response will not be accurate.

4. Conclusions

The LSPR response of Au nanoplates to the presence of boric acid in water has been investigated. This study shows that the LSPR of Au nanoplates is sensitive towards the presence of boric acid in concentrations as low as 0.01 mM. The sensing parameters are based on the changes of the resonance peak position and intensity. The responses were found to increase linearly with the increase in the concentration of boric acid until it reached the saturation limit at 200 mM. Moreover, the repeatability study showed that the response of t-SPR is more stable than that of l-SPR. In addition, improving the quality of the sensing material could narrow the LSPR peak and further enhance the performance of the LSPR sensor.

Acknowledgments

This work was supported by Universiti Tun Hussien Onn Malaysia under UTHM Contract Research Grant (U565-UTHM), Ministry of Higher Education (MOHE) under FRGS Grant (FRGS-1530) and IMEN, Universiti Kebangsaan Malaysia for the laboratory facilities. This article has been proofread by Rahmat, Nur Anida and Feri Ardiyanto from UTHM.

Author Contributions

Muhamad Mat Salleh, Akrajas Ali Umar and Marlia Morsin conceived and designed the experiments; Marlia Morsin performed the experiments and analyzed the data; Mohd Zainizan Sahdan contributed analysis tools; Marlia Morsin wrote the paper.

Conflicts of Interest

The authors declare no conflict of interest.

References

  1. Petryayeva, E.; Krull, U.J. Localized surface plasmon resonance: Nanostructures, bioassays and biosensing—A review. Anal. Chim. Acta 2011, 706, 8–24. [Google Scholar] [CrossRef] [PubMed]
  2. Yeom, S.H.; Yuan, H.; Choi, W.Y.; Eum, N.S.; Kang, S.W. Development of Localized Surface Plasmon Resonance Based Biosensor Using Au Deposited Nano-Porous Aluminum Anodic Oxide Chip. Sens. Lett. 2011, 1, 90–96. [Google Scholar] [CrossRef]
  3. Zhu, J.; Zhang, F.; Lu, J.; Zhao, J. Optimization of the refractive index plasmonic sensing of gold nanorods by non-uniform silver coating. Sens. Actuators B Chem. 2013, 183, 556–564. [Google Scholar] [CrossRef]
  4. Umar, A.A.; Oyama, M.; Salleh, M.M.; Majlis, B.Y. Silver nanocombs and branched nanowires formation in aqueous binary surfactants solution. J. Nanopart. Res. 2012, 14, 1001. [Google Scholar] [CrossRef]
  5. Balouch, A.; Umar, A.A.; Tan, S.T.; Nafisah, S.; Saad, S.K.M.; Salleh, M.M.; Oyama, M. Fibrous, ultra-small nanorod-constructed platinum nanocubes directly grown on the ITO substrate and their heterogeneous catalysis application. RSC Adv. 2013, 3, 19789–19792. [Google Scholar] [CrossRef]
  6. Watt, J.; Cheong, S.; Tilley, R.D. How to control the shape of metal nanostructures in organic solution phase synthesis for plasmonics and catalysis. Nano Today 2013, 8, 198–215. [Google Scholar] [CrossRef]
  7. Umar, A.A.; Oyama, M. Synthesis of Palladium Nanobricks with Atomic-Step Defects. Cryst. Growth Des. 2008, 8, 1808–1811. [Google Scholar] [CrossRef]
  8. Balouch, A.; Umar, A.A.; Shah, A.A.; Salleh, M.M.; Oyama, M. Efficient Heterogeneous Catalytic Hydrogenation of Acetone to Isopropanol on Semihollow and Porous Palladium Nanocatalyst. ACS Appl. Mater. Interf. 2013, 5, 9843–9849. [Google Scholar] [CrossRef] [PubMed]
  9. Mayer, K.M.; Hafner, J.H. Localized Surface Plasmon Resonance Sensor. Chem. Rev. 2011, 111, 3828–3857. [Google Scholar] [CrossRef] [PubMed]
  10. Zhao, J.; Zhang, X.; Yonzon, C.R.; Haes, A.J.; Van Duyne, R.P. Localized surface plasmon resonance biosensors. Nanomedicine 2008, 1, 219–228. [Google Scholar] [CrossRef] [PubMed]
  11. Mejri, M.B.; Baccar, H.; Ktari, T.; Aouni, M.; Abdelghani, A. Detection of E. coli Bacteria Using Impedance Spectroscopy and Surface Plasmon Resonance Imaging Based Biosensor. Sens. Lett. 2011, 9, 2130–2132. [Google Scholar] [CrossRef]
  12. Sekhon, J.S.; Malik, H.K.; Verma, S.S. Tailoring Surface Plasmon Resonance Wavelengths and Sensoric Potential of Core–Shell Metal Nanoparticles. Sens. Lett. 2013, 11, 512–518. [Google Scholar] [CrossRef]
  13. Hamamoto, K.; Micheletto, R.; Oyama, M.; Umar, A.A.; Kawai, S.; Kawakami, Y. An original planar multireflection system for sensing using the local surface plasmon resonance of gold nanospheres. J. Opt. A Pure Appl. Opt. 2006, 8, 268. [Google Scholar] [CrossRef]
  14. Chaoming, W.; Haining, W.; Shengli, Z.; Liyuan, M. Polyelectrolyte Multilayers Stabilized Plasmonic Nanosensors. Sens. Lett. 2013, 11, 519–525. [Google Scholar]
  15. Chen, H.; Kou, X.; Yang, Z.; Ni, W.; Wang, J. Shape- and Size-Dependent Refractive Index Sensitivity of Gold Nanoparticles. Langmuir 2008, 24, 5233–5237. [Google Scholar] [CrossRef] [PubMed]
  16. Eustis, S.; El-Sayed, M.A. Why gold nanoparticles are more precious than pretty gold: Noble metal surface plasmon resonance and its enhancement of the radiative and nonradiative properties of nanocrystals of different shapes. Chem. Soc. Rev. 2006, 35, 209–217. [Google Scholar] [CrossRef] [PubMed]
  17. Sannomiya, T.; Voros, J. Single plasmonic nanoparticles for biosensing. Trends Biotechnol. Rev. 2011, 29, 343–351. [Google Scholar] [CrossRef] [PubMed]
  18. Pillai, S.; Green, M.A. Plasmonics for photovoltaic applications. Sol. Energy Mat. Sol Cells 2010, 94, 1481–1486. [Google Scholar] [CrossRef]
  19. Veres, Á.; Rica, T.; Janovák, L.; Dömök, M.; Buzás, N.; Zöllmer, V.; Seemann, T.; Richardt, A.; Dékány, I. Silver and gold modified plasmonic TiO2 hybrid films for photocatalytic decomposition of ethanol under visible light. Catal. Today 2012, 181, 156–162. [Google Scholar] [CrossRef]
  20. Su, H.; Ma, Q.; Shang, K.; Liu, T.; Yin, H.; Ai, S. Gold nanoparticles as colorimetric sensor: A case study on E. coli O157:H7 as a model for Gram-negative bacteria. Sens. Actuators B Chem. 2012, 161, 298–303. [Google Scholar] [CrossRef]
  21. Nengsih, S.; Umar, A.A.; Salleh, M.M.; Oyama, M. Detection of Formaldehyde in Water: A Shape-Effect on the Plasmonic Sensing Properties of the Gold Nanoparticles. Sensors 2012, 12, 10309–10325. [Google Scholar] [CrossRef] [PubMed]
  22. Morsin, M.; Salleh, M.M.; Umar, A.A. Detection of Boric Acid using Localized Surface Plasmon Resonance Sensor of Gold Nanoparticles. In Proceedings of the 14th International Meeting on Chemical Sensor, Nuremberg, Germany, 20–23 May 2012. [Google Scholar]
  23. Morsin, M.; Umar, A.A.; Salleh, M.M.; Majlis, B.Y. High sensitivity localized surface plasmon resonance sensor of gold nanoparticles: Surface density effect for detection of boric acid. In Proceedings of the 10th IEEE International Conference on Semiconductor Electronics (ICSE), Kuala Lumpur, Malaysia, 19–21 September 2012. [Google Scholar]
  24. Cao, J.; Sun, T.; Grattan, K.T. Gold nanorod-based localized surface plasmon resonance biosensors: A review. Sens. Actuators B Chem. 2014, 195, 332–351. [Google Scholar] [CrossRef]
  25. Huang, X.; Neretina, S.; El-Sayed, M.A. Gold Nanorods: From Synthesis and Properties to Biological and Biomedical Applications. Adv. Mater. 2009, 21, 4880–4910. [Google Scholar] [CrossRef] [PubMed]
  26. Umar, A.A.; Iwantono, I.; Abdullah, A.; Salleh, M.M.; Oyama, M. Gold nanonetwork film on the ITO surface exhibiting one-dimensional optical properties. Nanoscale Res. Lett. 2012, 7, 1–9. [Google Scholar] [CrossRef] [PubMed]
  27. Umar, A.A.; Oyama, M.; Salleh, M.M.; Majlis, B.Y. Formation of High-Yield Gold Nanoplates on the Surface: Effective Two-Dimensional Crystal Growth of Nanoseed in the Presence of Poly(vinylpyrrolidone) and Cetyltrimethylammonium Bromide. Cryst. Growth Des. 2009, 9, 2835–2840. [Google Scholar] [CrossRef]
  28. Umar, A.A.; Oyama, M.; Salleh, M.M.; Majlis, B.Y. Formation of Highly Thin, Electron-Transparent Gold Nanoplates from Nanoseeds in Ternary Mixtures of Cetyltrimethylammonium Bromide, Poly(vinyl pyrrolidone), and Poly(ethylene glycol). Cryst. Growth Des. 2010, 10, 3694–3698. [Google Scholar] [CrossRef]
  29. Goyal, R.N.; Akrajas, A.A.; Oyama, M. Comparison of spherical nanogold particles and nanogold plates for the oxidation of dopamine and ascorbic acid. J. Electroanal. Chem. 2009, 631, 58–61. [Google Scholar] [CrossRef]
  30. Litovitz, T.L.; Klein-Schwartz, W.; Oderda, G.M.; Schmitz, V. Clinical manifestations of toxicity in a series of 784 boric acid ingestions. Am. J. Emerg. Med. 1988, 6, 209–213. [Google Scholar] [CrossRef]
  31. See, A.S.; Salleh, A.B.; Bakar, F.A.; Yusof, N.; Abdulamir, A.S.; Heng, L.Y. Risk and Health Effect of Boric Acid. Am. J. Appl. Sci. 2010, 7, 620–627. [Google Scholar] [CrossRef]
  32. Tréguer-Delapierre, M.; Majimel, J.; Mornet, S.; Duguet, E.; Ravaine, S. Synthesis of non-spherical gold nanoparticles. Gold Bull. 2008, 41, 195–207. [Google Scholar] [CrossRef]
  33. Morsin, M.; Salleh, M.M.; Umar, A.A.; Yahaya, M. Localized Surface Plasmon Resonance Sensor of Gold Nanoplates for Detection of Boric Acid. Key Eng. Mat. 2014, 605, 356–359. [Google Scholar] [CrossRef]
  34. Morsin, M.; Mat Salleh, M.; Sahdan, M.Z.; Muji, M.; Zarina, S. Development of plasmonic sensor for detection of toxic materials. ARPN J. Eng. Appl. Sci. 2015, 10, 9083–9087. [Google Scholar]
  35. Purcell, E.M.; Pennypacker, C.R. Scattering and Absorption of Light by Nonspherical Dielectric Grains. Astrophys. J. 1973, 186, 705–714. [Google Scholar] [CrossRef]
  36. Draine, B.T.; Flatau, P.J. Discrete-dipole approximation for scattering calculations. J. Opt. Soc. Am. A 1994, 11, 1491–1499. [Google Scholar] [CrossRef]
  37. Draine, B.T. The discrete dipole approximation for light scattering by irregular targets. In Light Scattering by Nonspherical Particles, Theory, Measurements, and Applications; Mishchenko, M.I., Hovenier, J.W., Travis, L.D., Eds.; Academic Press: New York, NY, USA, 2000; pp. 131–145. [Google Scholar]
  38. Stuart, D.A.; Haes, A.J.; Yonzon, C.R.; Hicks, E.M.; Van Duyne, R.P. Biological applications of localised surface plasmonic phenomenae. IEE Proc. Nanobiotechnol. 2005, 152, 13–32. [Google Scholar] [CrossRef] [PubMed]
  39. Barbillon, G.; Bijeon, J.; Plain, J.; Chapelle, M.L.; Adam, P.M.; Royer, P. Biological and chemical gold nanosensors based on localized surface plasmon resonance. Gold Bull. 2007, 40, 240–244. [Google Scholar] [CrossRef]
  40. Anker, J.N.; Hall, W.P.; Lyandres, O.; Shah, N.C.; Zhao, J.; Duyne, R.P.V. Biosensing with plasmonic nanosensors. Nat. Mater. 2008, 7, 442–453. [Google Scholar] [CrossRef] [PubMed]
  41. Wankhede, D.S. Refractive Index, Molar Refraction and Comparative Refractive Index Study of Propylene Carbonate Binary Liquid Mixtures. Acta Chim. Slov. 2012, 59, 258–263. [Google Scholar] [PubMed]
Figure 1. Field Emission Surface Scanning Electron Microscopy (FESEM) images of Au nanoplates grown on the substrate using the seed-mediated growth method. Variable structures of Au nanoplates were obtained, such as (A) symmetric hexagonal, (B) truncated pentagon, (C) triangular, (D) flat rod, (E) irregular shape; (F) the growth of Au in small sizes on the surface substrate. Scale bars are 100 nm.
Sensors 17 00947 g001
Figure 2. The spectra of Au nanoplates in three different mediums: (A) air, (B) deionized (DI) water, and (C) 1 mM boric acid.
Sensors 17 00947 g002
Figure 3. The plasmonic responses of Au nanoplates to the variation concentration of boric acid: (A) DI water, (B) 0.01 mM, (C) 0.1 mM, (D) 1 mM, (E) 10 mM, (F) 100 mM, and (G) 200 mM boric acid.
Sensors 17 00947 g003
Figure 4. The plasmonic responses of transverse surface plasmon resonance (t-SPR) and longitudinal surface plasmon resonance (l-SPR) with the relationship between peak position and boric acid concentrations: (A) 200 mM, (B) 100 mM, (C) 10 mM, (D) 1 mM, (E) 0.1 mM, and (F) 0.01 mM boric acid. The dotted line represents the refractive index (RIU) of each boric acid concentration. * Refractive index for acid boric is 0.13339.
Sensors 17 00947 g004
Figure 5. Plasmonic response of Au nanoplates towards boric acid and its corresponding response times with DI water as baseline. The dotted line represents the average peak intensity reading in the boric acid medium.
Sensors 17 00947 g005
Table 1. Summary for all changes in the SPR peak position and intensity.
Parameter∆Intensity (10−3)∆Peak Position (nm)
Concentration (mM)t-SPRl-SPRt-SPRl-SPR
0.016.676.251.241.17
0.110.009.751.431.46
1.015.7515.302.032.01
1020.0020.002.682.41
10031.2531.333.563.07
20022.3329.002.912.85

