
Towards Real-Time Detection of Gait Events on Different Terrains Using Time-Frequency Analysis and Peak Heuristics Algorithm


Abstract
:1. Introduction
2. Materials and Methods
2.1. Subjects
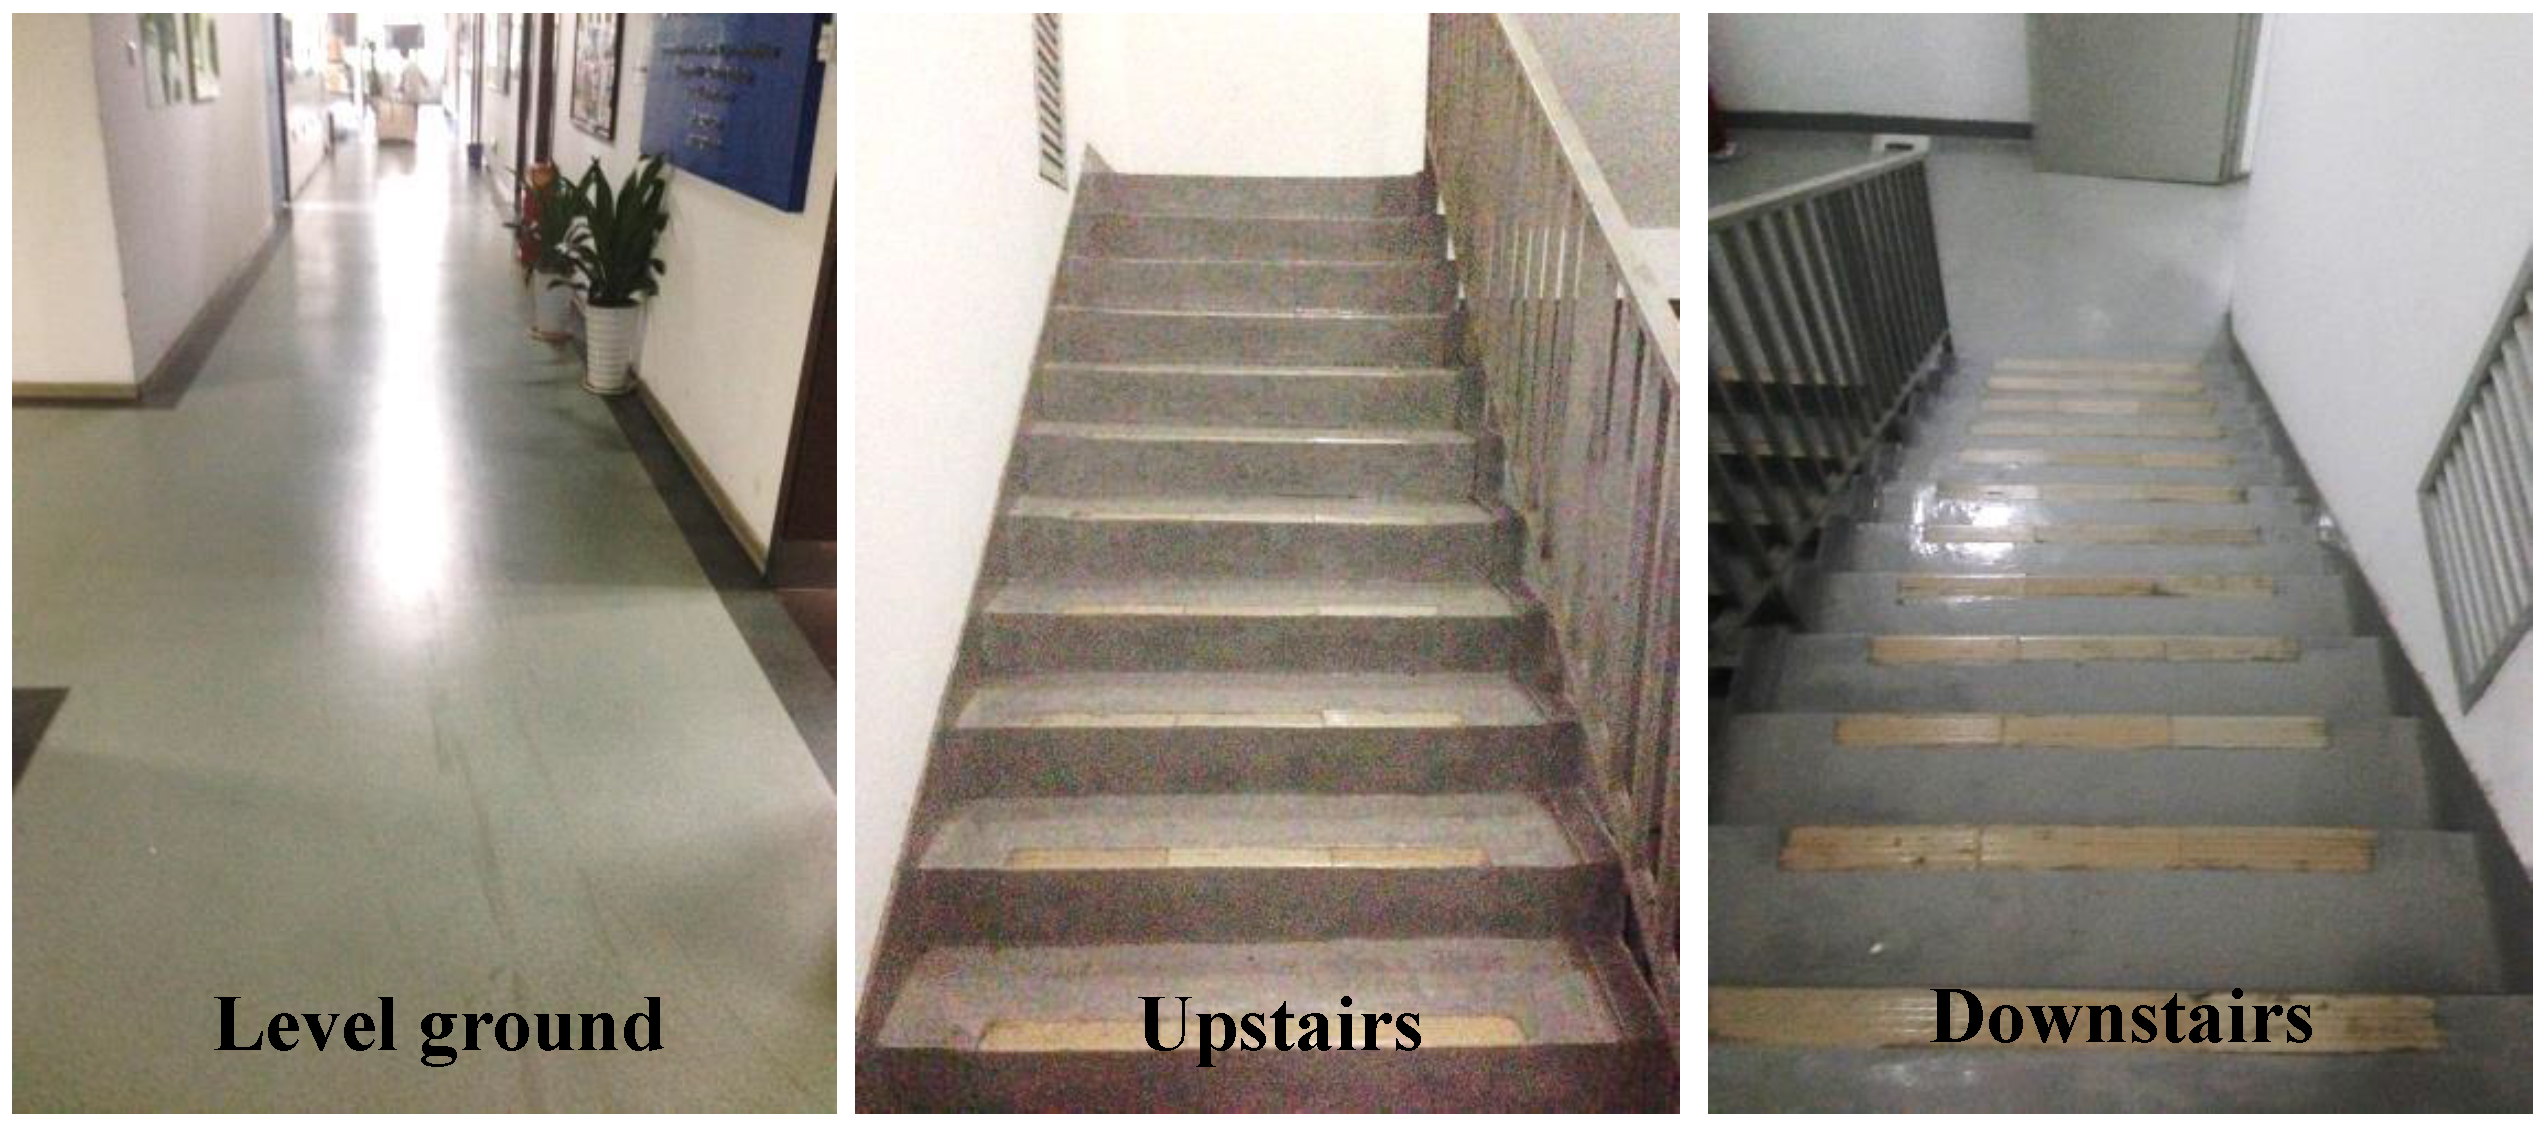
2.2. Protocol
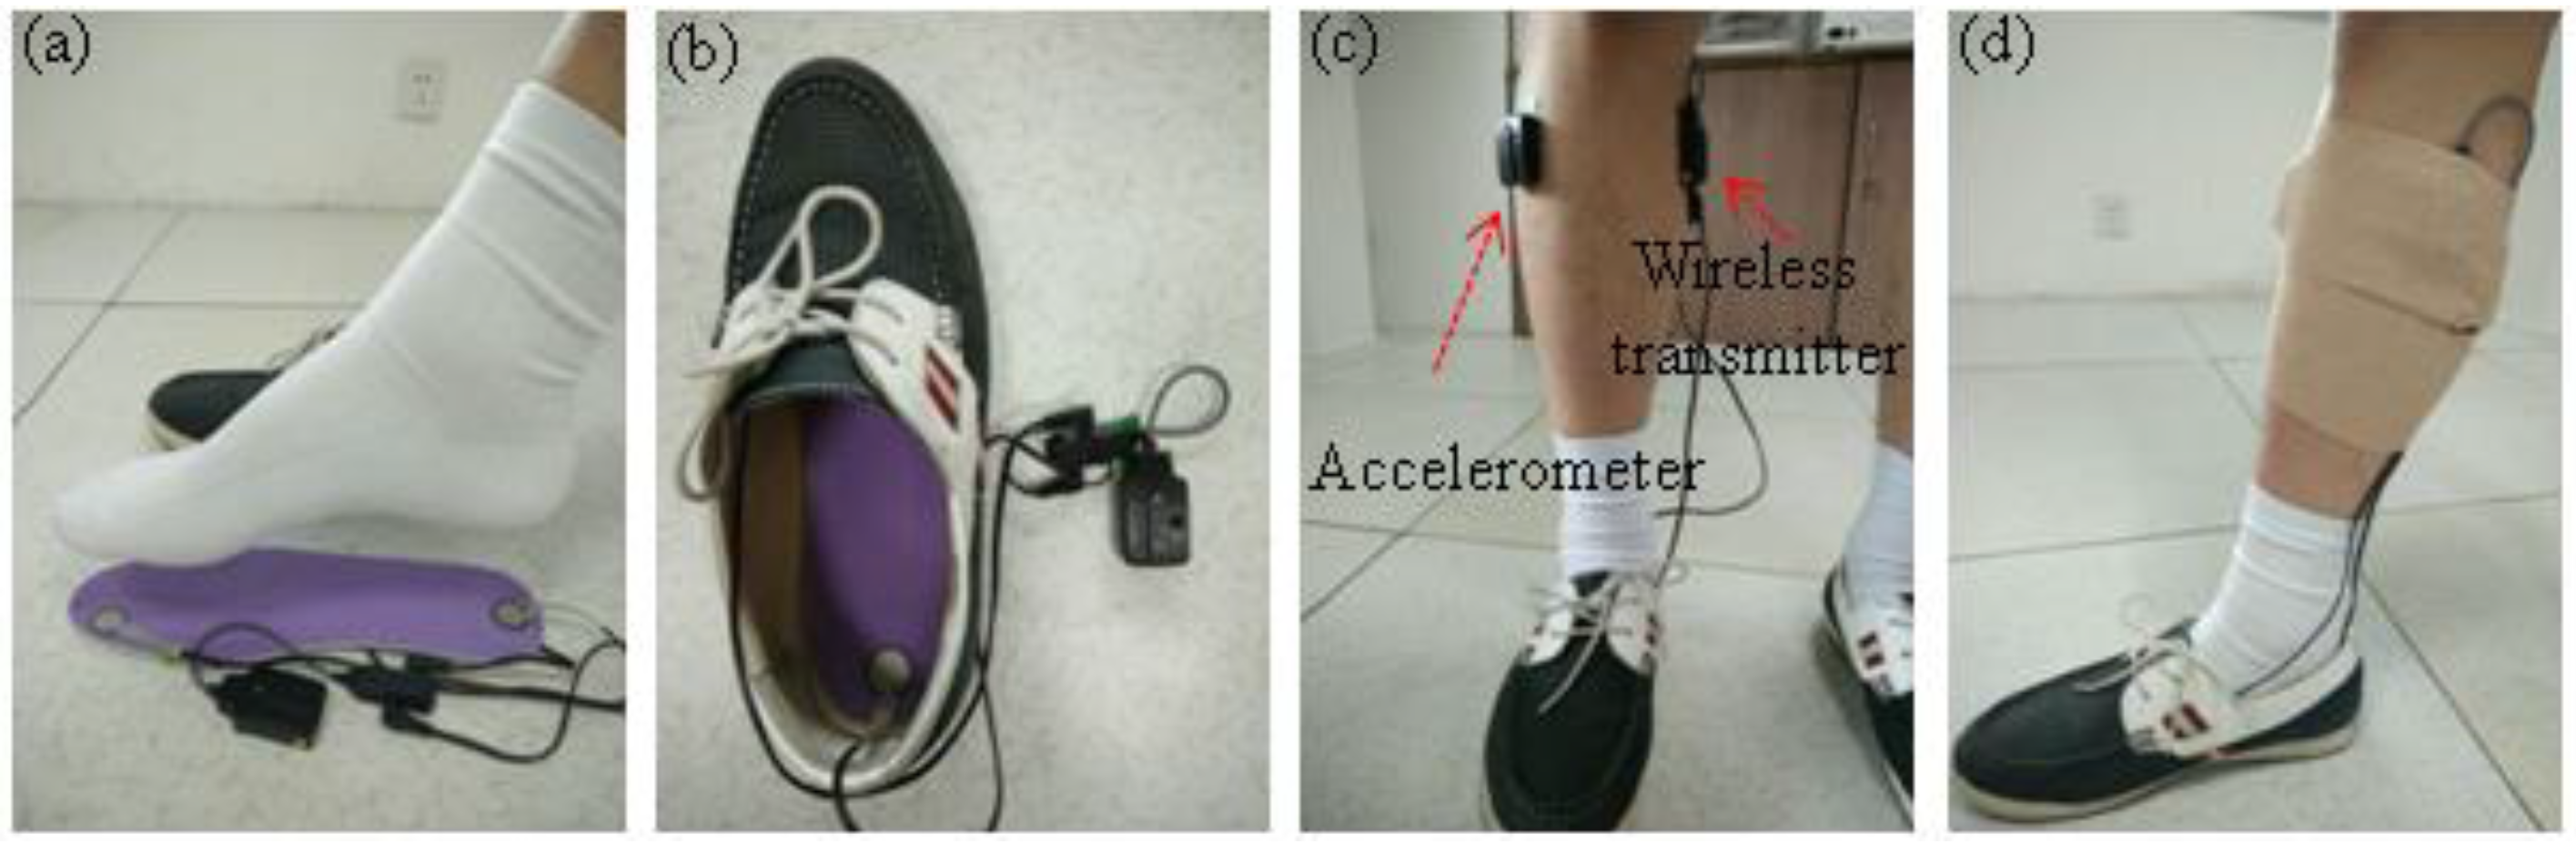
2.3. Instrumentation and Data Acquisition
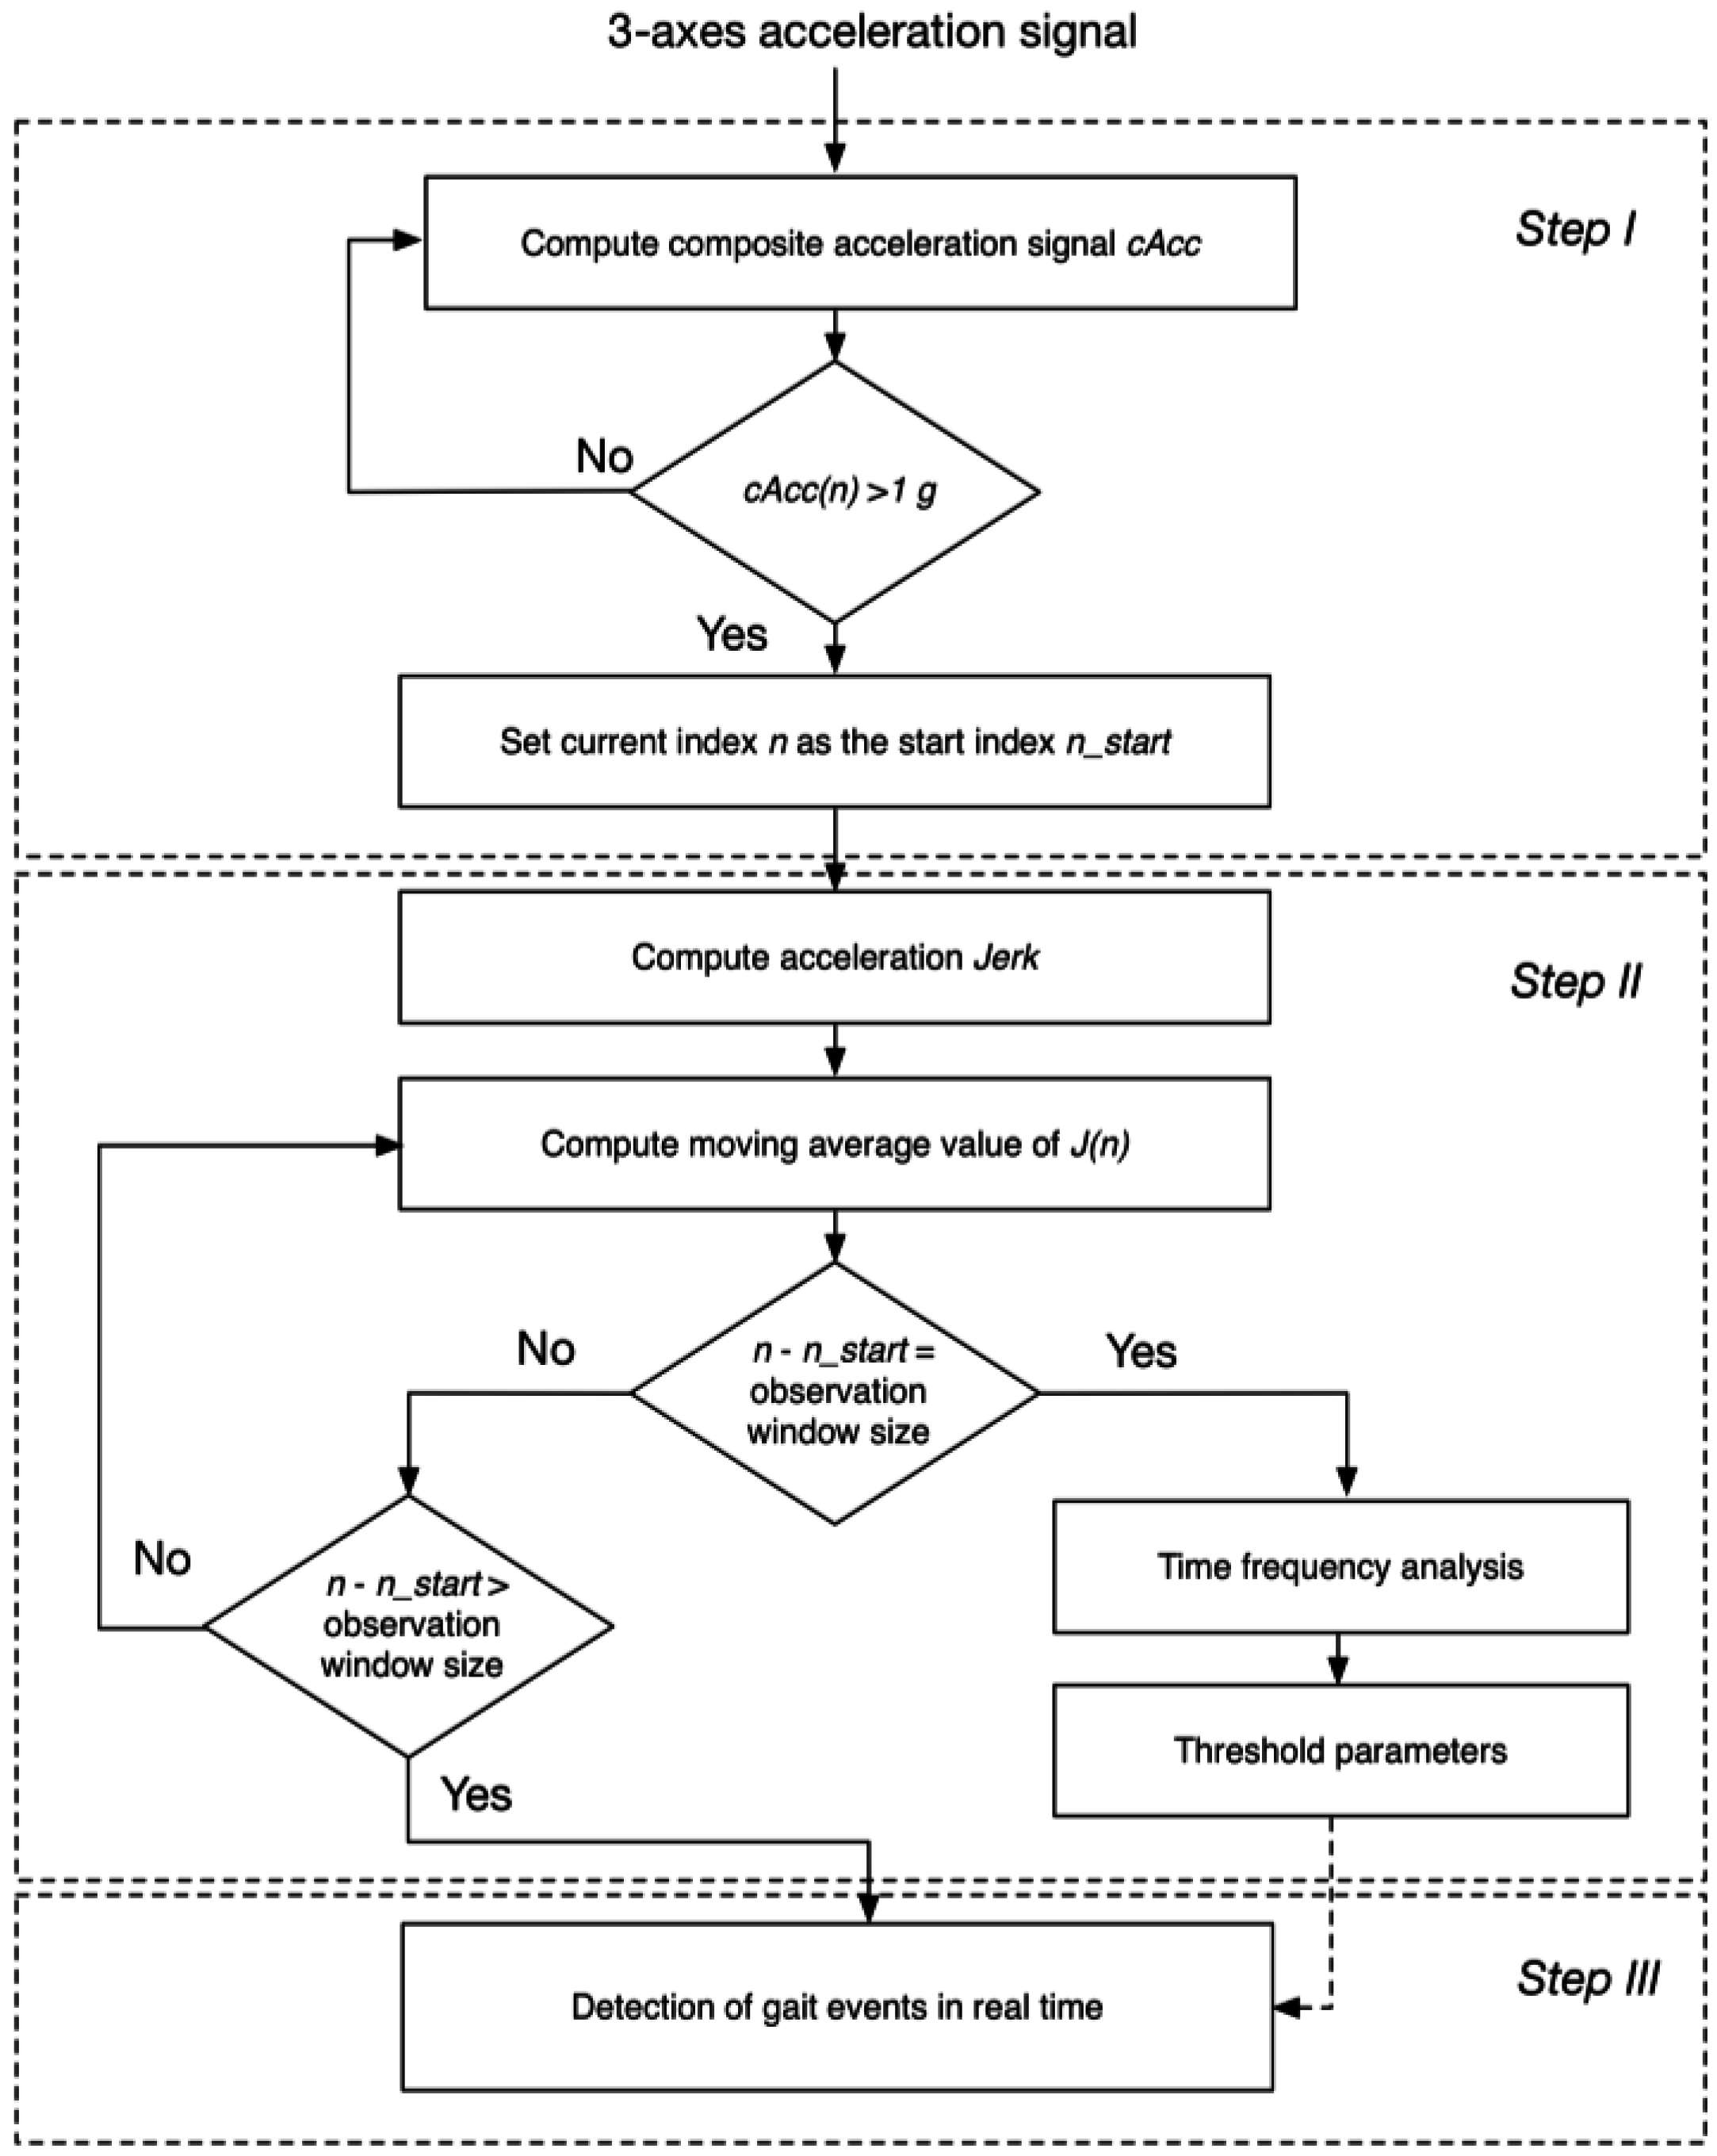
2.4. Proposed Real-Time Detection Algorithm of Gait Events
2.4.1. Identification of the Transition from Rest to Walking
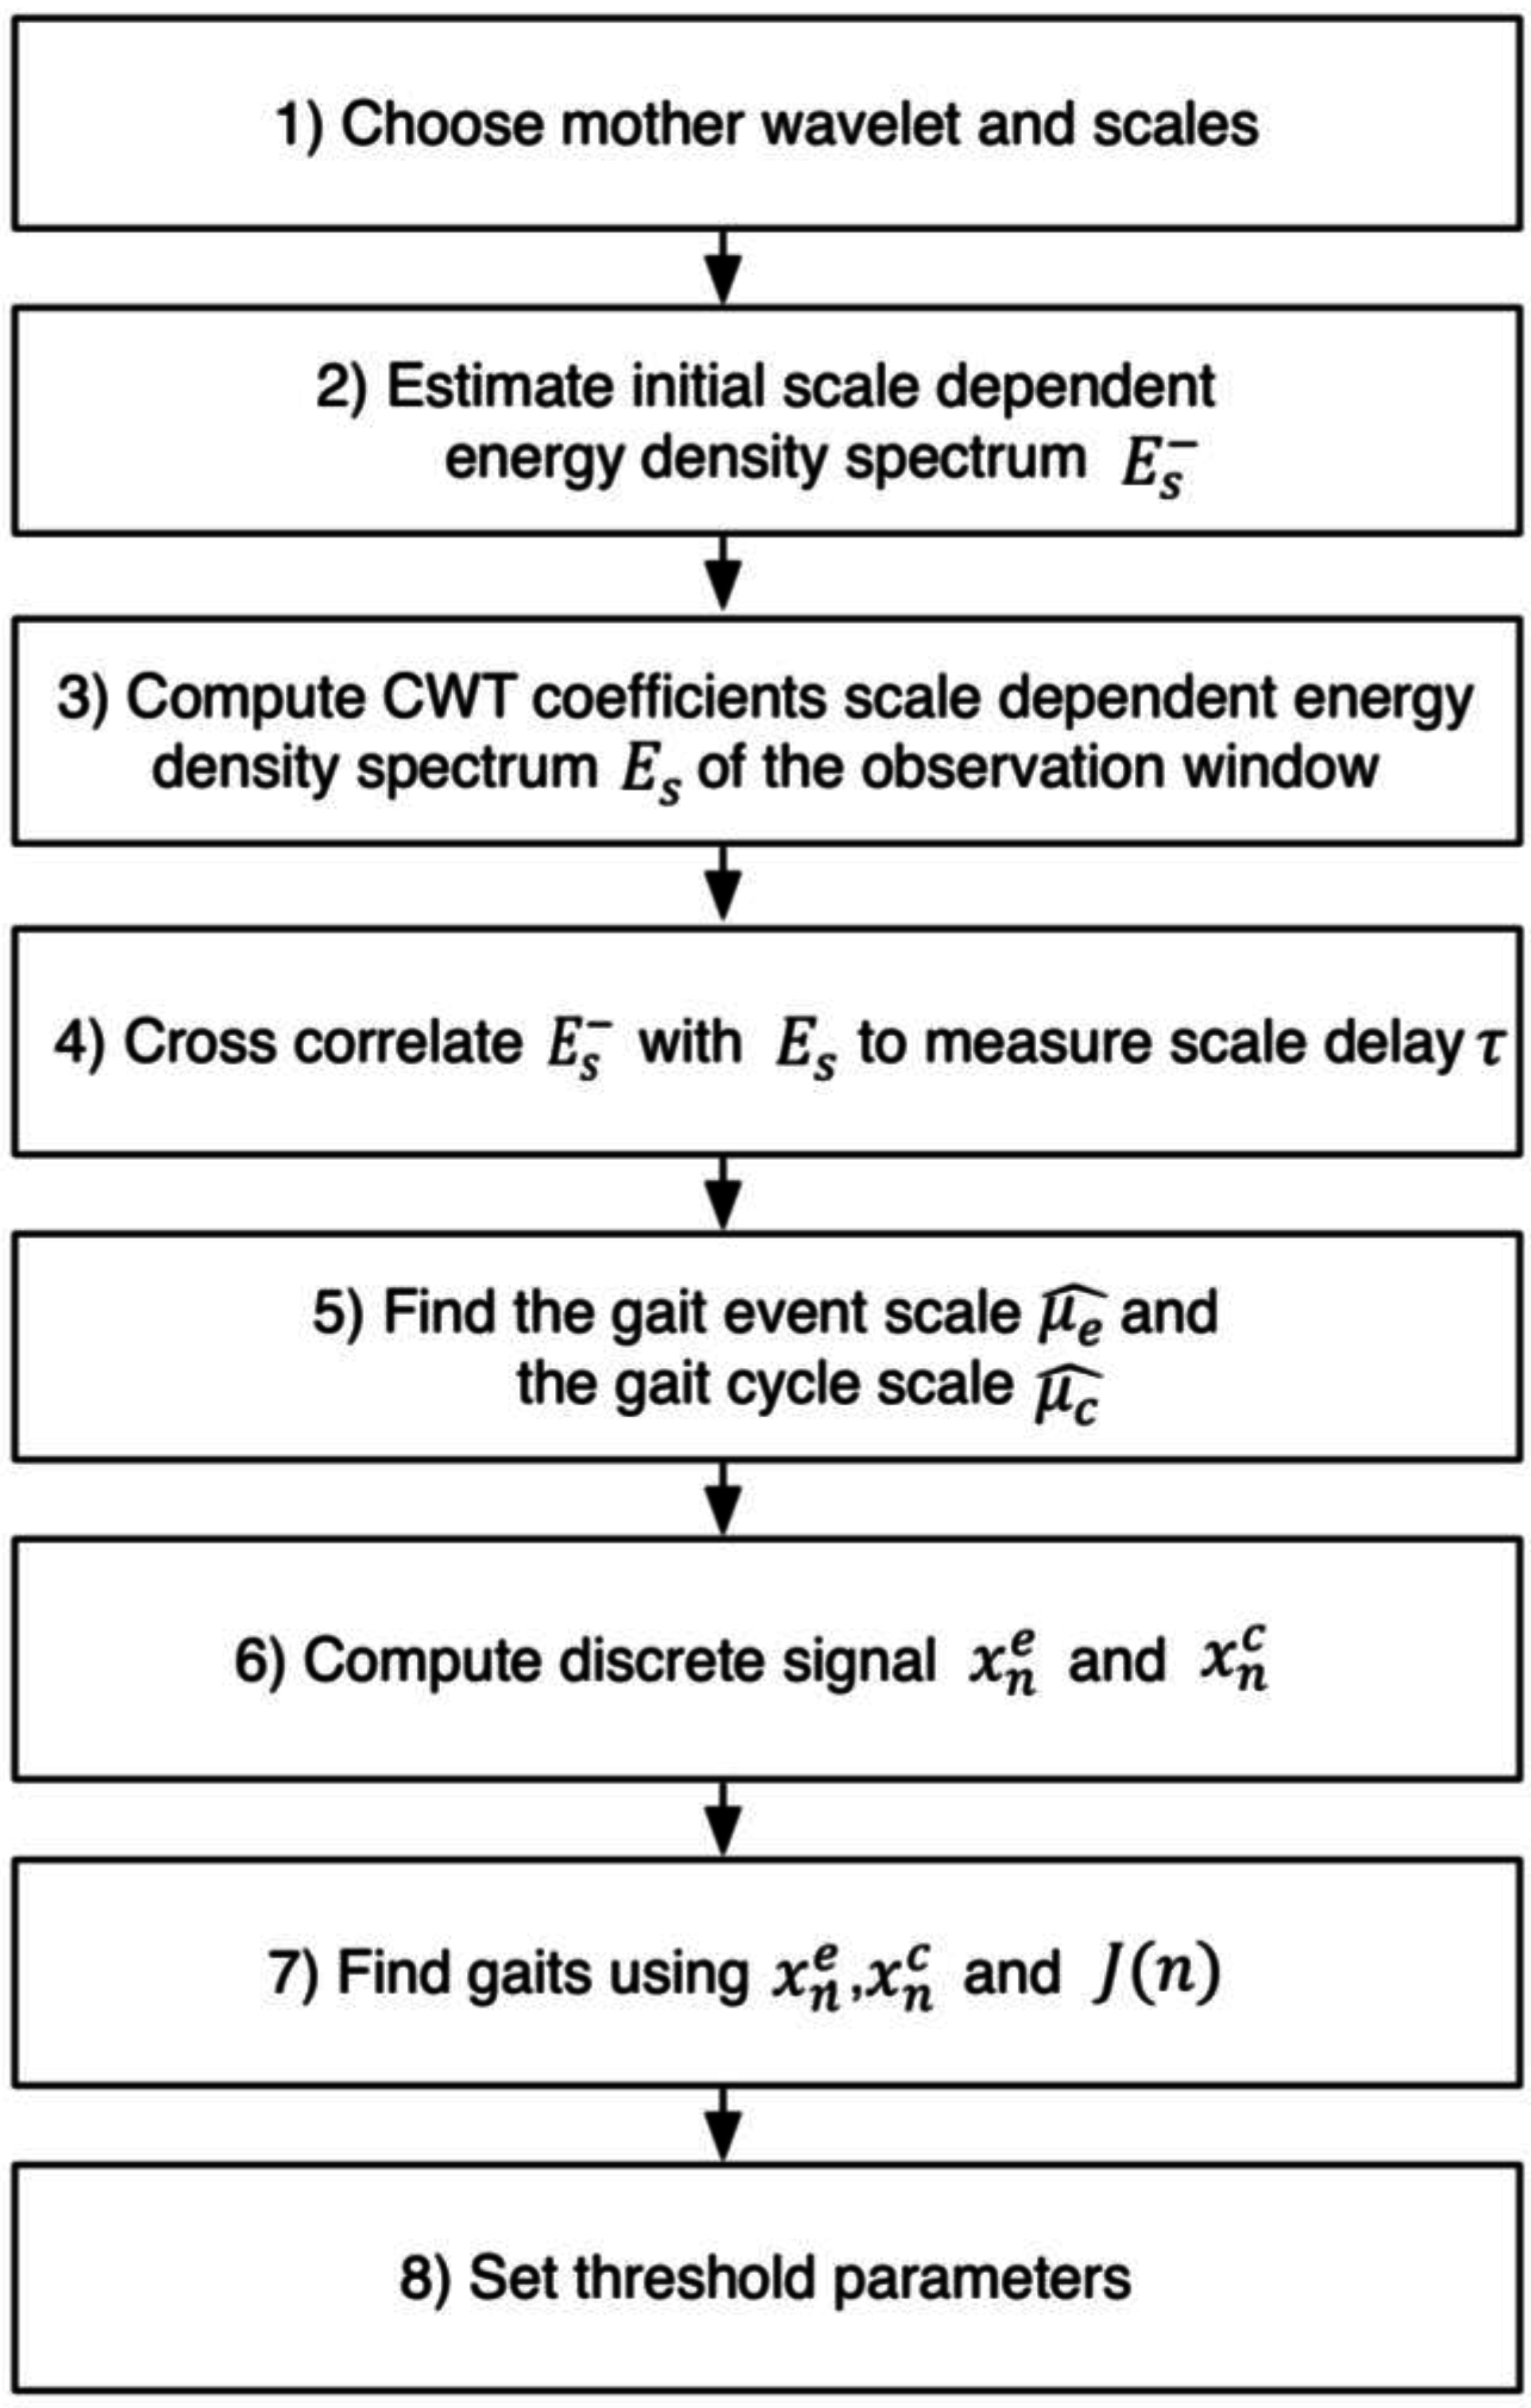
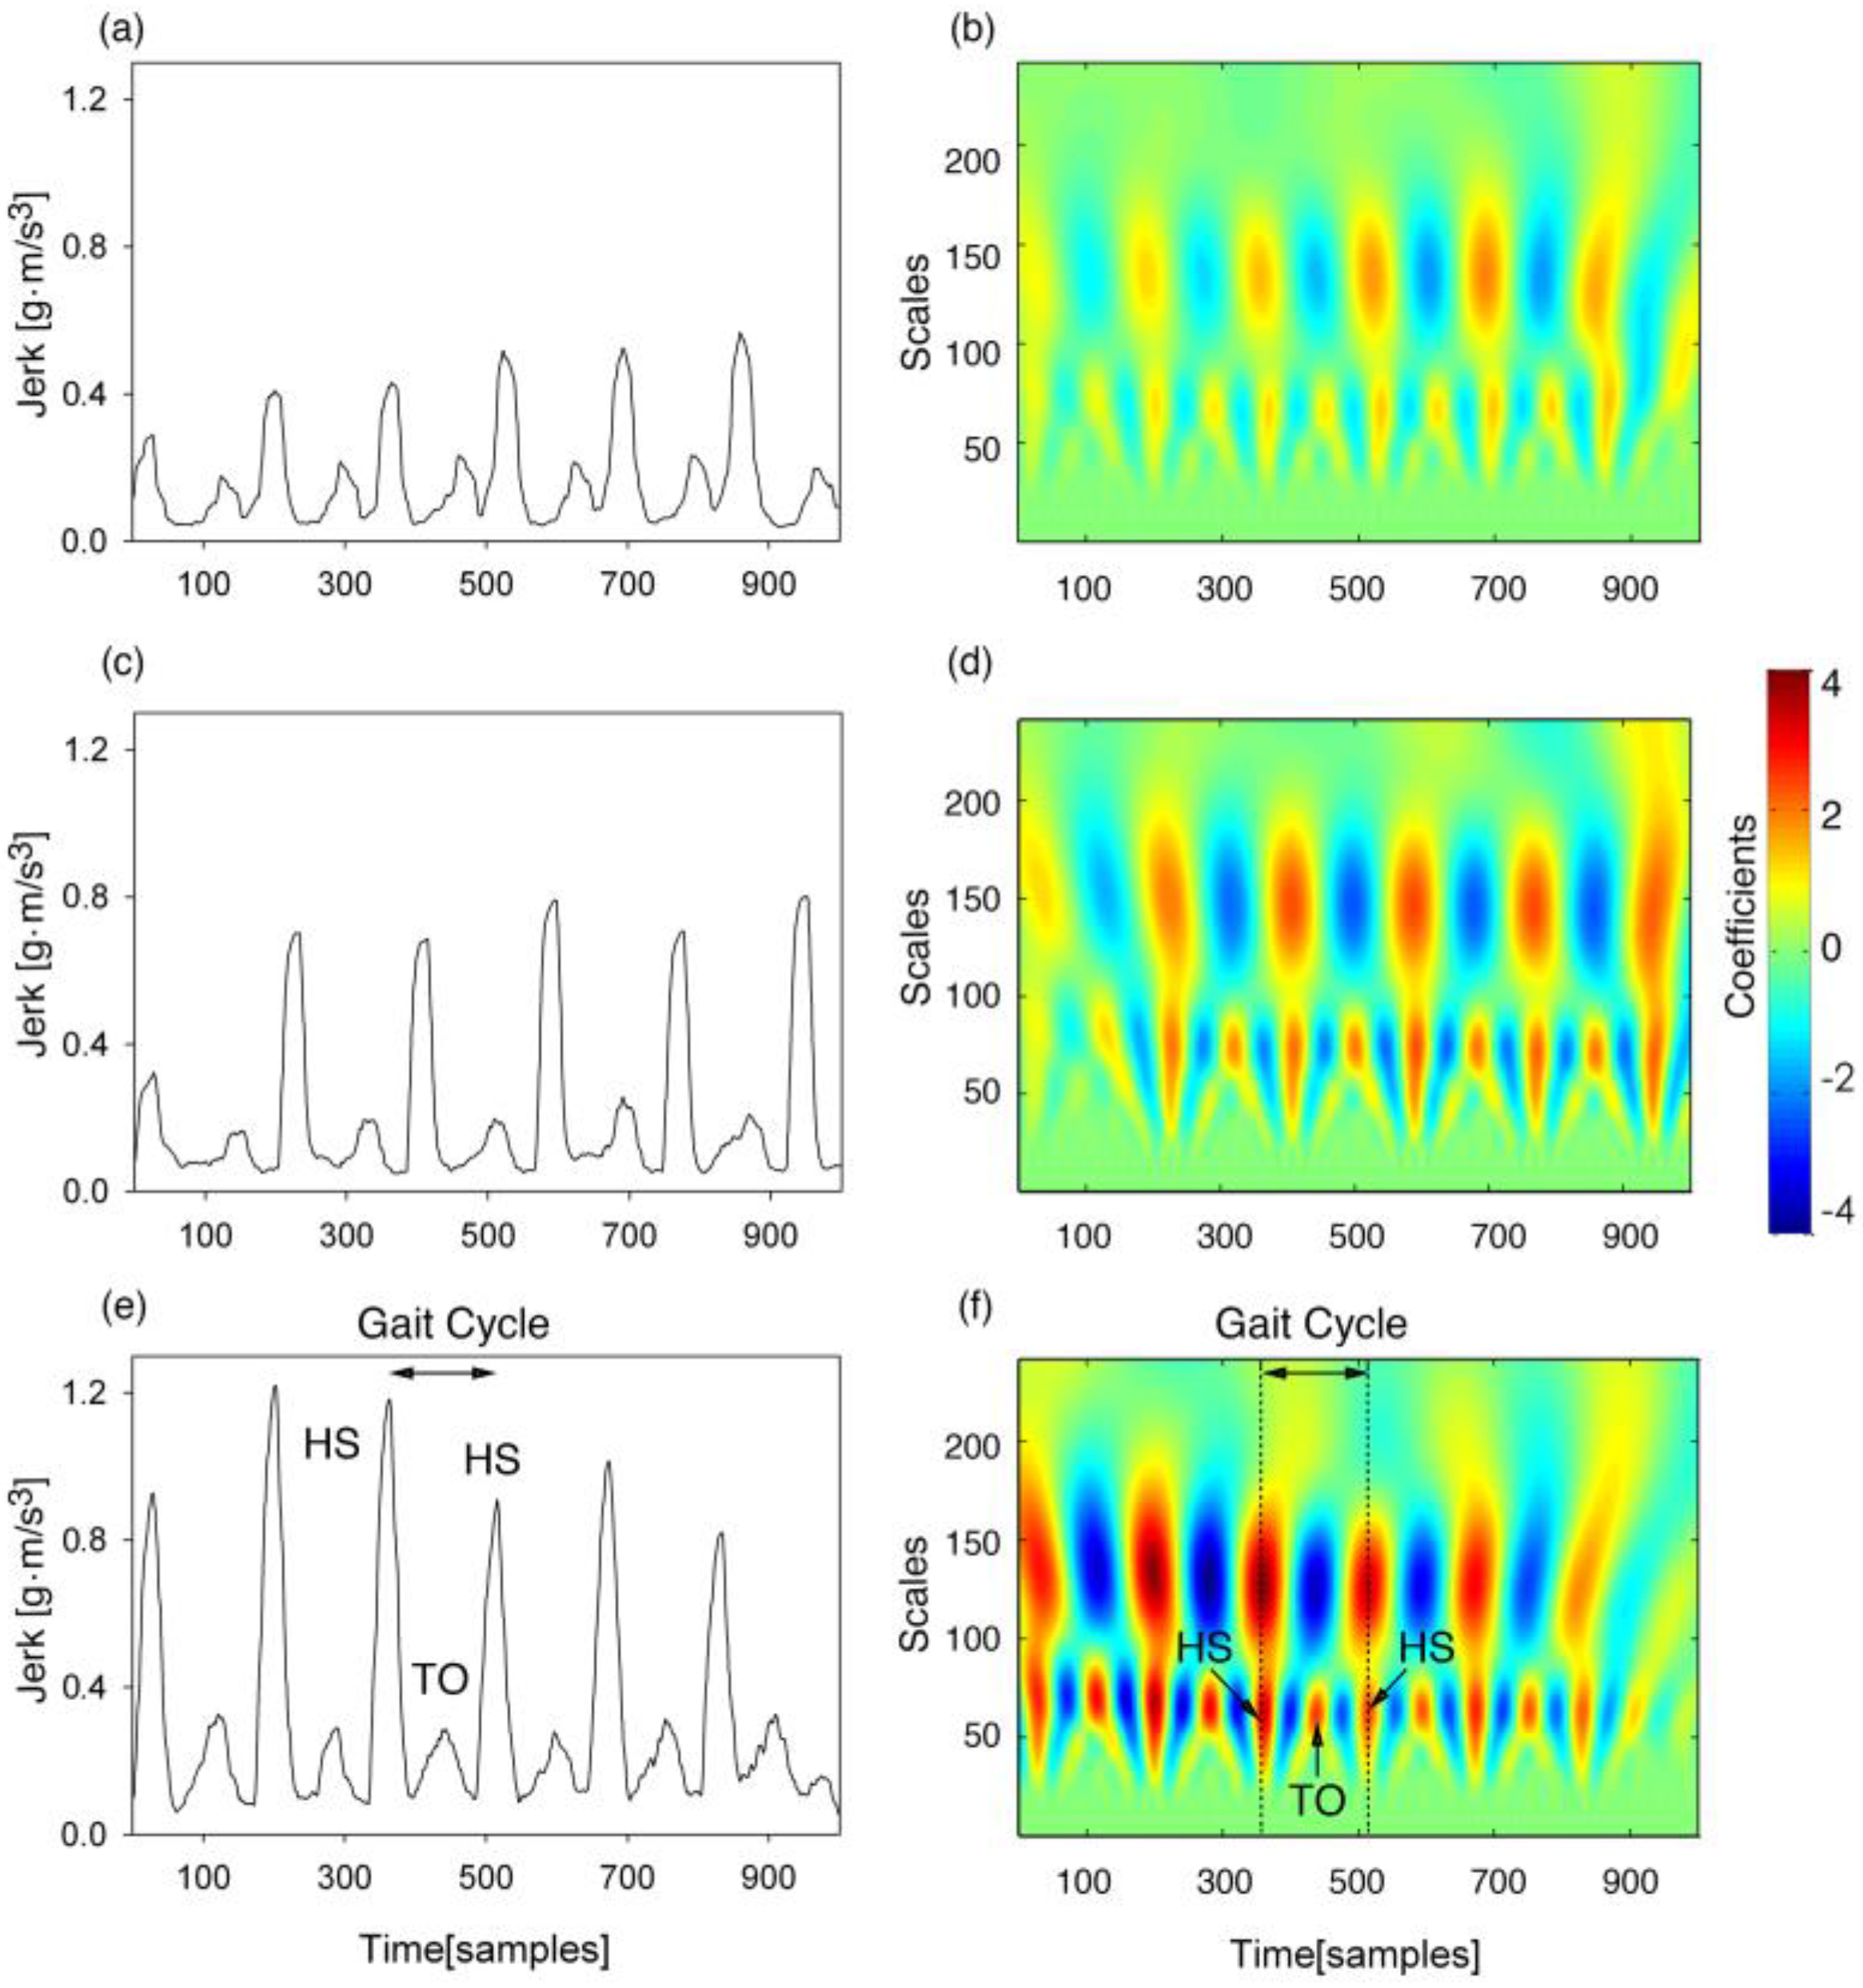
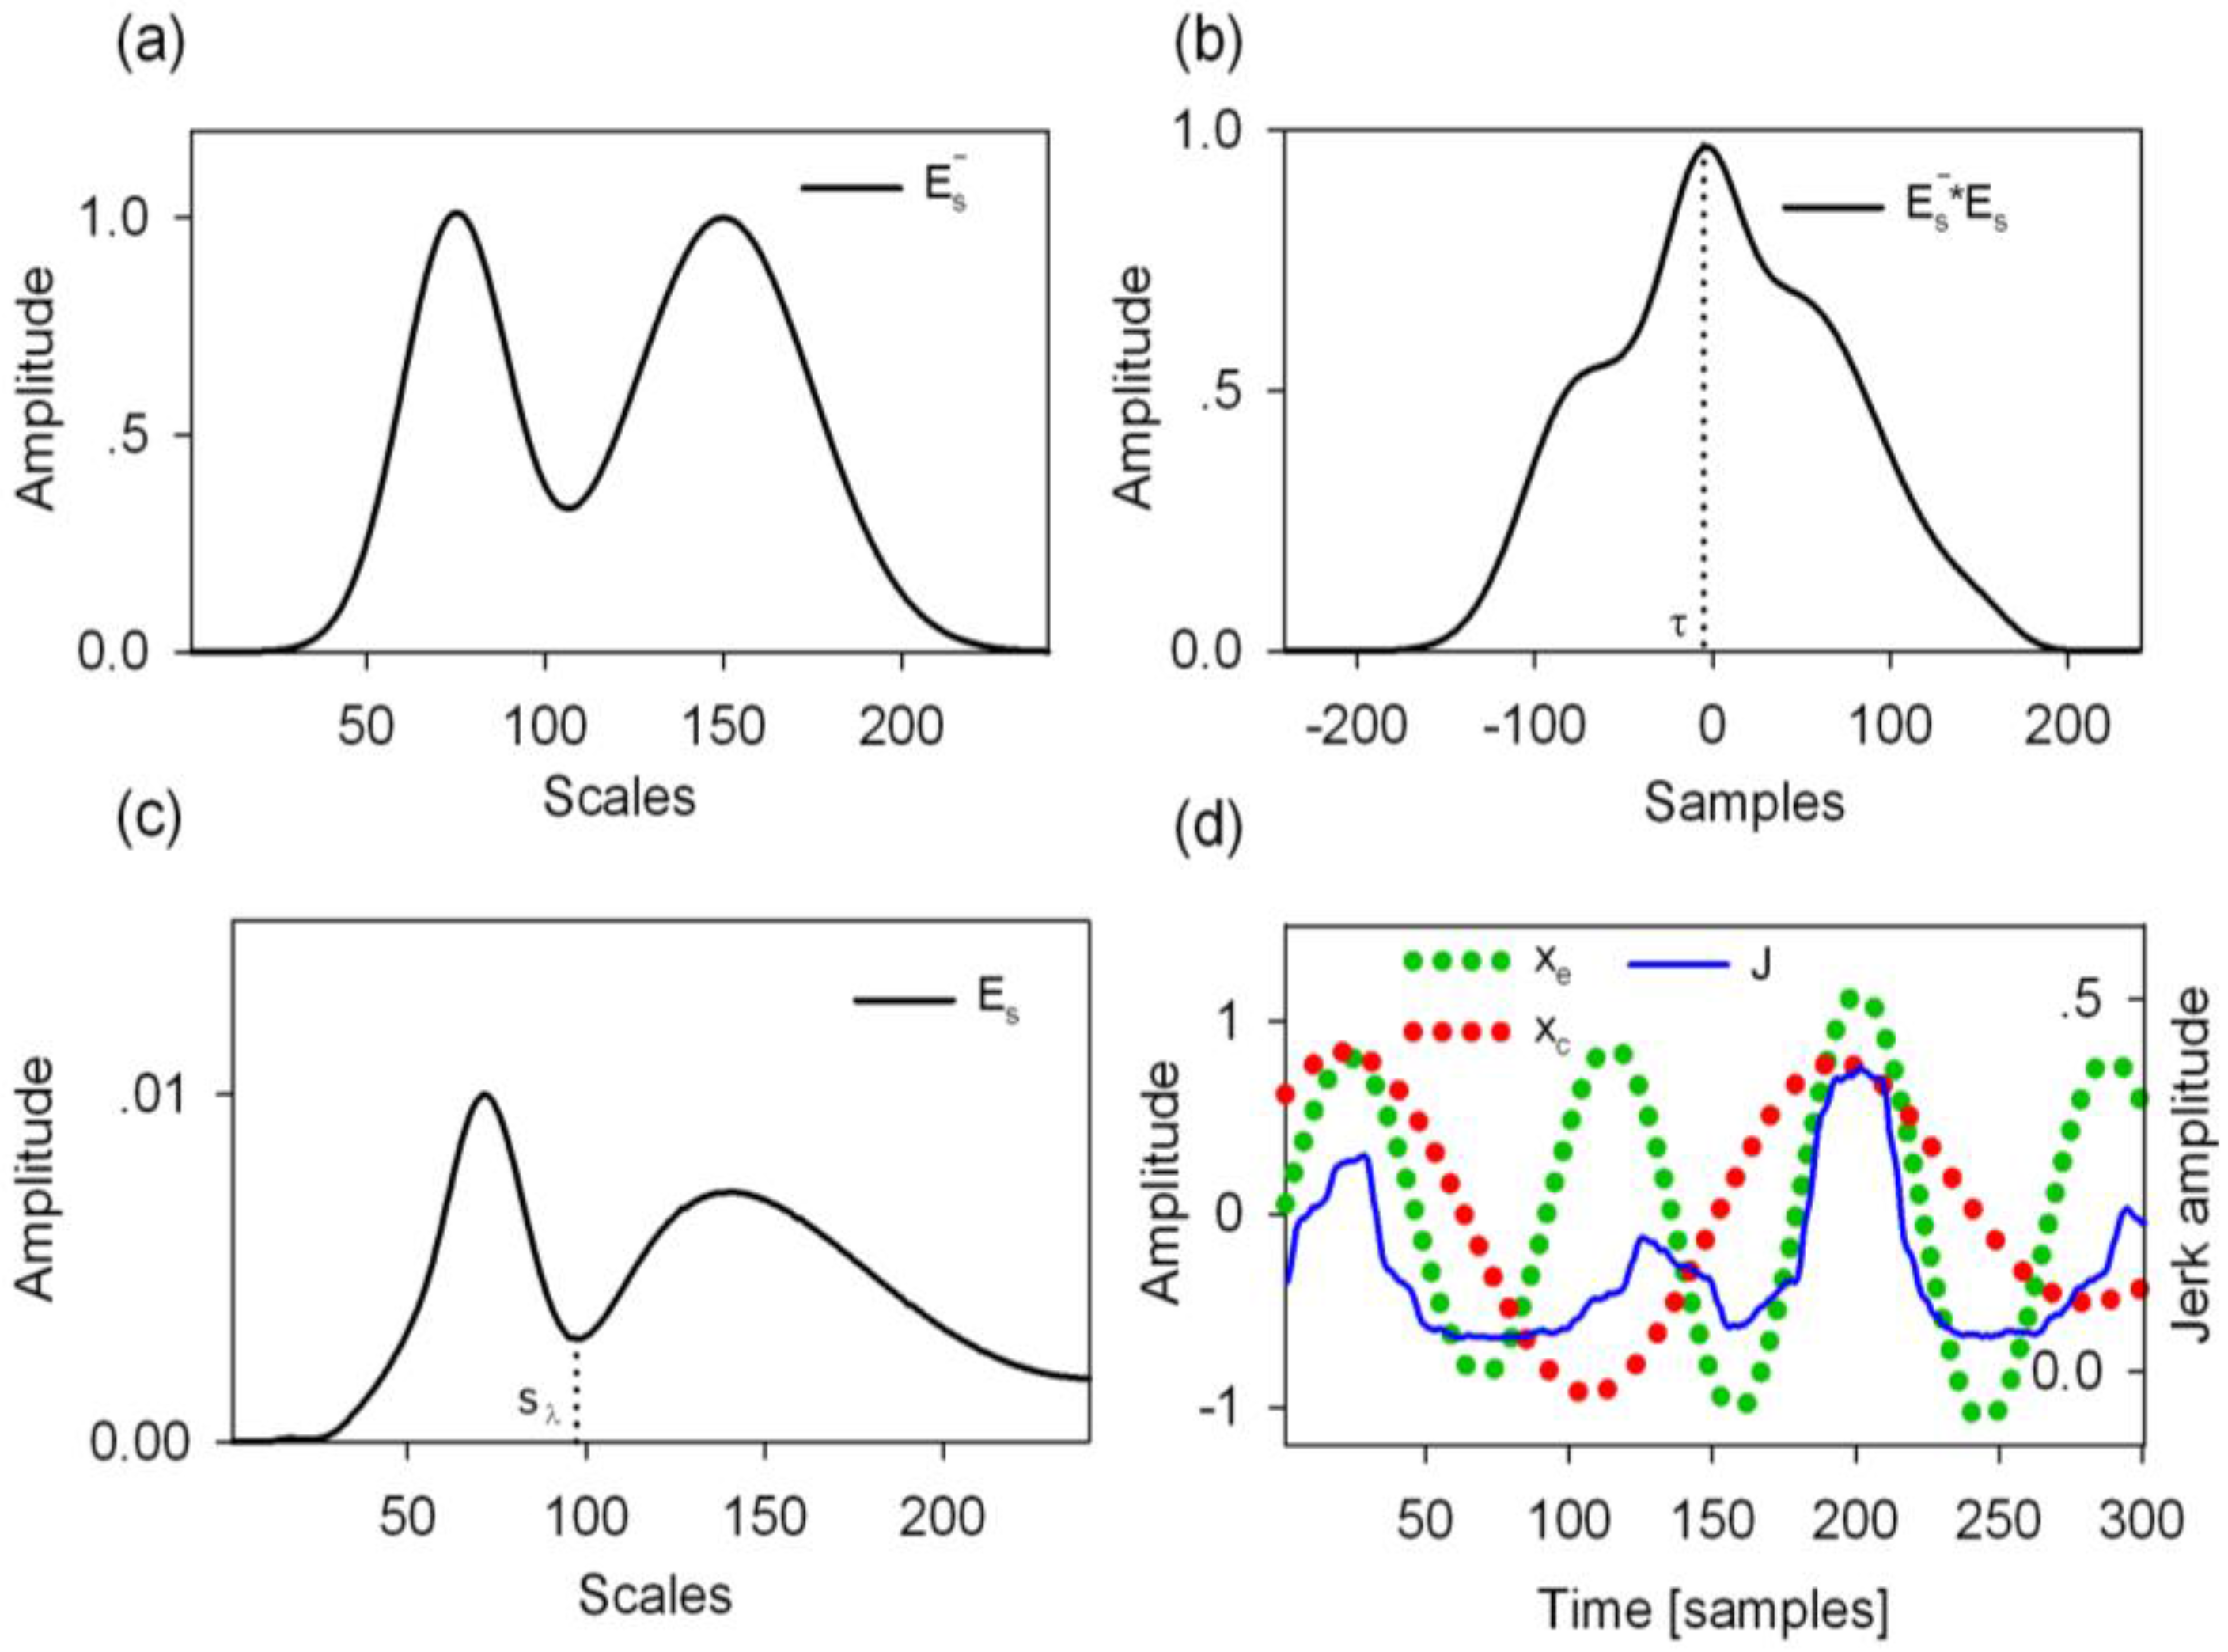
2.4.2. Determination of the Thresholds for the Real-Time Heuristic Algorithm Based on the Time-Frequency Analysis
2.4.3. Detection of Gait Events in Real-Time
2.5. Performance Evaluation of the Proposed Algorithm
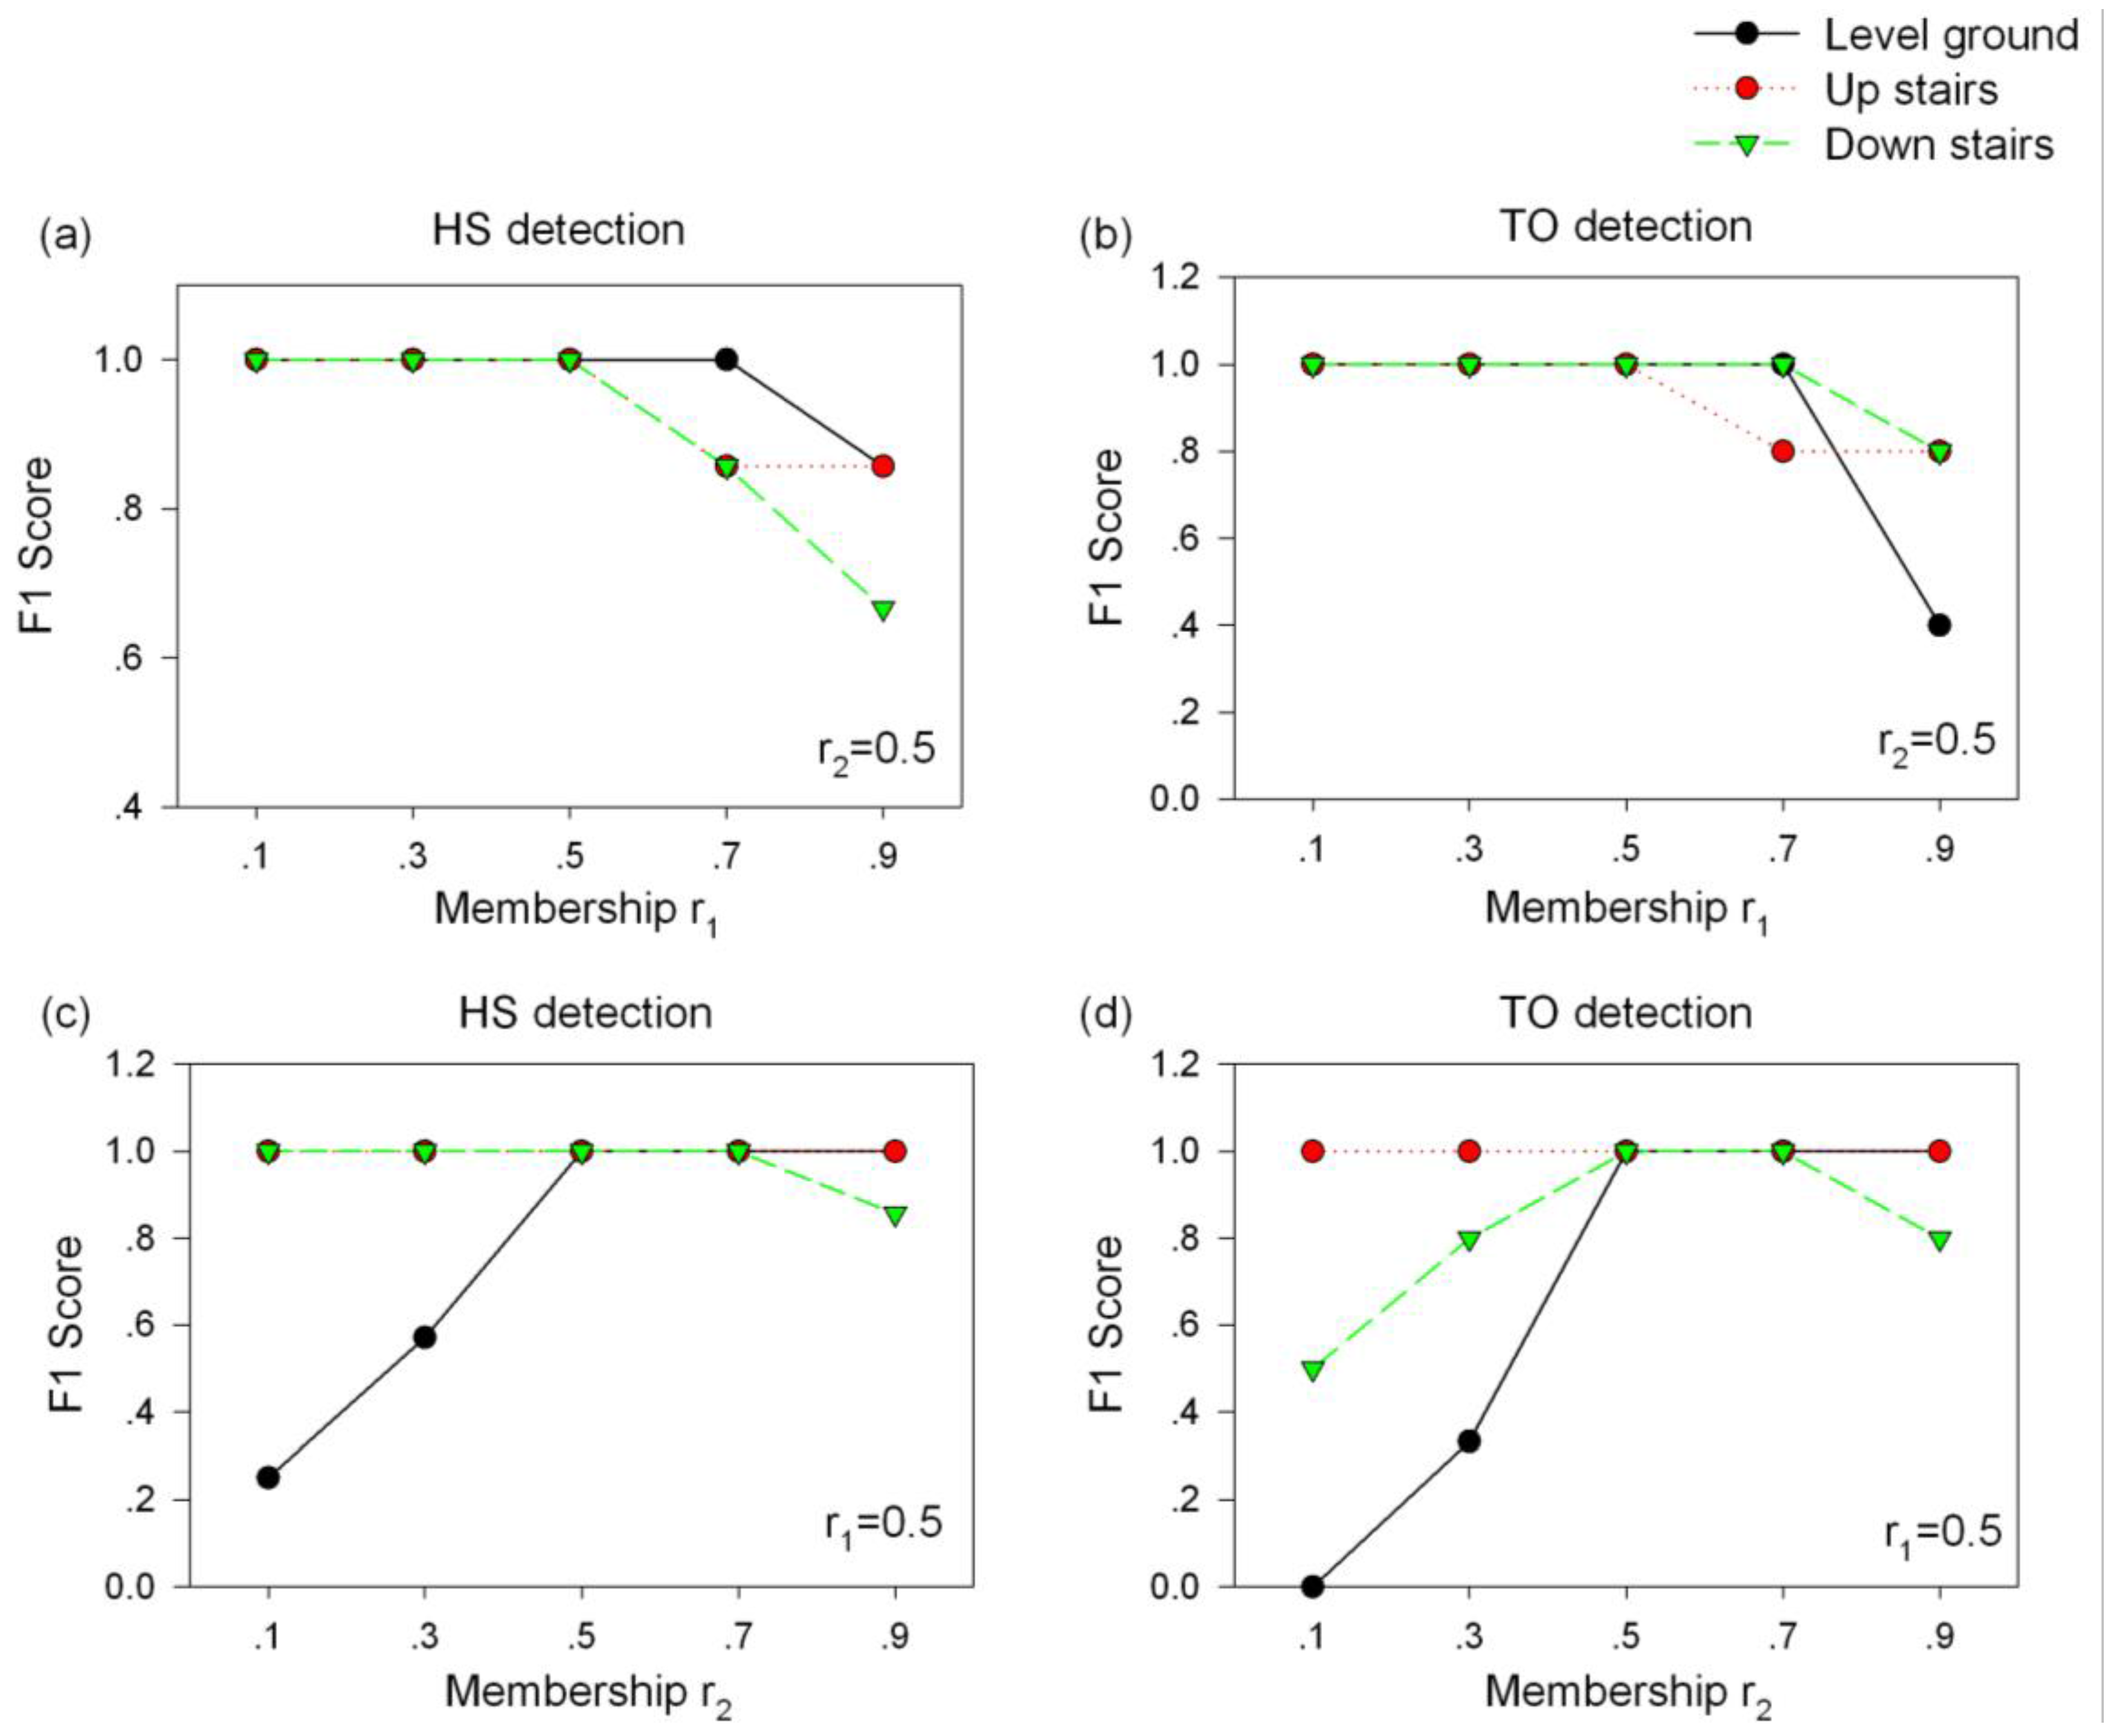
2.6. Parameter Selection
3. Results
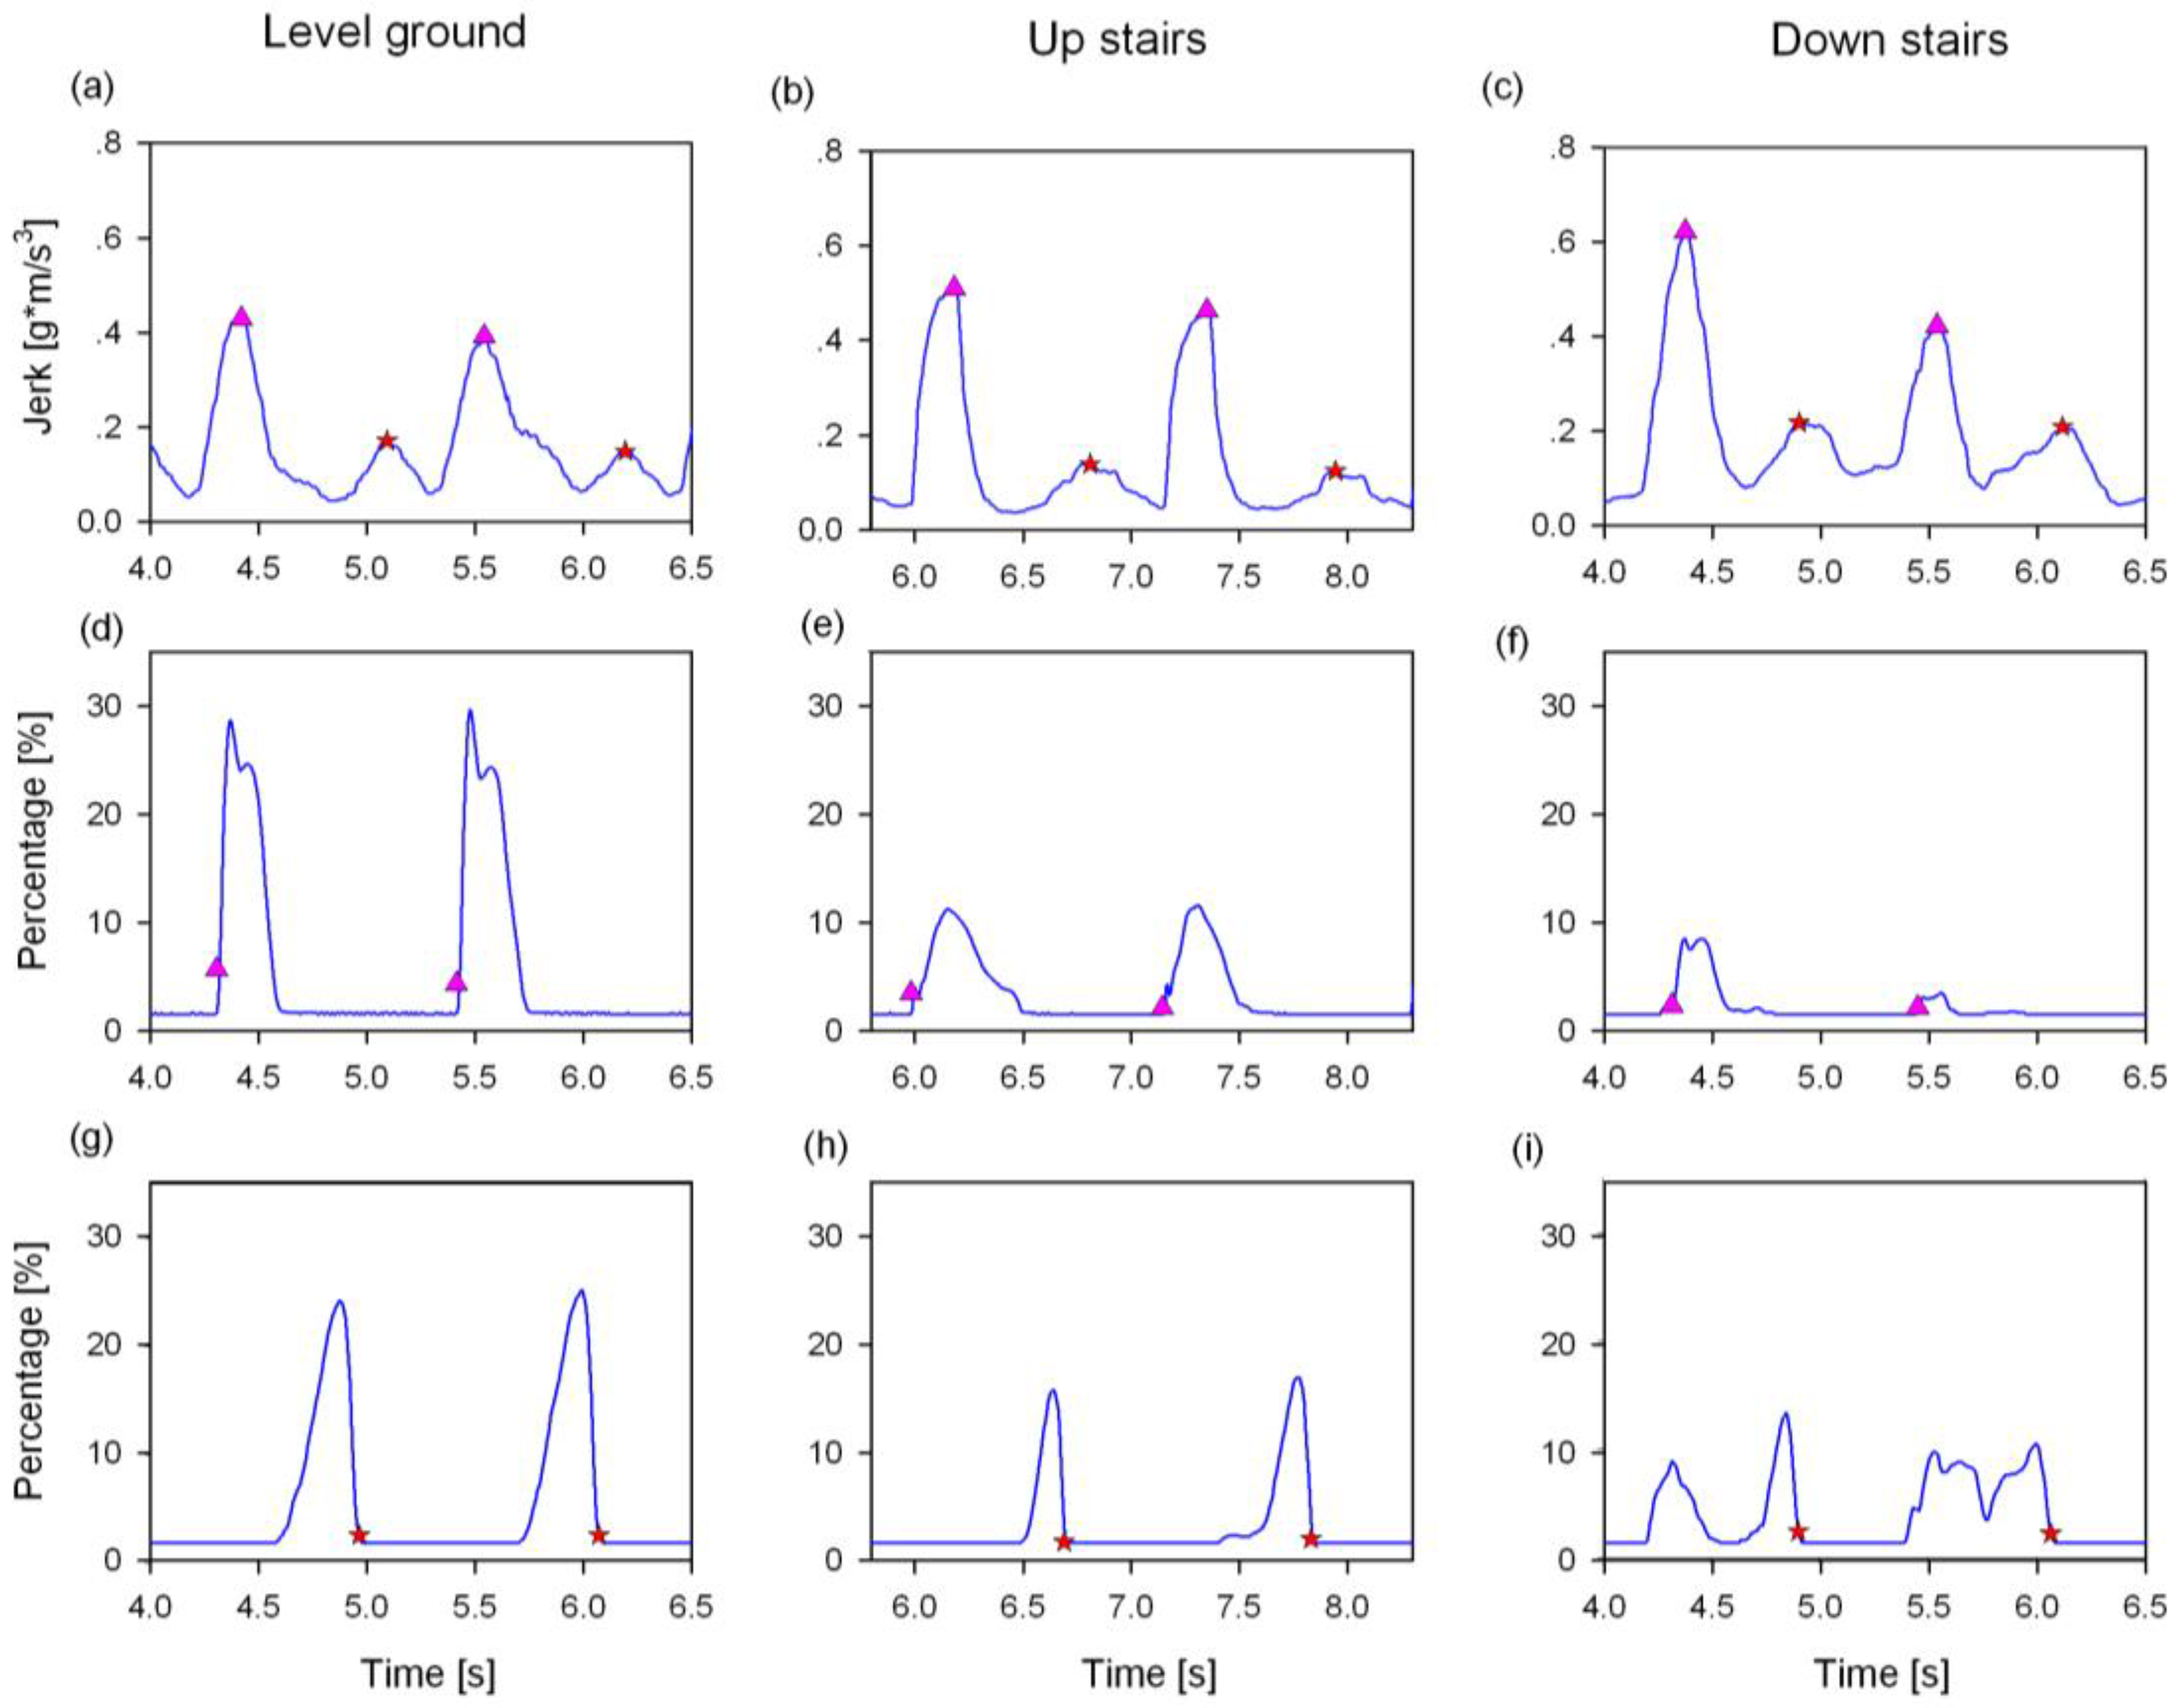
3.1. Gait Event Detection
3.2. Accuracy of Gait Event Detection
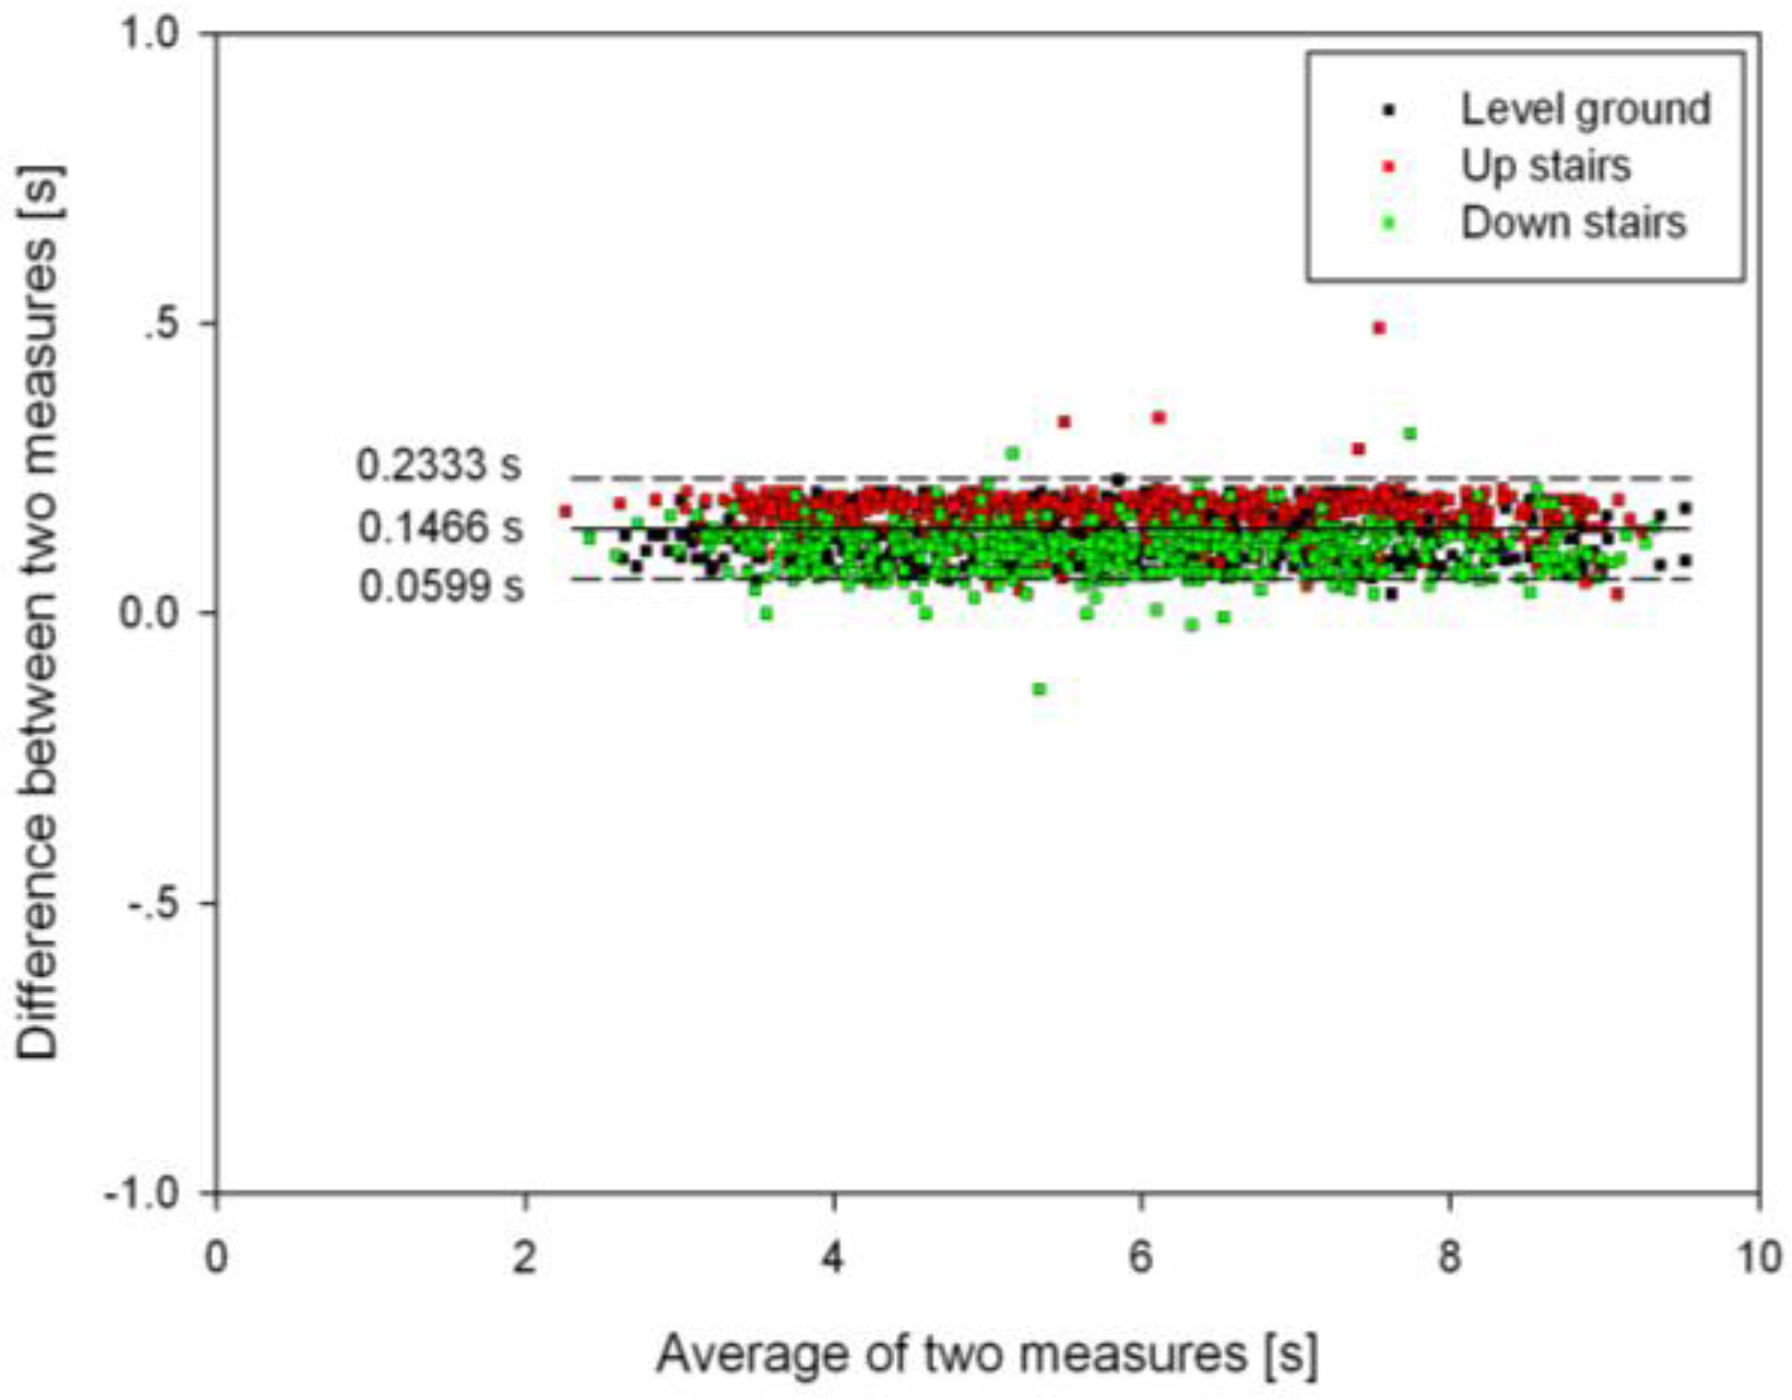
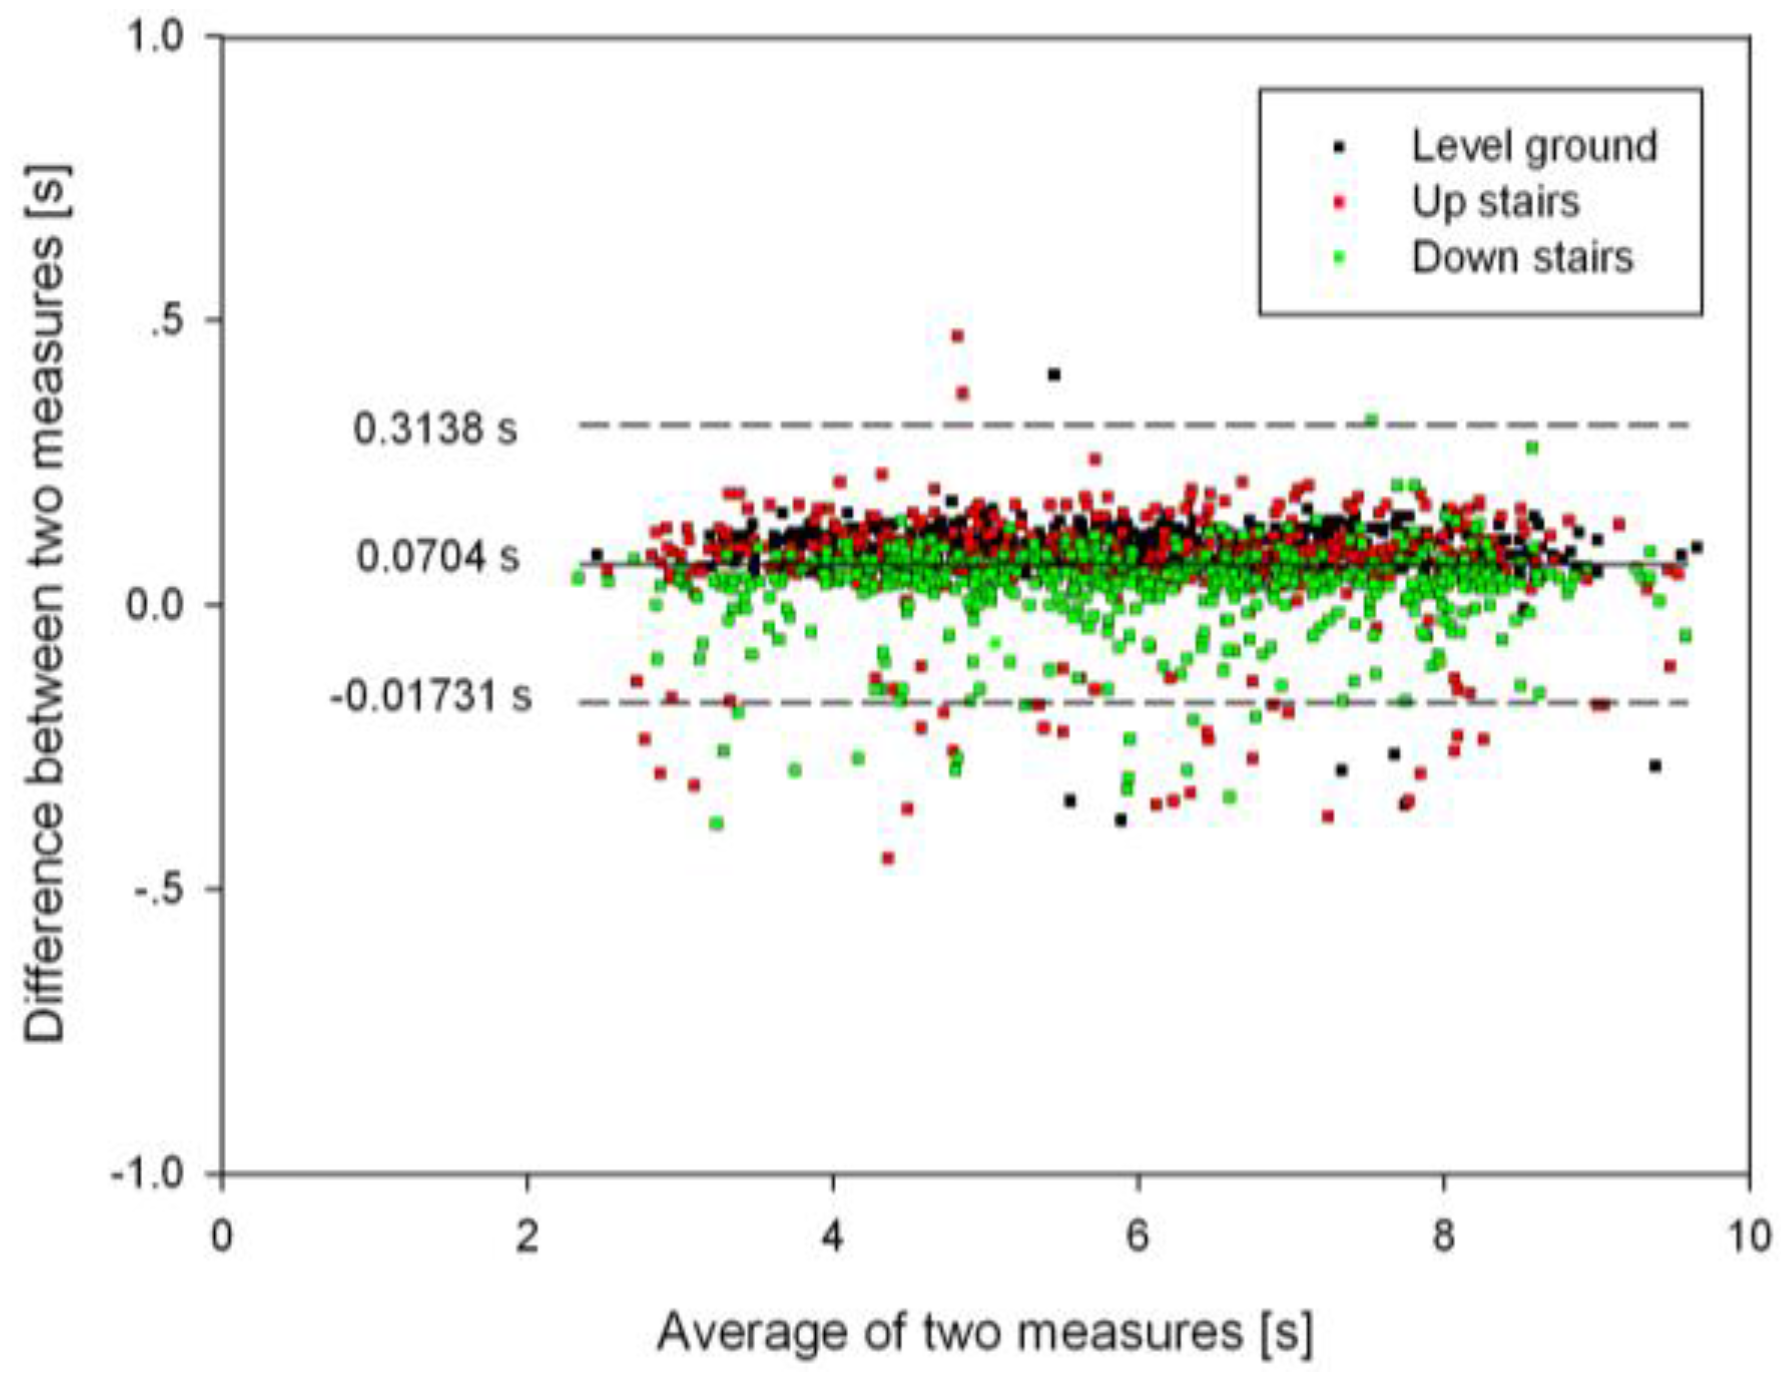
3.3. Timing Agreement between the Proposed Algorithm and FSR Method
3.4. The Comparison of F1 Score with Previous Studies for Stair Terrain
4. Discussion
5. Conclusions
Acknowledgments
Author Contributions
Conflicts of Interest
References
- Mansfield, A.; Lyons, G.M. The use of accelerometry to detect heel contact events for use as a sensor in FES assisted walking. Med. Eng. Phys. 2003, 25, 879–885. [Google Scholar] [CrossRef]
- Kotiadis, D.; Hermens, H.J.; Veltink, P.H. Inertial gait phase detection for control of a drop foot stimulator. Med. Eng. Phys. 2010, 32, 287–297. [Google Scholar] [CrossRef] [PubMed]
- Rueterbories, J.; Spaich, E.G.; Andersen, O.K. Gait event detection for use in FES rehabilitation by radial and tangential foot accelerations. Med. Eng. Phys. 2014, 36, 502–508. [Google Scholar] [CrossRef] [PubMed]
- Skelly, M.M.; Chizeck, H.J. Real-time gait event detection for paraplegic FES walking. IEEE Trans. Neural Syst. Rehabil. Eng. 2001, 9, 59–68. [Google Scholar] [CrossRef] [PubMed]
- Park, Y.L.; Chen, B.R.; Young, D.; Stirling, L.; Wood, R.J.; Goldfield, E.; Nagpal, R. Bio-inspired active soft orthotic device for ankle foot pathologies. In Proceedings of the 2011 IEEE/RSJ International Conference on Intelligent Robots and Systems, San Francisco, CA, USA, 25–30 September 2011; pp. 4488–4495.
- Lopez-Meyer, P.; Fulk, G.D.; Sazonov, E.S. Automatic detection of temporal gait parameters in poststroke individuals. IEEE Trans. Inf. Technol. Biomed. 2011, 15, 594–601. [Google Scholar] [CrossRef] [PubMed]
- El Achkar, C.M.; Lenoble-Hoskovec, C.; Paraschiv-Ionescu, A.; Major, K.; Büla, C.; Aminian, K. Instrumented shoes for activity classification in the elderly. Gait Posture 2016, 44, 12–17. [Google Scholar] [CrossRef] [PubMed]
- Ghoussayni, S.; Stevens, C.; Durham, S.; Ewins, D. Assessment and validation of a simple automated method for the detection of gait events and intervals. Gait Posture 2004, 20, 266–272. [Google Scholar] [CrossRef] [PubMed]
- Mills, P.M.; Barrett, R.S.; Morrison, S. Agreement between footswitch and ground reaction force techniques for identifying gait events: Inter-session repeatability and the effect of walking speed. Gait Posture 2007, 26, 323–326. [Google Scholar] [CrossRef] [PubMed]
- Boutaayamou, M.; Schwartz, C.; Stamatakis, J.; Denoël, V.; Maquet, D.; Forthomme, B.; Croisier, J.-L.; Macq, B.; Verly, J.G.; Garraux, G.; et al. Development and validation of an accelerometer-based method for quantifying gait events. Med. Eng. Phys. 2015, 37, 226–232. [Google Scholar] [CrossRef] [PubMed]
- Rueterbories, J.; Spaich, E.G.; Larsen, B.; Andersen, O.K. Methods for gait event detection and analysis in ambulatory systems. Med. Eng. Phys. 2010, 32, 545–552. [Google Scholar] [CrossRef] [PubMed]
- Liberson, W.T.; Holmquest, H.J.; Scot, D.; Dow, M. Functional electrotherapy: Stimulation of the peroneal nerve synchronized with the swing phase of the gait of hemiplegic patients. Arch. Phys. Med. Rehabil. 1961, 42, 101–105. [Google Scholar] [CrossRef] [PubMed]
- Barrett, C.; Taylor, P. The effects of the odstock drop foot stimulator on perceived quality of life for people with stroke and multiple sclerosis: Effectsofthe odstock drop foot stimulator. Neuromodulation 2010, 13, 58–64. [Google Scholar] [CrossRef] [PubMed]
- Bejarano, N.C.; Ambrosini, E.; Pedrocchi, A.; Ferrigno, G.; Monticone, M.; Ferrante, S. A novel adaptive, real-time algorithm to detect gait events from wearable sensors. IEEE Trans. Neural Syst. Rehabil. Eng. 2015, 23, 413–422. [Google Scholar] [CrossRef] [PubMed]
- González, R.C.; López, A.M.; Rodriguez-Uría, J.; Álvarez, D.; Alvarez, J.C. Real-time gait event detection for normal subjects from lower trunk accelerations. Gait Posture 2010, 31, 322–325. [Google Scholar] [CrossRef] [PubMed]
- Lovse, L.; Bobet, J.; Roy, F.D.; Rolf, R.; Mushahwar, V.K.; Stein, R.B. External sensors for detecting the activation and deactivation times of the major muscles used in walking. IEEE Trans. Neural Syst. Rehabil. Eng. 2012, 20, 488–498. [Google Scholar] [CrossRef] [PubMed]
- Pappas, I.P.I.; Keller, T.; Mangold, S.; Popovic, M.; Dietz, V.; Morari, M. A reliable gyroscope-based gait-phase detection sensor embedded in a shoe insole. IEEE Sens. J. 2004, 4, 268–274. [Google Scholar] [CrossRef]
- Greene, B.R.; McGrath, D.; O’Neill, R.; O’Donovan, K.J.; Burns, A.; Caulfield, B. An adaptive gyroscope-based algorithm for temporal gait analysis. Med. Biol. Eng. Comput. 2010, 48, 1251–1260. [Google Scholar] [CrossRef] [PubMed]
- Bötzel, K.; Marti, F.M.; Rodríguez, M.Á.C.; Plate, A.; Vicente, A.O. Gait recording with inertial sensors—How to determine initial and terminal contact. J. Biomech. 2016, 49, 332–337. [Google Scholar] [CrossRef] [PubMed]
- Khandelwal, S.; Wickstrom, N. Gait event detection in real-world environment for long-term applications: Incorporating domain knowledge into time-frequency analysis. IEEE Trans. Neural Syst. Rehabil. Eng. 2016, PP, 1–6. [Google Scholar] [CrossRef] [PubMed]
- Sheehan, R.C.; Gottschall, J.S. Stair walking transitions are an anticipation of the next stride. J. Electromyogr. Kinesiol. 2011, 21, 533–541. [Google Scholar] [CrossRef] [PubMed]
- Au, S.; Berniker, M.; Herr, H. Powered ankle-foot prosthesis to assist level-ground and stair-descent gaits. Neural Netw. 2008, 21, 654–666. [Google Scholar] [CrossRef] [PubMed]
- Goršič, M.; Kamnik, R.; Ambrožič, L.; Vitiello, N.; Lefeber, D.; Pasquini, G.; Munih, M. Online phase detection using wearable sensors for walking with a robotic prosthesis. Sensors 2014, 14, 2776–2794. [Google Scholar] [CrossRef] [PubMed]
- Sant’Anna, A.; Wickström, N. A symbol-based approach to gait analysis from acceleration signals: Identification and detection of gait events and a new measure of gait symmetry. IEEE Trans. Inf. Technol. Biomed. 2010, 14, 1180–1187. [Google Scholar] [CrossRef] [PubMed]
- Similä, H.; Immonen, M.; Merilahti, J.; Petäkoski-Hult, T. Gait analysis and estimation of changes in fall risk factors. In Proceedings of the 2015 37th Annual International Conference of the IEEE Engineering in Medicine and Biology Society (EMBC), Milan, Italy, 25–29 August 2015; pp. 6939–6942.
- Addison, P.S.; Walker, J.; Guido, R.C. Time—Frequency analysis of biosignals. IEEE Eng. Med. Biol. Mag. 2009, 28, 14–29. [Google Scholar] [CrossRef] [PubMed]
- Aung, M.S.H.; Thies, S.B.; Kenney, L.P.J.; Howard, D.; Selles, R.W.; Findlow, A.H.; Goulermas, J.Y. Automated detection of instantaneous gait events using time frequency analysis and manifold embedding. IEEE Trans. Neural Syst. Rehabil. Eng. 2013, 21, 908–916. [Google Scholar] [CrossRef] [PubMed]
- Rezvanian, S.; Lockhart, T. Towards real-time detection of freezing of gait using wavelet transform on wireless accelerometer data. Sensors 2016, 16, 475. [Google Scholar] [CrossRef] [PubMed]
- Khandelwal, S.; Wickström, N. Identification of gait events using expert knowledge and continuous wavelet transform analysis. In Proceedings of the International Conference on Bio-Inspired Systems and Signal Processing, Angers, France, 3–6 March 2014; pp. 197–204.
- Formento, P.; Acevedo, R.; Ghoussayni, S.; Ewins, D. Gait event detection during stair walking using a rate gyroscope. Sensors 2014, 14, 5470–5485. [Google Scholar] [CrossRef] [PubMed]
- Catalfamo, P.; Ghoussayni, S.; Ewins, D. Gait event detection on level ground and incline walking using a rate gyroscope. Sensors 2010, 10, 5683–5702. [Google Scholar] [CrossRef] [PubMed]
- Khandelwal, S.; Wickström, N. Detecting gait events from outdoor accelerometer data for long-term and continuous monitoring applications. In Proceedings of the 13th International Symposium on 3D Analysis of Human Movement (3D-AHM 2014), Lausanne, Switzerland, 14–17 July 2014; pp. 151–154.


| Accuracy | Level Ground | Upstairs | Downstairs | |||
|---|---|---|---|---|---|---|
| ACC | FSR | ACC | FSR | ACC | FSR | |
| P | 1.00 ± 0.00 | 1.00 ± 0.00 | 0.99 ± 0.04 | 0.99 ± 0.08 | 0.98 ± 0.02 | 0.97 ± 0.03 |
| R | 0.99 ± 0.02 | 1.00 ± 0.00 | 0.99 ± 0.04 | 0.99 ± 0.02 | 0.98 ± 0.02 | 0.97 ± 0.11 |
| F1 | 1.00 ± 0.01 | 1.00 ± 0.00 | 0.99 ± 0.04 | 0.99 ± 0.02 | 0.98 ± 0.02 | 0.97 ± 0.07 |
| Accuracy | Level Ground | Upstairs | Downstairs | |||
|---|---|---|---|---|---|---|
| ACC | FSR | ACC | FSR | ACC | FSR | |
| P | 0.99 ± 0.02 | 1.00 ± 0.01 | 0.95 ± 0.09 | 0.93 ± 0.08 | 0.99 ± 0.02 | 0.98 ± 0.03 |
| R | 0.98 ± 0.03 | 1.00 ± 0.01 | 0.95 ± 0.09 | 0.92 ± 0.08 | 0.99 ± 0.02 | 0.92 ± 0.03 |
| F1 | 0.99 ± 0.02 | 1.00 ± 0.01 | 0.95 ± 0.09 | 0.92 ± 0.08 | 0.99 ± 0.02 | 0.94 ± 0.03 |
| Gait Event | Level Ground | Upstairs | Downstairs | ||||||
|---|---|---|---|---|---|---|---|---|---|
| AMD | MD | CI | AMD | MD | CI | AMD | MD | CI | |
| HS | 137.4 ± 41.2 | 137.4 ± 41.2 | [133.6, 141.2] | 173.9 ± 35.6 | 173.9 ± 35.6 | [171, 176.8] | 119.6 ± 36.2 | 119.5 ± 36.6 | [116.1, 123.0] |
| TO | 124.4 ± 132.0 | 115.8 ± 139.7 | [102.8, 128.8] | 116.2 ± 80.6 | 69.7 ± 123.1 | [58, 81.4] | 72.2 ± 57.1 | 26.4 ± 88.2 | [18.3, 34.6] |
| Sensor Type | Gait Events | F1 Score (Up Stairs) | F1 Score (Down Stairs) | |
|---|---|---|---|---|
| This work | Acc | HS | 0.99 | 0.98 |
| This work | Acc | TO | 0.95 | 0.99 |
| [2] | Acc | HS | 0.96 | 0.76 |
| [2] | Gyro | HS | 1 | 0.78 |
| [30] | Gyro | TO | 0.95 | 0.93 |
© 2016 by the authors; licensee MDPI, Basel, Switzerland. This article is an open access article distributed under the terms and conditions of the Creative Commons Attribution (CC-BY) license (http://creativecommons.org/licenses/by/4.0/).
Share and Cite
Zhou, H.; Ji, N.; Samuel, O.W.; Cao, Y.; Zhao, Z.; Chen, S.; Li, G. Towards Real-Time Detection of Gait Events on Different Terrains Using Time-Frequency Analysis and Peak Heuristics Algorithm. Sensors 2016, 16, 1634. https://doi.org/10.3390/s16101634
Zhou H, Ji N, Samuel OW, Cao Y, Zhao Z, Chen S, Li G. Towards Real-Time Detection of Gait Events on Different Terrains Using Time-Frequency Analysis and Peak Heuristics Algorithm. Sensors. 2016; 16(10):1634. https://doi.org/10.3390/s16101634
Chicago/Turabian StyleZhou, Hui, Ning Ji, Oluwarotimi Williams Samuel, Yafei Cao, Zheyi Zhao, Shixiong Chen, and Guanglin Li. 2016. "Towards Real-Time Detection of Gait Events on Different Terrains Using Time-Frequency Analysis and Peak Heuristics Algorithm" Sensors 16, no. 10: 1634. https://doi.org/10.3390/s16101634
APA StyleZhou, H., Ji, N., Samuel, O. W., Cao, Y., Zhao, Z., Chen, S., & Li, G. (2016). Towards Real-Time Detection of Gait Events on Different Terrains Using Time-Frequency Analysis and Peak Heuristics Algorithm. Sensors, 16(10), 1634. https://doi.org/10.3390/s16101634