Article

Plant Biodiversity Along a Protection-Coverage Gradient in the Baekdudaegan Protected Area, South Korea


1
Baekdudaegan National Arboretum, Bonghwa 36209, Republic of Korea
2
Ecosystem Service Team, National Institute of Ecology, Seocheon 33657, Republic of Korea
*
Author to whom correspondence should be addressed.
Diversity 2026, 18(7), 413; https://doi.org/10.3390/d18070413
Submission received: 20 May 2026 / Revised: 21 June 2026 / Accepted: 6 July 2026 / Published: 7 July 2026
(This article belongs to the Section Biodiversity Conservation)

Abstract

Assessing biodiversity within protected areas requires consideration of not only the extent of protection but also multiple dimensions of biodiversity, including species richness, composition, and turnover. This issue is particularly relevant to the Kunming–Montreal Global Biodiversity Framework Target 3, which emphasizes area-based conservation by protecting 30% of terrestrial areas by 2030. However, empirical case studies examining how plant biodiversity is associated with protection coverage at fine spatial scales within protected areas remain limited, particularly in East Asian temperate forests. We aimed to examine the relationships between grid-scale protection coverage and plant species richness, species composition, species turnover, and multisite species-sharing structures within the core zone of the Baekdudaegan Protected Area in Korea. Plant biodiversity was analyzed using 60 grid cells (each 1:25,000 topographic sheet units, ~100 km2) located within legally protected core zones with minimal human disturbance. Negative binomial regression, beta regression, non-metric multidimensional scaling, and ζ-diversity analyses were applied to evaluate relationships between protected area extent and biodiversity patterns. Core-zone area with greater protection coverage supported higher plant species; however, climate and topography were stronger drivers of species richness. Species turnover and community assembly patterns were not significantly associated with protection coverage. ζ-diversity analyses supported a power-law model across all area groups, indicating deterministic community assembly driven by environmental filtering. These findings suggest that protection coverage is positively associated with α-diversity but shows no clear association with qualitative aspects of biodiversity such as species turnover and community assembly. Although our correlational design does not allow causal inference, the results suggest that future conservation policy should incorporate habitat quality, environmental representativeness, and ecological connectivity alongside area expansion.

1. Introduction

The rapid decline in biodiversity is one of the most urgent environmental challenges facing humanity in the 21st century, and international efforts to mitigate this crisis have placed considerable emphasis on the designation and management of protected areas [1]. The Convention on Biological Diversity (CBD) has placed considerable emphasis on protected areas as a core biodiversity conservation strategy. In 2022, the CBD adopted the Kunming–Montreal Global Biodiversity Framework (KMGBF), which includes Target 3—the “30 by 30” goal—aiming to effectively conserve and manage at least 30% of terrestrial, inland water, coastal, and marine areas by 2030 [2]. This demonstrates that area-based conservation approaches are a core strategy for enhancing global biodiversity. Since the adoption of the 30 by 30 target, countries have intensified their policy efforts to evaluate and expand their national protected-area networks. Korea has responded to this agenda by operating various protected-area systems, including the Baekdudaegan Protected Area, national parks, and ecological and landscape conservation areas.
A comprehensive evaluation of the effectiveness of area-based conservation would require a broader comparative framework beyond the scope of this case study. Accordingly, we focus on variation in protection coverage within protected areas to provide initial insights into biodiversity patterns across different levels of protection intensity.
However, whether the expansion of protected areas substantially contributes to biodiversity enhancement remains insufficiently verified through empirical case-based evidence. Global meta-analyses of vertebrates have reported that species richness inside protected areas is, on average, higher than that outside them [3,4]. Similarly, information-theoretic approaches to analyzing the determinants of protected area extent have confirmed positive relationships between protected areas, species richness, and endemism [5]. However, the effect sizes reported in global analyses vary considerably depending on the taxonomic group and region, and case studies focusing on plant taxa or East Asian forest systems remain relatively scarce [6]. Therefore, evaluating the implementation of KMGBF Target 3 requires the accumulation of case studies based on the national biodiversity data. Only through the integration of such cases via meta-analysis can a general conclusion be reached regarding whether protected area extent truly contributes to biodiversity enhancement.
Recent studies in ecology and conservation biology have highlighted the limitations of approaches that assess biodiversity solely in terms of species richness or α-diversity. The true value of biodiversity lies not only in the number of species present but also in how biodiversity is spatially distributed and maintained. From this perspective, β-diversity and ζ-diversity—which address species turnover and multisite species-sharing structure, respectively—have emerged as key indicators for evaluating the stability and maintenance of biodiversity [7,8,9]. In regions characterized by rapid species turnover, a single protected area cannot adequately represent regional diversity; therefore, careful consideration is required when designing the placement and size of protected areas [10]. β-diversity-based conservation planning yields superior outcomes in terms of ecological representativeness compared with species richness-based approaches [11,12]. Furthermore, global meta-analyses showing either negative or non-significant relationships between species richness and ecological uniqueness [13] suggest that α- and β-diversity should be treated as distinct dimensions in conservation planning. Nevertheless, in Korea, national-scale studies examining the relationship between species turnover and protected area extent remain extremely limited, and evaluations of protected area effectiveness continue to focus primarily on species richness.
To address these academic and policy gaps, we evaluated the effects of protected area extent on plant biodiversity from quantitative and qualitative perspectives using 60 grid cells located within the core zones of the Baekdudaegan Protected Area. The specific hypotheses are as follows.
H1. 
Protection coverage within a grid cell is positively associated with plant species richness (α-diversity), reflecting the potential role of greater within-cell protection in supporting higher local plant diversity.
H2. 
Qualitative aspects of plant biodiversity—species composition, Jaccard-based species turnover, and ζ-diversity-based multisite species-sharing structure—are not necessarily associated with protection coverage, but instead depend more strongly on environmental gradients.
H1 tests whether protection coverage predicts species richness better than environmental factors; H2 examines whether species composition, turnover, and multisite species-sharing are associated with area extent or are instead more strongly determined by environmental gradients. By testing these two hypotheses simultaneously, this study provides a national-scale correlational case for examining how plant biodiversity is patterned along a protection-coverage gradient within a single protected area, contributing to the empirical base needed for evaluating the implementation of KMGBF Target 3. We emphasize that this case study is correlational in nature and does not aim to assess causal effectiveness of protection through comparisons with unprotected areas.

2. Materials and Methods

2.1. Extraction of the Study Sites

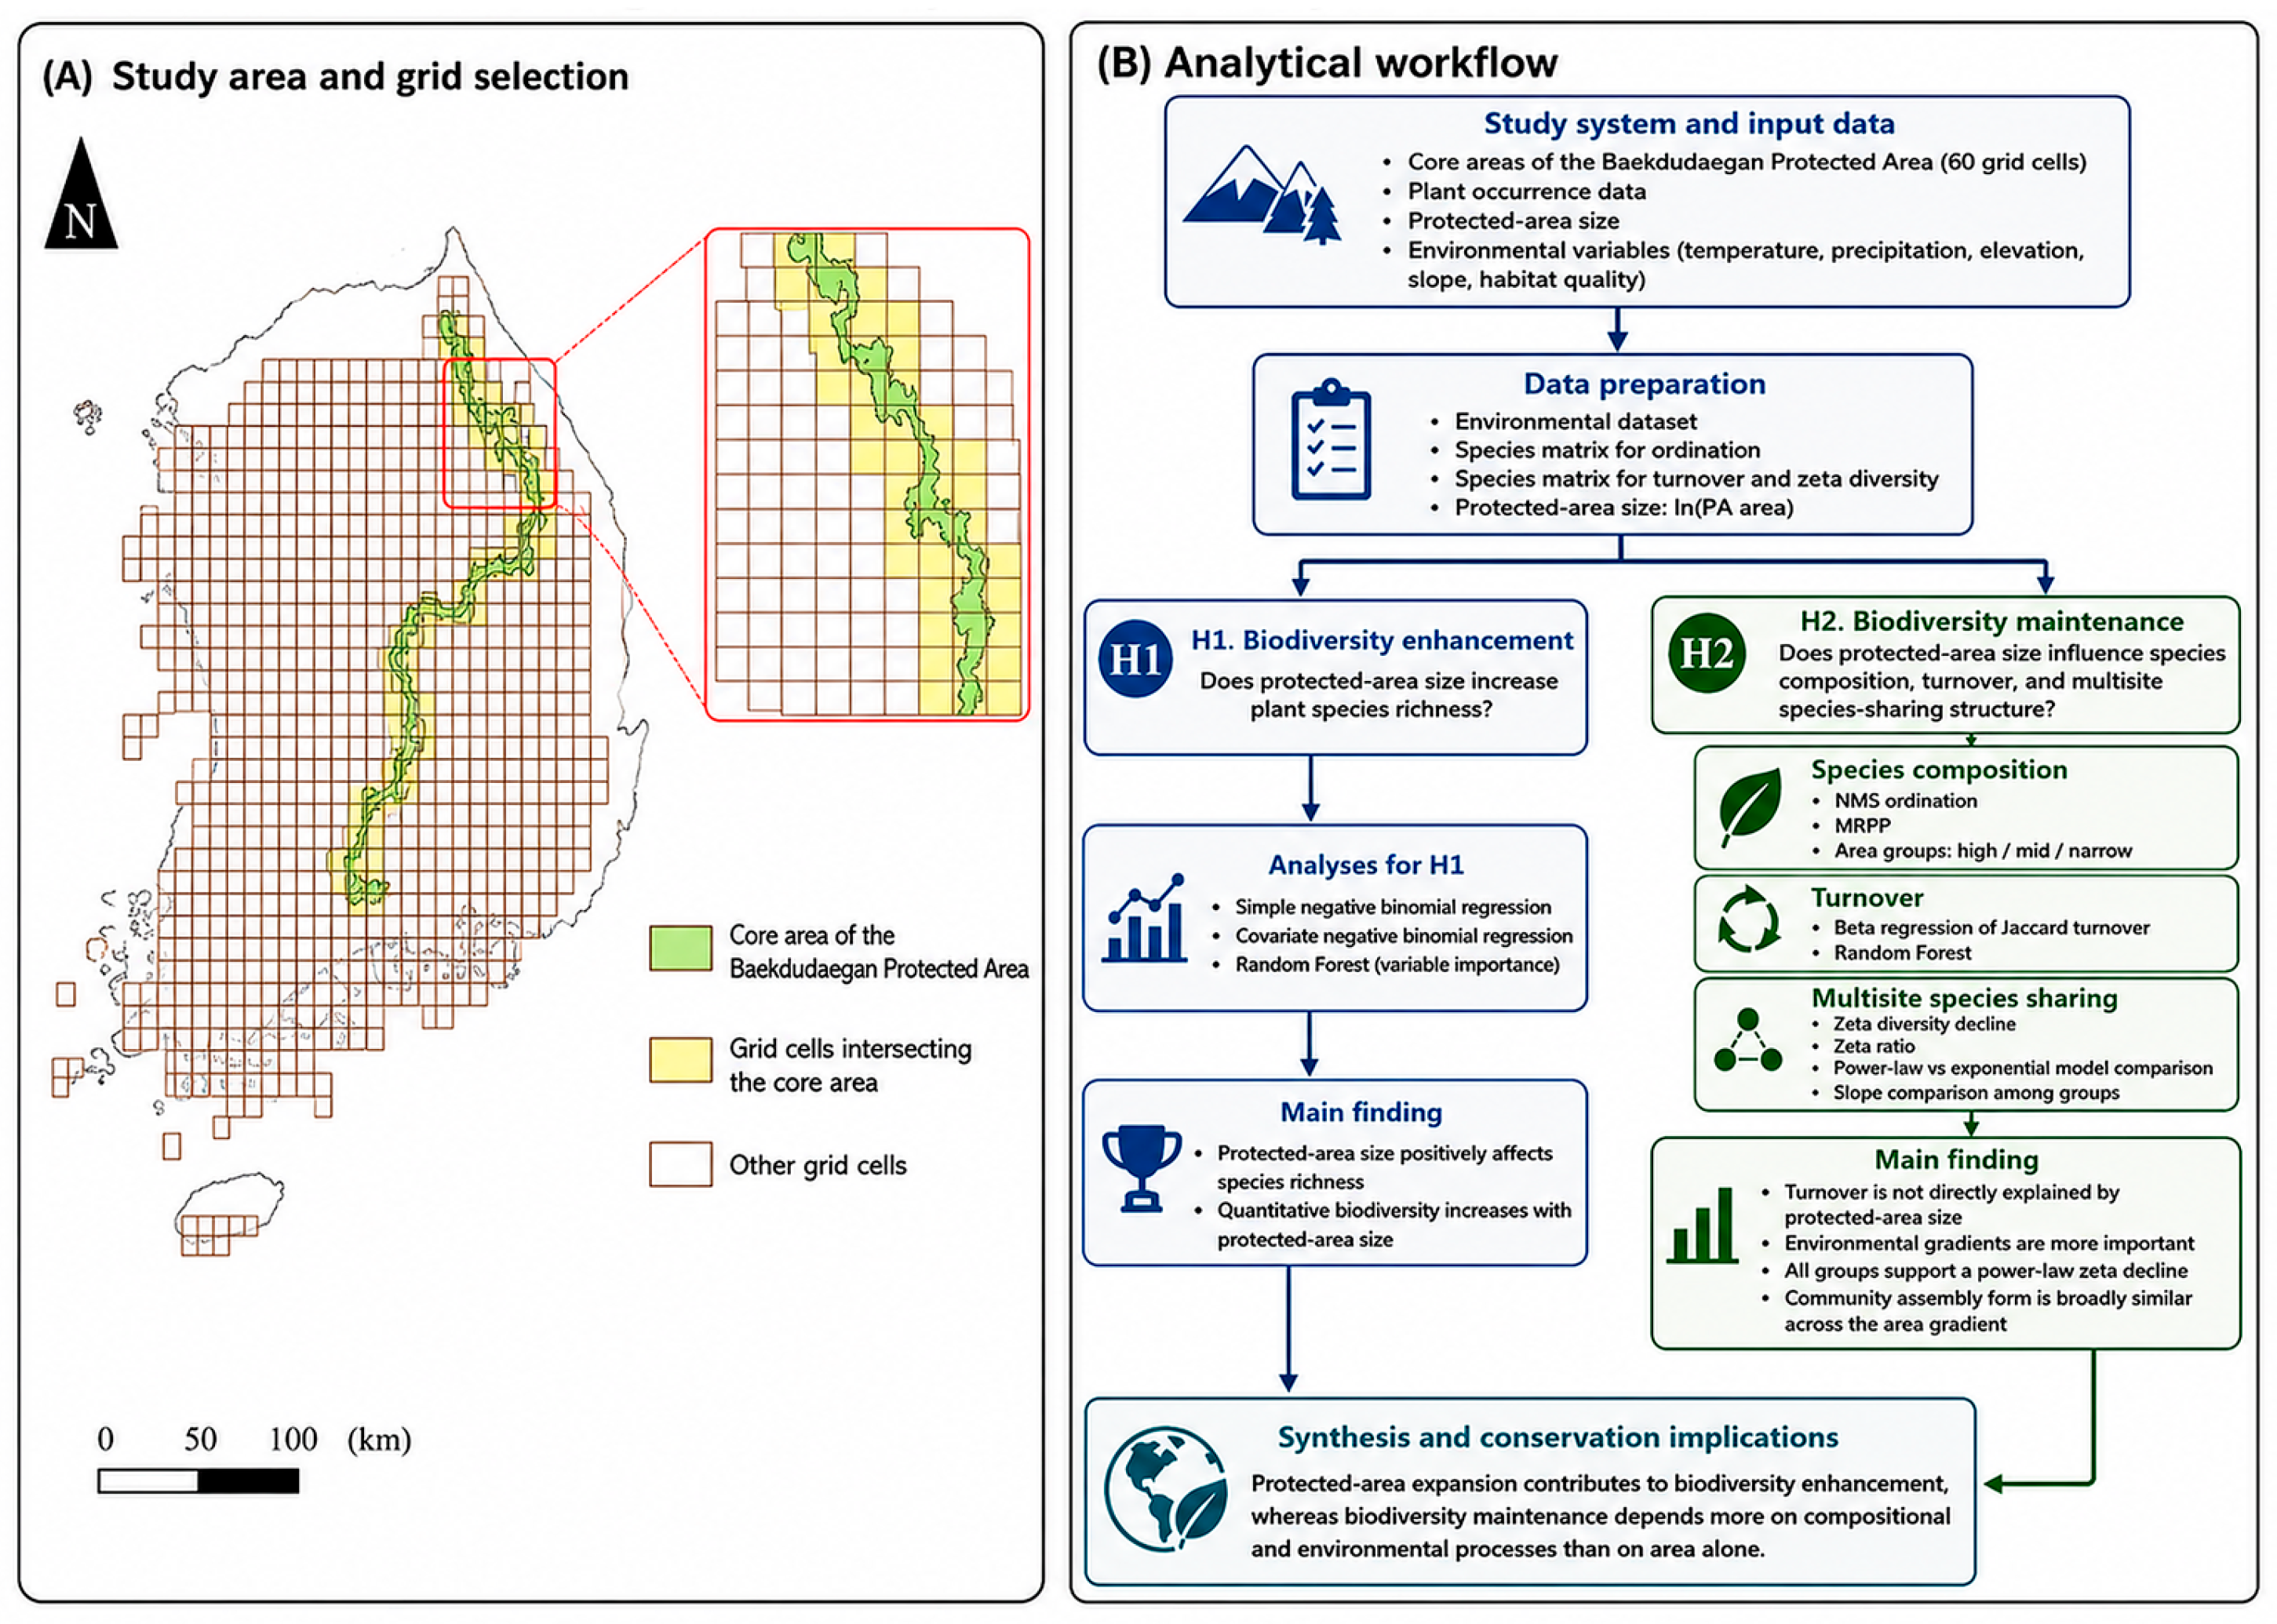
The workflow of this study is shown in Figure 1. The 800 survey grid cells used in this study were established based on a 1:25,000 digital topographic map sheet system, which serves as the standard unit for the National Ecosystem Survey conducted by the Ministry of Environment of Korea [14]. Each grid cell corresponded to a 1:25,000 topographic map sheet and served as a single survey unit [15]. Plant occurrence data (presence–absence records for vascular plant species) were obtained from the floristic dataset of the National Ecosystem Survey (3rd–5th surveys, 2008–2021) provided by the National Institute of Ecology [16]. These data were collected at the 1:25,000 grid cell level and were not restricted to the protected core-zone portion of each grid cell; therefore, species records may include observations from both core-zone and non-core-zone areas within each grid cell.
For study site selection, the Baekdudaegan Protected Area shapefile provided by the Korea Forest Service was used. The Baekdudaegan Protected Area is divided into core and buffer zones, and only the core zones were included in this study [17]. Spatial overlay analysis between the core zone and the 800 grid cells identified 60 grid cells corresponding to the core zone. These 60 grid cells constituted the final dataset, with each grid cell treated as a sampling and analytical unit.
The core zone is strictly protected under the “Act on the Protection of the Baekdu-daegan Mountain System,” where activities such as landform alteration, tree felling, forest road construction, and land reclamation are highly restricted [18]. Consequently, the core zone provides a relatively low-disturbance environment suitable for evaluating the effects of protected area extent on plant species composition, richness, and turnover [18]. Only the core zone of the Baekdudaegan Protected Area was selected to minimize the effects of heterogeneous land use and human activity in the buffer zone.
This approach enabled a systematic observational analysis of the relationships between protected area extent, plant biodiversity, and species turnover.

2.2. Environmental Variables

For each grid cell, five environmental variables were calculated: annual mean temperature (temp_aver, °C), annual mean precipitation (precip_ave, mm), mean elevation (elev_aver, m), mean slope (slope_aver, °), and habitat quality (HQ). Climatic variables were extracted from WorldClim Bioclim data (Bio1 and Bio12; version 2.1; 30 arc-second resolution representing 1970–2000 climate averages) [19], and topographic variables were derived from the NASA Shuttle Radar Topography Mission (SRTM) 1 Arc-Second Global product (SRTMGL1; ~30 m spatial resolution) [20]. Habitat quality was calculated by combining land cover maps and threat factor information using the InVEST Habitat Quality module [21]. All environmental variables were averaged at the grid cell level and used in subsequent analyses.

2.3. Protection Coverage Within Grid Cells

The protected-area core zone included within each grid cell was calculated in hectares (ha). As the area values showed a right-skewed distribution, a natural logarithmic transformation, ln(Protected_Area_ha), was performed, and the transformed values were used as explanatory variables in all regression analyses and group comparisons.

2.4. Biodiversity Metrics

The total number of plant species occurring within each grid cell was calculated as the species richness (SR_total) [22]. To quantify spatial variation in species turnover among grid cells, the Jaccard turnover index was calculated [7]. This was derived using the Jaccard similarity index based on the presence–absence data among grid cells [23,24]. The species composition similarity between two grid cells, i and j, was defined as follows:
J i , j = a a + b + c
where a represents the number of species shared by the two grid cells, b represents the number of species present only in grid cell i, and c represents the number of species present only in grid cell j. The Jaccard turnover index was defined as the Jaccard dissimilarity based on the Jaccard similarity, as follows [7,24].
D i , j = 1 J ( i , j )
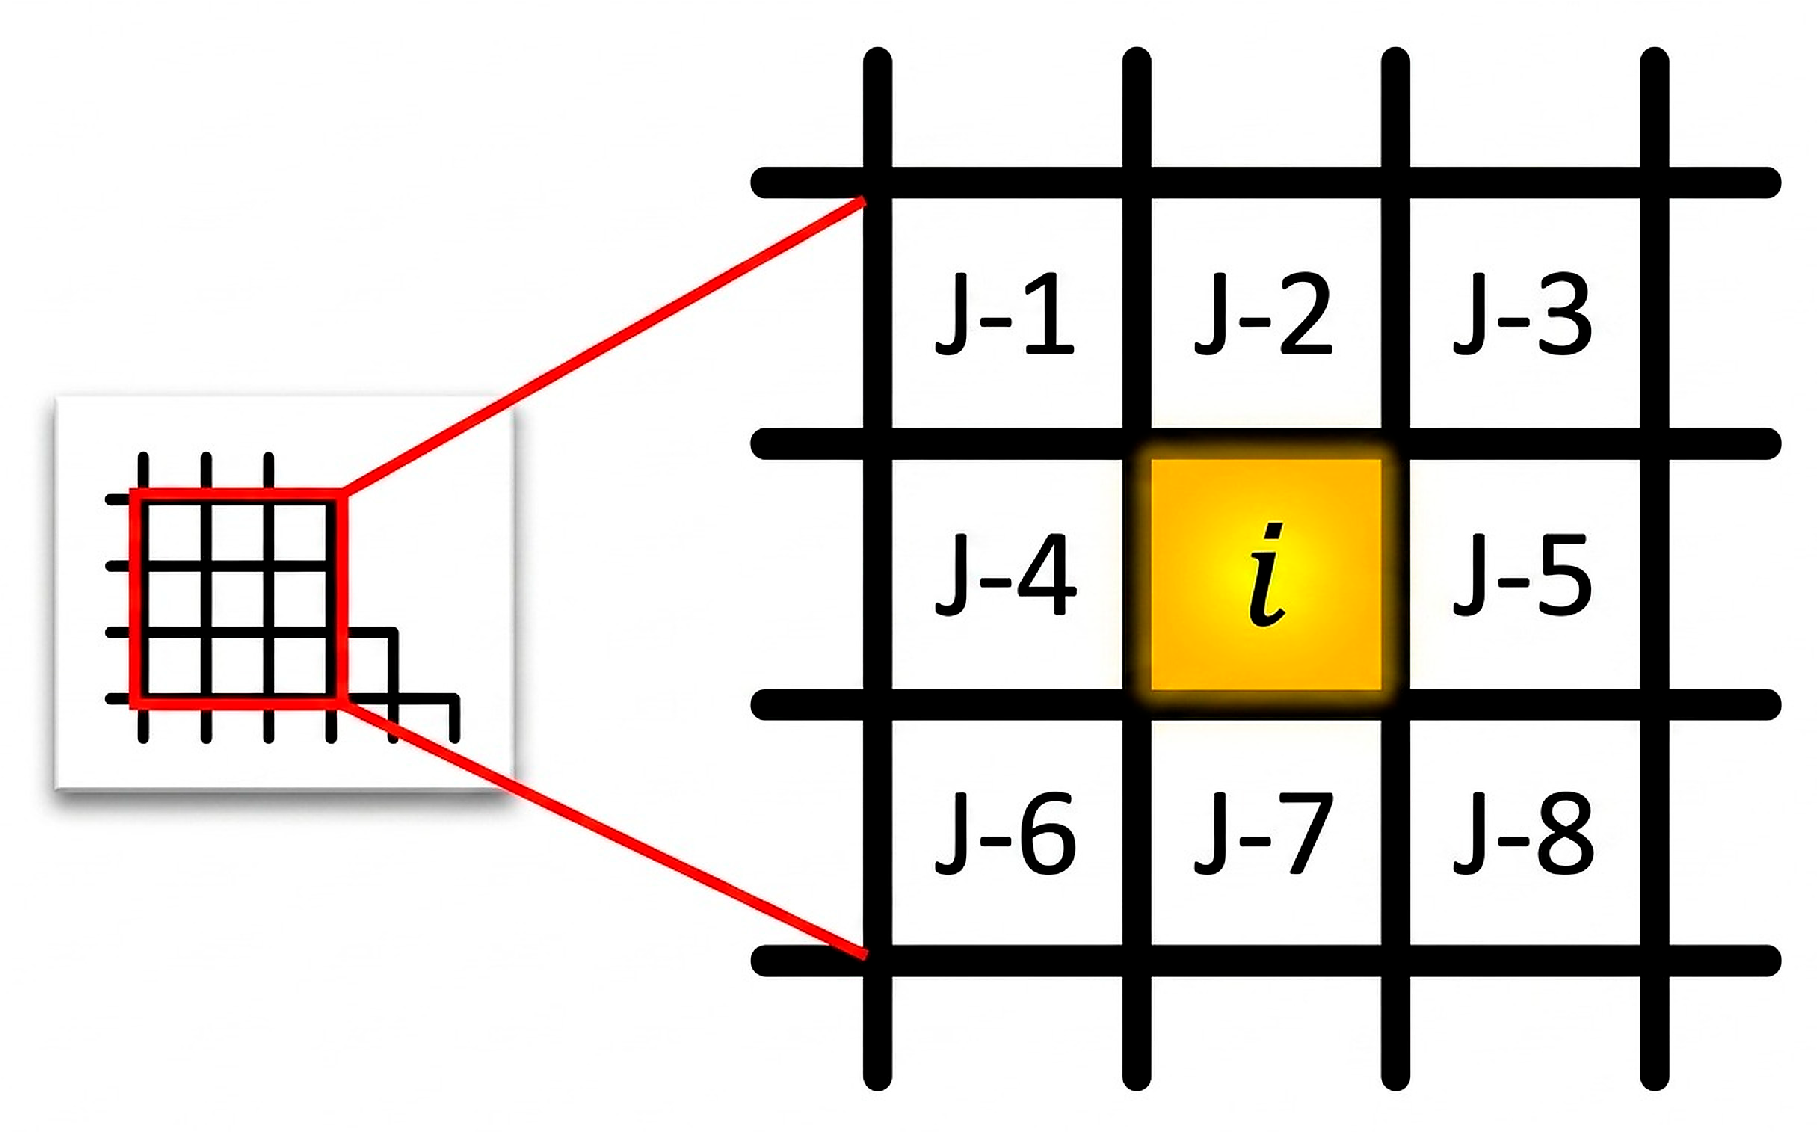
Species turnover for each grid cell was calculated as the mean Jaccard dissimilarity between the focal grid cell and its eight neighboring grid cells (Figure 2).
Turnover i = 1 1 k j = 1 k J ( i , j )
where i denotes the focal grid, and j denotes the neighboring grid of i.
As plant species richness constitutes count data, Poisson and Negative Binomial regression models were applied to assess overdispersion [25]. The relationship between protection coverage and Jaccard turnover was analyzed using Beta regression [26], as Jaccard turnover is a proportional variable bounded between 0 and 1.
To evaluate the variation in species composition according to protection coverage and multisite species-sharing structure, ζ-diversity analysis was performed [8,27]. For this analysis, the 60 grid cells corresponding to the core zone of the Baekdudaegan Protected Area were divided into three groups based on the protection coverage: small (SM), medium (ME), and large (LA) with 20 grid cells assigned to each group. Differences in species composition among the three area groups were analyzed using non-metric multidimensional scaling (NMS) and multi-response permutation procedures (MRPP). NMS ordination was performed in two dimensions based on Bray–Curtis dissimilarity to visualize differences in species composition among the three area groups. The A-statistic and p-value of MRPP were calculated to test whether species composition differed significantly among groups; the magnitude of A and its p-value together indicate the strength and statistical significance of compositional separation. Pairwise comparisons (SM vs. ME, SM vs. LA, and ME vs. LA) were performed to identify which group pairs differed most substantially [27]. The A-statistic quantifies the within-group homogeneity in community composition; larger A-values (approaching 1) indicate strong compositional similarity within groups and thus greater compositional separation among groups. The p-value from MRPP indicates whether the observed compositional separation among groups is statistically significant (p < 0.05) [27]. Pairwise comparisons (SM vs. ME, SM vs. LA, and ME vs. LA) were performed [27].
ζ-diversity refers to the mean number of species shared among randomly selected n sites, and the decline pattern of ζn with increasing n can be used to infer the community assembly mechanisms. Power-law decline indicates deterministic community assembly driven by environmental filtering, whereas exponential decline suggests stochastic assembly and dispersal limitations [8,28]. The ζ-diversity decline patterns were calculated for each of the three groups. Power-law and exponential models were fitted, and model selection was performed based on Akaike’s Information Criterion (AIC), with lower AIC values indicating a better model fit [29].
To evaluate the relative importance of protection coverage and environmental variables for species richness and turnover, Random Forest (RF) regression was performed [30]. RF is an ensemble-learning method based on multiple decision trees that can identify nonlinear relationships between the response and explanatory variables [30]. This method can reduce overfitting, accommodate a large number of explanatory variables without prior variable removal, and evaluate variable importance [31]. Six explanatory variables were included: ln(Protected_Area_ha), mean temperature, mean precipitation, mean elevation, mean slope, and habitat quality. Two separate models were fitted using species richness (SR_total) and Jaccard turnover as the response variables. Variable importance was calculated using permutation-based importance (Mean Decrease in Accuracy), and model performance was evaluated using 5-fold cross-validated R2 [31].

2.5. Software

All statistical analyses were performed using R statistical software (ver. 4.6.0; R Foundation for Statistical Computing, Vienna, Austria) [32]. The main packages used were MASS for negative binomial regression, betareg for beta regression, zetadiv for ζ-diversity analysis, randomForest for RF analysis, and ggplot2 for visualization [30,33,34,35,36]. NMS and MRPP were conducted using PC-ORD (ver. 7.0; MjM Software Design, Gleneden Beach, OR, USA) [27].

2.6. Hypothesis Testing

H1 is tested via negative binomial regression (Section 2.4) by evaluating whether ln(Protected_Area_ha) significantly predicts species richness. H2 is tested across three analytical methods: (1) Beta regression to assess turnover–area relationships, (2) NMS/MRPP to test compositional differences among area groups, and (3) ζ-diversity analysis to evaluate whether community assembly mechanisms differ by area extent. All analyses compare the relative importance of area extent versus environmental covariates (temperature, precipitation, elevation) to establish the hierarchy of drivers.

3. Results

3.1. Protected Area and Plant Species Richness

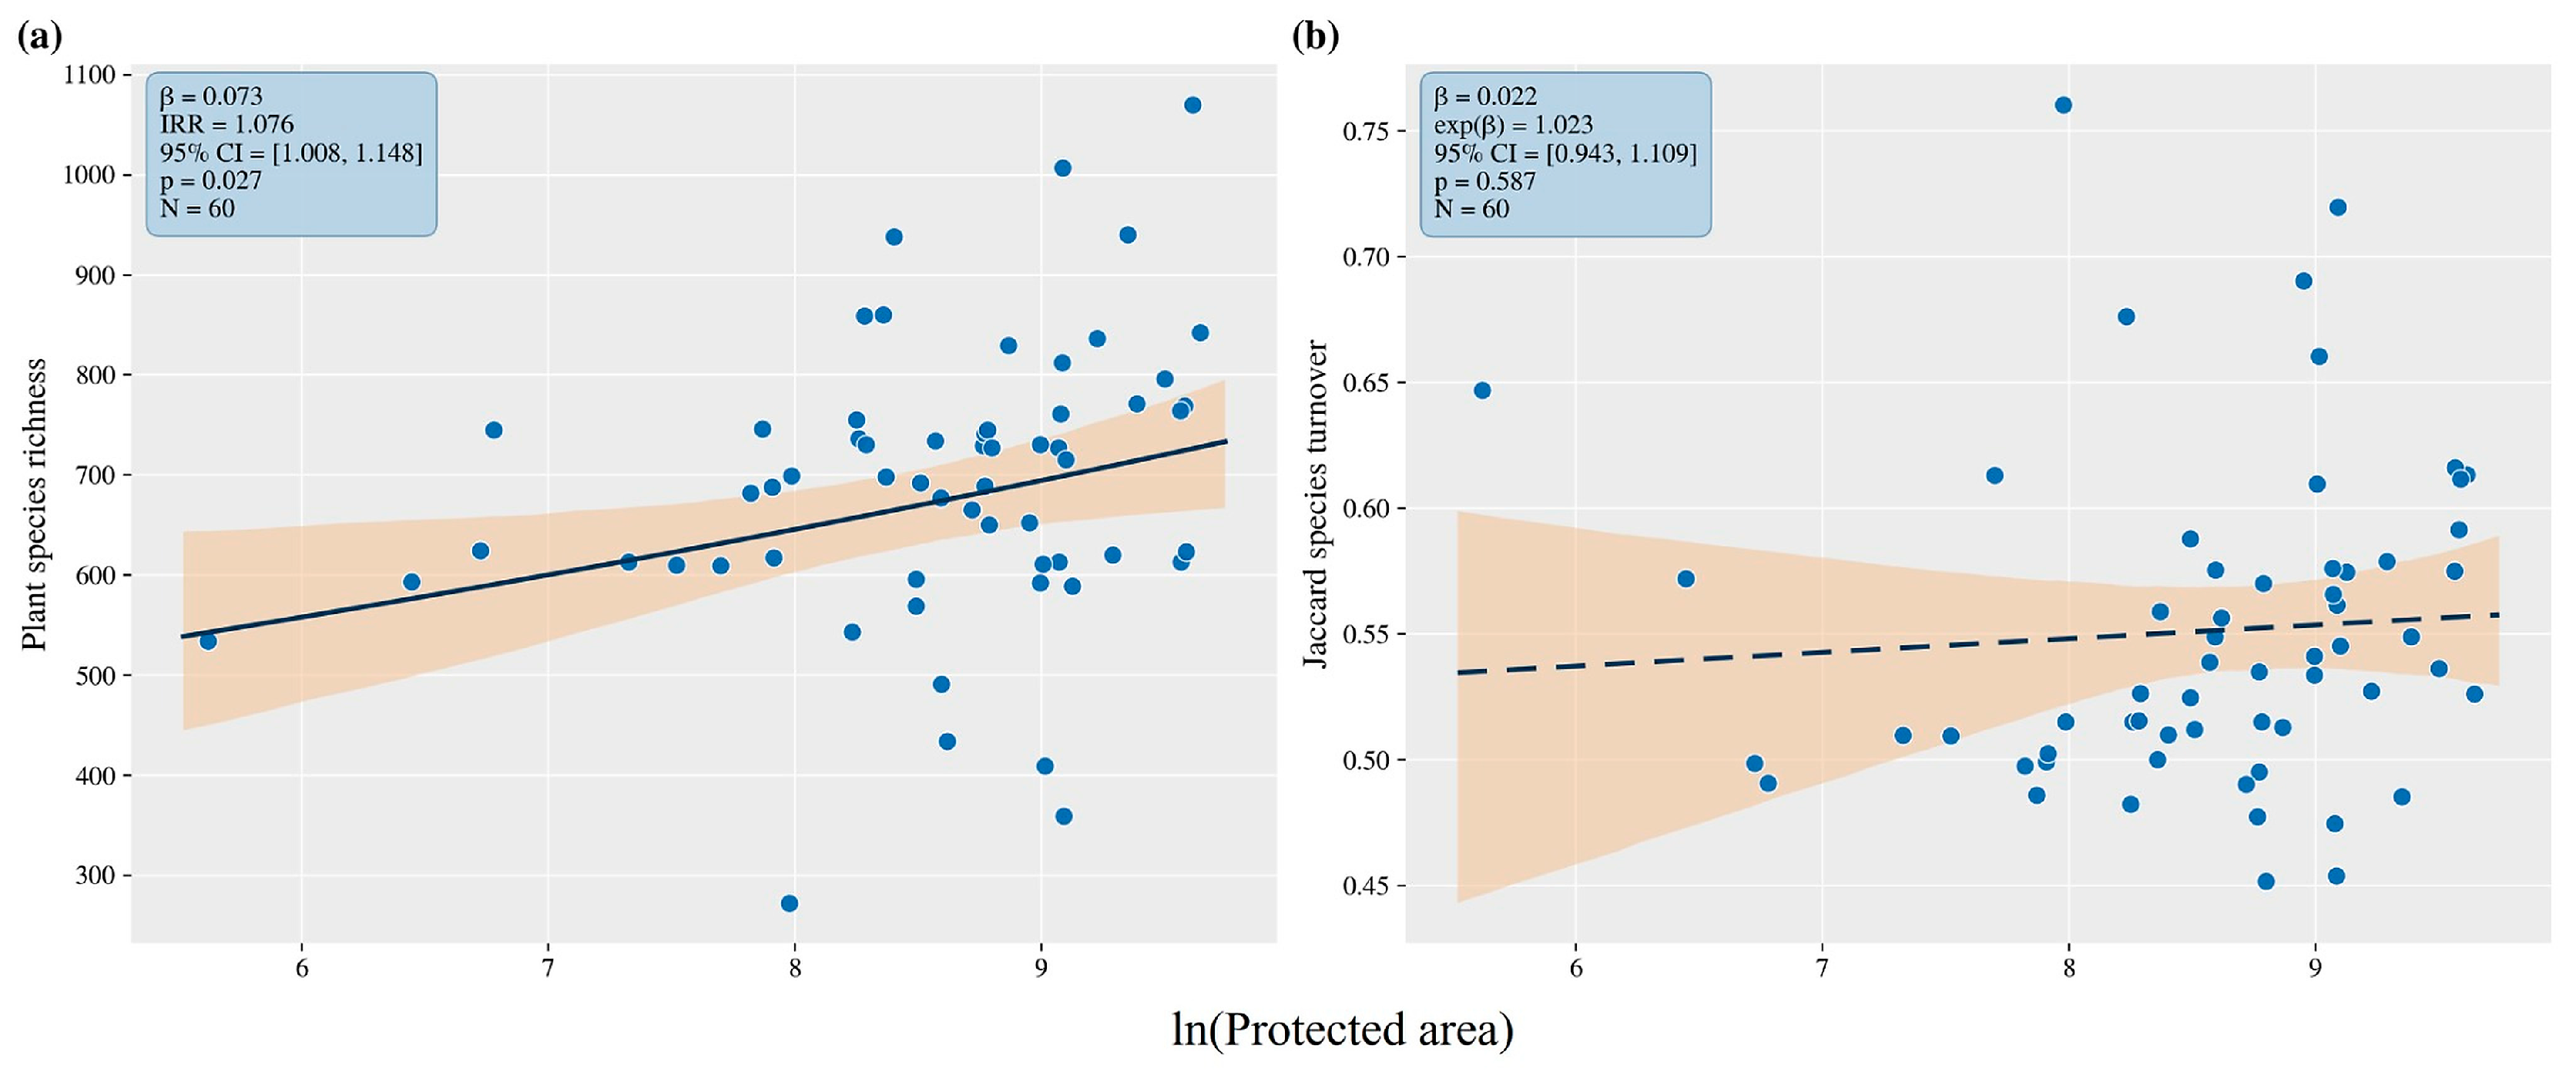
Larger protection coverage supported higher plant species richness (β = 0.073, incidence rate ratio [IRR] = 1.076, 95% CI [1.008, 1.148], p = 0.027; Figure 3a). This weak positive relationship remained marginally significant after accounting for environmental gradients (IRR = 1.064, p = 0.080; Table 1). However, temperature and elevation emerged as stronger predictors of species richness than area extent itself (Table 1), suggesting that environmental heterogeneity is the primary driver of richness variation. Because Poisson models fitted to species-richness data showed severe overdispersion, negative binomial models were used for inference, and the corresponding overdispersion diagnostics are provided in Table S1.
In the covariate model, the effect of protection coverage on species richness remained marginally significant (IRR = 1.064, p = 0.080; Table 1). Temperature (IRR = 1.205, p < 0.001) and elevation (IRR = 1.001, p < 0.001) had significant positive effects on species richness, whereas precipitation had a significant effect (IRR = 0.999, p = 0.049). In the covariate beta regression model for species turnover, the effect of protection coverage was not significant (exp(β) = 1.008, p = 0.823), whereas temperature (exp(β) = 0.592, p < 0.001), precipitation (exp(β) = 1.294, p < 0.001), and elevation (exp(β) = 0.510, p < 0.001) were identified as significant explanatory variables (Table 1).

3.2. Species Compositional Variation Along the Protected-Area Size Gradient

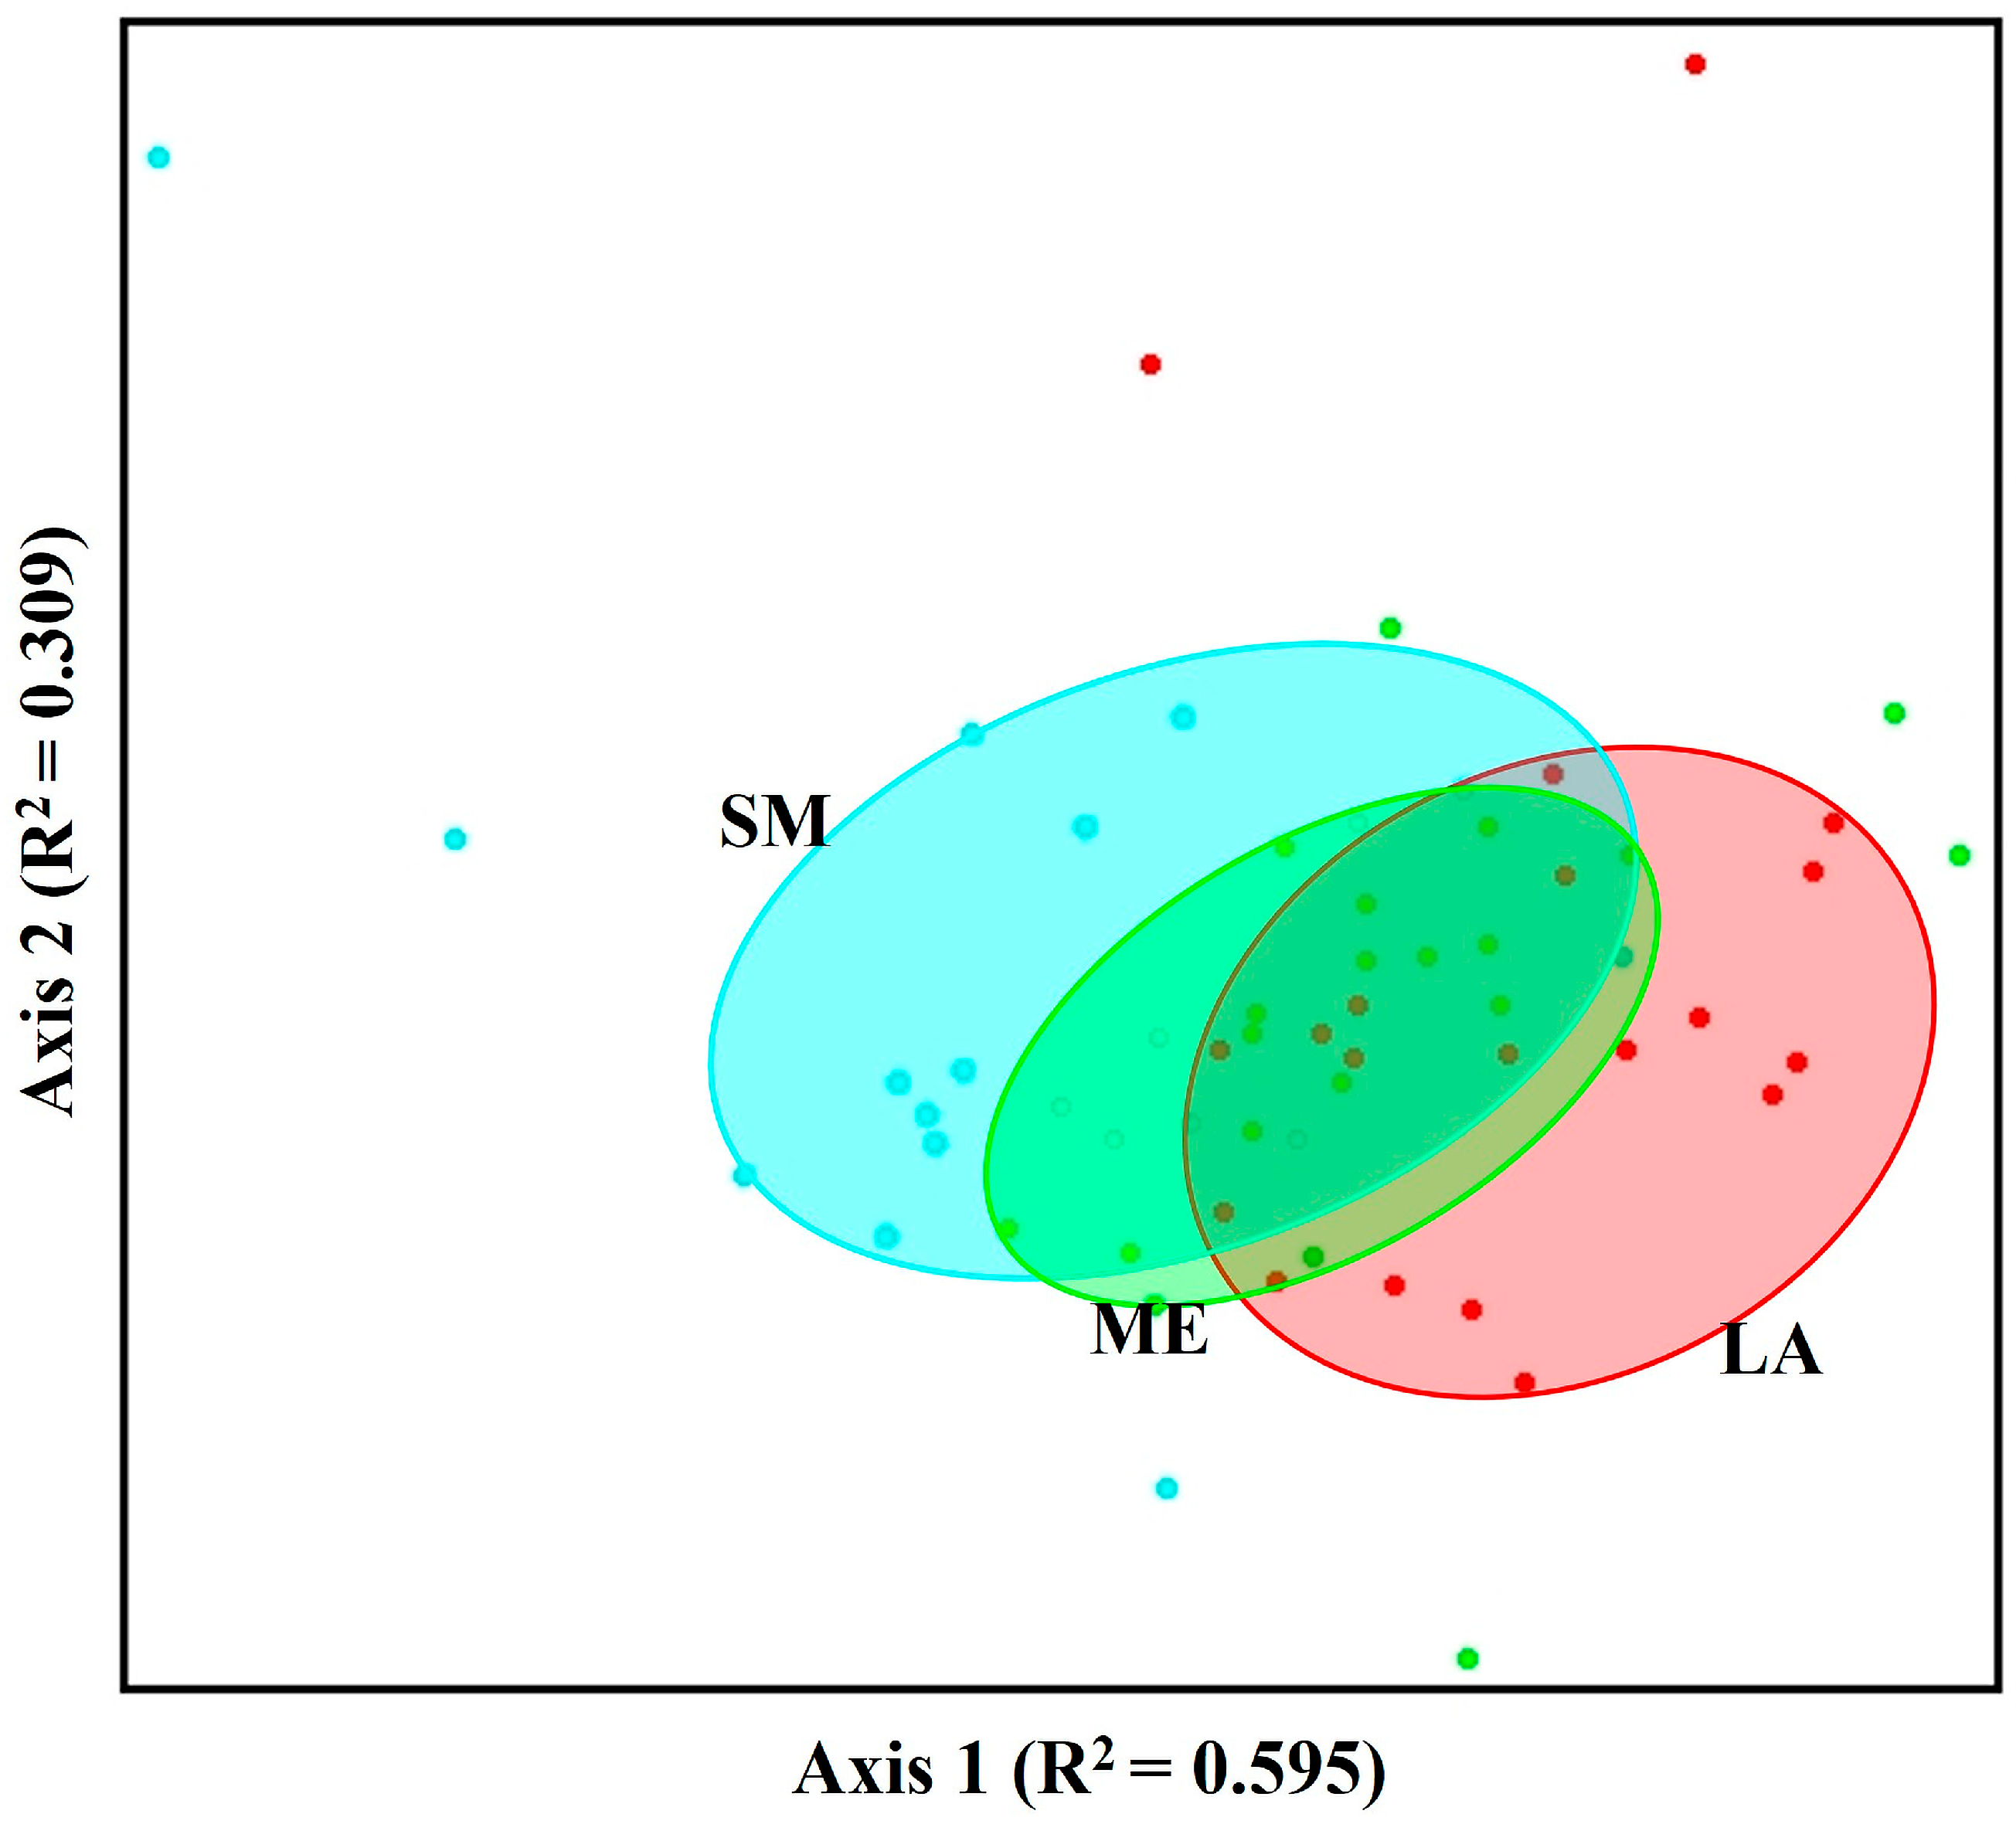
According to the NMS results, the species compositions of the three groups were partially separated in the ordination space (Figure 4). Axis 1 and Axis 2 explained 59.5% and 30.9% of the total variation in species composition, respectively. Axis 1 correlated positively with elevation (r ≈ 0.71) and inversely with temperature (r ≈ −0.58), suggesting that the primary compositional gradient reflects a climatic–elevational transition. The three area groups (SM, ME, LA) distributed sequentially along Axis 1, but this distribution appears to reflect co-variation with environmental gradients rather than a direct area effect. Pairwise MRPP comparisons indicated that the differences in species composition among the three groups were significant. The greatest compositional separation was observed between the SM and LA groups (A = 0.305, p < 0.001), followed by the SM and ME groups (A = 0.229, p < 0.001) and the LA and ME groups (A = 0.089, p = 0.005).

3.3. Relative Importance of Protected-Area Size and Environmental Predictors

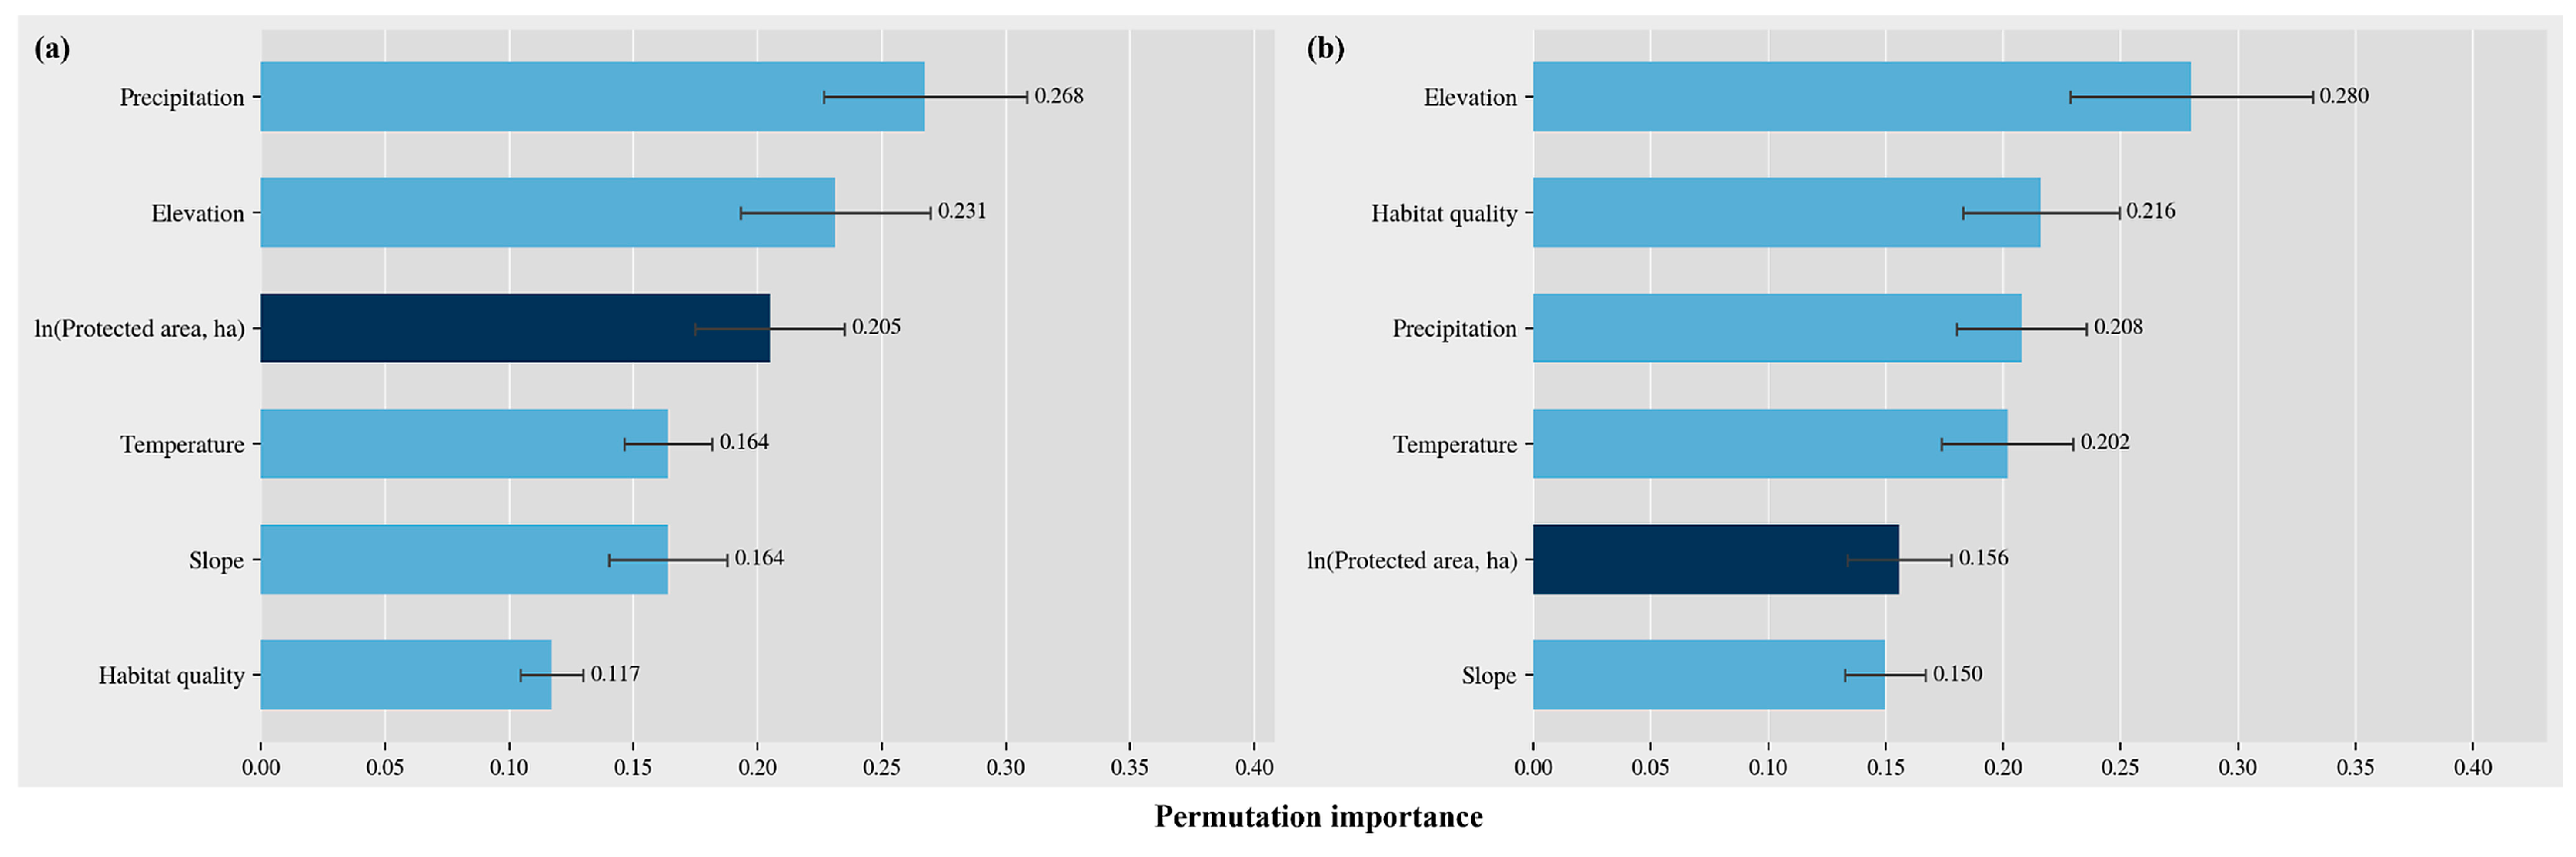
According to the RF permutation-importance analysis, the predictor importance for species richness was ranked as follows: precipitation (0.268), elevation (0.231), protection coverage (0.205), temperature (0.164), slope (0.164), and habitat quality (0.117) (Figure 5a). For species turnover, the predictor importance was ranked as follows: elevation (0.280), habitat quality (0.216), precipitation (0.208), temperature (0.202), protection coverage (0.156), and slope (0.150) (Figure 5b). protection coverage was the third most important factor for species richness, but ranked fifth for species turnover. As the cross-validated predictive performance of the RF models was low for both response variables (CV R2 = −0.098 and 0.039), these importance results were interpreted as supplementary evidence.

3.4. Multisite Species-Sharing Structure and Community Assembly

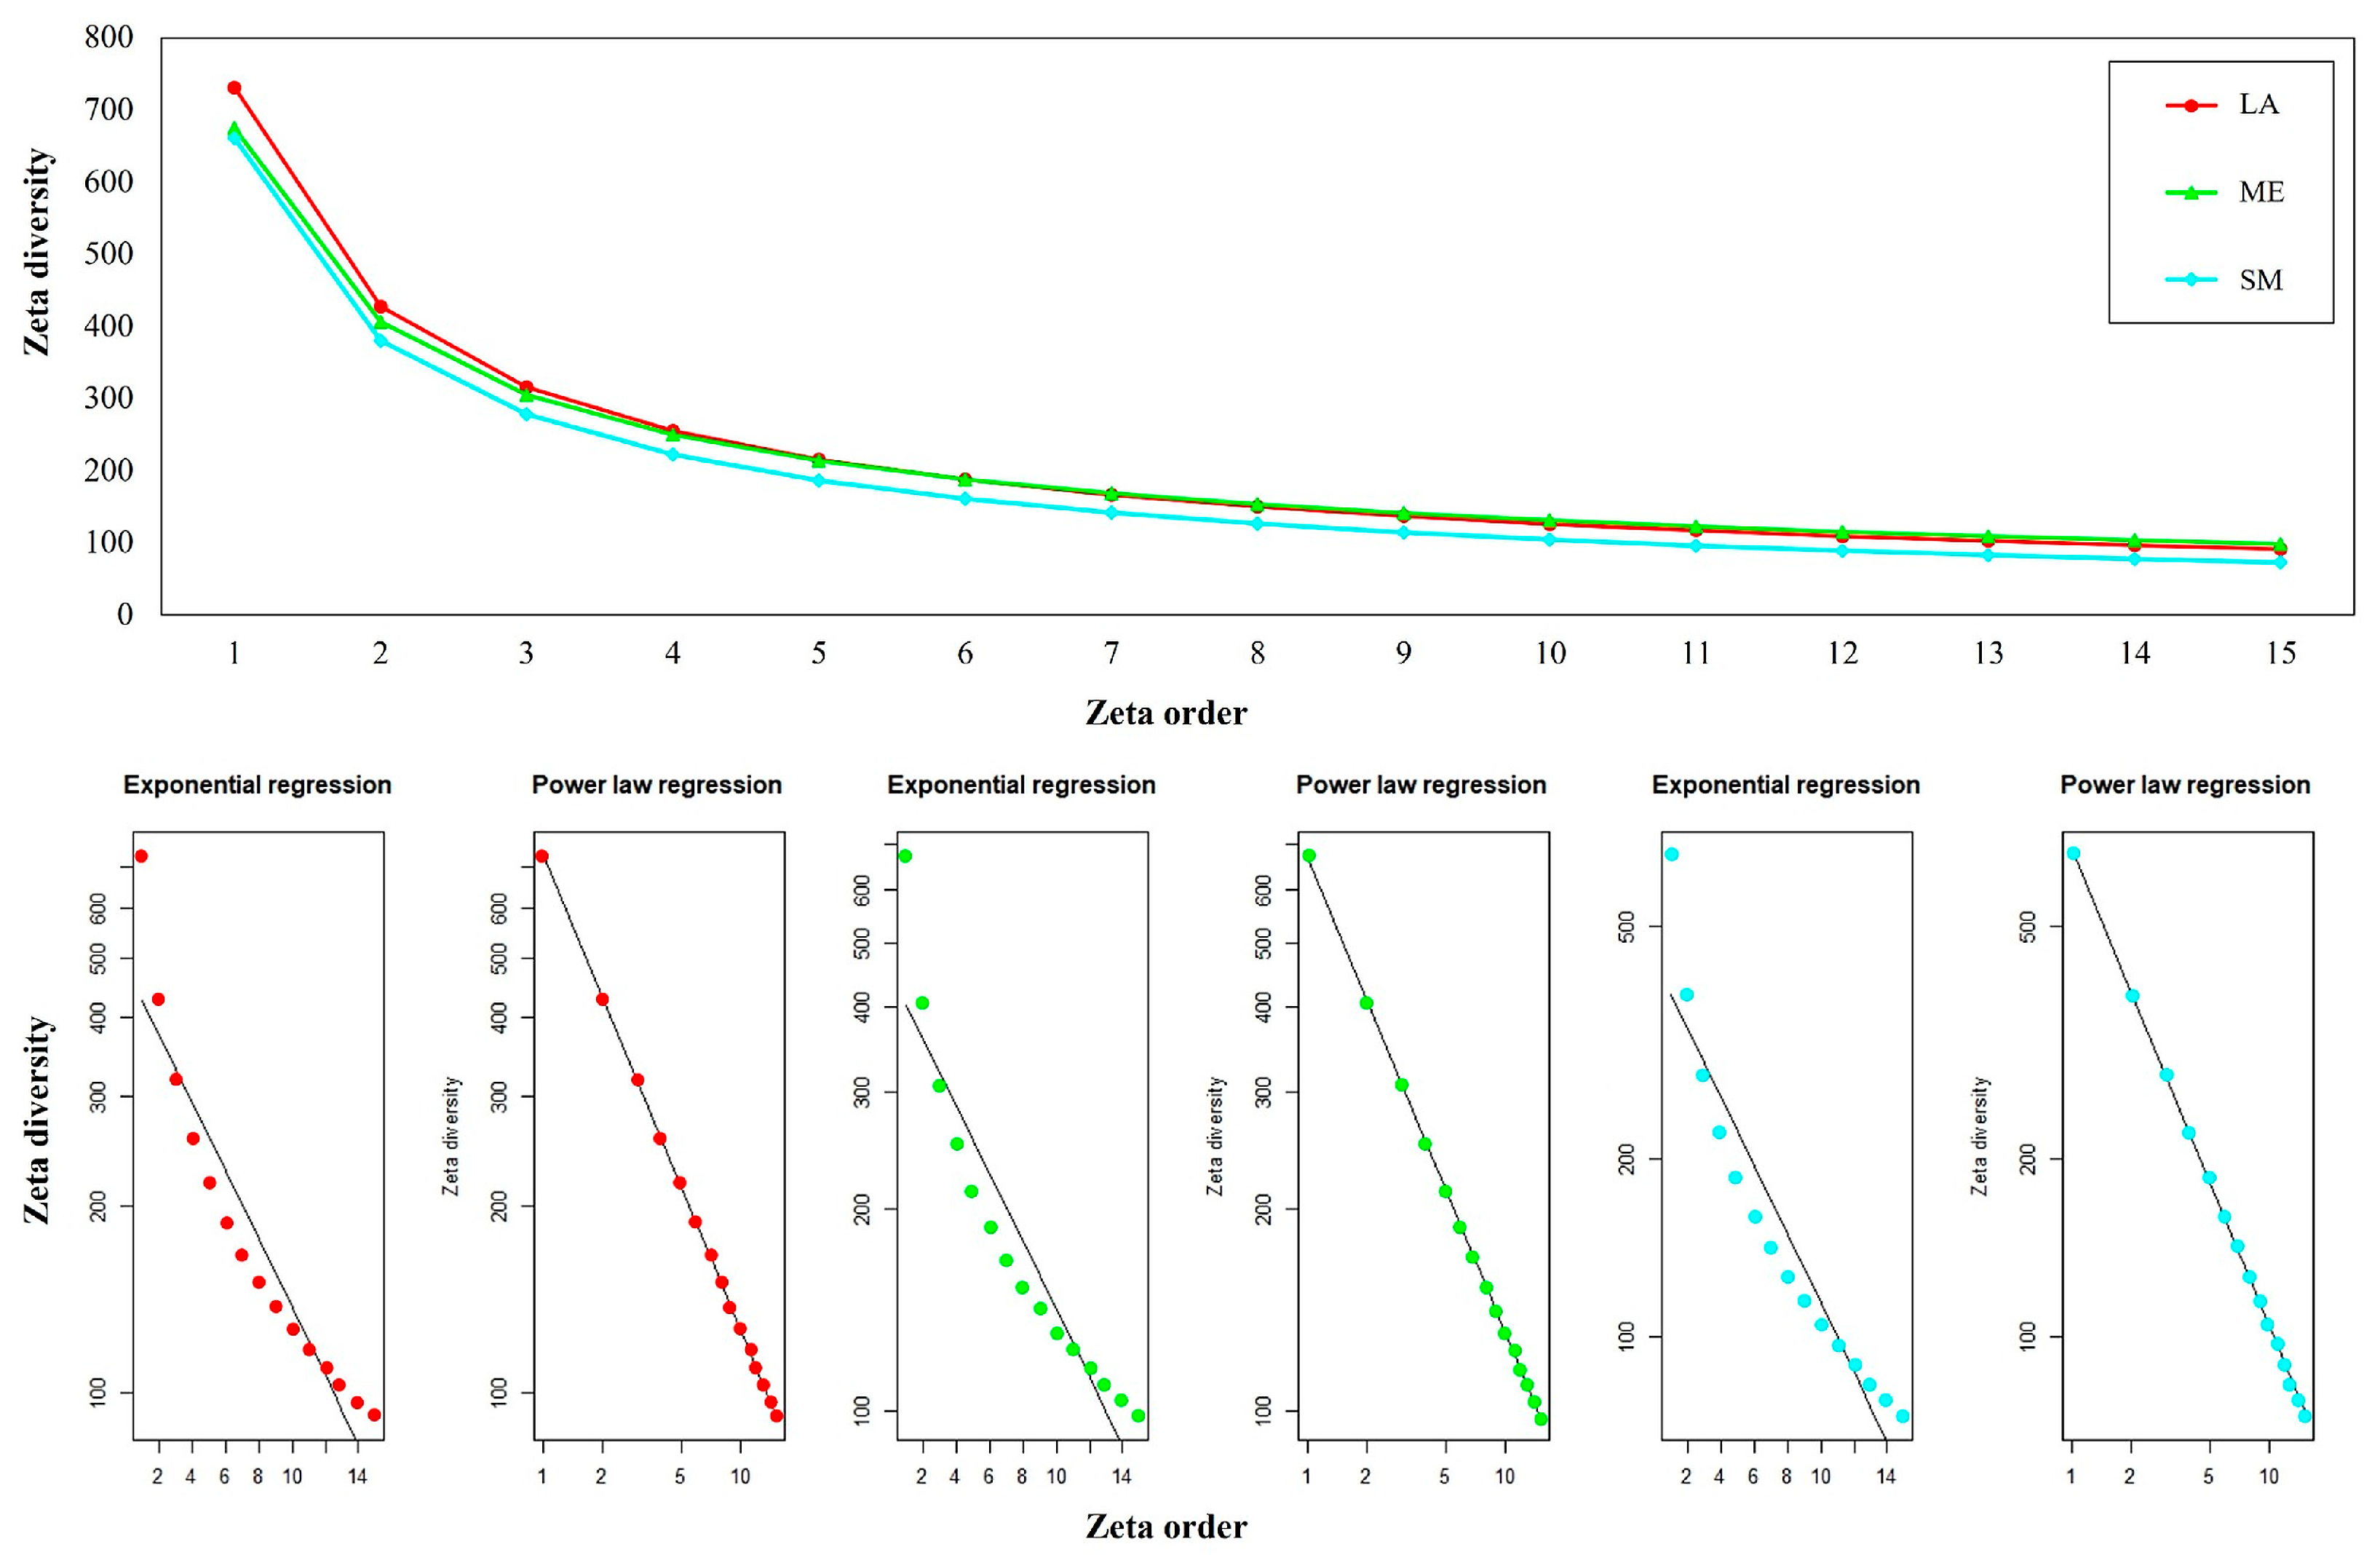
The ζ-diversity decline curves decreased monotonically in all three groups as the zeta order increased from 1 to 15 (Figure 6). A comparison of the exponential and power-law models showed that the power-law model provided a better fit in all three groups. The power-law slope was steepest in the SM group (b = 0.814), most gradual in the ME group (b = 0.708), and intermediate in the LA group (b = 0.766). Thus, the multisite species-sharing structure consistently followed a power-law pattern across the protection coverage gradient.

4. Discussion

This study evaluated the effects of protection coverage on the quantitative enhancement (α-diversity) and qualitative maintenance (species composition, species turnover, and multisite species sharing) of plant biodiversity using 60 grid cells within the core zones of the Baekdudaegan Protected Area. Species richness increased significantly with protection coverage, supporting H1. Species turnover and community assembly patterns were largely unrelated to protection coverage and were more strongly associated with climate and elevation gradients; H2 was therefore largely not supported. In the ζ-diversity analysis, all three area groups consistently supported the power-law model, suggesting that non-random community assembly driven by environmental filtering operates across the entire area gradient. These findings indicate that the expansion of protection coverage is positively associated with higher species richness but has limited influence on spatial variation in species composition and community stability. Area-based conservation strategies may contribute to the quantitative goals of plant biodiversity conservation under KMGBF Target 3, whereas the qualitative maintenance of biodiversity likely requires a multidimensional approach that incorporates environmental heterogeneity and habitat connectivity [1,37].

4.1. Protected-Area Size, Species Richness, and Environmental Gradients

In the simple regression analysis, protection coverage showed a significant positive association with species richness. This finding is consistent with global meta-analyses reporting that species richness inside protected areas is higher than that outside protected areas [4]. A meta-analysis of 86 vertebrate case studies reported that protected areas consistently have positive effects on species richness and abundance compared with unprotected areas [3]. Accordingly, the results of H1 suggest that a similar association is observed at a finer, within-protected-area spatial scale for plant taxa in East Asian temperate forest systems. However, we note that our design does not include unprotected counterfactuals and therefore cannot establish a causal effect of protection.
However, when environmental variables were included as covariates, the effect of protection coverage weakened, whereas temperature, elevation, and precipitation showed greater explanatory power. Similarly, RF analysis tentatively suggested that environmental variables may have greater relative importance than protection coverage, though these results should be interpreted cautiously given the low predictive performance of the models (CV R2 = −0.098 and 0.039). These results suggest that climatic and elevational conditions exert a stronger influence on species richness than protected area extent itself. Vertebrate species richness is more strongly associated with climate, elevation, and human pressure than with protected area size [38]. Similarly, an information-theoretic analysis of 762 ecoregions found that species richness, endemism, and threatened species explained protected area extent more strongly than agricultural suitability, although substantial regional variation was observed [5]. The area–species richness relationship observed in this study may partly reflect the environmental conditions in which protected areas are located, rather than the effects of area alone. Given that the species richness–productivity relationship is scale dependent [39], environmental heterogeneity may have partially absorbed the area effect at the grid scale used in this study.

4.2. Why Area Does Not Govern Turnover: The Quantitative–Qualitative Divide and Environmental Filtering

In contrast to H1, protection coverage did not show a significant relationship with Jaccard turnover in the Beta regression analysis. Although the NMS results showed partial but statistically significant separation among the three area groups, this pattern is more likely associated with environmental variation covarying with area groups than with the area itself. The RF analysis likewise showed that environmental predictors had greater relative importance for species turnover than protection coverage.
These findings are consistent with global meta-analyses reporting that protected areas enhance species richness and abundance but do not necessarily increase rarefied richness and endemicity [4]. This suggests that the primary effect of protected areas may involve maintaining a greater number of individuals and species rather than generating more diverse ecological niches. In this study, the quantitative–qualitative divide was reflected in the ζ-diversity analysis. Previous global analyses examining the relationships between species richness and ecological uniqueness or local contributions to beta diversity have reported either weak or negative relationships across plants, freshwater invertebrates, birds, and fish, with environmental filtering and dispersal limitation identified as major drivers [13]. The present results suggest that similar patterns occur in the East Asian mountainous protected area systems. In other words, expanding protection coverage may increase the number of species maintained within the protected areas, whereas the spatial structure of species occurrence is more strongly shaped by environmental conditions.
The mechanism underlying this quantitative–qualitative divide becomes clearer in ζ-diversity analysis. In this study, the power-law model provided a better fit than the exponential model across all groups, including the SM, ME and LA groups, and the power-law slopes differed only slightly among the groups. Support for the power-law model suggests deterministic community assembly, in which species are distributed non-randomly according to environmental conditions, whereas the exponential model suggests stochastic assembly and dispersal limitation [8]. This consistent support for the power-law model across all three groups indicates that plant communities in the core zones of Baekdudaegan are assembled under similar environmental influences regardless protection coverage. This finding is consistent with community assembly frameworks emphasizing environmental filtering as a dominant mechanism shaping β-diversity patterns in natural, low-disturbance forests [40,41]. The consistent power-law support across all area groups indicates that plant communities in the core zones are assembled primarily through environmental selection, independently of protection coverage. Considering that Baekdudaegan forms the ecological axis of the Korean Peninsula and contains strong elevation and climatic gradients, the dominant influence of environmental filtering on community assembly is ecologically plausible. Consequently, expanding the protection coverage alone is unlikely to produce substantial changes in community assembly processes. The qualitative conservation value of protected areas depends not on the area itself but on the range of environmental conditions and habitat quality represented within the protected areas.
The importance of species turnover in conservation planning has long been emphasized. In regions characterized by rapid species turnover, a single protected area cannot adequately represent regional biodiversity, making the placement and configuration of protected areas particularly important [10]. Fine-scale analyses using plant datasets have demonstrated that β-diversity can function as an effective surrogate for species representation [11]. Similarly, studies of Australian vegetation-monitoring networks have shown that turnover-based prioritization performs better than species richness-based prioritization in terms of ecological representativeness [12]. In Mediterranean marine protected area networks, when turnover dominates nestedness, connectivity and network representativeness have been identified as major determinants of conservation effectiveness [42]. The findings of this study align with these international trends and suggest that protected area policy in Korea remains largely focused on area and species richness [9].

4.3. Policy Implications and Limitations

The results of this study provide important implications for the implementation of KMGBF Target 3, which aims to ensure that at least 30% of terrestrial, inland water, and coastal and marine areas are effectively conserved and managed by 2030. As area expansion contributes to increased species richness, the “30 by 30” target may be justified from the perspective of plant α-diversity conservation. However, because protection coverage did not affect species turnover or community assembly processes, merely achieving quantitative area targets does not guarantee the qualitative maintenance of biodiversity. Critical reviews of KMGBF Target 3 have similarly concluded that effectiveness, representativeness, and connectivity must be improved together rather than through coverage expansion alone, and that the 30% and 50% targets have limited meaning unless these qualitative dimensions are addressed [23]. This interpretation is consistent with the findings of the present study. The “irreplaceability” of protected areas, rather than the area alone, is a key determinant of conservation effectiveness [1]. Furthermore, reports indicating that protected-area networks fail to represent approximately 40% of the unseen biodiversity suggest that site selection approaches centered on vertebrates may not adequately represent diverse taxa, such as plants and insects [43]. Critiques of the Half-Earth hypothesis have likewise emphasized that biodiversity value and site selection, rather than the area itself, are the key determinants of conservation effectiveness [44].
Habitat connectivity is another important consideration. Only 10% of protected areas worldwide are structurally connected, highlighting the urgent need for the conservation and restoration of intact landscapes surrounding protected areas [45]. Quantitative evaluations have further shown that the “well-connected” component of Aichi Target 11 has rarely been achieved [46], whereas recent studies have emphasized that functional connectivity, the degree to which landscapes facilitate species movement among habitat patches, should be a major conservation priority [47]. Habitat connectivity indicators aligned with the Essential Biodiversity Variables framework have recently been proposed for evaluating the KMGBF implementation [48]. The results of this study suggest that although area expansion is an effective strategy for conserving and enhancing α-diversity, future conservation policies should focus on habitat connectivity. As the Baekdudaegan extends north–south as the ecological axis of the Korean Peninsula and is fragmented by agricultural lands and roads, strengthening connectivity among core, buffer, and transition zones, as well as establishing corridors among core zones, may represent a more important conservation priority than simply expanding the protection coverage. The concept emphasized in Japanese conservation policy, “quality, not quantity, matters,” as well as land-sharing approaches such as satoyama and Other Effective Area-Based Conservation Measures (OECMs), may provide important implications for Korean protected-area policy [49].
This study had several limitations. First, our design is correlational and does not include a counterfactual comparison with unprotected or differently-managed sites. As such, our findings should be interpreted as associations between protection coverage and plant biodiversity patterns rather than as causal effects of protection itself. Quasi-experimental designs using matched unprotected sites (e.g., propensity score matching or nearest-neighbor matching) would be required to evaluate causal conservation effectiveness, and we encourage future studies to adopt such designs as a logical next step building on the present case study. Second, our analytical unit is the grid cell within a single protected area rather than multiple distinct protected areas of varying sizes. Therefore, the findings reflect within-protected-area variation in protection coverage, not the effects of protection coverage in a broader sense. Third, because the analytical units were limited to 60 grid cells, the statistical power may be limited. Fourth, this study used a cross-sectional design and therefore could not evaluate changes in species composition before and after the protected area designation. Selection bias—in which species-rich regions are preferentially designated as protected areas—cannot be ruled out. Fifth, although temperature, precipitation, elevation, slope, and habitat quality were included as environmental covariates, several potentially important variables—including soil type, bedrock geology, forest type, land-use history, and survey effort—were not considered. The absence of edaphic and historical variables in particular may have contributed to unexplained variance in both species richness and turnover, and future studies should incorporate these variables to improve model explanatory power. Fourth, plant occurrence data were recorded at the grid cell level rather than exclusively within core-zone boundaries, meaning that floristic data may include species observed outside the protected core zone. Future studies should, where possible, use occurrence data spatially filtered to protected area boundaries.

5. Conclusions

This study evaluated the effects of protected-area size on plant biodiversity from quantitative and qualitative perspectives using 60 grid cells within the core zones of the Baekdudaegan Protected Area. The main findings are summarized as follows. First protection coverage contributed to increased plant species richness, although its explanatory power was weaker than that of environmental gradients, including temperature, elevation, and precipitation. Second, protection coverage did not significantly explain species turnover or multisite species-sharing structure, both of which were more strongly associated with environmental conditions; accordingly, H2 was largely not supported. Third, the consistent support for the ζ-diversity power-law model across all coverage groups suggests that deterministic community assembly driven by environmental filtering operates regardless of protection coverage.
These findings provide empirical evidence that protection coverage expansion alone contributes modestly to plant species richness but does not maintain species composition and community assembly patterns, which are overwhelmingly determined by environmental conditions. However, maintaining the spatial structure of species composition requires conservation approaches that extend beyond area expansion to include environmental representativeness, habitat quality, and connectivity among protected areas. Accordingly, future biodiversity conservation policies in Korea should shift from a primary focus on area expansion to improving conservation outcomes and connectivity. This may require improvements in protected area site evaluation criteria that incorporate environmental gradients, the establishment of corridors among core zones, and greater consideration of land-sharing approaches, such as OECMs.
In addition, broad meta-analytic studies examining the relationship between habitat connectivity and biodiversity maintenance are required to support future international conservation agendas. The results of this study highlight the limitations of area-based conservation strategies for plant taxa and East Asian mountainous protected area systems, while providing empirical evidence supporting the importance of habitat connectivity in future biodiversity policy.

Supplementary Materials

The following supporting information can be downloaded at: https://www.mdpi.com/article/10.3390/d18070413/s1, Table S1. Overdispersion diagnostics for Poisson and negative binomial models fitted to species-richness data.

Author Contributions

Conceptualization, B.-J.P.; methodology, K.C. and B.-J.P.; software, K.C. and B.-J.P.; validation, K.C. and B.-J.P.; formal analysis, B.-J.P.; investigation, K.C. and B.-J.P.; resources, K.C.; data curation, B.-J.P.; writing—original draft preparation, K.C. and B.-J.P.; writing—review and editing, B.-J.P.; visualization, B.-J.P.; supervision, B.-J.P.; project administration, K.C.; funding acquisition, K.C. All authors have read and agreed to the published version of the manuscript.

Funding

This research was conducted as part of the National Institute of Ecology’s research project, “Study on the Thematic and Demand Assessment of Ecosystem Services (26) (Project No. NIE-B-2026-03)” and the Korea Environmental Industry and Technology Institute project, “Development of decision support integrated impact assessment model for climate change, adaptation: ecosystem (Project No. 2022003570001)” in the Republic of Korea.

Institutional Review Board Statement

Not applicable.

Data Availability Statement

The raw data supporting the conclusions of this study will be made available by the authors upon request.

Acknowledgments

We thank all the participants involved in the National Ecosystem Survey for their contributions.

Conflicts of Interest

The authors declare no conflicts of interest.

Abbreviations

The following abbreviations are used in this manuscript:
KMGBFKunming–Montreal Global Biodiversity Framework
MRPPmulti-response permutation procedure
NMSnon-metric multidimensional scaling
AICAkaike’s Information Criterion
RFRandom Forest
IRRIncidence Rate Ratio

References

  1. Le Saout, S.; Hoffmann, M.; Shi, Y.; Hughes, A.; Bernard, C.; Brooks, T.M.; Bertzky, B.; Butchart, S.H.M.; Stuart, S.N.; Badman, T.; et al. Protected areas and effective biodiversity conservation. Science 2013, 342, 803–805. [Google Scholar] [CrossRef] [PubMed]
  2. Convention on Biological Diversity (CBD). Kunming-Montreal Global Biodiversity Framework; CBD/COP/DEC/15/4 Convention on Biological Diversity (CBD); Secretariat of the Convention on Biological Diversity: Montreal, QC, Canada, 2022; Available online: https://www.cbd.int/doc/decisions/cop-15/cop-15-dec-04-en.pdf (accessed on 7 January 2026).
  3. Coetzee, B.W.T.; Gaston, K.J.; Chown, S.L. Local scale comparisons of biodiversity as a test for global protected area ecological performance: A meta-analysis. PLoS ONE 2014, 9, e105824. [Google Scholar] [CrossRef] [PubMed]
  4. Gray, C.L.; Hill, S.L.L.; Newbold, T.; Hudson, L.N.; Börger, L.; Contu, S.; Hoskins, A.J.; Ferrier, S.; Purvis, A.; Scharlemann, J.P.W. Local biodiversity is higher inside than outside terrestrial protected areas worldwide. Nat. Commun. 2016, 7, 12306. [Google Scholar] [CrossRef] [PubMed]
  5. Loucks, C.; Ricketts, T.H.; Naidoo, R.; Lamoreux, J.; Hoekstra, J. Explaining the global pattern of protected area coverage: Relative importance of vertebrate biodiversity, human activities and agricultural suitability. J. Biogeogr. 2008, 35, 1337–1348. [Google Scholar] [CrossRef]
  6. Westgate, M.J.; Barton, P.S.; Lane, P.W.; Lindenmayer, D.B. Global meta-analysis reveals low consistency of biodiversity congruence relationships. Nat. Commun. 2014, 5, 3899. [Google Scholar] [CrossRef] [PubMed]
  7. Baselga, A. Partitioning the turnover and nestedness components of beta diversity. Glob. Ecol. Biogeogr. 2010, 19, 134–143. [Google Scholar] [CrossRef]
  8. Hui, C.; McGeoch, M.A. Zeta diversity as a concept and metric that unifies incidence-based biodiversity patterns. Am. Nat. 2014, 184, 684–694. [Google Scholar] [CrossRef] [PubMed]
  9. Socolar, J.B.; Gilroy, J.J.; Kunin, W.E.; Edwards, D.P. How should beta-diversity inform biodiversity conservation? Trends Ecol. Evol. 2016, 31, 67–80. [Google Scholar] [CrossRef] [PubMed]
  10. McKnight, M.W.; White, P.S.; McDonald, R.I.; Lamoreux, J.F.; Sechrest, W.; Ridgely, R.S.; Stuart, S.N. Putting beta-diversity on the map: Broad-scale congruence and coincidence in the extremes. PLoS Biol. 2007, 5, e272. [Google Scholar] [CrossRef] [PubMed]
  11. Beier, P.; Albuquerque, F.S. Evaluating β diversity as a surrogate for species representation at fine scale. PLoS ONE 2016, 11, e0151048. [Google Scholar] [CrossRef] [PubMed]
  12. Martín-Forés, I.; Guerin, G.R.; Munroe, S.E.M.; Sparrow, B. Applying conservation reserve design strategies to define ecosystem monitoring priorities. Ecol. Evol. 2021, 11, 17060–17070. [Google Scholar] [CrossRef] [PubMed]
  13. Landeiro, V.L.; Franz, B.; Heino, J.; Siqueira, T.; Bini, L.M. Species-poor and low-lying sites are more ecologically unique in a hyperdiverse Amazon region: Evidence from multiple taxonomic groups. Divers. Distrib. 2018, 24, 966–977. [Google Scholar] [CrossRef]
  14. National Institute of Ecology. Manual of the 5th National Survey of Natural Environment; National Institute of Ecology: Seocheon, Republic of Korea, 2019; pp. 11–50. [Google Scholar]
  15. Park, B.J.; Cheon, K. Species composition and ecological niche overlap of alien and endemic plants in South Korea: Insights from the National Ecosystem Survey. Forests 2025, 16, 1485. [Google Scholar] [CrossRef]
  16. National Institute of Ecology. Floristic Dataset of the National Ecosystem Survey (3rd–5th Surveys); EcoBank: Seocheon, Republic of Korea, 2023; Available online: https://www.nie-ecobank.kr (accessed on 4 January 2026).
  17. Korea Forest Service. Protected Area on Baekdudaegan. 2026. Available online: https://map.forest.go.kr/forest/?systype=mapSearch&searchOption=backdudaegan (accessed on 5 January 2026).
  18. Moon, Y.; Cha, J.; Lee, S. Consultation status of environmental impact assessment and management measures in the Baekdudaegan Protected Area. J. Environ. Impact Assess. 2025, 34, 546–558. [Google Scholar]
  19. Fick, S.E.; Hijmans, R.J. WorldClim 2: New 1-km spatial resolution climate surfaces for global land areas. Int. J. Climatol. 2017, 37, 4302–4315. [Google Scholar] [CrossRef]
  20. NASA Jet Propulsion Laboratory (JPL). NASA Shuttle Radar Topography Mission Global 1 Arc Second; National Aeronautics and Space Administration Land Processes Distributed Active Archive Center: Sioux Falls, SD, USA, 2013. [CrossRef]
  21. Sharp, R.; Tallis, H.T.; Ricketts, T.; Guerry, A.D.; Wood, S.A.; Chaplin-Kramer, R.; Nelson, E.; Ennaanay, D.; Wolny, S.; Olwero, N.; et al. InVEST User’s Guide; The Natural Capital Project, Stanford University, University of Minnesota; The Nature Conservancy, and World Wildlife Fund: Stanford, CA, USA, 2014. [Google Scholar]
  22. Magurran, A.E. Measuring Biological Diversity; Blackwell Publishing: Oxford, UK, 2004. [Google Scholar]
  23. Jaccard, P. Étude comparative de la distribution florale dans une portion des Alpes et des Jura. Bull. Soc. Vaudoise Sci. Nat. 1901, 37, 547–579. [Google Scholar]
  24. Koleff, P.; Gaston, K.J.; Lennon, J.J. Measuring beta diversity for presence–absence data. J. Anim. Ecol. 2003, 72, 367–382. [Google Scholar] [CrossRef]
  25. Cameron, A.C.; Trivedi, P.K. Regression Analysis of Count Data, 2nd ed.; Cambridge University Press: Cambridge, UK, 2013. [Google Scholar] [CrossRef]
  26. Ferrari, S.; Cribari-Neto, F. Beta regression for modelling rates and proportions. J. Appl. Stat. 2004, 31, 799–815. [Google Scholar] [CrossRef]
  27. McCune, B.; Grace, J.B. Analysis of Ecological Communities; MjM Software Design: Gleneden Beach, OR, USA, 2002; pp. 179–204. [Google Scholar]
  28. McGeoch, M.A.; Latombe, G.; Andrew, N.R.; Nakagawa, S.; Nipperess, D.A.; Roigé, M.; Marzinelli, E.M.; Campbell, A.H.; Vergés, A.; Thomas, T.; et al. Measuring continuous compositional change using decline and decay in zeta diversity. Ecology 2019, 100, e02832. [Google Scholar] [CrossRef] [PubMed]
  29. Akaike, H. A new look at the statistical model identification. IEEE Trans. Autom. Control 1974, 19, 716–723. [Google Scholar] [CrossRef]
  30. Liaw, A.; Wiener, M. Classification and regression by randomForest. R News 2002, 2, 18–22. [Google Scholar]
  31. Breiman, L. Random forests. Mach. Learn. 2001, 45, 5–32. [Google Scholar] [CrossRef]
  32. R Core Team. R: A Language and Environment for Statistical Computing; R Foundation for Statistical Computing: Vienna, Austria, 2026; Available online: https://www.R-project.org/ (accessed on 7 January 2026).
  33. Venables, W.N.; Ripley, B.D. Modern Applied Statistics with S, 4th ed.; Springer: New York, NY, USA, 2002. [Google Scholar]
  34. Cribari-Neto, F.; Zeileis, A. Beta regression in R. J. Stat. Softw. 2010, 34, 1–24. [Google Scholar] [CrossRef]
  35. Latombe, G.; Hui, C.; McGeoch, M.A. zetadiv: An R Package for Computing Compositional Change Across Multiple Sites, Assemblages or Cases. R Package Version 1.2.0. 2018. Available online: https://CRAN.R-project.org/package=zetadiv (accessed on 7 January 2026).
  36. Wickham, H. ggplot2: Elegant Graphics for Data Analysis, 2nd ed.; Springer International Publishing: Cham, Switzerland, 2016. [Google Scholar]
  37. Arneth, A.; Leadley, P.; Claudet, J.; Coll, M.; Rondinini, C.; Rounsevell, M.D.A.; Shin, Y.J.; Alexander, P.; Fuchs, R. Making protected areas effective for biodiversity, climate and food. Glob. Change Biol. 2023, 29, 3883–3894. [Google Scholar] [CrossRef] [PubMed]
  38. Mcdonald, R.I.; Kareiva, P.; Forman, R.T.T. The implications of current and future urbanization for global protected areas and biodiversity conservation. Biol. Conserv. 2008, 141, 1695–1703. [Google Scholar] [CrossRef]
  39. Whittaker, R.J.; Willis, K.J.; Field, R. Scale and species richness: Towards a general, hierarchical theory of species diversity. J. Biogeogr. 2001, 28, 453–470. [Google Scholar] [CrossRef]
  40. Mori, A.S.; Isbell, F.; Seidl, R. β-diversity, community assembly, and ecosystem functioning. Trends Ecol. Evol. 2018, 33, 549–564. [Google Scholar] [CrossRef] [PubMed]
  41. Shi, W.; Wang, Y.Q.; Xiang, W.S.; Li, X.K.; Cao, K.F. Environmental filtering and dispersal limitation jointly shaped the taxonomic and phylogenetic beta diversity of natural forests in southern China. Ecol. Evol. 2021, 11, 8783–8794. [Google Scholar] [CrossRef] [PubMed]
  42. Bevilacqua, S.; Boero, F.; De Leo, F.; Guarnieri, G.; Mačić, V.; Benedetti-Cecchi, L.; Terlizzi, A.; Fraschetti, S. β-diversity reveals ecological connectivity patterns underlying marine community recovery: Implications for conservation. Ecol. Appl. 2023, 33, e2867. [Google Scholar] [CrossRef] [PubMed]
  43. Delso, Á.; Fajardo, J.; Muñoz, J. Protected area networks do not represent unseen biodiversity. Sci. Rep. 2021, 11, 12275. [Google Scholar] [CrossRef] [PubMed]
  44. Pimm, S.L.; Jenkins, C.N.; Li, B.V. How to protect half of Earth to ensure it protects sufficient biodiversity. Sci. Adv. 2018, 4, eaat2616. [Google Scholar] [CrossRef] [PubMed]
  45. Ward, M.; Saura, S.; Williams, B.; Ramírez-Delgado, J.P.; Arafeh-Dalmau, N.; Allan, J.R.; Venter, O.; Dubois, G.; Watson, J.E.M. Just ten percent of the global terrestrial protected area network is structurally connected via intact land. Nat. Commun. 2020, 11, 4563. [Google Scholar] [CrossRef] [PubMed]
  46. Saura, S.; Bastin, L.; Battistella, L.; Mandrici, A.; Dubois, G. Protected areas in the world’s ecoregions: How well connected are they? Ecol. Indic. 2017, 76, 144–158. [Google Scholar] [CrossRef] [PubMed]
  47. Brennan, A.; Naidoo, R.; Greenstreet, L.; Mehrabi, Z.; Ramankutty, N.; Kremen, C. Functional connectivity of the world’s protected areas. Science 2022, 376, 1101–1104. [Google Scholar] [CrossRef] [PubMed]
  48. Oehri, J.; Wood, S.L.R.; Touratier, E.; Leung, B.; Gonzalez, A. Rapid evaluation of habitat connectivity change to safeguard multispecies persistence in human-transformed landscapes. Biodivers. Conserv. 2024, 33, 4043–4071. [Google Scholar] [CrossRef]
  49. Shiono, T.; Kubota, Y.; Kusumoto, B. Area-based conservation planning in Japan: The importance of OECMs in the post-2020 Global biodiversity Framework. Glob. Ecol. Conserv. 2021, 30, e01783. [Google Scholar] [CrossRef]
Figure 1. Study area and analytical framework. (A) Location of the Baekdudaegan Protected Area (green) and the 60 core-zone grid cells (yellow) analyzed in this study, shown within South Korea and East Asia. Grid cells correspond to 1:25,000 topographic map sheets. (B) Analytical workflow showing data preparation, hypothesis testing, and synthesis. The environmental data matrix contains 60 grid cells (sampling units) × 5 environmental variables; the species incidence matrix contains 60 grid cells × n plant species. Abbreviations: NMS, non-metric multidimensional scaling; MRPP, multi-response permutation procedure.
Diversity 18 00413 g001
Figure 2. Jaccard index for a focal grid cell (i) was calculated against its eight neighboring grid cells (J-1 to J-8), and the average dissimilarity was used as the local turnover value.
Diversity 18 00413 g002
Figure 3. Relationships between protection coverage [ln(Protected area, ha)] and (a) plant species richness and (b) Jaccard species turnover across 60 grid cells in the core zones of the Baekdudaegan Protected Area. The fitted lines are based on simple regression models: a negative binomial model for species richness (left) and a beta regression model for Jaccard turnover (right). The solid line indicates a significant positive relationship between protection coverage and species richness (p = 0.027), whereas the dashed line indicates a non-significant relationship with Jaccard turnover (p = 0.587). The shaded bands represent the 95% bootstrap confidence intervals. N = 60.
Diversity 18 00413 g003
Figure 4. Non-metric multidimensional scaling (NMS) ordination of plant species composition across 60 grid cells in the core zones of the Baekdudaegan Protected Area based on the Bray–Curtis dissimilarity. Points represent individual grid cells grouped by protection coverage: SM (blue), ME (green), and LA (red) groups (n = 20 per group). Axes 1 and 2 explained 59.5% and 30.9% of the total compositional variation, respectively. Axis 1 is primarily aligned with elevation (r ≈ 0.71) and temperature (r ≈ −0.58), indicating a climatic–topographic gradient. The sequential separation of area groups along Axis 1 reflects co-variation with environmental conditions rather than direct area effects. All pairwise group comparisons were significant based on the MRPP (SM vs. LA: A = 0.305, p < 0.001; SM vs. ME: A = 0.229, p < 0.001; LA vs. ME: A = 0.089, p = 0.005), indicating significant differences in plant species composition among the protection coverage groups, with the greatest compositional separation between the SM and LA groups.
Diversity 18 00413 g004
Figure 5. Permutation importance of predictors for (a) plant species richness and (b) Jaccard species turnover based on Random Forest analysis (n = 60). Dark blue bars indicate protection coverage [ln(Protected area, ha)], whereas light blue bars indicate environmental variables (Temperature, Precipitation, Slope, Elevation, Habitat quality). Error bars represent ± 1 standard deviation across 100 permutations. Out-of-bag R2 = 0.073 for species richness and 0.164 for Jaccard turnover; cross-validated R2 = −0.098 and 0.039, respectively, indicating that the importance values should be interpreted as supplementary evidence.
Diversity 18 00413 g005
Figure 6. Zeta diversity decline curves and model fits for three protected-area size groups in the core zones of the Baekdudaegan Protected Area. The upper panel shows zeta diversity (ζ) as a function of zeta order (1–15) for the LA (red), ME (green), and SM (blue) groups, each comprising 20 grid cells. The lower panels present the semi-log (exponential regression) and log-log plots (power-law regression) plots for each group. Steeper slopes indicate a faster decline in multisite species sharing. All three groups supported a power-law model, suggesting non-random, environmentally filtered community assembly, regardless of protection coverage.
Diversity 18 00413 g006
Table 1. Results of covariate regression models examining the effects of protected-area size and environmental variables on plant species richness and Jaccard species turnover across 60 grid cells in the core zones of the Baekdudaegan Protected Area. Species richness was modeled using a negative binomial generalized linear model (IRR = incidence rate ratio), and Jaccard turnover was modeled using beta regression (exp(β) = exponentiated coefficient). For the beta regression, all predictors were z-standardized before the analysis.
PredictorSpecies RichnessSpecies Turnover
IRRpexp(β)p
ln(Protected area)1.0640.0801.0080.823
Temperature1.205<0.0010.592<0.001
Precipitation0.9990.0491.294<0.001
Slope1.0120.4510.9760.725
Elevation1.001<0.0010.510<0.001
Habitat quality0.3650.1611.0860.194
Disclaimer/Publisher’s Note: The statements, opinions and data contained in all publications are solely those of the individual author(s) and contributor(s) and not of MDPI and/or the editor(s). MDPI and/or the editor(s) disclaim responsibility for any injury to people or property resulting from any ideas, methods, instructions or products referred to in the content.