Article

Dynamic Changes, Spatial Clustering and Fragmentation Patterns of African Forests Under Different Shared Socioeconomic Pathway Scenarios

1
School of Geography and Planning, Nanning Normal University, Nanning 530001, China
2
Key Laboratory of Environment Change and Resources Use in Beibu Gulf, Ministry of Education, Nanning Normal University, Nanning 530001, China
3
School of Surveying and Geoinformation Engineering, East China University of Technology, Nanchang 330013, China
4
Guangxi Transportation Science and Technology Group Co., Ltd., Transportation Strategy Research Institute, Nanning 530007, China
5
Institute of Digital Forestry and Green Development, College of Economics and Management, Nanjing Forestry University, Nanjing 210037, China
6
College of Engineering, City University of Hong Kong, Hong Kong 999077, China
*
Authors to whom correspondence should be addressed.
Diversity 2026, 18(7), 406; https://doi.org/10.3390/d18070406
Submission received: 1 April 2026 / Revised: 24 June 2026 / Accepted: 25 June 2026 / Published: 2 July 2026

Abstract

As a core component of terrestrial ecosystems, forests play an irreplaceable ecological role in carbon sequestration, biodiversity conservation, and global climate regulation. Home to key global forest belts including the Congo Basin, the African continent’s forest changes directly shape regional ecological balance and sustainable development while profoundly affecting global ecological security and climate dynamics. Based on the Shared Socioeconomic Pathways (SSPs), a unified narrative framework for global socioeconomic and environmental change scenarios, this study couples techniques such as the Future Land Use Simulation (FLUS) model, dynamic degree analysis, transition matrix, K-means clustering analysis, and patch fragmentation analysis. This work aims to answer two key questions: (1) What are the spatiotemporal characteristics and dominant drivers of African woodland changes under different SSPs? (2) How do spatial clustering and fragmentation patterns vary across scenarios? It systematically predicts and analyzes the spatiotemporal characteristics, driving mechanisms, and fragmentation change patterns of African woodlands in 2030, 2050, and 2070 under five scenarios (SSP1-SSP5) with 2020 as the baseline. These five official IPCC SSP frameworks represent five distinctly divergent socioeconomic development trajectories ranging from sustainable to fossil-fuel-driven development, which are the core differentiated scenarios recommended by IPCC; full inclusion facilitates systematic comparison of varied forest feedback features across Africa’s diversified national development backgrounds. The research results show that understory forests in the SSP5 (Fossil Fuel-dominated Development) scenario exhibit a stable growth trend, with the total area transferred in significantly exceeding the area transferred out from 2020 to 2070, resulting in a net increase of 143,513 km2. This growth occurs because high-income economies under this scenario invest heavily in ecological restoration and forest protection, offsetting carbon-intensive development impacts. The core forest density continues to increase and is distributed in contiguous areas; the SSP4 (uneven development) scenario regarding forest degradation is the most severe, with the dynamic rate expected to drop to −0.05% between 2050 and 2070, and a net transfer of −265,581 km2. Forest fragmentation is highest, and the core density area is gradually shrinking. Cluster analysis shows that forest area remains relatively stable in most African countries, with stable countries accounting for as much as 95.49% under scenario SSP5. Regions with woodland expansion are mainly distributed in North Africa and localized parts of Southern Africa. After refinement using independent tree-density evidence, woodland expansion in South Africa is shown to be more limited and spatially heterogeneous; these newly expanded woodlands are mostly artificial plantations and alien invasive tree stands rather than native natural woodlands, mainly occurring in eastern and southeastern areas rather than in arid western regions. The spatiotemporal transfer process exhibits significant periodic differentiation, with 2030–2050 being a critical transitional period for forest change, and the differentiation effect between scenarios intensifying. Fragmentation analysis indicates that scenario SSP3 (regional rivalry, with moderate population growth and weak policy constraints) has the best forest integration and the lowest degree of fragmentation, while scenario SSP4 is most strongly affected by human activities and has the highest risk of patch fragmentation. These findings can provide a scientific basis for African countries to formulate differentiated forest protection policies and optimize ecological restoration plans, while also offering theoretical insights for continental-scale forest ecological management.

1. Introduction

Forests are critical to global carbon cycling, biodiversity conservation, and climate regulation [1,2,3]. Africa, boasting 13.85% of the world’s forest area, is a core hotspot for global biodiversity and the ecological foundation for the sustainable development of African countries [4,5,6]. In recent years, however, African forest dynamics have shifted from unidirectional loss to a complex pattern of coexisting loss and expansion, driven by climate governance, the implementation of REDD+ (Reducing Emissions from Deforestation and Forest Degradation, a UN-led forest conservation mechanism), and community forestry [7,8,9].
On a global scale, forest change has become a core issue in land use/cover change (LUCC) studies, given its profound global consequences on ecosystems, climate regulation, and inequalities in global carbon cycles [10,11,12]. Recent advancements in remote sensing technologies, such as Synthetic Aperture Radar (SAR)-based alert systems, have further enhanced the precision of tracking global forest LUCC dynamics [13]. To systematically analyze these dynamics, scholars have constructed multi-dimensional frameworks categorizing direct and indirect driving mechanisms [14]. Existing research generally identifies agricultural expansion, driven by population and economic growth, as the primary factor for global tropical forest loss, with African deforestation frequently dominated by smallholder farming [15,16,17,18,19].
To predict future change trends, scenario simulation has formed a mature research paradigm [20]. In this context, the Shared Socioeconomic Pathways (SSPs) include five standard scenarios: SSP1 (sustainability, low emissions), SSP2 (middle of the road, moderate emissions), SSP3 (regional rivalry, moderate-high emissions), SSP4 (inequality, high emissions), and SSP5 (fossil fuel development, very high emissions). They provide a unified scenario framework for global socioeconomic and land use change research [21,22,23]. These frameworks have been successfully applied to project regional LUCC, including studies in African nations like Ethiopia under SSP-RCP scenarios [24]. Furthermore, coupling SSPs with models like Coupled Model Intercomparison Project Phase 6 (CMIP6) provides robust data support for analyzing climate-land interactions [25]. Accordingly, modeling methods have evolved towards advanced spatial dynamic simulation models (e.g., FLUS, PLUS) and machine learning approaches. Notably, models like FLUS have proven highly effective in simulating multi-scenario LUCC and assessing subsequent impacts on ecosystem services and forest carbon storage [26,27,28,29].
Despite these methodological advancements, critical research gaps persist. Although Africa is a global hotspot for LUCC research, systematic, multi-scenario simulations of long-term forest dynamics at the continental scale remain limited. Existing studies have mainly focused on forest loss processes, while long-term scenario simulations and expansion dynamics of African forests remain understudied [30,31,32]. Furthermore, most predictive studies in Africa are limited to short-term extrapolations at local scales, lacking systematic, multi-scenario simulations over long time series at the continental level [33,34].
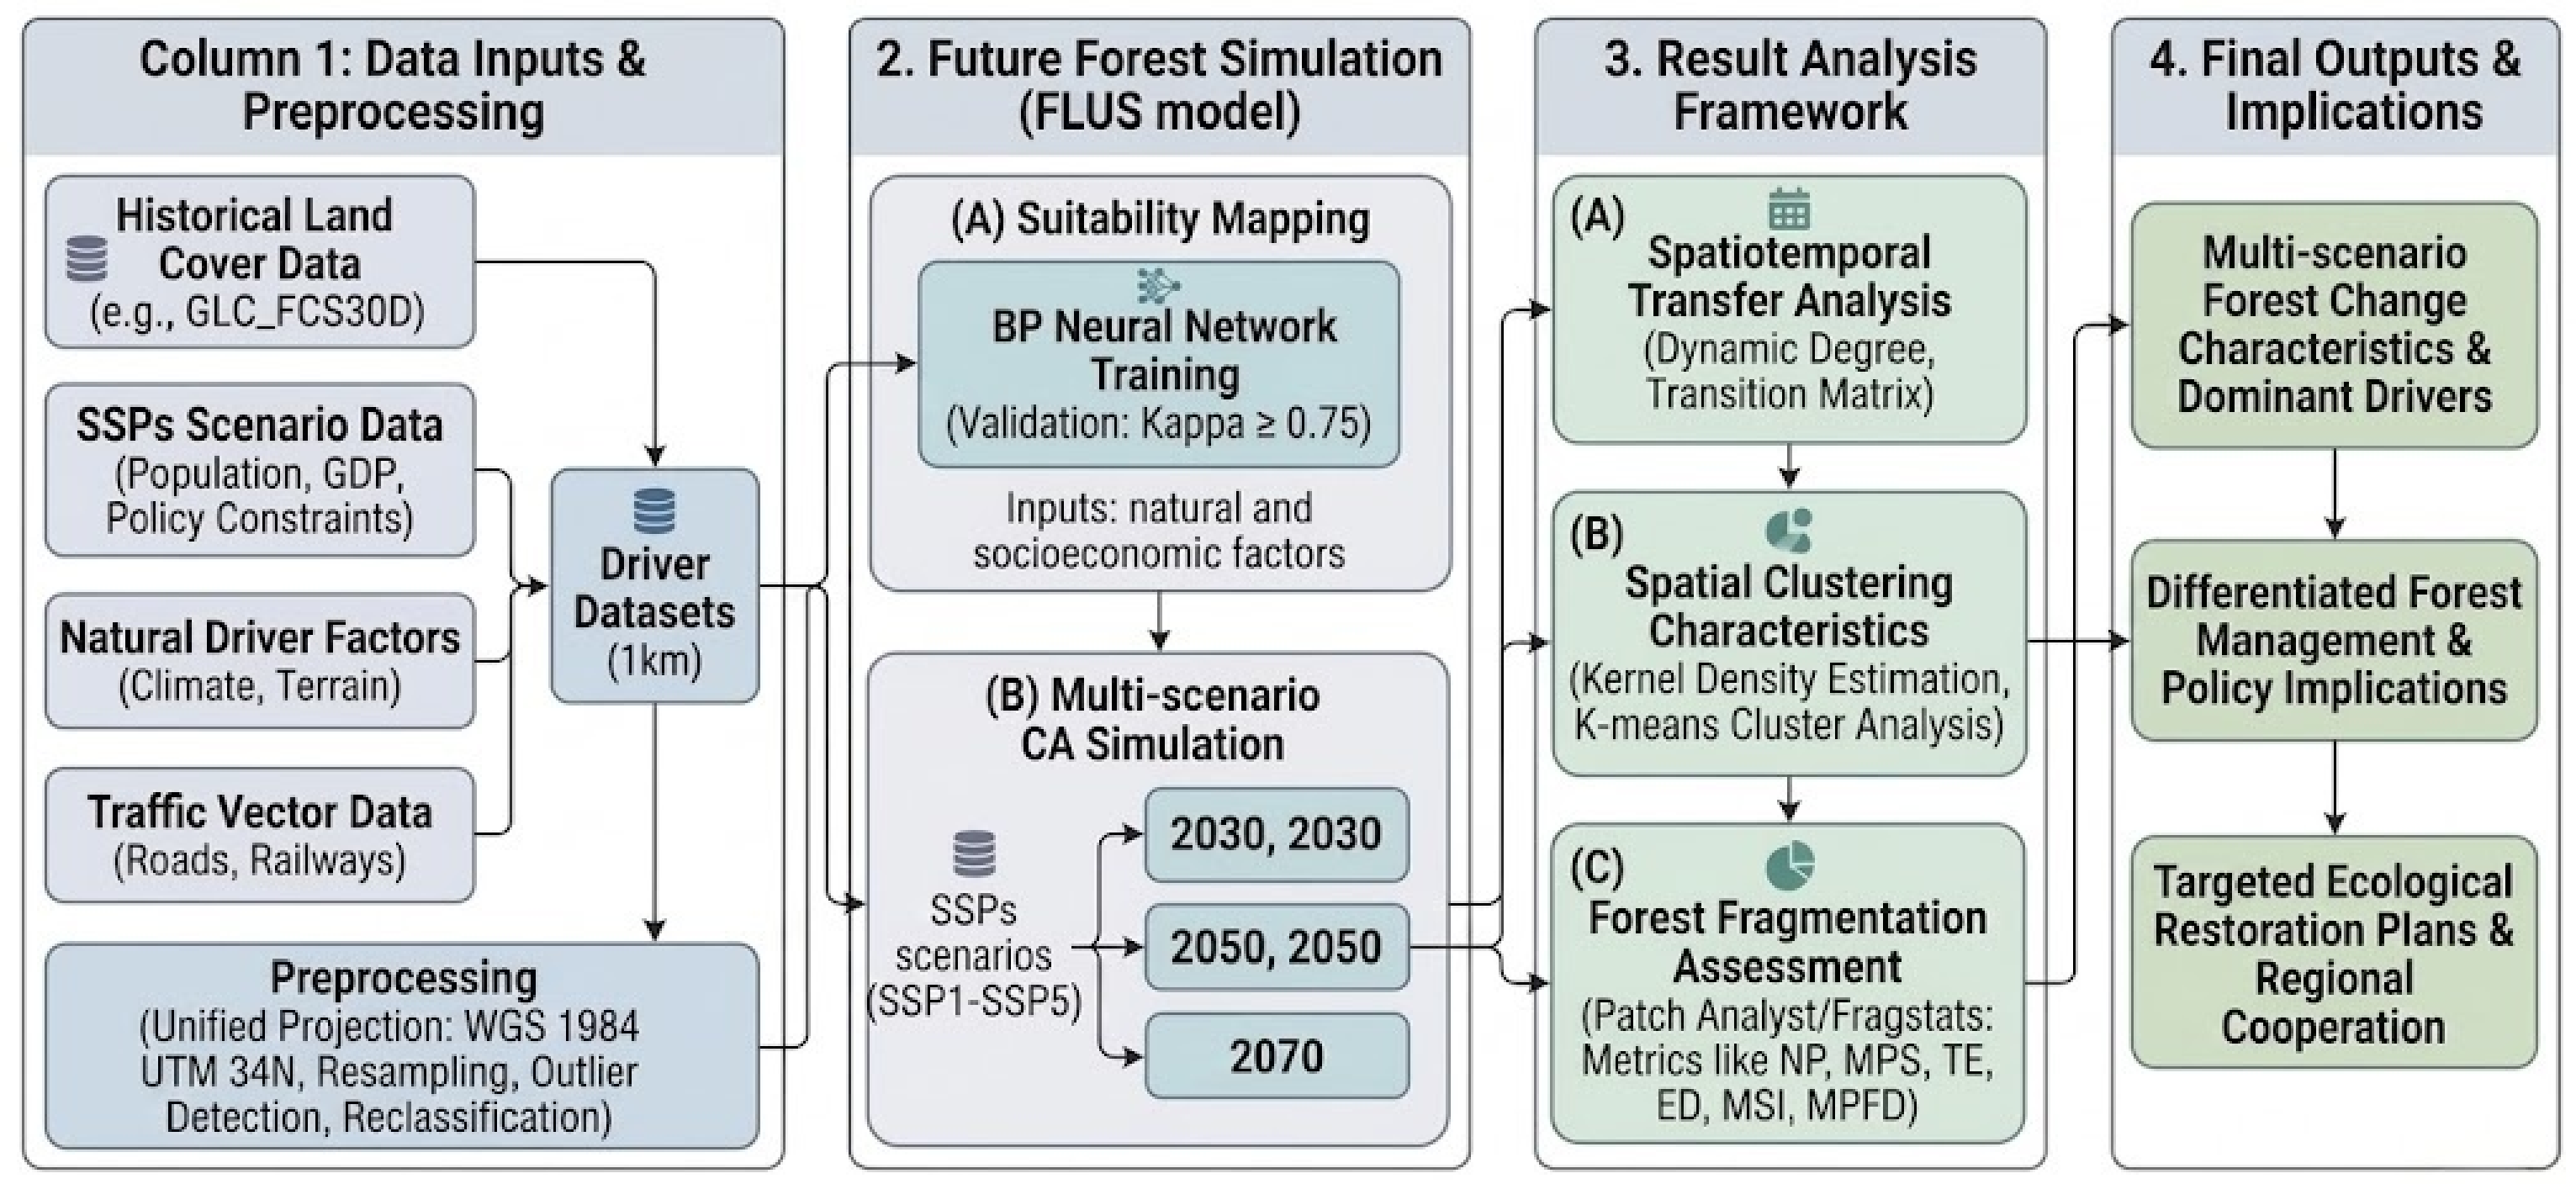
To address these shortcomings, this paper aims to answer two specific research questions: (1) What are the long-term spatiotemporal patterns and key drivers of African woodland changes under multiple SSP scenarios? (2) How do forest fragmentation and spatial clustering differ across scenarios? It conducts continental-scale scenario simulations to fill existing research gaps. By coupling the high-precision FLUS model with dynamic degree, transition matrix, and fragmentation analyses, this study systematically simulates the spatiotemporal change, driving mechanisms, and spatial clustering patterns of African woodlands from 2020 to 2070 under five SSP scenarios. The findings aim to provide a scalable analytical paradigm for global land use change research and offer precise, data-driven references for African countries to formulate differentiated forest management policies and contribute to global climate governance. The technical flowchart of the study is shown in Figure 1.

2. Materials and Methods

2.1. Geographical Focus of Study

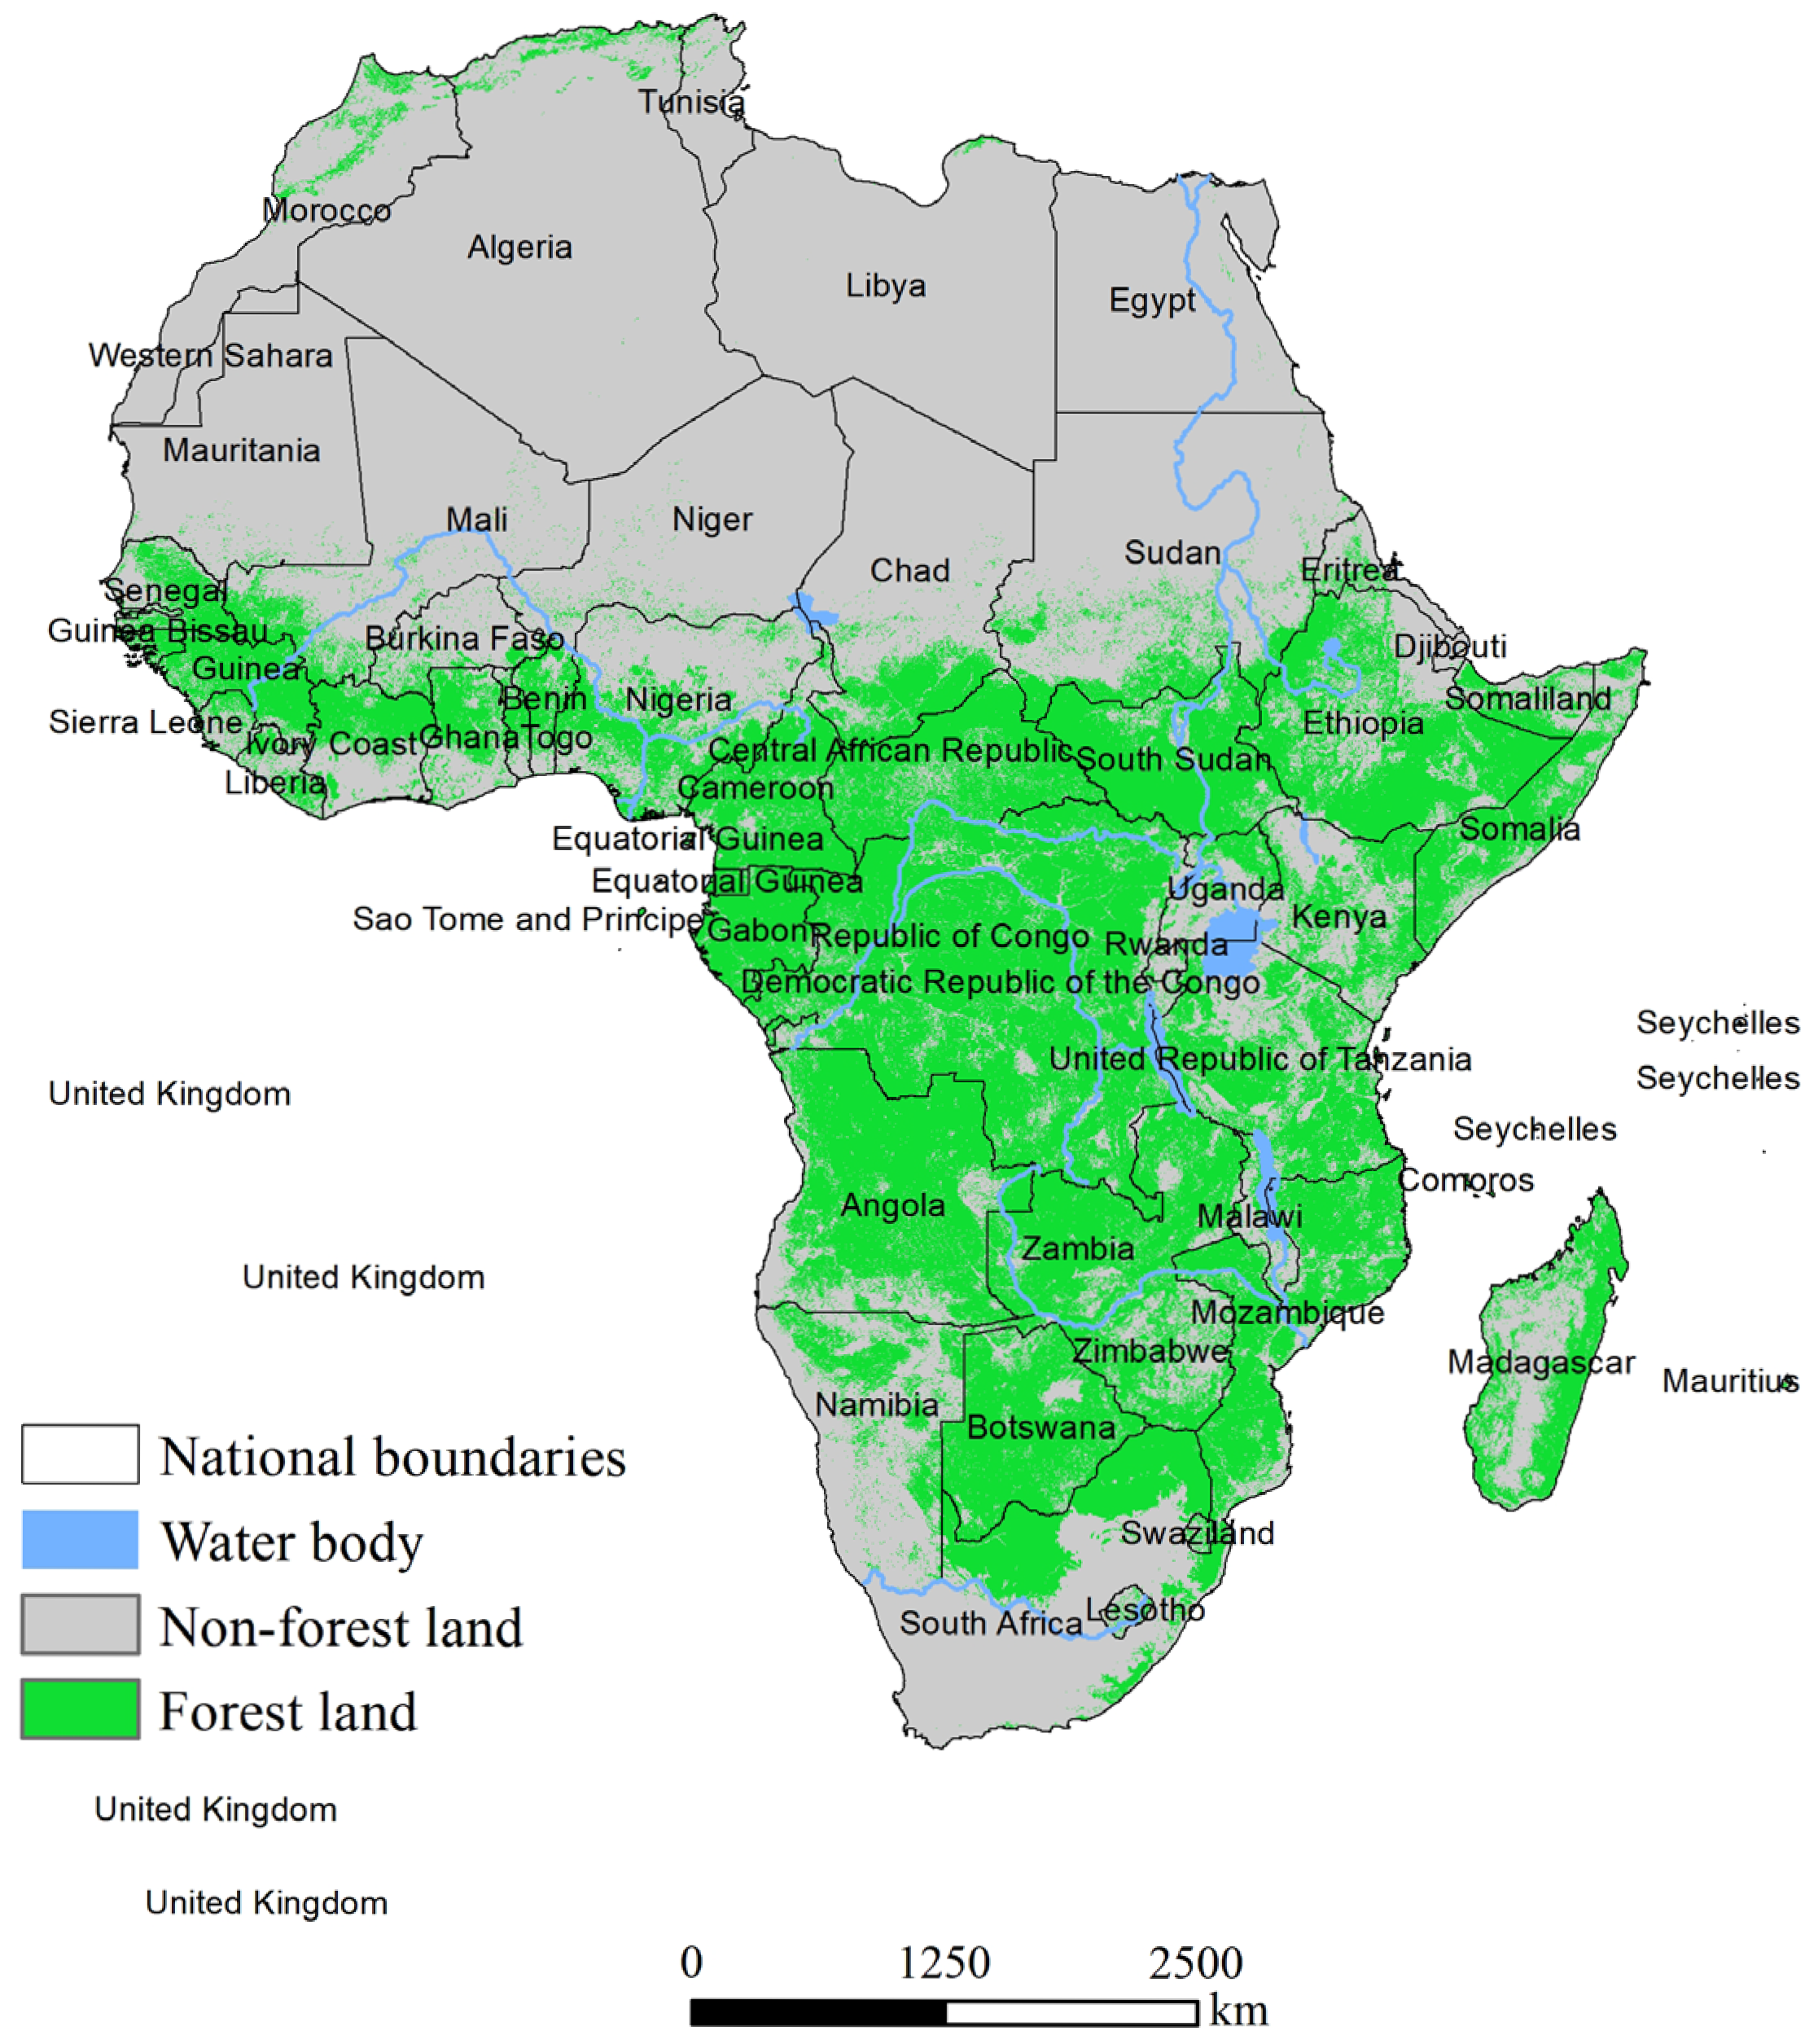
The geographical focus of this study is the African continent. It is a vast region with a predominantly plateau topography, generally sloping from southeast to northwest. The climate is predominantly tropical, symmetrically distributed between north and south, with significant differences in hydrothermal conditions, fostering diverse ecosystems such as tropical rainforests, tropical savannas, and tropical deserts. Forests, grasslands, farmlands, and built-up areas are interspersed throughout the region, making it a typical area for global land use and ecological environment change. In recent years, driven by population growth, agricultural development, economic development, and climate change, the surface landscape has changed frequently, with significant dynamic changes inof forest land, making it of important research value. The spatial scope of the African continent and the spatial distribution of forest/non-forest land in the baseline year are illustrated in Figure 2.

2.2. Data Sources and Preprocessing

2.2.1. Data Source

This study integrates land cover, climate, terrain, socioeconomic, transportation, and administrative boundary data to support forest simulation and scenario analysis. All data were obtained from official global open datasets, with detailed content, resolution, and sources provided in Table 1.

2.2.2. Data Preprocessing

To ensure the accuracy and reliability of the model simulation, a standardized data preprocessing workflow is established as follows:
Format conversion: Vector data such as transportation and administrative boundaries are kept in original vector format and not rasterized. All raster data are standardized to GeoTIFF format to ensure format consistency.
Unified projection and resolution: The WGS 1984 UTM Zone 34N (EPSG:32634) projected coordinate system is adopted for all spatial analysis, distance calculation, and resampling procedures, as EPSG:4326 is not suitable for area and distance calculations. Continuous raster data including elevation, annual precipitation, annual average temperature, and GDP density were resampled to 1 km resolution within the projected coordinate system using bilinear interpolation, while categorical land use data were resampled using nearest-neighbor interpolation to preserve class accuracy.
Research area clipping: Using the African national boundary vector data as the mask layer, the study area was clipped using the Extract by Mask tool in ArcGIS 10.8 to eliminate invalid data outside the continent.
For continuous climate and socioeconomic data, outliers were detected using the 3σ (three-sigma) [36] criterion, where values outside the range of mean ± 3× standard deviation were treated as outliers and replaced by the mean value. This approach is widely used for geospatial and environmental data preprocessing to improve data stability and reliability. Mean replacement was selected because this study focuses on continental-scale spatial simulation, where outliers are sparse and exert limited influence on overall trends. This method preserves the original data distribution and avoids over-correction. Other methods such as mathematical transformation were not applied to prevent distortion of the original driving factor characteristics required for the FLUS model.
Land use reclassification: Based on the research objectives of simulating forest distribution dynamics and fragmentation patterns at the continental scale, the original land use types were reclassified into two categories: forest land and non–forest land. This binary classification simplifies the model structure, improves simulation efficiency, and ensures focus on the core goal of forest change analysis, which is a common and reasonable strategy for large-scale land use simulation studies. Non-forest land includes cultivated land, grassland, construction land, wetland, water body, and other types and is assigned a unique code (forest land = 1, non-forest land = 0). Note: In this study, “forest” is defined consistently with the GLC_FCS30D dataset and FAO standards, referring to areas with tree coverage >10%, including sparse woodlands and shrublands. This broad definition differs from regional definitions of closed-canopy forests (>30% cover). The global tree-density map developed by Crowther et al. (2015) together with its corrigendum [35], was introduced as an auxiliary validation dataset for South Africa. The original woodland mask derived from GLC_FCS30D was cross-checked against tree-density information to reduce possible overestimation in arid and semi-arid regions. Areas showing consistently low tree-density values relative to surrounding woodland regions were considered to have weak tree-density support and were therefore excluded from the woodland category or reclassified as non-forest land. As a result, the woodland extent in South Africa was substantially reduced, and all subsequent analyses, including woodland area statistics, transition matrices, spatial clustering, kernel density patterns, and fragmentation metrics, were recalculated using the revised dataset.
Driving factor derivation: Based on SRTM Digital Elevation Model (DEM) data, terrain factors such as elevation, slope, and aspect are extracted using ArcGIS spatial analysis tools; Euclidean distance is computed directly from vector traffic data without vector-to-raster conversion to generate distance to roads and railways; and population and GDP raster data are combined to calculate population density and GDP density indicators, thus constructing a complete driving factor system.
All maps (Figures 3–6) were produced in the projected coordinate system WGS 1984 UTM Zone 34N (EPSG:32634) to support valid spatial analysis and cartographic representation. To ensure spatial consistency across multi-resolution datasets (30 m to 1 km), spatial generalization and aggregation were applied during resampling. Continuous variables (elevation, precipitation, temperature, GDP density) were aggregated using bilinear interpolation to preserve spatial gradients and trends. Categorical land use data were resampled using nearest-neighbor interpolation to maintain class integrity and avoid mixed pixels. This step eliminates uncertainty caused by resolution mismatches and is essential for valid continental-scale spatial analysis. Although resampling from 30 m to 1 km inevitably reduces fine-scale spatial detail, this resolution is a standard input for continental-scale land use models such as FLUS, and it balances computational feasibility with regional representativeness. Importantly, our fragmentation analysis focuses on relative changes and scenario differences (e.g., decreasing NP, increasing MPS) rather than absolute patch-level accuracy. Therefore, the observed trends and comparisons among SSP scenarios remain robust and reliable. The potential limitation of spatial detail loss is further acknowledged in the limitations part of the Section 7.

2.3. Research Methods

2.3.1. Future Land Use Simulation (FLUS) Model Simulation Method

The Future Land Use Simulation Model (FLUS) was used to predict forest land change. This model is based on the coupled framework of cCellular aAutomata (CA) and system dynamics (SD) and can effectively simulate land use change processes under complex driving factors [37]. The specific implementation steps are as follows:
Driver selection: Taking into account both natural constraints and human activity interference, eight core driver factors were selected. Natural driver factors include altitude, slope, annual precipitation, and annual average temperature, which collectively characterize the biophysical suitability of woodland growth. Socioeconomic drivers include population density, GDP density, distance from urban centers, and distance from transportation networks, which can reflect urbanization trends, economic development intensity, and human disturbance levels. Environmental pollution and forestry industry dynamics were implicitly incorporated via GDP density and land use conversion rules in the FLUS model, as these factors are closely related to regional economic structure and land use demand. In addition, climate change (precipitation and temperature) indirectly influences woodland dynamics by altering regional socioeconomic activities, agricultural suitability, and human land use demand, which are fully integrated into the scenario simulation framework. All factors were tested for variance inflation factor (VIF). A threshold of VIF < 10 was adopted to identify severe multicollinearity, which is a widely recognized standard in multivariate statistical analysis and geospatial modeling [38]. Distance to roads and railways represents human accessibility and disturbance intensity. Notably, the impact of road distance varies substantially across subregions in Africa:
  • In Central Africa (Congo Basin), long distances to roads limit agricultural expansion and effectively reduce forest loss.
  • In West Africa, short distances to roads strongly accelerate forest conversion due to high population pressure and intensive farming.
  • In East Africa, road proximity drives fragmentation near protected areas and populated highlands.
  • In Southern Africa, road effects are concentrated near infrastructure and energy development corridors.
These regional differentiations were fully incorporated into the FLUS model’s suitability analysis.
Model parameter calibration: Based on the revised 2020 African woodland distribution dataset, in which the South African woodland mask was refined by cross-checking with the global tree-density map, a backpropagation (BP) neural network was trained using a random sampling method, with a sampling rate of 20%. The neighborhood weight parameters were then adjusted, with the woodland neighborhood factor set to 0.01 and the built-up land factor set to 1.0. Model accuracy was evaluated using the Kappa coefficient, and a Kappa value of ≥0.75 was considered to meet the accuracy requirement for subsequent scenario simulation.
The scenario design in this study follows the IPCC’s Shared Socioeconomic Pathway (SSP) framework and is combined with the actual characteristics of socioeconomic development in Africa. Referencing common practices in large-scale land use simulation research, the key parameters under different scenarios are set as follows:
  • SSP1 (sustainable development scenario): Population growth rate: 0.5%/year; GDP growth rate: 3%/year; policy constraint intensity: 0.8.
  • SSP2 (middle development scenario): Population growth rate: 0.8%/year; GDP growth rate: 2.5%/year; policy constraint intensity: 0.5.
  • SSP3 (fragmented development scenario): Population growth rate: 1.0%/year; GDP growth rate: 2.0%/year; policy constraint intensity: 0.3.
  • SSP4 (inequality development scenario): Population growth rate: 0.9%/year; GDP growth rate: 2.2%/year; policy constraint intensity: 0.4.
  • SSP5 (fossil fuel development scenario): Population growth rate: 1.2%/year; GDP growth rate: 4.5%/year; policy constraint intensity: 0.2.
This parameter system is established according to the global SSP standard setting and regional research experience, which can reasonably reflect the possible trends of future socioeconomic changes in Africa [39,40].
Predictive data generation: The system dynamics module predicts the demand for different land use types in each time period, and the cellular automata module is started for iterative simulation. The number of iterations is set to 100, generating predicted data for the distribution of African woodlands under each scenario in the three time periods of 2030, 2050 and 2070.
This study clarifies the influences of driving variables on the FLUS model and conducts model reliability assessment. Elevation, slope, precipitation, temperature, and distance factors reflect natural constraints, while population density and GDP density represent human disturbance intensity. These variables jointly determine the spatial suitability of forest distribution and dominate the simulation results.
In the FLUS model, variable importance is automatically calculated through the BP neural network during suitability mapping, which objectively learns the contribution rate of each driving factor from the actual 2020 land use data. No manual weighting was applied, so the model avoids subjective bias and maintains full objectivity.
Model reliability was verified using the Kappa coefficient (Kappa ≥ 0.75), which confirms acceptable simulation accuracy and robustness for continental-scale scenario prediction.

2.3.2. Dynamic Degree Analysis Method

The single land use dynamic degree is a classic and widely applied indicator for quantifying the change rate and intensity of land use types. This index can effectively reflect the speed and direction of woodland expansion or loss at the continental scale and has been widely used in many recent land use change studies.
K = U b U a U a × 1 T × 100 %
This formula is a common method in land use change research and not developed by the present authors [41].
In the above formula, K represents the single land use dynamic degree (%), Ua represents the forest area (km2) at the beginning of the study period (t = a), Ub represents the forest area (km2) at the end of the study period (t = b), and T represents the length of the study period (years). A dynamic degree K > 0 indicates an increase in forest area, K < 0 indicates a decrease in forest area, and the larger the absolute value of K, the faster the rate of forest change.

2.3.3. Transition Matrix Analysis Method

A transition matrix is a basic and widely used tool for analyzing the transformation characteristics between different land use categories. It can clearly show the transformation area, direction, and ratio between forest land and non-forest land so as to reveal the spatiotemporal change law of land use structure.
M i j = M 11 M 12 M 21 M 22
This matrix formulation is a conventional method in land use change analysis and is not proposed by the authors [42].
Mij represents the area (km2) of land use type i transformed into land use type j, and i and j represent forest land and non-forest land, respectively. The transformation matrix can clearly show the mutual transformation relationship between forest land and non-forest land under various scenarios, including the transformation area, transformation direction and transformation ratio, thereby revealing the spatiotemporal transformation pattern of forest land.

2.3.4. Kernel Density Analysis Method

Kernel density estimation is a classic spatial analysis method widely used to identify spatial clustering and distribution patterns of geographic elements [43]. In this study, kernel density analysis was used to characterize the spatial aggregation degree and core distribution range of African woodlands. The Gaussian kernel function was applied with a bandwidth of 50 km, which was determined according to the continental research scale and data resolution (1 km) with reference to relevant large-scale forest spatial pattern studies [41].
Notably, kernel density (not kernel density) is a conventional method rather than a new method proposed by this study. The classification intervals of kernel density were set as low-density zone (<10 km2/km2), medium–low-density zone (10–20 km2/km2), medium-density zone (20–40 km2/km2), medium–high-density zone (40–60 km2/km2), and high-density zone (>60 km2/km2).
These intervals were determined based on two criteria, namely (1) the natural break classification (Jenks Natural Breaks) of the actual kernel density values of African woodlands in 2020, which can maximize the differences between classes while ensuring data homogeneity within classes, and (2) referring to the classification standards commonly used in large-scale forest spatial pattern research [44], so that the results are comparable with previous studies.
f ( x , y ) = 1 n π h 2 i = 1 n K ( ( x x i ) 2 ( y y i ) 2 h )
This kernel density formula follows the standard Gaussian kernel function and was not created by the authors [41].

2.3.5. K-Means Cluster Analysis

K-means clustering was used to classify African countries at the national level, supporting differentiated regional analysis of forest change trends under different SSP scenarios. Using African countries as sample units, the forest area change rate (2020–2070) was selected as the core clustering indicator. This index can directly reflect the overall net change trend of forest resources and is the most representative and comparable index for continental-scale comparative analysis. Therefore, even using a single indicator can sufficiently reflect the overall differentiation of forest change in African countries. The K-means clustering algorithm was applied to divide African countries into three categories: forest area remaining largely unchanged, forest area declining, and forest area increasing. During the clustering process, the elbow rule was used to determine the optimal number of clusters (K = 3), and the silhouette coefficient was used to verify the clustering effect (silhouette coefficient > 0.6) to ensure the rationality and reliability of the clustering results.

2.3.6. Forest Fragmentation Assessment

Multiple landscape fragmentation indices were integrated to comprehensively quantify woodland fragmentation, which is critical for assessing ecological integrity and spatial stability under future scenarios. This study used the Patch Analyst extension module in ArcGIS 10.8 as the tool for forest fragmentation analysis. Patch Analyst adopts the core landscape metric algorithms from classic FRAGSTATS [43] to systematically extract and calculate multiple attribute metrics of forest patches for quantitative fragmentation assessment. To quantify the fragmentation characteristics of African woodlands under different SSP scenarios, this study selected the following indicators for analysis: Category Area (CA), Total Landscape Area (TLA), number of patches (NP), average patch size (MPS), total edge length (TE), edge density (ED), Average Shape Index (MSI), Area-Weighted Average Shape Index (AWMSI), Average Perimeter–Area Ratio (MPAR), and Average Patch Fractal Dimension (MPFD). The classification and ecological significance of each indicator are shown in Table 2. Since this study focuses on the African woodlands ecosystem, the fragmentation analysis was conducted only for forest types. Although some of these fragmentation metrics are mathematically correlated (e.g., NP and MPS, or TE and ED), each captures a distinct aspect of landscape structure—patch abundance, size, edge complexity, and shape regularity. These metrics are widely used together in landscape ecology without prior PCA reduction because they jointly provide a holistic, interpretable characterization of fragmentation. For the purpose of comparing trends across SSP scenarios, the full set of indicators is retained to ensure transparency and comparability with existing studies. A formal correlation or redundancy test is not required for this comparative scenario analysis.

3. Quantitative Prediction of Changes in African Woodlands Under Different SSP Scenarios

3.1. Characteristics of Dynamic Changes in Forest Land

The dynamics of African woodlands under different SSP scenarios exhibit significant scenario differentiation and temporal change characteristics (Table 3). From the perspective of scenario differentiation, SSP2 has the highest dynamics (0.9942%) in the early stage (2020–2030), indicating that African woodlands under this scenario are most active in the early stages of the study. This is consistent with the relatively balanced development characteristics of agricultural expansion and ecological protection policies under the intermediate development path. SSP4 shows a continuous degradation trend, with dynamics of −1.2251% and −0.8206% in 2030–2050 and 2050–2070, respectively, and the degradation rate gradually intensifies. This reflects the dual impact of excessive encroachment on forest resources by economic expansion in a few wealthy areas and insufficient ecological protection capacity in low-income areas under the unbalanced development model. SSP5 is the only one that maintains a positive dynamic range throughout the entire period. Although the dynamic range is only 0.2206% in the early stage (2020–2030), it rises to 0.8059% in the middle stage (2030–2050) and remains at 0.3094% in the later stage (2050–2070), maintaining a stable growth trend in the long term. This reflects the synergistic effect of the rapid economic development driven by fossil fuels and the improvement in ecological protection capabilities brought about by technological progress.
From the perspective of temporal change, from 2020 to 2030, the forest land dynamics of all scenarios were positive, showing a general upward trend. Among them, the growth of scenario SSP2 was the most significant, while that of scenario SSP4 was the slowest, reflecting that African woodland was generally in a recovery phase at the beginning of the study, but the growth rates among scenarios differed significantly. From 2030 to 2050, the forest land dynamics became a critical transitional period. The dynamics of scenario SSP3 reached its peak (1.24%), while scenario SSP4 began to show a significant decline, with the dynamics dropping to −1.2251%, and the differentiation effect among scenarios intensified significantly. From 2050 to 2070, the forest land dynamics of most scenarios turned negative, with only scenario SSP5 maintaining positive growth, indicating that the pressure on forest land protection will increase in the long term, and the impact of different socioeconomic development paths on forest land will show solidification characteristics.

3.2. Analysis of Changes in Forest Area

The changes in forest area further confirm the results of the dynamic analysis and more intuitively reflect the scale characteristics of forest land change (Table 3). Quantitative analysis shows that the largest increase in forest land (121,043 km2) occurs in the SSP2 scenario from 2020 to 2030. This result is closely related to the characteristics of maintaining historical trends in socioeconomic development and a relative balance between agricultural expansion and ecological protection policies under the intermediate development path. During this period, most African countries gradually increased their investment in ecological protection while developing their economies, promoting the restorative growth of forest land area. The most significant decrease in forest land (−169,584 km2) occurs in the SSP4 scenario from 2030 to 2050. This is mainly due to the widening development gap between regions under the unbalanced development model, the accelerated industrialization and urbanization processes in high-income areas, and the large-scale encroachment on forest land. Resources are scarce, and low-income areas, burdened by economic pressures, rely excessively on forest development for livelihoods, leading to a significant shrinkage of forest area. Scenario SSP5 maintains positive growth in forest areas throughout the entire period, with a cumulative increase of 143,513 km2 from 2020 to 2070. This result is attributed to the improved ecological protection capabilities brought about by technological advancements, the reduction in damage to primary forests due to infrastructure improvements, and the positive role of policy constraints in forest protection. Scenario SSP1 exhibits a fluctuating characteristic of “increase followed by decrease.” In the early stage (2020–2030), driven by sustainable development policies, forest area increases by 40,075 km2. In the later stage (2050–2070), due to increased agricultural demand and intensified competition for land resources, forest area decreases by 62,282 km2, showing a slight net decrease (−15,452 km2) overall, reflecting the real challenges faced by forest protection under the sustainable development path.

3.3. Spatial Distribution and Kernel Density Characteristics of Forest Land

3.3.1. Spatial Distribution and Transfer Characteristics

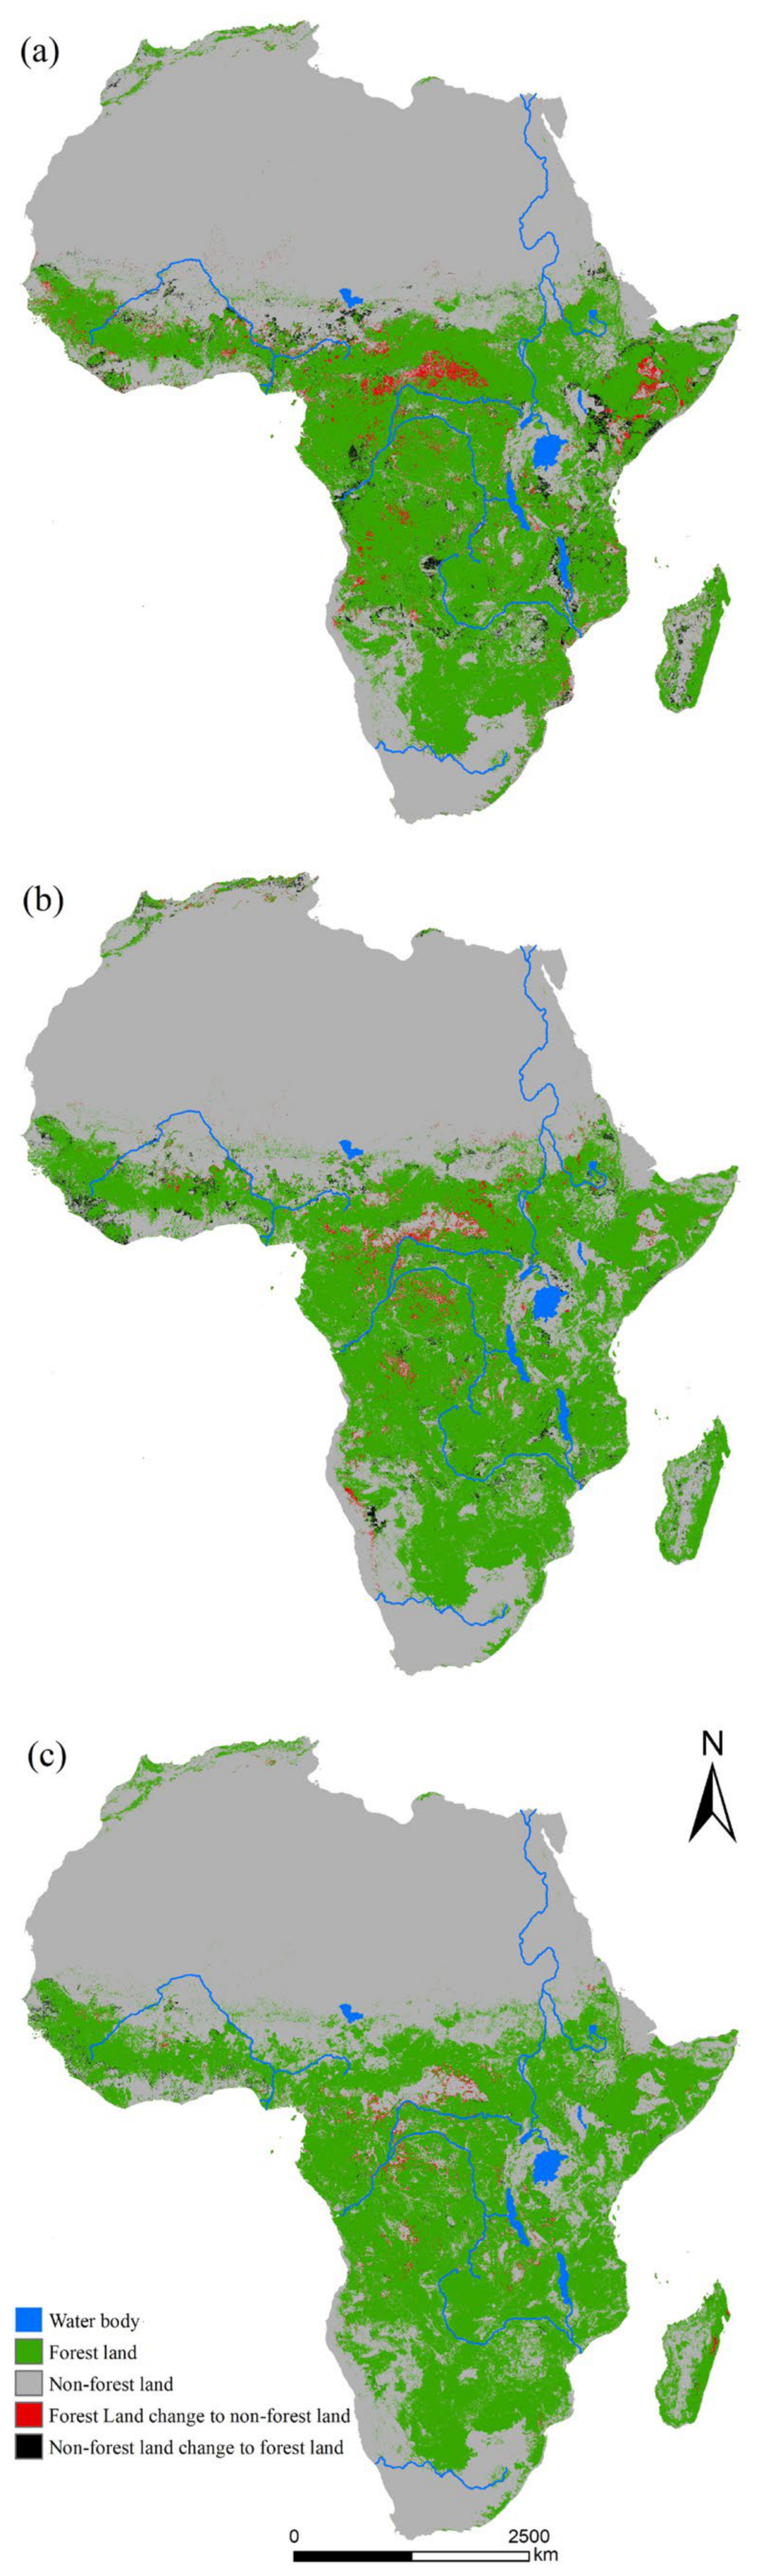
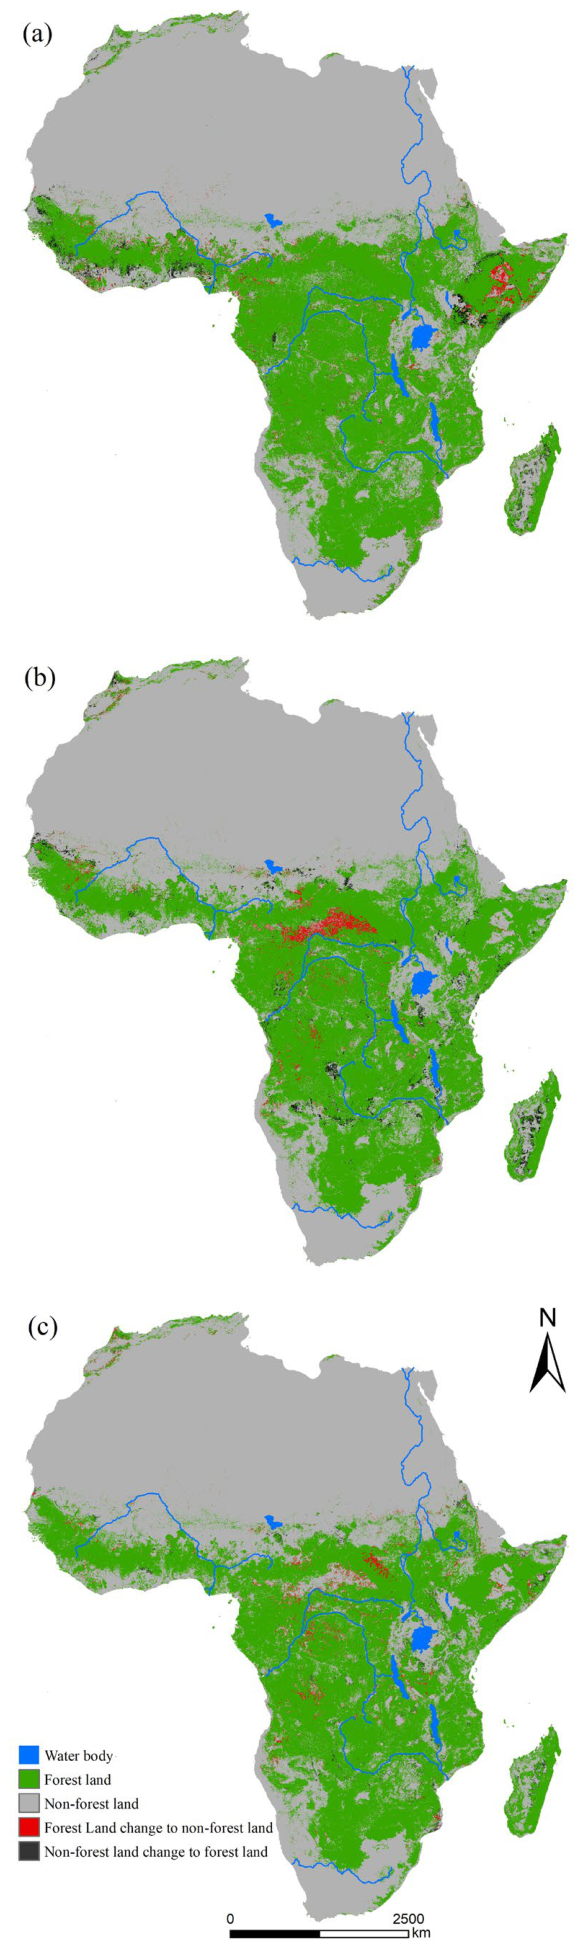
The spatial patterns of woodland change under different SSP scenarios exhibit strong regional heterogeneity across Africa. Combined with the simulation results from the FLUS model, the spatial distribution and transfer characteristics of African woodlands from 2020 to 2070 were analyzed in detail. The spatial distribution maps for each scenario (Figure 3, Figure 4, Figure 5 and Figure 6) show clear divergence among subregions, which are summarized below.
  • Central Africa (Congo Basin). The Congo Basin represents the core and most stable forest zone across all scenarios. Under SSP1 and SSP5, the core forest area remains intact and even expands slightly, with improved landscape connectivity. Under SSP4, however, the forest edges gradually shrink and fragmentation increases due to weak governance and inadequate protection. Road distance has little influence in this region because of the overall low road density.
  • West Africa. Forest dynamics in West Africa are highly sensitive to road access and human disturbance. Under SSP3 and SSP4, forest loss and fragmentation are most severe, especially along the Gulf of Guinea coast, due to intensive agricultural expansion near road networks. Under SSP1 and SSP2, stricter ecological policies effectively mitigate forest loss, and some fragmented patches recover through natural regeneration and afforestation.
  • East Africa. Forest changes in East Africa are concentrated in the equatorial highlands and coastal areas. Under SSP4, unplanned urbanization and road construction lead to rapid increases in forest fragmentation. Under SSP5, protected areas maintain good stability and show obvious restoration trends, especially in mountainous forest zones.
  • Southern Africa. Woodland resources in Southern Africa show obvious spatial divergence. Under SSP5, local woodland expansion occurs mainly in eastern South Africa under ecological restoration projects; these expanded woodlands mostly belong to artificial plantations and alien invasive tree species rather than native natural woodlands, while western arid zones remain dominated by sparse shrubs without obvious woodland growth. Road and energy construction disturbances only exist along linear development corridors and will cause localized fragmentation rather than large-area forest loss.
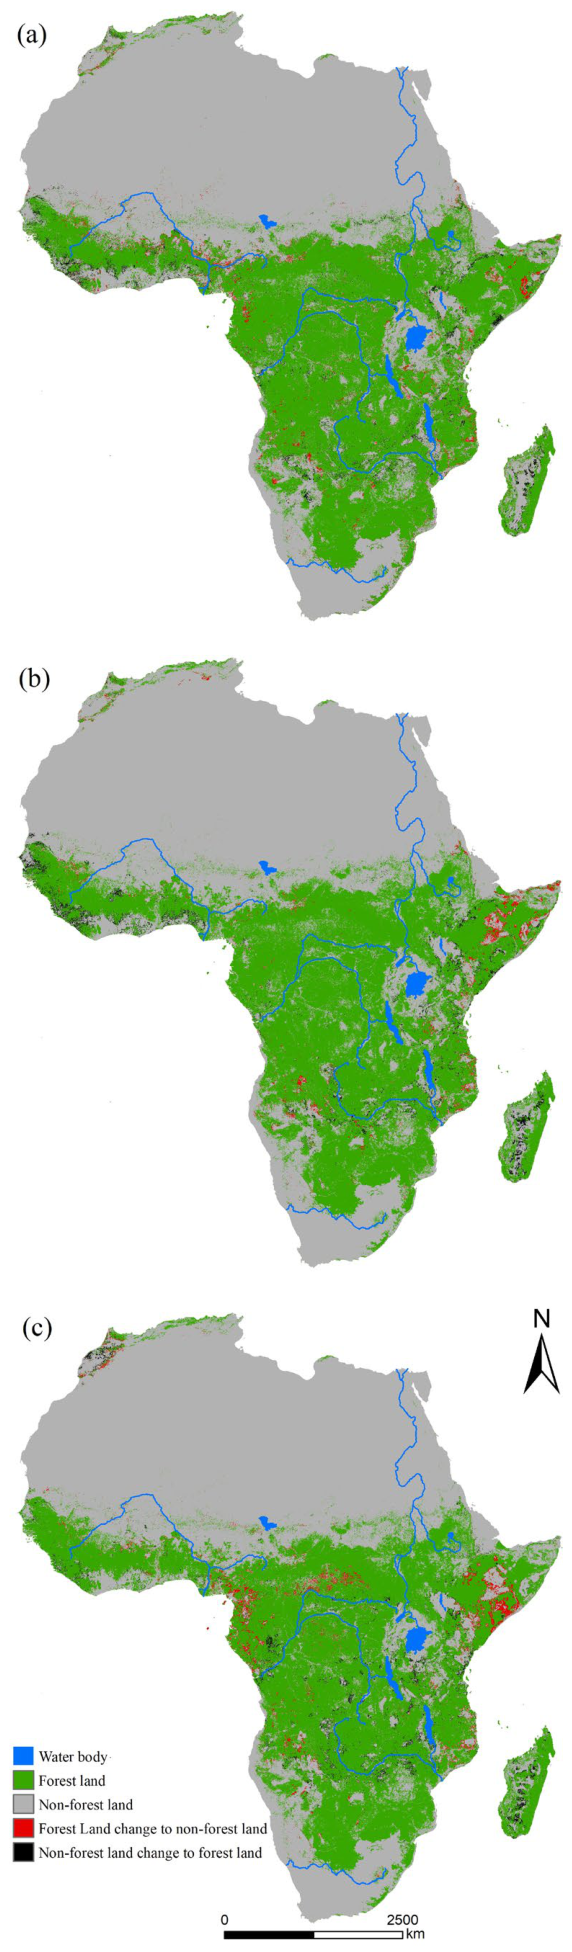
(1) SSP1 scenario takes “balance between ecological protection and sustainable development” as its core orientation. In 2070, the spatial distribution of forest land (Figure 3) shows the characteristics of “stable expansion of the core area and fusion of scattered patches”. In Congo Basin core forest land, there is no shrinkage and it expands slightly to the surrounding degraded farmland areas, forming a “core area-buffer zone” nested pattern, and the connectivity is further improved; along the Gulf of Guinea coast in West Africa, driven by the “ecological restoration policy”, the originally fragmented small patches have achieved “patch fusion” through natural restoration and artificial afforestation, and the proportion of medium-sized contiguous forest land has increased to 55%; near the equator in East Africa, “corridor-type forest belts” are formed along the river valley areas, connecting the originally isolated patch blocks, and the regional forest connectivity index has increased by more than 20%; in South Africa, woodland distribution presents obvious spatial differentiation; and eastern zones form stable small patch clusters guided by sustainable land use planning with limited human occupation, and these clustered woodlands are mostly artificial plantations and alien invasive tree stands instead of native natural woodlands, while arid western areas lack woodland expansion conditions and are dominated by sparse non-vegetation.
Under this scenario, the total forest area remains at 1.233 × 10⁹ ha, with the optimal spatial pattern, representing a typical path to balance ecological benefits and economic development.
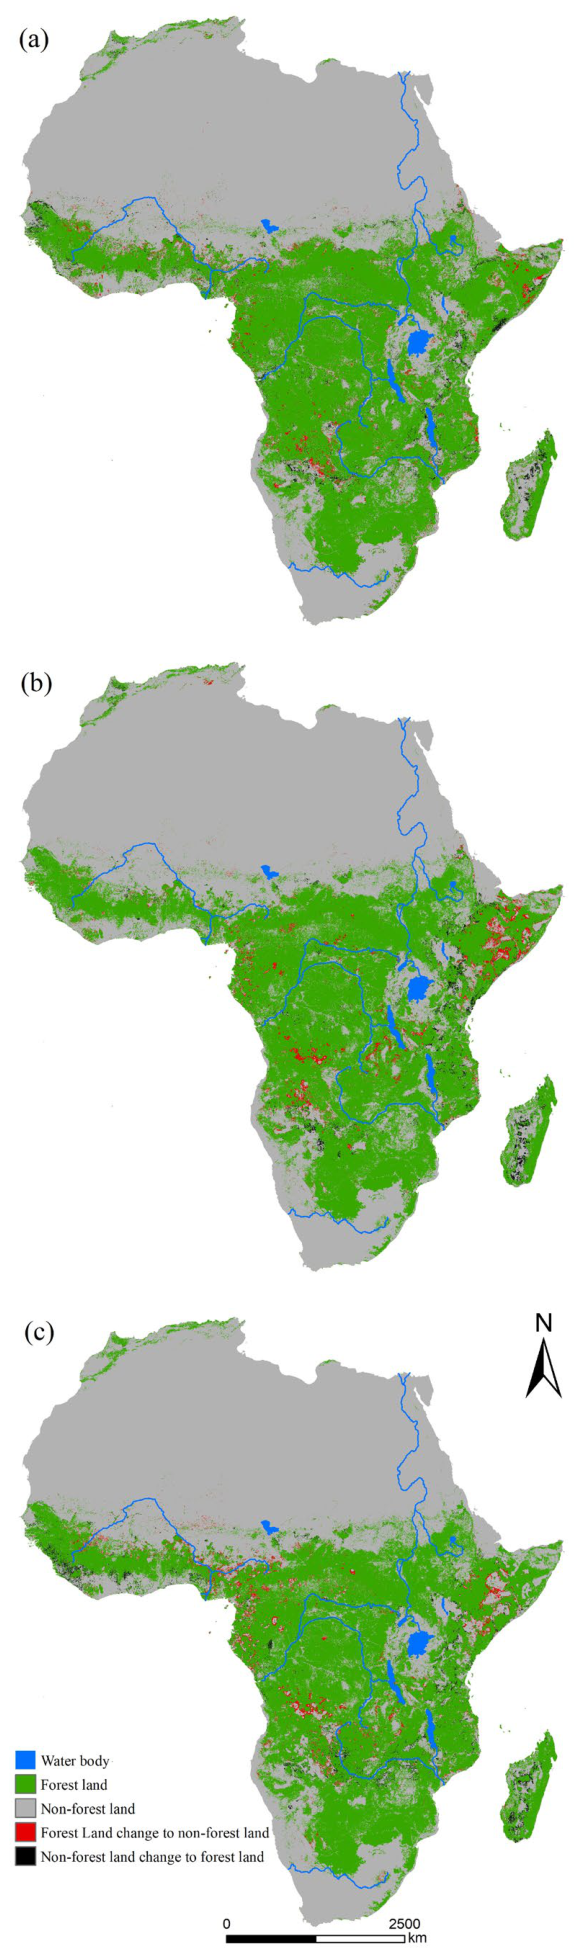
(2) As an intermediate development path without special intervention, the SSP2 scenario shows a neutral characteristic in the spatial distribution of forest land in 2070 (Figure 4): “the core area is basically stable and the peripheral area is slightly encroached upon”. Congo Basin core forest land: no large-scale fragmentation has occurred, but the peripheral area is affected by moderate agricultural expansion, and there is a phenomenon of “pattern edge shrinkage”, with the forest land boundary shrinking 5–10 km towards the core area. Along the Gulf of Guinea coast in West Africa: forest land, farmland and construction land are “interspersed”, and some small patches (area < 100 ha) near towns are encroached upon, but the overall forest land size has not decreased significantly (total area 1.245 × 10⁹ ha). Near the equator in East Africa: affected by agricultural reclamation driven by population growth, the disappearance rate of scattered small patches reaches 15%, but the core block forest land is preserved intact. South Africa presents obvious east–west differentiation in woodland changes; small forest patches in the eastern agricultural and urban agglomeration zones shrink continuously under urbanization and agricultural modernization, while key ecological zones maintain stable woodland coverage relying on ecological compensation policies, and the arid western region barely generates new woodland patches.
This scenario reflects the natural change trend of forest land under the conditions of “no ecological priority and no over-exploitation” and serves as a “neutral baseline” for subsequent scenario comparisons.
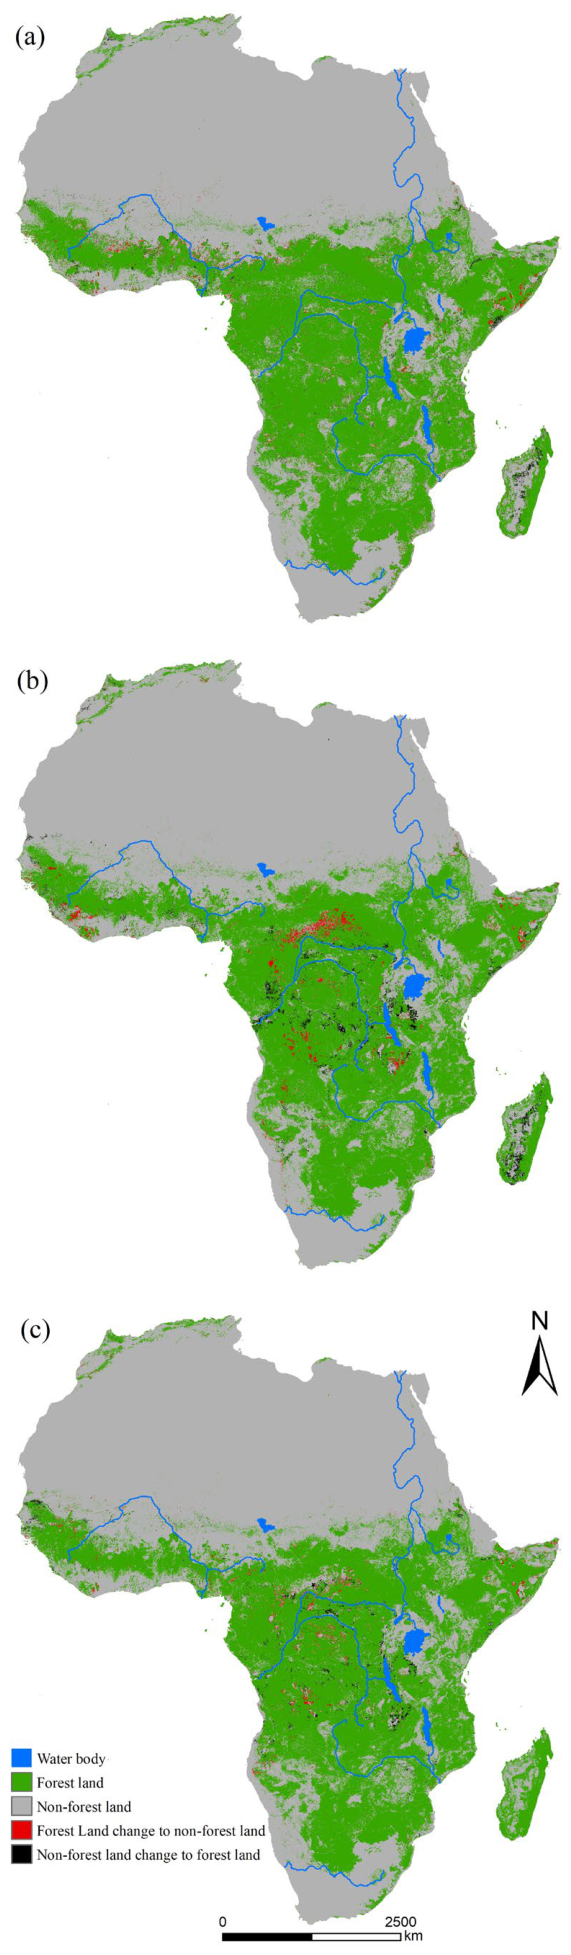
(3) The SSP3 scenario is centered on “regional resource competition and short-term economic priority”. In 2070, the spatial distribution of forest land (Figure 5) shows the characteristics of “concentration of core areas and severe fragmentation of peripheral areas”. Congo Basin core forest land: although it remains contiguous, the peripheral areas are cut by “large-scale agricultural reclamation belts”, forming multiple “isolation belts” that isolate some peripheral forest land from the core area, increasing the fragmentation index by 35%. West Africa Gulf of Guinea coast: driven by “economic interests”, a large amount of forest land has been converted into farmland and industrial land. The original strip-shaped forest land has been broken into isolated small patches, and the proportion of small patches has increased sharply to 60%. East Africa near the equator: affected by regional conflicts and disorderly development, the size of core block forest land has shrunk by 20%, scattered patches have basically disappeared, and forest connectivity has decreased significantly. South Africa presents stark east–west disparities in woodland fragmentation; unregulated mining and industrial construction under local protectionism fragment woodland patches severely across eastern mining and manufacturing zones, forming staggered interlacing of woodland and built-up land with the maximum fragmentation level across all scenarios, while the arid western zone has limited woodland coverage and low fragmentation pressure.
(4) The SSP4 scenario presents an unbalanced development characteristic of “center-periphery”. The spatial distribution of forest land in 2070 (Figure 6) shows “isolation of the core area and fragmentation of the urban periphery”. Congo Basin core forest land: It has not shrunk on a large scale, but the surrounding area lacks ecological protection investment, forming a “ring-shaped fragmentation zone”. The connection between the core area and the external forest land is completely cut off, becoming an “ecological island”. In the economically developed areas of West Africa and eastern South Africa: urban expansion has led to the “point-like encroachment” of the surrounding forest land; the woodlands in eastern South Africa are mostly artificial plantations and alien invasive tree stands rather than native natural woodlands, forming a pattern of “city surrounding forest land” with far higher edge density, patch quantity and shape complexity than other regions. The arid western part of South Africa has sparse woodland coverage and suffers little occupation from urban construction.
(5) The SSP5 scenario centers on “high-intensity development of fossil fuels,” and the spatial distribution of forest land in 2070 (Figure 7) exhibits a characteristic of “stable core areas and localized fragmentation in energy development areas.” Core forest lands far from energy development, such as the Congo Basin and the East African equator, remain highly stable with no fragmentation, and some areas experience slight expansion due to the “high-income ecological compensation” policy. In the energy-rich areas of the Gulf of Guinea in West Africa and northeastern South Africa, the extraction of oil and gas and coal mining have led to “patchy encroachment” of forest land, forming “fragmented circles” with a diameter of 10–20 km around energy bases, with small patches accounting for 45%; the arid western region of South Africa lacks fossil energy resources, with no large-scale mining disturbance and intact continuous woodland distribution. Along energy transportation corridors, railway and highway construction has resulted in “linear cutting” of forest land, dividing previously contiguous forest land into isolated patches and impairing connectivity. While the overall scale remains stable, “localized fragmentation” caused by energy development becomes the main problem.
Figure 3. Forest land transfer under the SSP1 scenario. (a) 2020–2030; (b) 2030–2050; (c) 2050–2070. Projection: WGS 1984 UTM Zone 34N (EPSG:32634). Scale bar, north arrow, and legend are shown in panel (c) and apply to all panels. All maps share the same spatial extent, legend, scale bar, and projection for direct visual comparison.
Diversity 18 00406 g003
Figure 4. Forest land transfer under the SSP2 scenario. (a) 2020–2030; (b) 2030–2050; (c) 2050–2070. Projection: WGS 1984 UTM Zone 34N (EPSG:32634). Scale bar, north arrow, and legend are shown in panel (c) and apply to all panels. All maps share the same spatial extent, legend, scale bar, and projection for direct visual comparison.
Diversity 18 00406 g004
Figure 5. Forest land transfer under the SSP3 scenario. (a) 2020–2030; (b) 2030–2050; (c) 2050–2070. Projection: WGS 1984 UTM Zone 34N (EPSG:32634). Scale bar, north arrow, and legend are shown in panel (c) and apply to all panels. All maps share the same spatial extent, legend, scale bar, and projection for direct visual comparison.
Diversity 18 00406 g005
Figure 6. Forest land transfer under the SSP4 scenario. (a) 2020–2030; (b) 2030–2050; (c) 2050–2070. Projection: WGS 1984 UTM Zone 34N (EPSG:32634). Scale bar, north arrow, and legend are shown in panel (c) and apply to all panels. All maps share the same spatial extent, legend, scale bar, and projection for direct visual comparison.
Diversity 18 00406 g006
Figure 7. Forest land transfer under the SSP5 scenario. (a) 2020–2030; (b) 2030–2050; (c) 2050–2070. Projection: WGS 1984 UTM Zone 34N (EPSG:32634). Scale bar, north arrow, and legend are shown in panel (c) and apply to all panels. All maps share the same spatial extent, legend, scale bar, and projection for direct visual comparison.
Diversity 18 00406 g007

3.3.2. Kernel Density Clustering Characteristics

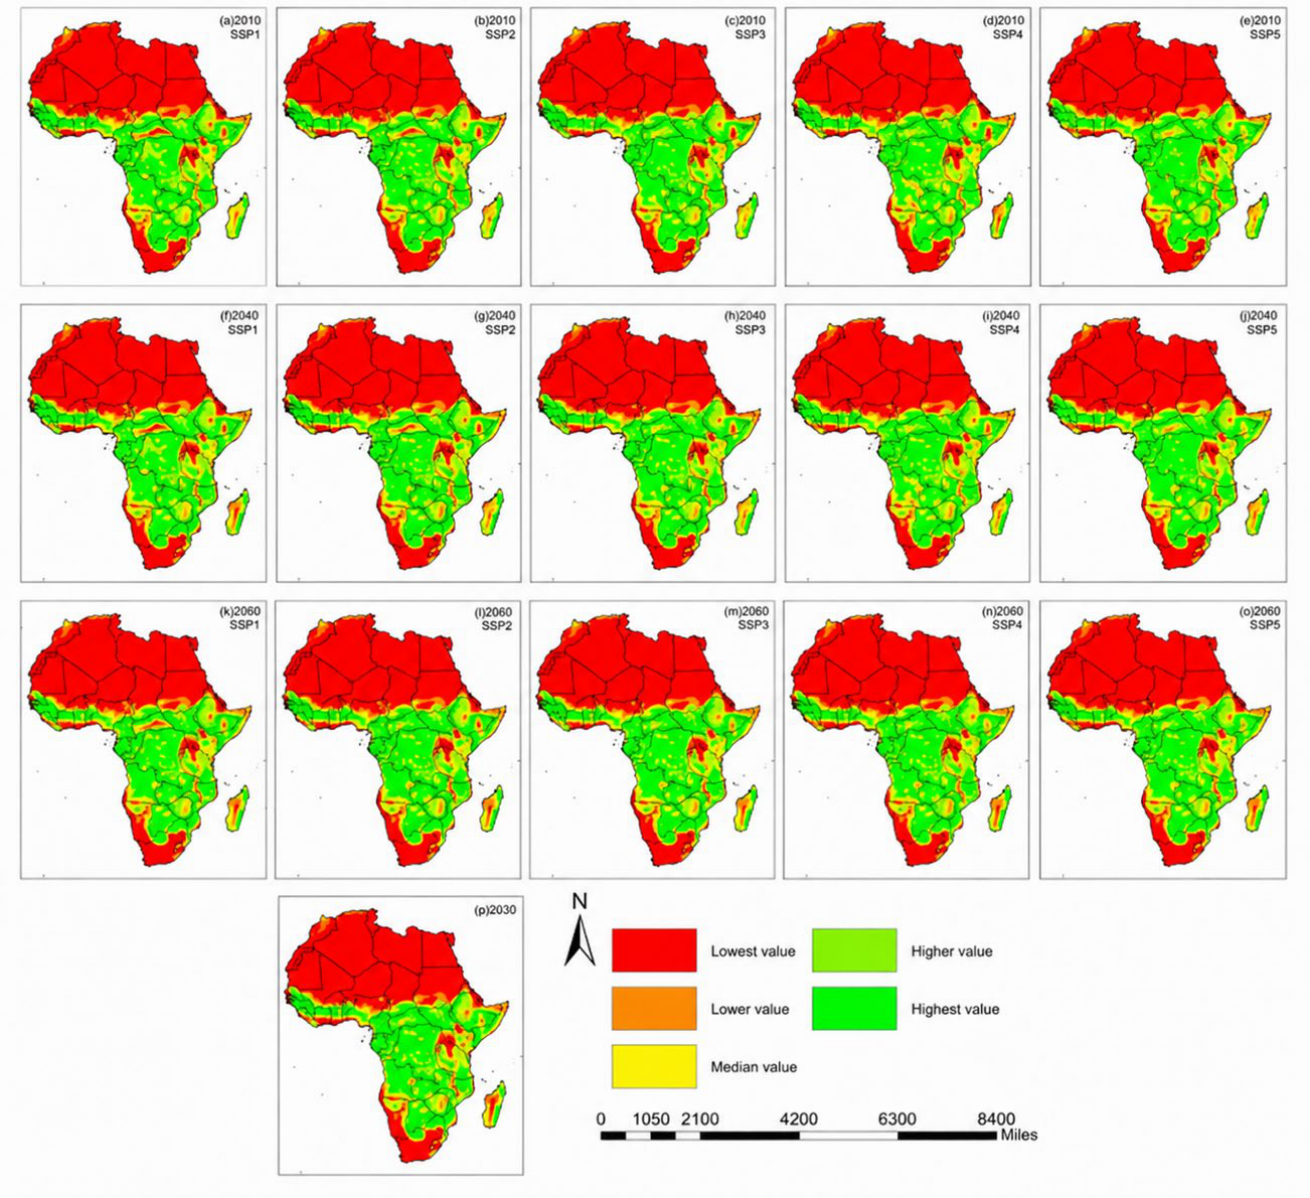
The results of Kernel density analysis show that the high-kernel-density areas in the African woodlands are highly concentrated in the core area of the Congo Basin, and the distribution and change characteristics of kernel density under different scenarios show significant differences (Figure 8).
From the perspective of the temporal change in core density, in 2020 (base period), the core density value of the Congo Basin core area reached over 75 km2/km2, forming a single high-density clustering center, while the Gulf of Guinea coast in West Africa and southeastern South Africa were medium-density clustering areas. In 2030, the high-density core area expanded slightly in most scenarios, with the most significant expansion in scenario SSP2, where the area of the high-density core area increased by 12%, while scenario SSP4 remained basically stable. In 2050, scenario differentiation intensified, with scenario SSP5 showing a continued expansion of the high-density core area, increasing in area by 23% compared to the base period, and the core density value rising to 82 km2/km2, while scenario SSP4 showed a shrinking of the high-density core area, decreasing in area by 15%, with the core density value dropping to 68 km2/km2. In 2070, scenario SSP5 showed a contiguous distribution of the high-density core area, covering most of the Congo Basin, with a core density value reaching 85 km2/km2, while scenario SSP4 showed a shrinking of the high-density core area. The high-density core region of the scenario further shrank, showing significant fragmentation characteristics, with the core density value dropping to 62 km2/km2. The high-density core regions of other scenarios remained fluctuating around the base period level.
From a regional differentiation perspective, the Congo Basin has consistently been a high-density area for African woodlands. Under the SSP5 scenario, the density in this area has continued to increase and its range has expanded, reflecting the significant effectiveness of core forest protection. The core density values in ecologically fragile areas such as the Sahel region and the East African Plateau have remained low (<20 km2/km2), and under the SSP4 scenario, the density has further decreased to below 10 km2/km2, highlighting the characteristics of forest degradation. In relatively developed economic regions such as North Africa and South Africa, the core density values have shown a steady upward trend under the SSP1 and SSP5 scenarios, rising from 20 km2/km2 to 35 km2/km2, reflecting the positive effects of forest restoration and ecological repair. The arid western part of South Africa maintains a persistently low-kernel-density area with no obvious woodland accumulation.

4. Spatiotemporal Transition Analysis of African Woodlands Under Different SSP Scenarios

The time-segmented transfer matrix reveals the temporal characteristics of changes in African woodlands. Combined with stacked bar charts, it visually demonstrates the dynamic changes in forest land transfer in and out at different time periods under each scenario (Table 4). The time-segmented transfer characteristic analysis shows that from 2020 to 2030, the area of forest land transferred in all scenarios was greater than the area transferred out, exhibiting a general upward trend. Among them, scenario SSP2 had the largest difference between transfer in and out (125,465 km2), while scenario SSP4 had the smallest difference (27,519 km2), reflecting the changing characteristics of African woodlands during this period. Woodlands are generally in a recovery phase, but the growth drivers differ significantly among scenarios. From 2030 to 2050, the scenario differentiation effect intensifies. Scenarios SSP3 and SSP5 still show a net transfer of more land than land, with net transfers of 157,763 km2 and 101,926 km2, respectively. However, scenario SSP4 shows a significantly larger transfer-out area than transfer-in area, with a difference of −154,951 km2, marking a critical period for forest degradation. This result is closely related to the solidification of socioeconomic development patterns under different scenarios during this period, with intensified regional competition and uneven development leading to a widening gap in forest conservation investment. From 2050 to 2070, only scenario SSP5 shows a net transfer of more land than land (39,443 km2), while the remaining scenarios show a net transfer of more land than land. Scenario SSP4 shows the most severe degradation (net transfer of −102,512 km2), indicating increased pressure on forest conservation in the long term, and the impact of different socioeconomic development paths on forests has formed a stable pattern.
From the perspective of the change in transfer intensity, the area transferred out under the SSP1 scenario shows a continuous downward trend, decreasing from 650,028 km2 in 2020–2030 to 182,739 km2 in 2050–2070, a decrease of 71.9%, reflecting the gradual improvement in forest land stability and the smoothing of land use conversion under sustainable development policies. The area transferred out under the SSP3 scenario shows a fluctuating trend of “decline–increase,” decreasing to 277,679 km2 in 2030–2050 and increasing to 448,949 km2 in 2050–2070, an increase of 61.7%, indicating that intensified regional competition leads to increased pressure on forest land degradation in the later stages. The area transferred in under the SSP5 scenario shows a “rise–decline” trend, increasing from 2020 to 2030 to 2030 to 2050, with the area transferred in during 2030–2050 reaching 388,840 km2, the highest among the three periods. This period became a critical period for forest land growth. Although the area transferred in decreased in the later period, it still remained at a high level, reflecting the sustainability of forest land protection under the fossil-fuel-driven development model. The area transferred out under the SSP4 scenario showed a trend of “first rise then slight decline”, rising from 414,656 km2 in 2020–2030 to 453,800 km2 in 2030–2050, then slightly decreasing to 444,079 km2 in 2050–2070, reflecting the overall intensified trend of forest land degradation under the unbalanced development model.

5. Clustering Characteristics of Forest Land Change in African Countries Under Different SSP Scenarios

Based on K-means clustering analysis, African countries were divided into three categories: forest land basically unchanged, forest land declining, and forest land rising. The number and area of each category of countries showed significant differences under different scenarios (Table 5). In terms of the proportion of countries, the SSP5 scenario shows the highest proportion of countries with essentially unchanged forest land (77.19%), more than 10 percentage points higher than other scenarios. This indicates that under the fossil-fuel-driven development model, forest land remains stable in most countries, which is closely related to the improved ecological protection capacity brought about by technological progress under this scenario. The SSP3 scenario shows the highest proportion of countries with declining forest land (15.79%), three times that of the SSP2 scenario (5.26%), reflecting that intensified regional competition has led to more countries experiencing forest land degradation, and ecological protection faces severe challenges. The SSP1 and SSP2 scenarios show the same proportion of countries with rising forest land (28.07%), significantly higher than other scenarios, reflecting that a large number of countries have achieved forest land restoration under sustainable development and intermediate development paths, and that ecological protection policies have been relatively effective. The SSP4 scenario shows the lowest proportion of countries with rising forest land (17.54%), indicating that the unbalanced development model has inhibited the process of forest land restoration, and only a few countries have been able to achieve forest land growth.
In terms of area proportion, the area of forest land remaining basically unchanged exceeded 92% in all scenarios, with the highest proportion in scenario SSP5 (95.49%) and the lowest in scenario SSP3 (92.96%). This indicates that the area of African woodlands is mainly concentrated in countries with relatively stable forest areas, and the stability of the core forest area is an important characteristic of the African woodland ecosystem. The area of forest land showing a downward trend had the highest proportion in scenario SSP4 (3.86%) and the lowest in scenario SSP5 (2.04%), which is consistent with the overall degradation of forest land in this scenario, reflecting that the scale of forest land degradation is larger under the unbalanced development model. The area of forest land showing an upward trend had the highest proportion in scenario SSP3 (3.80%). Although some countries experienced forest land degradation in this scenario, some countries still achieved forest land expansion, which is closely related to regional development differences.
Regional differentiation analysis shows that relatively developed economic regions such as North Africa and South Africa mostly exhibit an upward trend in forest land under SSP1 and SSP5 scenarios, which is closely related to their strong economic strength and sufficient investment in ecological protection. Notably, the increased woodland areas in South Africa are mainly artificial plantations and alien invasive tree stands rather than native natural woodlands. The Sahel region and some East African countries mostly exhibit a downward trend in forest land under SSP3 and SSP4 scenarios. These regions have high ecological vulnerability, are significantly affected by regional competition and uneven development, and have insufficient ecological protection capacity. Countries surrounding the Congo Basin show that forest land remains basically unchanged under all scenarios, reflecting the ecological stability of this region as the core forest area of Africa, and its forest land changes respond relatively slowly to external driving factors.

6. Fragmentation Characteristics of African Woodlands Under Different SSP Scenarios

6.1. Overall Changes in the Fragmentation Index

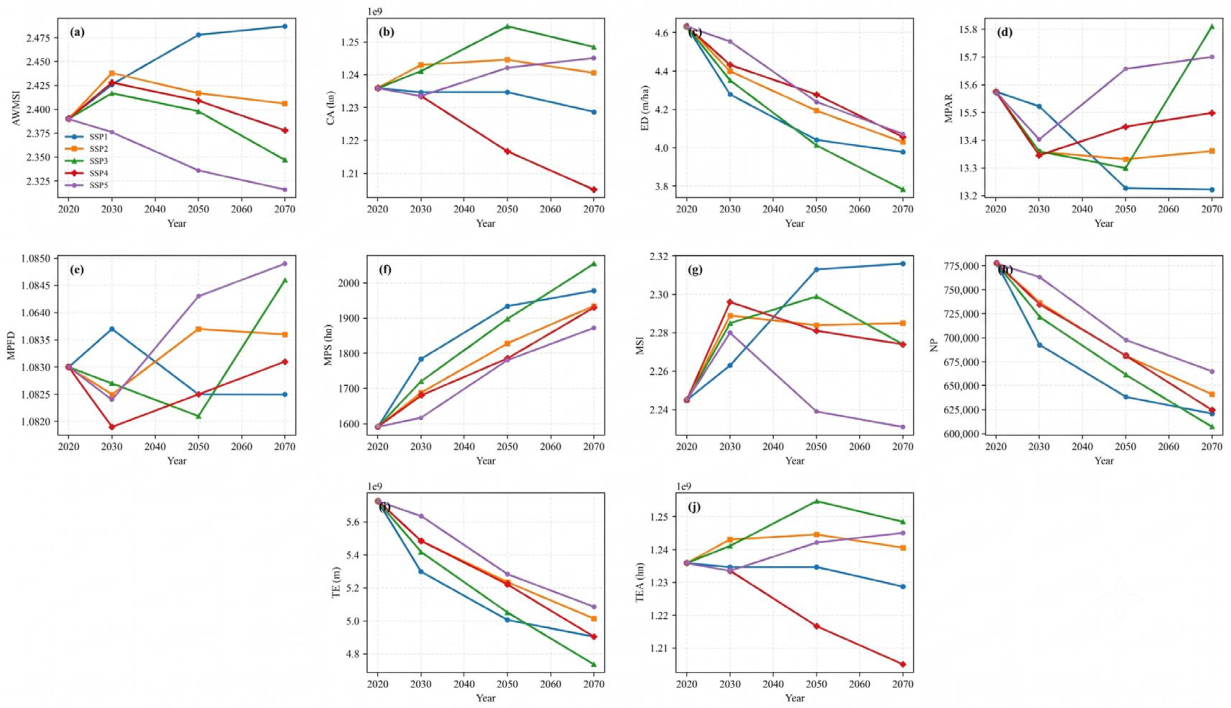
From 2020 to 2070, forest fragmentation decreased significantly under SSP3, remained stable under SSP1 and SSP2, and increased notably under SSP4 (Figure 9). Overall, with the differences in socioeconomic development paths, the number of woodland patches, average patch area, edge structure, and morphological complexity all undergo systematic changes, directly reflecting the fragmentation and integration process of the woodland landscape.

6.2. Changes in the Number of Plaques and the Average Plaque Area

The number of patches (NP) and the average patch size (MPS) are the most intuitive indicators of landscape fragmentation. In 2020, the number of patches in the African woodlands was 775,000, and all scenarios showed a significant downward trend by 2070, indicating that the woodlands as a whole are undergoing a change pattern of patch integration and increased contiguousness.
Among them, the number of patches in scenario SSP3 decreased to the lowest (600,000), with the largest decrease, indicating that the forest land integration effect was the most significant under this scenario; scenario SSP4 had the smallest decrease, and the number of patches remained at the highest level across all scenarios, indicating that the forest land continued to be fragmented and the fragmentation pressure was significantly higher than other scenarios.
The average patch size (MPS) showed a significant negative correlation with the degree of fragmentation. During the study period, MPS continuously increased from 1600.00 ha in 2020, with the largest increase observed in scenario SSP3, reaching 2000.00 ha, indicating the largest patch size and best integrity. SSP4 and SSP5 scenarios showed relatively lower MPS, suggesting more significant patch fragmentation due to human activities. This trend indicates a significant reduction in patch miniaturization and fragmentation, leading to a more regular and continuous forest landscape overall.

6.3. Variation in Edge Length and Edge Density

Total edge length (TE) and edge density (ED) together characterize the boundary complexity and intensity of human disturbance in forest patches. From 2020 to 2070, both TE and ED showed a decreasing trend in all scenarios, indicating that forest patch boundaries tend to be simplified and less fragmented.
SSP3 scenario has the lowest edge density (3.72 m/ha), the most regular edge structure, and the weakest human interference; SSP4 and SSP5 scenarios maintain edge densities above 4.00, indicating that the patch boundaries are more complex and are more affected by human activities such as agricultural expansion and infrastructure encroachment.
The continuous decline in edge density indicates that the forest landscape is gradually transforming from a complex, fragmented, and highly disturbed state to a regular, continuous, and low-disturbance state, which is consistent with the findings of mangrove studies in the Malay Peninsula: increased edge density is a typical sign of intensified fragmentation, while decreased edge density represents improved landscape connectivity and stability.

6.4. Shape Index and Fractal Dimension Variation

The mean shape index (MSI), area-weighted mean shape index (AWMSI), and mean patch fractal dimension (MPFD) together reflect the morphological complexity of forest patches.
The SSP1 scenario showed a slight increase in both MSI and AWMSI, indicating that the patch morphology was closer to a natural and complex state. In the SSP5 scenario, both indices decreased significantly, indicating that the patch morphology was more regular and more influenced by human planning and modification. The morphology indices of the SSP3 and SSP4 scenarios remained at a moderate level.
The mean patch fractal dimension (MPFD) fluctuated within the range of 1.0820 to 1.0850 across all scenarios, with values close to 1.0, indicating that forest patches are predominantly regular in shape and significantly disturbed by human activities. This is consistent with the findings in mangrove studies: the closer the fractal dimension is to 1, the more regular the patch boundaries and the more pronounced the human-disturbed features.

6.5. Differences and Driving Mechanisms of Fragmentation in Different Scenarios

Different SSP scenarios directly shape the differentiated fragmentation pattern of African woodlands through differences in socioeconomic development paths: (1) SSP3 (regional competition) achieves the most prominent patch integration effect, with the lowest edge density, the largest average patch area, the weakest overall fragmentation, and optimal ecological connectivity. (2) SSP4 (uneven development): woodland area presents a continuous net loss trend, retaining the largest patch quantity, highly complex patch edges, and severe landscape division, which makes it the scenario with the most serious fragmentation. (3) SSP5 (fossil fuel development): woodland area achieves steady net growth, yet patch morphology becomes regularized with obvious traces of human disturbance. (4) SSP1 and SSP2 maintain moderate fragmentation levels, striking a relatively balanced state between ecological conservation pressure and socioeconomic development demand.
Overall, the fragmentation pattern of forest land is mainly driven by the intensity of land use conversion, agricultural expansion, policy control, and infrastructure layout, which is highly consistent with the fragmentation mechanism of mangroves in Malaysia; unbalanced development, disorderly reclamation, and excessive encroachment will significantly exacerbate fragmentation, while orderly development, ecological management, and spatial optimization can effectively reduce fragmentation and promote the overall restoration and contiguous integration of forest landscapes.

6.6. Potential Impacts of Fragmentation on Forest Ecosystems

According to the conclusions of relevant mangrove studies, fragmentation will directly affect the structure and function of the African woodland ecosystem: (1) The reduction in patch size and the enhancement of edge effects will change the microclimate, light, and humidity conditions in the forest, affecting the community structure. (2) The decline in landscape connectivity will hinder species dispersal, animal migration and gene exchange, and reduce the ability to maintain biodiversity. (3) The regularization of patch morphology and the simplification of boundaries will weaken natural ecological processes and reduce the stability and resistance to disturbance of the ecosystem. (4) The contiguousness and increased integration will help enhance the function of carbon sink, water conservation, soil and water conservation, and habitat services.
The low fragmentation and high integration of the SSP3 scenario are most conducive to the stability and service function enhancement of the African woodland ecosystem, while the high fragmentation of the SSP4 scenario will weaken the ecosystem services of African forests in the long term, posing a potential risk to regional ecological security and the carbon sink target.

7. Discussion

7.1. Driving Mechanism Analysis

The core driving mechanisms for the continuous growth of forest land and the expansion of the core density area in the SSP5 scenario include three aspects [45,46]. First is the improvement in ecological protection capabilities brought about by technological progress. Under this scenario, rapid economic development has promoted forestry technology innovation and the application of ecological restoration technologies, effectively improving the efficiency of forest land restoration. Second, the improvement in infrastructure has reduced the damage to primary forest land. The optimized layout of infrastructure such as transportation and cities has reduced the encroachment on core forest areas. Third, the policy constraint intensity is moderate (0.2), which realizes the synergy between economic development and ecological protection. It not only ensures the needs of economic growth but also curbs the excessive development of forest land through appropriate policy intervention [47,48].
The driving mechanisms of severe forest degradation and density decline in SSP4 scenario are mainly manifested in the following ways: unbalanced development leads to the concentration of resources in a few high-income areas, where industrialization and urbanization are accelerating and encroaching on forest resources; low-income areas are affected by economic pressure and rely excessively on logging and land reclamation to maintain their livelihoods, resulting in a serious lack of investment in ecological protection; and the widening development gap between regions makes it difficult to effectively implement ecological protection policies, and there is a lack of a unified coordination mechanism for forest protection, ultimately leading to a forest change pattern of “the rich getting richer and the poor getting poorer” [49,50].
As an intermediate development path, the SSP2 scenario shows a mild “increase followed by decrease” characteristic in forest land change. Its driving mechanism lies in the fact that socioeconomic development maintains its historical trend under this scenario, and population growth, economic development, and ecological protection policies are relatively balanced. Early ecological protection investment promotes forest land restoration, while later intensified competition for land resources leads to a slight decrease in forest land. This is most consistent with the current socioeconomic development status in Africa, and its results can provide a reference for forest land protection under the baseline scenario [51,52].

7.2. Comparison with Other Studies

The results of this study share common characteristics with the research of Tang Qi et al. [53,54] in the lakeside areas of the Yunnan–Guizhou Plateau; namely, the increase in ecological land use is relatively significant in the SSP1 scenario, and the human activities have the strongest impact on the natural environment in the SSP3 scenario. This indicates that the SSP scenario framework has a certain degree of universality in simulating land use change in different regions. However, as a developing continent, Africa’s forest land change is more significantly affected by population growth and agricultural expansion, and there are significant differences in the driving mechanisms of forest land change with those in China and other regions: forest land change in China and other developed countries or regions is more affected by the transformation in the later stage of urbanization and the strengthening of ecological protection policies, while the change in African woodlands is mainly driven by factors such as rapid population growth, agricultural expansion, and uneven regional development, and the real constraints faced by ecological protection are more severe [55,56].
Compared with the study of the forests of Mount Kenya by Otieno et al. [57], this study, based on the whole-Africa scale, integrates kernel density analysis to reveal the spatial clustering patterns of forest land, making up for the shortcomings of local regional studies in spatial pattern analysis. The study by Otieno et al. shows that forest land change in a single region is mainly affected by climate factors and local human activities. However, this study found that forest land change at the whole-Africa scale is more driven by the macro-level socioeconomic development patterns (SSP scenarios). The impact of different development paths on forest land is systematic and holistic, and spatially it shows differentiated change characteristics between core areas and vulnerable areas. This provides a new perspective for the study of forest land change on a global scale [58,59].

7.3. Practical and Policy Implications

Based on the simulation results of this study, several targeted policy implications can be provided for African forest conservation and sustainable management. First, differentiated regional forest protection policies should be implemented. The Congo Basin, as a core contiguous forest area, should be designated as a key protected region with strict constraints on agricultural and infrastructure expansion. West Africa and East Africa, where fragmentation is severe, should strengthen ecological restoration and control unreasonable expansion of roads and farmland. Second, road planning and infrastructure development should be spatially compatible with forest protection to reduce habitat fragmentation, especially near protected areas. Third, for high-risk scenarios such as SSP4, more transnational cooperation, ecological compensation mechanisms, and balanced development policies are needed to curb forest degradation. Fourth, priority should be given to sustainable development pathways (SSP1, SSP5) to maintain forest connectivity and enhance carbon sink and ecological security.
In the revised results, woodland expansion in South Africa is much more limited than in the previous version and mainly occurs in localized eastern and southeastern areas. These expanded woodland patches should not be interpreted as large-scale native natural forest recovery; they are mostly composed of open savanna woodlands, artificially planted timber forests, and invasive alien tree stands, which differ substantially from native natural woodlands in biodiversity maintenance and carbon sequestration potential [60,61]. This distinction is important because invasive-driven or plantation-related gains differ ecologically from native forest restoration in terms of biodiversity conservation and long-term carbon sequestration.

7.4. Limitations and Future Prospects

Although the present study provides a systematic assessment of future woodland dynamics across Africa, several limitations should be acknowledged.
First, the analysis was conducted at a continental scale using a 1 km simulation resolution. Although this resolution is widely adopted in large-scale land use simulation studies and is appropriate for continental-scale pattern analysis, it inevitably reduces the representation of fine-scale landscape heterogeneity. Local woodland patches, ecological corridors, and small fragmented forests may not be fully captured.
Second, future woodland projections are dependent on the assumptions embedded in the SSP framework. Although SSP1–SSP5 represent the most widely accepted socioeconomic development pathways, actual future trajectories may deviate from these scenarios due to policy changes, geopolitical conflicts, technological breakthroughs, or unexpected environmental disturbances. Therefore, the simulation results should be interpreted as scenario-based projections rather than deterministic forecasts.
Third, woodland identification in arid and semi-arid regions remains a source of uncertainty. This issue is particularly relevant in South Africa, where open woodlands, woody savannas, shrublands, plantations, and invasive alien tree stands often form complex transitional landscapes. Following the reviewer’s recommendation, the global tree-density map developed by Crowther et al. [35] was used as auxiliary reference datasets to re-examine woodland distribution in South Africa. Based on this independent tree-density evidence, the original woodland mask was refined and areas with weak tree-density support were excluded from the woodland category. Consequently, the woodland extent in South Africa was substantially reduced, and all subsequent analyses, including area statistics, transfer matrices, clustering results, kernel density patterns, and fragmentation metrics, were recalculated using the revised dataset.
Future studies should further integrate national forest inventory data, higher-resolution remote sensing products, long-term ecological monitoring observations, and global tree-density datasets to improve woodland identification accuracy, particularly in dryland and transitional ecosystems where forest and non-forest boundaries are often difficult to distinguish. Additional efforts should also focus on differentiating native forests, plantations, invasive alien tree stands, and sparse woody vegetation, which frequently coexist in semi-arid landscapes. Such improvements would contribute to more reliable assessments of future woodland dynamics, ecological restoration potential, and carbon sequestration capacity across Africa.

8. Conclusions

The changes in African woodlands under different SSPs exhibit significant scenario differentiation: the SSP5 (fossil fuel-dominated development) scenario shows stable growth in forest land, with a net increase of 143,513 km2 from 2020 to 2070, making it the only scenario that maintains positive growth throughout the entire period; the SSP4 (uneven development) scenario shows the most severe forest degradation, with a net decrease of 265,581 km2 from 2020 to 2070, and the dynamics rate drops to −0.05% in the later period; the SSP2 (intermediate development) scenario shows active changes in the early stage and tends to stabilize in the later stage, with an overall moderate increase (108,662 km2); the SSP1 (sustainable development) scenario shows a “first increase then decrease” fluctuation characteristic, with an overall small net decrease (−15,452 km2); and the SSP3 (regional competition) scenario shows significant growth in the middle stage and obvious degradation in the later stage, with an overall moderate increase (184,227 km2).
Forest fragmentation showed clear divergent trends across scenarios: it decreased significantly under SSP3, remained relatively stable under SSP1 and SSP2, and increased notably under SSP4 and SSP5.
The spatiotemporal transfer process of forest land exhibits a significant periodic differentiation pattern: 2020–2030 is a period of general growth, with forest land transfer in all scenarios exceeding transfer out; 2030–2050 is a critical transition period, with the differentiation effect among scenarios intensifying, the SSP3 and SSP5 scenarios maintaining growth, and the SSP4 scenario beginning to degrade significantly; and 2050–2070 is a period of stable differentiation, with only the SSP5 scenario maintaining growth, while the remaining scenarios all show degradation, and the impact of different development paths on forest land forms a solidified pattern.
Spatial migration and core density analysis revealed significant characteristics of forest spatial clustering: high-density clusters in African woodlands are concentrated in the Congo Basin. Under the SSP5 scenario, the core density area continues to expand, reaching a core density of 85 km2/km2 in 2070, and is distributed in contiguous areas. Under the SSP4 scenario, the core density area gradually shrinks, fragmentation intensifies, and the core density drops to 62 km2/km2. Ecologically vulnerable areas are consistently distributed at low densities, with density further decreasing under the SSP4 scenario, highlighting forest degradation characteristics.
National-scale cluster analysis revealed regional differentiation characteristics of forest land change: the forest area of most African countries remained basically stable, with the number of countries ranging from 56.14% to 77.19% and the area share exceeding 92%; under the SSP5 scenario, the stable countries had the highest number of countries (77.19%) and area share (95.49%), indicating the best forest land protection results; under the SSP3 scenario, the degraded countries had the highest number of countries (15.79%); and under the SSP4 scenario, the degraded countries had the highest area share (3.86%). Countries with growing woodland areas are mainly concentrated in relatively developed economic regions such as North Africa and eastern South Africa, as well as countries surrounding the Congo Basin; arid western South Africa rarely presents woodland expansion trends.
This study still has the following shortcomings: First, the FLUS model parameter calibration is based on the average level across Africa, which fails to fully consider the differences in natural and socioeconomic characteristics between regions, which may lead to the need to improve the simulation accuracy in some areas. Second, the cluster analysis only uses the forest area change rate as a single indicator, without combining multiple dimensions such as natural and socioeconomic factors, making it difficult to comprehensively reflect the comprehensive characteristics of forest land change. Third, the search radius of the kernel density analysis is based on empirical settings and no multi-scale sensitivity analysis is performed, which may affect the accuracy of density distribution. Fourth, the synergistic effects of climate change and socioeconomic development are not considered, focusing only on the individual effects of SSP scenarios.

Author Contributions

Conceptualization, W.Z. and B.L.; methodology, B.L.; software, L.L.; validation, B.L., Y.J. and C.Z.; formal analysis, W.Z.; investigation, C.Z.; resources, W.L.; data curation, L.L.; writing—original draft preparation, W.Z.; writing—review and editing, B.L. and Y.J.; visualization, C.Z.; supervision, B.L.; project administration, Y.J.; funding acquisition, B.L. All authors have read and agreed to the published version of the manuscript.

Funding

This research was funded by the Research funding for Nanning Normal University’s Special Funding for Degree and Graduate Education in 2025 (6020303892015), The 2024 Green seedling Program of the Human Resources and Social Security Department of Guangxi Zhuang Autonomous Region, China (60203038919630213), 2026 Guangxi First-Class Discipline Construction Project–Plateau Geography as a Disciplinary Field (60203038921020301), Guangxi Innovation and Entrepreneurship Training Program for College Students (202510603320), Nanning Normal University Doctoral Research Startup Project (No. 602021239447), and The General Program of the National Natural Science Foundation of China (42571364).

Data Availability Statement

The original contributions presented in this study are included in the article. Further inquiries can be directed to the corresponding authors.

Acknowledgments

During the preparation of this manuscript/study, the authors used Doubao AI, 2.4.7 for the purposes of full-text polishing and grammar checking of the paper. The authors have reviewed and edited the output and take full responsibility for the content of this publication.

Conflicts of Interest

Author Yan Jiang was employed by Guangxi Transportation Science and Technology Group Co., Ltd. The remaining authors declare that the research was conducted in the absence of any commercial or financial relationships that could be construed as a potential conflict of interest.

References

  1. Pan, Y.; Birdsey, R.A.; Fang, J.; Houghton, R.; Kauppi, P.E.; Kurz, W.A.; Phillips, O.L.; Shvidenko, A.; Lewis, S.L.; Canadell, J.G.; et al. A large and persistent carbon sink in the world’s forests. Science 2011, 333, 988–993. [Google Scholar] [CrossRef] [PubMed]
  2. Griscom, B.W.; Adams, J.; Ellis, P.W.; Houghton, R.A.; Lomax, G.; Miteva, D.A.; Schlesinger, W.H.; Shoch, D.; Siikamäki, J.V.; Smith, P. Natural climate solutions. Proc. Natl. Acad. Sci. USA 2017, 114, 11645–11650. [Google Scholar] [CrossRef] [PubMed]
  3. IPCC. Climate Change 2021: The Physical Science Basis; Cambridge University Press: Cambridge, UK, 2021. [Google Scholar]
  4. FAO. Global Forest Resources Assessment 2020: Main Report; FAO: Rome, Italy, 2020. [Google Scholar] [CrossRef]
  5. Myers, N.; Mittermeier, R.A.; Mittermeier, C.G.; da Fonseca, G.A.B.; Kent, J. Biodiversity hotspots for conservation priorities. Nature 2000, 403, 853–858. [Google Scholar] [CrossRef] [PubMed]
  6. Baccini, A.; Goetz, S.J.; Walker, W.S.; Laporte, N.T.; Sun, M.; Sulla-Menashe, D.; Hackler, J.; Beck, P.S.A.; Dubayah, R.; Friedl, M.A.; et al. Estimated carbon dioxide emissions from tropical deforestation improved by carbon-density maps. Nat. Clim. Change 2012, 2, 182–185. [Google Scholar] [CrossRef]
  7. Angelsen, A. REDD+ as result-based aid: Lessons from early experiences. For. Policy Econ. 2017, 83, 10–18. [Google Scholar]
  8. Duchelle, A.E.; Simonet, G.; Sunderlin, W.D.; Wunder, S. What is REDD+ achieving on the ground? Curr. Opin. Environ. Sustain. 2018, 32, 134–140. [Google Scholar] [CrossRef]
  9. Mekuria, W.; Veldkamp, E.; Haile, M. Community-based forest management and carbon sequestration in the Ethiopian highlands. For. Ecol. Manag. 2011, 262, 1113–1121. [Google Scholar]
  10. Foley, J.A.; DeFries, R.; Asner, G.P.; Barford, C.; Bonan, G.; Carpenter, S.R.; Chapin, F.S.; Coe, M.T.; Daily, G.C.; Gibbs, H.K.; et al. Global consequences of land use. Science 2005, 309, 570–574. [Google Scholar] [CrossRef] [PubMed]
  11. Luyssaert, S.; Jammet, M.; Stoy, P.C.; Estel, S.; Pongratz, J.; Ceschia, E.; Churkina, G.; Don, A.; Erb, K.; Ferlicoq, M.; et al. Land management and land-cover change have impacts of similar magnitude on surface temperature. Nat. Clim. Change 2014, 4, 389–393. [Google Scholar] [CrossRef]
  12. Cui, J.; Deng, O.; Zheng, M.; Zhang, X.; Bian, Z.; Pan, N.; Tian, H.; Xu, J.; Gu, B. Warming exacerbates global inequality in forest carbon and nitrogen cycles. Nat. Commun. 2024, 15, 9185. [Google Scholar] [CrossRef] [PubMed]
  13. Mullissa, A.; Saatchi, S.; Dalagnol, R.; Erickson, T.; Provost, N.; Osborn, F.; Ashary, A.; Moon, V.; Melling, D. LUCA: A Sentinel-1 SAR-based global forest land use change alert. Remote Sens. 2024, 16, 2151. [Google Scholar] [CrossRef]
  14. Lambin, E.F.; Geist, H.J.; Lepers, E. Dynamics of land-use and land-cover change in tropical regions. Annu. Rev. Environ. Resour. 2003, 28, 205–241. [Google Scholar]
  15. Hansen, M.C.; Potapov, P.V.; Moore, R.; Hancher, M.; Turubanova, S.A.; Tyukavina, A.; Thau, D.; Stehman, S.V.; Goetz, S.J.; Loveland, T.R.; et al. High-resolution global maps of 21st-century forest cover change. Science 2013, 342, 850–853. [Google Scholar] [PubMed]
  16. Curtis, P.G.; Slay, C.M.; Harris, N.L.; Tyukavina, A.; Hansen, M.C. Classifying drivers of global forest loss. Science 2018, 361, 1108–1111. [Google Scholar] [CrossRef] [PubMed]
  17. Austin, K.G.; Schwantes, A.M.; Gu, Y. Trends in national contributions to global tropical deforestation linked to agricultural production. Environ. Res. Lett. 2019, 14, 094008. [Google Scholar]
  18. Winkler, K.; Fuchs, R.; Rounsevell, M.; Herold, M. Global land use change is four times higher than previously estimated. Nat. Commun. 2021, 12, 1–10. [Google Scholar]
  19. Masolele, M.N.; Verburg, P.H.; Kuemmerle, T. Mapping the proximate causes of deforestation across Africa. Environ. Res. Lett. 2021, 16, 094054. [Google Scholar]
  20. Verburg, P.H.; Schot, P.P.; Dijst, M.J.; Veldkamp, A. Land use change modeling: Current practice and research priorities. GeoJournal 2004, 61, 309–324. [Google Scholar] [CrossRef]
  21. O’Neill, B.C.; Kriegler, E.; Ebi, K.L.; Kemp-Benedict, E.; Riahi, K.; Rothman, D.S.; van Ruijven, B.J.; van Vuuren, D.P.; Birkmann, J.; Kok, K.; et al. The roads ahead: Narratives for shared socioeconomic pathways describing world futures in the 21st century. Glob. Environ. Change 2017, 42, 169–180. [Google Scholar] [CrossRef]
  22. van Vuuren, D.P.; Riahi, K.; Calvin, K.; Dellink, R.; Emmerling, J.; Fujimori, S.; KC, S.; Kriegler, E.; O’Neill, B. The Shared Socio-economic Pathways: Trajectories for human development and global environmental change. Glob. Environ. Change 2017, 42, 148–152. [Google Scholar] [CrossRef]
  23. Popp, A.; Calvin, K.; Fujimori, S.; Havlik, P.; Humpenöder, F.; Stehfest, E.; Bodirsky, B.L.; Dietrich, J.P.; Doelmann, J.C.; Gusti, M.; et al. Land-use futures in the shared socio-economic pathways. Glob. Environ. Change 2017, 42, 331–345. [Google Scholar]
  24. Brhane, E.S.; Dairaku, K. Future Land Use Change Projection Under SSP-RCP Scenarios over Ethiopia; No. EGU23-10587; Copernicus Meetings: Online, 2023. [Google Scholar]
  25. Eyring, V.; Bony, S.; Meehl, G.A.; Senior, C.A.; Stevens, B.; Stouffer, R.J.; Taylor, K.E. Overview of the Coupled Model Intercomparison Project Phase 6 (CMIP6) experimental design and organization. Geosci. Model Dev. 2016, 9, 1937–1958. [Google Scholar] [CrossRef]
  26. Liu, X.; Liang, X.; Li, X.; Xu, X.; Ou, J.; Chen, Y.; Li, S.; Wang, S.; Pei, F. A future land use simulation model (FLUS) for simulating multiple land use scenarios by coupling human and natural effects. Landsc. Urban Plan. 2017, 168, 94–116. [Google Scholar] [CrossRef]
  27. Liang, X.; Guan, Q.; Clarke, K.C.; Liu, S.; Wang, B.; Yao, Y. Understanding the drivers of sustainable land expansion using a patch-generating land use simulation (PLUS) model: A case study in Wuhan, China. Comput. Environ. Urban Syst. 2021, 85, 101569. [Google Scholar] [CrossRef]
  28. Tian, L.; Tao, Y.; Fu, W.; Li, T.; Ren, F.; Li, M. Dynamic simulation of land use/cover change and assessment of forest ecosystem carbon storage under climate change scenarios. Remote Sens. 2022, 14, 2330. [Google Scholar] [CrossRef]
  29. Zhang, J.; Li, L.; Li, Q.; Chen, W.; Huang, J.; Guo, Y.; Ji, G. Multiscenario Land Use Change Simulation and Its Impact on Ecosystem Service Function in Henan Province Based on FLUS-InVEST Model. Ecol. Evol. 2025, 15, e71111. [Google Scholar] [PubMed]
  30. Turner, B.L., II; Lambin, E.F.; Reenberg, A. The emergence of land change science for global environmental change and sustainability. Proc. Natl. Acad. Sci. USA 2007, 104, 20666–20671. [Google Scholar] [CrossRef] [PubMed]
  31. McNicol, I.M.; Ryan, C.M.; Mitchard, E.T.A. Carbon losses from deforestation and widespread degradation offset by extensive growth in African woodlands. Nat. Commun. 2018, 9, 3045. [Google Scholar] [CrossRef] [PubMed]
  32. Rudel, T.K.; Coomes, O.T.; Moran, E.; Achard, F.; Angelsen, A.; Xu, J.; Lambin, E. Forest transitions: Towards a global understanding of land use change. Glob. Environ. Change 2005, 15, 23–31. [Google Scholar] [CrossRef]
  33. Abdisa, L. Application of CA-Markov model for land use/land cover change dynamics analysis in Belete Gera Forest Priority Area, Southwestern Ethiopia. J. Land Rural Stud. 2020, 8, 1–16. [Google Scholar]
  34. Padonou, E.A.; Sinsin, B.; Le Page, C. Simulating land cover changes in northern Benin using a Markov chain model. J. Land Use Sci. 2013, 8, 347–364. [Google Scholar]
  35. Crowther, T.W.; Glick, H.B.; Covey, K.R.; Bettigole, C.; Maynard, D.S.; Thomas, S.M.; Smith, J.R.; Hintler, G.; Duguid, M.C.; Amatulli, G.; et al. Mapping Tree Density at a Global Scale. Nature 2015, 525, 201–205, Corrigendum in Nature 2016, 532, 268. [Google Scholar] [CrossRef] [PubMed]
  36. Leys, C.; Klein, O.; Bernard, P.; Licata, L. Detecting outliers: Do not use standard deviation around the mean, use absolute deviation around the median. J. Exp. Soc. Psychol. 2013, 49, 764–766. [Google Scholar] [CrossRef]
  37. Liu, D.; Zheng, X.; Wang, H. Land-use Simulation and Decision-Support system (LandSDS): Seamlessly integrating system dynamics, agent-based model, and cellular automata. Ecol. Model. 2020, 417, 108924. [Google Scholar]
  38. Hair, J.F.; Black, W.C.; Babin, B.J.; Anderson, R.E. Multivariate Data Analysis, 8th ed.; Cengage: Boston, MA, USA, 2019. [Google Scholar]
  39. O’Neill, B.C.; Kriegler, E.; Riahi, K.; van Vuuren, D.P. A new scenario framework for climate change research: The matrix of SSPs and RCPs. Clim. Change 2014, 122, 373–380. [Google Scholar]
  40. Riahi, K.; Van Vuuren, D.P.; Kriegler, E.; O’Neill, B.; Rogelj, J. The Shared Socioeconomic Pathways (SSPs): An Overview. Available online: https://unfccc.int/sites/default/files/part1_iiasa_rogelj_ssp_poster.pdf (accessed on 27 September 2025).
  41. Fu, S.; Xu, B.; Yu, J.; Feng, Y.; Liu, L.; Yang, Z. How Urban Expansion Influencing Temporal and Spatial Changes in Land Use. SAGE Open 2025, 15, 21582440251378806. [Google Scholar] [CrossRef]
  42. Li, X. Dynamic variation and driving mechanisms of land use change. Front. Environ. Sci. 2023, 11, 1335624. [Google Scholar]
  43. Rivas, C.A.; Guerrero-Casado, J.; Navarro-Cerrillo, R.M. A New Combined Index to Assess the Fragmentation Status of a Forest Patch Based on Its Size, Shape Complexity, and Isolation. Diversity 2022, 14, 896. [Google Scholar] [CrossRef]
  44. Chen, Z.; Jiang, X.; Pan, X.; Chen, Y.; Lei, J.; Wu, T.; Chen, X.; Li, Y.; Shi, T. Multi-scenario land use simulation and carbon storage prediction analysis in the Hainan Tropical Rainforest National Park. Front. Ecol. Evol. 2025, 13, 1539340. [Google Scholar] [CrossRef]
  45. Xiao, H.; Liu, J.; He, G.; Zhang, X.; Wang, H.; Long, T.; Zhang, Z.; Wang, W.; Yin, R.; Guo, Y.; et al. Data-Driven Forest Cover Change and Its Driving Factors Analysis in Africa. Front. Environ. Sci. 2022, 9, 780069. [Google Scholar] [CrossRef]
  46. Vancutsem, C.; Pekel, J.F.; Bontemps, S. Changes in forest cover in sub-Saharan Africa between 2000 and 2012. Remote Sens. Environ. 2013, 137, 102–113. [Google Scholar]
  47. Gao, J.; O’Neill, B.C. Mapping global urban land for the 21st century with data-driven simulations and Shared Socioeconomic Pathways. Nat. Commun. 2020, 11, 2302. [Google Scholar] [CrossRef] [PubMed]
  48. Riahi, K.; Van Vuuren, D.P.; Kriegler, E.; Edmonds, J.; O’Neill, B.C.; Fujimori, S.; Bauer, N.; Calvin, K.; Dellink, R.; Fricko, O.; et al. The shared socioeconomic pathways and their energy, land use, and greenhouse gas emissions implications: An overview. Glob. Environ. Change 2017, 42, 153–168. [Google Scholar] [CrossRef]
  49. Gibbs, H.K.; Ruesch, A.S.; Achard, F.; Clayton, M.K.; Holmgren, P.; Ramankutty, N.; Foley, J.A. Tropical forests were the primary sources of new agricultural land in the 1980s and 1990s. Proc. Natl. Acad. Sci. USA 2010, 107, 16732–16737. [Google Scholar] [CrossRef] [PubMed]
  50. Sodhi, N.S.; Koh, L.P.; Brook, B.W.; Ng, P.K. Southeast Asian biodiversity: An impending disaster. Trends Ecol. Evol. 2004, 19, 654–660. [Google Scholar] [CrossRef] [PubMed]
  51. Meyfroidt, P.; Lambin, E.F. Global forest transition: Prospects for an end to deforestation. Annu. Rev. Environ. Resour. 2011, 36, 343–371. [Google Scholar] [CrossRef]
  52. Hosonuma, N.; Herold, M.; De Sy, V.; De Fries, R.S.; Brockhaus, M.; Verchot, L.; Angelsen, A.; Romijn, E. An assessment of deforestation and forest degradation drivers in developing countries. Environ. Res. Lett. 2012, 7, 044009. [Google Scholar] [CrossRef]
  53. Tang, Q.; Yu, P.H.; Chen, Z.Y.; Bai, S.Y.; Chen, Y.Y. Simulation of land use change based on the shared socioeconomic pathways. Res. Soil Water Conserv. 2022, 29, 301–310. (In Chinese) [Google Scholar]
  54. Li, S.C.; Liu, J.L.; Wang, Y.L. Research Progress on the Ecological and Environmental Effects of Land Use Change in China. Acta Geogr. Sin. 2020, 75, 1809–1826. (In Chinese) [Google Scholar]
  55. Otieno, T.A.; Otieno, L.A.; Rotich, B.; Löhr, K.; Kipkulei, H.K. Modeling climate change impacts and predicting future vulnerability in the Mount Kenya Forest Ecosystem. Environ. Monit. Assess. 2025, 197, 631. [Google Scholar] [CrossRef] [PubMed]
  56. Assede, E.S.P.; Orou, H.; Biaou, S.S.H.; Geldenhuys, C.J.; Ahononga, F.C.; Chirwa, P.W. Understanding drivers of land use and land cover change in Africa: A review. Curr. Landsc. Ecol. Rep. 2023, 8, 62–72. [Google Scholar] [CrossRef]
  57. Zou, L.; Chen, J.; Wang, Y.; Zhao, A.; Dai, M.; Sanchez-Azofeifa, A. Simulating tropical forest change using a cellular automata-agent based model. Ecol. Model. 2025, 509, 111256. [Google Scholar] [CrossRef]
  58. Lambin, E.F.; Meyfroidt, P. Land use transitions: Socio-ecological feedback versus socio-economic change. Land Use Policy 2010, 27, 108–118. [Google Scholar]
  59. Otieno, L.A.; Otieno, T.A.; Rotich, B.; Löhr, K.; Kipkulei, H.K. Integrating remote sensing and machine learning to evaluate environmental drivers of post-fire vegetation recovery in the Mount Kenya forest. Discov. Geosci. 2025, 3, 81. [Google Scholar] [CrossRef]
  60. Richardson, D.M. Invasive trees in South Africa: Impacts and management. Biol. Rev. 2020, 95, 892–915. [Google Scholar]
  61. van Wilgen, B.W. Alien plant invasions in South Africa: A national assessment. Biol. Invasions 2016, 18, 3435–3452. [Google Scholar]
Figure 1. Technical flowchart of the study.
Diversity 18 00406 g001
Figure 2. National boundaries were obtained from Natural Earth (2020), and the forest/non-forest layer was derived from GLC_FCS30D and further refined in South Africa using the global tree-density map of Crowther et al. [35].
Diversity 18 00406 g002
Figure 8. Kernel density distribution map. Unit: km2/km2. Projection: WGS 1984 UTM Zone 34N (EPSG:32634). (ae) Projections for 2070: (a) SSP1, (b) SSP2, (c) SSP3, (d) SSP4, (e) SSP5; (fj) Projections for 2050: (f) SSP1, (g) SSP2, (h) SSP3, (i) SSP4, (j) SSP5; (ko) Projections for 2030: (k) SSP1, (l) SSP2, (m) SSP3, (n) SSP4, (o) SSP5; (p) Baseline spatial pattern of woodland fragmentation for the year 2020.
Diversity 18 00406 g008
Figure 9. Trends in the fragmentation index of African woodlands under different SSP scenarios from 2020 to 2070: (a) AWMSI; (b) CA (ha); (c) ED (m/ha); (d) MPAR; (e) MPFD; (f) MPS (ha); (g) MSI; (h) NP; (i) TE (m); (j) TLA (ha).
Diversity 18 00406 g009
Table 1. Overview of datasets used in this study.
Data CategoriesDataYearsData SourceResolution
Land Use DataGLC_FCS30D Global 30 m Fine-scale Land Cover Dynamic Monitoring Dataset2020 (base period)International Research Center for Big Data for Sustainable Development (https://data.casearth.cn, accessed on 12 March 2025)30 m
Tree-Density Validation DataGlobal tree-density map2015Crowther et al. (2015) [35]; Yale University data repository1 km
SSP Scenario DataSSP1-SSP5 Scenario Population, GDP, and Policy Constraint Parameters2020–2070SSP database (https://tntcat.iiasa.ac.at/SspDb, accessed on 20 March 2025)1 km
Climate DataGlobal 1 km resolution annual precipitation dataset, Global 1 km resolution annual average temperature dataset2000–2020 (calibration period)National Earth System Science Data Center (https://www.geodata.cn/, accessed on 08 May 2025)1 km
Terrain DataSRTM 30 m DEM dataNASA-Earth Data (https://dwtkns.com/srtm30m/, accessed on 02 June 2025)30 m
Socioeconomic DataLandScan global population distribution data, global GDP raster data2020LandScan official website (https://landscan.ornl.gov/, accessed on 15 June 2025), World Bank Open Data Platform1 km
Traffic DataAfrican road and railway vector dataset2020OpenStreetMap (www.openstreetmap.org, accessed on 03 August 2025)vector
Auxiliary DataAfrican country border vector data2020Natural Earth Data (https://www.naturalearthdata.com, accessed on 27 September 2025)vector
Table 2. List of metrics used for fragmentation analysis in the Patch Analyst extension.
GroupFragmentation IndexDefinition
AreaCellular Region (CA)The sum of the areas of all patches in a given category
Total Landscape Area (TLA)The sum of the areas of all patches in the landscape
Patch sizeNumber of patches (NP)
Mean Plaque Size (MPS)
Category/Total number of patches in landscape average patch size
SideTotal Number of edges (TE)Total perimeter of plaque
Edge Density (ED)The ratio of edge area to landscape area
ShapeMean Shape Index (MSI)
Area-Weighted Mean Shape Index(AWMSI)
Mean Perimeter–Area Ratio (MPAR)
Mean patch fractal dimension (MPFD)
Mean perimeter to area ratio (MSI) divided by weighted patch area average patch
The ratio of perimeter to patch area after logarithmic transformation of patch perimeter and
Patch area ratio after logarithmic transformation
Table 3. Dynamics and variations in African woodlands under different SSP scenarios.
SSP
Scenario
MeasurementPeriod
2020–20302030–20502050–2070
SSP1Dynamic degree/%0.41230.2067−0.4349
Variation/km252,02926,190−55,232
SSP2Dynamic degree/%0.99420.2075−0.2345
Variation/km2125,46526,442−29,949
SSP3Dynamic degree/%0.81631.24−0.3476
Variation/km2103,014157,763−44,776
SSP4Dynamic degree/%0.2181−1.2251−0.8206
Variation/km227,519−154,951−102,512
SSP5Dynamic degree/%0.22060.80590.3094
Variation/km227,839101,92639,443
Table 4. African woodland transfer matrix, 2020–2070 (unit: km2).
SSP ScenarioSwitching ModesTime Period
2020–20302030–20502050–2070
SSP1Transfer out650,028375,109182,739
Transfer702,057401,299127,507
SSP2Transfer out338,686354,688308,002
Transfer464,151381,130278,053
SSP3Transfer out406,519277,679448,949
Transfer509,533435,442404,173
SSP4Transfer out414,656453,800444,079
Transfer442,175298,849341,567
SSP5Transfer out270,653286,914178,585
Transfer298,492388,840218,028
Table 5. Proportion of forest change types (number proportion) in African countries under different SSP scenarios.
SSP ScenarioTypes of Change
Basically Unchanged (%)Downward Trend (%)Upward Trend (%)
SSP164.917.0228.07
SSP266.675.2628.07
SSP356.1415.7928.07
SSP466.6715.7917.54
SSP577.198.7714.04
Disclaimer/Publisher’s Note: The statements, opinions and data contained in all publications are solely those of the individual author(s) and contributor(s) and not of MDPI and/or the editor(s). MDPI and/or the editor(s) disclaim responsibility for any injury to people or property resulting from any ideas, methods, instructions or products referred to in the content.