1. Introduction
This paper continues the documentation of the remarkable levels of unrecognized diversity within the ant fauna of the savanna landscapes of the 2 million km
2 Australian monsoonal (seasonal) tropics (AMT). The AMT is not formally recognized as harboring a particularly diverse ant fauna [
1], but recent analyses that integrate genetic and morphological variation with geographic distribution show that it is inhabited by thousands of species [
2]. This is substantially more than the number currently estimated for the Amazonian fauna, which is generally considered the world’s most diverse [
3].
Extremely high levels of unrecognized diversity occur in many AMT taxa [
2], but especially within the
Monomorium nigrius Forel group, which is a hyperdiverse assemblage of very small, nondescript, and taxonomically intractable myrmicine species. The taxon is formally recognized as a single species,
M. fieldi Forel [
4]. However, seven species have been shown to occur in a single 10 m × 10 m savanna plot [
5] near Darwin in the Northern Territory (NT), representing six broad morphotypes (referred to as the
donisthorpei,
fieldi, sp. 9, sp. 13, sp. 14, and sp. 50 morphotypes [
6]). A subsequent analysis of 401 sequenced specimens from across the AMT, integrating genetic (CO1) and morphological variation with geographic distribution, recognized 74 species within the group [
6]. Given the very limited sampling, it was concluded that more than 200 species of the
M. nigrius group likely occur in the AMT [
6].
The NT is the most extensively surveyed jurisdiction for ants in the AMT, and 53 species of the
M. nigrius group were recognized from the NT monsoonal tropics [
6]. Most (34) of these occur in the Top End, the 400,000 km
2 high-rainfall (>1000 mm) northern third of the NT, and it has been estimated that this region alone is inhabited by more than 50 species [
6]. However, estimates of the total number of species are highly uncertain, given that they are based on extrapolation from very limited sampling. Many ant surveys have since been conducted in the NT monsoonal tropics, including the Top End, yielding numerous additional specimens from the
M. nigrius group. Here, we use these specimens to test the conclusion that more than 200 species of the
M. nigrius group likely occur in the AMT [
6].
2. Materials and Methods
We obtained new CO1 sequences from 223
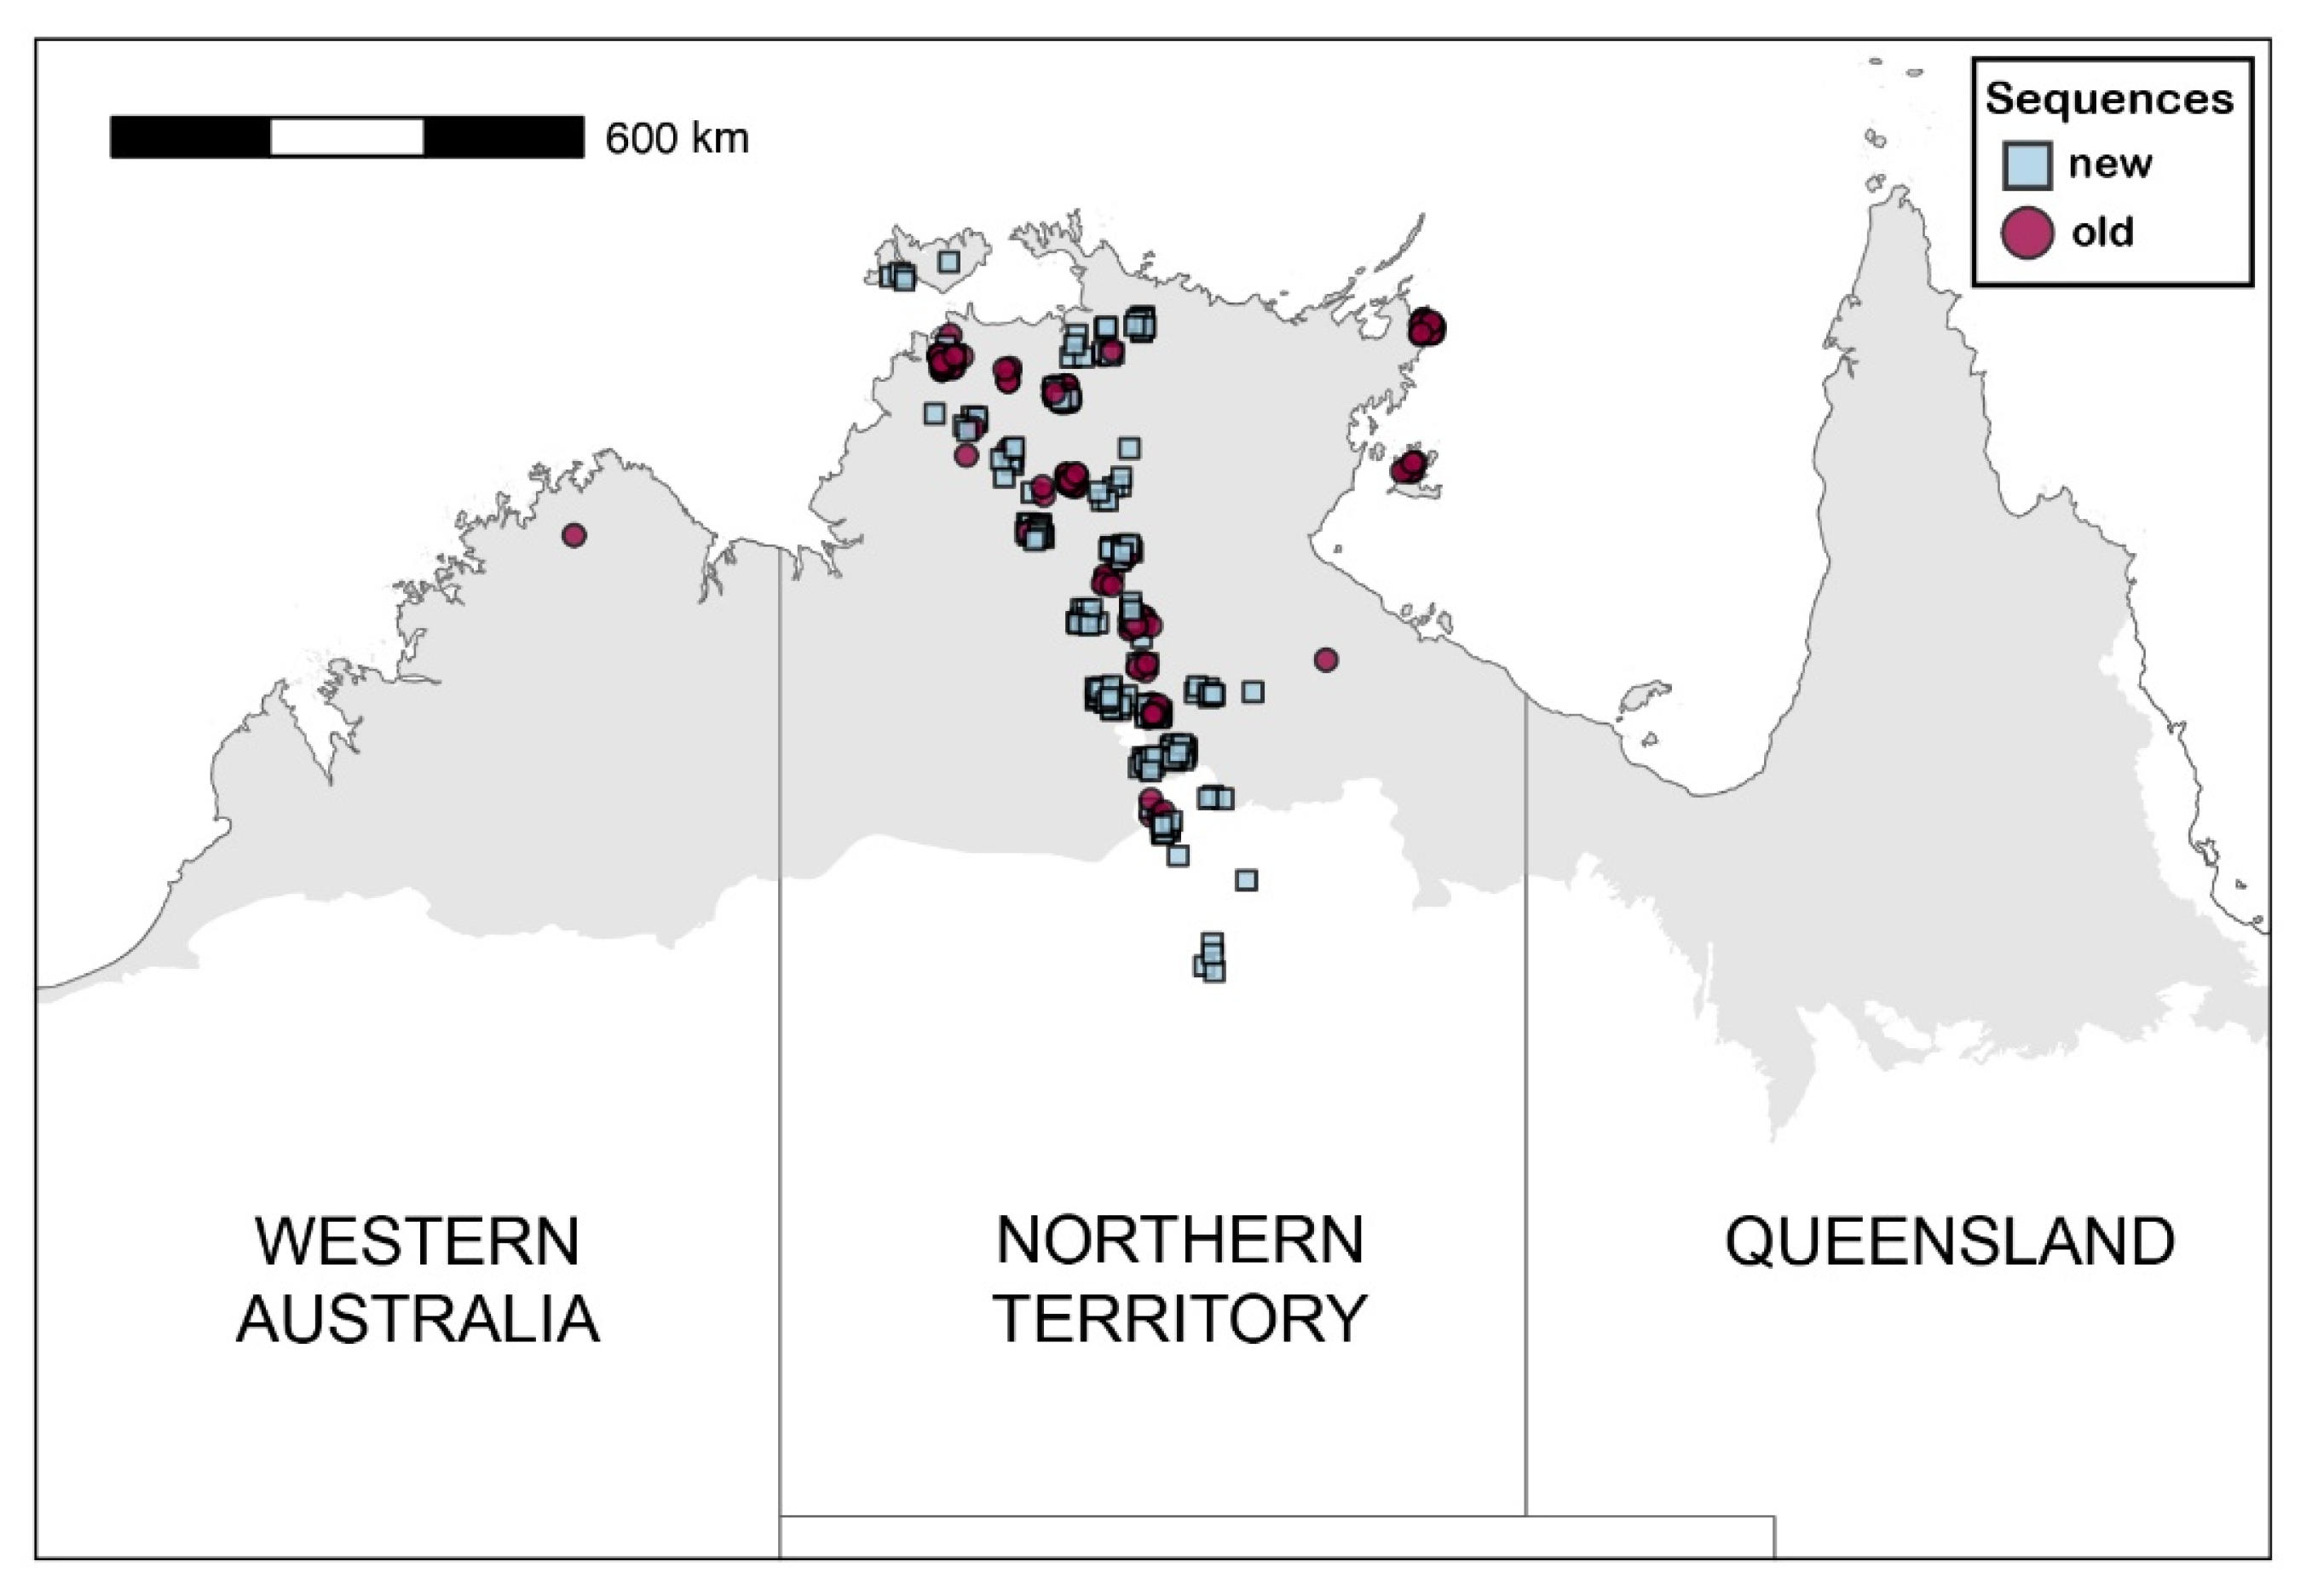
M. nigrius-group specimens collected in or near the NT monsoonal tropics since 2021 (
Supplementary Table S1). These collections were broadly from the same areas in the NT as previously [
6], primarily along the central north–south corridor associated with the Stuart Highway, rather than from new areas (
Figure 1). The Barcode of Life Data (BOLD) System was used for both DNA extraction (from the whole body excluding the gaster, or the foreleg only; for extraction details, see
http://ccdb.ca/resources; accessed on 12 January 2026) and CO1 sequencing. A unique identification code that combines the batch within which it was processed, its number within the batch, and the year of sequencing (e.g., BOLOZ479-24) was assigned to each sequenced specimen. All specimens are labeled with their respective BOLD identification numbers in the ant collection held at the Museum and Art Gallery of the NT in Darwin (previously held at the CSIRO Darwin Laboratory).
In addition to our 223 newly obtained sequences, our analysis considered 138 sequences from [
6] that represented all 53 NT species recognized in that study (
Supplementary Table S1). For species with two sequences, both were used. For species with >2 sequences, at least three were selected that covered the full range of CO1 variation. We included a sequence from sp. A8 from the Kimberley region of Western Australia (WA; DARW342-15), a species that was not recorded from the NT in [
6] but was recorded in our current study. It was included to show that the specimens are conspecific. This gave a total of 361
M. nigrius group sequences for our study (
Supplementary Table S1). We note that the distribution of specimens across the AMT region of the NT remains extremely patchy, with large regions lacking any samples (
Figure 1).
We checked and edited the 361 sequences using MEGA [
7] (version 12.0.01). They were then aligned using the UPGMB clustering method in MUSCLE [
8], resulting in 975 base pairs, and translated into (invertebrate) proteins to check for stop codons and nuclear paralogues. We constructed a maximum likelihood tree in IQ-TREE v3 [
9], using a specimen from the closely related
Monomorium carinatum group from Nitmiluk NP (MONS086-18) as the outgroup. The built-in ModelFinder (-m TEST) was used to identify the best-fit nucleotide substitution model, and node support was assessed using 1000 ultrafast bootstrap replicates (-B 1000). FigTree v1.4.4 was used to produce our final figure.
Intraspecific CO1 distance is typically 1–3% but can vary markedly among species [
10], and CO1 data alone can provide only an indication of diversity within a hyperdiverse group. We used a range of statistical methods for species delimitation based on CO1 data alone. We first used the Poisson tree process (PTP) model and its Bayesian implementation (bPTP). The former infers species boundaries using the number of substitutions within and between species in a maximum likelihood tree, and the latter adds Bayesian values to delimit species on the input tree [
11]. For these, we constructed a second maximum likelihood tree in IQ-TREE with the outgroup removed, then conducted the analyses using the web server (
http://species.h-its.org/ptp/, accessed in 13 January 2026), with settings of 500,000 MCMC generations, 100 thinning, and 0.1 burn-in. To increase the rate of convergence for the MCMC chain, we increased the number of MCMC generations from 100,000 to 500,000.
We then delimited Operational Taxonomic Units (OTUs) from our aligned COI sequence data (excluding the outgroup) using a distance-based clustering approach. Sequence quality was first assessed by calculating the proportion of gap characters and ambiguous bases for each specimen. Sequences in which >50% of sites consisted of such characters occurred in 18 of the 361 cases; these were considered of insufficient quality for reliable distance estimation and were excluded from further analysis. Pairwise genetic distances among the remaining sequences were calculated using the Tamura–Nei 1993 (TN93) substitution model [
12], using pairwise deletion of missing data to maximize the number of comparable sites between each pair of sequences. Sequences were then clustered using the Unweighted Pair Group Method with Arithmetic Mean (UPGMA), implemented via hclust() with method = “average”. OTUs were defined by cutting the resulting dendrogram at six divergence thresholds (1, 2, 3, 4, 5, and 6%). OTU analyses were conducted using the ape (version 5.8) package [
13].
Our ultimate species delimitations were based on the integration of CO1 clustering and distance, morphological variation, and geographic distribution [
14]. Our species concept was based on reproductive isolation as evidenced by morphological differentiation between sister (most closely related) CO1 clades and, where relevant, sympatric distribution.
We produced images of selected species using a Leica DMC5400 camera (Wetzlar, Germany) mounted on a Leica M205C dissecting microscope. Image montages were captured using the Leica Application suite v. 4.13 and stacked in Zerene stacker (Walnut Creek, CA, USA).
Finally, we assessed whether any of the newly recorded species had previously been recorded [
6] in either Western Australia (WA) or Queensland (Qld) by constructing another maximum likelihood tree, using sequences from all newly recorded species for the NT combined with all WA and Qld AMT species from [
6], and also using MONS086-18 as the outgroup.
3. Results
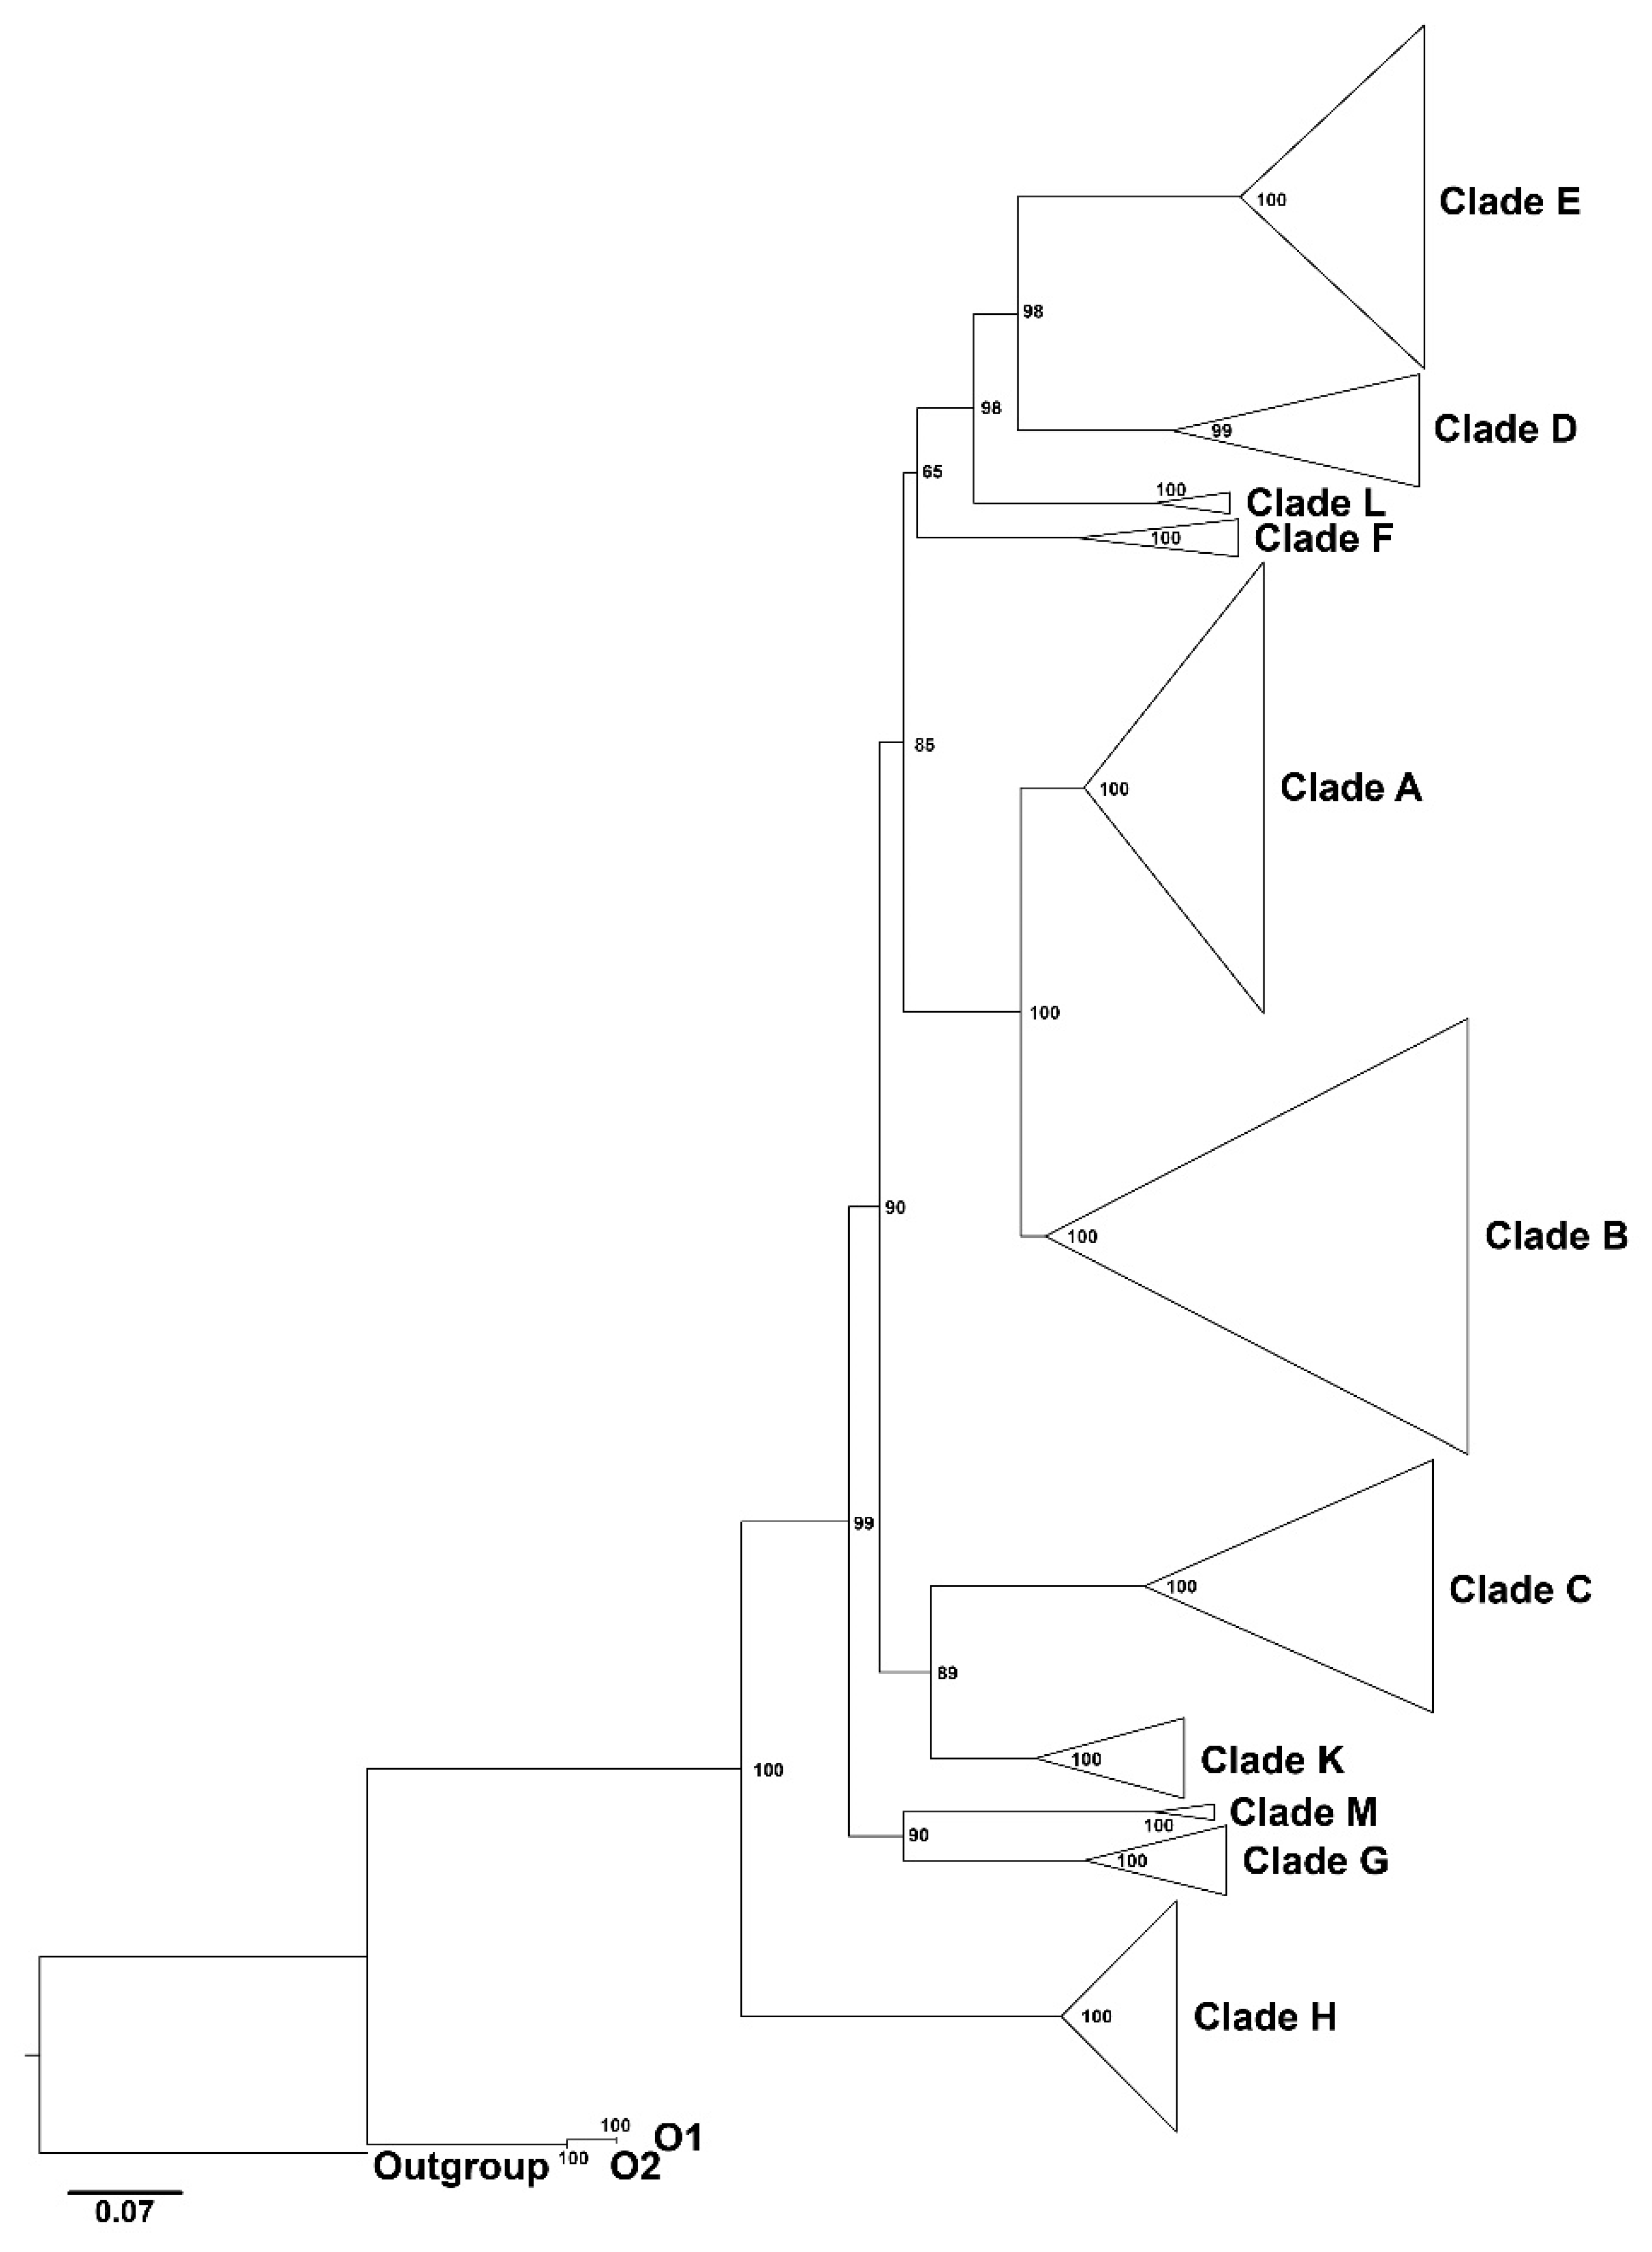
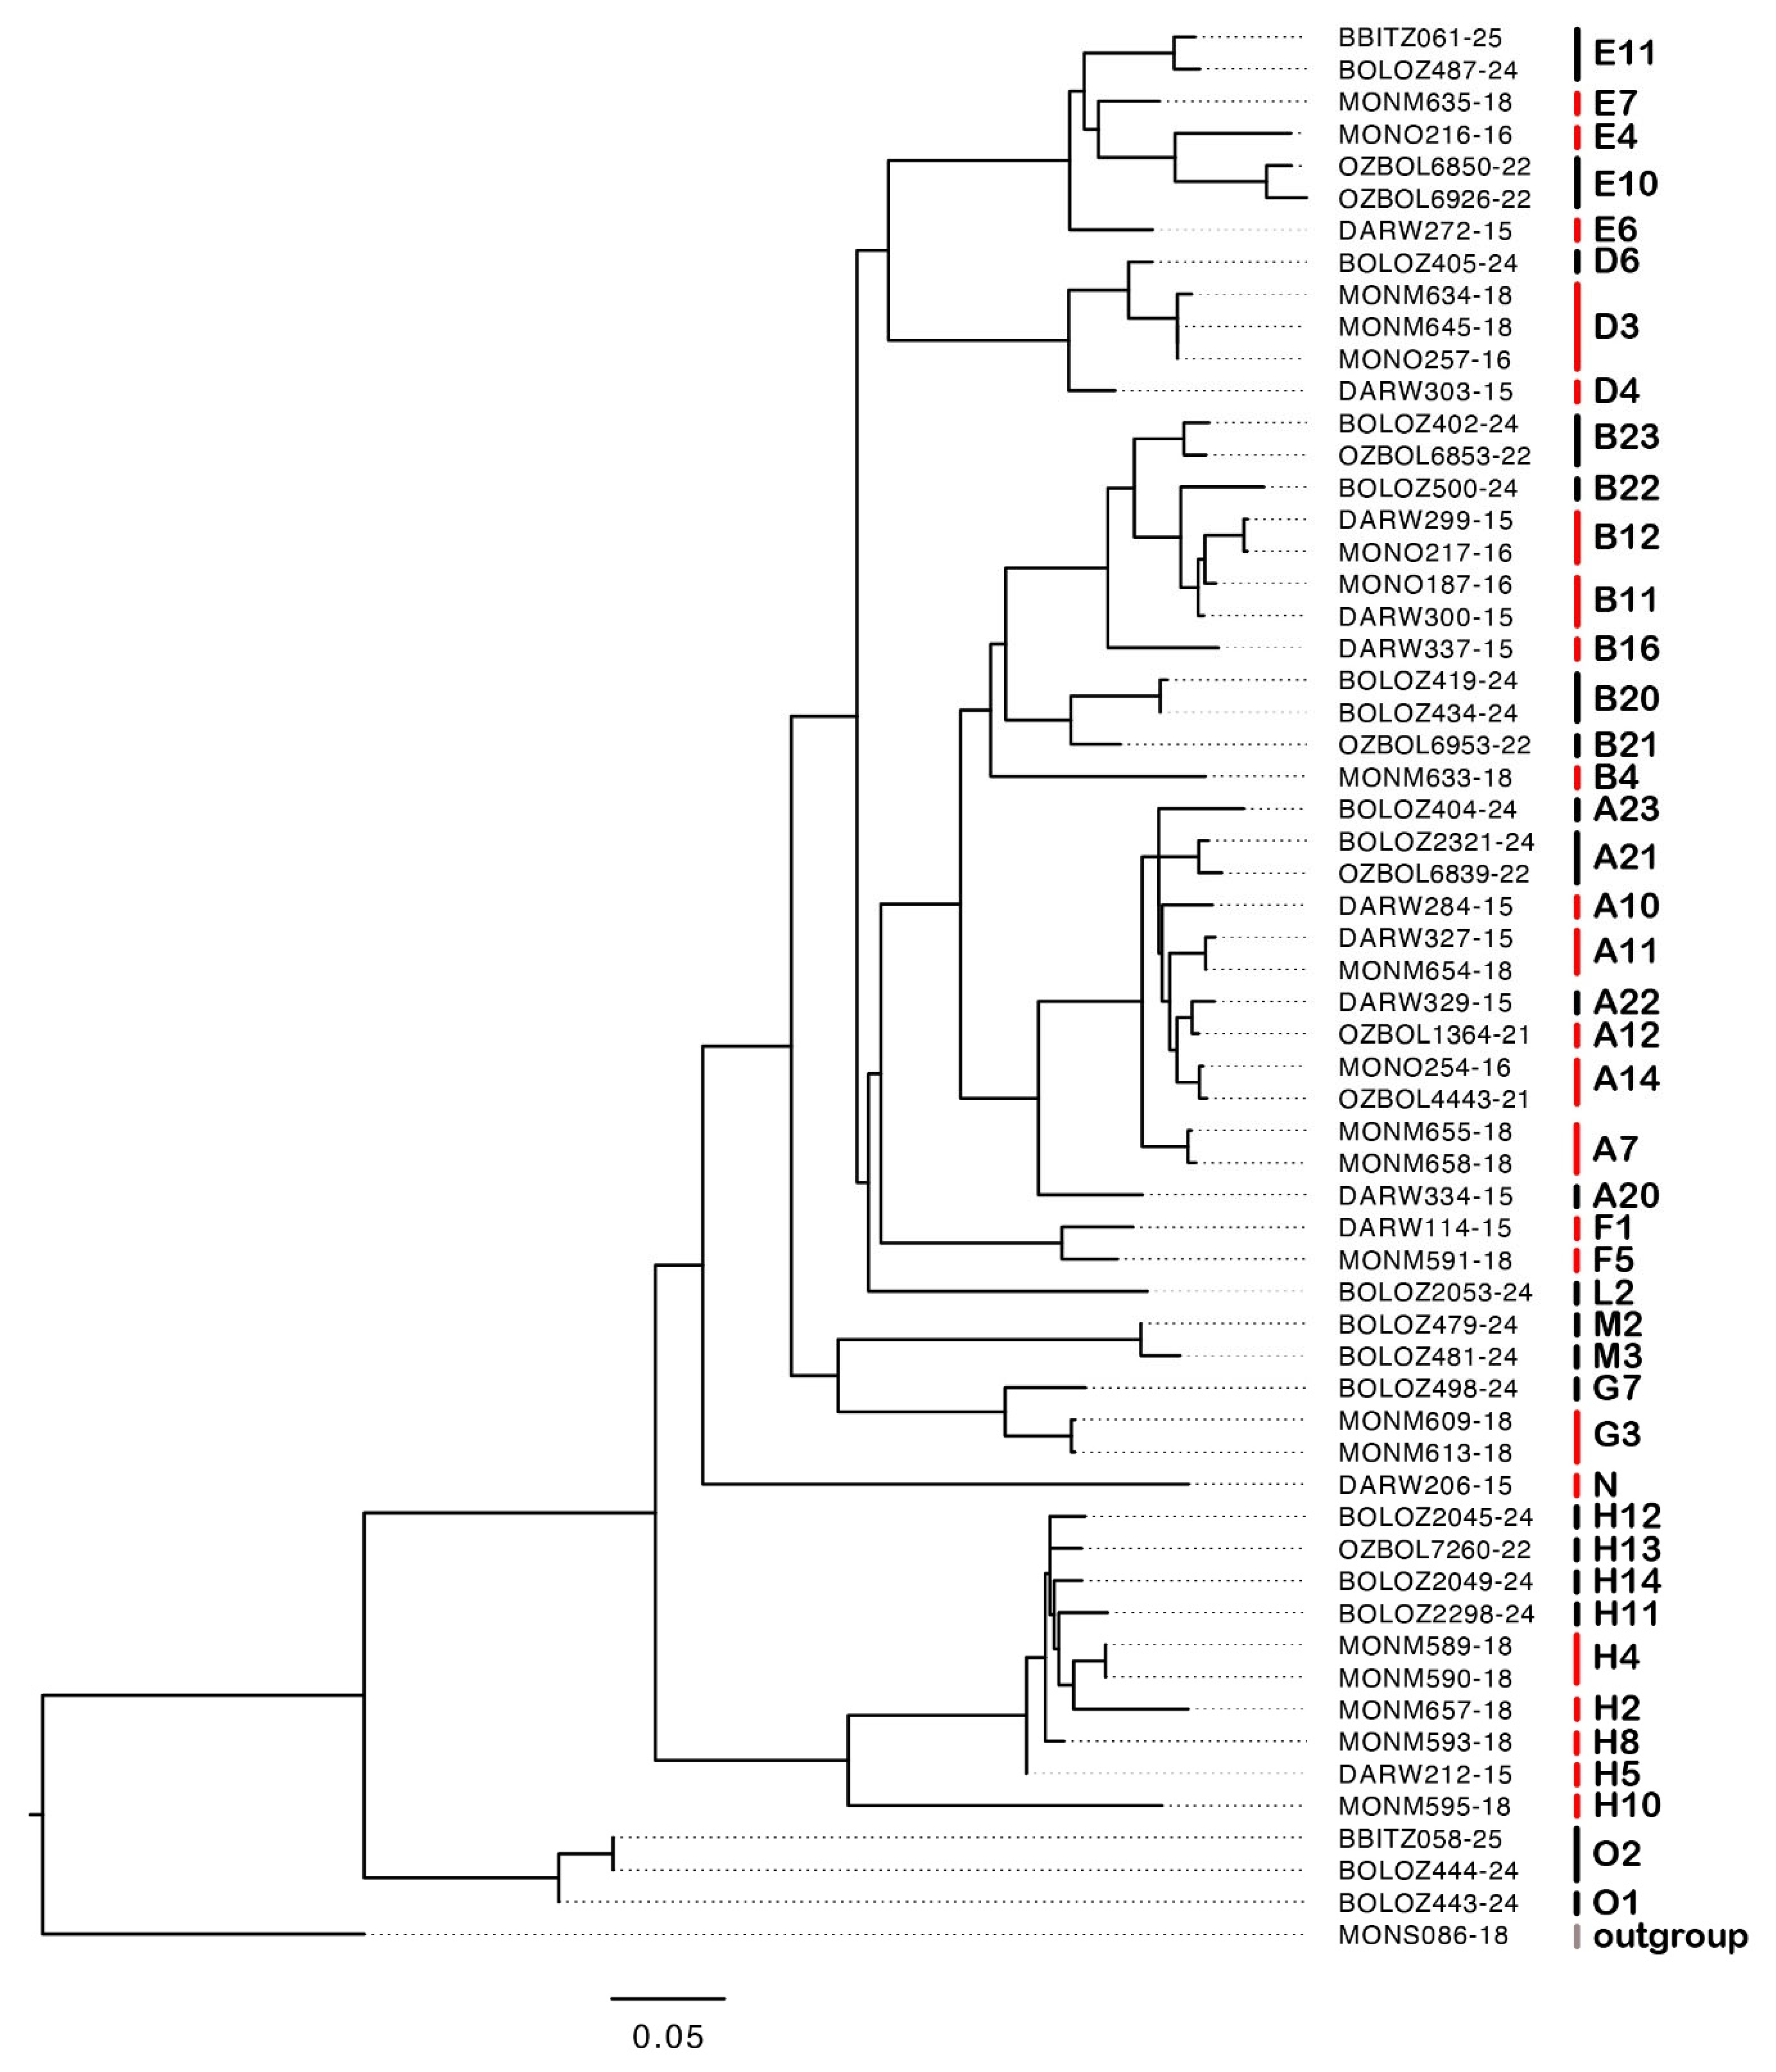
Based on the integrated assessment, we recognize 85 species among our 361 sequenced specimens from the NT monsoonal tropics, belonging to 12 clades, each with ≥99% bootstrap support (
Figure 2). Clade structure followed that found in [
6]. The 85 species comprise 14 in clade A (
Supplementary Figure S1), 18 in clade B (
Figure S2), 12 and 3 in clades C and K, respectively (
Figure S3), 8, 4, 4, and 2 in clades E, D, F, and L, respectively (
Figure S4), 9 in clade H (
Figure S5), 6 and 3 in clades G and M, respectively (
Figure S6) and 2 in clade O (
Figure 2). Clades I, J, and N from [
6] were not represented, and clade O is new. PTP and bPTP analyses recognized totals of 107 and 136 species, respectively (
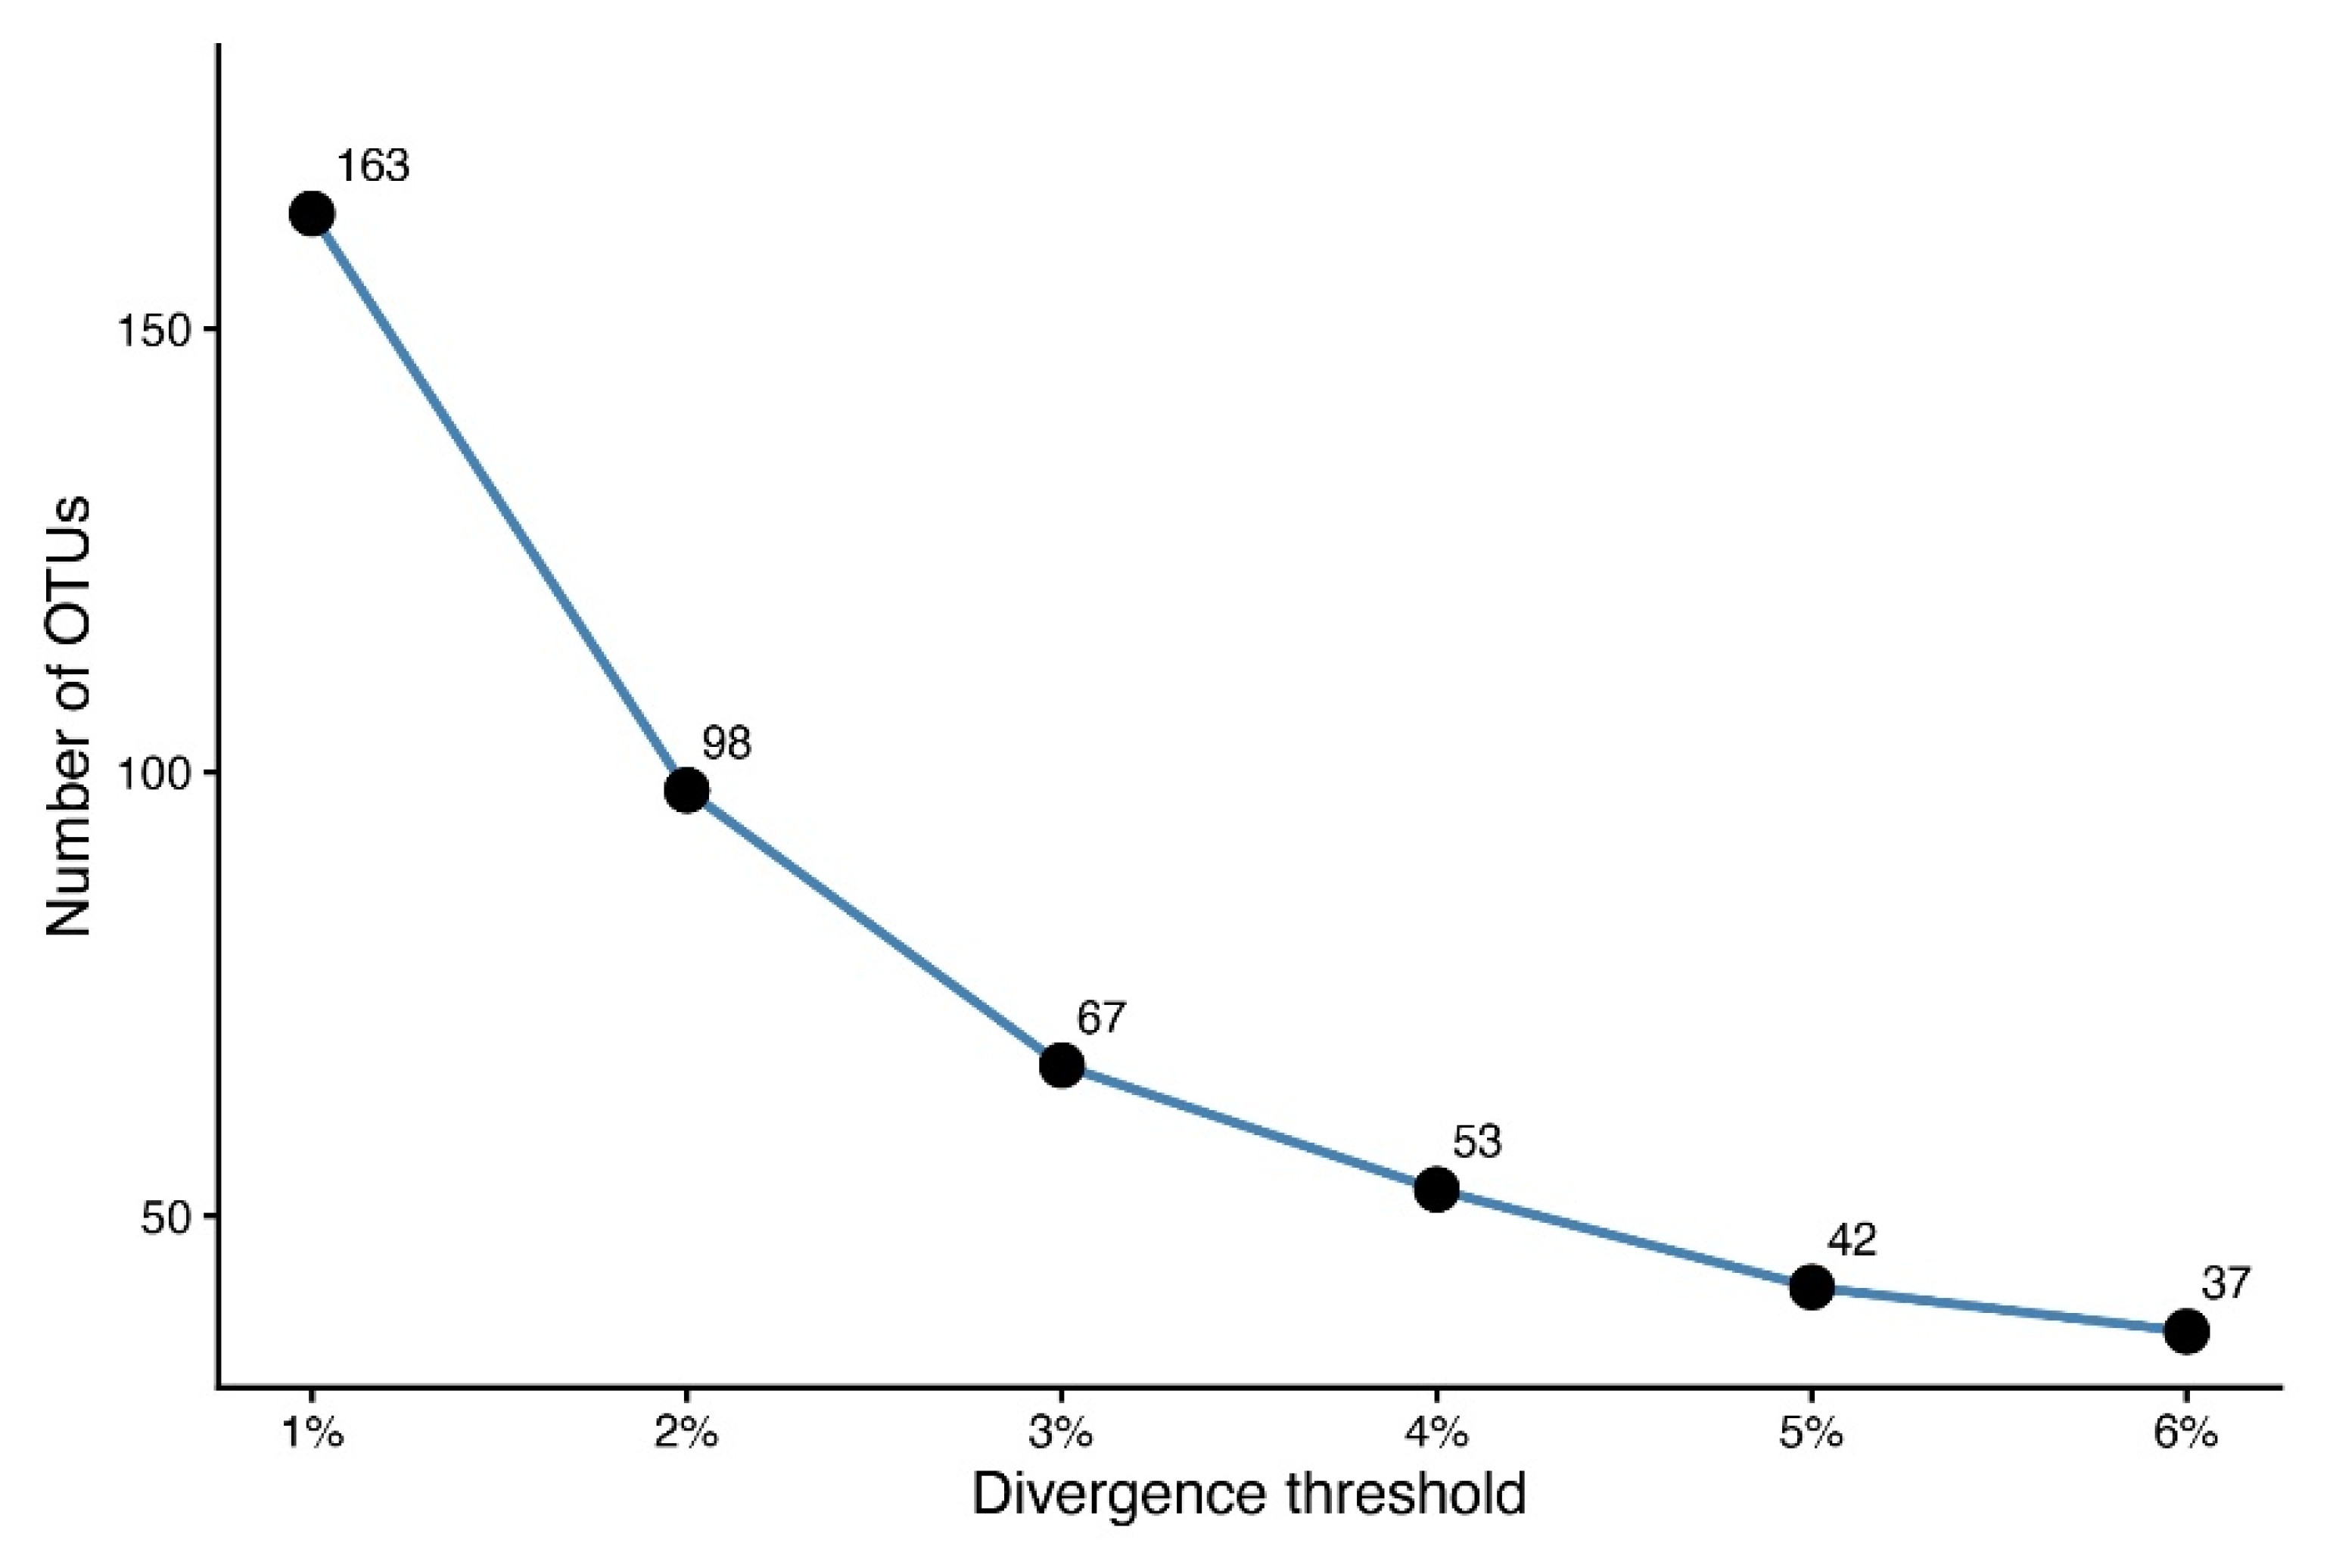
Figures S1–S6). The number of OTUs defined by our six CO1 divergence thresholds ranged from 163 (1%) to 37 (6%) (
Figure 3).
The 223 newly obtained sequences led to some revisions of the species delimitations in [
6]. This included the synonymy of spp. A5 and A9 with sp. A3. The other revisions involved splitting each of the four species (spp. B19, C1, C2, and C3) into multiple species (
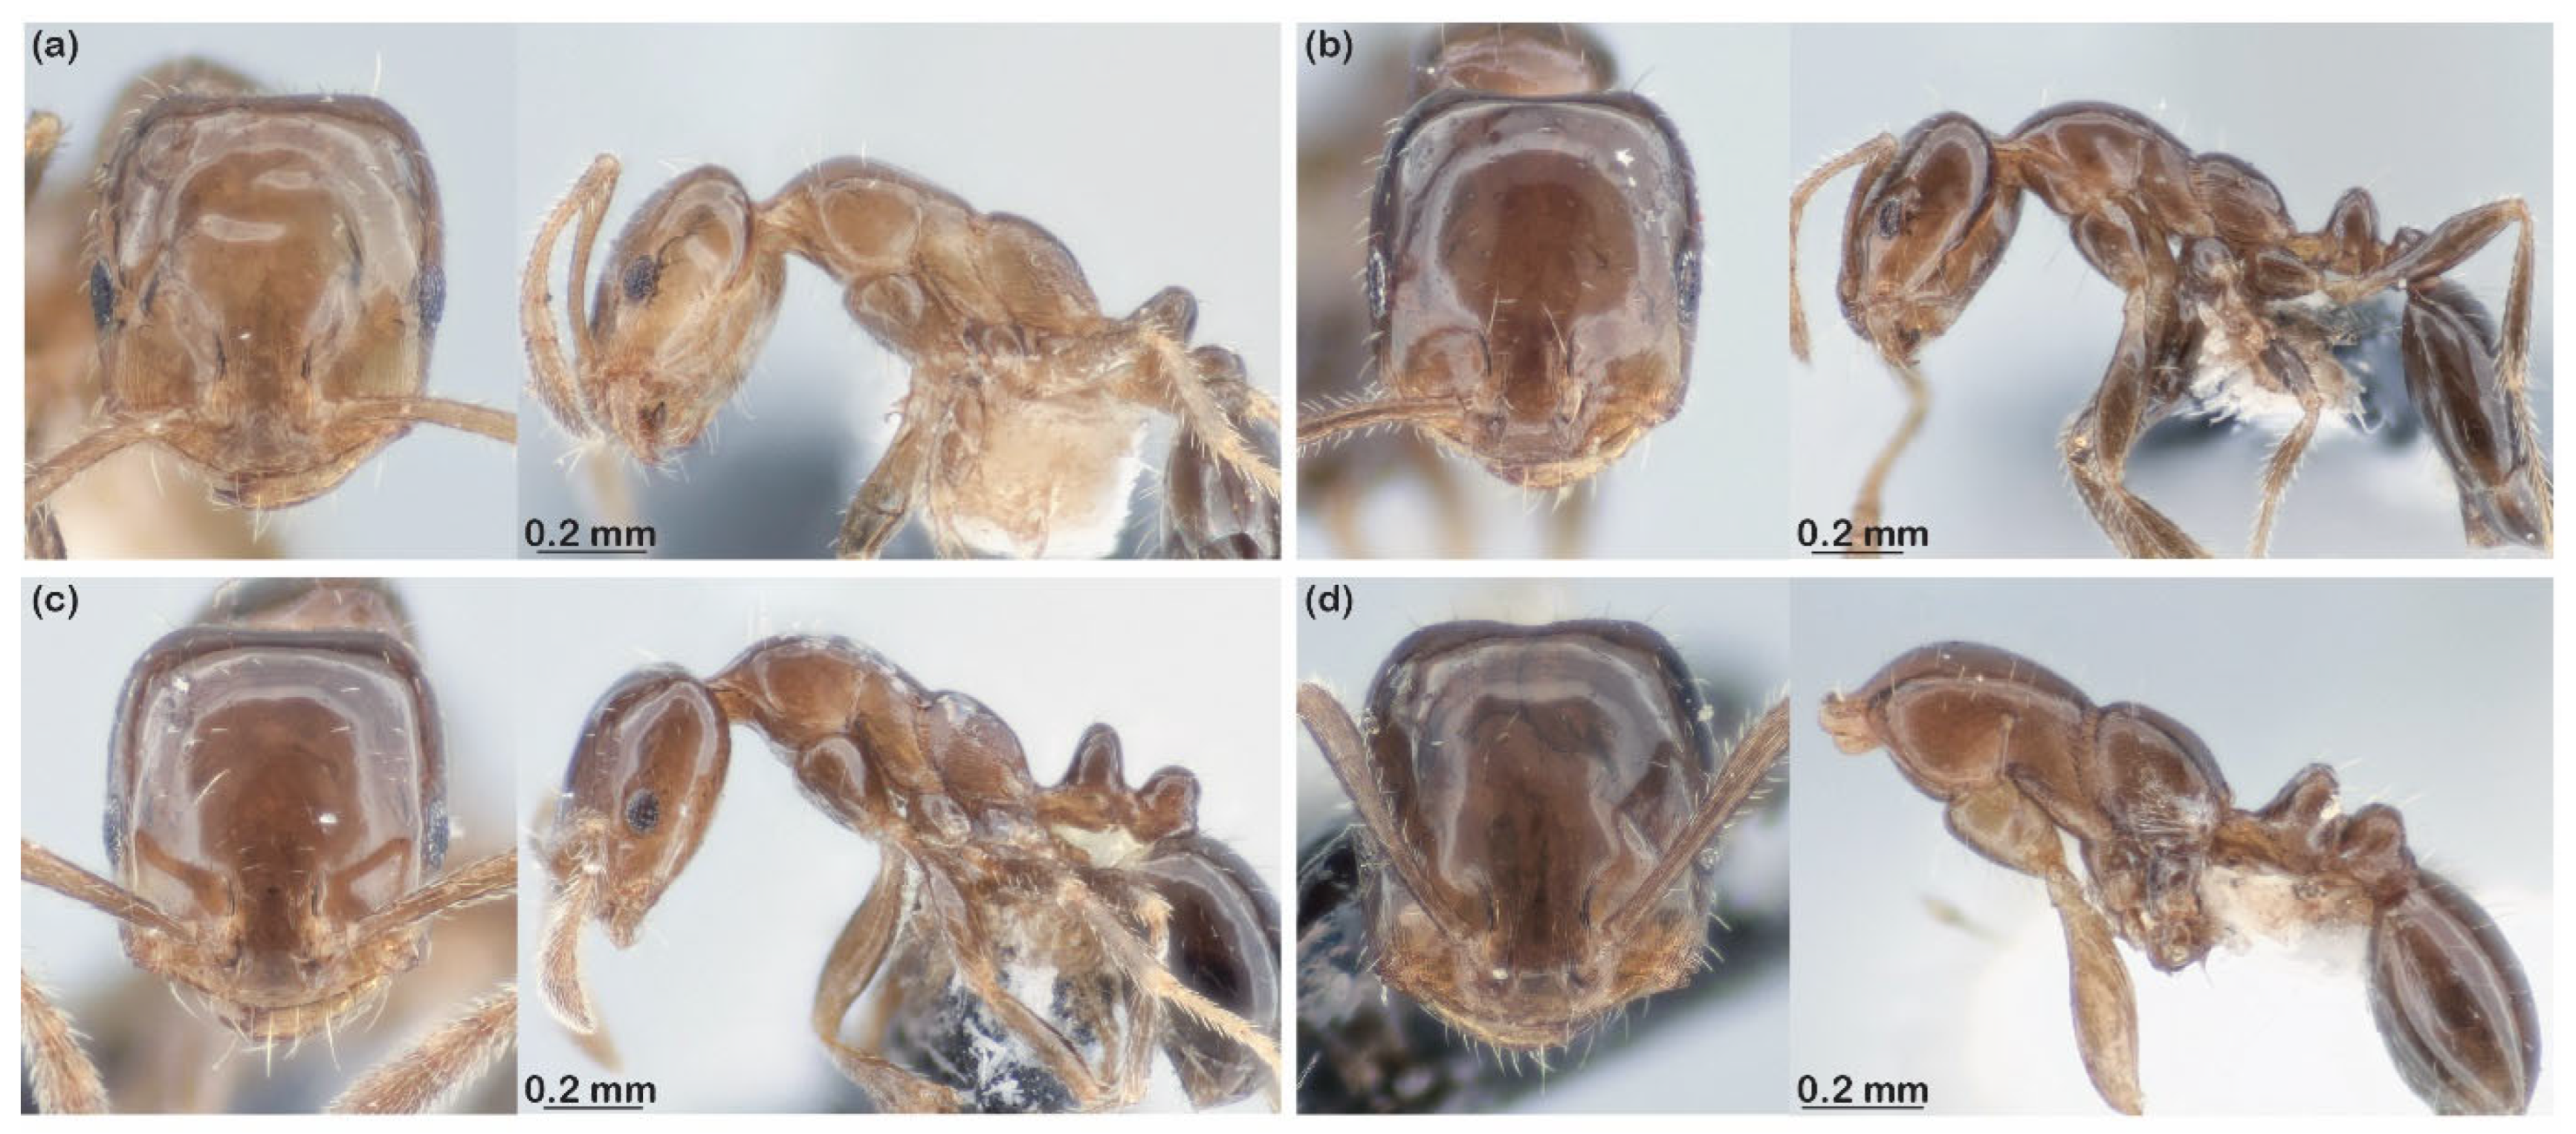
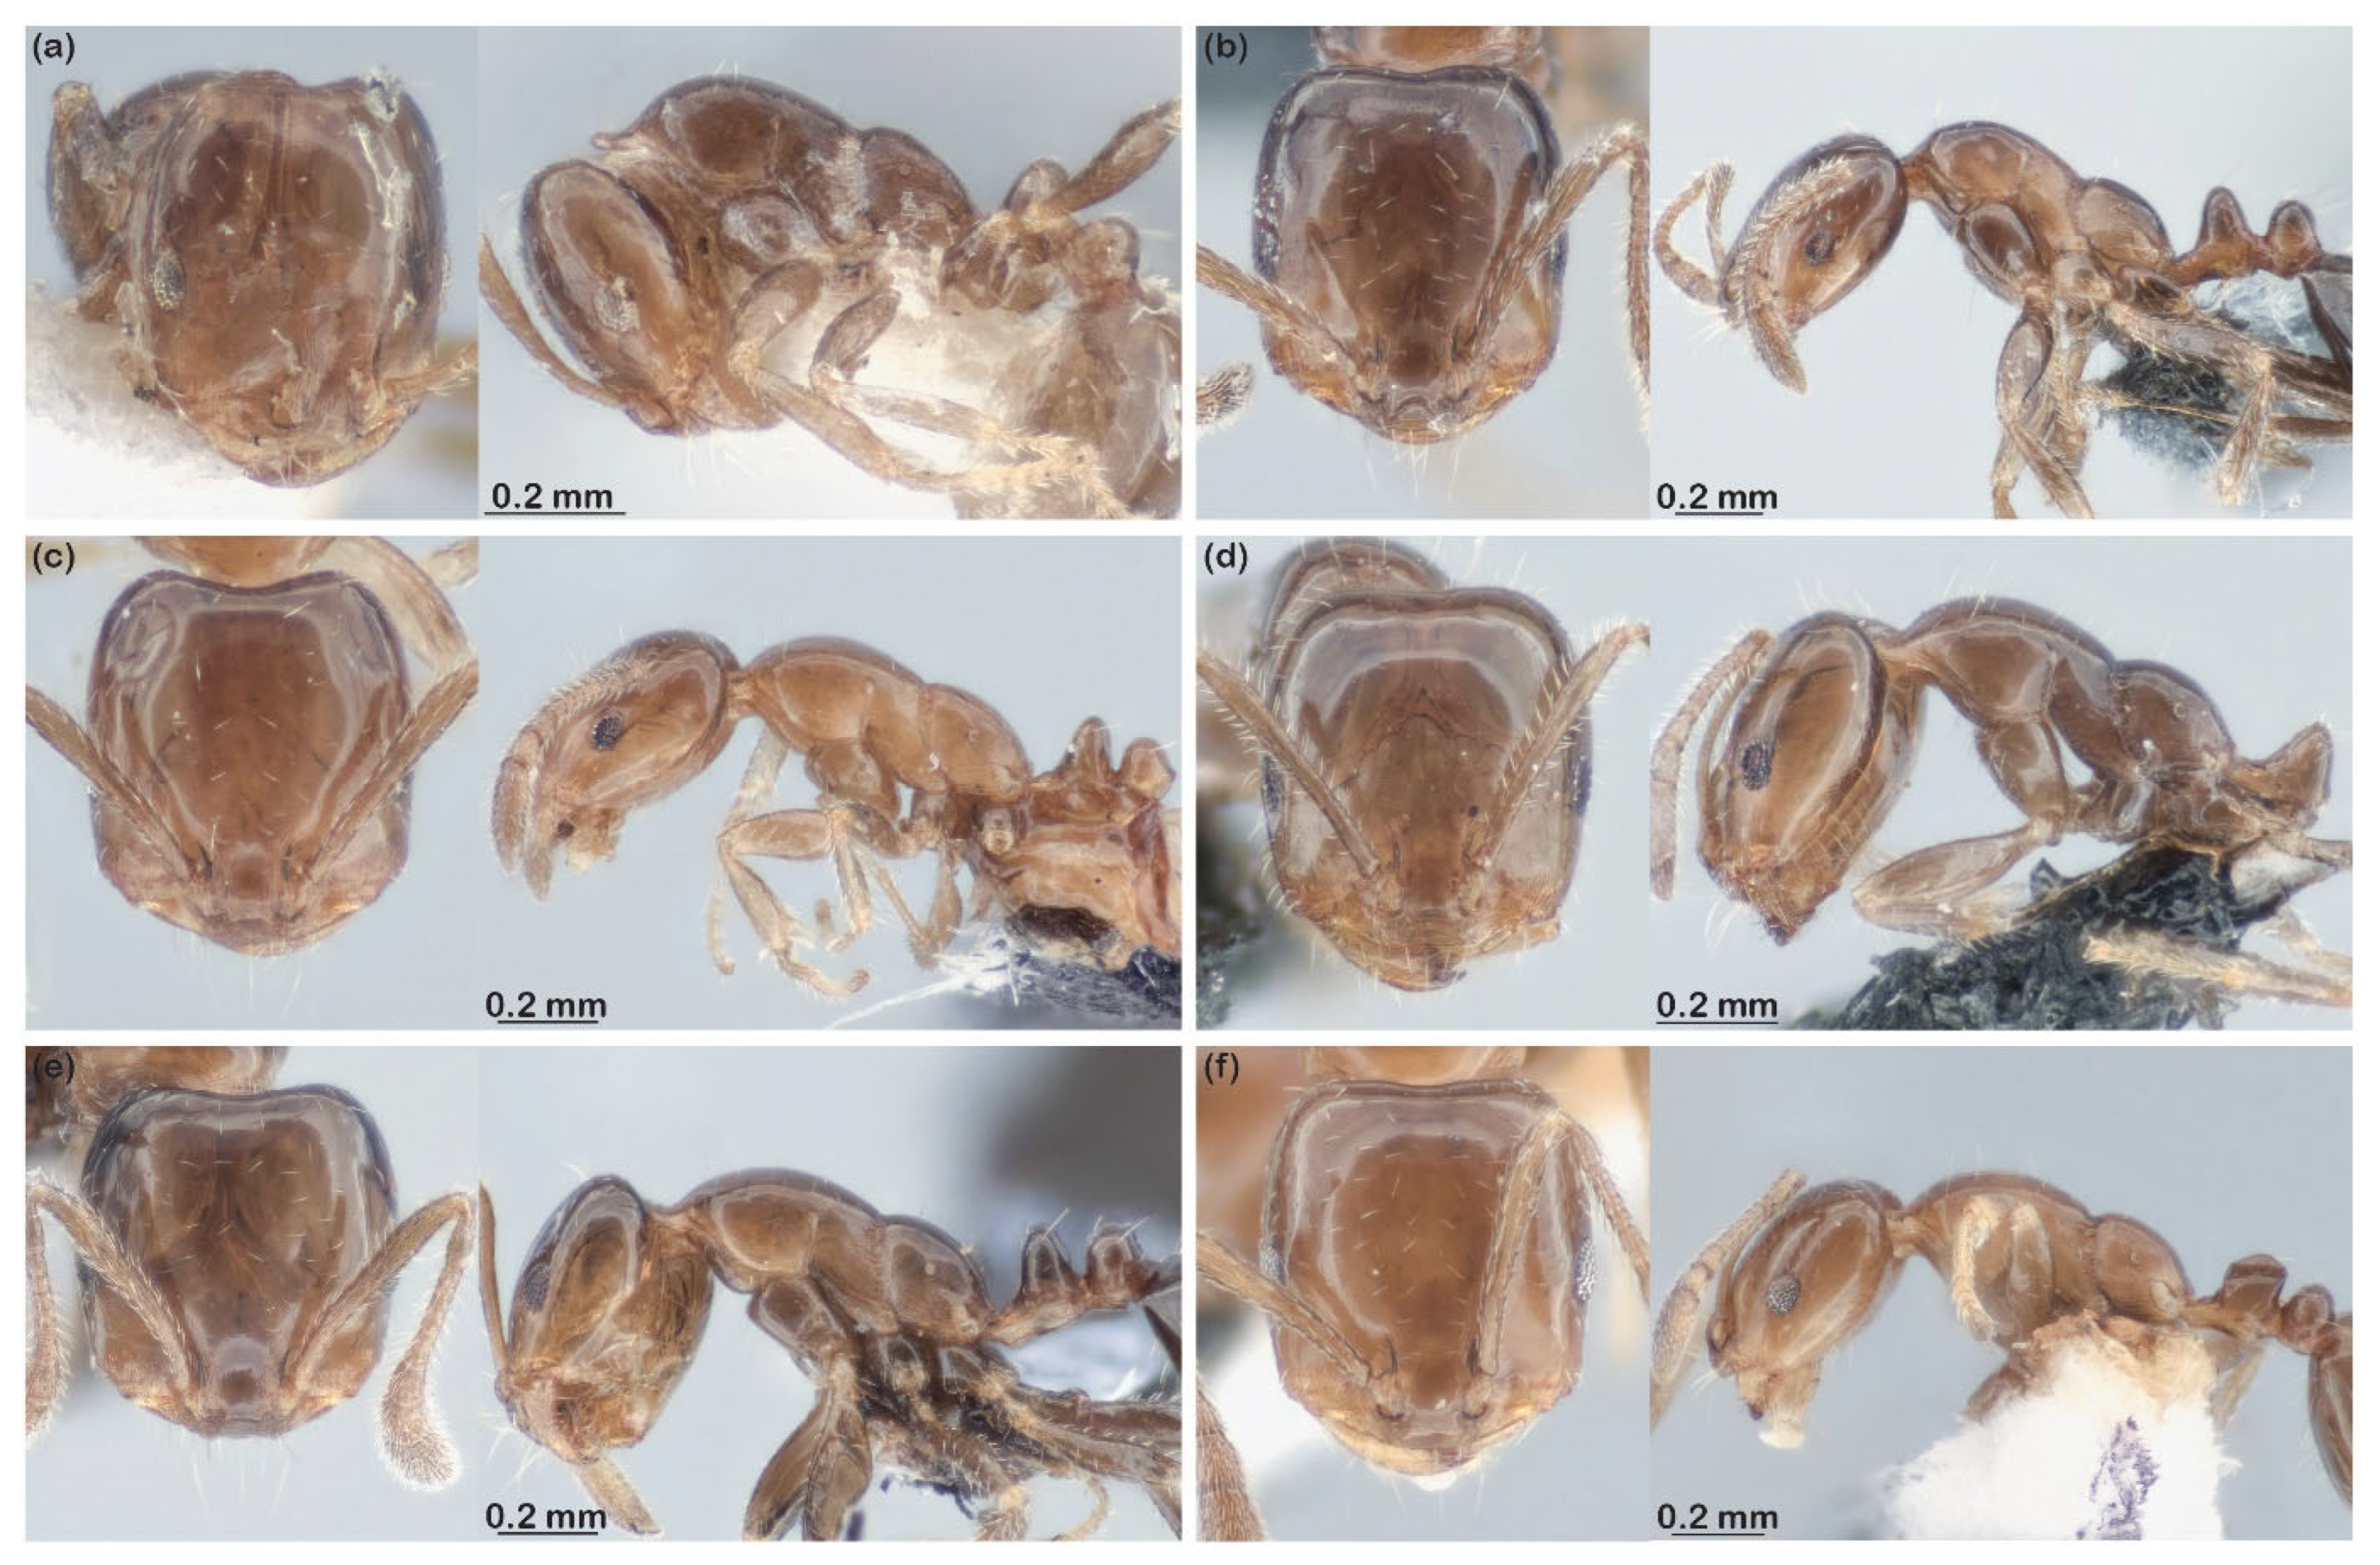
Supplementary Figures S2 and S3). Notably, sp. C3 was split into six species (C3a–f;
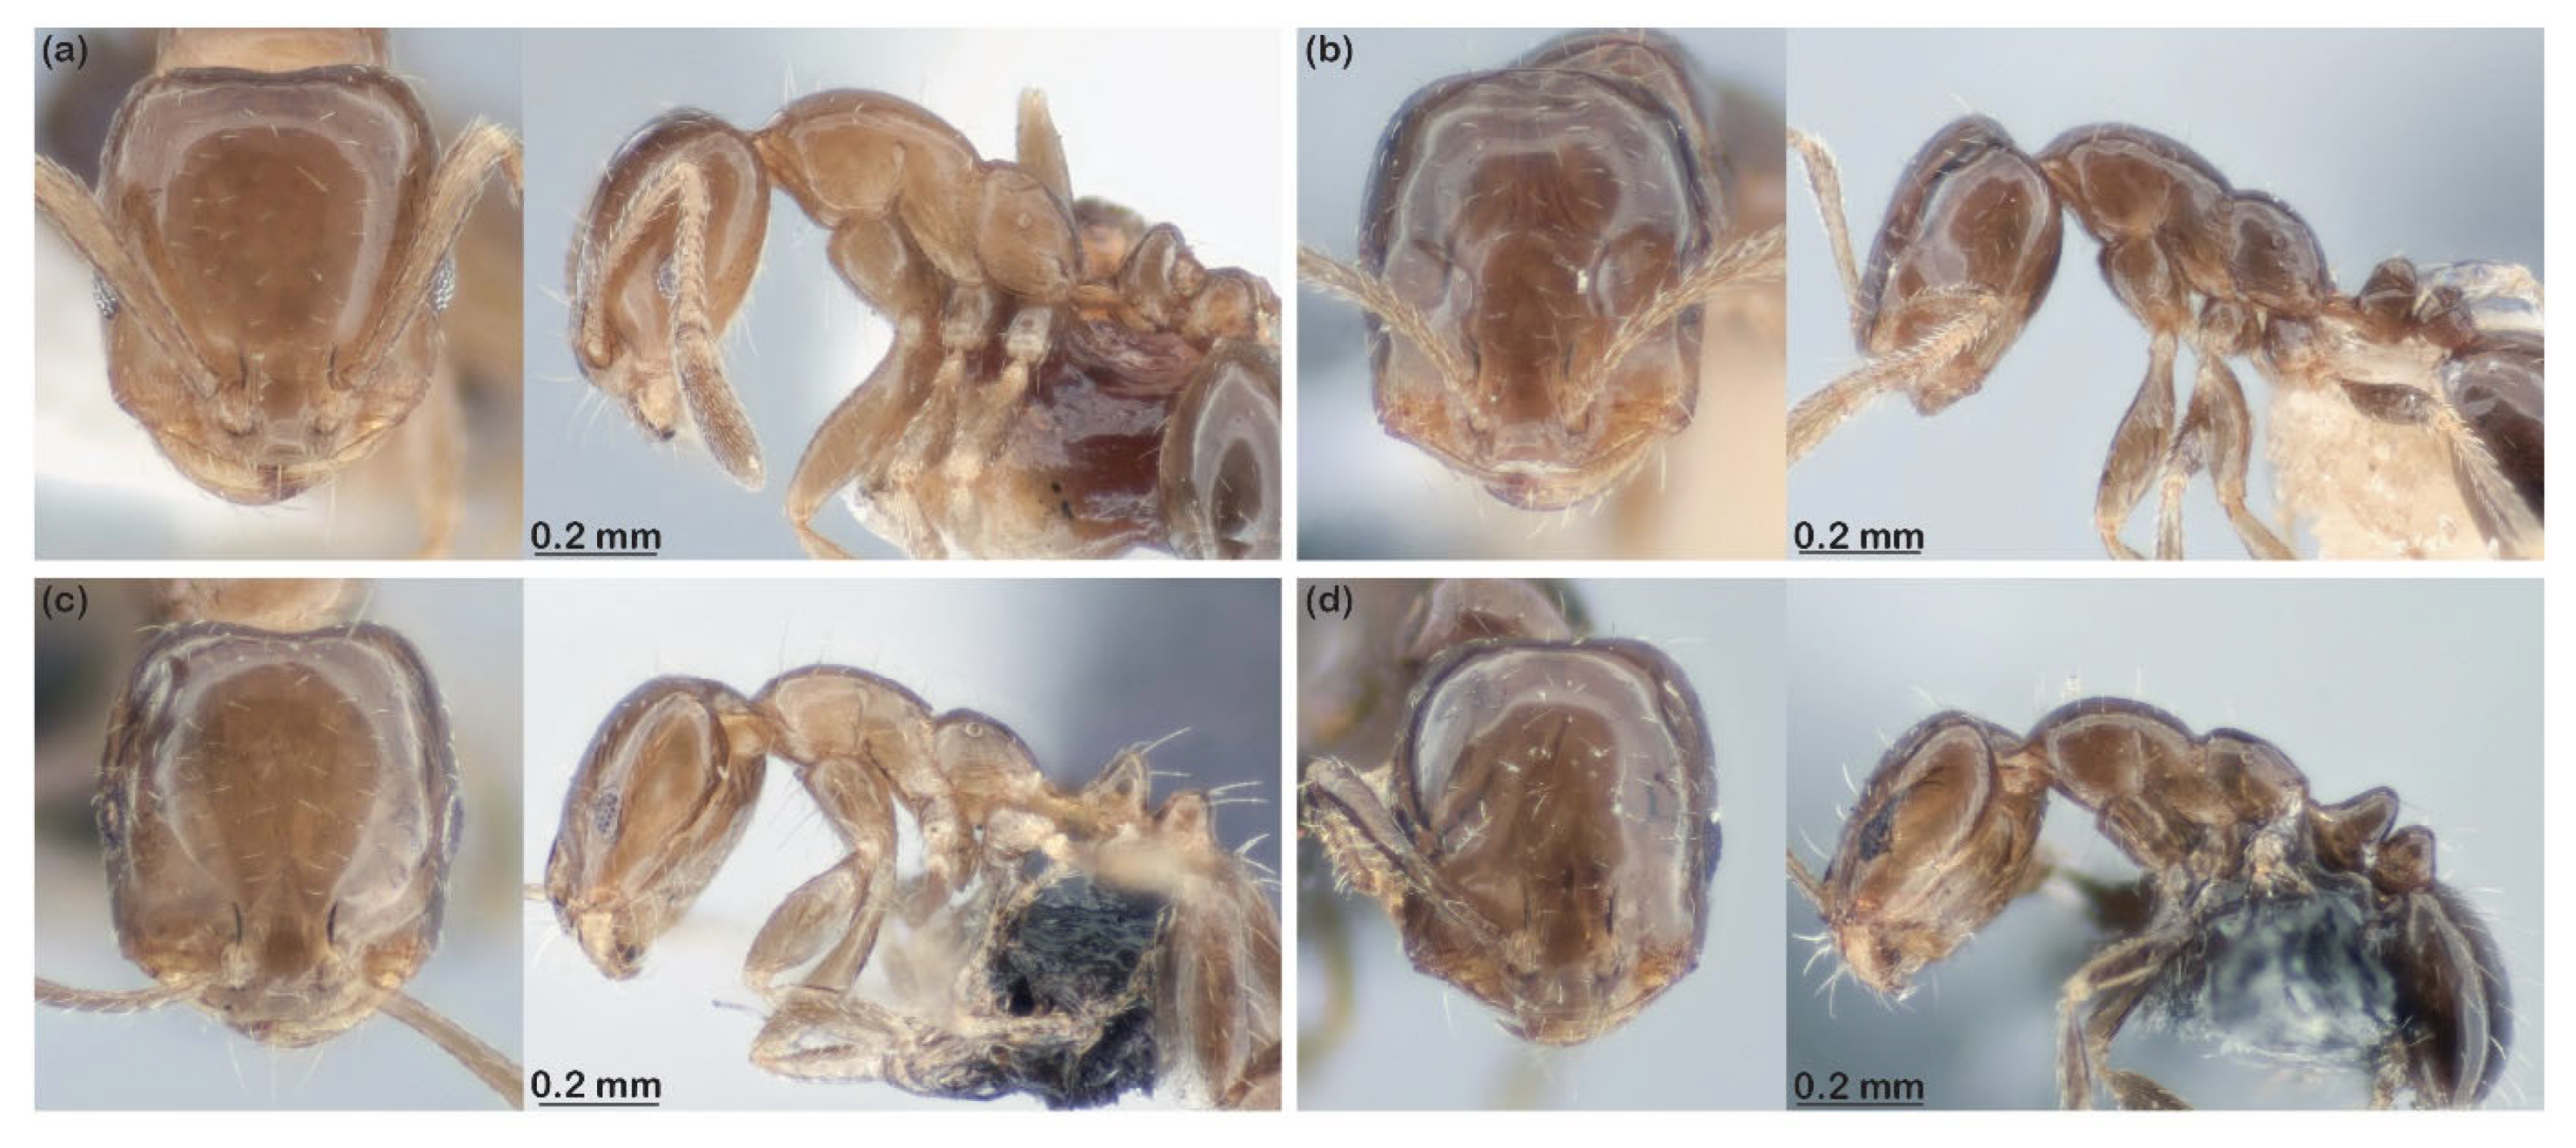
Figure 4) and sp. C1 into four (C1a–d;
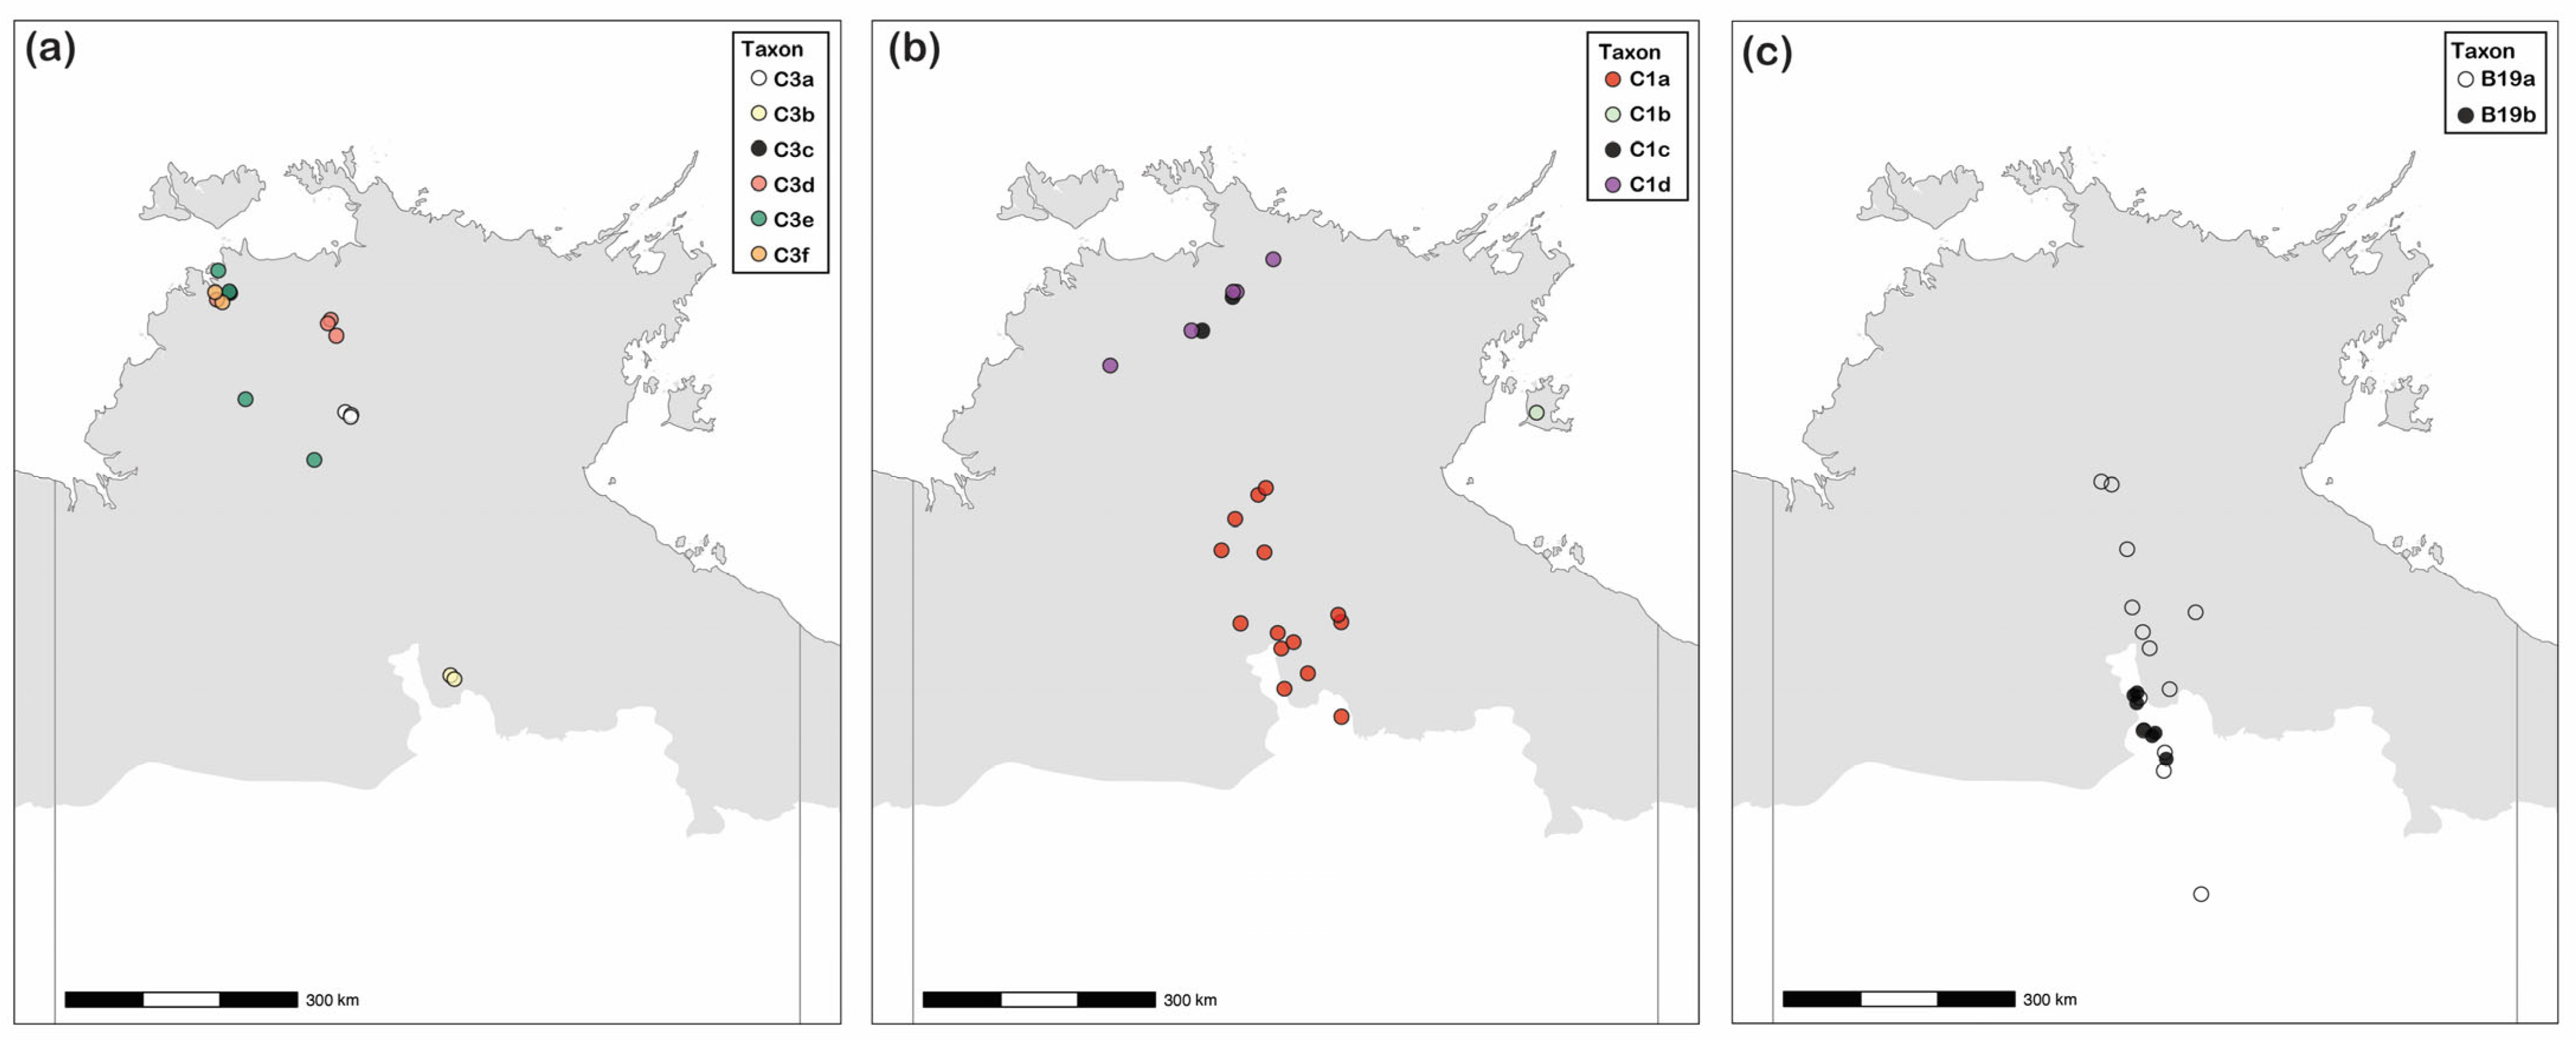
Figure 5). Geographic distribution (
Figure 6) was important in informing such splitting. For example, a sp. C3d specimen from Berry Springs (doni_334p3) is far more closely related (only 0.6% CO1 kimura distance) to sp. C3d specimens from Kakadu NP >200 km away (BOLOZ2041-24) than it is to sp. C3f specimens occurring at the same Berry Springs site, including one from the same 10 m × 10 m plot (doni_217p3; 5.4% CO1 Kimura distance) (
Figure S3 and
Figure 5c). In sp. C3d, the hairs on the antennal scapes are fully erect rather than semi-erect or appressed as in the other sp. C3 species (
Figure 4). Similarly, the sp. C3e specimen doni_5p1 from the same site is more closely related (1.3% Kimura distance) to sp. C3e specimen OZBOL6973-22 from Manbulloo Stn >300 km away than it is to the sympatric (within 1.5 km) sp. C3d doni_334p3 (6.4%) and sp. C3f specimen doni-217p3 (2.4%). Species C3b has a disjunct distribution relative to the other C3 species, being known only from the far south of the NT monsoonal tropics (
Figure 6a), despite very extensive sampling further north. Even without taking biogeography into account, both PTP and bPTP recognized nine species within sp. C3 (
Figure S3).
Within sp. ‘C1’, sp. C1d specimen BOLOZ460-24 from near Ranger Uranium Mine is considerably more closely related to sp. C1d specimen MONO210-16 from Bridge Creek >300 km away (0.6% Kimura distance) than it is to sp. C1c specimen OZBOL1377-21, also from near Ranger Uranium Mine (3.0% Kimura distance) (
Figure 6b). Species C1a has a disjunct distribution relative to the other C1 species, being known only from the southern half of the NT monsoonal tropics (
Figure 6b). PTP recognized sp. C1 as a single species, but bPTP recognized it as five, following our recognized sp. C1a-d except for splitting sp. C1c into two species (
Figure S3). Within sp. ‘C2’ (
Figure 7a,b), sp. C2b specimen BOLOZ2039-24 from Kakadu NP is considerably more closely related to sp. C2b specimen doni_428p3 (0.9% Kimura distance) from Berry Springs 250 km away than it is to sp. 2Ca specimen MONO203-16 that is also from Kakadu (2.3%). Neither PTP nor bPTP recognized this split (
Figure S3). Finally, sp. B19a (
Figure 7c) occurs throughout the central and southern AMT regions of the NT and is sympatric with sp. B19b (
Figure 7d) in the far south of this range (
Figure S2 and
Figure 6c). Both PTP and bPTP recognized this split, but inexplicably split sp. 19b into multiple species despite almost no CO1 divergence (
Figure S2).
We recognize 21 species that are additional (excluding those resulting from the splitting above) to those in [
6] among the 223 newly sequenced specimens (
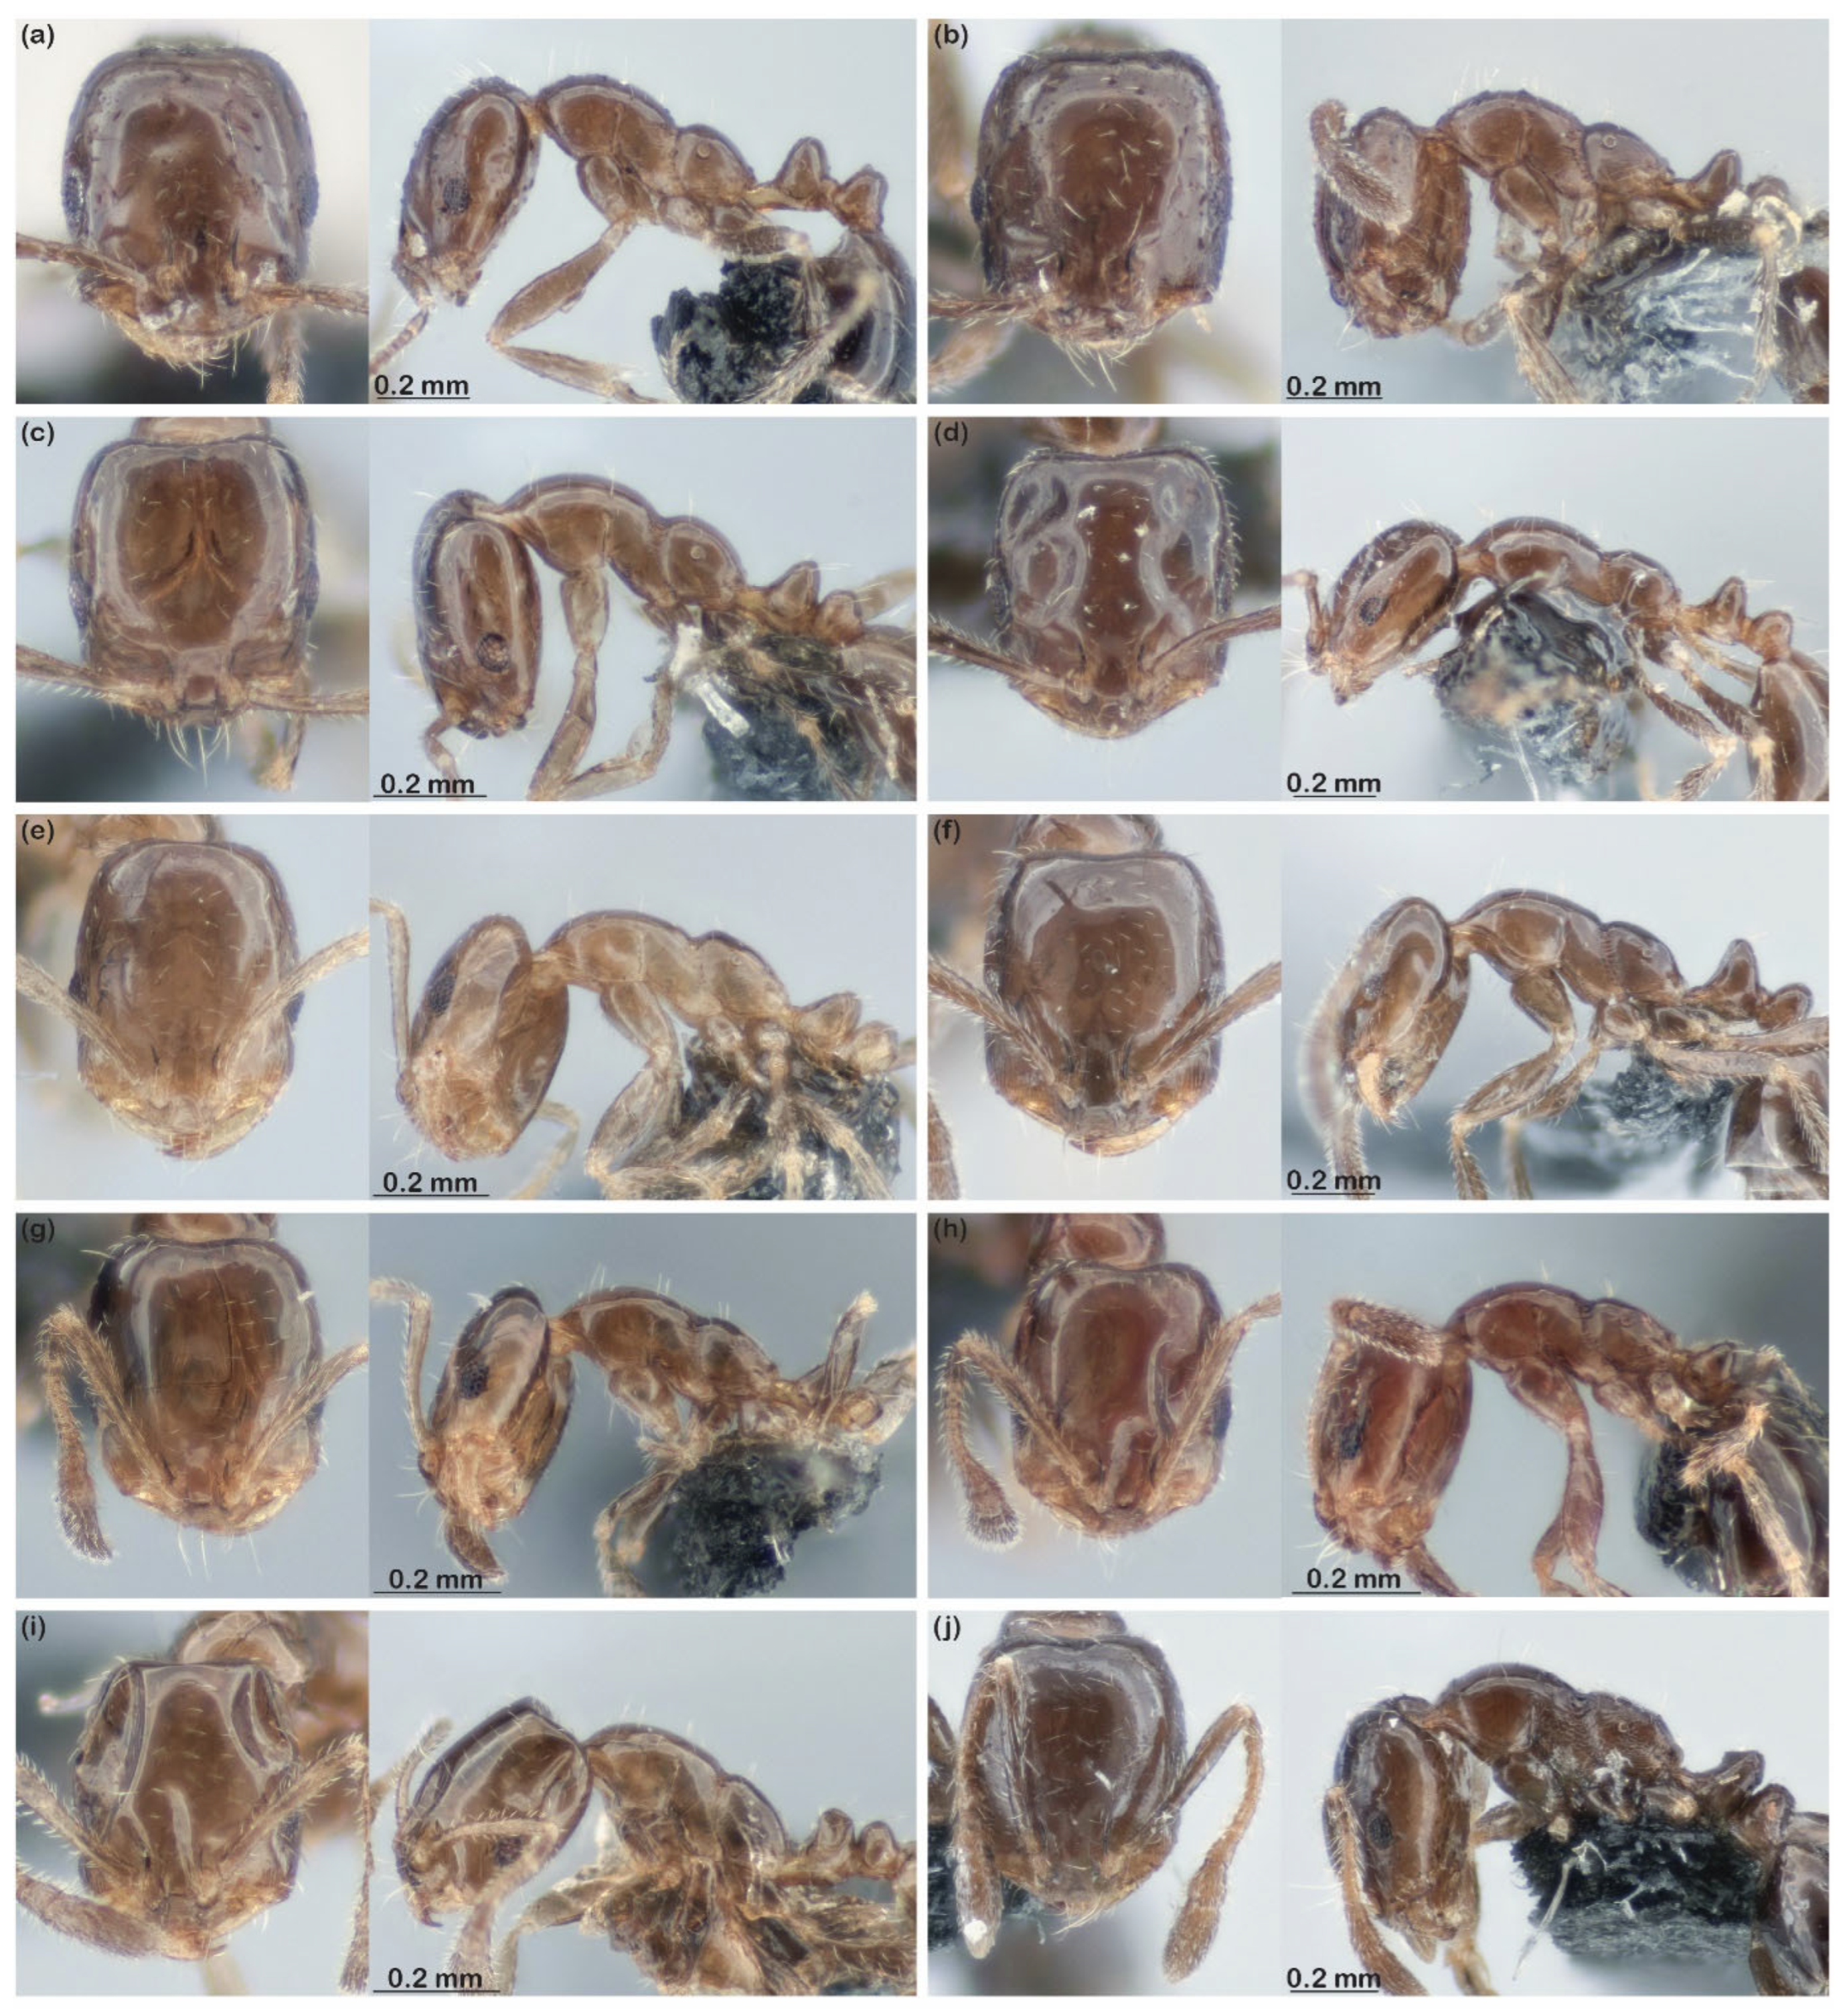
Figure 8). These include four species each from clades A (spp. A20–23;
Figure 8a,b), B (spp. B20–23;
Figure 8c,d), and H (sp. H11–14;
Figure 8g,h) (
Figure 2). They also include the new clade O, with two species, which was not recorded in [
6]. A total of 55 species were recorded from the Top End, of which 38 (69.1%) were recorded exclusively there. None of the 21 newly recorded species from the NT were recorded in either WA or Qld in [
6] (
Figure 9).
4. Discussion
Our integrated analysis recognized 85 species from within or near the NT monsoonal tropics. This figure is substantially lower than the numbers recognized by PTP (107) and especially by bPTP (136), which suggests that our species delimitations were conservative. A CO1 divergence threshold of ca. 2.5% gives 85 OTUs according to distance-based clustering.
Our 85 recognized species all fall into CO1 clades that have very strong bootstrap support, and they align very strongly with the different morphotypes recognized in [
6]. We provisionally consider the clades to represent different species complexes, as follows (numbers of recognized NT monsoonal species given):
fieldi complex (clade A; 14 species). These are medium-sized to relatively large (for the
M. nigrius group) species with long hairs on the mesosomal dorsum. The antennal scapes are relatively long (reaching the occipital margin), there is a pronounced metanotal groove, and the propodeum is typically prominently rounded (
Figure 8a,b).
sp. 50 complex (clade B; 18 species). These are rather nondescript, medium-sized species, with relatively long scapes (
Figure 8c,d).
donsithorpei complex (clade C; 12 species). These are the largest species of the group; they have long antennal scapes, but body hairs are shorter than in the
fieldi complex, and the propodeum is not prominently rounded (
Figure 4,
Figure 5 and
Figure 7).
sp. 37 complex (clade D; 4 species). These have the same morphotype as those in the
donisthorpei complex, and there is no obvious character separating them (see Figure 5c,d in [
6].
sp. 18 complex (clade E; 8 species). These have a similar morphotype to that of the sp. 50 complex (
Figure 8e,f).
Complex A (clade F; 4 species). These have the sp. 9 morphotype, characterized by short scapes and a low and broad propodeum (see Figure 9a,b in [
6]).
nigrius complex (clade G; 6 species). These have the sp. 14 morphotype, characterized by small body size, short scapes, and propodeum with a very short dorsal face (see Figure 7a in [
6]).
sp. 13 complex (clade H; 9 species). These are the smallest species, with short scapes and a highly truncated propodeum (
Figure 8g,h).
complex B (clade K; 3 species). These have the sp. 9 morphotype, but with the propodeum conspicuously sculptured (see Figure 9c,d in [
6]).
sp. 9 complex (clade L; 2 species). These are distinguished from complexes A and B, which share the sp. 9 morphotype, by the workers being somewhat polymorphic and having broad heads (see Figure 2k,l in [
6]).
complex C (clade M; 3 species). This complex has the sp. 14 morphotype as in the
M. nigrius complex (
Figure 8i).
complex D (clade O; 2 species). These species have a morphotype similar to that in the sp. 18 complex, but with longer mesosomal hairs, and the katepistermum and lateral propodeum are conspicuously sculptured (
Figure 8j).
Almost all the complexes occur throughout most, if not all, of the NT’s monsoonal tropics. The only exceptions are complexes L and M, which are known only from the Top End and contain only two and three species, respectively.
Our 85 recognized species are 32 more than those recorded in the NT monsoonal tropics in [
6], and the 55 species that we recognize here from the Top End are 21 more than the number recorded in [
6]. This is despite the newly sequenced specimens coming from broadly the same areas as those in [
6]. Given that sampling remains highly patchy (
Figure 1), the 55 species now documented from the Top End and the 85 overall from the whole of monsoonal NT are likely to be very substantial underestimates of the total sizes of the respective faunas. It seems likely that 75 or more species occur in the Top End and considerably more than 100 in the whole of monsoonal NT.
Only four of the 53 species from the NT in [
6] are known from elsewhere, and none of the 21 newly recorded species were recorded outside the NT in [
6]. Species A8 is notable in that it ranges from the Queensland Gulf region through central NT to the Northern Kimberley, with <1% CO1 divergence across this >1500 km range. Given such high rates of species turnover among the NT, Western Australia, and North Queensland (see also [
6]), our findings support the conclusion of [
6] that the total number of AMT species in the
M. nigrius group likely exceeds 200. Remarkable levels of unrecognized hyperdiversity occur in many ant species groups in the AMT, with the total number of ant species likely to be several thousand [
2]. This challenges the traditional understanding that peak ant diversity occurs in tropical rainforest biomes, especially in the Amazon [
1].