Article

Elevational Gradients as Natural Filters: Assemblage Structure and Diversity of Ambrosia beetles (Curculionidae: Scolytinae) on the Tacaná Volcano, Chiapas, Mexico


by
Mauricio Pérez-Silva
1,
Rodolfo J. Cancino-López
2,
Alba Dueñas-Cedillo
2,
Atilano Contreras-Ramos
1 and
Francisco Armendáriz-Toledano
1,*
1
Colección Nacional de Insectos, Departamento de Zoología, Instituto de Biología, Universidad Nacional Autónoma de México, Circuito Zona Deportiva S/N, C.U., Mexico City 04510, Mexico
2
Facultad de Ciencias Forestales, Universidad Autónoma de Nuevo León, Campus Linares, Linares 67700, Mexico
*
Author to whom correspondence should be addressed.
Diversity 2026, 18(4), 212; https://doi.org/10.3390/d18040212
Submission received: 26 February 2026 / Revised: 2 April 2026 / Accepted: 2 April 2026 / Published: 5 April 2026
(This article belongs to the Special Issue Diversity in 2026)

Abstract

The interaction between environmental variables influences patterns of diversity and the composition of communities along the elevational gradient. However, there is a lack of evidence regarding how these diversity patterns in Scolytinae change in response to environmental changes associated with elevation. This study aims to evaluate the influence of environmental changes along an elevational gradient on the diversity and composition of Ambrosia beetles, testing the hypothesis that species assemblages are primarily driven by the interaction between environmental variables and vegetation structure. We sampled Scolytinae at five sites (650–3360 m a.s.l.) on Tacaná Volcano from February 2018 to January 2019. Sampling was conducted using five trap types, including ethanol-baited Malaise traps and interception traps. Data were analyzed using Hill numbers for alpha diversity, Bray–Curtis indices for beta diversity, and canonical correspondence analysis to evaluate the relationship between Scolytinae species abundance and environmental variables. We recorded a high richness with 82 species, a peak in diversity at mid-elevations in mesic montane forests (p < 0.05). The Scolytinae species pool is structured in three local assemblages, corresponding to different elevational landscapes, environmentally structured. Different environmental variables displayed some correlation with species dynamics. However, these factors alone were insufficient to explain patterns of species diversity. Their influence appears to depend on interactions with site-specific characteristics. These results highlight that elevational gradients act as environmental filters structuring Scolytinae assemblages primarily through species turnover rather than nested species loss.

1. Introduction

Species distribution and diversity along elevational gradients are shaped by the interaction of multiple environmental factors, particularly temperature, humidity, precipitation, and vegetation structure [1,2,3,4]. These factors have been shown to covary along elevational gradients [5,6]. Because these variables change predictably with elevation, elevational gradients provide a useful framework for understanding how environmental filtering structures biological assemblages [7]. However, observed diversity patterns cannot be attributed to elevation alone; rather, they reflect the combined influence of climatic conditions, habitat characteristics, and landscape configuration [6,8,9,10,11,12,13].
In insect assemblages, elevational diversity generally follows two main patterns: a monotonic decrease in richness with increasing elevation or a mid-elevation peak consistent with the mid-domain effect, depending on the taxonomic group and regional context [6,14]. Changes in assemblage composition and species turnover along elevational gradients have been recognized as key to understanding spatial variation and highlight the importance of evaluating both alpha and beta diversity to fully characterize assemblage structure [15].
For ambrosia and bark beetles of the subfamily Scolytinae (Coleoptera: Curculionidae), climatic factors such as temperature, humidity, and precipitation have been consistently reported as key determinants of species richness, abundance, and distribution [16,17,18]. In Ambrosia beetles, these variables directly regulate the establishment and growth of symbiotic fungi within the galleries, which are linked to food availability, essential for their development [19]. Furthermore, higher relative humidity and higher mean temperatures determine the dispersal periods and the ability of adults to colonize new hosts, particularly in environments with high humidity [20].
Additionally, host availability and vegetation type have played a central role in shaping Scolytinae assemblages due to the close ecological association between Scolytinae and their host plants [21,22]. These patterns have varied according to feeding habits, host specificity, mating systems, and distribution. Scolytinae diversity has generally been higher in tropical ecosystems, largely driven by forest heterogeneity, which has provided greater niche availability and food resources [23]. According to Beaver (1979) [24], Ambrosia beetle species (mycetophagous) have tended to exhibit lower host specificity because they have relied on symbiotic fungi rather than directly on host tissues, whereas bark beetle species (phloeophagous) have required higher host specificity. As a result, Ambrosia beetle diversity has increased toward the tropics, while phloeophagous species have been relatively more diverse in temperate and boreal regions.
The Scolytinae have been pivotal contributors to forest ecosystems, playing a critical role in the decomposition of organic matter, soil structure development, and canopy pruning. Most species have been saprophagous and among the first insects to colonize dead, dry, decaying, or weakened trees, making them indispensable agents in maintaining ecosystem stability. Only a few species have exhibited aggressive colonization strategies, especially some northern species [16,25,26,27,28].
Despite their ecological importance and strong environmental dependence, elevational diversity patterns in Scolytinae have remained insufficiently documented, particularly across broad elevational ranges that encompass distinct vegetation communities. Dong et al. (2025) [22] have determined that species of Scolytinae diversity and richness tend to be higher at low to mid elevations and have decreased at higher elevations. However, the diversity patterns of these beetles have been complex and have depended on the simultaneous interaction of multiple geographical and environmental factors that have often been correlated with elevation [29].
Mountains are considered excellent natural systems for investigating how environmental gradients and landscape heterogeneity shape insect assemblage structure [5,30]. The integration of climatic variables, vegetation composition, and elevation allows assessment of their relative contribution to assemblage structure, because elevation alone provides only a partial explanation for the structure of assemblages along elevational gradients [31].
Elevational gradients were strongly correlated with environmental factors such as temperature, precipitation, humidity, vegetation structure, and land use, making it difficult to isolate their individual effects. Therefore, rather than altitude alone, we expected Scolytinae diversity patterns to be shaped by the combined influence of these variables. In this study, we analyzed Scolytinae diversity along a broad elevational gradient (650–3360 m) on the Tacaná Volcano. Specifically, we aimed to (1) determine the composition and structure of Scolytinae assemblages and their relationship with environmental variables across elevational levels; (2) evaluate patterns of alpha and beta diversity along the gradient; and (3) assess whether distinct vegetation communities and elevational zones structure discrete Scolytinae assemblages.

2. Materials and Methods

2.1. Study Area

The present study was carried out on the Tacaná Volcano, located in the Mexican southeast, to the east of the Sierra Madre de Chiapas. It covers the municipalities of Tapachula, Cacahoatán, and Unión Juárez and reaches the department of San Marcos in Guatemala. It reaches an elevation of 4092 m and has an area of 300 km2. The Tacaná Volcano, based on its high biological diversity and ecological fragility, was decreed as a Biosphere Reserve on 28 January 2003 [30,32].
Taking into account the Köppen climate classification modified by García (2004) [33], the predominant climate in the region is temperate humid with abundant rains in summer (C(m)(w)ig), semi-warm humid with abundant rains in summer (A(c)m(w)ig), and warm humid with abundant rains in summer (Am(w)ig). Rainfall is recorded with an annual average of 4438 mm. The relative humidity during the rainy season exceeds 90 percent, while in the dry season it does not drop below 50 percent. It presents a great variety of vegetation types, but the mesic montane forest predominates with 46 percent of the surface, the evergreen tropical forest with 27 percent of the surface, and the pine forest with eight percent. Approximately 13 percent of the surface has been occupied by agricultural activities, including coffee plantations, since coffee is one of the most important products of the state of Chiapas [32].
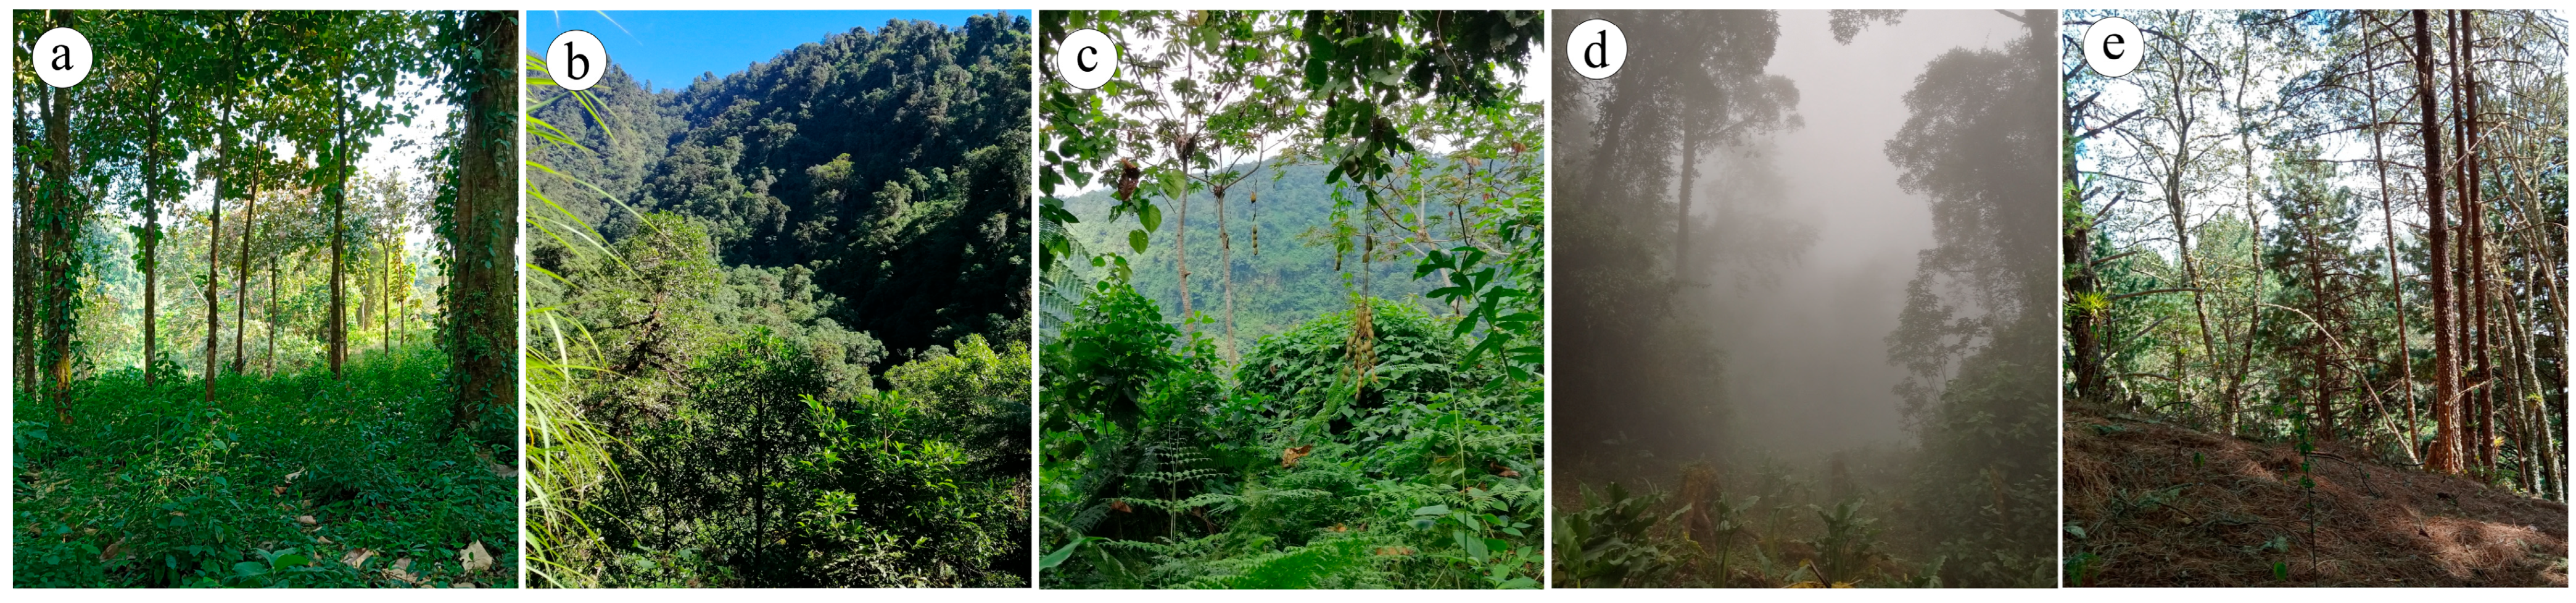
On the south–southwest slope of the Tacaná Volcano, five collection sites were established, showcasing contrasting ecological variations across landscapes shaped by distinct vegetation communities and elevational zones, in an elevational range from 650 to 3360 m. Three sites were in the municipality of Cacahoatán: S1 (650 to 810 m, 15°02′29.22″ N, 92°10′13.14″ W), Finca Alianza, in fragments dominated by evergreen tropical forest and with evident anthropogenic impact associated with coffee plantations; S2 (1050 to 1390 m, 15°05′33.24″ N, 92°10′50.64″ W), Ejido El Águila, with vegetation dominated by mesic montane forest and coffee plantations; and S3 (1400 to 1770 m, 15°05′27.18″ N, 92°08′51.06″ W), Ejido Benito Juárez El Plan, dominated by mesic montane forest. The other two sites were in the Unión Juárez municipality: S4 (2000 to 2470 m, 15°05′43.74″ N, 92°05′57.6″ W), Cantón Chiquihuites, with a combination of oak forest and mesic montane forest; and S5 (2800 to 3360 m, 15°06′56.46″ N, 92°05′54.72″ W), Parador Papales and Parador La Cabaña, where oak–pine forest and pine forest predominate (Figure 1).

2.2. Sampling Method

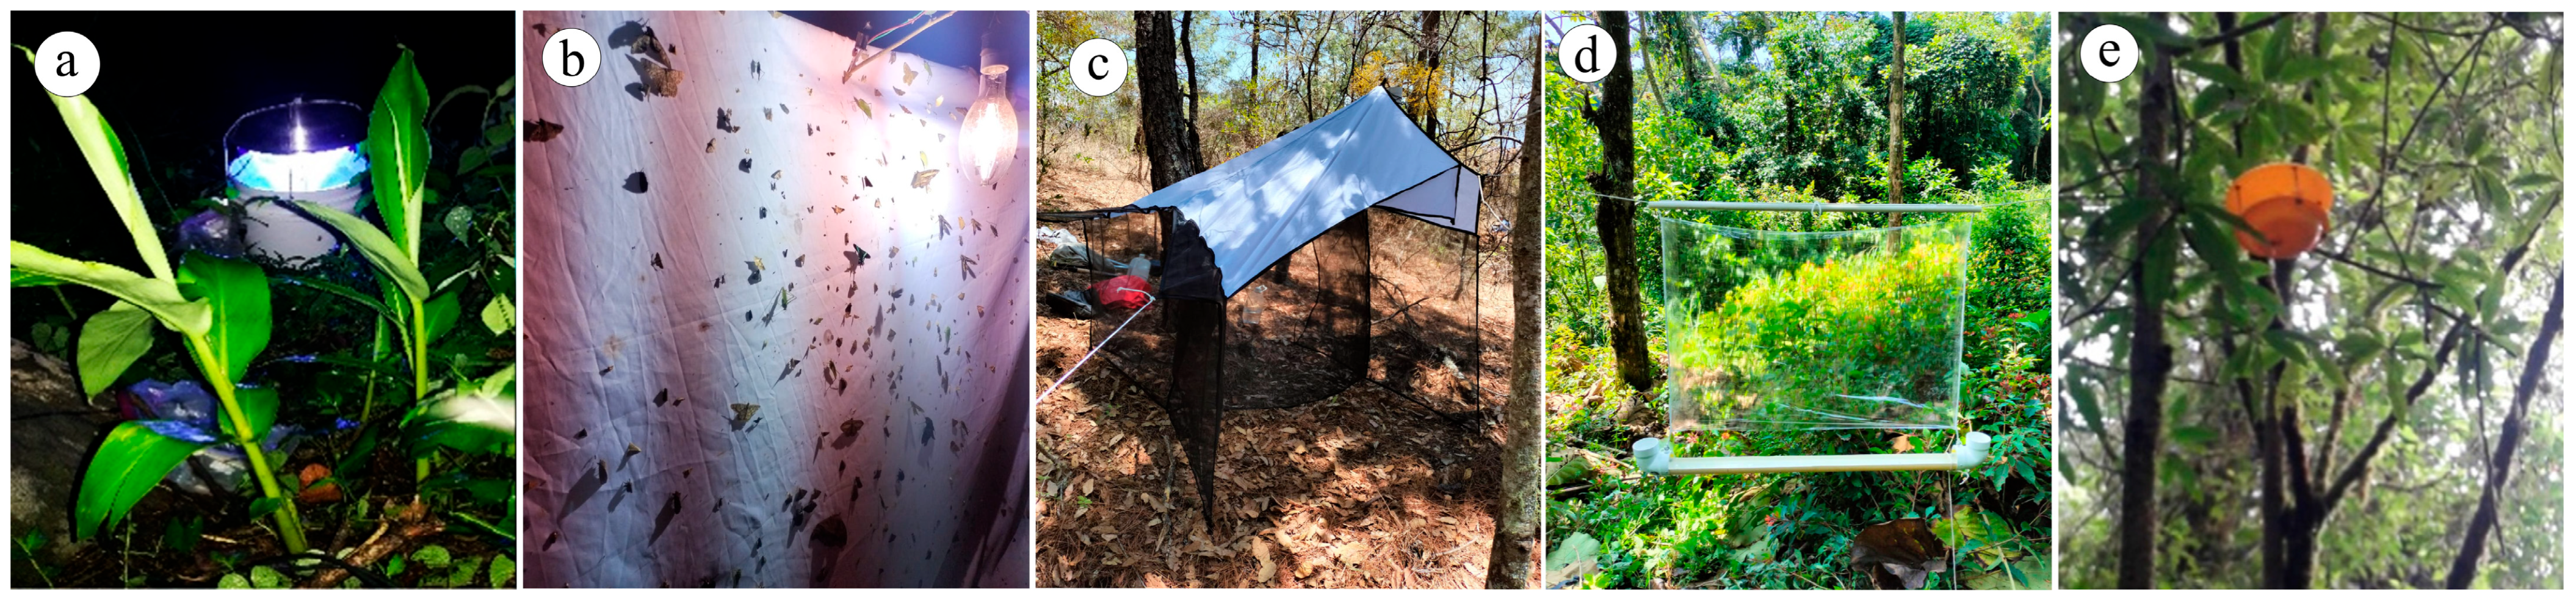
In each collection site, 14 traps of five different types were placed: one black light trap adapted to a bucket at ground level, two black and white light screen traps, two malaise traps, five screen-type interception traps placed at ground level, and four yellow-plate traps placed in the canopy. With the exception of light traps, all traps were baited with a 70% ethanol (v/v) solution prepared with ethanol and distilled water, which served as a killing and preservative agent for the captured arthropods (Figure 2). Sampling stations were separated by approximately 500 m to ensure spatial independence among samples and to reduce potential spatial autocorrelation. Different trap types were used to maximize sampling completeness, as Scolytinae species exhibit different flight behaviors, vertical stratification, and attraction to light or ethanol-baited traps. The collections were conducted for one year, with monthly sampling from February 2018 to January 2019. At each site, all traps were set for two and a half days, except for the malaise traps, which were left at the collection sites throughout the year, and material was collected only once a month. The environmental variables—temperature, humidity, and dew point—were measured at each site during the sampling period using HOBO data loggers.

2.3. Insect Identification

Scolytinae specimens were identified using taxonomic keys by Wood (1982, 2007) [25,34] at the genus and species level, and Xyleborini members were identified using keys by Pérez et al. (2021) [35]. Descriptions by Atkinson (2020) were also referenced for reviewing features of the genus Corthylus [36]. As complementary support, the bark and Ambrosia beetles website was consulted [37]. When species identification was not possible, specimens were classified as morphospecies at the genus level.

2.4. Data Analysis

2.4.1. Richness, Structure, and Species Composition

The abundance and richness of Scolytinae species were assessed for the entire volcano and for each individual site. The effect of elevation on the abundance of Scolytinae was evaluated by a Kruskal–Wallis test, once the test hypotheses had been verified: independence of observations, normality, and homoscedasticity [38]. The Dunn test was used to determine the differences between the sites, using the PAST program ver. 4.03 [39]. An abundance range curve was constructed using the relative frequencies of the five most abundant species per site. Species abundance data from each sample were used to calculate Chao 1 and ACE (Abundance Coverage Estimator) values using EstimateS v9.1.0 software [40]. To assess sampling efficiency, species accumulation curves were constructed based on the collection time.
The relationship between environmental variables and richness and abundance was assessed using Pearson linear correlations once the outliers were eliminated [38]. The environmental variables considered were temperature, dew point, and relative humidity, while the biological response variables were species richness and abundance. To quantify the influence of each of seven environmental variables (A-RH: average relative humidity, Min-RH: minimum relative humidity, Mx-RH: maximum relative humidity, A-Temp: average temperature, Min-Temp: minimum temperature, Mx-Temp: maximum temperature, and DP: dew point) on the occurrence of Scolytinae species, a Canonical Correspondence Analysis (CCA) was performed. Only species with more than 10 individuals collected were included (17 species). Species abundance was transformed using ln(x + 1).

2.4.2. Alpha and Beta Diversity of Scolytinae

Alpha diversity was estimated using Hill’s numbers, or the effective number of species [41], which include diversity of order 0, representing species richness or the observed number of species; diversity of order 1, representing the number of common species and the typical diversity value this order corresponds to the exponential of the Shannon-Wiener diversity index:
D 1 = e H
where H′ is the Shannon diversity index. This metric represents the effective number of common species in the community (same abundance). And diversity of order 2, reflecting the dominance of the most abundant species, this order corresponds to the inverse of the Simpson diversity index:
D 2 = 1 i = 1 S p i 2
s is the proportional abundance of species i. This metric represents the effective number of dominant species in the community, giving greater weight to the most abundant species. The diversity of the three orders, both at a general level and by site, was estimated using the online software iNEXT (https://chao.shinyapps.io/iNEXTOnline/ (accessed on 25 February 2026)) [42], with 50 bootstraps and a 95% confidence interval.
Beta diversity on the volcano was evaluated using the Bray–Curtis dissimilarity index (βBC) and analyzed through its two components: dissimilarity due to balance-variation (βBC.BAL, i.e., substitution) and dissimilarity due to abundance-gradients (βBC.GRA, i.e., subsets) under the multiple-site approach [43]. Additionally, using the pair-wise approach, beta diversity between consecutive sites was assessed along the elevation gradient (βBC = βBC.BAL + βBC.GRA), calculating the relative contribution of each component (in percentages) based on species abundance:
B C i j = | x i k x j k | ( x i k + x j k )
where xik and xjk represent the abundance of species k in sites i and j, respectively. Values range from 0 (identical communities) to 1 (completely different communities). All beta diversity analyses were conducted using the Betapart v.13 package in R Version 2023.06.1+524 [44].

2.4.3. Scolytinae Species Assemblages

To assess whether the structure and composition of the Scolytinae communities at each site support a spatial structure according to the elevational gradient, that is, whether sites located at similar elevations had communities that were more similar in species composition than those located at more distant elevations, Principal Coordinate Analyses (PCoA) were performed on the abundance and presence–absence matrices per site, respectively. In both analyses, the sites were used as operational taxonomic units (OTUs), with species serving as attributes. A Bray–Curtis’s similarity matrix was estimated and used for the structure analysis, while the Jaccard index was selected for the composition analysis:
J ( A B ) = a a + b + c
where a represents the number of species present in both site A and site B (shared species), b the number of species present in site A but absent from site B, and c the number of species present in site B but absent from site A. These analyses were performed with PAST software ver. 4.03 [39].
To evaluate whether local communities can be recognized along the gradient from the entire species pool found on the volcano, a two-way clustering analysis was conducted using the absence–presence matrix of the five sites. A distance matrix was estimated with the Jaccard index, and a dendrogram was created using the simple clustering method. For both dendrograms (among sites and species), branch support was calculated independently using a bootstrap of 1000 pseudo-replicates and the co-phenetic correlation index. The topology of these trees was used to define the boundaries and members of the local communities, as well as to identify exclusive and shared species among them. The richness of local communities was represented using Venn diagrams. These analyses were performed with PAST software ver. 4.03 [39].
To assess if the elevational gradient reflects an environmental structure that could be related to the patterns of the Scolytinae assemblages, basic descriptive statistics were calculated for each environmental variable (temperature, relative humidity, and dew point). The normality of the distribution was tested using the Shapiro–Wilk test [45]. Variability between sites was represented using box plots, while differences between sites for each variable were evaluated with ANOVA tests [38]. Once the linearity of the data and the correlation between measured variables had been verified [38], a Principal Component Analysis (PCA) was conducted to identify if the assemblages are related to the environmental structure along the elevational gradient.

3. Results

3.1. Richness, Structure, and Species Composition

A total of 2995 Scolytinae specimens were collected, representing nine tribes, 26 genera, and 82 species (45 identified species and 37 morphospecies). Corthylini (58 species; 2016 individuals) and Xyleborini (13 species; 954 individuals) dominated the assemblage, accounting for nearly 80% of total richness and 98% of abundance. Four species—Corthylus panamensis, Xyleborus affinis, Corthylus comatus, and Gnathotrichus consentaneus—comprised 75% of all individuals. Twenty-eight species were singletons (Table 1).
Abundance differed significantly among sites (Kruskal–Wallis, F4,54 = 3.75, p < 0.01), with the highest values at the lowest elevation (S1) and the lowest at the highest elevation (S5). In contrast, species richness peaked at the intermediate site (S3), which exhibited the highest richness but comparatively low abundance. Thus, abundance declined with elevation, whereas richness followed a unimodal pattern (Table 1).
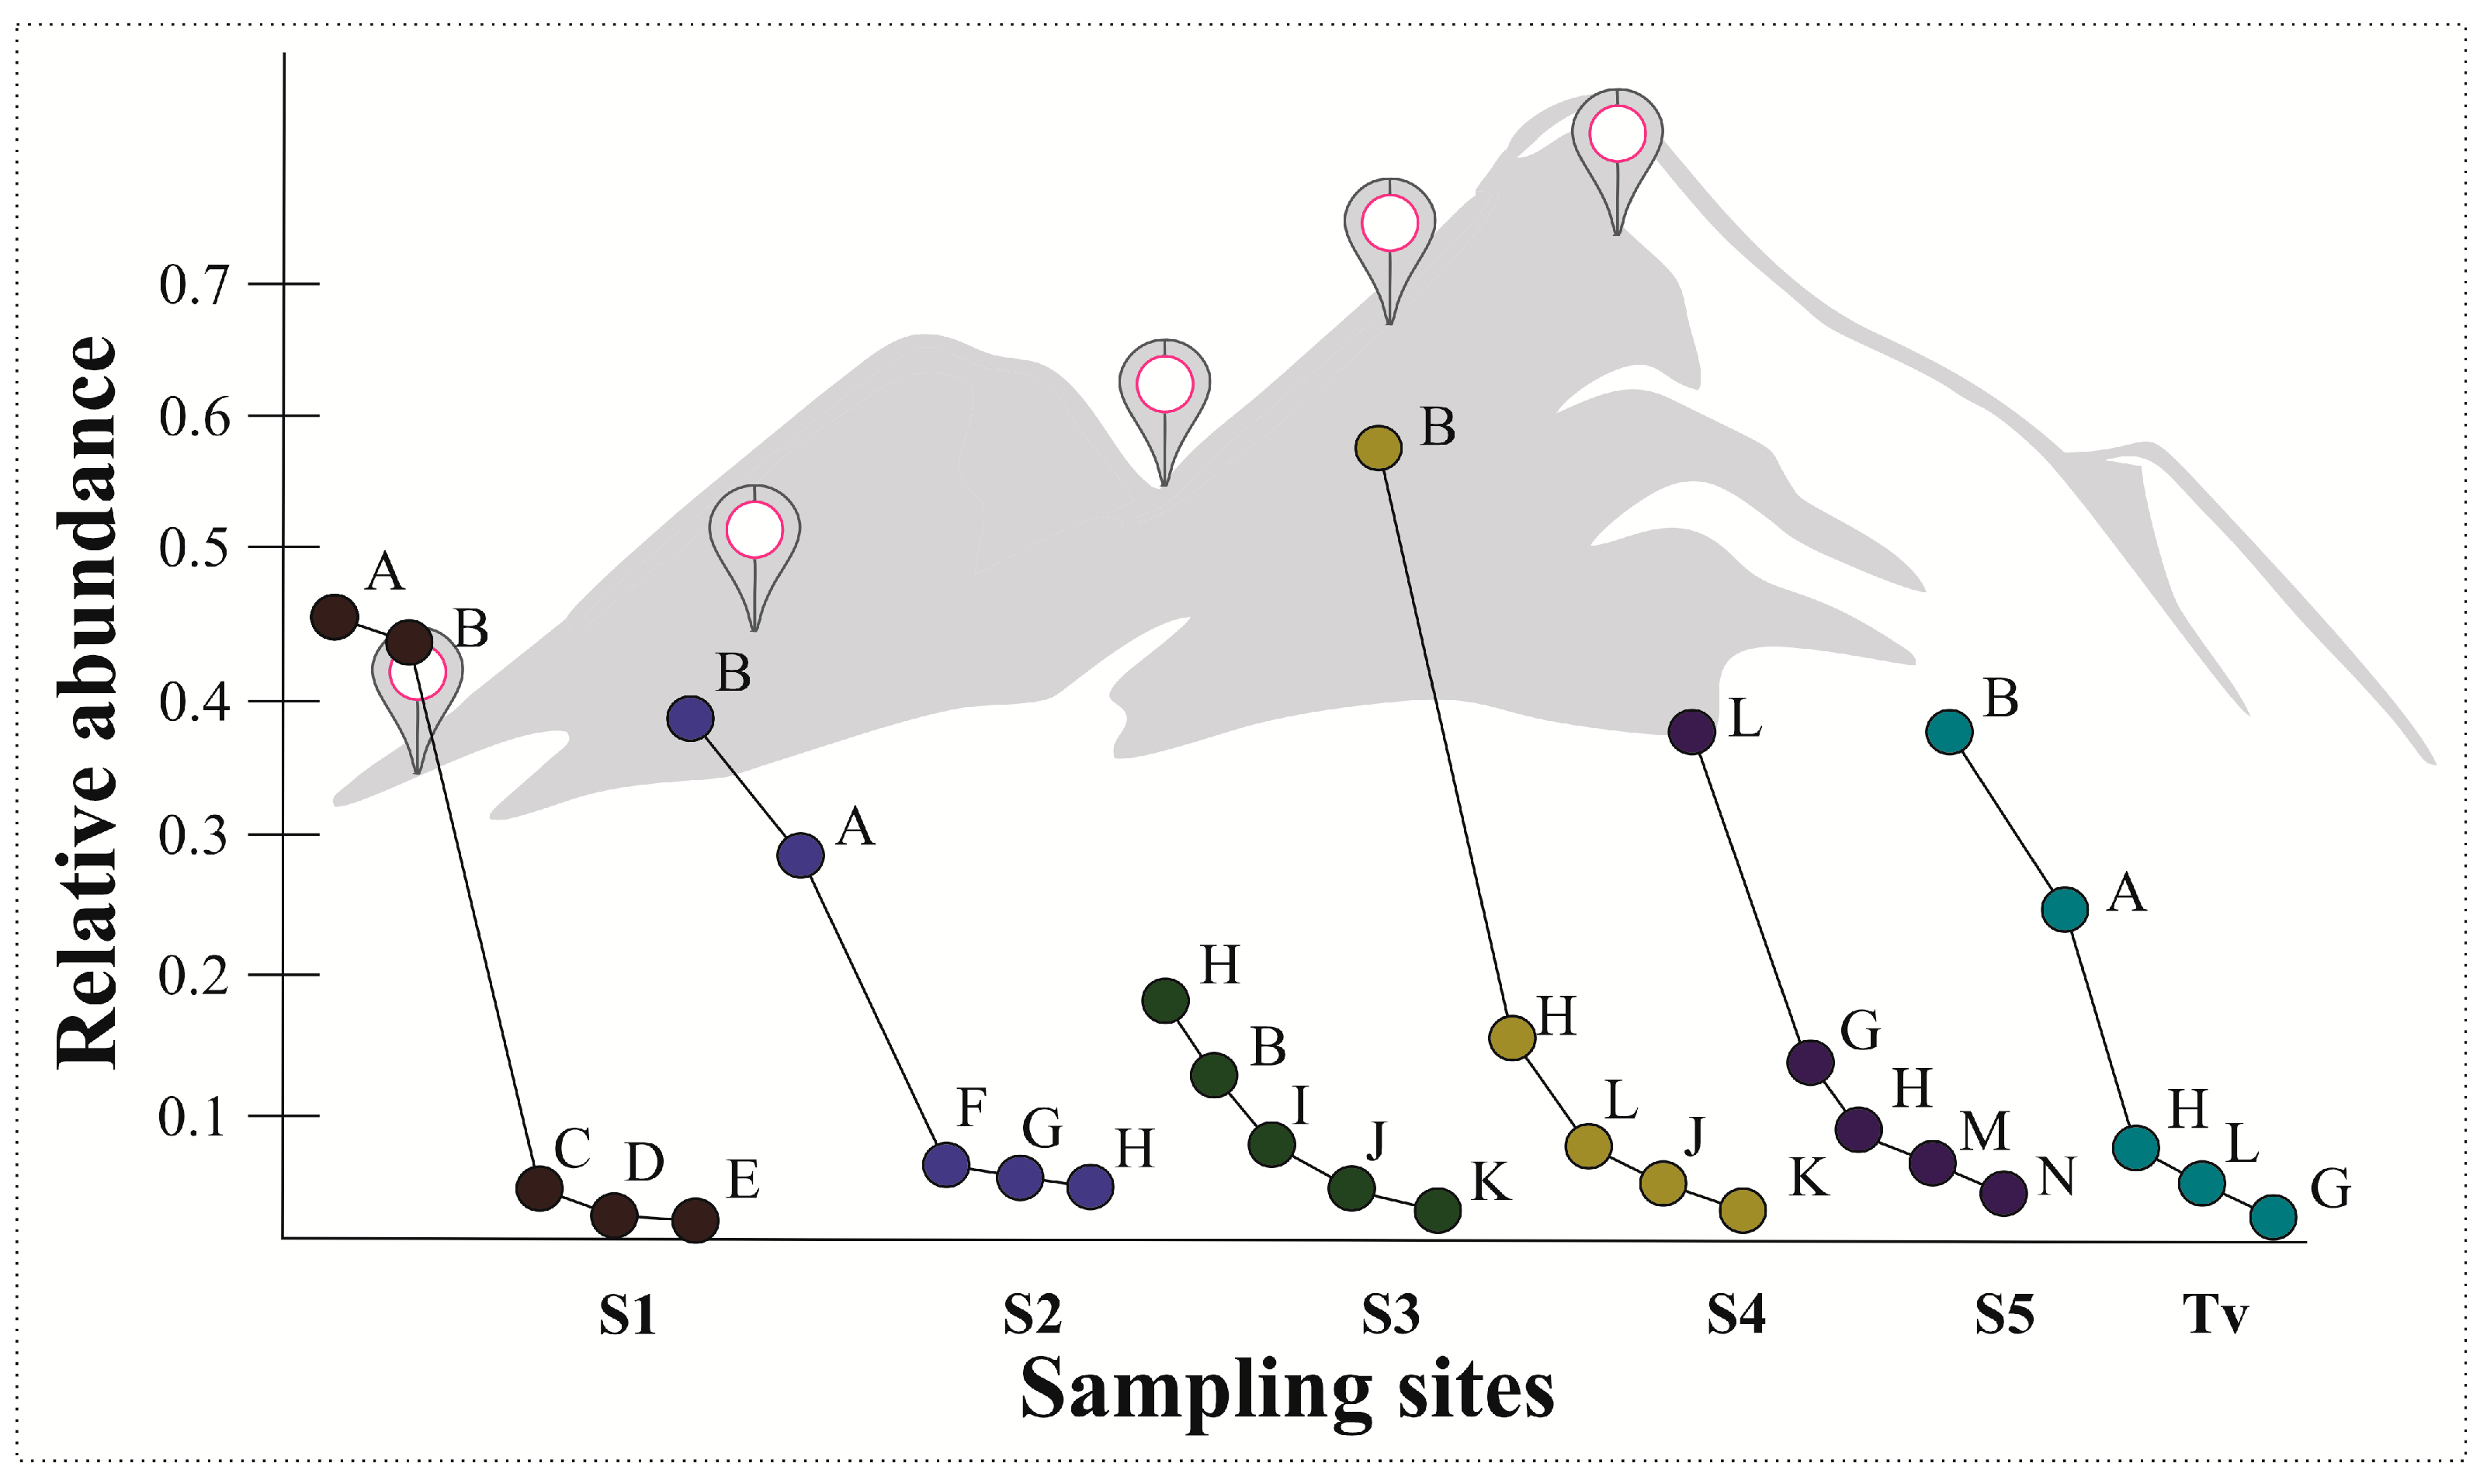
The patterns of species dominance exhibited significant variation among the sites, as evidenced by the distinct distribution of the relative abundance of the most common species (Figure 3). Species composition varied markedly along the gradient, with most species restricted to one or two sites and only a few broadly distributed. A high proportion of species (41) occurred at a single site, indicating strong spatial turnover. Dominance patterns within sites are illustrated in Figure 3, which emphasizes within-site structure rather than direct comparisons among sites. Only C. panamensis and C. comatus were found with high abundance at all sites; they were abundant at sites S2, S3, and S4. They were surpassed only by X. affinis at site S1 and by G. consentaneus and Glochinocerus gemellus (Blandford) at site S5.
The Ambrosia beetles were the most abundant, with 65 species and 2952 specimens. The bark beetles constituted the second most dominant, comprising 10 species. Two myelophagous, three spermatophagous, one herbiphagous, and one xylophagous were also recorded (Table 1). While phloeophagous species were collected only at the three highest sites, Ambrosia beetle species were collected at all sites; however, Corthylini genera dominated at the higher sites and Xyleborini genera at the lower sites (Figure 3).
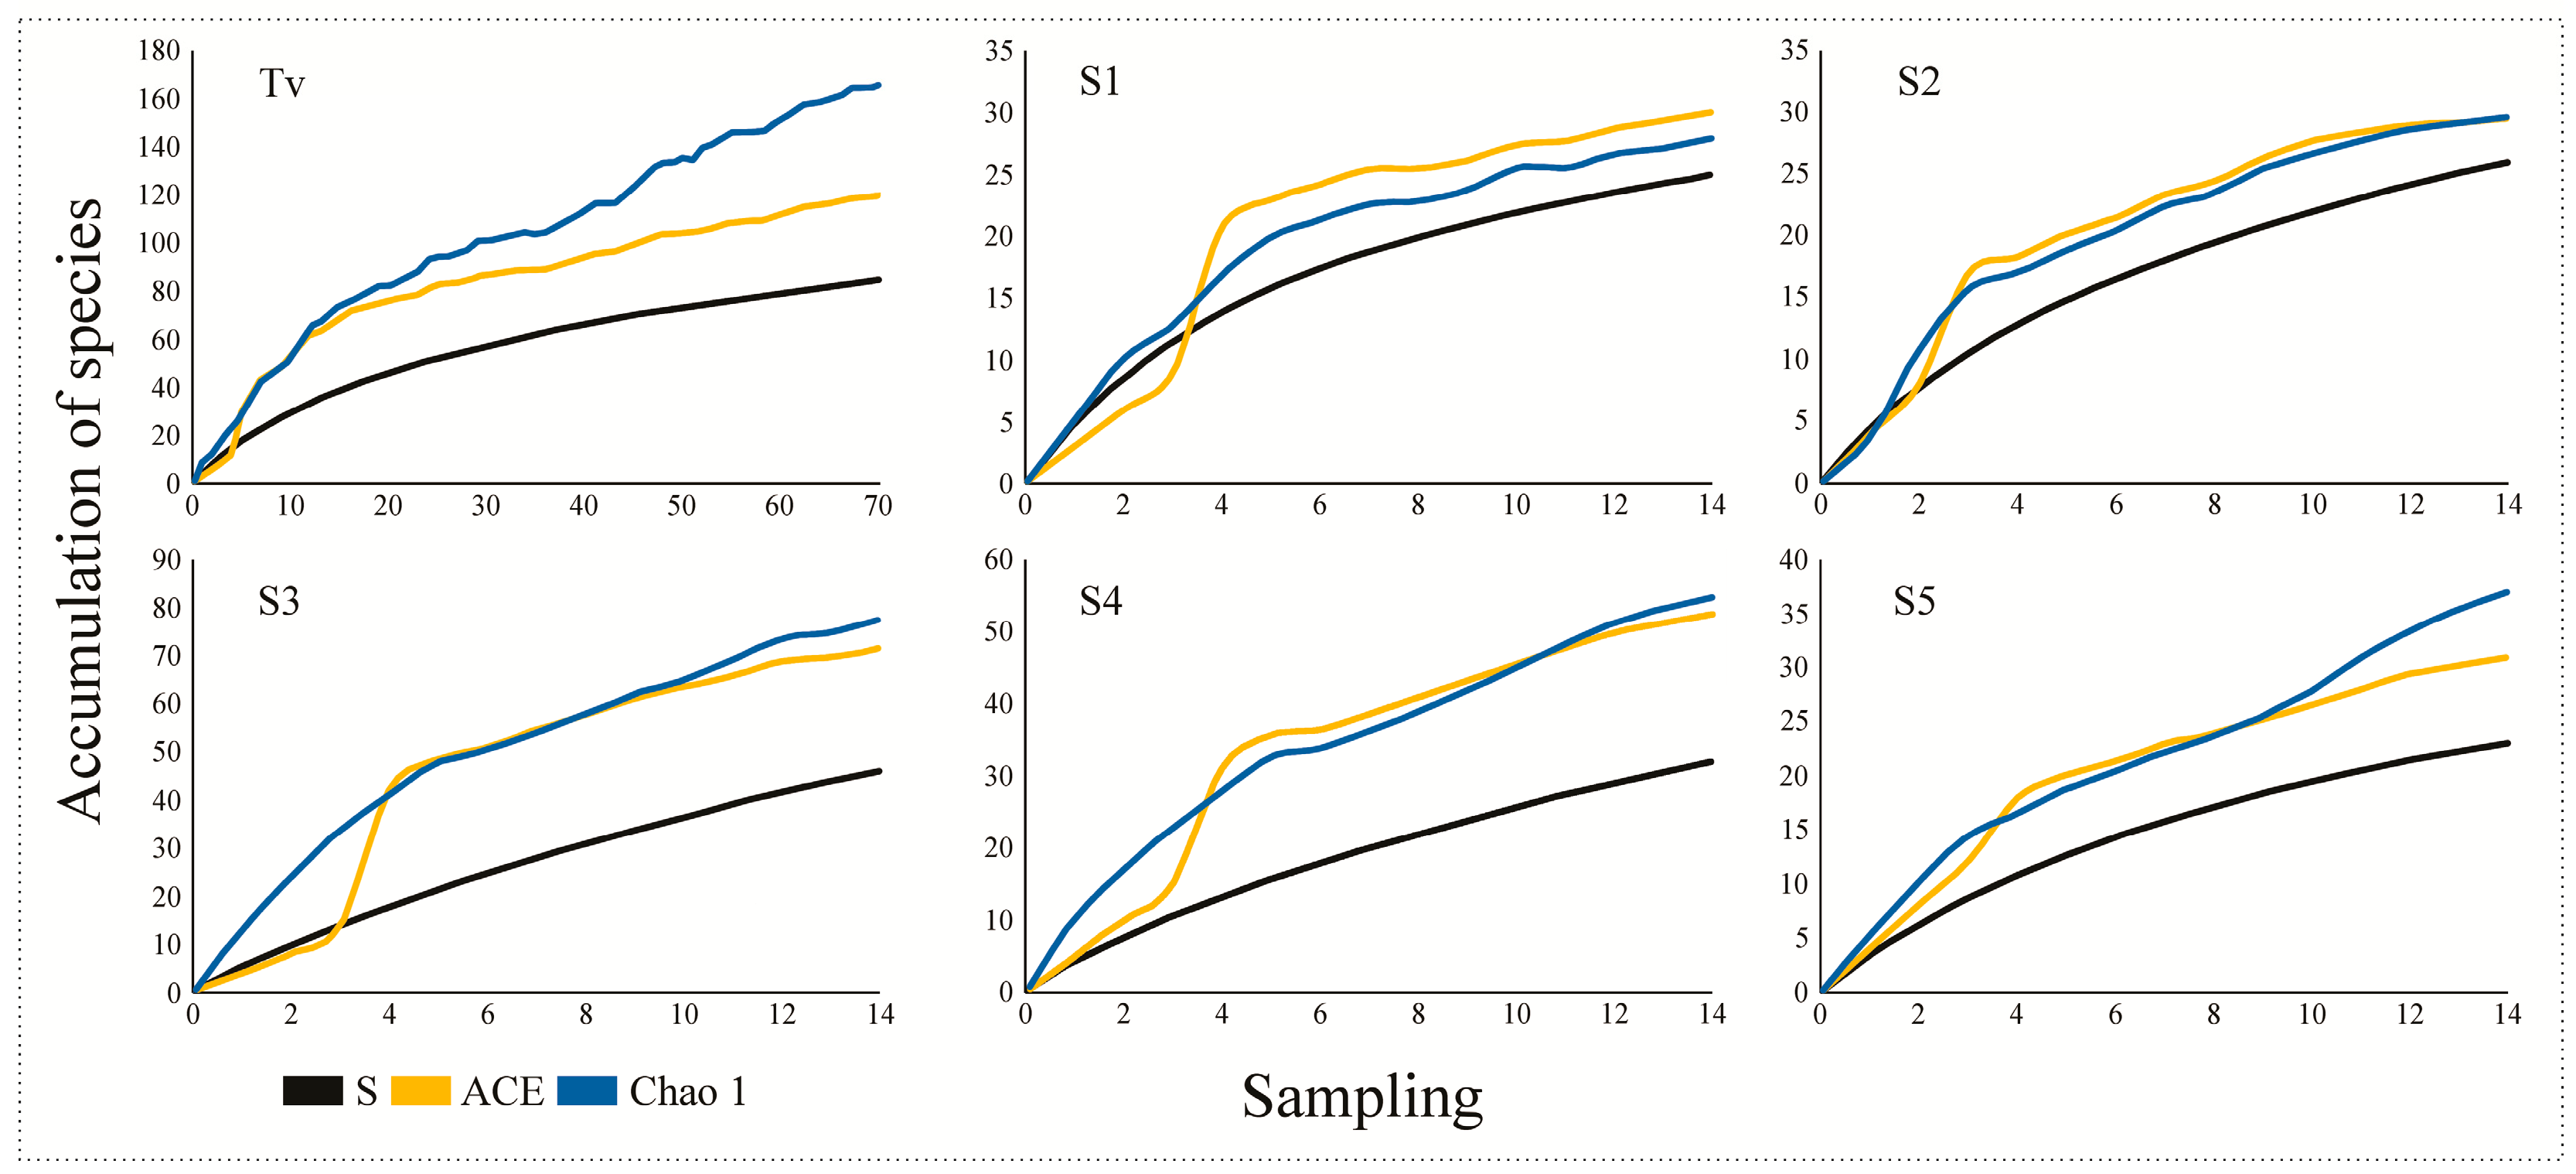
Richness estimators suggested incomplete sampling, particularly at intermediate and high elevations. ACE estimated 120 species, whereas Chao 1 estimated 166 species, indicating that observed richness represents a partial fraction of the total species pool. The sampling efficiency at S2 showed a completeness of 89%, with 25 out of the 29 estimated species collected. The lowest site (S1) followed with 83%, while the highest site (S5) had the lowest completeness at 74%. However, the results show that only 64.7% of the estimated species were obtained in S3 and 61.5% in S4, indicating a continuous accumulation of species. The Chao 1 values were like those of ACE in almost all cases but slightly higher in S3 (Figure 4).
In relation to environmental variables, the abundance of Scolytinae was positively correlated with temperature (r = 0.30, p < 0.05) and dew point (r = 0.40, p < 0.005) and was negatively correlated with relative humidity (r = −0.30, p < 0.05), while richness was not correlated with any of the environmental variables analyzed.
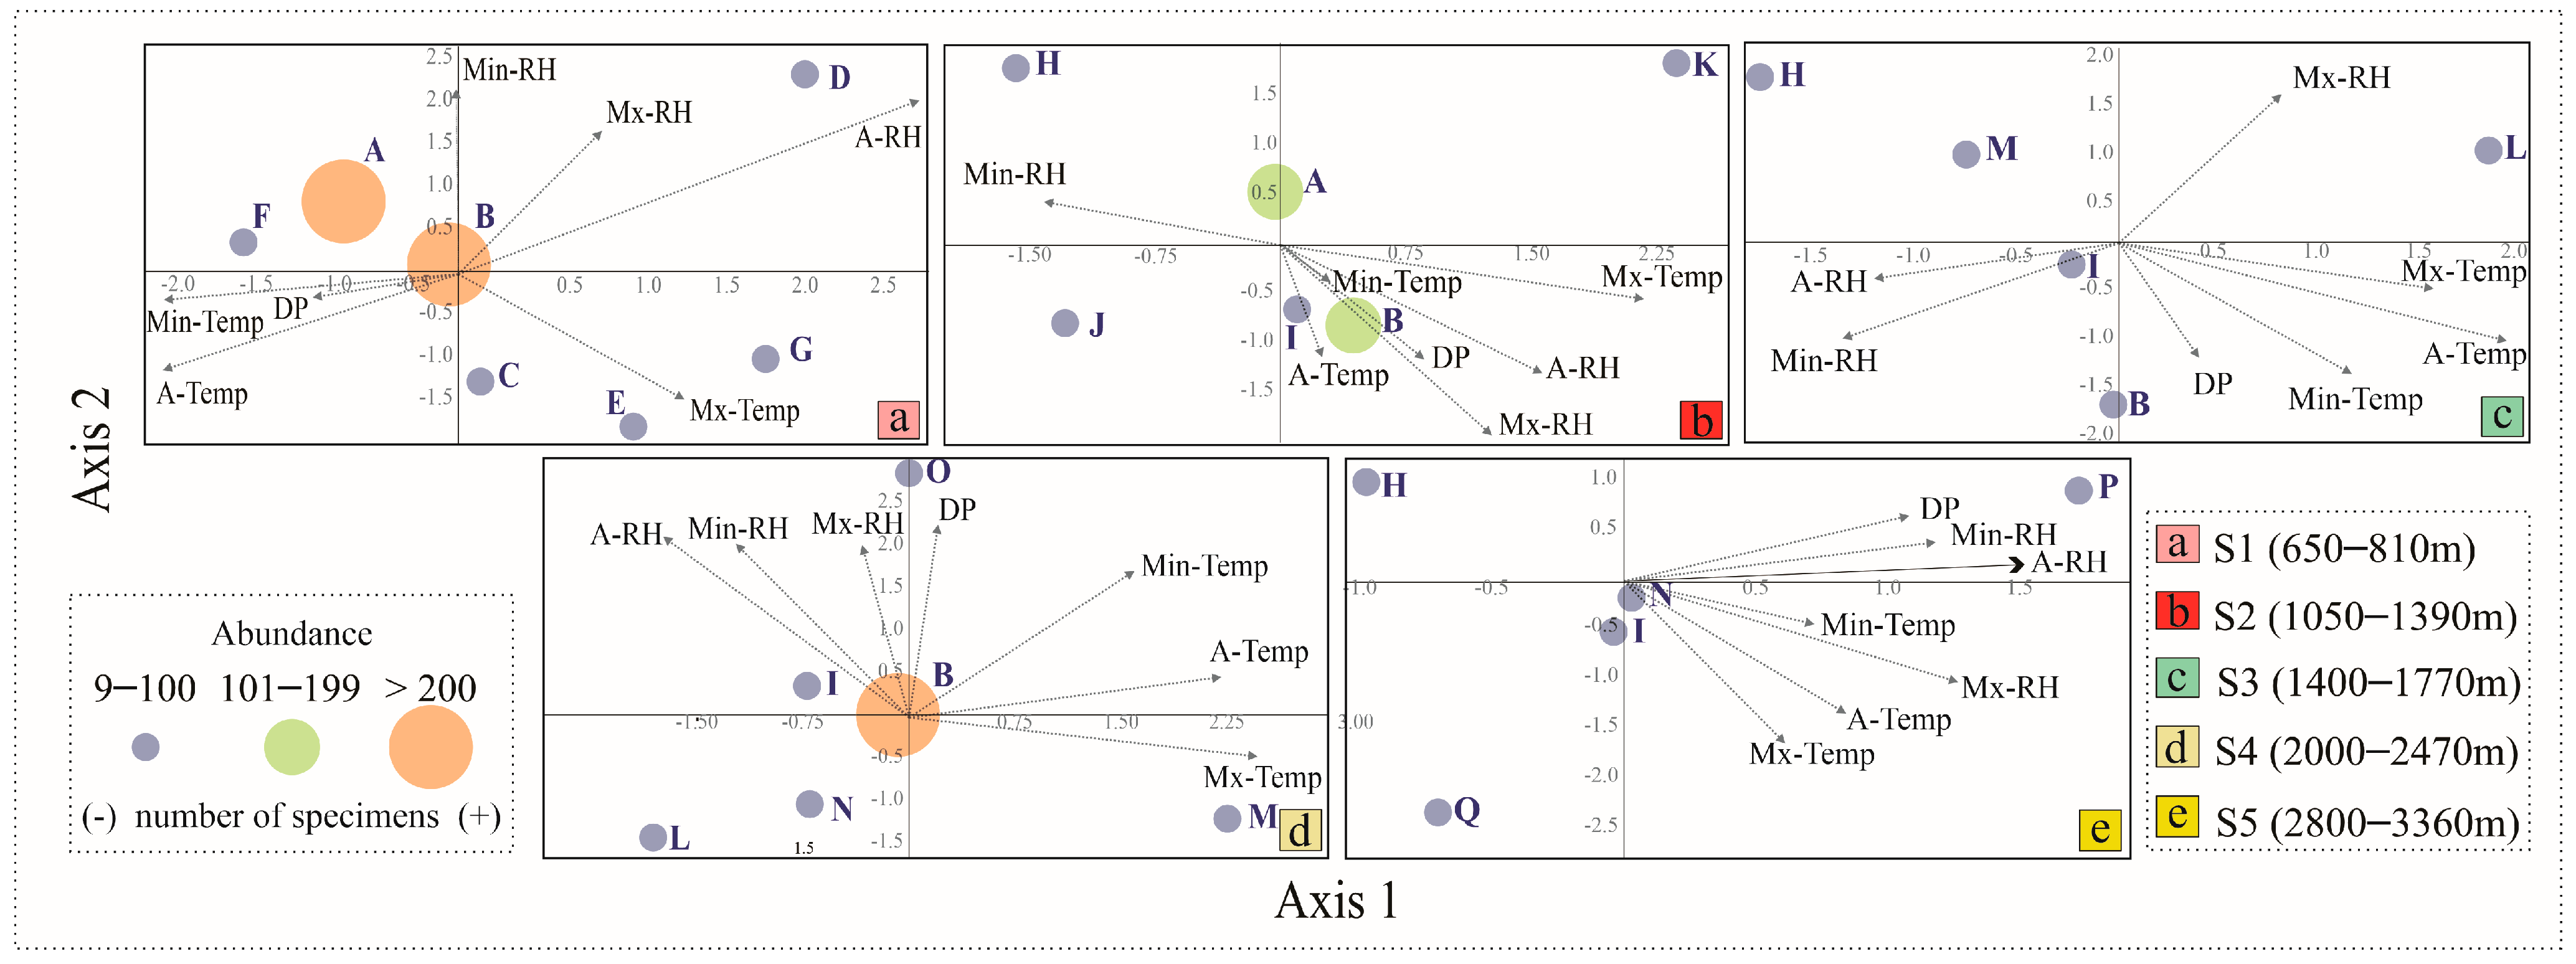
The Canonical Correspondence Analysis (CCA) revealed that the correlation between environmental variables and the occurrence of Scolytinae species exhibited variation across sites. Consequently, separate analyses were conducted for each site (Figure 5). The number of species considered in each CCA and the respective variation percentages explained by the first two axes are presented in Table 2. Significant differences were observed only on one axis of site S1. These analyses indicated that the relationship of environmental parameters to species is different at each site.
At the S1 site, the abundance of X. bispinatus was strongly related to average relative humidity (A-RH), while the presence of X. morigerus, Araptus laevigatus (Eggers), and X. ferrugineus was more closely related to maximum temperature (Mx-Temp) (Figure 5a).
In the S2 site, the maximum relative humidity (Max-RH) and dew point (DP) were found to influence the abundance of C. panamensis, while the average temperature (A-Temp) on C. comatus and the minimum relative humidity (Min-RH) were found to have a significant influence on C. villus. The abundance of Euwallacea posticus Eichhoff was determined by the average temperature (A-Temp) and the minimum relative humidity (Min-RH) (Figure 5b).
In S3, C. panamensis was related to the dew point (DP), while C. comatus was related to the minimum relative humidity (Min-RH) and M. hoegei to the average relative humidity (A-RH) (Figure 5c).
In site 4, the abundance of C. panamensis exhibited a slight influence from the minimum temperature (Min-Tem) and the dew point (DP). The presence of M. hoegei was found to be influenced by the maximum temperature (Mx-Temp), while that of Ambrosiodmus rusticus Wood was influenced by the dew point (DP) (Figure 5d).
In S5, G. gemellus was found to be related to the dew point (DP) and minimum relative humidity (Min-RH) (Figure 5e).

3.2. Alpha and Beta Diversity of Scolytinae

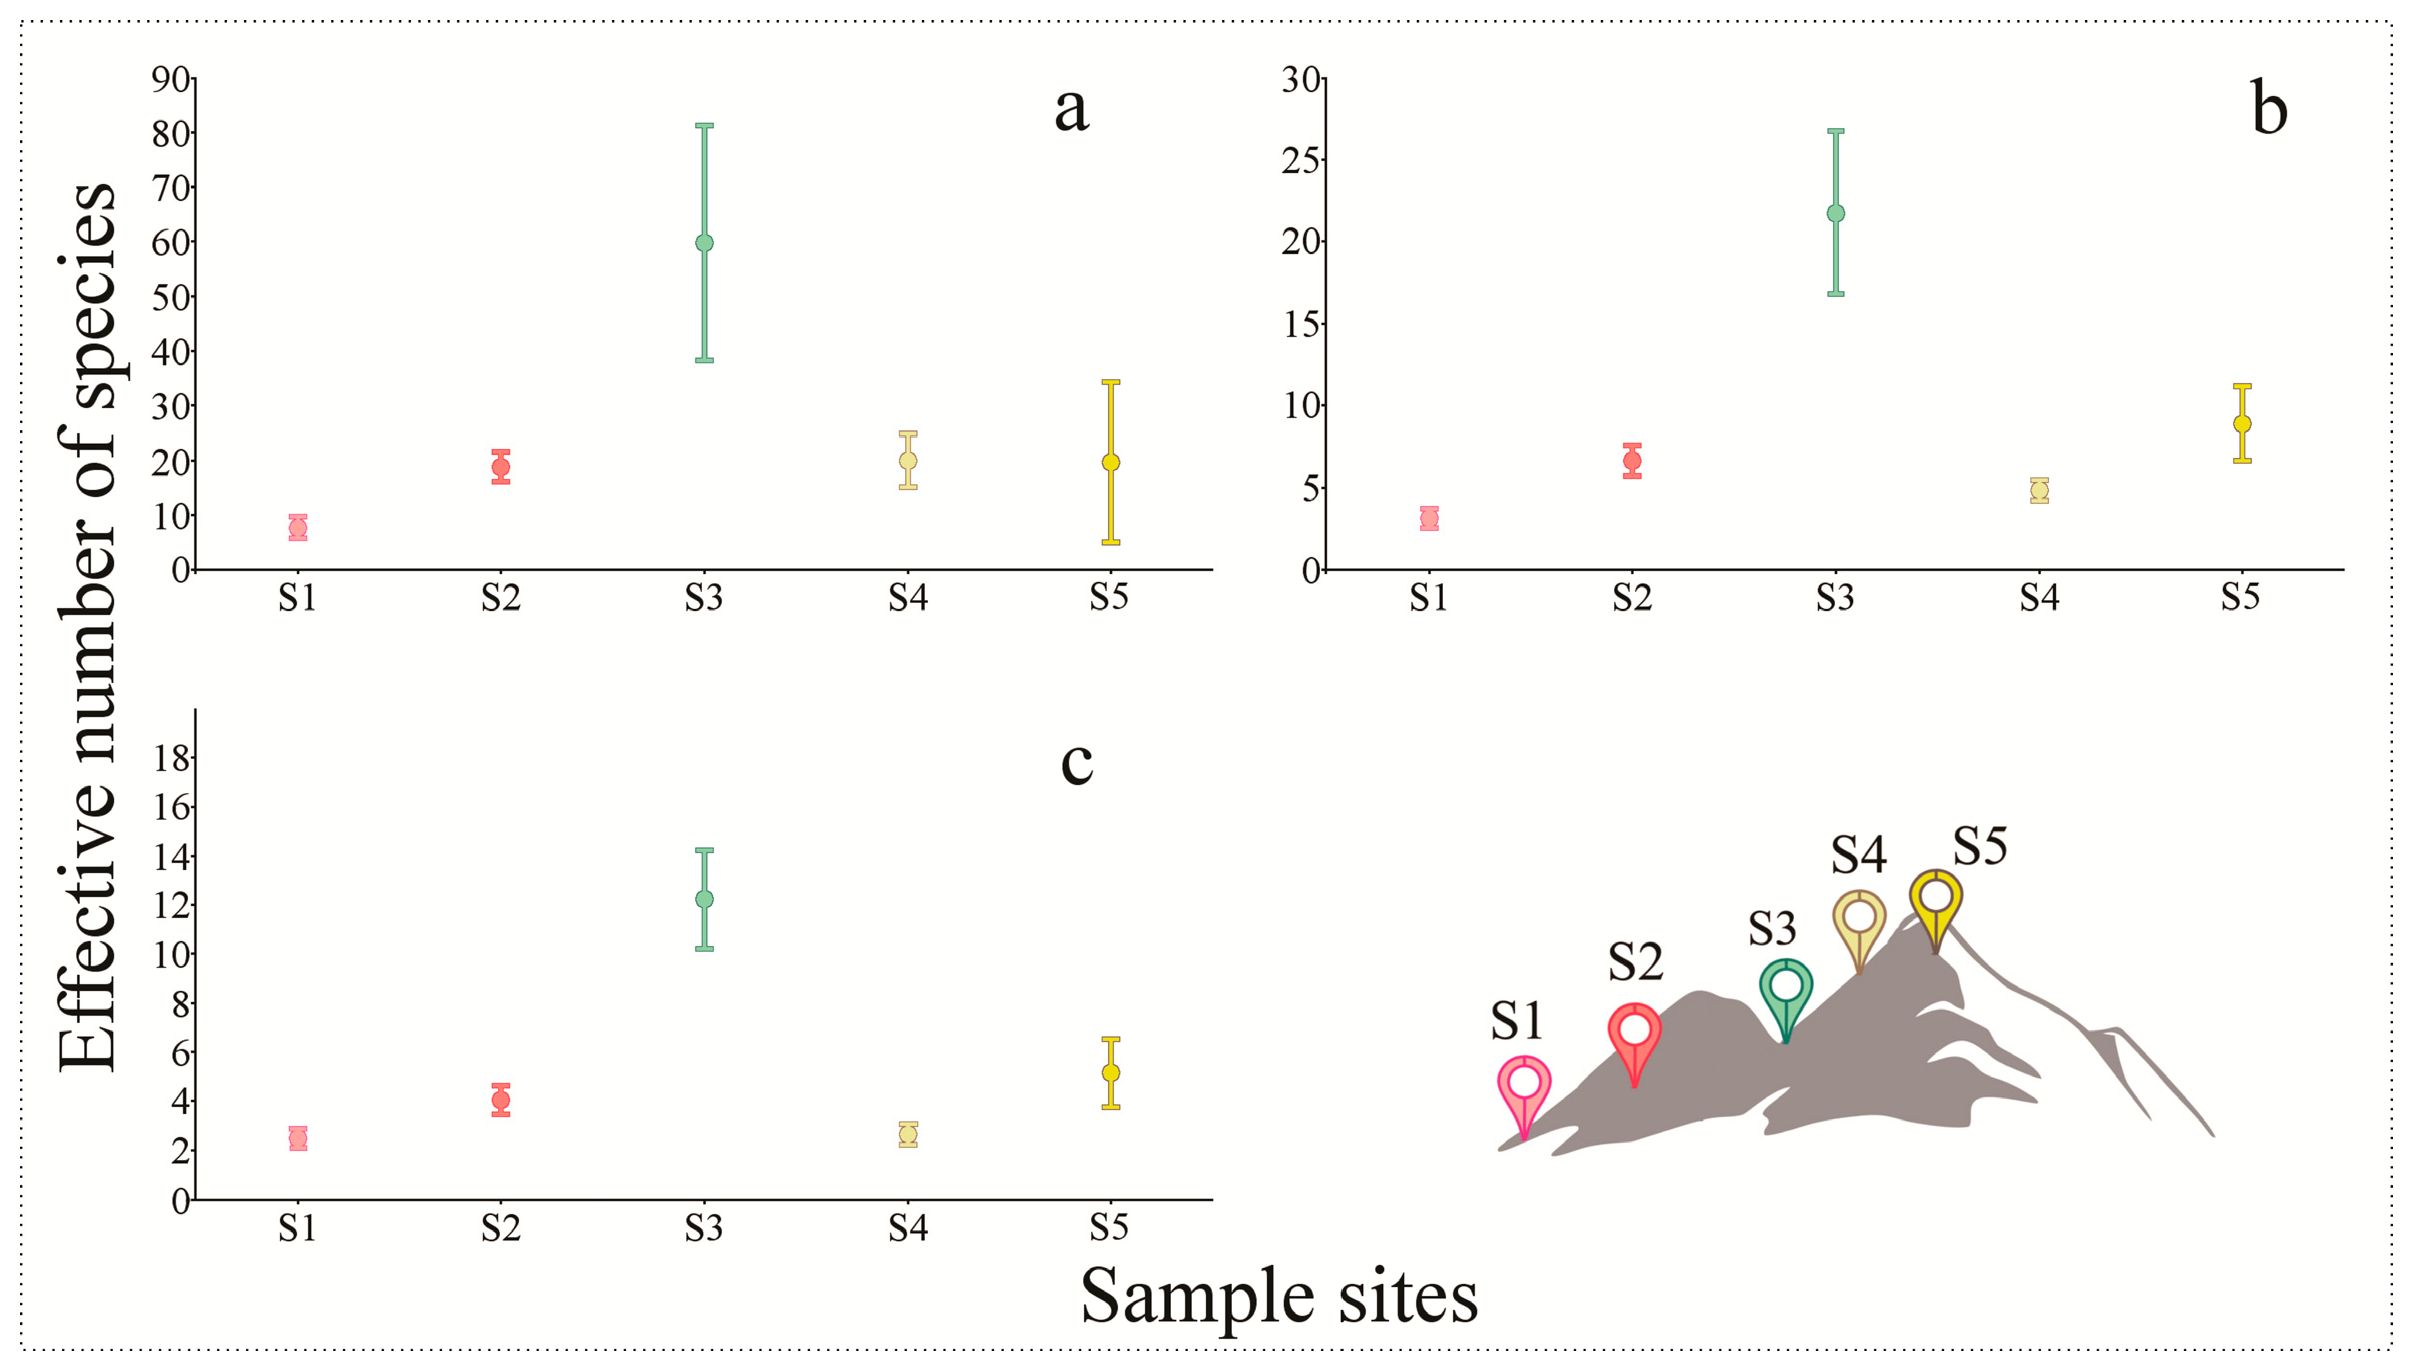
Alpha diversity at Tacaná Volcano, based on Hill numbers at 0.99 sample coverage, was 0D = 82, 1D = 9, and 2D = 4. The sample coverage was greater than 0.90. To compare the diversity between the different elevational levels, the diversity values were standardized to a sample coverage of 0.95. Diversity peaked at the mid elevation (S3: mesic montane forests), which was identified as the site with the highest diversity values, 0D = 59, 1D = 21, and 2D = 12 effective species; these values were significantly higher than those recorded at the other sampling sites (p < 0.05). The highest elevation site (S5) was the second most diverse; however, the diversity did not have a significant difference from that of S2. Diversity decreased toward the S1, with values of 0D = 7, 1D = 3, and 2D = 2, although abundance was the highest of all sites and equity was the lowest (Figure 6a–c).
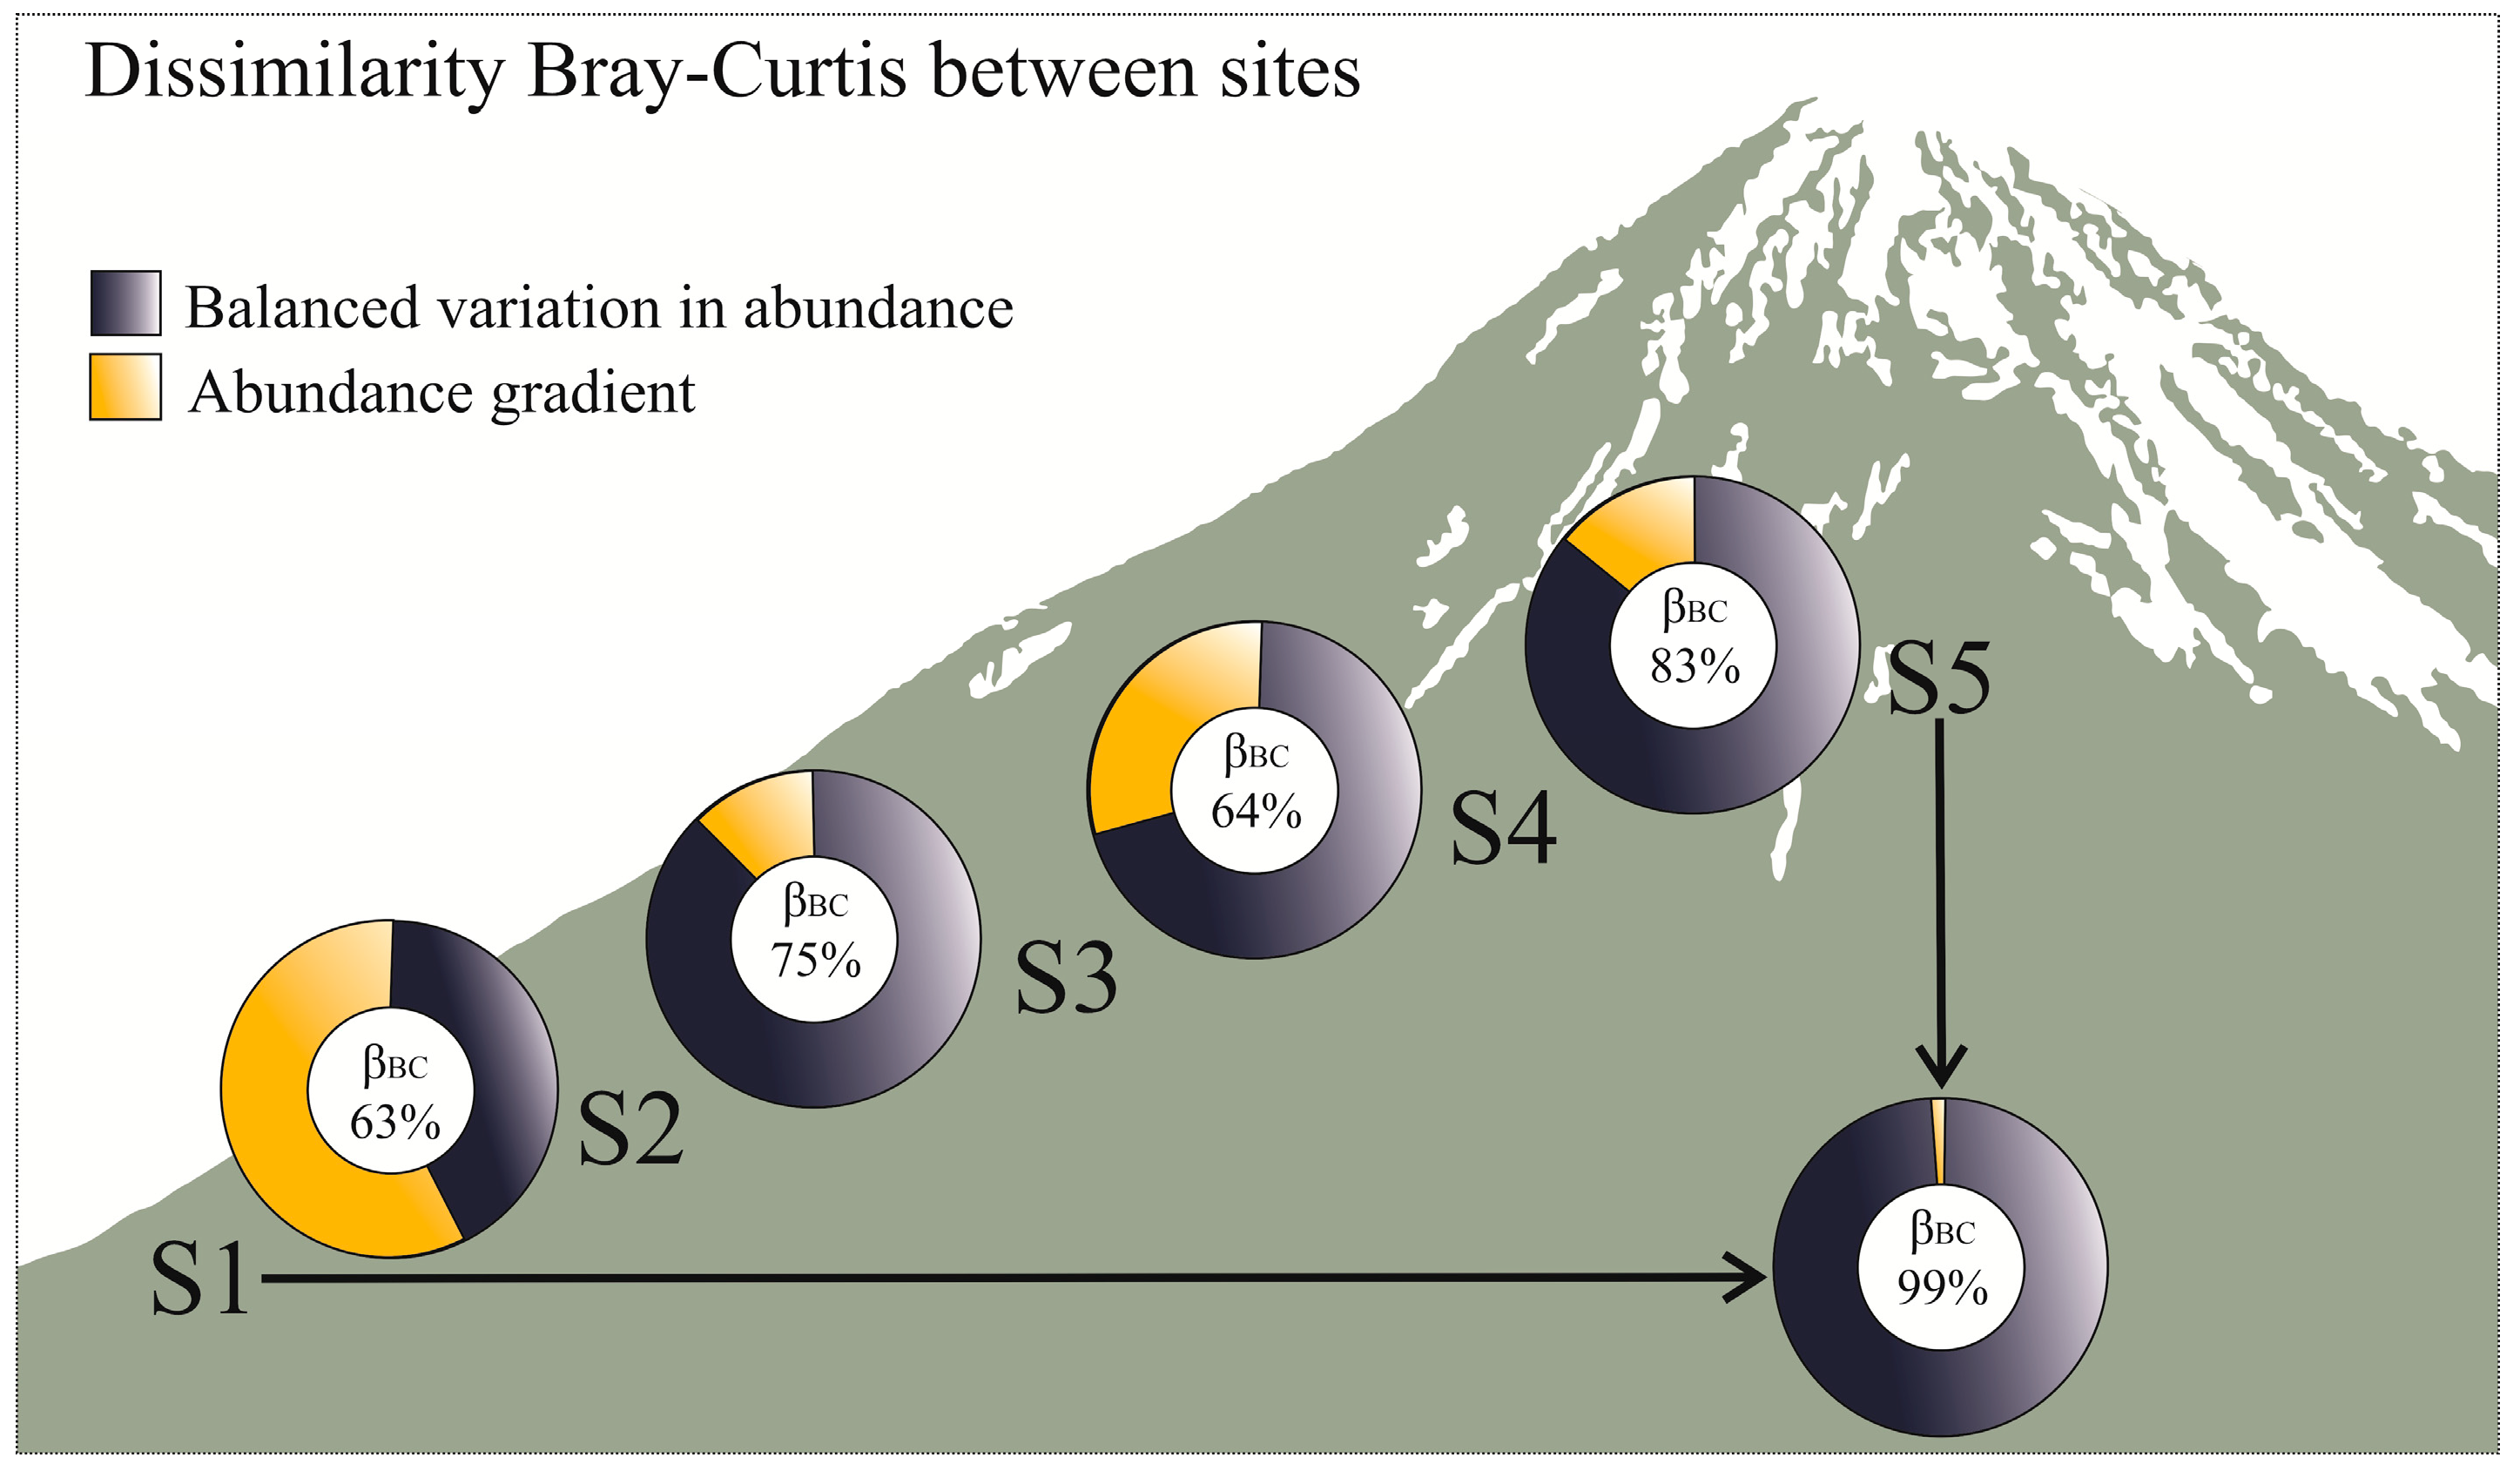
The Bray–Curtis index showed a high dissimilarity (βBC = 82%) in Scolytinae assemblages across sites, mainly due to the replacement of species abundances between sites (balanced variation in abundance, βBC.BAL = 66%). This means that when one species decreases in abundance at a site, another species increases at a different site. A smaller portion of the dissimilarity (βBC.GRA = 16%) was due to the reduction of the abundances of the same species among sites, species loss without replacement (abundance gradient).
Dissimilarity increased with elevational distance, with the greatest difference between S1 and S5 (βBC = 99%) and between S2 and S5 (βBC = 90%), almost entirely due to abundance replacement. The change between S1 and S2 was more influenced by the decrease in abundances of species (βBC.GRA = 58%) than by the replacement of species abundances (βBC.BAL = 42%), indicating low dissimilarity between these sites (βBC = 63%). The least dissimilarity was between S2 and S4 (βBC = 58%), primarily due to abundance replacement (βBC.BAL = 53%) (Figure 7).

3.3. Scolytinae Species Assemblage

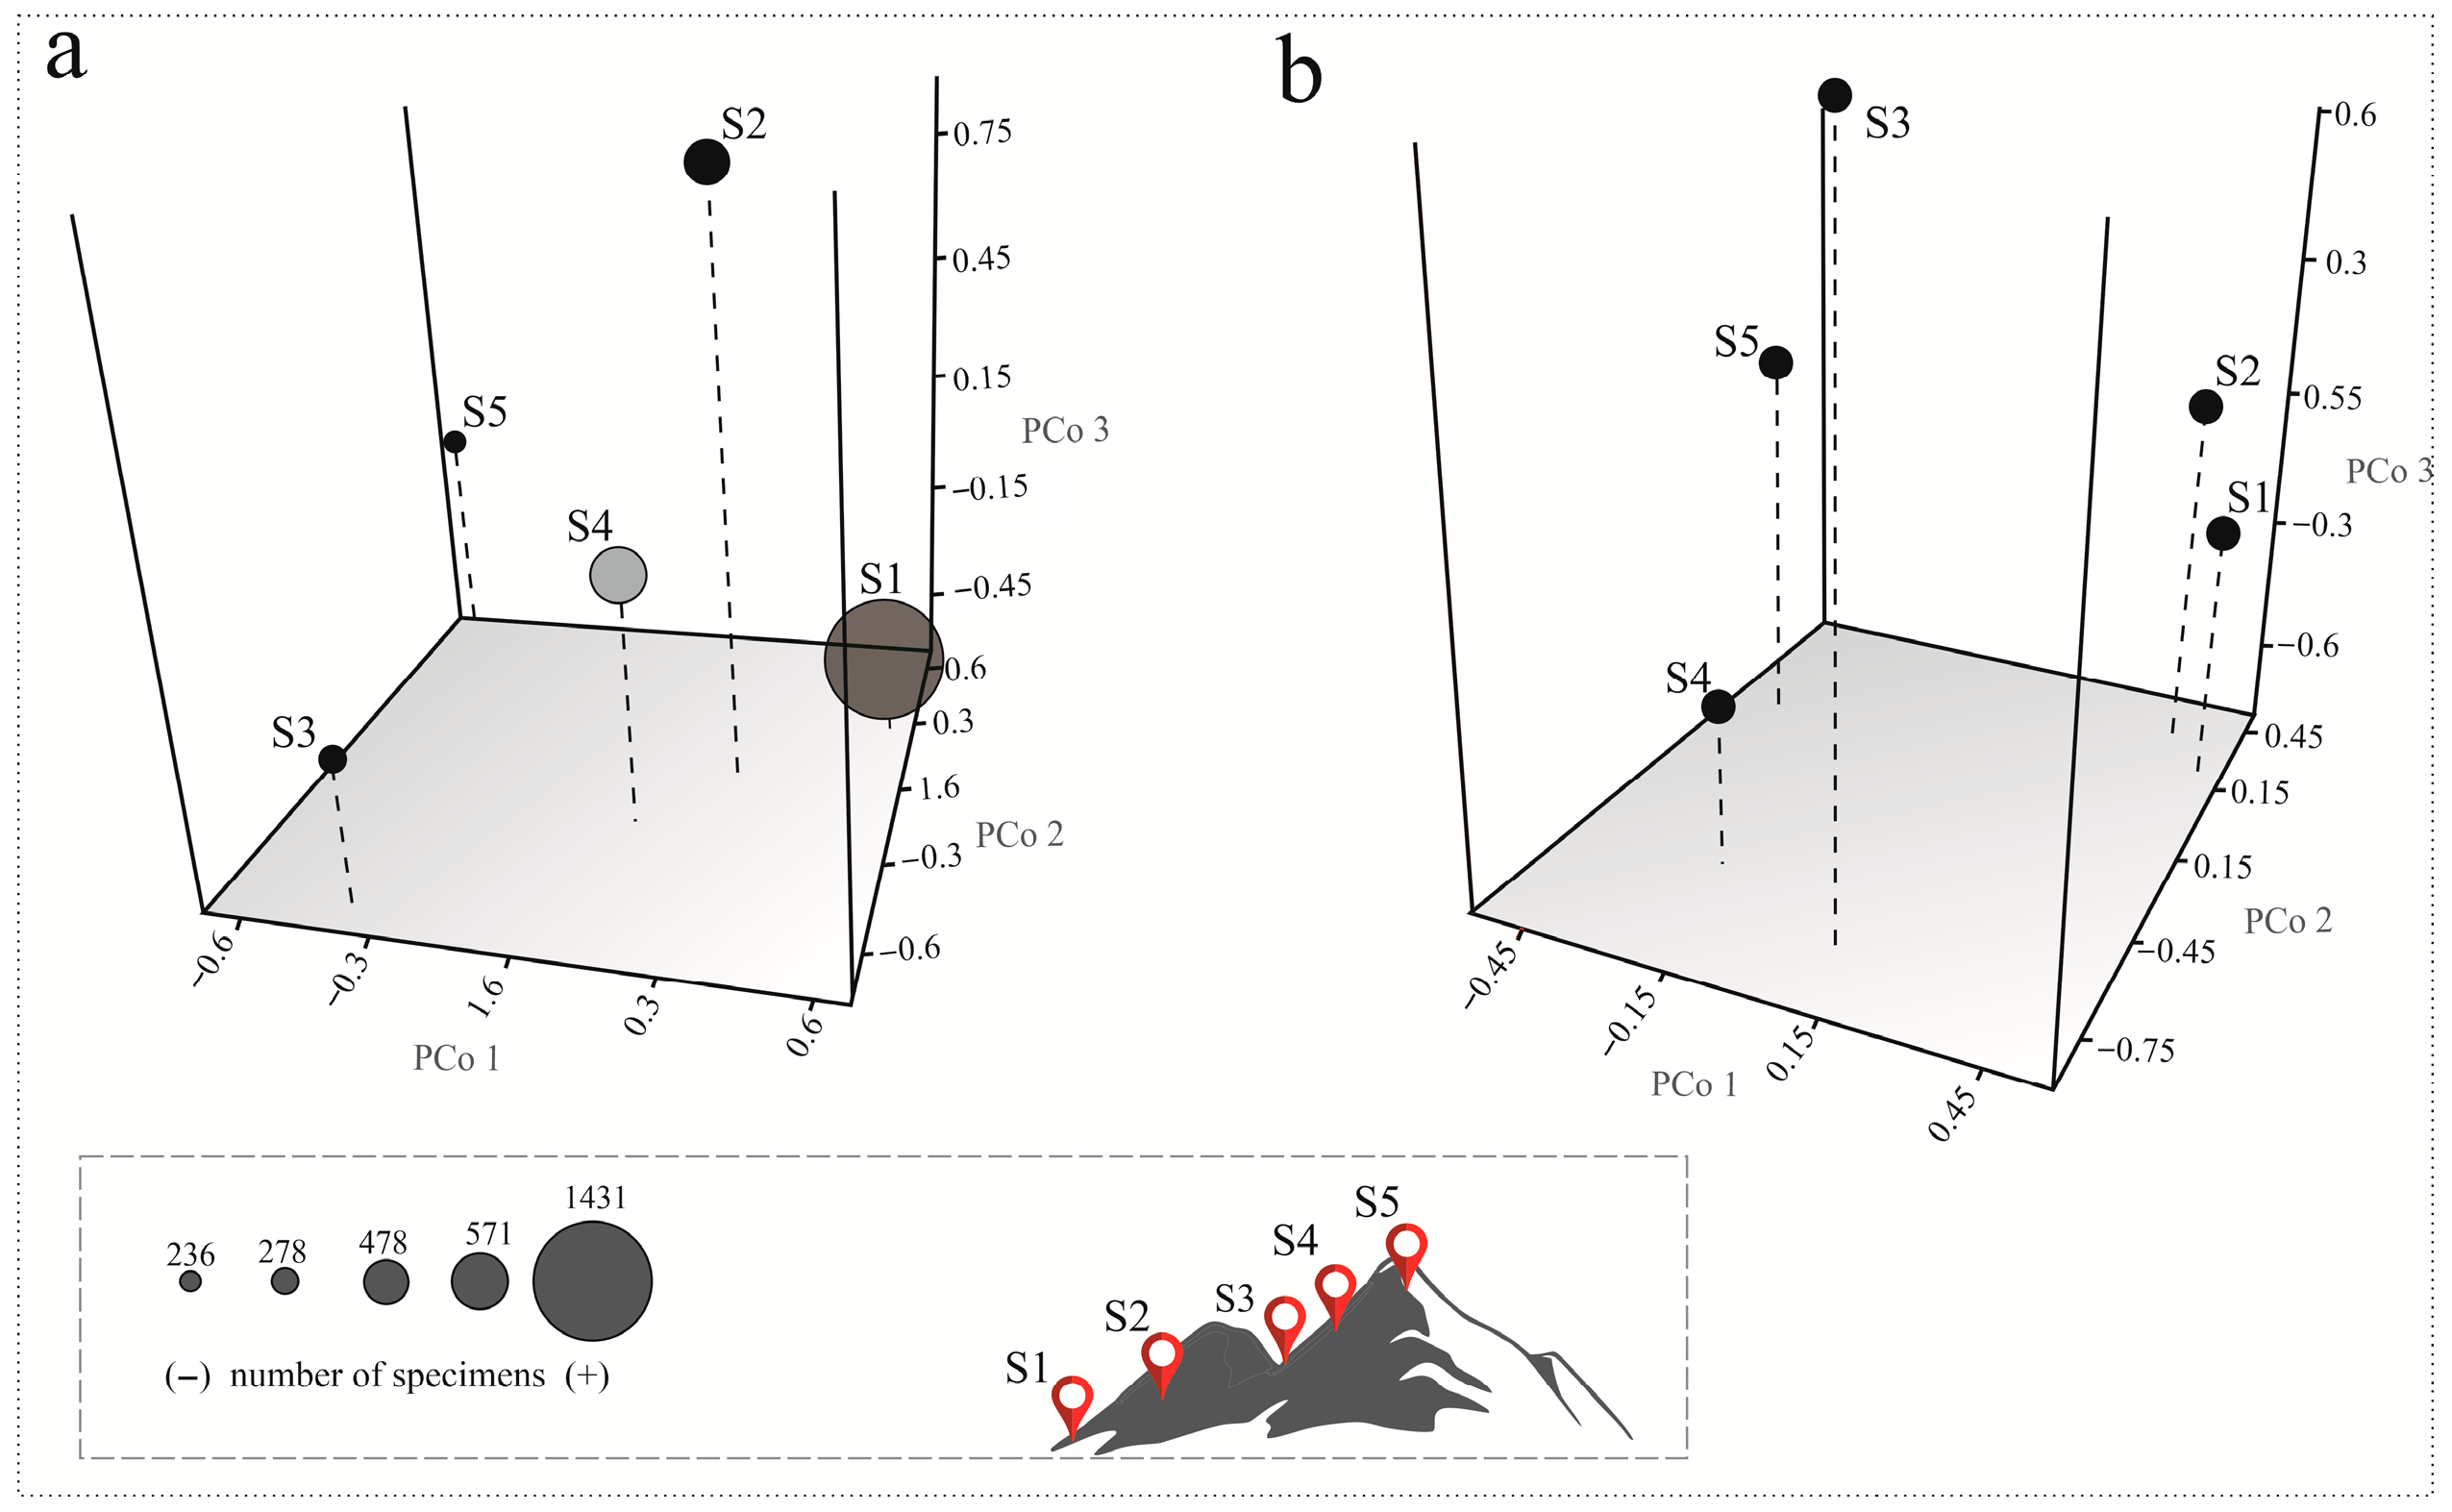
Principal coordinate analyses quantified more than 80% of the community variation in the first three coordinates: 81.09% with the presence–absence matrix (PCo1-36.1%, PCo2-26.1%, PCo3-19.6%) and 88.8% with the abundance matrix (PCo1 48.2%, PCo2 24.9%, PCo3 15.6%). The respective three-dimensional scatter plots showed the spatial structure of the Scolytinae assemblages (Figure 8). The Scolytinae assemblages of sites S1, S2, and S4 have smaller distances due to abundances higher than 400 specimens (Figure 8a). The scatterplot obtained with absence data showed a clearer structure of the assemblages according to the elevational gradient (Figure 8b). Assemblages at lower elevations (S1 and S2) were more like each other, as were those at higher elevations (S3–S5), of which at least two groups can be defined: low and high elevation.
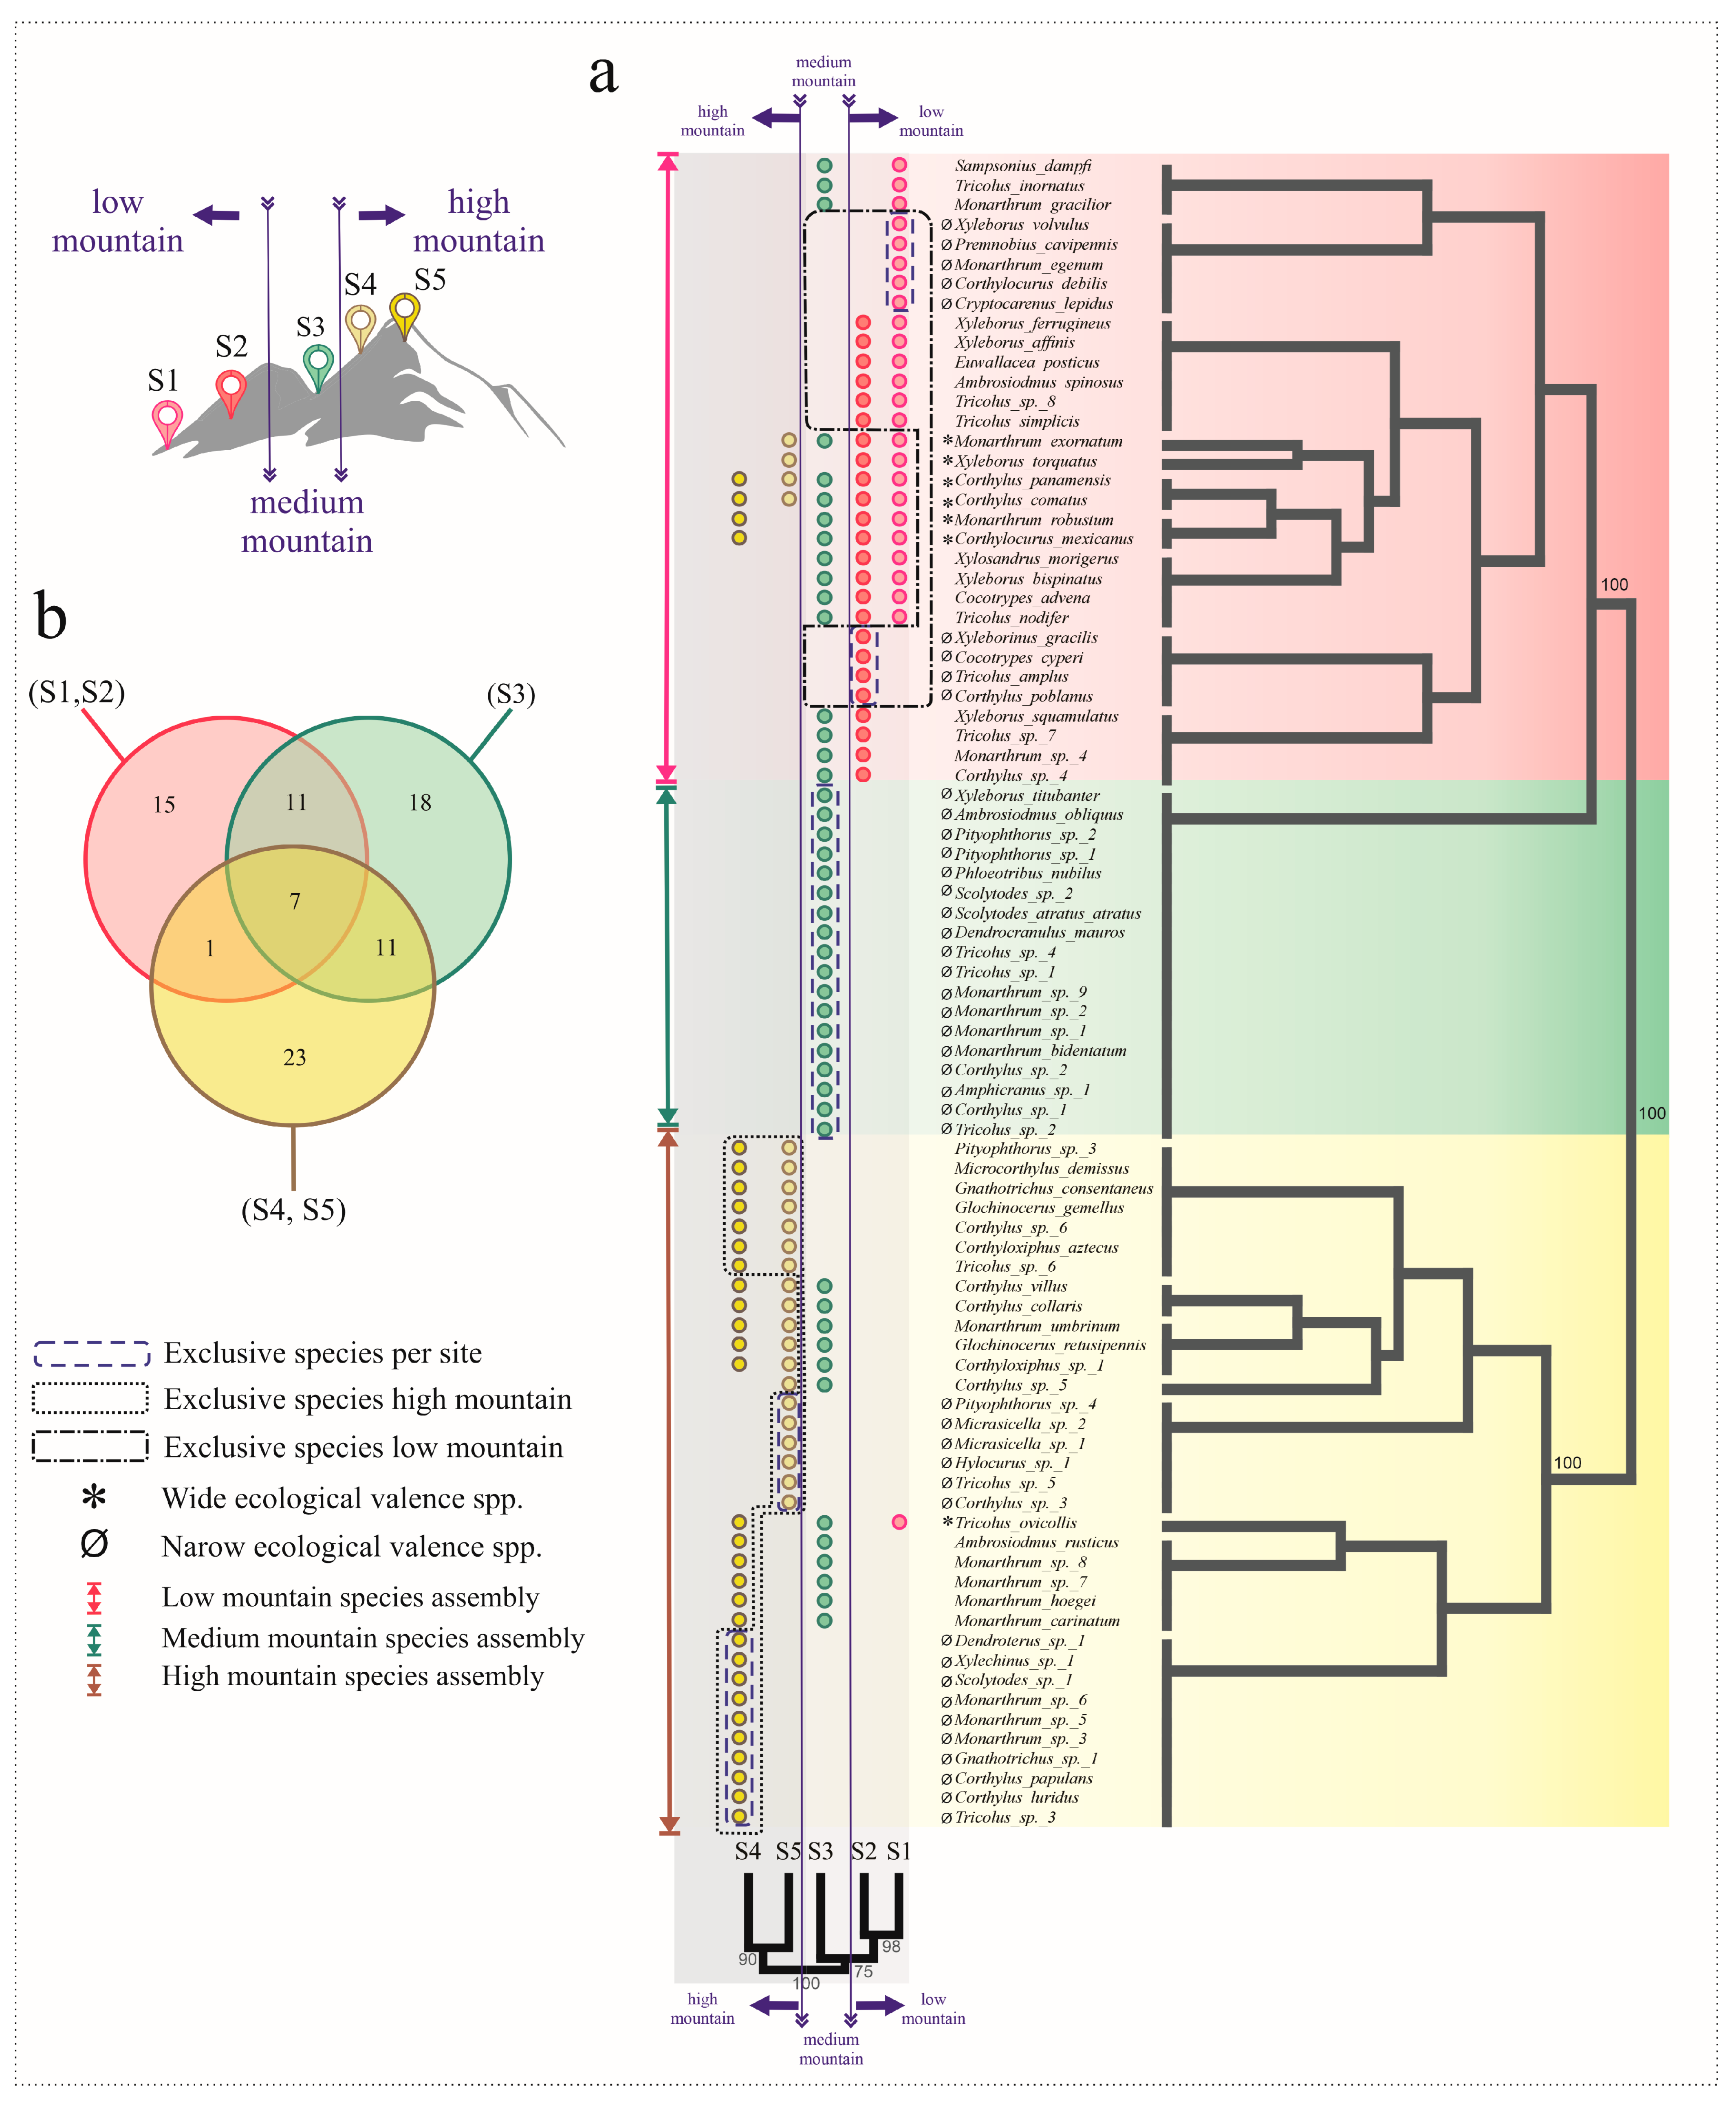
It was determined that the presence–absence matrix analyses would provide a clearer delineation of the community structure according to the geographical setting. The obtained dendrograms, among sites and species, showed good consistency between the original distance matrix and the resulting topology; both presented high values of the co-phenetic correlation index (rs = 0.93 and rspp = 0.89), and the recovered clusters were supported by values higher than 90% in most cases. The cluster analysis revealed that the species pool of Scolytinae is structured in three local communities, corresponding to different elevational landscapes: the low mountain community (S1 and S2), mid-mountain community (S3), and high mountain community (S4 and S5) (Figure 9a). These local communities were supported by the presence of species with narrow ecological valence; thus, they were limited and exclusive to one or two sites.
In turn, the local communities were related to each other by the presence of species with a wide ecological valence, which were found in more than three elevational levels. According to the Venn diagram (Figure 9b), the low mountain community has 15 exclusive species, the medium mountain community has 18, and the high mountain community has 23.
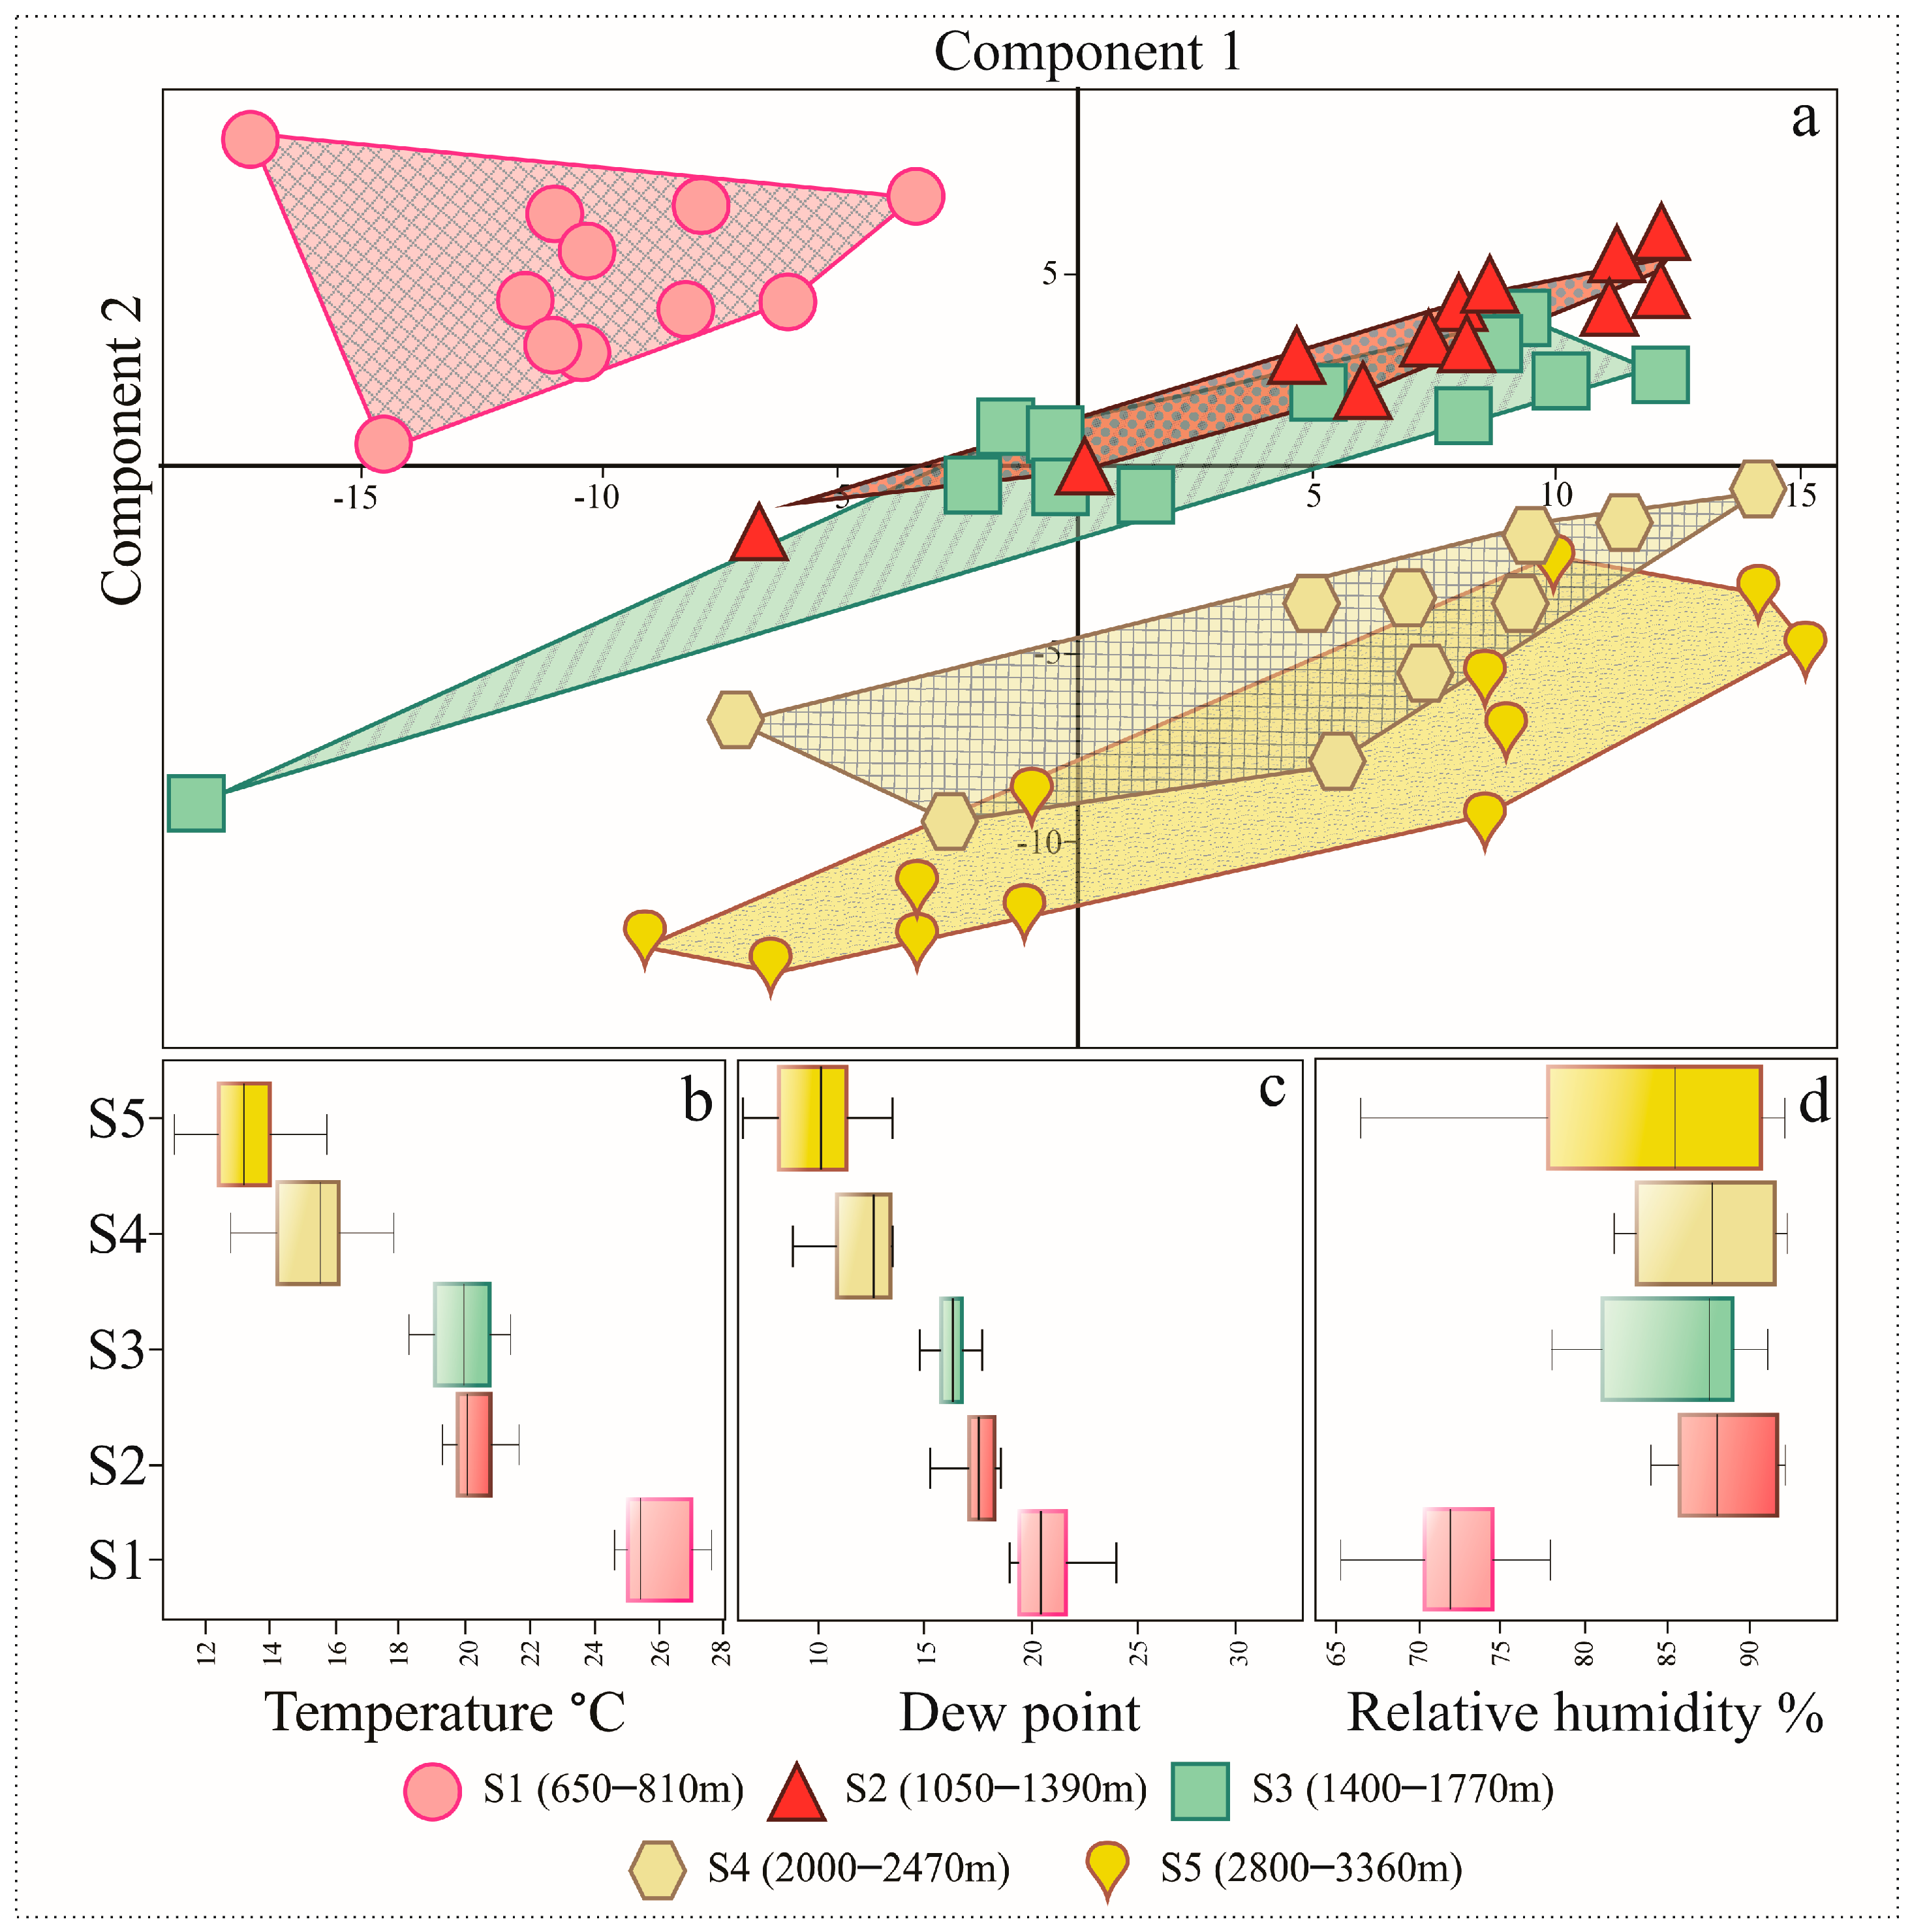
The three environmental variables (temperature, relative humidity, and dew point) showed significant differences in at least one comparison among the collection sites. The PCA of these environmental variables explained 99.79% of the total variation in the two principal components (PC1-72.22%; PC2-27.57%). The two-dimensional scatter plot revealed an environmental structure on the volcano, corresponding to three elevational scenarios: low (S1), medium (S2 and S3), and high mountain (S4 and S5). The environmental variables with the greatest contribution to explaining the pattern were relative humidity in PC1 and temperature and dew point in PC2 (Figure 10a). The Tukey test showed differences in the following contrasts: S1 vs. S2, S1 vs. S3, S1 vs. S4, and S1 vs. S5 (Figure 10a). The temperature and dew point were higher in S1 and lower in S5. Significant differences were found in temperature (ANOVA linear, F4, 54 = 196.1, p < 0.001) (Figure 10b) and dew point (ANOVA linear, F4, 54 = 66.16, p < 0.001) (Figure 10c). The Tukey test showed the same differences in both temperature and dew point in the following contrasts: S1 vs. S2, S1 vs. S3, S1 vs. S4, S1 vs. S5, S2 vs. S4, S2 vs. S5, S3 vs. S4, S3 vs. S5, and S4 vs. S5. The relative humidity was higher in S2 and lower in S1. Significant differences were found (ANOVA linear, F4, 54 = 7.26, p < 0.001) (Figure 10d).

4. Discussion

This study characterizes the taxonomic composition, diversity patterns, and environmental associations of Scolytinae communities along an elevational gradient on the Tacaná Volcano. The 45 taxa identified to the species level represent 18.4% of the 250 species currently reported for the state of Chiapas [37], indicating that the system harbors a substantial proportion of the known regional diversity. The remaining 37 taxa were treated as Operational Taxonomic Units (OTUs), following a conservative protocol to account for sexual dimorphism and avoid taxonomic inflation. The fact that 81.6% of the regional fauna was not captured is consistent with the high host specificity of many bark beetles that do not respond to ethanol-baited traps. Thus, our results highlight the Tacaná Volcano as a critical biodiversity hotspot for Scolytinae. Furthermore, richness estimators suggest that species diversity remains underestimated at intermediate and high elevations, highlighting the need for additional sampling to capture the full extent of elevational turnover.

4.1. Assemblage Composition and Abundance Along Elevation

Community composition exhibited clear elevational structuring. Xyleborini dominated at lower elevations, whereas Corthylini increased in proportional representation at intermediate and higher sites, consistent with previously documented elevational tendencies [19,46,47,48]. Most species were recorded at only one or two sampling sites, while only a limited subset occurred across multiple elevations. This pattern suggests restricted elevational occurrence for most species and high compositional turnover along the gradient.
In the lowlands (S1–S2), the dominance of Xyleborini, particularly Xyleborus affinis, reflects the high availability of diverse tropical hosts. While X. affinis behaves as a broad generalist, other lowland taxa show high resource specificity; for instance, the presence of Coccotrypes is intrinsically linked to the abundance of palm seeds, a resource restricted to these tropical levels. This indicates that even in high-diversity lowland forests, host-specific availability structures the assemblage.
In contrast, the shift in community composition at higher altitudes is driven by the transition toward temperate botanical elements. Species such as Xyleborus titubanter and Ambrosiodmus rusticus were restricted to these elevations, where they are associated with key mountain hosts such as Alnus and Quercus [25,49]. These patterns suggest that while climatic variables (temperature and humidity) define the physiological envelope, the presence and abundance of specific ambrosia beetle groups are ultimately determined by the botanical turnover along the Tacaná Volcano.
The tribe Corthylini exhibited distinct elevational affinities along the Tacaná Volcano, with a predominance of generalist species in terms of their hosts. Specifically, the genera Monarthrum and Corthylus reached their highest diversity at intermediate altitudes (800–1800 m), consistent with mesic montane forests [47]. Similarly, the genus Tricolus showed its greatest richness and abundance between 1000 and 1800 m, partially documented in previous studies [19,48]. In contrast, Gnathotrichus, Glochinocerus, and Corthyloxiphus were predominantly recorded at higher elevations (>2000 m), associated with temperate forest hosts [50]. While these elevational preferences in Corthylini are clear, defining the exact host range for many Corthylini remains a challenge. These results suggest that the mid-elevation peak in Scolytinae diversity is largely driven by the high turnover and specialization of Corthylini genera across the cloud forest and temperate transition.
Comparable elevational segregation has been documented in other insect assemblages. For instance, ground-dwelling arthropods on the Colorado Plateau exhibited high site-level exclusivity and turnover-driven beta diversity [51]. Similarly, dung beetle assemblages along an elevational gradient in the Sierra Nevada de Santa Marta showed marked elevational turnover, with most species occurring at unique elevations and distinct lowland versus high-elevation groups [52]. Narrow elevational ranges and strong species replacement have also been reported for epigaeic beetles [53] and tropical dung beetles [54].
Abundance was highest at the lowest site, whereas species richness peaked at the intermediate elevation (S3). This unimodal richness pattern aligns with the mid-elevation peak patterns described for insects [6,14], particularly for Scolytinae, across broad elevational gradients [22]. In contrast to patterns observed in temperate bark beetle outbreaks—where evidence indicates that temperature acts as the primary regional driver, facilitating the colonization of high-elevation habitats that were previously thermally unsuitable [55]—our results suggest a more complex structuring. Nevertheless, because elevation integrates multiple environmental gradients, including temperature, moisture, and vegetation structure, the observed pattern likely reflects the interaction of climatic and habitat-related drivers rather than elevation per se [23,56].
Sampling completeness decreased with elevation, which may contribute to the underestimation of richness at intermediate and high sites. Additionally, spatial coverage restricted to the Mexican flank of the volcano may limit broader biogeographic inference [30]. The use of ethanol-baited Malaise and interception traps likely biased sampling toward Ambrosia beetles [57], potentially underrepresenting other ecological guilds and influencing assemblage-level patterns. However, this focus is not incidental; in tropical and mountain ecosystems like the Tacaná Volcano, Ambrosia beetle groups—particularly the tribe Corthylini—constitute the most diverse and abundant component of the Scolytinae [25]. While our results must be interpreted with caution regarding the entire subfamily, the diversity patterns described here are fundamental to understanding the ecological dynamics of the dominant Scolytinae groups in the region. The prevalence of Ambrosia beetles in our samples is explained by their generalist attraction to host-stress signals, such as ethanol, whereas true bark beetles rely on a more complex and specific network of insect- and host-derived semiochemicals. Consequently, while our study primarily reflects the Ambrosia beetle assemblage, it provides a robust characterization of the most ecologically active guild within this elevational gradient.

4.2. Alpha Diversity Patterns

Hill numbers (1D and 2D) confirmed significantly higher diversity at the intermediate site (S3), indicating greater evenness and dominance compared to other elevations. Diversity declined toward both lower and higher extremes of the gradient, reinforcing the presence of a mid-elevation diversity maximum. Comparable patterns have been reported across mountain systems [14,22], suggesting that transitional ecological zones frequently support elevated diversity. Mesic montane forests on Tacaná Volcano appear to function as ecological transition zones between tropical lowland and temperate high-elevation forests [58]. Their restricted distribution, isolation, and distinctive moisture regimes may create environmental heterogeneity conducive to diversification [59].
Host-plant diversity is a key driver of tropical herbivorous insect communities, including Scolytinae [60,61]. In the Tacaná Volcano, Scolytinae species turnover across the elevational gradient is intrinsically linked to the varying composition of plant communities, which act as structural and resource filters. However, this response is moderated by the conservation status of the forest and the heterogeneity of the landscape. As natural forest gradients transition towards agroforestry or degraded environments, the availability of diverse potential hosts, which vary in age, size, and physiological state, decreases considerably [62]. For Ambrosia beetles, this loss or reduction of heterogeneity in hosts is particularly critical, because the reproductive success of the Ambrosia beetles depends on specific microclimatic conditions within the wood [63], which favor symbiotic fungal growth. In conserved forest fragments, the presence of large-diameter fallen trees and high canopy cover maintains the hygroscopic stability required for fungal inoculation, a mechanism that explains the higher species richness observed in our more preserved intermediate-elevation sites compared to disturbed lowland areas.

4.3. Beta Diversity and Assemblage Structure

Beta diversity across the gradient was high (βBC = 82%), driven primarily by balanced variation in species abundances rather than abundance gradients and nested species loss. In Scolytinae, this dissimilarity is primarily driven by structural environmental filtering and forest conservation status [23,24]. We observed an almost complete species turnover (99% dissimilarity) between the extremes of the gradient (S1 vs. S5). This extreme beta diversity is not merely a product of distance but a reflection of the abrupt transition between functional guilds: this turnover primarily resulted in the replacement of a tropical assemblage dominated by Xyleborini species in the lowlands with a temperate assemblage with more specialized temperate species at higher altitudes of Corthylini and Ambrosiodmus associated with Quercus-Alnus hosts.
Interestingly, the 75% dissimilarity between El Águila (S2) and Benito Juárez (S3)—sites with similar altitudes—suggests that landscape fragmentation and land-use history (coffee cultivation) act as secondary filters. While geographical distance often fails to reduce similarity in continuous forests [64], the ‘spot-like’ distribution of cloud forest fragments in the Tacaná region likely limits the dispersal of host-specific Ambrosia beetles. This suggests that the regional dynamics of coffee agroforestry create micro-allopatric conditions, where the isolation of preserved forest patches promotes high beta diversity even over short linear distances [65].
Multivariate analyses revealed the presence of three distinct Scolytinae communities distributed along the entire mountain range: the low mountain community (S1 and S2), mid-mountain assemblage (S3), and high mountain assemblage (S4 and S5). These assemblages were defined mainly by species turnover along the gradient rather than progressive species loss. Similar structuring mechanisms have been discussed for insect communities along environmental gradients [66]; however, assembly processes may vary across spatial scales and along elevational gradients [15]. The faunal history of mountainous regions is intimately linked to dispersal events within a confined physical space, shaped by the distinctive historical attributes of these regions. In this context, elevational dispersal of species plays a far greater influence on assemblage structure than horizontal dispersal [67].
Species distribution, abundance, and interaction patterns manifest across disparate spatial scales, varying according to the scale of observation [68]. Among these, elevational gradients are of particular significance at both local and regional levels. In mountainous systems, connectivity between low-, mid-, and high-elevation communities is maintained by species with high ecological value. These taxa exhibit greater environmental tolerance, preventing assemblages from becoming isolated sinks. In this context, the faunal history of these regions is intimately linked to dispersal events within confined physical spaces, where vertical (altitudinal) dispersal often exerts a greater influence on community structure than horizontal movement [67].
Mittelbach and McGill (2019) identify three primary processes influencing species persistence: biotic interactions, abiotic filters, and dispersal abilities [69]. In Scolytinae, host specificity is a central, yet complex, determinant of dispersal. While it has been suggested that Ambrosia beetles lack strict host specificity [63], this cannot be generalized to all species. For some taxa, low ecological valence may be driven by host specialization or narrow environmental tolerances. Furthermore, while some assemblages may be influenced by the phylogenetic proximity of hosts [70], others appear independent of local tree composition [57], suggesting that dispersal is regulated more by environmental cues than by botanical identity.
These dispersal mechanisms are further moderated by abiotic conditions, including temperature, solar radiation, and wind dynamics, alongside the insects’ ability to locate hosts and bypass defense mechanisms [25,71]. The search for suitable breeding substrates remains the primary driver of dispersal; however, the process is high-risk. When olfactory stimuli (e.g., ethanol or pheromones) are absent, Scolytinae undertake random flights, which can result in mortality rates of 50–80% [72]. This high ‘cost of dispersal’ underscores why climatic stability along the gradient is critical for the maintenance of stable ambrosia beetle populations.

4.4. Environmental Drivers of Diversity

Temperature and dew point decreased with elevation, while relative humidity showed weaker differentiation among higher sites. Abundance was positively correlated with temperature and dew point and negatively correlated with relative humidity, whereas richness was not significantly correlated with the measured variables. Previous studies have reported variable relationships between Scolytinae abundance and climatic factors [18], suggesting that responses may be context dependent.
Canonical Correspondence Analyses indicated that environmental variables explained only a limited proportion of total species variation, suggesting that additional unmeasured factors—such as host availability, microhabitat structure, or historical processes—may contribute to assemblage organization. Corthylus panamensis showed a consistent association with dew point, a variable that reflects the humidity stability required for its symbiotic fungal gardens. In Ambrosia beetles, the dew point serves as a proxy for the environmental conditions that maintain the water content of the host tissue; such stability is essential to prevent fungal desiccation and ensure larval development [25]. The fact that C. panamensis was recorded across all sampling sites, despite the marked turnover in forest types, suggests that its distribution is determined by these microclimatic thresholds rather than by the presence of specific host plants. Temperature and humidity are known to influence Scolytinae physiology and development [1,71], but their independent effects cannot be disentangled from elevation in this study. Hulcr et al. (2008) [73] reported that environmental variables, including temperature and humidity, play a more significant role in the occurrence of species of Scolytinae when considered as a composite variable, defined as seasonality, than when considered as independent variables.
The congruence between environmental clustering and assemblage structure, particularly at high elevations, indicates that climatic filtering contributes to assemblage differentiation. Because climatic variables also structure plant communities and act as limiting factors along environmental gradients [73], indirect vegetation-mediated effects likely reinforce the observed patterns in Scolytinae diversity.

4.5. Conservation Perspectives

The pronounced species turnover observed in Scolytinae communities on Tacaná Volcano indicates that each elevational band contributes uniquely to regional diversity. Because assemblages are structured primarily by species replacement rather than nested subsets, the loss or alteration of any elevational zone could result in disproportionate biodiversity loss. Montane systems are particularly vulnerable to climate change, as upward shifts in temperature may compress or eliminate high-elevation habitats, reducing available area for cold-adapted species and potentially disrupting specialized plant–insect interactions. Climate change is also known to alter the population dynamics, phenology, and distribution of bark and Ambrosia beetles by modifying thermal regimes and host tree stress, often facilitating range expansions and changes in outbreak dynamics [74]. Given that climatic variables also structure vegetation dynamics along the gradient [75], climate-driven shifts in plant communities are likely to cascade into associated Scolytinae assemblages. Therefore, conservation strategies should prioritize the protection of the full elevational gradient to maintain connectivity, facilitate elevational dispersal, and preserve the environmental heterogeneity that underpins species turnover. Long-term monitoring across elevations will be essential to detect range shifts, assemblage reassembly, and potential biodiversity contraction under ongoing climate change.

4.6. Study Limitations and Scope

This study was conducted along a single elevational transect with unequal elevational intervals and varying sampling completeness. Vegetation type, elevation, and climatic variables were strongly correlated, limiting our ability to disentangle their independent effects. In addition, trap types are likely biased captures toward Ambrosia beetles. Therefore, our conclusions are restricted to describing patterns of composition, alpha and beta diversity, and their associations with environmental variation along this gradient. Broader generalizations beyond Tacaná Volcano require replicated gradients and study designs that explicitly evaluate climatic and habitat variables independently.

5. Conclusions

Scolytinae assemblages on Tacaná Volcano showed clear structuring along the elevational gradient, with distinct assemblages at low, mid, and high elevations driven primarily by species turnover. Species richness peaked at intermediate elevations, whereas abundance decreased with elevation, indicating contrasting responses of diversity components along the gradient. Although abundance was associated with temperature and dew point, these variables covaried with elevation and vegetation, suggesting that assemblage patterns are shaped by integrated environmental conditions rather than by single drivers. These findings highlight the role of elevational gradients as environmental filters that structure Scolytinae assemblages, providing a robust framework for future studies to evaluate the mechanisms underlying these patterns.

Author Contributions

Conceptualization, M.P.-S. and F.A.-T.; methodology, M.P.-S., R.J.C.-L., A.D.-C. and F.A.-T.; formal analysis, R.J.C.-L., A.D.-C. and F.A.-T.; investigation, M.P.-S. and R.J.C.-L.; resources, F.A.-T.; data curation, M.P.-S.; writing—original draft preparation, M.P.-S.; writing—review and editing, R.J.C.-L., A.D.-C. and F.A.-T.; visualization, M.P.-S. and F.A.-T.; project administration, A.C.-R. and F.A.-T.; funding acquisition, A.C.-R. and F.A.-T. All authors have read and agreed to the published version of the manuscript.

Funding

The present research was funded by “Una aproximación integrativa para el estudio de la diversidad de escarabajos ambrosiales (Curculionidae: Scolytinae) de la Reserva de la Biósfera Volcán Tacaná: diversidad taxonómica, morfológica, genética y asociaciones simbióticas” (PAPIIT-UNAM, IN223924) and “Documentación sistematizada de la riqueza biótica de México para la generación de conocimiento científico y la promoción de su apropiación social” (PRONAII-2024-3).

Institutional Review Board Statement

Not applicable.

Data Availability Statement

The original contributions presented in the study are included in the article; further inquiries can be directed to the corresponding author.

Acknowledgments

The authors express their gratitude to the local communities and administrators of the Tacaná Volcano region for their invaluable support and facilities provided during the fieldwork, specifically Finca Alianza, Ejido El Águila, Ejido Benito Juárez El Plan, Chiquihuites, and Parador Papales. We also extend our thanks to the anonymous reviewers and the Editorial Board for their insightful comments and suggestions, which significantly contributed to the improvement of this manuscript. The authors would like to thank SECIHTI, especially M Pérez-Silva (CVU 493511), RJ Cancino-López (CVU 481167), and AR Dueñas-Cedillo (CVU 496686), for the funding of the postdoctoral program.

Conflicts of Interest

The authors declare no conflicts of interest.

References

  1. Jaworski, T.; Hilszczański, J. The effect of temperature and humidity changes on insects development their impact on forest ecosystems in the context of expected climate change. Leś. Pr. Badaw. 2013, 74, 345–355. [Google Scholar] [CrossRef] [Scilit]
  2. Buse, A.; Good, J.E.G.; Dury, S.; Perrins, C.M. Effects of elevated temperature and carbon dioxide on the nutritional quality of leaves of oak (Quercus robur L.) as food for the winter moth (Operophtera brumata L.). Funct. Ecol. 1998, 12, 742–749. [Google Scholar] [CrossRef] [Scilit]
  3. Bale, J.S.; Masters, G.J.; Hodkinson, I.D.; Awmack, C.; Bezemer, T.M.; Brown, V.K.; Butterfield, J.; Buse, A.; Coulson, J.C.; Farrar, J.; et al. Herbivory in global climate change research: Direct effects of rising temperature on insect herbivores. Glob. Change Biol. 2002, 8, 1–16. [Google Scholar] [CrossRef] [Scilit]
  4. Zhao, L.; Gao, R.; Liu, J.; Liu, L.; Li, R.; Men, L.; Zhang, Z. Effects of environmental factors on the spatial distribution pattern and diversity of insect communities along altitude gradients in Guandi Mountain, China. Insects 2023, 14, 224. [Google Scholar] [CrossRef] [Scilit] [PubMed]
  5. Hodkinson, I.D. Terrestrial insects along elevation gradients: Species and community responses to altitude. Biol. Rev. 2005, 80, 489–513. [Google Scholar] [CrossRef] [Scilit]
  6. Guo, Q.; Kelt, D.A.; Sun, Z.; Liu, H.; Hu, L.; Ren, H.; Wen, J. Global variation in elevational diversity patterns. Sci. Rep. 2013, 3, 3007. [Google Scholar] [CrossRef] [Scilit]
  7. Machac, A.; Janda, M.; Dunn, R.R.; Sanders, N.J. Elevational gradients in phylogenetic structure of ant communities reveal the interplay of biotic and abiotic constraints on diversity. Ecography 2011, 34, 363–371. [Google Scholar] [CrossRef] [Scilit]
  8. Willig, M.R.; Kaufman, D.M.; Stevens, R.D. Latitudinal gradients of biodiversity: Pattern, process, scale, and synthesis. Annu. Rev. Ecol. Evol. Syst. 2003, 34, 273–309. [Google Scholar] [CrossRef] [Scilit]
  9. Brehm, G.; Colwel, R.K.; Kluge, J. The role of environment and mid-domain effect on moth species richness along a tropical elevational gradient. Glob. Ecol. Biogeogr. 2007, 16, 205–219. [Google Scholar] [CrossRef] [Scilit]
  10. Mittelbach, G.G.; Schemske, D.W.; Cornell, H.V.; Allen, A.P.; Brown, J.M.; Bush, M.B.; Harrison, S.P.; Hurlbert, A.H.; Knowlton, N.; Lessios, H.A.; et al. Evolution and the latitudinal diversity gradient: Speciation, extinction and biogeography. Ecol. Lett. 2007, 10, 315–331. [Google Scholar] [CrossRef] [Scilit]
  11. Körner, C. The use of ‘altitude’ in ecological research. Trends Ecol. Evol. 2007, 22, 569–574. [Google Scholar] [CrossRef] [Scilit]
  12. Koleff, P.; Soberón, J.; Arita, H.T.; Arita, H.T.; Dávila, P.; Óscar, F.V.; Golubov, J.; Halffter, G.; Andrés, L.N.; Moreno, C.E.; et al. Patrones de diversidad espacial en grupos selectos de especies. In Capital Natural de México; Sarukhán, J., Ed.; CONABIO: Mexico city, Mexico, 2008; pp. 323–364. [Google Scholar]
  13. Economo, E.P.; Narula, N.; Friedman, N.R.; Weiser, M.D.; Guénard, B. Macroecology and macroevolution of the latitudinal diversity gradient in ants. Nat. Commun. 2018, 9, 1778. [Google Scholar] [CrossRef] [Scilit]
  14. Colwell, R.K.; Rahbek, C.; Gotelli, N.J. The mid-domain effect and species richness patterns: What have we learned so far? Am. Nat. 2004, 163, E1–E23. [Google Scholar] [CrossRef] [Scilit]
  15. Tello, J.S.; Myers, J.A.; Macia, M.J.; Fuentes, A.F.; Cayola, L.; Arellano, G.; Loza, M.I.; Torrez, V.; Cornejo, M.; Miranda, T.B.; et al. Elevational Gradients in β-Diversity Reflect Variation in the Strength of Local Community Assembly Mechanisms across Spatial Scales. PLoS ONE 2015, 10, e0121458. [Google Scholar] [CrossRef] [Scilit]
  16. Raffa, K.F.; Grégoire, J.C.; Lindgren, B.S. Natural History and Ecology of Bark Beetles. In Bark Beetles: Biology and Ecology of Native and Invasive Species; Vega, F.E., Hofstetter, R.W., Eds.; Academic Press: New York, NY, USA, 2015; pp. 1–40. [Google Scholar]
  17. Sandoval, R.C.; Cognato, A.I.; Righi, C.A. Bark and ambrosia beetle (Curculionidae: Scolytinae) diversity found in agricultural and fragmented forests in Piracicaba-SP, Brazil. Environ. Entomol. 2017, 46, 1254–1263. [Google Scholar] [CrossRef] [Scilit] [PubMed]
  18. Lázaro-Dzul, M.O.; Equihua-Martínez, A.; Romero-Nápoles, J.; González-Hernández, H.; Alvarado-Rosales, D.; Castañeda-Vildózola, A.; Espinosa, J.S. Fluctuación poblacional de Scolytinae (Coleoptera: Curculionidae) en huertos de aguacate (Persea americana Mill.) en Michoacán, México. Rev. Colomb. Entomol. 2023, 49, e12526. [Google Scholar] [CrossRef] [Scilit]
  19. Pérez-De la Cruz, M.; Hernández-May, M.A.; De la Cruz-Pérez, A.; Saúl, S.-S. Scolytinae y Platypodinae (Coleoptera: Curculionidae) de dos áreas de conservación en Tabasco, México. Rev. Biol. Trop. 2016, 64, 319–326. [Google Scholar] [CrossRef] [Scilit]
  20. Martínez, M.; Jaramillo, G.; Santana, A.; Gaibor, J.; Chóez, J.; Pacheco, R.; Casanova, L.; Zambrano, A.; Dumontet, S.; Marini, F.; et al. Effects of climate and host age on flight activity, infestation percentage, and intensity by Coptoborus ochromactonus (Coleoptera: Curculionidae: Scolytinae) in commercial balsa plantations of Ecuador. J. Econ. Entomol. 2020, 113, 824–831. [Google Scholar] [CrossRef] [Scilit]
  21. Yu, Y.; Li, L.; Yang, X.; Lin, W.; Han, Q.; Li, Z. Spatiotemporal distributions of Scolytinae beetles in the subtropical forests of Southern China. Diversity 2023, 15, 499. [Google Scholar] [CrossRef] [Scilit]
  22. Dong, Y.; Shepherd, S.; Stork, N.E.; Johnson, A.J.; Smith, S.M.; Wardhaugh, C.; Leponce, M.; Mogia, M.; Novotny, V.; Hulcr, J. Scolytinae beetle diversity along an altitudinal gradient in Papua New Guinea. Insect Conserv. Divers. 2025, 18, 552–566. [Google Scholar] [CrossRef] [Scilit]
  23. Martínez, M.; Cognato, A.I.; Guachambala, M.; Boivin, T. Bark and ambrosia beetle (Coleoptera: Curculionidae: Scolytinae) diversity in natural and plantation forests in Ecuador. Environ. Entomol. 2019, 48, 603–613. [Google Scholar] [CrossRef] [Scilit] [PubMed]
  24. Beaver, R.A. Host specificity of temperate and tropical animals. Nature 1979, 281, 139–141. [Google Scholar] [CrossRef] [Scilit]
  25. Wood, S.L. The bark and Ambrosia beetles of North and Central America (Coleoptera: Scolytinae), a taxonomic monograph. In Great Basin Naturalist Memoirs; No. 6; Brigham Young University: Provo, UT, USA, 1982; p. 1359. [Google Scholar]
  26. Lindgren, B.S.; Raffa, K.F. Evolution of tree killing in bark beetles (Coleoptera: Curculionidae): Trade-offs between the maddening crowds and a sticky situation. Can. Entomol. 2013, 145, 471–495. [Google Scholar] [CrossRef] [Scilit]
  27. Seidl, R.; Rammer, W. Climate change amplifies the interactions between wind and bark beetle disturbances in forest landscapes. Landsc. Ecol. 2017, 32, 1485–1498. [Google Scholar] [CrossRef] [Scilit]
  28. Skelton, J.; Jusino, M.A.; Carlson, P.S.; Smith, K.; Banik, M.T.; Lindner, D.L.; Palmer, J.M.; Hulcr, J. Relationships among wood-boring beetles, fungi, and the decomposition of forest biomass. Mol. Ecol. 2019, 28, 4971–4986. [Google Scholar] [CrossRef] [Scilit]
  29. Luo, F.; Meng, L.-Z.; Wang, J.; Liu, Y.-H. The patterns of co-occurrence variation are explained by the low dependence of bark beetles (Coleoptera: Scolytinae and Platypodinae) on hosts along altitude gradients. Front. Zool. 2022, 19, 10. [Google Scholar] [CrossRef] [Scilit]
  30. Cancino-López, R.J.; Moreno, C.E.; Contreras-Ramos, A. Diversity of lacewings (Neuroptera) in an altitudinal gradient of the Tacaná Volcano, Southern Mexico. Insects 2022, 13, 652. [Google Scholar] [CrossRef] [Scilit] [PubMed]
  31. Lookingbill, T.R.; Urban, D.L. Gradient analysis, the next generation: Towards more plant-relevant explanatory variables. Can. J. For. Res. 2005, 35, 1744–1753. [Google Scholar] [CrossRef] [Scilit]
  32. CONANP. Programa de Manejo Reserva de la Biosfera Volcán Tacaná, 1st ed.; SEMARNAT: Mexico City, Mexico, 2013; p. 204.
  33. García, E. Modificaciones al Sistema de Clasificación Climática de Köppen, 6th ed.; Instituto de Geografía, UNAM: Ciudad de México, México, 2004; pp. 1–71. [Google Scholar]
  34. Wood, S.L. Bark and Ambrosia Beetles of South America (Coleoptera: Scolytidae); Monte, L., Ed.; Bean Life Science Museum: Provo, UT, USA; Brigham Young University: Provo, UT, USA, 2007; p. 900. [Google Scholar]
  35. Pérez-Silva, M.; Equihua-Martínez, A.; Atkinson, T.H.; Romero-Nápoles, J.; López-Buenfil, J.A. Claves ilustradas para la identificación de géneros y especies de la tribu Xyleborini (Curculionidae: Scolytinae) presentes en México. Rev. Mex. Biodivers. 2021, 92, e923817. [Google Scholar] [CrossRef] [Scilit]
  36. Atkinson, T.H. New species, new records and synonymy of Mexican Corthylus Erichson, 1834 (Coleoptera: Curculionidae: Scolytinae). Insecta Mundi 2020, 792, 1–25. [Google Scholar]
  37. Atkinson, T.H. Bark and Ambrosia beetles of the Americas. 2025. Available online: https://www.barkbeetles.info/about.php (accessed on 25 February 2026).
  38. Zar, J.H. Biostatistical Analysis, 5th ed.; Prentice Hall: Hoboken, NJ, USA, 2010; 944p. [Google Scholar]
  39. Hammer, Ø.; Harper, D.A.T.; Ryan, P.D. PAST: Paleontological statistics software package for education and data analysis. Palaeontol. Electron. 2001, 4, 9. [Google Scholar]
  40. Colwell, R.K. EstimateS, Version 9.1.0; Statistical Estimation of Species Richness and Shared Species from Samples; University of Connecticut: Storrs, CT, USA, 2013; Available online: http://purl.oclc.org/estimates (accessed on 12 January 2025).
  41. Jost, L. Entropy and diversity. Oikos 2006, 113, 363–375. [Google Scholar] [CrossRef] [Scilit]
  42. Chao, A.; Ma, K.H.; Hsieh, T.C. iNEXT Online: Software for Interpolation and Extrapolation of Species Diversity. Program and User’s Guide 2016. Available online: http://chao.stat.nthu.edu.tw/wordpress/software_download/inext-online/ (accessed on 12 January 2025).
  43. Baselga, A. Partitioning abundance-based multiple-site dissimilarity into components: Balanced variation in abundance and abundance gradients. Methods Ecol. Evol. 2017, 8, 799–808. [Google Scholar] [CrossRef] [Scilit]
  44. Baselga, A.; Orme, C.D.L. Betapart: An R package for the study of beta diversity. Methods Ecol. Evol. 2012, 3, 808–812. [Google Scholar] [CrossRef] [Scilit]
  45. Shapiro, S.S.; Wilk, M.B. An analysis of variance test for normality (complete samples). Biometrika 1965, 52, 591–611. [Google Scholar] [CrossRef] [Scilit]
  46. Atkinson, T.H.; Equihua, M.A. Biology of Scolytidae and Platypodidae (Coleoptera) of a tropical rain forest in southeastern Mexico with an annotated checklist of species. Ann. Entomol. Soc. Am. 1986, 79, 414–423. [Google Scholar] [CrossRef] [Scilit]
  47. Atkinson, T.H.; Ibarra, J.L.A. Corrections and additions to the checklist of bark and Ambrosia beetles (Coleoptera: Curculionidae: Scolytinae, Platypodinae) of mesic montane forest in Xalapa, Veracruz, México. Coleopt. Bull. 2021, 75, 227–239. [Google Scholar] [CrossRef] [Scilit]
  48. Pérez-De la Cruz, M.; Zavaleta-Bastar, P.G.; De la Cruz-Pérez, A. Aproximación al conocimiento de la diversidad de Scolytinae y Platypodinae (Coleoptera: Curculionidae) asociados a selvas de Tabasco, México. Entomotropica 2015, 30, 201–211. [Google Scholar]
  49. Noguera-Martínez, F.A.; Atkinson, T.H. Biogeography and biology of bark and ambrosia beetles (Coleoptera: Scolytidae and Platypodidae) of a mesic montane forest in Mexico, with an annotated checklist of species. Ann. Entomol. Soc. Am. 1990, 83, 453–466. [Google Scholar] [CrossRef] [Scilit]
  50. Lázaro-Dzul, M.O.; Equihua-Martínez, A.; Romero-Nápoles, J.; Mayorga-Castañeda, J.M.; Valdés-Rodríguez, A.S. Diversity of Scolytinae (Coleoptera: Curculionidae) at three sites in the central avocado-producing region of Michoacán, México. Coleopt. Bull. 2020, 74, 454–462. [Google Scholar] [CrossRef] [Scilit]
  51. Uhey, D.A.; Hofstetter, R.W.; Whitham, T.G. Elevational patterns of ground-dwelling arthropod diversity and community turnover on the Colorado Plateau. Environ. Entomol. 2021, 50, 337–348. [Google Scholar] [CrossRef] [Scilit]
  52. Noriega, J.A.; Realpe, E. Altitudinal turnover of species in a Neotropical peripheral mountain system: A case study with dung beetles (Coleoptera: Aphodiinae and Scarabaeinae). Environ. Entomol. 2018, 47, 1376–1387. [Google Scholar] [CrossRef] [Scilit] [PubMed]
  53. Maveety, S.; Browne, R.; Erwin, T.L. Carabidae diversity along an altitudinal gradient in a Peruvian cloud forest (Coleoptera). ZooKeys 2011, 147, 651–666. [Google Scholar] [CrossRef] [Scilit] [PubMed]
  54. Escobar, F.; Lobo, J.M.; Halffter, G. Altitudinal variation of Dung Beetle (Scarabaeidae: Scarabaeinae) assemblages in the Colombian Andes. Glob. Ecol. Biogeogr. 2005, 14, 327–337. [Google Scholar] [CrossRef] [Scilit]
  55. Marini, L.; Ayres, M.P.; Battisti, A.; Faccoli, M. Climate affects severity and altitudinal distribution of outbreaks in an eruptive bark beetle. Clim. Change 2012, 115, 327–341. [Google Scholar] [CrossRef] [Scilit]
  56. González-Megías, A.; Sánchez-Piñero, F. Factors determining beetle richness and composition along an altitudinal gradient in the high mountains of the Sierra Nevada National Park (Spain). Écoscience 2008, 15, 429–441. [Google Scholar] [CrossRef] [Scilit]
  57. Miller, D.R.; Rabaglia, R.J. Ethanol and (-)-α-pinene: Attractant kairomones for bark and Ambrosia beetles in the southeastern US. J. Chem. Ecol. 2009, 35, 435–448. [Google Scholar] [CrossRef] [Scilit] [PubMed]
  58. Villaseñor, J.L. El Bosque Húmedo de Montaña en México Y Sus Plantas Vasculares: Catálogo Florístico-Taxonómico; CONABIO-UNAM: México City, Mexico, 2010.
  59. Ávila-Sánchez, P.; Sánchez-González, A.; Catalán-Heverástico, C.; Almazán Núñez, R.C. Patrones de riqueza y diversidad de especies vegetales en un gradiente altitudinal en Guerrero, México. Polibotánica 2018, 45, 101–113. [Google Scholar]
  60. Hulcr, J.; Novotny, V.; Maurer, B.A.; Cognato, A.I. Low beta diversity of Ambrosia beetles (Coleoptera: Curculionidae: Scolytinae and Platypodinae) in lowland rainforests of Papua New Guinea. Oikos 2008, 117, 214–222. [Google Scholar] [CrossRef] [Scilit]
  61. Dole, S.A.; Hulcr, J.; Cognato, A.I. Species-rich bark and ambrosia beetle fauna (Coleoptera, Curculionidae, Scolytinae) of the Ecuadorian Amazonian Forest Canopy. ZooKeys 2021, 1044, 797–813. [Google Scholar] [CrossRef] [Scilit]
  62. Perry, J.; Lojka, B.; Quiñones, R.L.G.; Van Damme, P.; Houška, J.; Banout, J. How natural forest conversion affects insect biodiversity in the Peruvian Amazon: Can agroforestry help? Forests 2016, 7, 82. [Google Scholar] [CrossRef] [Scilit]
  63. Boland, J.M. The impact of an invasive ambrosia beetle on the riparian habitats of the Tijuana River Valley, California. PeerJ 2016, 4, e2141. [Google Scholar] [CrossRef] [Scilit]
  64. Hulcr, J.; Mogia, M.; Isua, B.; Novotny, V. Host specificity of ambrosia and bark beetles (Col., Curculionidae: Scolytinae and Platypodinae) in a New Guinea rainforest. Ecol. Entomol. 2007, 32, 762–772. [Google Scholar] [CrossRef] [Scilit]
  65. Pérez-Hernández, C.X.; Zaragoza-Caballero, S. Diversidad alfa y beta de Cantharidae (Coleoptera) en el bosque tropical caducifolio de la vertiente del Pacífico mexicano. Rev. Mex. Biodivers. 2015, 86, 771–781. [Google Scholar] [CrossRef] [Scilit]
  66. Calderón-Patrón, J.M.; Moreno, C.E.; Zuria, I. La diversidad beta: Medio siglo de avances. Rev. Mex. Biodivers. 2012, 83, 879–891. [Google Scholar] [CrossRef]
  67. Wen, Z.; Feijó, A.; Ke, J.; He, X.; Cheng, J.; Ge, D.; Tian, T.; Xia, L.; Wu, Y.; Ran, J.; et al. Altitudinal dispersal process drives community assembly of montane small mammals. Ecography 2022, 2022, e06318. [Google Scholar] [CrossRef] [Scilit]
  68. Leibold, M.A.; Holyoak, M.; Mouquet, N.; Amarasekare, P.; Chase, J.M.; Hoopes, M.F.; Holt, R.D.; Shurin, J.B.; Law, R.; Tilman, D.; et al. The metacommunity concept: A framework for multi-scale community ecology. Ecol. Lett. 2004, 7, 601–613. [Google Scholar] [CrossRef] [Scilit]
  69. Mittelbach, G.G.; McGill, B.J. Community assembly and species traits. In Community Ecology, 2nd ed.; Mittelbach, G.G., McGill, B.J., Eds.; Oxford University Press: Oxford, UK, 2019; pp. 230–246. [Google Scholar] [CrossRef] [Scilit]
  70. Peng, Y.; Buranapanichpan, A.; Kamata, N. Succession of Ambrosia beetles colonizing the logs of fallen alder and birch trees. Insects 2022, 13, 223. [Google Scholar] [CrossRef] [Scilit] [PubMed]
  71. Rudinsky, J.A. Ecology of Scolytidae. Annu. Rev. Entomol. 1962, 7, 327–348. [Google Scholar] [CrossRef] [Scilit]
  72. Kirkendall, L.R.; Biedermann, P.H.W.; Jordal, B.H. Evolution and diversity of bark and Ambrosia beetles. In Bark Beetles: Biology and Ecology of Native and Invasive Species; Vega, F.E., Hofstetter, R.W., Eds.; Academic Press: New York, NY, USA, 2015; pp. 85–156. [Google Scholar]
  73. Hulcr, J.; Beaver, R.A.; Puranasakul, W.; Dole, S.A.; Sonthichai, S. A comparison of bark and ambrosia beetle communities in two forest types in Northern Thailand (Coleoptera: Curculionidae: Scolytinae and Platypodinae). Environ. Entomol. 2008, 37, 1461–1470. [Google Scholar] [CrossRef] [Scilit]
  74. Battisti, A.; Larsson, S. Climate change and forest insect pests. In Forest Entomology and Pathology: Volume 1: Entomology; Coyle, D.R., Gandhi, K.J.K., Eds.; Springer Nature: Cham, Switzerland, 2023; pp. 773–787. [Google Scholar]
  75. Sánchez-González, A.; López-Mata, L. Plant species richness and diversity along an altitudinal gradient in the Sierra Nevada, Mexico. Divers. Distrib. 2005, 11, 567–575. [Google Scholar] [CrossRef] [Scilit]
Figure 1. Vegetation structure of the collection sites along the elevational gradient at the Tacana Volcano: (a) Finca Alianza: evergreen tropical forest modified by coffee plantations (S1); (b) Ejido El Aguila: Mesic montane forest; modified by coffee plantations (S2); (c) Ejido Benito Juárez El Plan: Conserved mesic montane forest (S3); (d) Cantón Chiquihuites: transition zone of mesic montane forest–oak forest (S4); and (e) Parador Papales-La Cabaña: oak–pine forest (S5).
Diversity 18 00212 g001
Figure 2. Types of traps used for collection in the present study: (a) black light trap, (b) black and white light screen traps, (c) Malaise traps, (d) interception traps, and (e) yellow-plate traps.
Diversity 18 00212 g002
Figure 3. Rank abundance curves for Scolytinae species on Tacaná Volcano. S1: Finca Alianza: Evergreen tropical forest–coffee plantations; S2: Ejido El Águila: Mesic montane forest–coffee plantations; S3: Ejido Benito Juárez El Plan: Mesic montane forest; S4: Cantón Chiquihuites: Mesic montane forest–oak forest; S5: Paradores Papales-La Cabaña: oak–pine forest; Tv: Tacaná volcano (all sites combined). Species: A. Xyleborus affinis, B. Corthylus panamensis, C. Xylosandrus morigerus, D. Xyleborus bispinatus, E. Xyleborus ferrugineus, F. Corthylus collaris, G. Corthylus villus, H. Corthylus comatus, I. Corthyloxiphus sp. 1, J. Monarthrum sp. 7, K. Monarthrum hoegei, L. Gnathotrichus consentaneus, M. Glochinocerus gemellus, and N. Tricolus sp. 6.
Diversity 18 00212 g003
Figure 4. Scolytinae species accumulation curve, S: Number of species observed, ACE: Abundance Coverage Estimator, and Chao1: non-parametric richness estimator; Tv: Tacaná volcano (all sites combined), S1: Finca Alianza: Evergreen tropical forest–coffee plantations; S2: Ejido El Águila: Mesic montane forest–coffee plantations; S3: Ejido Benito Juárez El Plan: Mesic montane forest; S4: Cantón Chiquihuites: Mesic montane–oak forest; S5: Paradores Papales-La Cabaña: oak–pine forest.
Diversity 18 00212 g004
Figure 5. Canonical Correspondence Analysis (CCA) plot of the relationship between Scolytinae species abundance and environmental variables (A-RH: average relative humidity, Min-RH: minimum relative humidity, Mx-RH: maximum relative humidity, A-Temp: average temperature, Min-Temp: minimum temperature, Mx-Temp: maximum temperature, and DP: dew point). (a) Finca Alianza: evergreen tropical forest–coffee plantations, (b) Ejido El Águila: Mesic montane forest–coffee plantations, (c) Ejido Benito Juárez El Plan: Mesic montane forest, (d) Cantón Chiquihuites: Mesic montane forest–oak forest, and (e) Paradores Papales-La Cabaña: oak–pine forest. A. Xyleborus affinis, B. Corthylus panamensis, C. Xylosandrus morigerus, D. Xyleborus bispinatus, E. Xyleborus ferrugineus, F. Xyleborus torquatus, G. Araptus laevigatus, H. Corthylus villus, I. Corthylus comatus, J. Euwallacea posticus, K. Microcorthylus pusillus, L. Monarthrum sp. 7, M. Monarthrum hoegei, N. Gnathotrichus consentaneus, O. Ambrosiodmus rusticus, P. Glochinocerus gemellus, and Q. Tricolus sp. 6.
Diversity 18 00212 g005
Figure 6. Species diversity, standardized values to the sample coverage (Sc = 0.95); error bars are 95% confidence intervals (p < 0.05). (a) Order 0; (b) Order 1, and (c) Order 2. S1: Finca Alianza: Evergreen tropical forest–coffee plantations; S2: Ejido El Águila: Mesic montane forest–coffee plantations; S3: Ejido Benito Juárez El Plan: Mesic montane forest; S4: Cantón Chiquihuites: Mesic montane forest–oak forest; S5: Paradores Papales-La Cabaña: oak–pine forest.
Diversity 18 00212 g006
Figure 7. Beta diversity of the Scolytinae community of the Tacaná Volcano, based on the Bray–Curtis index (βBC) with its two components: balanced variation in abundance (βBC.BAL) and abundance gradient (βBC.GRA). S1: Finca Alianza: Evergreen tropical forest–coffee plantations; S2: Ejido El Águila: Mesic montane forest–coffee plantations; S3: Ejido Benito Juárez El Plan: Mesic montane forest; S4: Cantón Chiquihuites: Mesic montane forest–oak forest; S5: Paradores Papales-La Cabaña: oak–pine forest.
Diversity 18 00212 g007
Figure 8. Scatter plots corresponding to principal coordinate analyses of bark beetle community data from Tacaná Volcano, Chiapas. (a) Analysis based on abundance matrix and Bray–Curtis similarity index; (b) analysis based on presence–absence matrix and Jaccard similarity index.
Diversity 18 00212 g008
Figure 9. “Pool” and local communities of bark beetles from Tacaná Volcano. (a) Two-way cluster analysis of pool species community based on presence–absence matrix and Jaccard index; Branch support was based on 1000 bootstrap replicates. (b) Venn diagram among local communities recognized in two-way cluster analysis.
Diversity 18 00212 g009
Figure 10. Environmental variation across the five sampling sites on the Tacaná Volcano. (a) Principal Component Analysis (PCA) showing the ordination of the sites based on environmental variables. For the univariate analysis, box plots of environmental variables per site are represented on the horizontal and vertical axes, respectively: (b) temperature, (c) dew point, and (d) relative humidity. The vertical line within each box indicates the median, the box represents the interquartile range, and the whiskers show the non-outlier range. Sampling sites: S1: Finca Alianza; S2: Ejido El Águila; S3: Ejido Benito Juárez El Plan; S4: Cantón Chiquihuites; and S5: Paradores Papales-La Cabaña.
Diversity 18 00212 g010
Table 1. List of Scolytinae species recorded across sampling sites along the elevational gradient of Tacaná Volcano. Feeding habits (Fh): H: herbiphagous; M: myelophagous; P: phloeophagous; S: spermatophagous; My: mycetophagous; X: xylophagous. S1: Finca Alianza: Evergreen tropical forest–coffee plantations; S2: Ejido El Águila: Mesic montane forest–coffee plantations; S3: Ejido Benito Juárez El Plan: Mesic montane forest; S4: Cantón Chiquihuites: Mesic montane forest–oak forest; S5: Paradores Papales-La Cabaña: oak–pine forest.
SpeciesFhS1S2S3S4S5Total
Tribe Corthylini: Corthylina
           Amphicranus sp. 1My002002
           Corthylocurus aguacatensis (Schedl)My300003
           Corthylocurus mexicanus (Schedl)My1281012
           Corthyloxiphus aztecus (Bright)My0009211
           Corthyloxiphus sp. 1My00266840
           Corthylus collaris BlandfordMy03313441
           Corthylus comatus BlandfordMy322549922200
           Corthylus luridus BlandfordMy010203
           Corthylus panamensis BlandfordMy6221843633211175
           Corthylus papulans EichhoffMy000101
           Corthylus sp. 1My001001
           Corthylus sp. 2My001001
           Corthylus sp. 3My000066
           Corthylus sp. 4My053008
           Corthylus sp. 5My003047
           Corthylus sp. 6My0004610
           Corthylus villus BrightMy0261363075
           Glochinocerus gemellus BlandfordMy00011819
           Glochinocerus retusipennis BlandfordMy0062816
           Gnathotrichus consentaneus BlandfordMy0002992121
           Gnathotrichus sp. 1My000101
           Microcorthylus debilis WoodMy0004812
           Microcorthylus pusillus WoodMy1972120
           Monarthrum bidentatum WoodMy00110011
           Monarthrum egenum (Blandford)My100001
           Monarthrum gracilior (Schedl)My204006
           Monarthrum hoegei (Blandford)My001811029
           Monarthrum robustum (Schedl)My4283017
           Monarthrum laterale (Eichhoff)My001719
           Monarthrum sp. 1My004004
           Monarthrum sp. 2My001001
           Monarthrum sp. 3My000101
           Monarthrum sp. 4My022004
           Monarthrum sp. 5My000101
           Monarthrum sp. 6My000101
           Monarthrum sp. 7My002323046
           Monarthrum sp. 8My003104
           Monarthrum sp. 9My001001
           Tricolus amplus WoodMy030003
           Tricolus inornatus WoodMy102003
           Tricolus nodifer BlandfordMy2470013
           Tricolus ovicollis BlandfordMy3044011
           Tricolus simplices WoodMy150006
           Tricolus sp. 1My001001
           Tricolus sp. 2My001001
           Tricolus sp. 3My000101
           Tricolus sp. 4My005005
           Tricolus sp. 5My000033
           Tricolus sp. 6My00011415
           Tricolus sp. 7My041005
           Tricolus sp. 8My350008
Tribe Corthylini: Pityophthorina
           Araptus laevigatus (Eggers)S900009
           Pityophthorus sp. 1P004004
           Pityophthorus sp. 2P001001
           Pityophthorus sp. 3P000112
           Pityophthorus sp. 4P000011
           Scolytodes sp. 1P000101
           Scolytodes sp. 2P001001
Tribe Drycoetini
           Cocotrypes advena (Blandford)S8310012
           Cocotrypes distinctus (Motschulsky)S010001
           Dendrocranulus maurus (Blandford)H001001
Tribe Hexacolini
           Scolytodes atratus (Blandford)P001001
           Scolytodes sp. 1P000101
           Scolytodes sp. 2P001001
Tribe Hylurgini
           Xylechinus sp. 1P000101
Tribe Ipini
           Premnobius cavipennis EichhoffMy200002
Tribe Micracidini
           Hylocurus sp. 1X000033
           Micrasicella sp. 1M000022
Tribe Phloeotribini
           Phloeotribus nubilus BlandfordP001001
Tribe Xyleborini
           Ambrosiodmus obliquus (LeConte)My001001
           Ambrosiodmus rusticus (Wood)My00111012
           Ambrosiodmus spinosus Pérez et al. [35]My510006
           Euwallacea posticus EichhoffMy21300015
           Sampsonius dampfi SchedlMy402006
           Xyleborinus gracilis (Eichhoff)My010001
           Xyleborus affinis EichhoffMy649136000785
           Xyleborus bispinatus EichhoffMy23410028
           Xyleborus ferrugineus (Fabricius)My14100015
           Xyleborus squamulatus EichhoffMy051006
           Xyleborus titubanter SchedlMy003003
           Xyleborus torquatus EichhoffMy13100115
           Xylosandrus morigerus (Blandford)My55510061
Total species 242646322282
Total specimens 14314782795712362995
Table 2. Variation of percentages of the first two axes in the CCA, between environmental variables and the occurrence of Scolytinae species. S1: Finca Alianza: Evergreen tropical forest–coffee plantations; S2: Ejido El Águila: Mesic montane forest–coffee plantations; S3: Ejido Benito Juárez El Plan: Mesic montane forest; S4: Cantón Chiquihuites: Mesic montane–oak forest; S5: Paradores Papales-La Cabaña: oak–pine forest.
SiteAxis 1Axis 2Total
S140.86%36.25% *77.11%
S257.18%36.25%93.43%
S360.04%19.55%79.59%
S455.04%26.78%81.82%
S544.17%30.39%74.56%
* Axis with significant differences (p ≤ 0.05).
Disclaimer/Publisher’s Note: The statements, opinions and data contained in all publications are solely those of the individual author(s) and contributor(s) and not of MDPI and/or the editor(s). MDPI and/or the editor(s) disclaim responsibility for any injury to people or property resulting from any ideas, methods, instructions or products referred to in the content.