Article

Spatial and Temporal Activity Patterns of Six Ungulate Species in the Anzihe Nature Reserve, Giant Panda National Park, China: A Camera-Trap Study

1
Sichuan Academy of Forestry, Chengdu 610081, China
2
Chengdu Zhuzhijingran Planning and Design Co., Ltd., Chengdu 610066, China
3
Laboratory for Ex Situ Conservation and Resource Utilization of Montane Plants, Chengdu Botanical Garden (Chengdu Park City Botanical Science Research Institute), Chengdu 610083, China
4
Giant Panda National Park Chengdu Administration, Chengdu 610094, China
5
Offfce of Academic Affairs, Chengdu University, Chengdu 610106, China
*
Authors to whom correspondence should be addressed.
Diversity 2026, 18(3), 186; https://doi.org/10.3390/d18030186
Submission received: 20 January 2026 / Revised: 5 March 2026 / Accepted: 11 March 2026 / Published: 19 March 2026

Abstract

The study used camera traps (2946 trap days, 60 sites) to investigate the diversity, habitat use, and activity rhythms of six sympatric ungulates in a montane ecosystem of southwestern China: tufted deer (Elaphodus cephalophus), Chinese goral (Naemorhedus caudatus), Chinese serow (Naemorhedus griseus), sambar (Rusa unicolor), wild boar (Sus scrofa), and blue sheep (Pseudois nayaur). Relative abundance indices indicated that sambar were most frequent, while blue sheep and Chinese goral were least common. Species showed distinct elevational, slope, and vegetation preferences, suggesting spatial niche segregation. Kernel density estimates revealed predominantly diurnal activity, with bimodal patterns for tufted deer, sambar, and Chinese goral, and unimodal peaks for blue sheep, wild boar, and Chinese serow. Temporal overlap was highest between sambar and tufted deer, and lowest between tufted deer and blue sheep. These results demonstrate spatial and temporal partitioning as key mechanisms enabling ungulate coexistence and underscore the importance of conserving heterogeneous montane habitats.

1. Introduction

The spatial distribution and activity rhythms of wildlife provide insights into habitat use, ecological interactions, and mechanisms of coexistence [1,2]. Ungulates are a key group in terrestrial ecosystems. They act as primary consumers, influence vegetation structure, and support predator populations [3,4]. Patterns of habitat use and temporal activity in ungulates can reduce interspecific competition and reflect adaptations to environmental and anthropogenic pressures [5,6,7]. Niche differentiation theory suggests that sympatric species must reduce competition by partitioning resources along spatial, temporal, or dietary dimensions [8,9]. Studies on carnivore and herbivore guilds have shown that spatial avoidance and temporal segregation are effective strategies that allow coexistence [10,11,12]. In particular, camera-trap studies have provided evidence that both mesocarnivores and ungulates exhibit flexible behavioral adjustments to reduce overlap, especially in landscapes with limited resources or high human disturbance [13,14,15].
Camera trapping has become one of the most effective methods for investigating wildlife ecology. It enables long-term, non-invasive monitoring of multiple species in different habitats, and has been widely applied to assess distribution, occupancy, and activity patterns [16,17,18]. This approach has been successful in revealing coexistence mechanisms in carnivores and ungulates through spatio-temporal analyses [13,19,20]. Most previous studies in China have focused on flagship species, while comprehensive research on sympatric ungulates remains limited [21,22,23]. The present study aims to investigate six sympatric ungulate species, using camera traps, and addresses three objectives: (i) to describe their spatial distribution across the study area, (ii) to analyze their daily activity rhythms, and (iii) to explore how spatio-temporal patterns contribute to coexistence.

2. Materials and Methods

2.1. Study Area

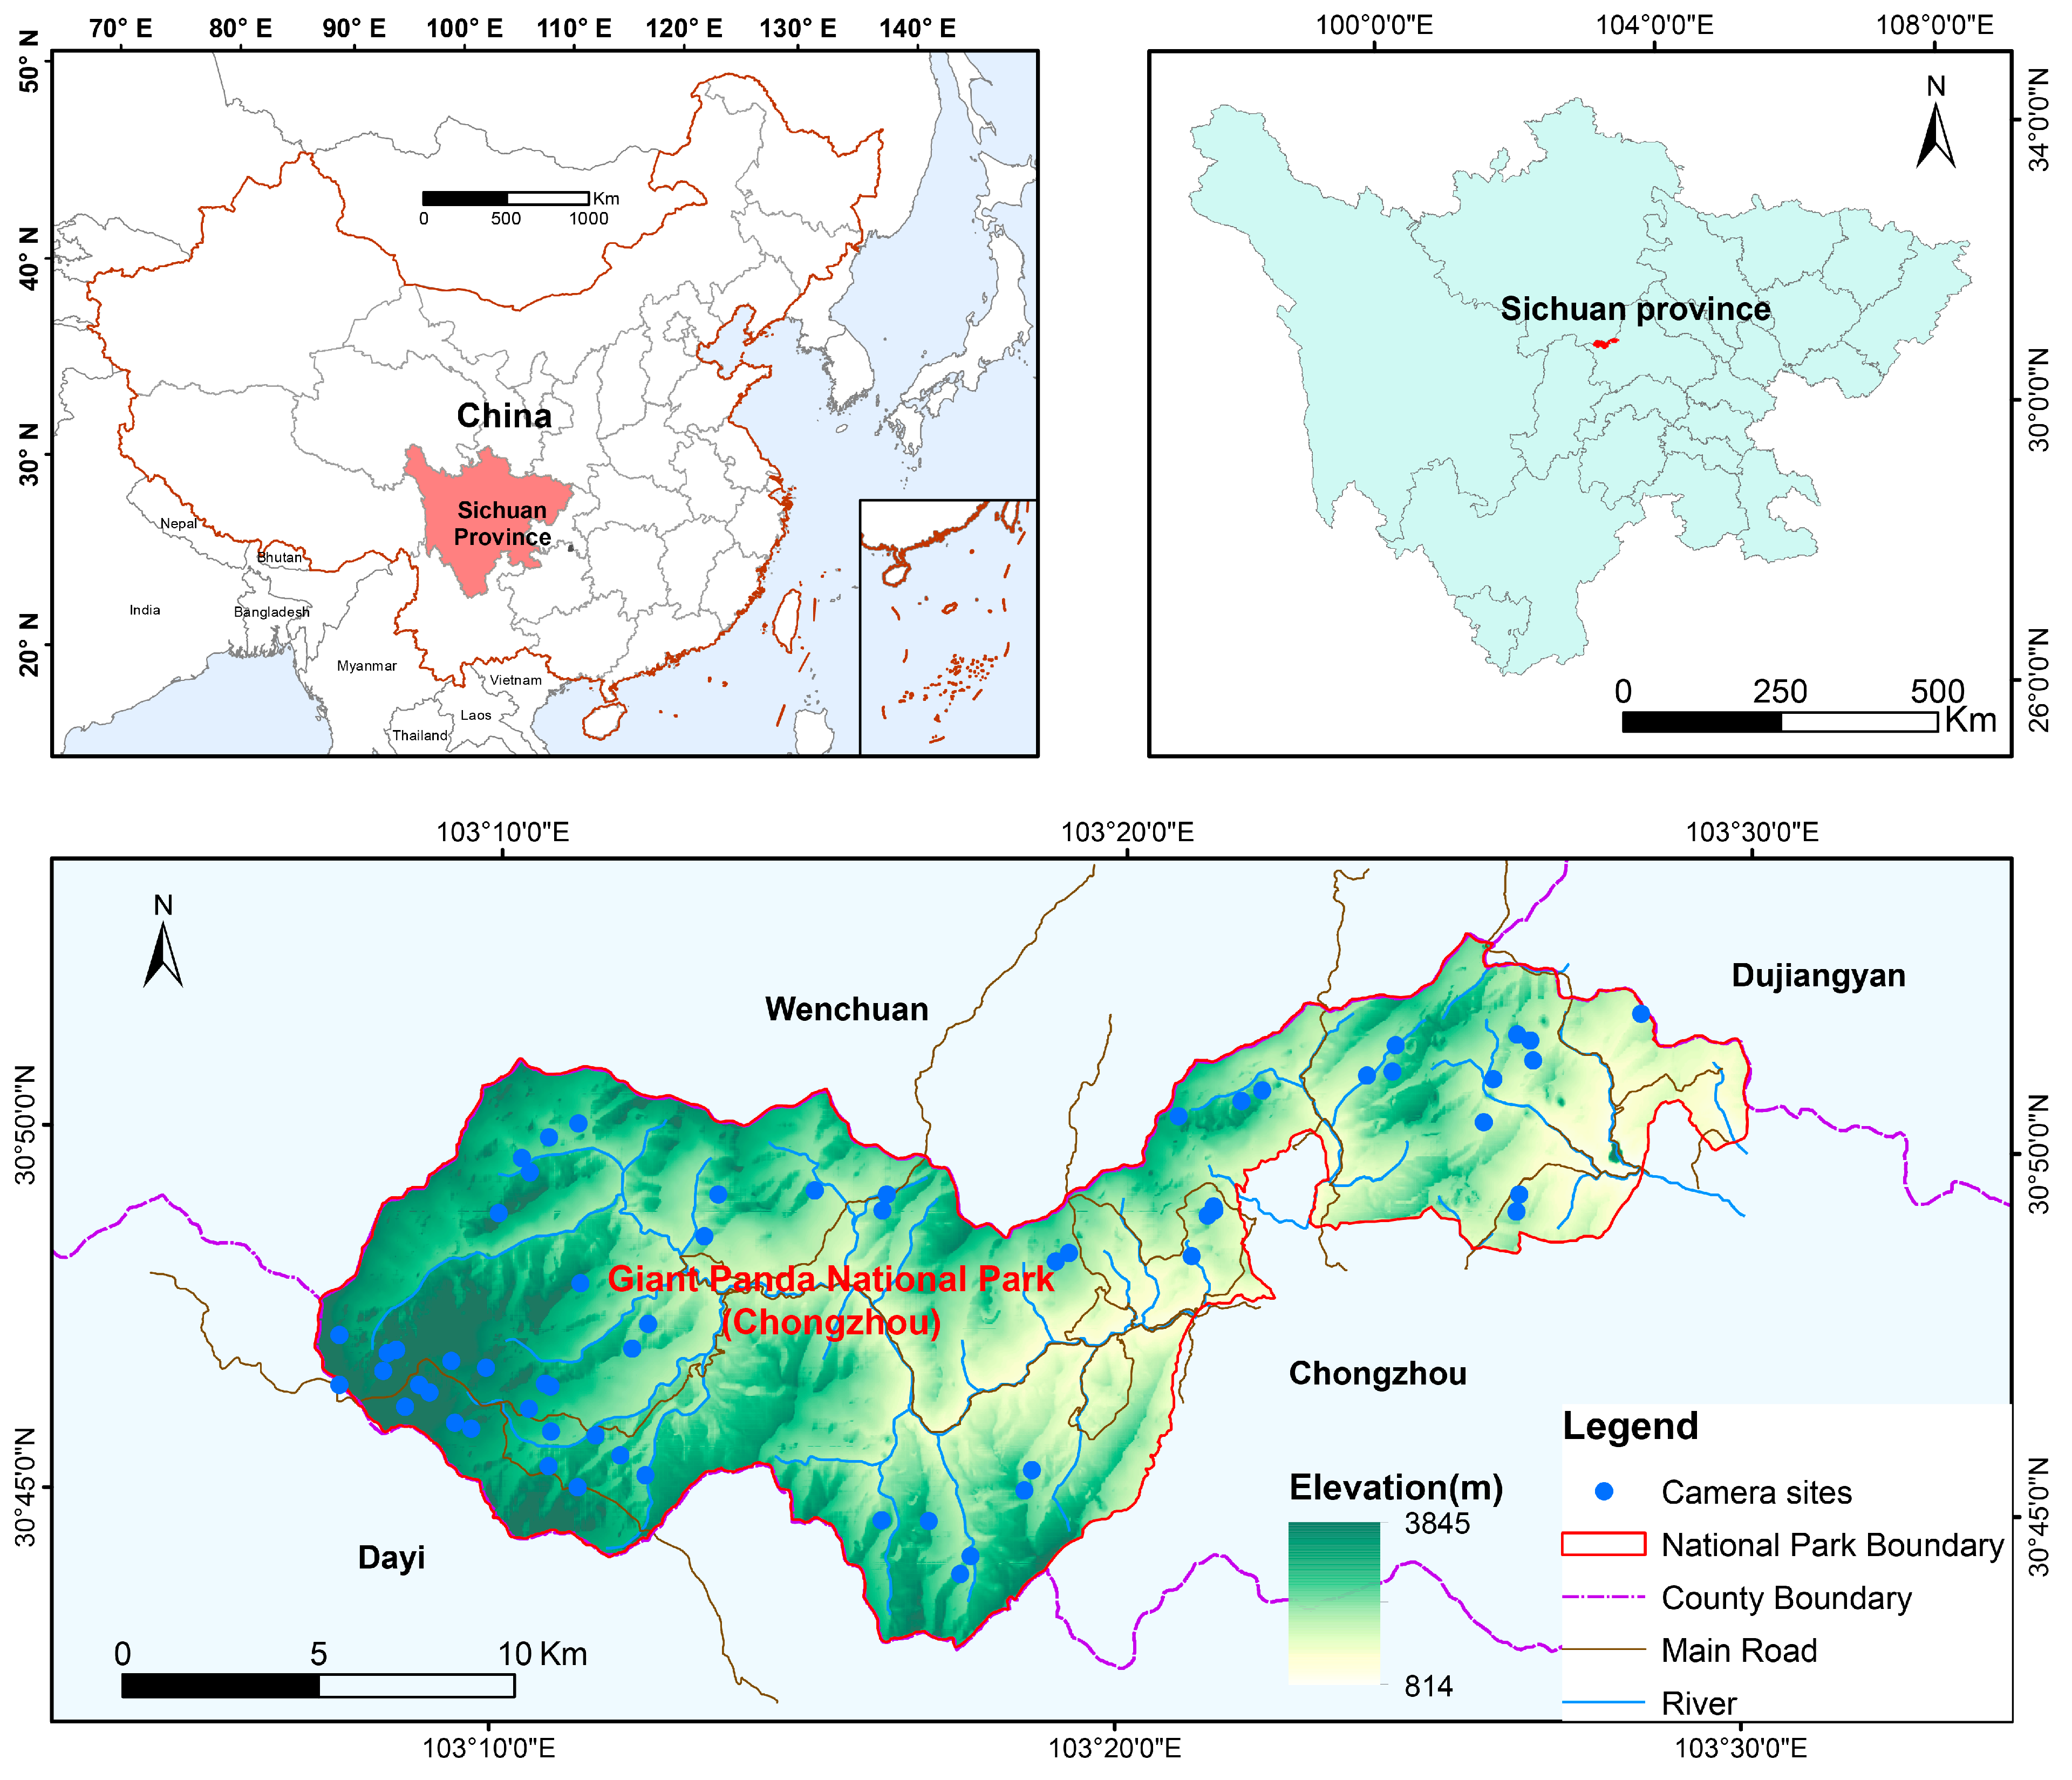
The study was conducted in the Anzihe Nature Reserve of Giant Panda National Park, Sichuan Province, China (Figure 1). This sector covers approximately 283.07 km2 along the eastern edge of the Qionglai Mountains, with elevations ranging from 841 to 3845 m. The study area features complex landforms and a pronounced altitudinal gradient, supporting a continuous vertical vegetation spectrum from evergreen broadleaf forests at lower elevations to subalpine coniferous forests and alpine shrublands at higher elevations. It connects with Wolong, Heishuihe, and Fengtongzhai reserves, together forming a core part of the Qionglai Mountain giant panda (Ailuropoda melanoleuca) habitat and ecological corridor. The area harbors high biodiversity and provides an important habitat for several sympatric ungulate species, which were the focus of this study.

2.2. Species in This Study

The study focused on six ungulates: tufted deer (Elaphodus cephalophus), Chinese goral (Naemorhedus griseus), Chinese serow (Capricornis milneedwardsii), sambar (Rusa unicolor), wild boar (Sus scrofa), and blue sheep (Pseudois nayaur). Tufted deer are distributed in the montane forests of central and southern China and show crepuscular activity with seasonal variation; recent genetic studies indicate significant population structure in southwestern populations [24]. Chinese goral occupy rocky slopes and mid-to-high elevation forests, with field studies in Wolong showing clear habitat preferences [25,26]. Chinese serow occur in dense montane forests and rugged terrain, with camera-trap surveys in Sichuan revealing spatio-temporal overlap with Chinese goral; genomic work provides further insights into its taxonomy and adaptation [27,28]. Sambar is the largest cervid in the region, inhabiting forest valleys and mixed woodlands, feeding on grasses, leaves, and fruits, and is listed as Vulnerable [29]. Wild boar is a widespread habitat generalist found in forests and agricultural areas, and it has an omnivorous diet. Blue sheep are an alpine ungulate typical of high-elevation shrublands and open rocky slopes in the Himalaya and Hengduan Mountains, and were assessed as Least Concern [30]. These six species occupy distinct dietary niches, and the availability of their respective food resources varies across camera-trap locations. Therefore, we recognize that a lower record of species at certain sites may be attributed to several ecological factors, including the absence of suitable forage or specific habitat requirements for certain species.

2.3. Camera-Trap Survey

From January to December 2021, we deployed camera traps using a systematic grid-based sampling design. The study area was divided into 1 km × 1 km grids using ArcGIS 10.8, and one camera was installed within each grid that showed evidence of wildlife activity (e.g., animal trails, footprints, and feces) or near water sources and forest gaps [31,32]. A total of 60 cameras (main model: LTL-6210MC; backup: RE40) were installed. Cameras were fixed to tree trunks at a height of 40–60 cm above the ground, with lenses oriented parallel to animal paths, and camouflaged to minimize disturbance [32]. While the study area experienced seasonal snowfall, this installation height was sufficient to keep the lenses above the snowpack, and no instances of cameras being buried or obstructed by snow were observed during the survey. Additionally, all recorded images were screened during preprocessing to ensure that weather conditions did not interfere with species identification or detection consistency. No bait was used at any site. Cameras were set to “photo + video” mode, capturing three consecutive photographs followed by a 15 s video upon triggering, with a 1 min interval and medium sensitivity. At each site, we recorded GPS coordinates (Garmin 64s) and elevation, and documented habitat characteristics, including vegetation type, slope position, aspect, canopy closure, distance to the nearest water source, and distance to the nearest human activity point (e.g., road, village), and human disturbances primarily consisted of non-lethal activities, including livestock grazing (cattle and goats), herbal medicine collection by local residents, and regulated ecotourism. Cameras were checked every 3–4 months to replace batteries and memory cards and to ensure continuous operation.

2.4. Data Organization and Species Identification

All camera-trap photographs and video recordings were archived systematically by site ID and date [1,33]. Data management and preprocessing were conducted using Camera Data Manager V1.6, a specialized software for wildlife image analysis [33]. An independent detection event was defined as consecutive records of the same species at the same camera site separated by at least 30 min [1,32]. To ensure a conservative and consistent estimation across sites, we employed an event-based recording protocol: each independent detection event was counted as a single record (n = 1), regardless of the number of individuals (e.g., sounders of wild boar) or age classes (e.g., juveniles or subadults) present in the images. This approach was adopted to minimize the bias caused by varying group sizes and the difficulty of accurately identifying all individuals in dense forest environments. To avoid duplicate counts, only the first photograph from each independent event was retained for subsequent analyses, including calculation of the Relative Abundance Index (RAI) and activity pattern assessment [1,34]. Species identification was performed independently by at least two experienced researchers. In cases of disagreement, the researchers jointly reviewed the images until consensus was achieved. For each independent event, we recorded the following information: species identity, number of individuals, observed behavior, and the exact time of capture.

2.5. Data Analysis

2.5.1. Calculation of Relative Abundance Index (RAI)

The study used the Relative Abundance Index (RAI) to quantify and compare the relative activity levels of target species across different spatial and temporal categories. The RAI was calculated as:
R A I = N i D × 100
where Ni is the number of independent effective detections of species i, and D is the total working days of all cameras during the survey [13]. Higher RAI values indicate more frequent relative activity [13,35].

2.5.2. Habitat Use Analysis

To assess differences in habitat use among the six focal species, we compared their distributions across key habitat variables, including vegetation type, slope, slope aspect, and elevation gradient. For each habitat variable, we constructed contingency tables of species by habitat categories based on the number of independent detection events. The study applied the Pearson Chi-square test to evaluate whether the overall distributions differed significantly among species. When more than 20% of expected cell frequencies were <5, Fisher’s exact test (with Monte Carlo simulation when needed) was used instead. Statistical significance was assessed at α = 0.05 [13].

2.5.3. Visualization

The habitat utilization preferences of the six species were visualized using radial bar charts generated in Origin 2023. These charts display Relative Abundance Index (RAI) values across habitat categories in a circular layout, allowing clear and intuitive comparison of habitat-use patterns among species [32].

2.5.4. Activity Pattern Analysis

The study analyzed daily activity rhythms using Kernel density estimation (KDE) in R (v4.2.2). The “activity” package was used for plotting, and the “overlap” package was used to calculate the overlap coefficient (Δ). We applied the Δ1 estimator for species with <50 records and Δ4 for those with ≥50, with 95% CIs obtained from 10,000 bootstrap replicates. To examine the relationship between spatial and temporal dimensions, we quantified spatial overlap using Schoener’s D index based on the Relative Abundance Index (RAI) per station. A Pearson correlation was then used to analyze the link between spatial (D) and temporal (Δ) overlap across species pairs. We acknowledge that differences in species traits may bias detectability. Results are presented as observed habitat use and relative activity frequency rather than absolute preference or density. All analyses were conducted in R 3.6.3 [36]. The “activity” package was used to plot kernel density curves, and the “overlap” package was used to calculate overlap indices [37,38].

3. Result

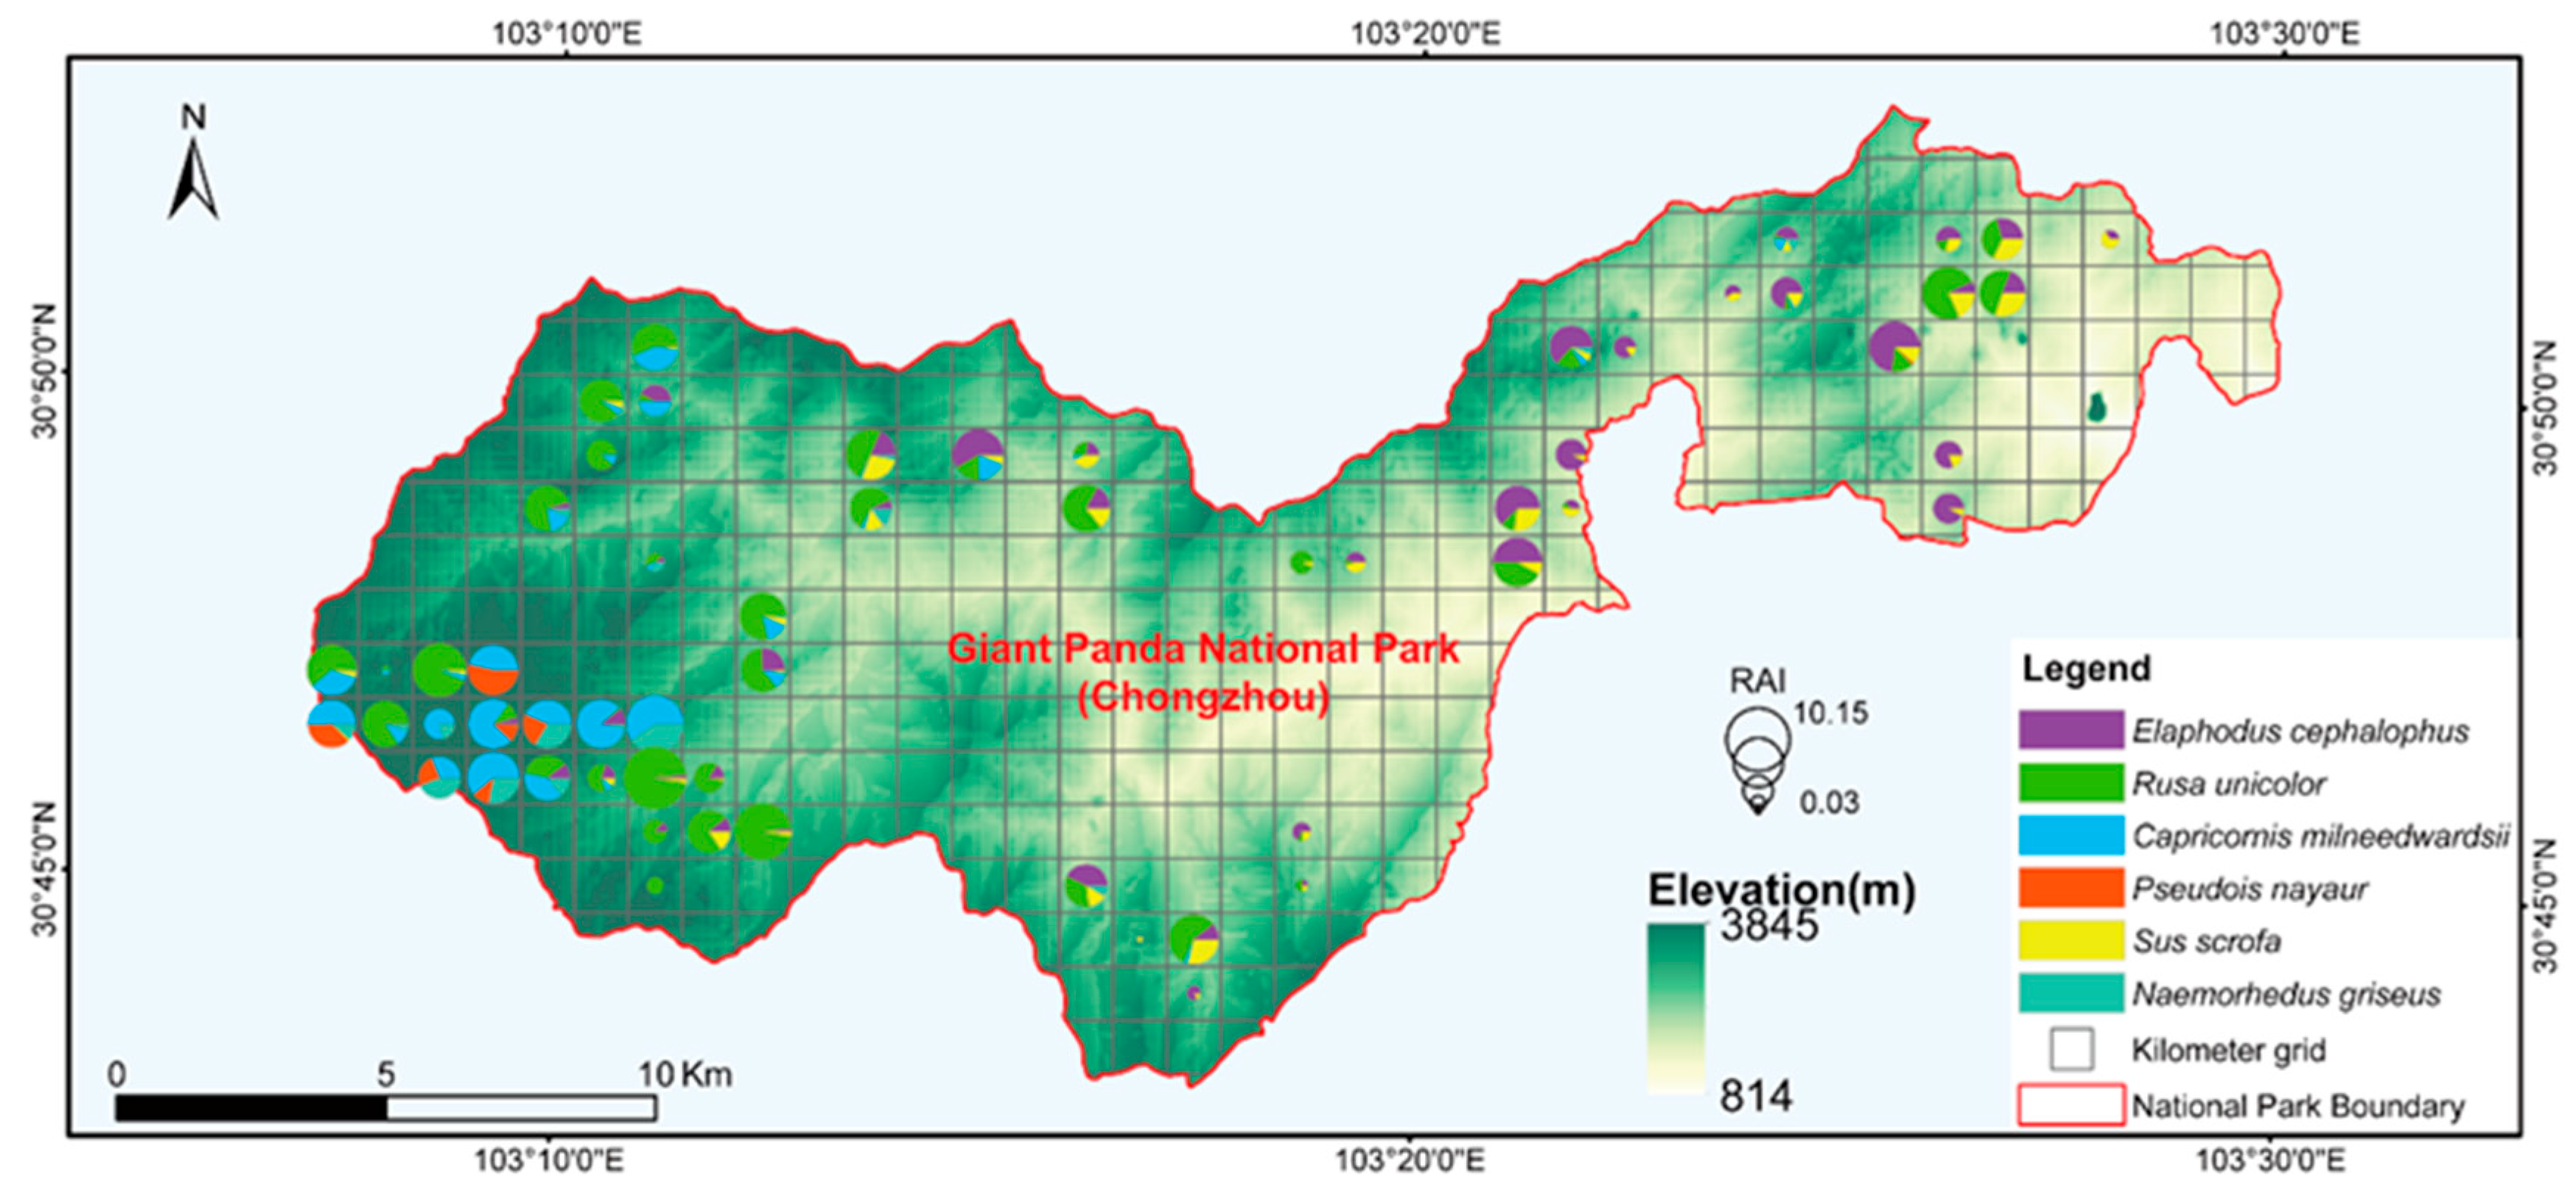
Over the course of the survey, a total of 2946 camera-trap days were accumulated from 60 sampling sites, and no large mammalian predators were recorded (Table S1). A total of 23,509 photographs were recorded, among which 23,201 belonged to the focal ungulate species. From these, 2841 independent photos (as shown in Table 1) were identified for further analysis. Six ungulate species were recorded: Tufted deer, Chinese goral, Chinese serow, sambar, wild boar, and blue sheep. The sambar was the most abundant species (RAI = 44.72), followed by the Chinese serow (RAI = 18.03) and the tufted deer (RAI = 16.46). The wild boar was less common (RAI = 7.87). The two rock-dwelling specialists, the Chinese goral and the blue sheep, exhibited the lowest RAIs (5.79 and 3.52) (Table 1; Figure 2).

3.1. Habitat-Use Patterns of Six Sympatric Ungulates

Tufted deer occurred mainly at 1500–2000 m (61.98%) (Table 2), while sambar were concentrated at 2000–2500 m (55.16%), Chinese serow (41.17%) and blue sheep (69.23%) showed the broadest elevational use, peaking at 3000–3500 m; wild boar also ranged widely but were most frequent at 1500–2000 m (65.95%). Chinese goral (39.77%) occurred predominantly at 2500–3000 m. Sambar (53.19%), wild boar (41.38%), and tufted deer (44.21%) favored south-facing slopes; Chinese goral were common on southeast slopes (34.50%). Most species used moderate-to-steep slopes, with sambar on 26–30° (55.16%), Chinese goral on 21–25° (49.12%), and blue sheep on slopes > 35° (76.92%). Vegetation use also varied: tufted deer (51.24%) and wild boar (46.55%) were associated with evergreen–deciduous broadleaf mixed forests, sambar (52.28%) and Chinese serow (60.15%) with coniferous–broadleaf mixed forests, blue sheep with meadow (76.92%), and Chinese goral with coniferous forests (57.31%).
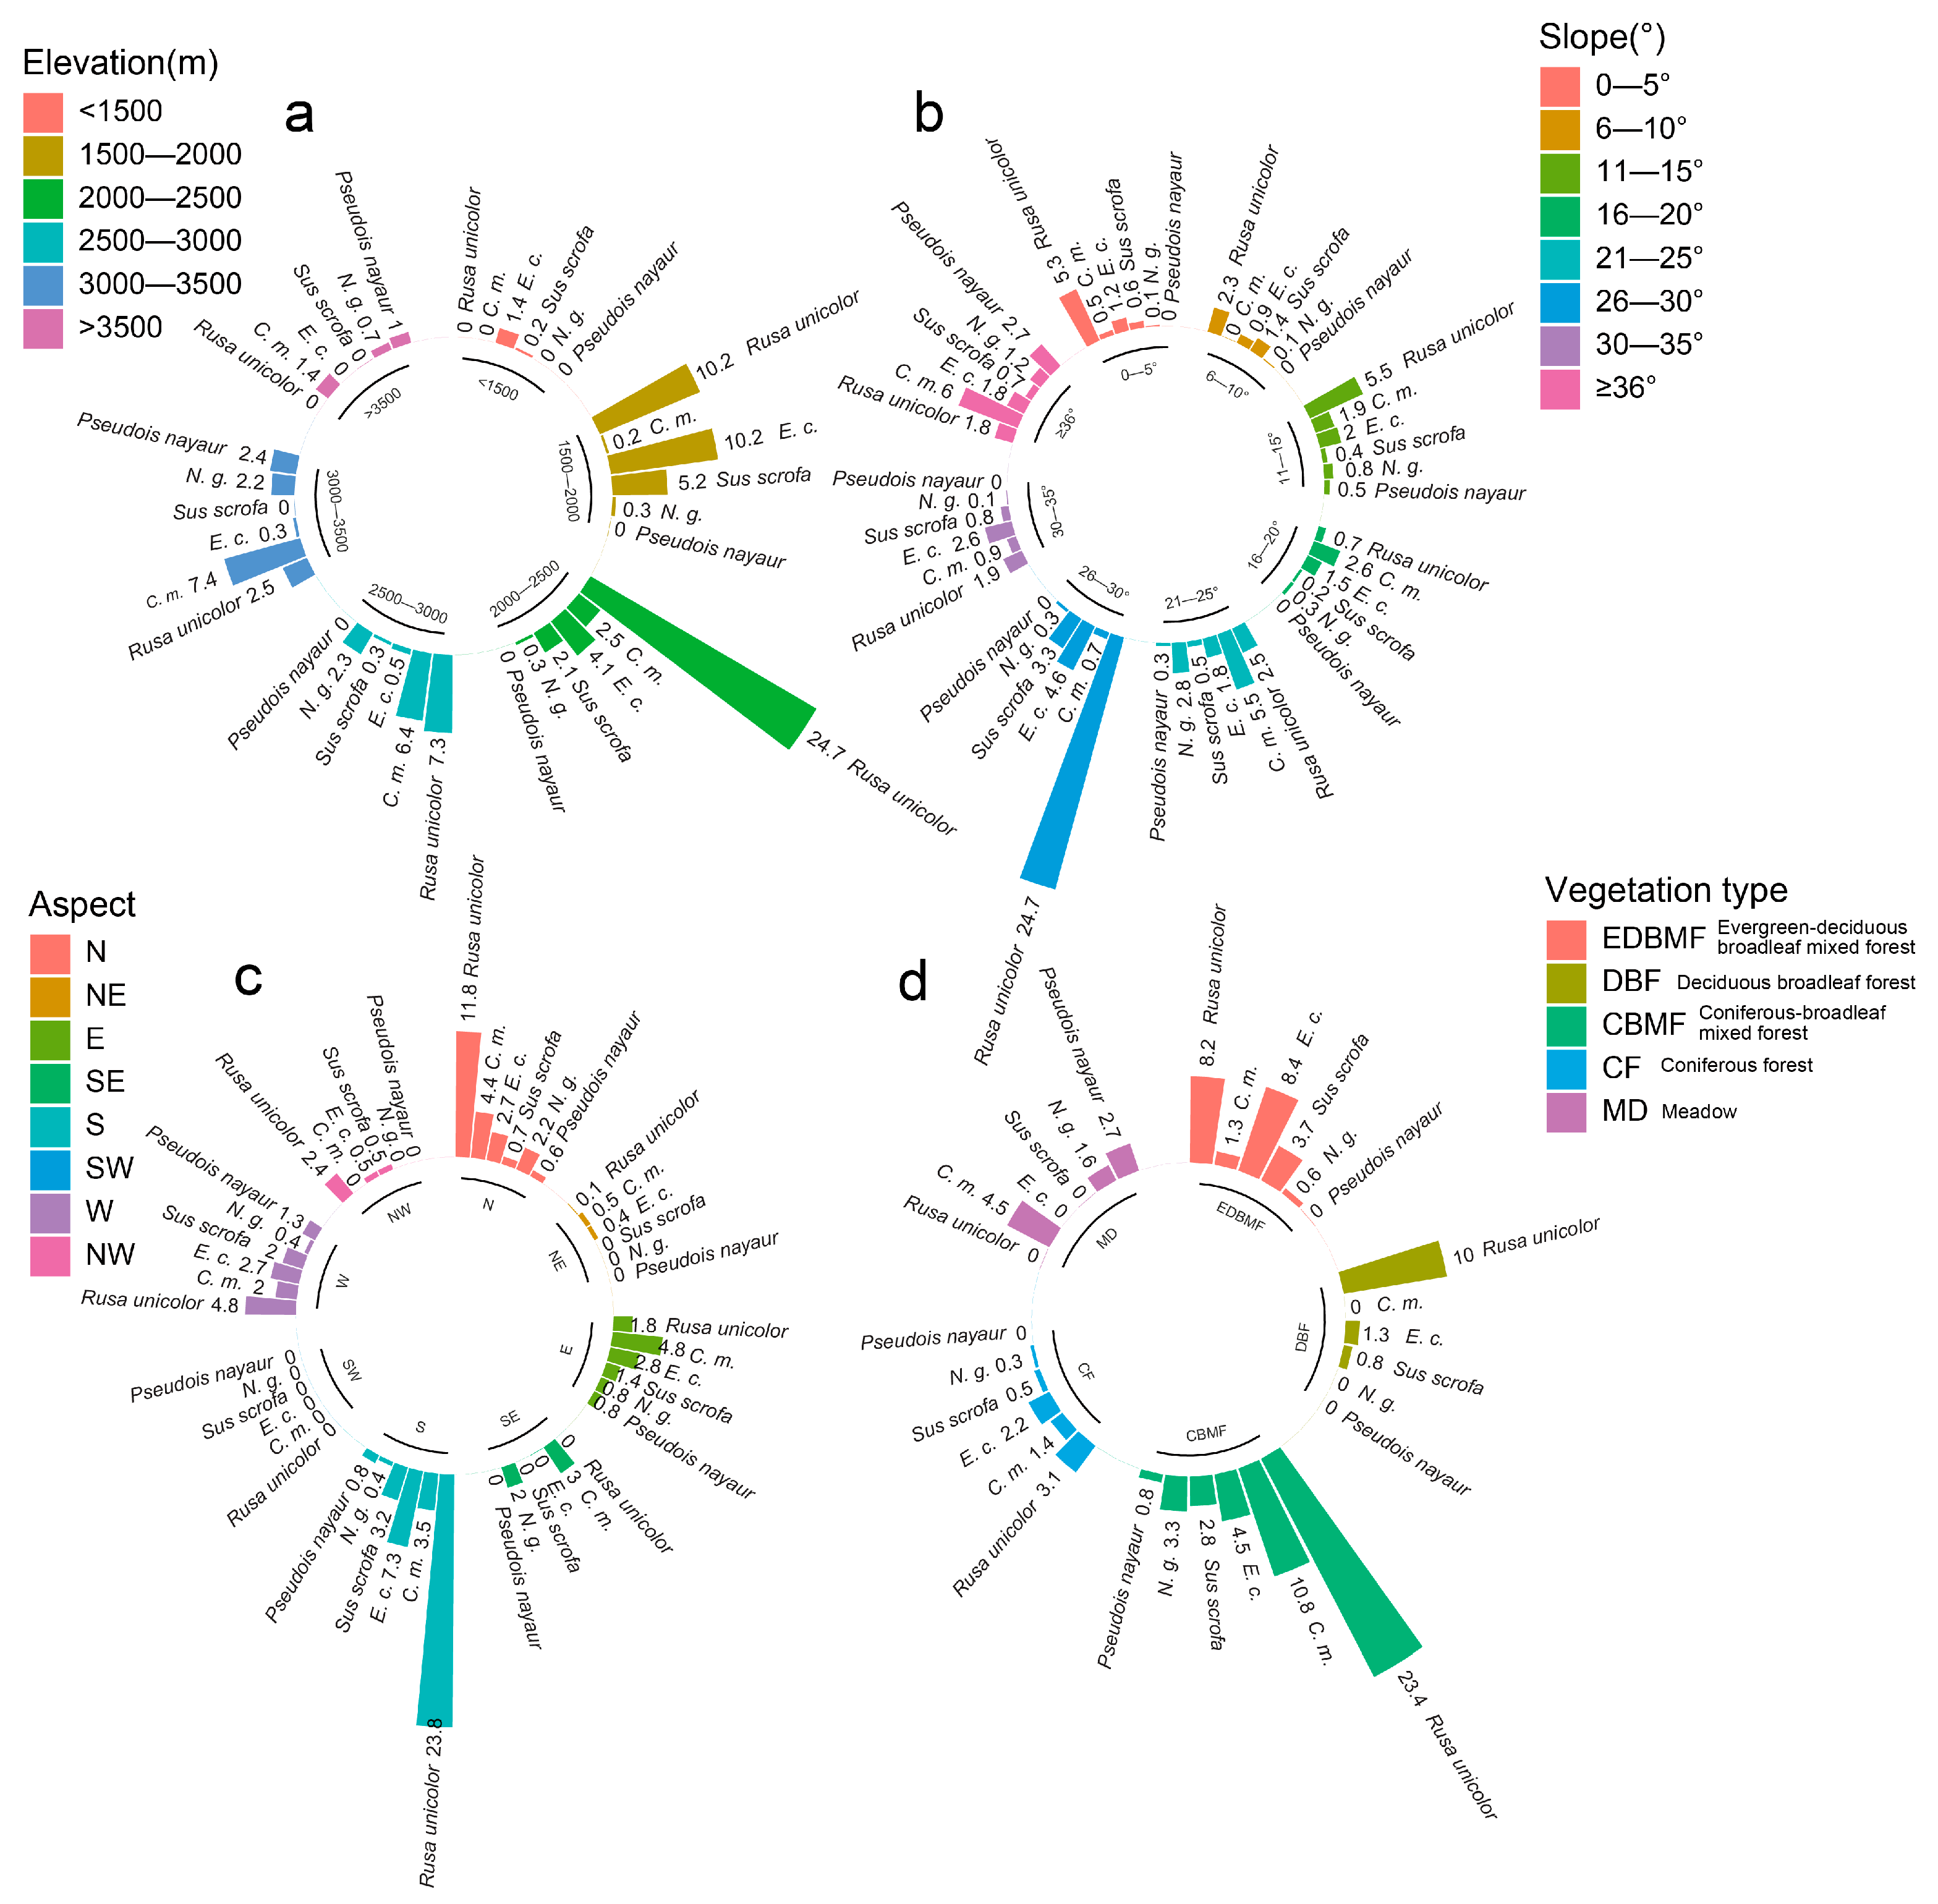
The six ungulates showed distinct habitat-use patterns (Table 3, Figure 3). Tufted deer and sambar had the highest activity at 1500–2000 m (RAI = 10.19 and 10.24). Chinese serow peaked at 3000–3500 m (RAI = 7.41), and Chinese goral peaked at 2500–3000 m (RAI = 2.30). Blue sheep were concentrated above 3000 m, with RAI = 2.44 at 3000–3500 m. Wild boar occurred mainly between 1500 and 2000 m (RAI = 5.21). Sambar and tufted deer showed high activity on south-facing slopes (RAI = 23.79 and 7.29), whereas Chinese serow and Chinese goral were more frequent on north and east aspects. Sambar and tufted deer used gentle-to-moderate slopes, while Chinese serow often occurred on steep slopes (>35°, Chinese serow RAI = 5.79). Sambar reached the highest RAI in coniferous–broadleaf mixed forests (RAI = 23.38), while tufted deer were frequent in evergreen–deciduous broadleaf mixed forests (RAI = 8.41). Chinese serow favored coniferous–broadleaf mixed forests (RAI = 10.85), whereas blue sheep were more common in meadows (RAI = 2.71). Chinese goral showed moderate use of coniferous–broadleaf mixed forests (RAI = 3.32).

3.2. Daily Activity Pattern and Time Overlap

Circular kernel density estimates revealed clear interspecific differences in diel activity levels among the six ungulate species examined (Table 4). The Chinese serow exhibited the highest mean activity level (0.552 ± 0.039), which was greater than that of all other species, as indicated by non-overlapping confidence intervals. The tufted deer showed the lowest mean activity level (0.429 ± 0.036). The Chinese goral (0.474 ± 0.048), sambar (0.465 ± 0.027), wild boar (0.490 ± 0.039), and blue sheep (0.453 ± 0.052) exhibited intermediate values that were broadly comparable. Sample sizes (N) varied substantially across species, ranging from 104 detections for blue sheep to 1318 for sambar, but confidence intervals around activity estimates were consistently narrow, indicating robust parameter estimation despite variation in sampling effort.
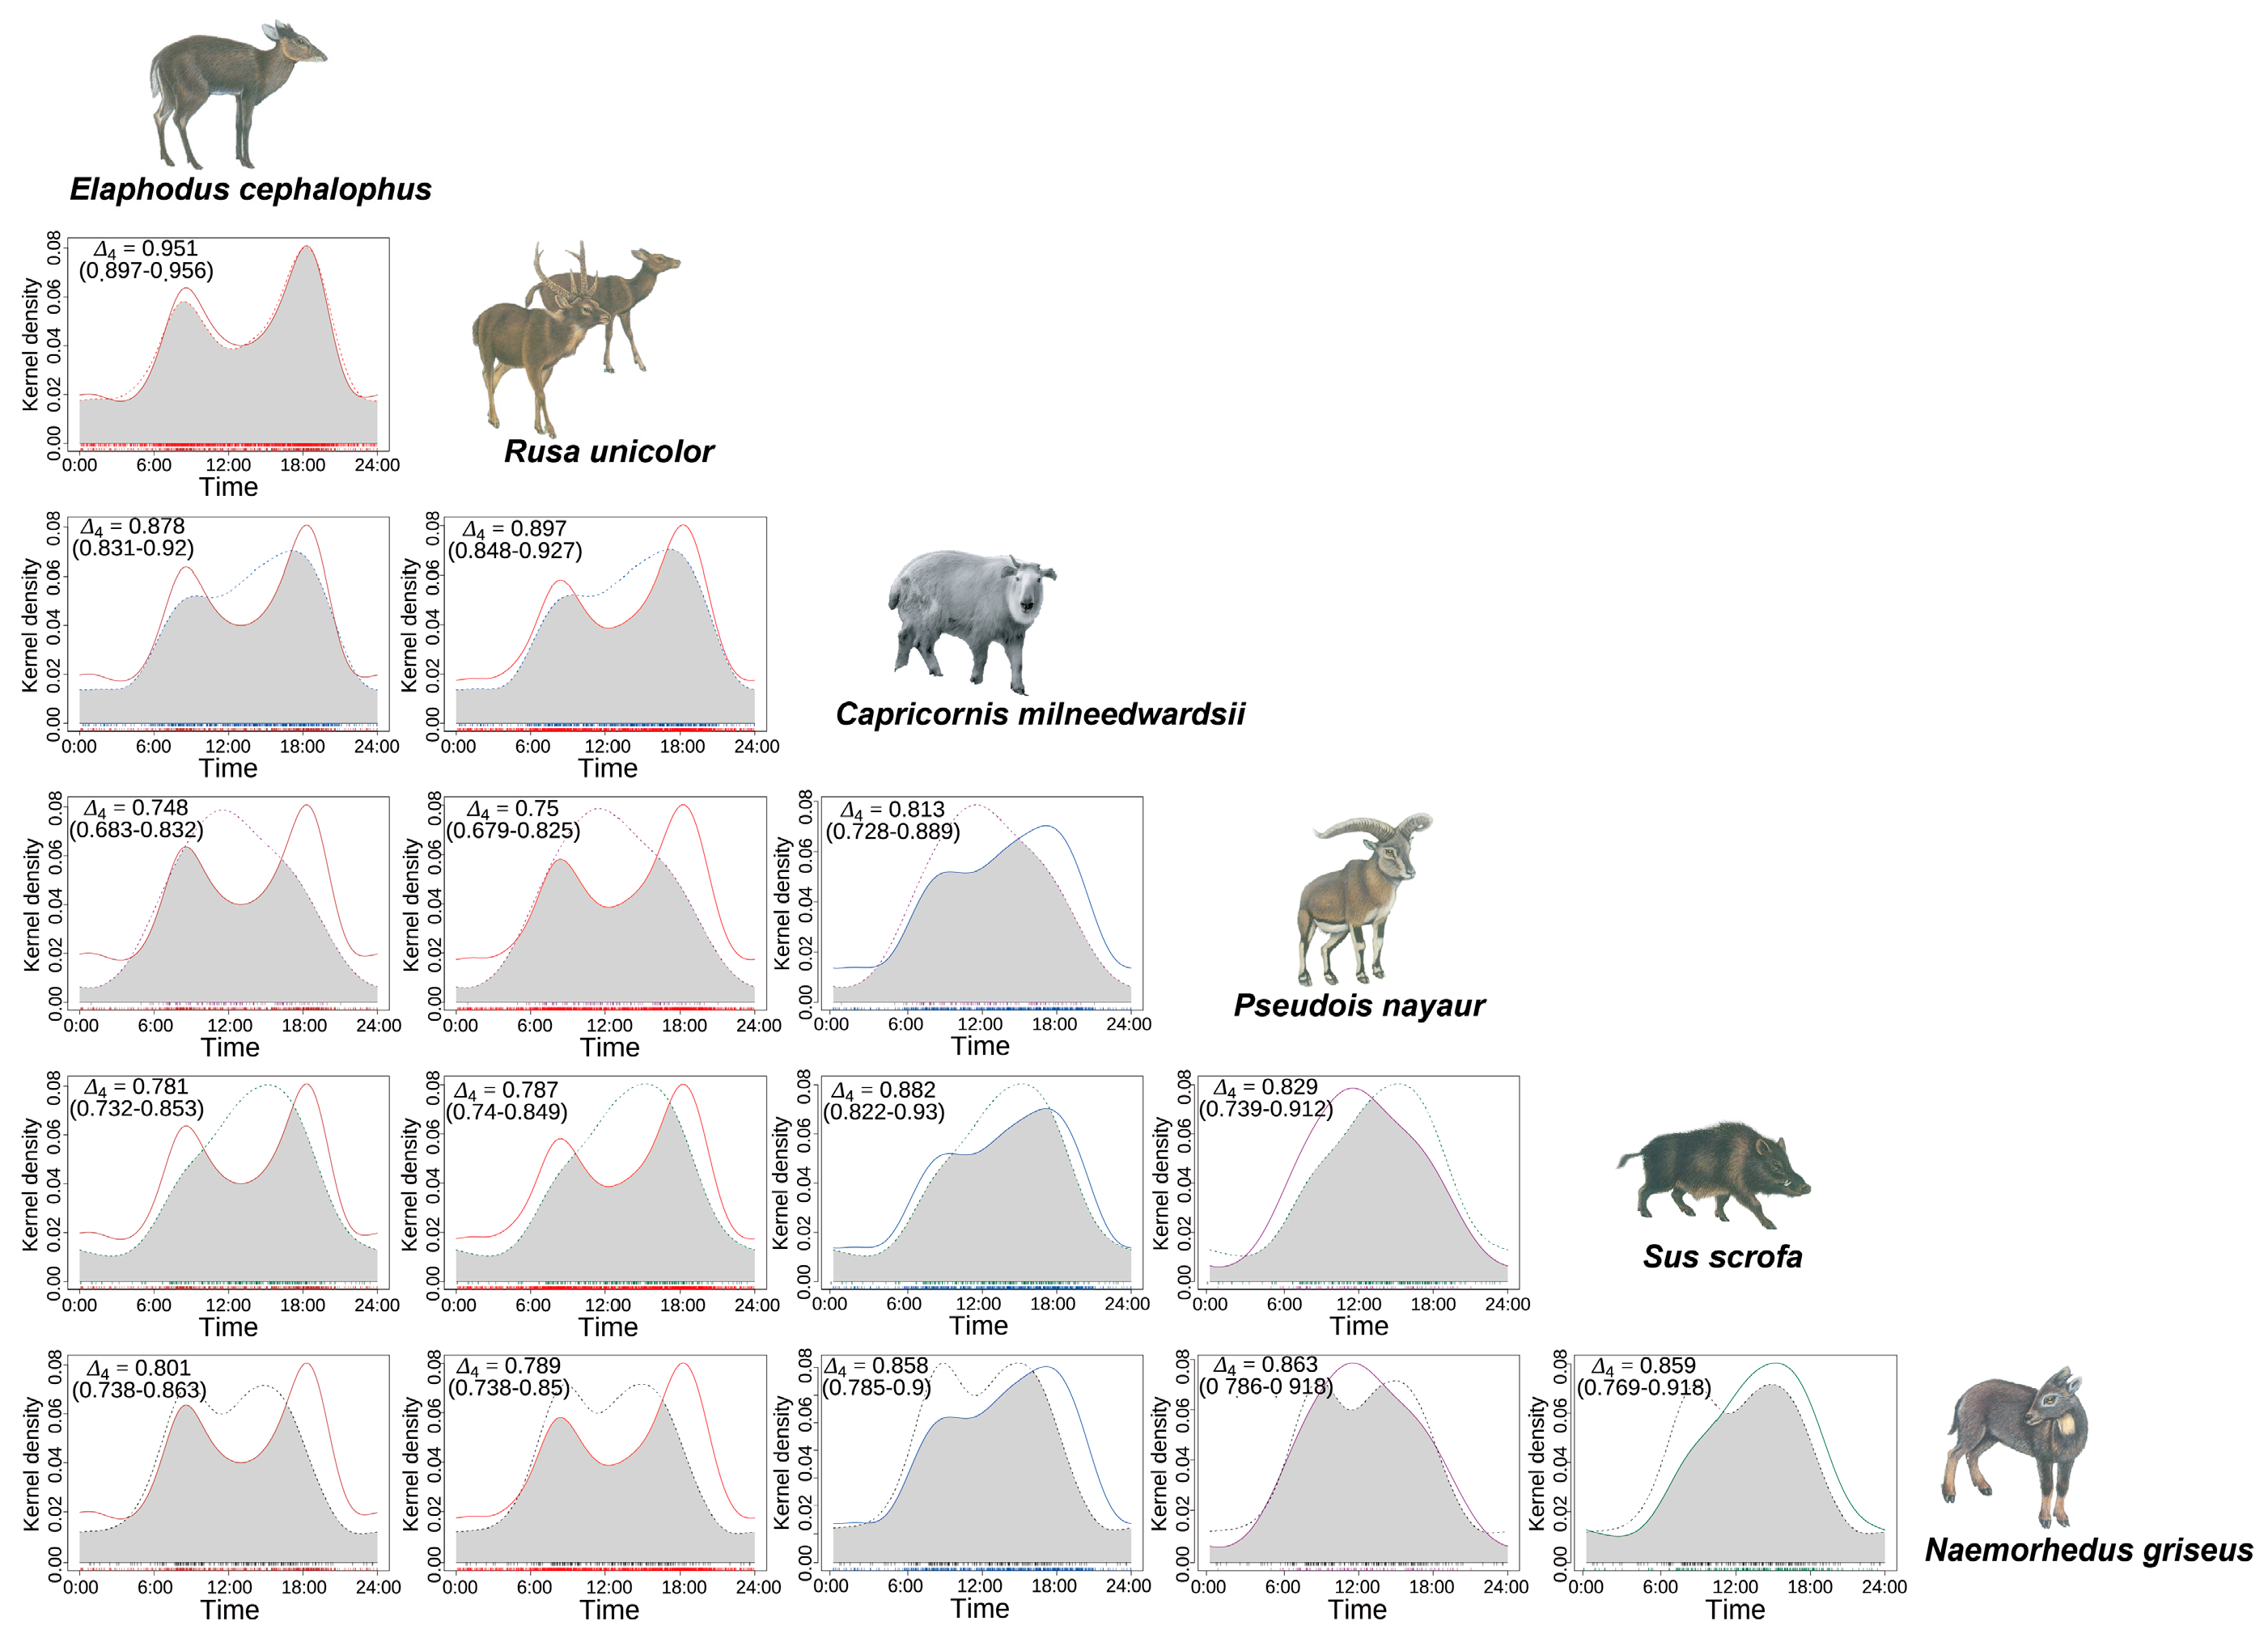
Kernel density estimation of diurnal activity rhythms was revealed for all six ungulate species (Figure 4). Tufted deer, sambar, and Chinese goral exhibited clear bimodal diurnal activity patterns, with peaks in the morning (09:00–11:00) and late afternoon (15:00–19:00). In contrast, blue sheep, wild boar, and Chinese serow each displayed a single major activity peak, but the timing of these peaks differed: blue sheep peaked around midday (12:00), wild boar in the late afternoon (16:00), and Chinese serow in the early evening (17:00).
Comparison of kernel density activity curves using the Overlap Index revealed varying degrees of temporal niche overlap among species pairs (Table 5, Figure 4). The highest overlap was observed between tufted deer and sambar (Δ = 0.951, 95% CI: 0.897–0.956), followed by sambar and Chinese serow (Δ = 0.897, 95% CI: 0.848–0.927), and Chinese serow and wild boar (Δ = 0.882, 95% CI: 0.822–0.930). Moderate overlap was detected between blue sheep and Chinese goral (Δ = 0.863, 95% CI: 0.786–0.918), and between wild boar and Chinese goral (Δ = 0.859, 95% CI: 0.769–0.918); the lowest overlap occurred between tufted deer and blue sheep.

4. Discussion

The camera-trap survey provided a robust dataset of nearly 3000 trap days across 60 sites, documenting six sympatric ungulate species with contrasting relative abundances and habitat-use patterns. Sambar was the most abundant, while blue sheep and Chinese goral were the least frequently detected. These patterns likely reflect a combination of species’ ecological traits and habitat availability. The dominance of sambar may be attributable to its generalist foraging strategy and preference for mixed conifer–broadleaf forests, a habitat type widely represented in the study area. The relatively low RAI of blue sheep and Chinese goral corresponds to their specialization for steep, rocky terrain, which is less extensive and thus limits their detectability. Similar patterns of relative abundance and habitat specialization have been reported in Tangjiahe National Nature Reserve, where sympatric ungulates exhibited distinct spatial distributions linked to habitat availability [39].
Tufted deer and wild boar were associated primarily with low-to-mid elevation broadleaf forests, while sambar and Chinese serow favored mixed conifer–broadleaf forests at mid-to-high elevations. Blue sheep and Chinese goral were most frequent at higher altitudes and on steeper slopes, which is consistent with their morphological and behavioral adaptations to rugged terrain. Elevational niche differentiation has also been documented in the Helan Mountains, where sympatric ungulates partitioned resources along altitudinal gradients to minimize competition [40]. While slope and aspect are physical topographic parameters, they serve as essential environmental proxies that shape ungulate behavior by influencing micro-habitat characteristics. Slope and aspect occurrence further highlighted micro-habitat segregation, which is consistent with studies showing that fine-scale topographic heterogeneity shapes ungulate distributions by determining the spatial availability of seasonal forage and thermal cover [27,28,41]. In this rugged landscape, these factors likely represent a functional trade-off between the energetic costs of movement and the biological requirements for high-quality food and predator-free resting sites. The presence of predators significantly shaped prey behavior and community structure; however, no large mammalian predators were recorded during our survey, reflecting their extreme scarcity in this part of the Giant Panda National Park.
Temporal activity analyses indicated that the six species’ diel activity rhythms varied in modality and peak timing. Tufted deer, sambar, and Chinese goral exhibited bimodal patterns with morning and late-afternoon peaks, whereas blue sheep, wild boar, and Chinese serow displayed unimodal peaks. High temporal overlaps between tufted deer and sambar, as well as between sambar and Chinese serow, suggest shared temporal niches, possibly mediated by high resource availability. By contrast, low overlap between tufted deer and blue sheep indicates temporal segregation that complements elevational partitioning, reducing direct competition. Such temporal niche differentiation has been recognized as a key coexistence mechanism among sympatric herbivores [28,38,40,42].
The findings demonstrate that sympatric ungulates in this montane ecosystem partition resources along both spatial (elevation, slope, and vegetation type) and temporal (activity rhythm) dimensions. This multidimensional niche differentiation likely underpins their coexistence in a heterogeneous landscape. From a conservation perspective, the results highlight the importance of maintaining intact elevational gradients and habitat mosaics to support diverse ungulate communities. Protecting mixed forests and alpine meadows is particularly critical, as these habitats sustain both generalist and specialist species. The results may be influenced by varying detectability among the six ungulate species, this is a common challenge in multi-species camera-trapping studies. Although this study focused primarily on interspecific patterns among ungulates, external factors such as human activity and resource availability also play roles. In the study area, human disturbances (e.g., grazing and herb collection) were observed but localized. Furthermore, given the high precipitation and dense stream network in this region, water availability is unlikely to be a primary constraint on ungulate movement. Future research incorporating these covariates would provide a more comprehensive understanding of the anthropogenic impacts on this community.

Supplementary Materials

The following supporting information can be downloaded at: https://www.mdpi.com/article/10.3390/d18030186/s1, Table S1: Detailed records of camera trap stations, including geographic coordinates, recorded wildlife species, and environmental characteristics.

Author Contributions

Conceptualization, B.D.; methodology, X.F.; software, X.F.; investigation, B.D. and X.F.; data curation, S.L.; writing—original draft preparation, B.D.; writing—review and editing, X.F. and J.H.; visualization, X.F.; project administration, B.D. All authors have read and agreed to the published version of the manuscript.

Funding

This study was supported by the Basic Research Project of Sichuan Academy of Forestry Sciences (2025JBKY14).

Institutional Review Board Statement

Not applicable.

Data Availability Statement

The original contributions presented in this study are included in the article. Further inquiries can be directed to the corresponding authors.

Acknowledgments

We extend our sincere gratitude to the Giant Panda National Park Chengdu Administration for their essential support in data collection and fieldwork facilitation.

Conflicts of Interest

Author Shengqiang Li was employed by the company Chengdu Zhuzhijingran Planning and Design Co., Ltd. The remaining authors declare that the research was conducted in the absence of any commercial or financial relationships that could be construed as a potential conflict of interest.

References

  1. Li, J.; Li, D.; Hacker, C.; Dong, W.; Wu, B.; Xue, Y. Spatial co-occurrence and temporal activity patterns of sympatric mesocarnivores guild in Qinling Mountains. Glob. Ecol. Conserv. 2022, 36, e02129. [Google Scholar] [CrossRef]
  2. Wen, D.; Qi, J.; Cheng, W.; Li, Z.; Qi, Q.; Cui, Y.; Roberts, N.J.; Tian, Y.; Zhou, Z.; Wang, Y.; et al. Spatial population distribution dynamics of big cats and ungulates with seasonal and disturbance changes in temperate natural forest. Glob. Ecol. Conserv. 2024, 51, e02881. [Google Scholar] [CrossRef]
  3. Fritz, H.; Loison, A. Large herbivores across biomes. In Large Herbivore Ecology, Ecosystem Dynamics and Conservation; Danell, K., Bergström, R., Duncan, P., Pastor, J., Eds.; Cambridge University Press: Cambridge, UK, 2006; pp. 19–49. [Google Scholar]
  4. Ripple, W.; Beschta, R. Trophic cascades in Yellowstone: The first 15 years after wolf reintroduction. Biol. Conserv. 2012, 145, 205–213. [Google Scholar] [CrossRef]
  5. Cromsigt, J.P.; Olff, H. Resource partitioning among savanna grazers mediated by local heterogeneity: An experimental approach. Ecology 2006, 87, 1532–1541. [Google Scholar] [CrossRef] [PubMed]
  6. Ogutu, J.O.; Piepho, H.P.; Dublin, H.T.; Bhola, N.; Reid, R.S. Rainfall influences on ungulate population abundance in the Mara-Serengeti ecosystem. J. Anim. Ecol. 2008, 77, 814–829. [Google Scholar] [CrossRef]
  7. Gosling, C.M.; Cromsigt, J.P.; Mpanza, N.; Olff, H. Effects of Erosion from Mounds of Different Termite Genera on Distinct Functional Grassland Types in an African Savannah. Ecosystems 2012, 15, 128–139. [Google Scholar] [CrossRef]
  8. Schoener, T.W. Resource Partitioning in Ecological Communities. Science 1974, 185, 27–39. [Google Scholar] [CrossRef]
  9. Letten, A.D.; Ke, P.J.; Fukami, T. Linking modern coexistence theory and contemporary niche theory. Ecol. Monogr. 2017, 87, 161–177. [Google Scholar] [CrossRef]
  10. Donadio, E.; Buskirk, S.W. Diet, morphology, and interspecific killing in carnivora. Am. Nat. 2006, 167, 524–536. [Google Scholar] [CrossRef]
  11. Sharief, A.; Kumar, V.; Singh, H.; Mukherjee, T.; Dutta, R.; Joshi, B.D.; Bhattacharjee, S.; Ramesh, C.; Chandra, K.; Thakur, M.; et al. Landscape use and co-occurrence pattern of snow leopard (Panthera uncia) and its prey species in the fragile ecosystem of Spiti Valley, Himachal Pradesh. PLoS ONE 2022, 17, e0271556. [Google Scholar] [CrossRef]
  12. Franchini, M.; Atzeni, L.; Lovari, S.; Nasanbat, B.; Ravchig, S.; Herrador, F.C.; Bombieri, G.; Augugliaro, C. Spatiotemporal behavior of predators and prey in an arid environment of Central Asia. Curr. Zool. 2023, 69, 670–681. [Google Scholar] [CrossRef]
  13. Bu, H.; Wang, F.; McShea, W.J.; Lu, Z.; Wang, D.; Li, S. Spatial Co-Occurrence and Activity Patterns of Mesocarnivores in the Temperate Forests of Southwest China. PLoS ONE 2016, 11, e0164271. [Google Scholar] [CrossRef]
  14. Chen, Y.; Liu, B.; Fan, D.; Li, S. Temporal Response of Mesocarnivores to Human Activity and Infrastructure in Taihang Mountains, Central North China: Shifts in Activity Patterns and Their Overlap. Animals 2023, 13, 688. [Google Scholar] [CrossRef]
  15. Cong, W.; Li, J.; Hacker, C.; Li, Y.; Zhang, Y.; Jin, L.; Zhang, Y.; Li, D.; Xue, Y.; Zhang, Y. Different coexistence patterns between apex carnivores and mesocarnivores based on temporal, spatial, and dietary niche partitioning analysis in Qilian Mountain National Park, China. eLife 2024, 13, RP97169. [Google Scholar] [CrossRef]
  16. O’Brien, T.; Kinnaird, M.; Wibisono, H. Crouching tigers, hidden prey: Sumatran tiger and prey populations in a tropical forest landscape. Anim. Conserv. 2003, 6, 131–139. [Google Scholar] [CrossRef]
  17. Welbourne, D.J.; Claridge, A.W.; Paull, D.J.; Ford, F. Camera-traps are a cost-effective method for surveying terrestrial squamates: A comparison with artificial refuges and pitfall traps. PLoS ONE 2020, 15, e0226913. [Google Scholar] [CrossRef] [PubMed]
  18. Fisher, J.T. Camera trapping in ecology: A new section for wildlife research. Ecol. Evol. 2023, 13, e9925. [Google Scholar] [CrossRef] [PubMed]
  19. Ridout, M.S.; Linkie, M. Estimating overlap of daily activity patterns from camera trap data. J. Agric. Biol. Environ. Stat. 2009, 14, 322–337. [Google Scholar] [CrossRef]
  20. Fan, Z.; Ou, X.; Wan, Y.; Xiao, W.; Xie, W.; Ou, S.; Deng, X.; Huang, Z.; Xiao, Z. Mammals and birds survey using camera trapping in Dinghushan and its surrounding forests, Guangdong Province. Biodivers. Sci. 2020, 28, 1147–1153. [Google Scholar] [CrossRef]
  21. Swaisgood, R.R.; Wei, F.; McShea, W.J.; Wildt, D.E.; Kouba, A.J.; Zhang, Z. Can science save the giant panda (Ailuropoda melanoleuca)? Unifying science and policy in an adaptive management paradigm. Integr. Zool. 2011, 6, 290–296. [Google Scholar] [CrossRef]
  22. Montgomery, R.A.; Carr, M.; Booher, C.R.; Pointer, A.M.; Mitchell, B.M.; Smith, N.; Calnan, K.; Montgomery, G.M.; Ogada, M.; Kramer, D.B. Characteristics that make trophy hunting of giant pandas inconceivable. Conserv. Biol. 2020, 34, 915–924. [Google Scholar] [CrossRef] [PubMed]
  23. Wang, Z.N.; Yang, L.; Fan, P.F.; Zhang, L. Species bias and spillover effects in scientific research on Carnivora in China. Zool. Res. 2021, 42, 354–361. [Google Scholar] [CrossRef]
  24. Wang, F.; Yang, C.; Xiong, Y.; Xiang, Q.; Cui, X.; Peng, J. Genetic Diversity and Population Structure of Tufted Deer (Elaphodus cephalophus) in Chongqing, China. Animals 2025, 15, 2254. [Google Scholar] [CrossRef]
  25. Chen, W.; Hu, J.C.; Lu, X. Habitat use and separation between the Chinese serow (Capricornis milneedwardsi) and the Chinese goral (Naemorhedus griseus) in winter. Mammalia 2009, 73, 249–252. [Google Scholar] [CrossRef]
  26. Chen, W.; Wu, Q.G.; Hu, J.C.; Lu, X.; You, Z.Q. Seasonal habitat use of Chinese goral (Naemorhedus griseus) in a subtropical forest. Russ. J. Ecol. 2012, 43, 256–260. [Google Scholar] [CrossRef]
  27. You, Z.; Lu, B.; Du, B.; Liu, W.; Jiang, Y.; Guan, R.; Yang, N. Spatio-Temporal Niche of Sympatric Tufted Deer (Elaphodus cephalophus) and Sambar (Rusa unicolor) Based on Camera Traps in the Gongga Mountain National Nature Reserve, China. Animals 2022, 12, 2694. [Google Scholar] [CrossRef] [PubMed]
  28. Liu, W.; Li, X.Q.; Li, Z.L.; Li, Y.; You, Z.Y.; Jiang, Y.; Ruan, G.H.; Lu, B.G.; Yang, N. Spatio-temporal distribution and overlap of Naemorhedus griseus and Capricornis milneedwardsii in Gongga Mountain, Sichuan, China. Chin. J. Appl. Ecol. 2023, 34, 1630–1638. [Google Scholar]
  29. Applegate, R.D.; Groves, C.; Grubb, P. Ungulate Taxonomy; Johns Hopkins University Press: Baltimore, MD, USA, 2011; pp. 245–246. [Google Scholar]
  30. IUCN. The IUCN Red List of Threatened Species; Version 2025-2. Available online: https://www.iucnredlist.org/en (accessed on 9 February 2026).
  31. Jun, M.; Jiaojiao, W.; Lei, Z.; Yunbo, L.; Zhumei, L.; Haijun, S. Field monitoring using infrared cameras and activity rhythm analysis on mammals and birds in Xishui National Nature Reserve, Guizhou, China. Biodivers. Sci. 2019, 27, 641–648. [Google Scholar] [CrossRef]
  32. Tian, J.; Zou, Q.; Zhang, M.; Hu, C.; Khattak, R.H.; Su, H. Spatial and temporal differentiation are not distinct but are covariant for facilitating coexistence of small and medium-sized carnivores in Southwestern China. Glob. Ecol. Conserv. 2022, 34, e02017. [Google Scholar] [CrossRef]
  33. Rahman, D.A.; Gonzalez, G.; Aulagnier, S. Benefit of camera trapping for surveying the critically endangered Bawean deer Axis kuhlii (Temminck, 1836). Trop. Zool. 2016, 29, 155–172. [Google Scholar] [CrossRef]
  34. Vinitpornsawan, S.; Fuller, T.K. A Camera-Trap Survey of Mammals in Thung Yai Naresuan (East) Wildlife Sanctuary in Western Thailand. Animals 2023, 13, 1286. [Google Scholar] [CrossRef] [PubMed]
  35. Wu, F.; Hua, Y.; Dou, H.; Zhang, Y.; Dong, X.; Zhu, D.; Gao, H. Temporal, Spatial and Prey Niche Partitioning Reveals Coexistence Mechanism of Mesocarnivores in Guangdong Province, South China. Ecol. Evol. 2025, 15, e71797. [Google Scholar] [CrossRef] [PubMed]
  36. R Core Team. R: A Language and Environment for Statistical Computing; R Foundation for Statistical Computing: Vienna, Austria, 2020; Available online: https://www.R-project.org/ (accessed on 6 February 2026).
  37. Rowcliffe, J.M.; Field, J.; Turvey, S.T.; Carbone, C. Estimating animal density using camera traps without the need for individual recognition. J. Appl. Ecol. 2008, 45, 1228–1236. [Google Scholar] [CrossRef]
  38. Meredith, M.; Ridout, M.S. R Package, version 0.3.2; Overview of the Overlap Package; R Core Team: Vienna, Austria, 2016.
  39. Han, Y.; Xiao, M.; He, M.; Li, M.; Hou, R.; Wu, P.; He, F.; Shen, L.; Hu, J.; Chen, P. The activity rhythm and space utilization among six species of ungulates in Tangjiahe National Nature Reserve, Sichuan, China. Acta Theriol. Sin. 2024, 44, 598–610. [Google Scholar]
  40. Li, Z.; Wang, J.; Khattak, R.H.; Han, X.; Liu, P.; Liu, Z.; Teng, L. Coexistence mechanisms of sympatric ungulates: Behavioral and physiological adaptations of blue sheep (Pseudois nayaur) and red deer (Cervus elaphus alxaicus) in Helan Mountains, China. Front. Ecol. Evol. 2022, 10, 904673. [Google Scholar] [CrossRef]
  41. Chen, Y.; Xiao, Z.; Zhang, L.; Wang, X.; Li, M.; Xiang, Z. Activity Rhythms of Coexisting Red Serow and Chinese Serow at Mt. Gaoligong as Identified by Camera Traps. Animals 2019, 9, 1071. [Google Scholar] [CrossRef]
  42. Kronfeld-Schor, N.; Dayan, T. Partitioning of Time as an Ecological Resource. Annu. Rev. Ecol. Evol. Syst. 2003, 34, 153–181. [Google Scholar] [CrossRef]
Figure 1. The location of the Giant Panda National Park, Chongzhou, China, and the layout of camera sites.
Diversity 18 00186 g001
Figure 2. Spatial distributions of six ungulate species and the composition of Relative Abundance Index (RAl) at each camera site in the study area.
Diversity 18 00186 g002
Figure 3. Relative activity indices (RAIs) of six ungulate species across different environmental factors. (a) Elevation (m); (b) Slope (°); (c) Aspect (N, NE, E, SE, S, SW, W, NW); (d) Vegetation type, Evergreen-deciduous broadleaf mixed forest (EDBMF), Deciduous broadleaf forest (DBF), Coniferous-broadleaf mixed forest (CBMF), Coniferous forest (CF), and Meadow (MD).
Diversity 18 00186 g003
Figure 4. Interspecific temporal activity overlap among six ungulate species in the Anzihe Nature Reserve. The curves represent kernel density estimates of diel activity; the shaded gray areas indicate the degree of temporal overlap between pairs of species. The estimated overlap coefficient (Δ) is provided for each pair, with 95% confidence intervals (CI) in parentheses. Values of Δ closer to 1 indicate higher similarity in activity patterns, while values closer to 0 suggest stronger temporal niche partitioning.
Diversity 18 00186 g004
Table 1. General monitoring data of ungulate species in Giant Panda National Park, Chongzhou, China.
Ungulate SpeciesNumber of Camera Sites That Captured SpeciesNumber of Independent PhotosRelative Abundance Index (RAI)
Tufted deer4248416.46
Sambar45131844.72
Chinese serow3153218.03
Wild boar432327.87
Blue sheep71043.52
Chinese goral191715.79
Table 2. Habitat use of six ungulate species across different environmental factors. Values represent the number of independent detection events, with percentages shown in parentheses relative to the total detections of each species. *** p < 0.001.
Habitat FactorCategoryTufted Deer (%)Sambar (%)Chinese Serow (%)Blue Sheep (%)Wild Boar (%)Chinese Goral (%)G-Test
Elevation<15008.68 2.59 G = 2208, df = 25, p < 0.001 (***)
1500–200061.9822.911.320.9665.955.85
2000–250024.5955.1614.1 27.164.68
2500–30003.116.3935.53 3.4539.77
3000–35001.655.5441.1769.230.4337.43
>3500 7.8929.810.4312.28
AspectNorth16.3226.4824.2517.319.0538.01G = 1047, df = 30, p < 0.001 (***)
Northeast2.480.152.63
East17.154.126.3222.1217.6714.04
Southeast0.21 16.35 34.5
South44.2153.1919.3623.0841.387.02
West16.5310.6211.0937.525.436.43
Northwest3.15.46 6.47
Slope0–5°7.4411.912.63 7.761.75G = 1595, df = 35, p < 0.001 (***)
6–10°5.375.240.19 17.241.75
11–15°12.412.3710.3414.425.614.62
16–20°9.091.5914.66 3.025.26
21–25°11.165.5430.647.696.4749.12
26–30°28.155.163.57 41.814.68
30–35°15.74.254.890.969.481.75
≥36°10.743.9533.0876.928.6221.05
Vegetation typeEvergreen–deciduous broadleaf mixed forest51.2418.367.140.9646.559.94G = 1436, df = 20, p < 0.001 (***)
Deciduous broadleaf forest8.0622.31 10.78
Coniferous–broadleaf mixed forest27.2752.2860.1522.1235.7857.31
Coniferous forest13.436.987.71 6.475.26
Meadow 0.082576.920.4327.49
Table 3. Relative activity indices (RAIs) of six ungulate species across different environmental factors.
Habitat FactorCategoryChinese SerowTufted DeerChinese GoralBlue SheepSambarWild Boar
Elevation<150001.430000.21
1500–20000.2310.190.340.0310.245.21
2000–25002.554.060.26024.682.12
2500–30006.410.512.307.330.27
3000–35007.410.272.172.442.470.03
>35001.4300.721.0500.03
AspectNorth4.362.692.20.6111.840.72
Northeast0.480.41000.070
East4.752.810.820.781.821.4
Southeast2.950.032000
South3.57.290.40.8123.793.24
Southwest000000
West1.992.720.371.324.762
Northwest00.51002.440.51
Slope0–5°0.481.230.105.330.61
6–10°0.030.880.102.341.36
11–15°1.862.050.850.515.520.44
16–20°2.641.490.3100.710.24
21–25°5.521.832.840.272.490.51
26–30°0.654.630.27024.673.29
30–35°0.882.590.10.031.90.75
≥36°5.971.761.222.711.760.67
Vegetation typeEvergreen–deciduous broadleaf mixed forest1.288.410.570.038.213.68
Deciduous broadleaf forest01.33009.980.84
Coniferous–broadleaf mixed forest10.854.513.320.7823.382.8
Coniferous forest1.392.210.303.120.52
Meadow4.5101.62.710.030.03
Table 4. Behavior records and estimated activity levels of six ungulate species.
Ungulate SpeciesNCircular Kernel Density Estimates
Estimated Activity LevelConfidence Interval
Chinese goral1710.474 ± 0.0480.356–0.539
Chinese serow5320.552 ± 0.0390.468–0.614
Sambar13180.465 ± 0.0270.415–0.516
Wild boar2320.490 ± 0.0390.385–0.534
Blue sheep1040.453 ± 0.0520.336–0.539
Tufted deer4840.429 ± 0.0360.363–0.501
Table 5. Diel activity overlap and confidence intervals for each species pair among the six ungulate species.
Tufted deer
W ± se
0.49 ± 0.05Sambar Dhat4p (W test)
0.480.95
4.47 ± 0.063.18 ± 0.05Chinese serow
0.030.870.070.89
0.13 ± 0.070.04 ± 0.0612.19 ± 0.067Blue sheep
0.710.750.850.750.140.81
1.09 ± 0.060.26 ± 0.051.20 ± 0.060.29 ± 0.07Wild boar
0.300.780.610.790.270.880.590.83
0.51 ± 0.060.02 ± 0.061.64 ± 0.060.081 ± 0.070.063 ± 0.06Chinese goral
0.480.800.880.790.20.860.780.860.800.86
Disclaimer/Publisher’s Note: The statements, opinions and data contained in all publications are solely those of the individual author(s) and contributor(s) and not of MDPI and/or the editor(s). MDPI and/or the editor(s) disclaim responsibility for any injury to people or property resulting from any ideas, methods, instructions or products referred to in the content.