Article

Evaluation of Eutrophication in Small Reservoirs in Northern Agricultural Areas of China

1
School of Life Sciences, Qufu Normal University, Qufu 273165, China
2
School of Economics & Management, Beijing Forestry University, Beijing 100083, China
3
School of Life Sciences, Xiamen University, Xiamen 361102, China
*
Author to whom correspondence should be addressed.
Diversity 2025, 17(8), 520; https://doi.org/10.3390/d17080520
Submission received: 5 June 2025 / Revised: 12 July 2025 / Accepted: 22 July 2025 / Published: 26 July 2025
(This article belongs to the Special Issue Diversity and Ecology of Freshwater Plankton)

Abstract

Small reservoirs have important functions, such as water resource guarantee, flood control and drought resistance, biological habitat and maintaining regional economic development. In order to better clarify the impact of agricultural activities on the nutritional status of water bodies in small reservoirs, zooplankton were quantitatively collected from four small reservoirs in the Jiuxianshan agricultural area of Qufu, Shandong Province, in March and October 2023, respectively. The physical and chemical parameters in sampling points were determined simultaneously. Meanwhile, water samples were collected for nutrient salt analysis, and the eutrophication of water bodies in four reservoirs was evaluated using the comprehensive nutrient status index method. The research found that the species richness of zooplankton after farming (100 species) was significantly higher than that before farming (81 species) (p < 0.05). On the contrary, the dominant species of zooplankton after farming (7 species) were significantly fewer than those before farming (11 species). The estimation results of the standing stock of zooplankton indicated that the abundance and biomass of zooplankton after farming (92.72 ind./L, 0.13 mg/L) were significantly higher than those before farming (32.51 ind./L, 0.40 mg/L) (p < 0.05). Community similarity analysis based on zooplankton abundance (ANOSIM) indicated that there were significant differences in zooplankton communities before and after farming (R = 0.329, p = 0.001). The results of multi-dimensional non-metric sorting (NMDS) showed that the communities of zooplankton could be clearly divided into two: pre-farming communities and after farming communities. The Monte Carlo test results are as follows (p < 0.05). Transparency (Trans), pH, permanganate index (CODMn), electrical conductivity (Cond) and chlorophyll a (Chl-a) had significant effects on the community structure of zooplankton before farming. Total nitrogen (TN), total phosphorus (TP) and electrical conductivity (Cond) had significant effects on the community structure of zooplankton after farming. The co-linearity network analysis based on zooplankton abundance showed that the zooplankton community before farming was more stable than that after farming. The water evaluation results based on the comprehensive nutritional status index method indicated that the water conditions of the reservoirs before farming were mostly in a mild eutrophic state, while the water conditions of the reservoirs after farming were all in a moderate eutrophic state. The results show that the nutritional status of small reservoirs in agricultural areas is significantly affected by agricultural activities. The zooplankton communities in small reservoirs underwent significant changes driven by alterations in the reservoir water environment and nutritional status. Based on the main results of this study, we suggested that the use of fertilizers and pesticides should be appropriately reduced in future agricultural activities. In order to better protect the water quality and aquatic ecology of the water reservoirs in the agricultural area.

1. Introduction

Reservoirs play a crucial role in the regional economy and ecological security. People often use reservoirs for agricultural irrigation, flood control, aquaculture, water supply and power generation, etc. [1]. In China, small reservoirs account for as high as 95% of all 98,000 reservoirs [2]. In recent years, the degree of intensification of modern agriculture has been continuously improving. Agricultural non-point source pollution is having an increasingly serious impact on the water environment of rivers, reservoirs, lakes and other water bodies [3]. Under the influence of agricultural activities, many reservoirs have experienced water pollution incidents or witnessed the phenomenon of eutrophication [4,5]. Economic activities such as agricultural planting and aquaculture have been directly affected [6]. Eutrophication is one of the major problems currently faced by freshwater ecosystems worldwide [7]. Many reports have indicated that water body eutrophication can have a significant impact on regional economic development [8,9]. For the sake of regional ecological security and sustainable economic development, scientists have conducted extensive research on the causes of eutrophication in reservoirs and their management [10]. Research on Waihu Reservoir indicates that the causes of eutrophication include endogenous pollution (a significant accumulation of sediment) and exogenous pollution (raw domestic sewage from surrounding villages, rural solid waste and livestock manure). Reducing the input of Nutrient salt, such as nitrogen and phosphorus, is the main goal for exogenous pollution in Waihu Reservoir [11]. A study about the Three Gorges Reservoir area has found that the eutrophication of reservoir water bodies in agricultural areas is mainly caused by agricultural surface pollution [12]. The effective micro-organisms (EM) were used in a eutrophic reservoir on the Mała Panew River in Poland, which achieved good results [13]. However, the current research on reservoir eutrophication is mainly focused on large and medium-sized reservoirs [14,15]. Due to their small storage capacity and rapid changes in the water environment, small reservoirs are more susceptible to interference from external activities [16]. The input of nutrient salt in areas with intensive agricultural activities is more likely to affect small reservoirs, leading to an increased risk of eutrophication [17]. The community structure of aquatic organisms often undergoes significant changes in eutrophic water bodies due to alterations in the water environment [18]. For instance, the invasive macrophytes (such as Eichhornia crassipes) can grow rapidly under conditions of eutrophication [19]. The fish population structure shows miniaturization and simplification under the condition of eutrophication [18]. The oligochaetes among the zoobenthos have a dominant position in reservoirs with high nutrient levels [20]. Plankton is small in size and is highly sensitive to water environment changes [21]. During the process of eutrophication in reservoirs, zooplankton community structure can respond rapidly [22]. Community succession of zooplankton is mainly characterized by an increase in the proportion of tolerant species (such as rotifers and small cladocera), while the species richness of sensitive species (such as large cladocera and calanoida) decreases significantly [23,24].
Zooplankton are an important biological component and ecological functional group in freshwater ecosystems [25], which play a crucial role in the material circulation and energy flow process of freshwater ecosystems [26]. As a crucial link connecting producers and consumers, it is significantly influenced by the bottom-up effect and top-down effect in the aquatic food chain. It is usually constrained by both phytoplankton and filter-feeding fish [27,28]. Furthermore, due to their small size and rapid reproduction, zooplankton have the characteristic of being highly sensitive to changes in the water environment [29]. The dynamic changes in zooplankton communities can directly reflect the ecological conditions of water bodies [30]. They are often used as indicators to evaluate water quality and the nutritional status of the water bodies [31]. Research on reservoir zooplankton is quite extensive, both domestically and internationally. For instance, in terms of studying the relationship between the changes in the structure of zooplankton communities and environmental factors, researchers have found that the main environmental factors affecting the structure of zooplankton communities in five reservoirs in Nanjing are nutrient salt, water temperature and transparency [32]. In the study of the planktonic food web, a model consisting of 63 functional nodes revealed that filter-feeding zooplankton and predatory zooplankton were, respectively, the main consumers in both waterbloom and non-waterbloom states [33]. In the study of zooplankton as environmental indicators and water quality assessment, researchers have found that the abundance and biomass of rotifers have a certain degree of reliability in indicating the nutritional status of water bodies, but the evaluation results are greatly affected by the season [34]. When studying the impact of climate change on zooplankton in the Rybinsk Reservoir, it was found that global warming led to an increase in the number of crustacean zooplankton in the reservoir, accelerating the process of reservoir eutrophication and deterioration of water quality [35]. However, there are few reports on the impact of agricultural activities on the eutrophication of reservoirs and the zooplankton communities.
In order to analyze the impact of agricultural activities on the zooplankton communities and water quality of small reservoirs, this study selected four small reservoirs in the Jiuxian Mountain agricultural area of Qufu City, Shandong Province, as the research sites. The focus of the study was on the zooplankton and the water environmental factors of the reservoirs. We aimed to explore the following two questions: (1) to investigate the differences in the structure of the zooplankton communities in small reservoirs before and after farming and analyze the impact of agricultural activities on the zooplankton communities. (2) To evaluate the water eutrophication level of the reservoirs before and after farming and analyze the impact of agricultural activities on the nutritional status of small reservoirs. The research results are expected to provide a scientific basis for the water resource management and water ecological protection of small reservoirs in agricultural areas and to offer scientific suggestions for agricultural activities in the area.

2. Materials and Methods
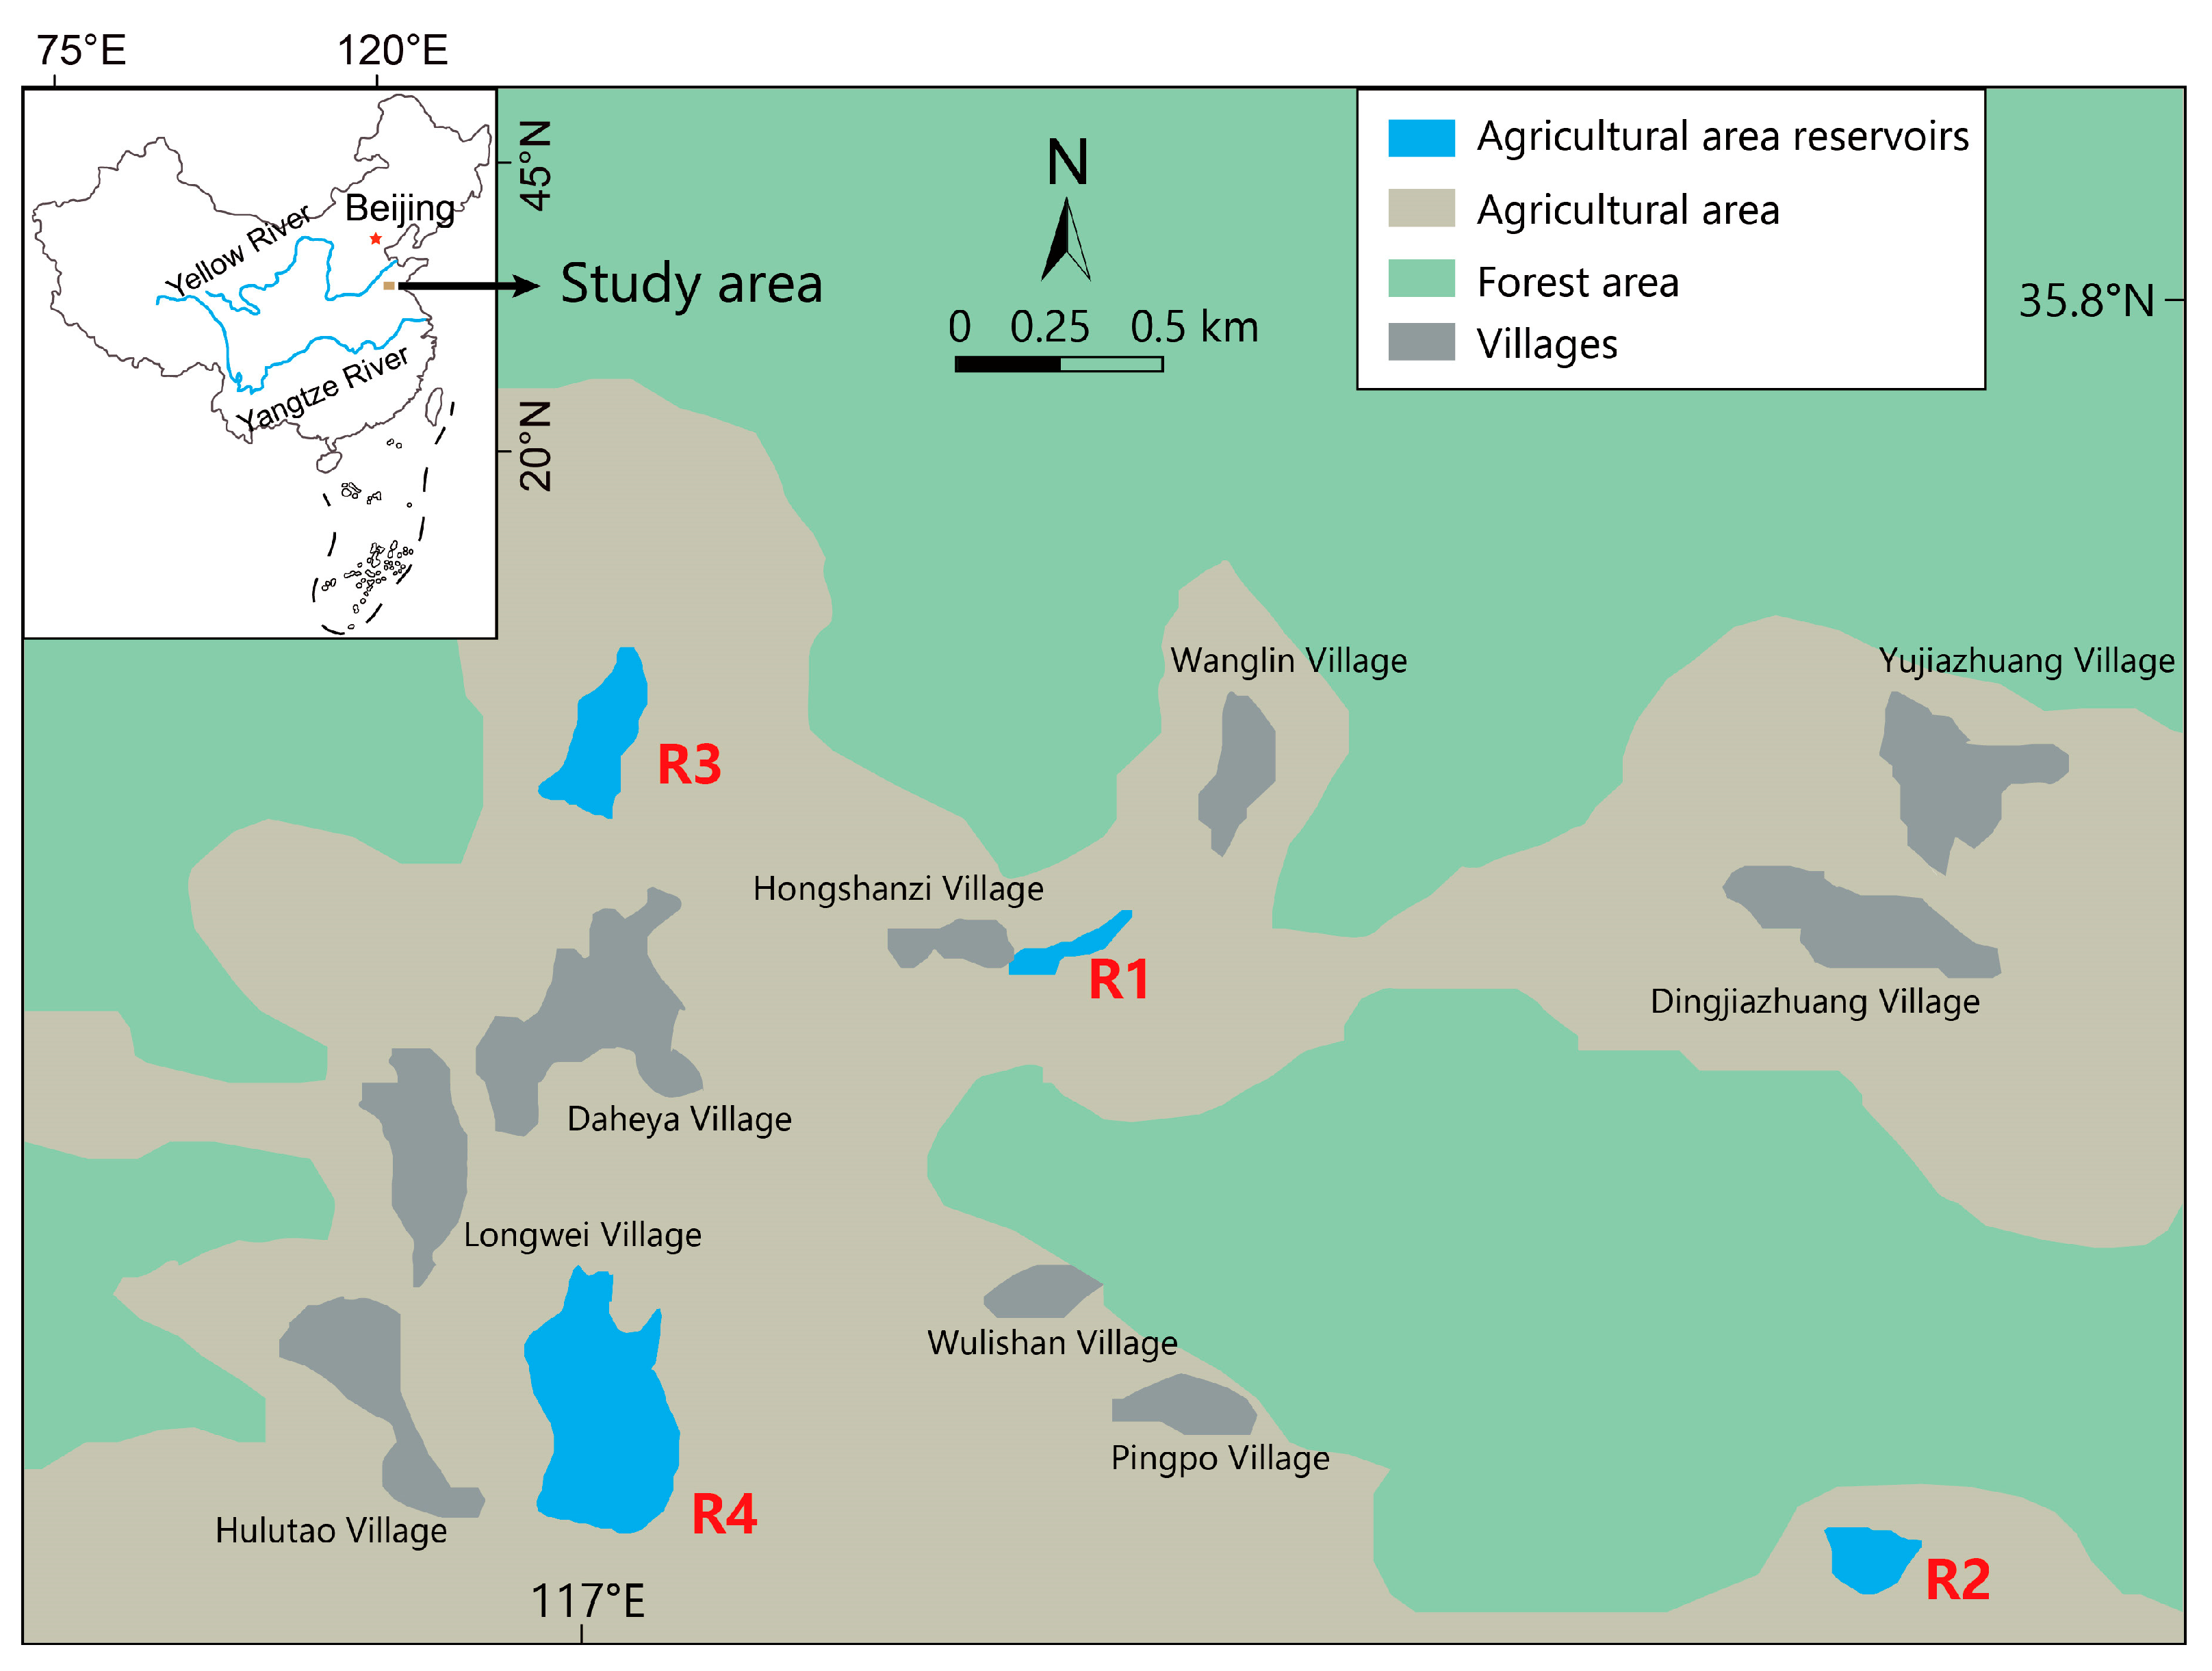
2.1. Study Area

Jiuxian Mountain in Qufu City (35°75′~35°85′ N, 117°00′~117°10′ E) is located in the southeast of Qufu City, Shandong Province. It covers an area of over 2700 hectares, with the main peak reaching an altitude of 548 m. It is located in the warm temperate monsoon climate zone, with four distinct seasons, a mild climate and moderate precipitation. Jiuxian Mountain is an important ecological protection area and agricultural base in Qufu. There are agricultural zones and small reservoirs distributed within the area. This study selected four small reservoirs in the Jiuxianshan Agricultural Area as the research sites (Figure 1). Three sampling points were set up in each reservoir, and two sampling points were set up 10 m apart at each sampling point to repeatedly collect zooplankton samples and water samples. The four reservoirs are located at different altitude gradients (Table 1). The altitude gradients of the reservoir near Hongshanzi Village (reservoir R1), the reservoir near the Revolutionary Martyrs Cemetery (reservoir R2), Jiuxian Tianchi Reservoir (reservoir R3), and Chuanliangshi Reservoir (reservoir R4) decrease in sequence.

2.2. Sample Collection and Identification

In March 2023 (before farming) and October 2023 (after farming), quantitative sampling of zooplankton was conducted in four reservoirs selected in the agricultural area of Jiuxian Mountain in Qufu. A total of 48 samples of zooplankton were collected before and after farming. Twenty liters of mixed water were collected at a depth of 50 cm by a 5 L water sampler. Zooplankton samples were collected by filtering water with a 25# plankton net (64 μm mesh size). Then, they were preserved in 50 mL bottles containing 4% formalin and transported to the laboratory. The zooplankton were stained with Sodium Acid Red 52 for 24 h. They were rinsed with slowly flowing tap water to remove the remaining formalin and staining solution. They were classified, identified and counted under a stereomicroscope (Olympus SZ61, Olympus Corporation, Tokyo, Japan). The biomass of rotifers is calculated using the volume method, with the density of zooplankton set at 1. The biomass of cladocerans and copepods was calculated using the regression equation of body length and body weight. The unit for zooplankton biomass is mg/L [36]. When the total number of zooplankton in a sample exceeded 2000, volume sampling was used for counting [36].
Zooplankton identification was performed using three fauna identification guides [21,37,38]. After the identification and counting are completed, the remaining samples are fixed and preserved by adding 4% formalin. The quantity of Copepod larvae (including juvenile Calanoida, juvenile Cyclopoida and juvenile Harpacticoida) was large and cannot be identified at the species level. Therefore, all the Copepod larvae are counted as one taxon and are referred to as “Copepod larvae”. They were not counted when calculating the species richness and dominant species. However, in the analysis of zooplankton community structure, they were treated as one taxon [39,40].

2.3. Water Sample Collection and Determination of Environmental Factors

While collecting the zooplankton samples, a multi-parameter water quality analyzer (AZ86031, AZ Instrument Corp, Taiwan, China) was used to measure the physic-chemical factors of the water at each sampling point. Water temperature (WT), dissolved oxygen (DO), acidity and alkalinity (pH) and conductivity (Cond) were the measured parameters in the field investigation. The water transparency (Trans) was measured using a Secchi disk, and the turbidity (Turb) of the water was measured using the turbidity meter (SGZ-200BS, INESA, Shanghai, China).
Furthermore, 1000 mL of water sample was collected at a depth of 50 cm at each sampling point by a water sampler. Total phosphorus (TP) was determined using the continuous flow ammonium molybdate spectrophotometric method [41]. Total nitrogen (TN) was measured using the gas-phase molecular absorption spectrometry [42]. Chlorophyll a concentration (Chl-a) was determined using the spectrophotometric method [43]. Permanganate index (CODMn) was measured using the acidic potassium permanganate method [44].

2.4. Data Statistical Analysis

The diversity changes of the zooplankton community structure were comprehensively analyzed using the Mcnaughton dominance index (Y), the Shannon-Wiener index (H′), and the Pielou evenness index (J). The calculation formula is as follows [45,46,47]:
Y = n i N · f i H = i = 1 S n i N log 2 n i N J = H l n S
In this formula, ni represents the number of individuals of the i-th species and N is the total sum of the individual numbers of all species. S represents the number of zooplankton species. fi represents the frequency of the occurrence of the species. When fi is greater than 65%, it is defined as a common species. Y represents the species dominance index. When Y is greater than or equal to 0.02, it is defined as a dominant species [48,49].
Calculate the comprehensive nutritional status index. Five indicators, namely, chlorophyll a (Chl-a), total phosphorus (TP), total nitrogen (TN), transparency (Trans) and permanganate index (CODMn), were selected as the unified indicators. The calculation formula is as follows [50]:
W j = r i j 2 j = 1 m r i j 2 T L I ( C h l a ) = 10 ( 2.5 + 1.086 l n C h l a ) T L I ( T P ) = 10 ( 9.436 + 1.624 l n T P ) T L I ( T N ) = 10 ( 5.433 + 1.694 l n T N ) T L I ( T r a n s ) = 10 ( 5.118 1.94 l n T r a n s ) T L I ( C O D M n ) = 10 ( 0.109 + 2.661 l n C O D M n )
T L I ( ) = j = 1 m W j T L I j
rij represents the correlation coefficient between the j-th parameter and the reference parameter “Chl-a”. TLI () represents the comprehensive nutritional status index. Wj is the relevant weight of the nutritional status index of the j-th parameter, and TLI (j) represents the nutritional status index of the j-th parameter. m is the number of evaluation parameters.
The Venn diagram package in R v 4.1.2 was used to generate a Venn diagram of the species composition of zooplankton. In the Statistic 7.0 statistical software, one-way ANOVA was used to test the differences in zooplankton abundance and biomass before and after farming, and p < 0.05 indicated a significant difference. Before conducting the variance analysis, all data were transformed using log (x + 1). In the Primer 5.0 software, the Bray-Curtis similarity matrix was converted for zooplankton abundance data, and based on this matrix, a similarity analysis (ANOSIM) of zooplankton communities was performed between two investigated months. A multidimensional non-metric ranking (NMDS) map was created to reveal the characteristics of zooplankton communities. In the Canoco for Windows 5.0 software, a corresponding analysis was conducted for zooplankton abundance and water physic-chemical factor data. Before the analysis, DCA detection was performed on zooplankton abundance. When the maximum eigenvalue of the first axis of DCA analysis was less than 3, redundancy analysis (RDA) was selected. When the maximum eigenvalue of the first axis was greater than 4, canonical correspondence analysis (CCA) was selected. When the maximum eigenvalue of the first axis was between 3 and 4, either RDA or CCA could be used. Subsequently, the environmental factors significantly affecting zooplankton were determined using Monte Carlo test, and a correlation graph between zooplankton and environmental factors was created. Species with an abundance greater than 0.2% were selected, and a co-linearity network diagram of zooplankton was generated in the software Gephi 0.9.2. The ratio of graph density (D) to average clustering coefficient (L) was calculated to reflect the stability of the zooplankton community structure. A smaller D/T value indicates a more stable community structure, while a larger D/T value indicates a less stable community structure.

3. Results

3.1. Analysis of Environmental Factors

The results of physicochemical factors are as follows (Table 2). After farming, all reservoirs exhibited a significant increase in conductivity (Cond) and a significant decrease in pH. Dissolved oxygen (DO) significantly increased in R1 and R4, while water transparency (Trans) significantly decreased in R2 and R3. Total nitrogen (TN) and total phosphorus (TP) significantly increased in R2, R3 and R4. Additionally, chlorophyll a (Chl-a) and permanganate index (CODMn) significantly increased in all reservoirs following farming activities.

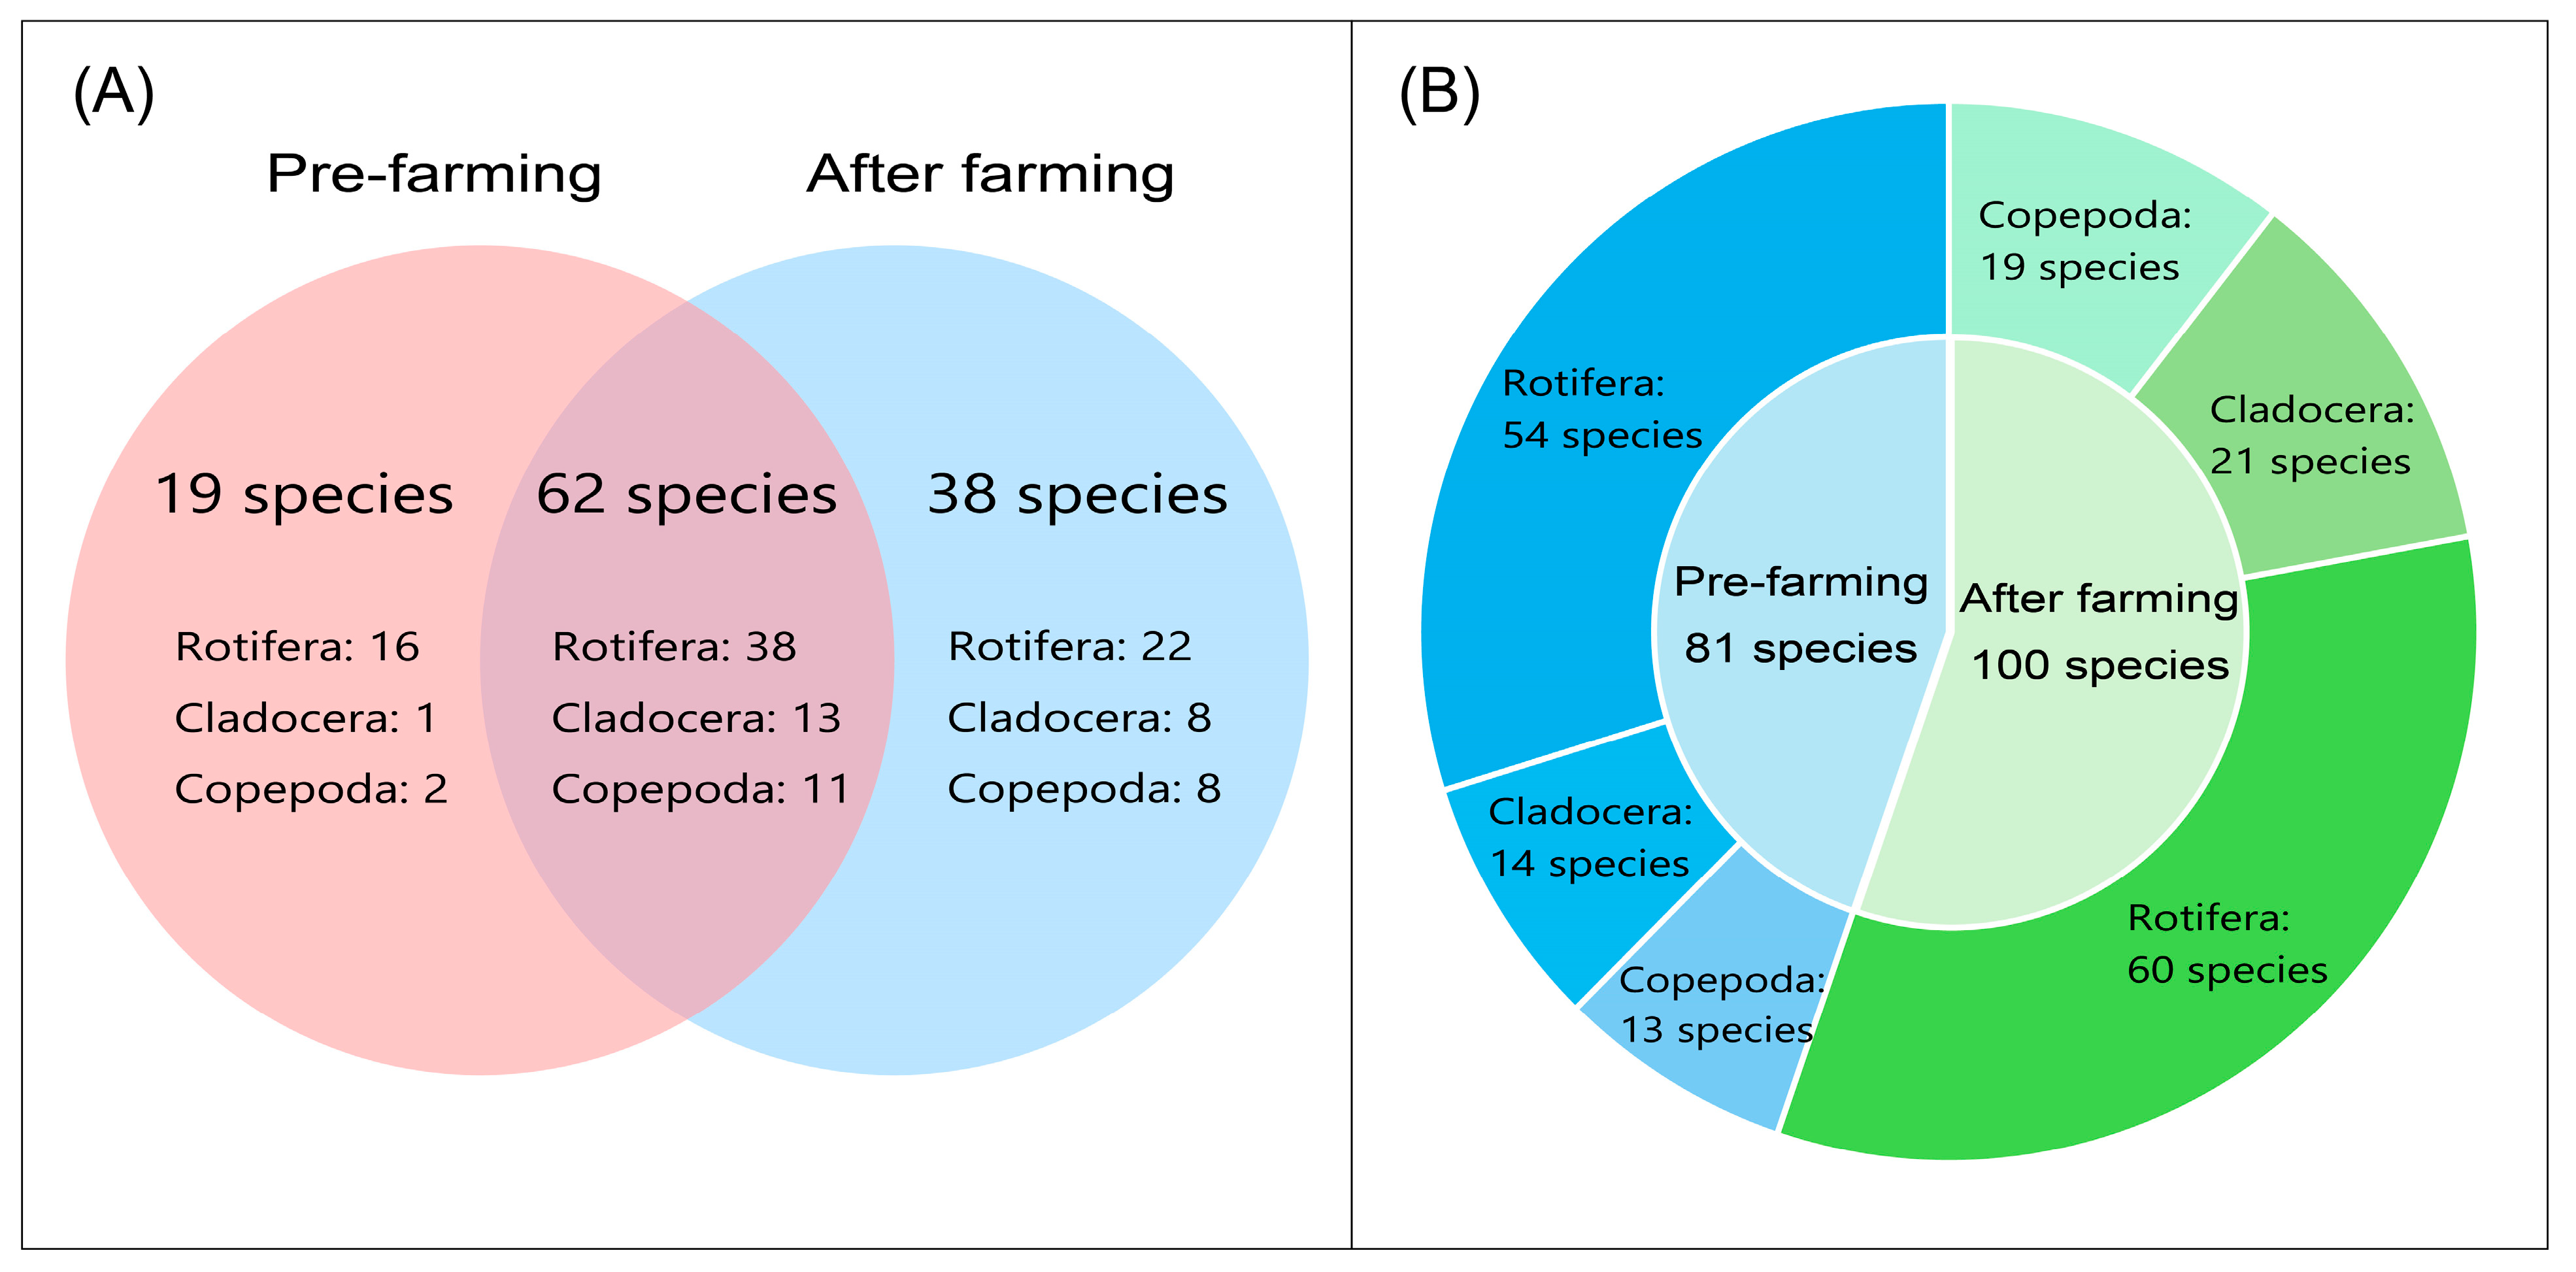
3.2. Composition of Zooplankton Species

During the two sampling surveys in March and October, a total of 119 species of zooplankton were found in the four small reservoirs of Jiuxian Mountain in Qufu. Rotifers, cladocerans and copepods accounted for 76 species, 22 species and 21 species, respectively (Figure 2A), accounting for 63.86%, 18.49% and 17.65% of the total. There were 81 species before farming, including 54 species of rotifers, 14 species of cladocerans and 13 species of copepods (Figure 2B). There were 100 species after farming, including 60 species of rotifers, 21 species of cladocerans and 19 species of copepods (Figure 2B). The species that remained unchanged before and after farming were 62 in total, including 38 species of rotifers, 13 species of cladocerans and 11 species of copepods (Figure 2A).
The differences between the Shannon–Wiener index and the Pielou evenness index of zooplankton before and after farming were significant (p < 0.05). The average values of the Shannon–Wiener index and the Pielou evenness index were 3.37 and 1.04 before farming. The average values of the Shannon–Wiener index and the Pielou evenness index were 2.82 and 0.85 after farming. The two indices of the four reservoirs were both lower after farming than before farming (Figure 3).
The Mcnaughton dominance index was calculated to obtain a total of 14 dominant species before and after farming, including 8 species of rotifers, 4 species of cladocerans, and only 2 species of copepods (Table 3). There were 11 dominant species of zooplankton before farming and 7 dominant species of zooplankton after farming. Among the 14 dominant species, Brachionus diversicornis, Asplanchna priodonta, Polyarthra trigla, and Mesocyclops leuckarti were the common dominant species before and after farming.

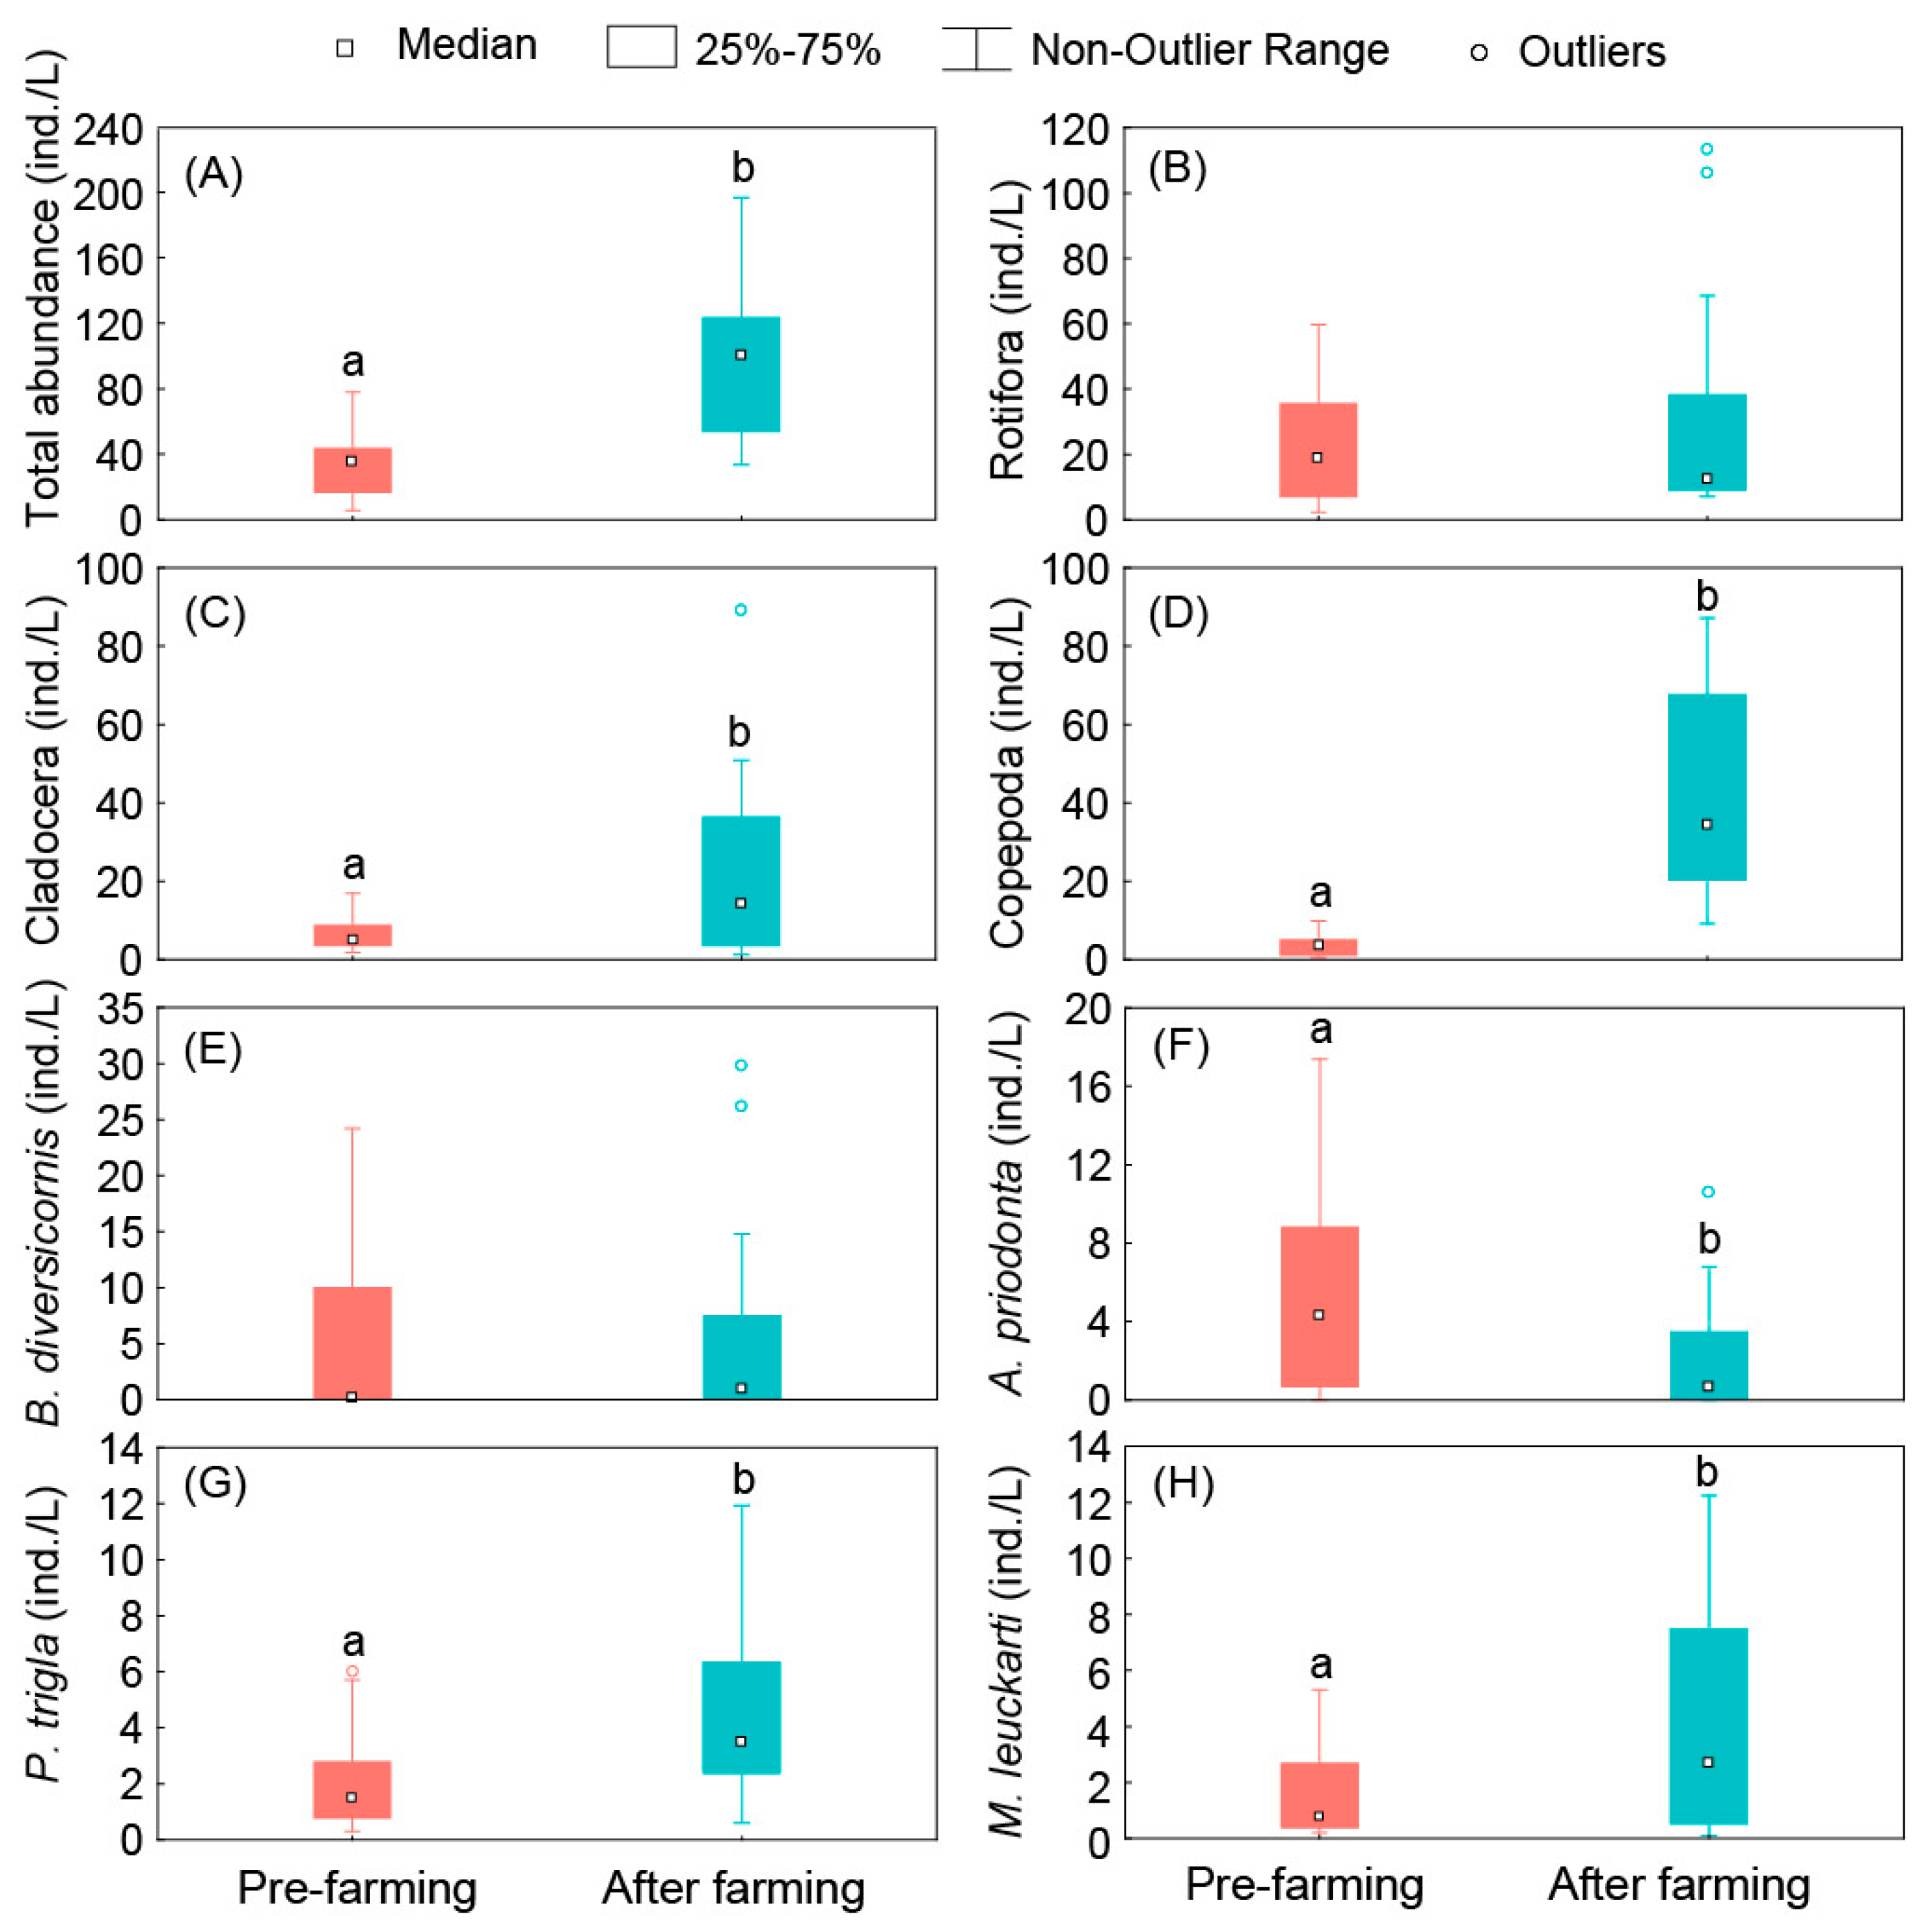
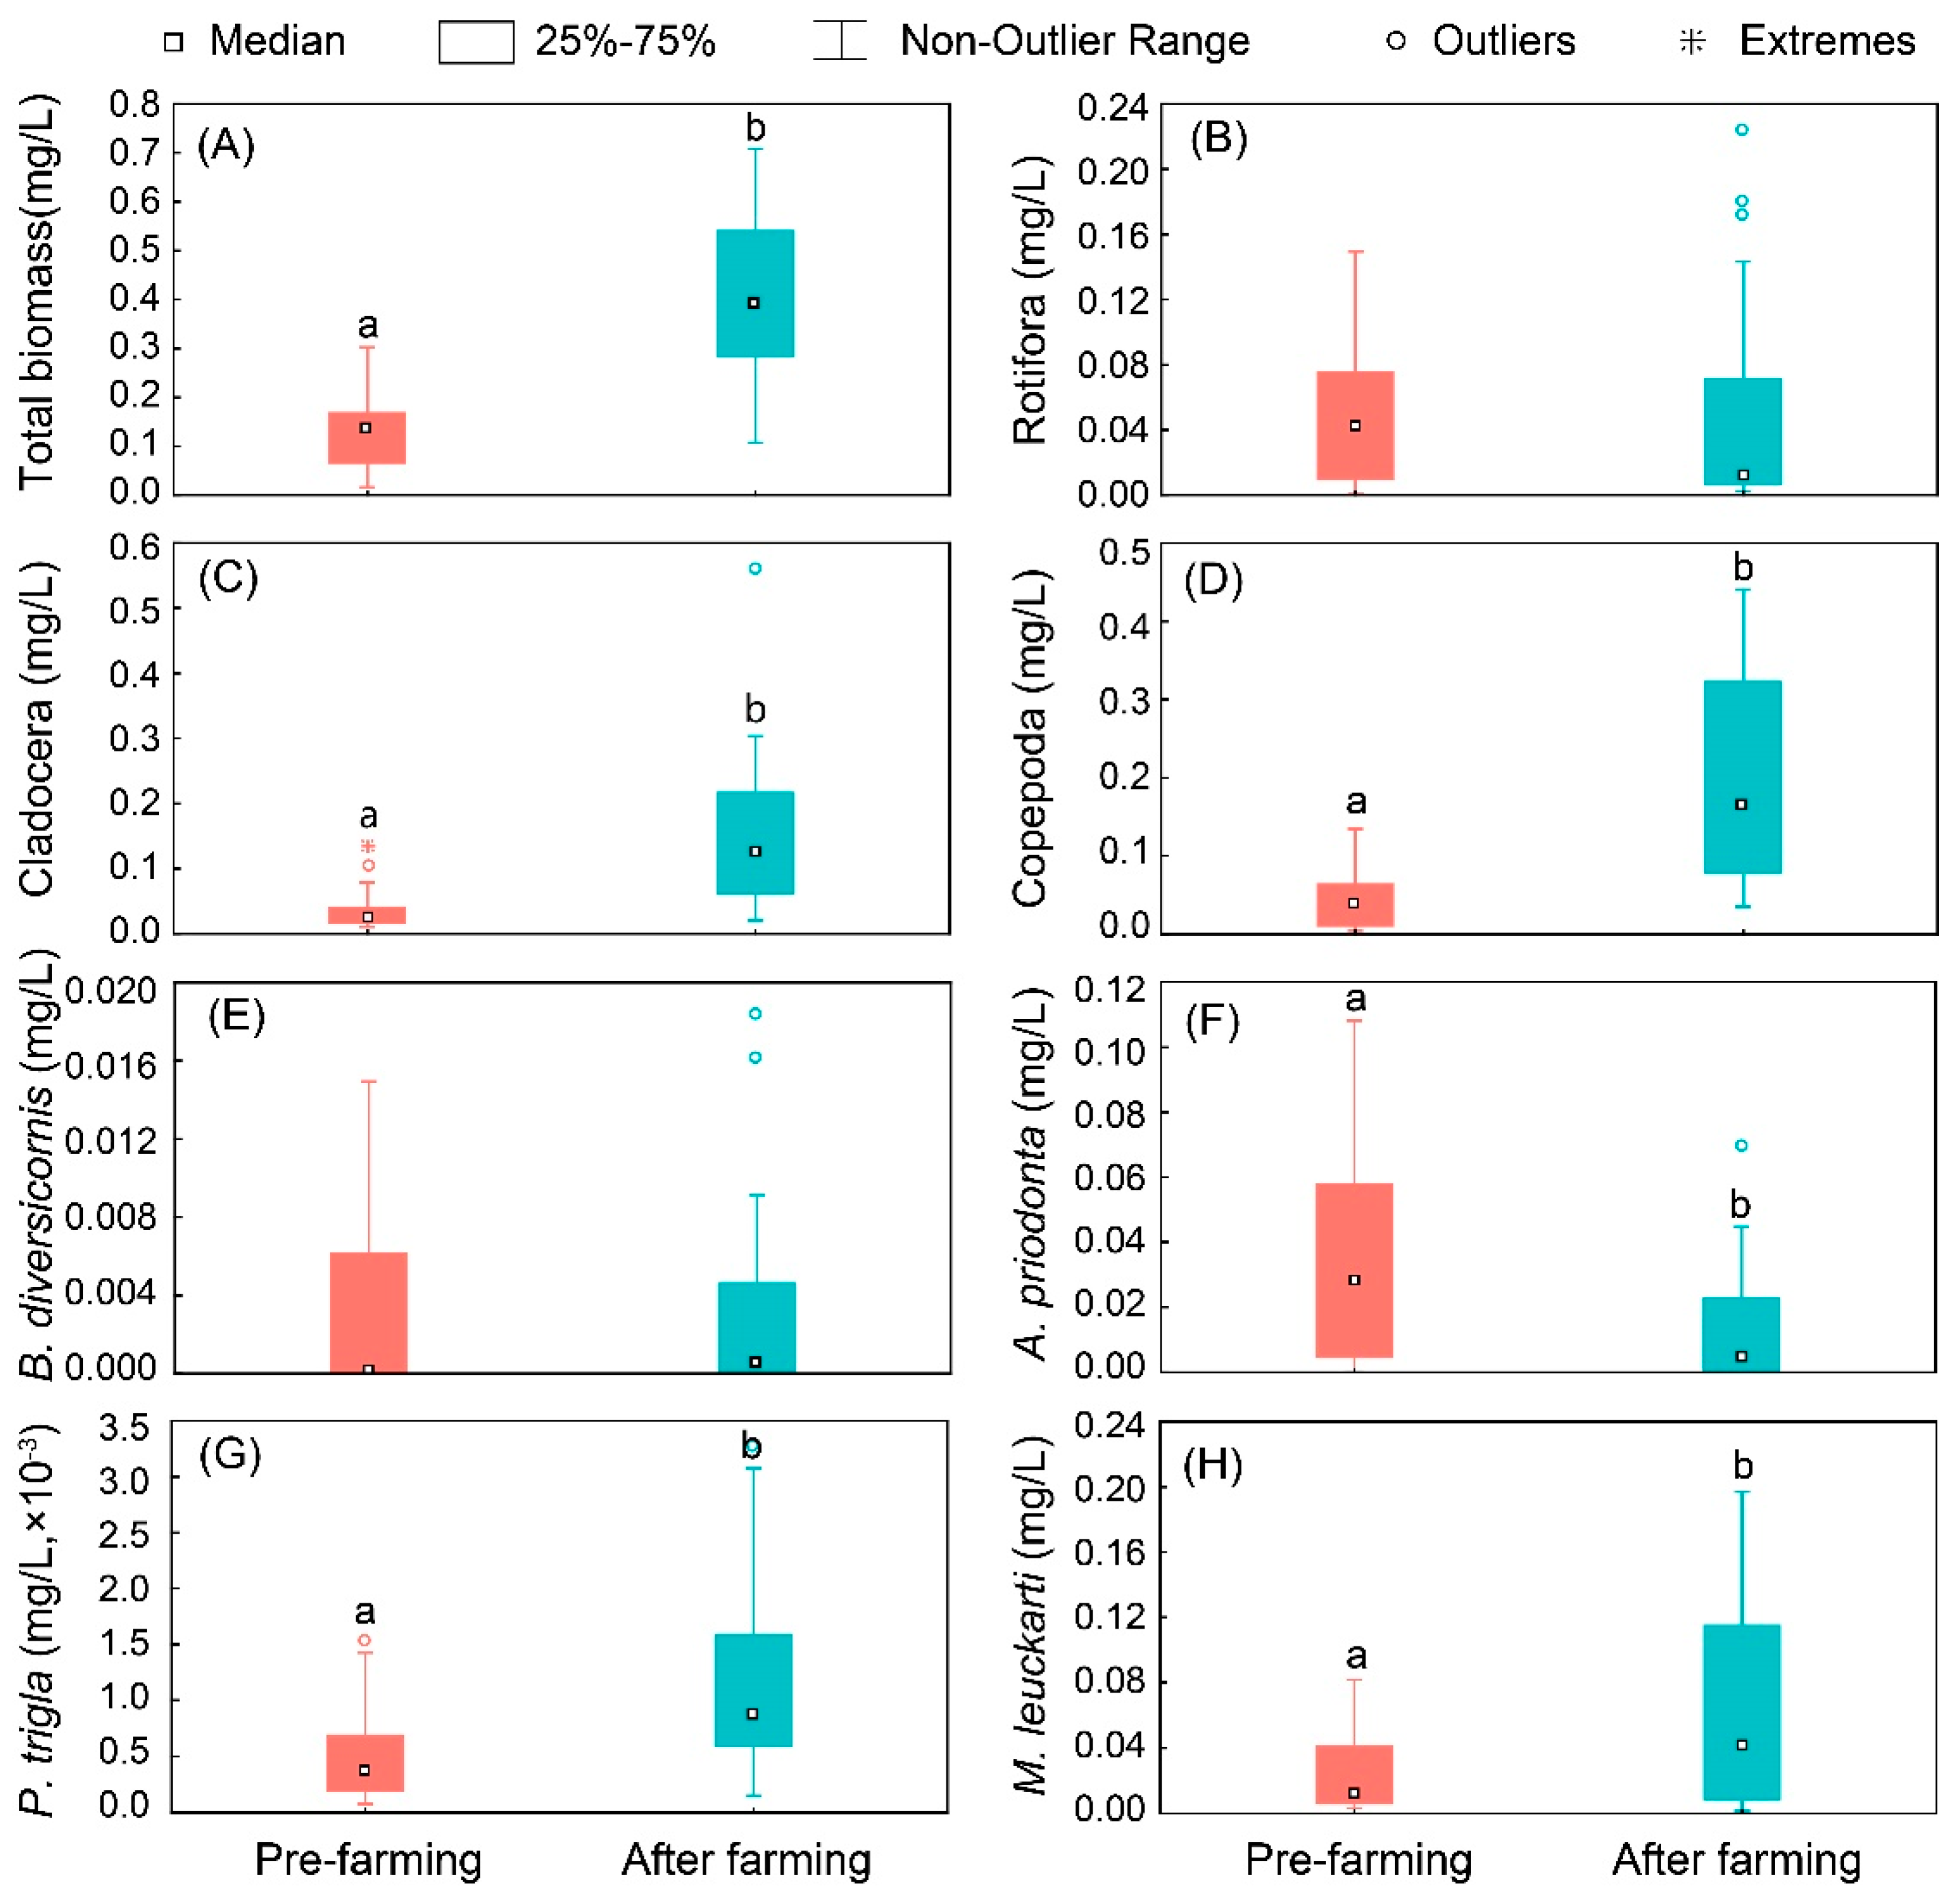
3.3. Standing Stock of Zooplankton

The total abundance of zooplankton after farming was significantly higher than that before farming (p < 0.05, Figure 4A). The average abundance of zooplankton after farming (92.72 ind./L) was approximately 2.85 times that before farming (32.51 ind./L). The average abundance of rotifers before farming (22.41 ind./L) and after farming (28.64 ind./L) was similar (Figure 4B). The average abundances of cladocerans and copepods after farming were significantly higher than those before farming (p < 0.05, Figure 4C,D). Specifically, the average abundances of cladocerans and copepods before farming were 6.38 ind./L and 3.72 ind./L, respectively, while after farming they were 21.66 ind./L and 42.42 ind./L. The average abundance of zooplankton in the R1-R4 reservoirs before farming was 32.82 ind./L, 7.03 ind./L, 54.37 ind./L and 35.82 ind./L, respectively. The average abundance of zooplankton in the R1–R4 reservoirs after farming was 37.37 ind./L, 117.70 ind./L, 76.92 ind./L, and 138.9 ind./L, respectively.
Among the four dominant species, there were significant differences before and after farming in three species (p < 0.05), namely Asplanchna priodonta, Polyarthra trigla, and Mesocyclops leuckarti. Only the average abundance of Asplanchna priodonta was greater before farming (5.20 ind./L) than after farming (2.06 ind./L) (Figure 4F–H). The average abundance of Brachionus diversicornis showed no significant difference before and after farming (5.54 ind./L vs. 5.07 ind./L, Figure 4E).
The total biomass of zooplankton after farming was significantly higher than that before farming (p < 0.05, Figure 5A). The average biomass of zooplankton after farming (0.40 mg/L) was approximately 3.08 times that before farming (0.13 mg/L). The average biomass of rotifers before and after farming was basically the same, approximately 0.05 mg/L (Figure 5B). The average biomass of cladocerans and copepods after farming was significantly higher than that before farming (p < 0.05, Figure 5C,D). Specifically, the average biomass of cladocerans and copepods before farming was 0.04 ind./L and 0.05 ind./L, respectively, while after farming it was 0.15 mg/L and 0.20 mg/L. The average biomass of zooplankton in the R1-R4 reservoirs before farming was 0.14 mg/L, 0.21 mg/L, 0.14 mg/L, and 0.03 mg/L, respectively. The average biomass of zooplankton in the R1–R4 reservoirs after farming was 0.40 mg/L, 0.19 mg/L, 0.50 mg/L, and 0.53 mg/L, respectively.
Among the four dominant species, there were significant differences before and after farming in three species (p < 0.05), namely Asplanchna priodonta, Polyarthra trigla, and Mesocyclops leuckarti. Only the average biomass of Asplanchna priodonta was greater before farming (0.03 mg/L) than after farming (0.01 mg/L) (Figure 5F–H). The average biomass of Brachionus diversicornis showed no significant difference before and after farming, at approximately 0.003 mg/L (Figure 5E).

3.4. Structure Characteristics of Zooplankton Communities

The community similarity analysis (ANOSIM) based on the number of individual zooplankton revealed significant differences in the zooplankton communities before and after farming (R = 0.329, p = 0.001). The multidimensional non-metric ranking (NMDS) map showed that the zooplankton communities in the Jiuxian Mountain Small Reservoir group could be clearly divided into two groups: the community before farming and the community after farming (Figure 6).

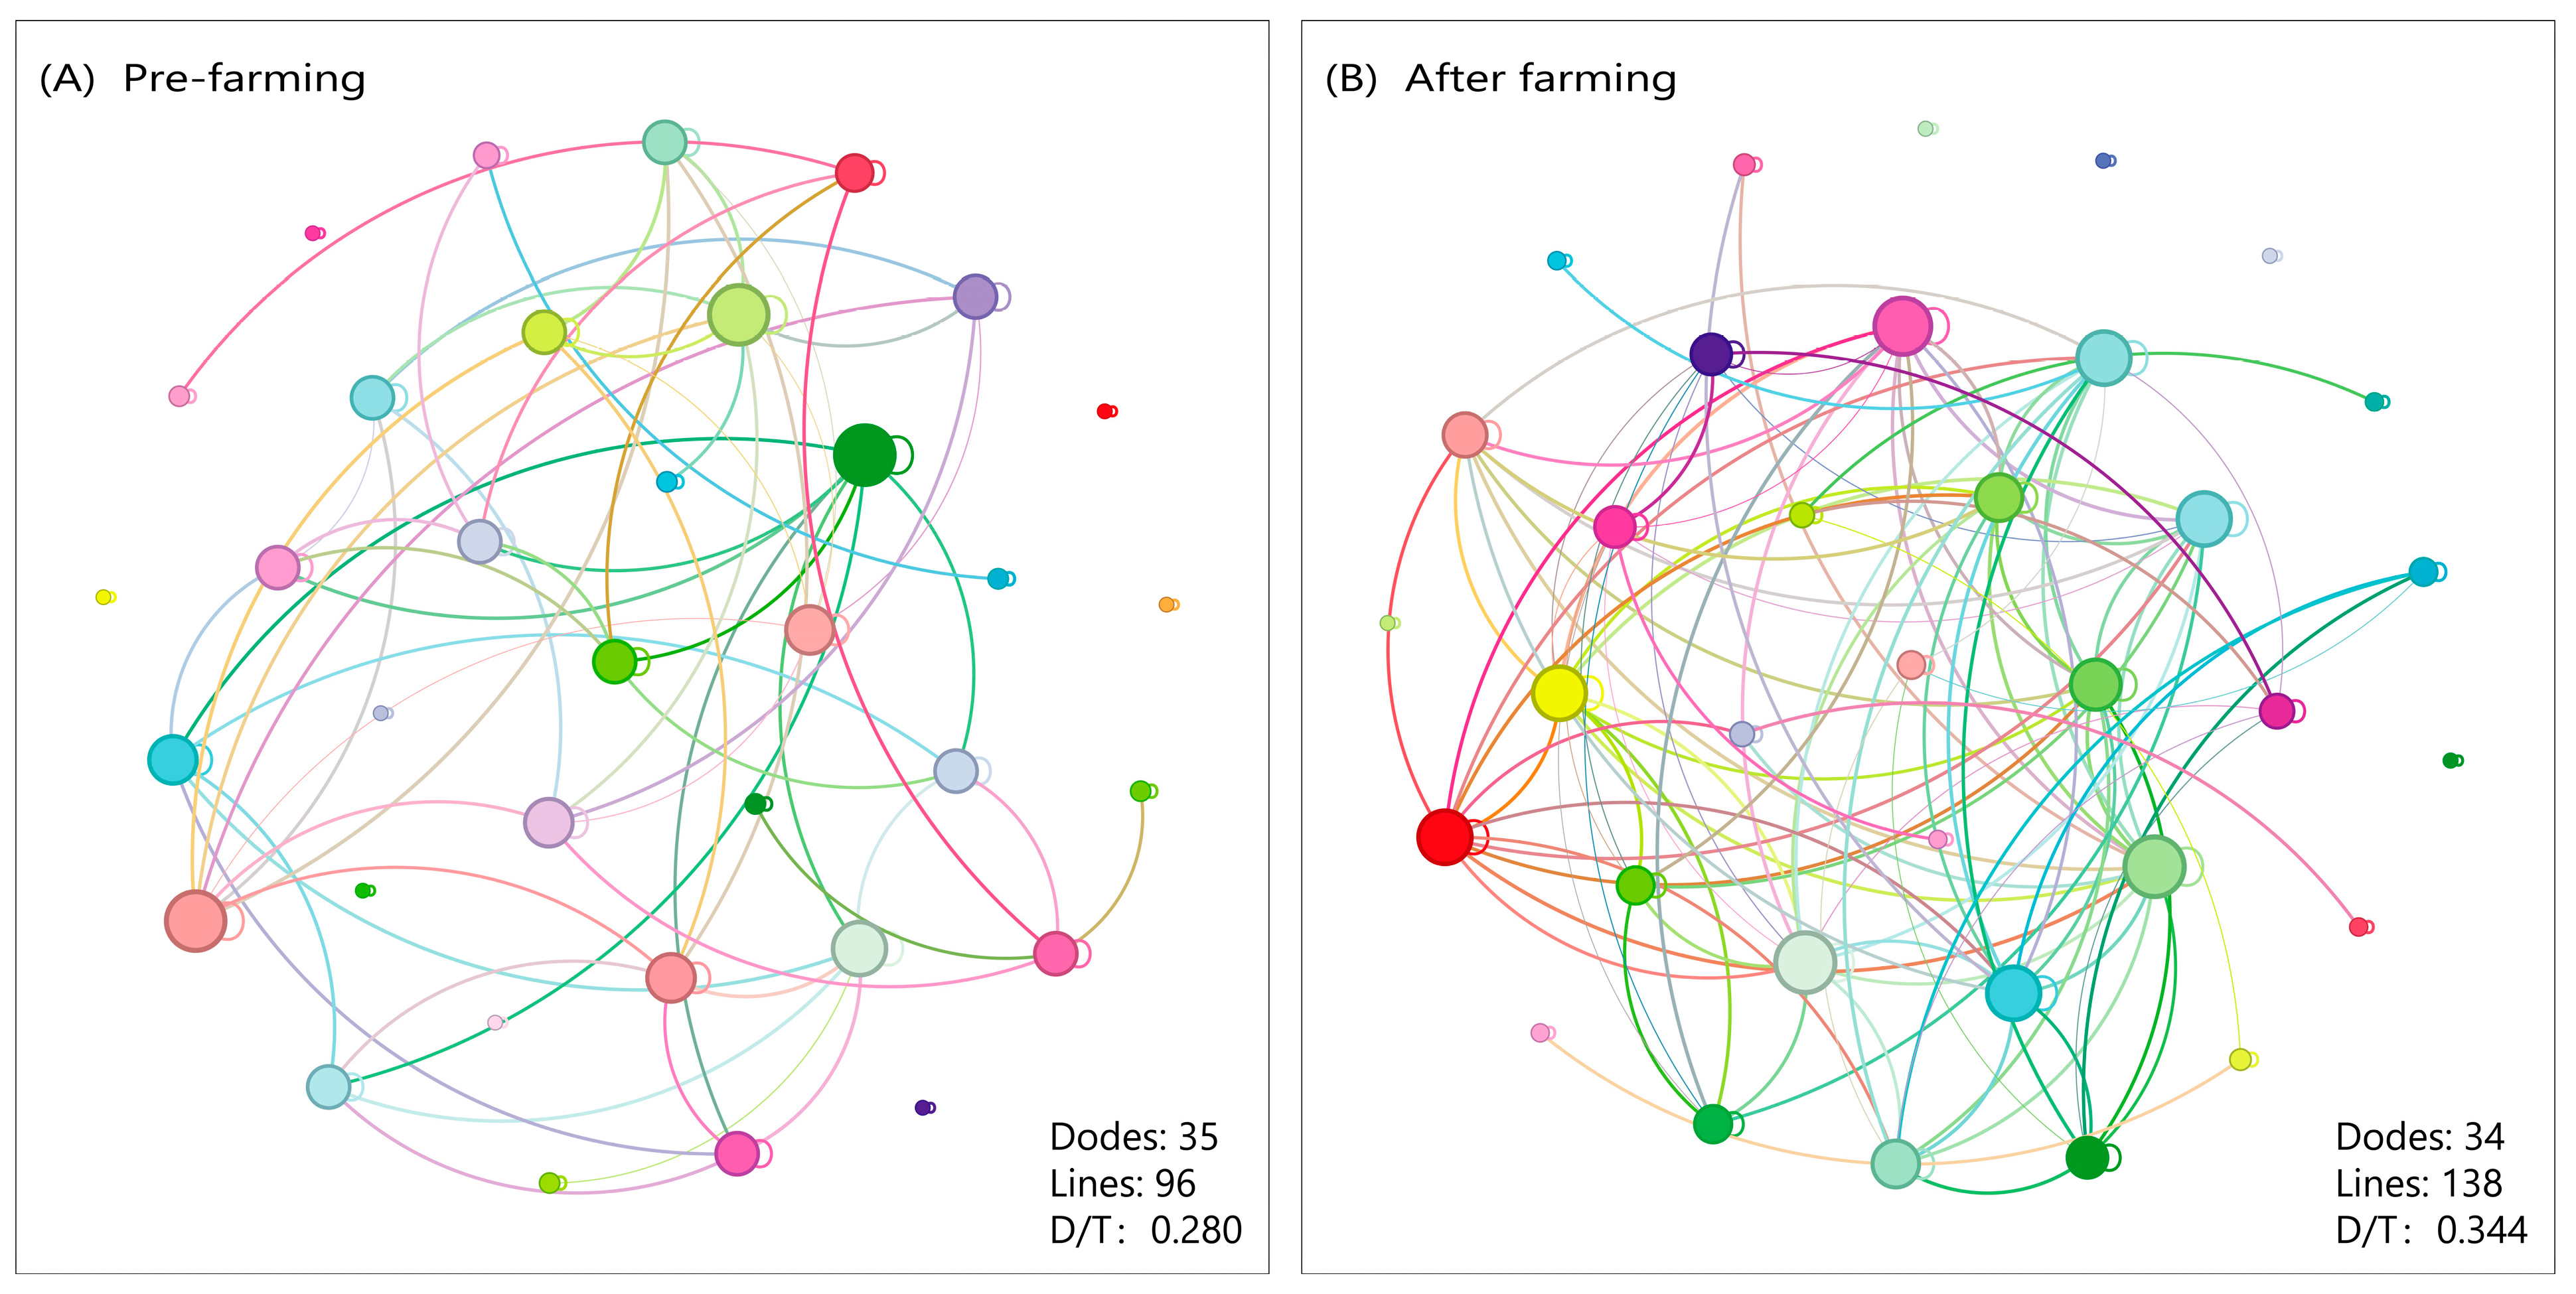
3.5. Stability of Zooplankton Community

The results of collinear network analysis based on the abundance of zooplankton showed that there were significant differences in the stability of zooplankton before and after farming (Figure 7). The D/T value of zooplankton before farming was 0.280, while that after farming was 0.344. The result indicates that the zooplankton community before farming was more stable than that after farming.

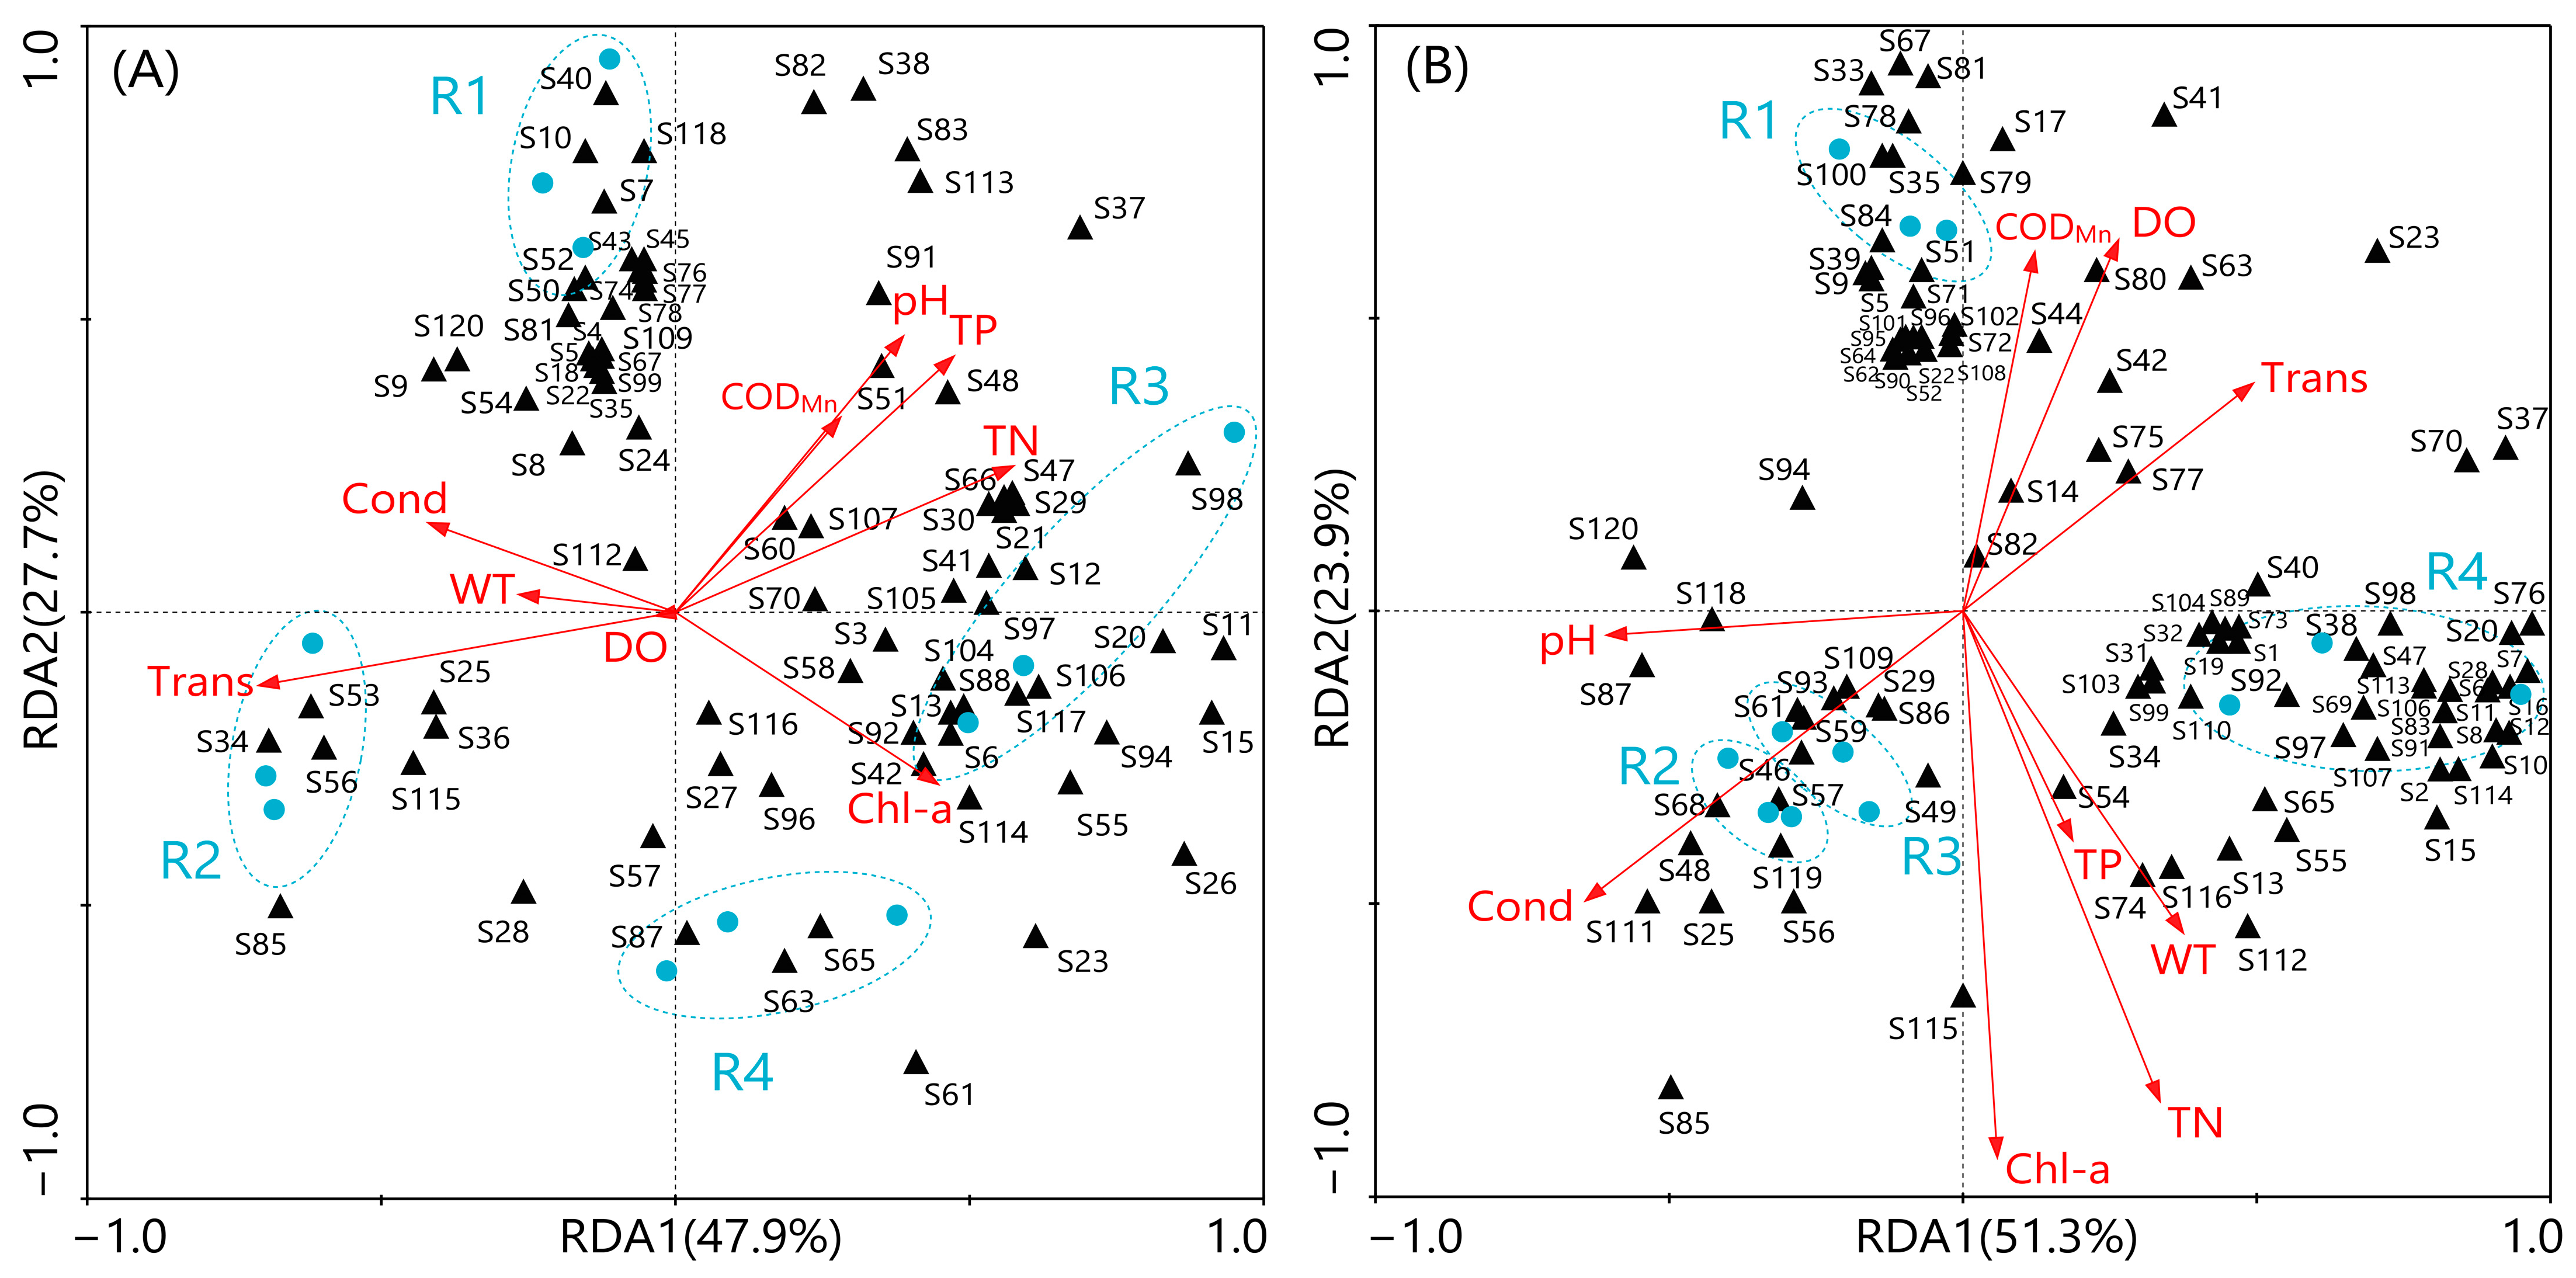
3.6. Relationship Between Zooplankton and Environmental Factors

Firstly, the trend removal analysis (DCA) was conducted separately on the abundance of zooplankton before and after farming. Maximum eigenvalue lengths obtained before farming were 2.538 (less than 3), while those after farming were 1.85 (less than 3). Therefore, the redundancy analysis (RDA) model was selected to conduct correlation analysis between zooplankton and water environment factors before and after farming. The results of redundancy analysis (RDA) showed that the first axis of species-environmental factors in the pre-farming period had a characteristic value of 0.479 and the second axis had a characteristic value of 0.277. The first two axes together explained 75.6% of the variation rate of zooplankton (Figure 8A). The first axis of species-environmental factors in the post-farming period had a characteristic value of 0.513 and the second axis had a characteristic value of 0.239. The first two axes together explained 75.2% of the variation rate of zooplankton (Figure 8B).
The Monte Carlo test results are as follows. Transparency (Trans, p = 0.018, F = 3.66), pH (p = 0.01, F = 3.69), permanganate index (CODMn, p = 0.036, F = 3.00), electrical conductivity (Cond, p = 0.002, F = 5.54) and chlorophyll a (Chl-a, p = 0.048, F = 2.87) had significant effects on the community structure of zooplankton before farming. However, total nitrogen (TN, p = 0.002, F = 8.41), total phosphorus (TP, p = 0.008, F = 7.34) and electrical conductivity (Cond, p = 0.006, F = 4.37) had significant effects on the community structure of zooplankton after farming.
Before farming, the abundance of dominant zooplankton species (S11, S15, S23, S26, S37, S38, S61, S82, S83, S98 and S116) was positively correlated with CODMn, pH, TP, TN and Chl-a, and negatively correlated with Trans, Cond and WT (Figure 8A). After farming, the abundance of dominant zooplankton species (S8, S15, S112 and S116) were positively correlated with TP, TN, WT and Chl-a, and negatively correlated with pH, Cond, Trans, DO and CODMn (Figure 8B). The abundance of zooplankton dominant species (S37) after farming was positively correlated with Trans, DO and CODMn, and negatively correlated with TP, TN, WT, Chl-a, pH and Cond (Figure 8B). The abundance of zooplankton dominant species (S61, S85) after farming was positively correlated with pH and Cond, and negatively correlated with Trans, DO, CODMn, TP, TN, WT and Chl-a (Figure 8B).

3.7. Evaluation of Water Body Eutrophication

The eutrophication level of water bodies before and after farming in the reservoirs of Jiuxianshan agricultural area was evaluated through the comprehensive nutritional status index (TLI) method. The results showed that the average value of the comprehensive nutritional status index of the small reservoirs water before farming is 53.45. This value indicated that the reservoir was in a mild eutrophication state (Table 4). The average value of the comprehensive nutritional status index of the small reservoirs after farming was 66.50. This index indicated that the reservoir was in a moderate eutrophication state.

4. Discussion

4.1. The Structure and Stability of the Zooplankton Community

The differences in the structure of zooplankton communities mainly manifest in the changes in species composition, abundance, biomass and diversity index [51]. The total number of zooplankton species increased after farming, and the proportion of rotifers was the largest both before and after farming. This is consistent with the research results of many researchers [52,53]. This is mainly because rotifers are small in size and have the characteristic of parthenogenesis, which enables them to reproduce quickly in a short period of time [54]. They have strong adaptability, enabling them to quickly occupy an advantageous position in aquatic ecosystem [55,56]. Many studies on the dynamic changes in zooplankton in the same month have shown that the abundance and biomass of zooplankton in March are usually lower than those in other months [57,58]. The Shannon–Wiener index and the Pielou evenness index of zooplankton are usually higher in October than in March [58]. This is mainly attributed to seasonal variations. In this study, the abundance and biomass of zooplankton also showed a trend where they were lower before farming (in March) than after farming (in October). In contrast, common species (Brachionus calyciflorus and Bosmina longirostris) in eutrophic water bodies experienced an outbreak [24,59]. This indicates that agricultural activities have exacerbated the degree of water body eutrophication. The Shannon–Wiener index and the Pielou evenness index of the zooplankton in this study showed that the values were higher before farming (in March) than after farming (in October). This was mainly due to the decrease or even disappearance of sensitive species (such as Argonotholca foliacea), which led to a reduction in the diversity of zooplankton after farming [24].
Zooplankton mainly feed on phytoplankton, bacteria and organic debris [60]. Phytoplankton can influence the structure of the zooplankton community through the bottom-up effect [61]. The research results on phytoplankton conducted simultaneously in this laboratory indicate that the abundance of phytoplankton in reservoir R4 was the highest after farming. This result supports the findings of this study, which is that the abundance of planktonic animals in reservoir R4 is the highest after farming. The main reason is that the reservoir R4 has the lowest altitude, and the surrounding agricultural areas have a high concentration of nutrient salt. A large amount of nutrient salt flow in, resulting in a significant increase in the biomass of phytoplankton. Under the driving effect of this bottom-up, the abundance of zooplankton also increases significantly.
In terms of dominant species, there are significant differences in the dominant species of zooplankton before and after farming. The number of dominant species decreased significantly after farming. The species such as Brachionus diversicornis, Asplanchna priodonta, Polyarthra trigla, and Mesocyclops leuckarti are all dominant species before and after farming, indicating that they have a strong tolerance to environmental changes and can maintain their population dominance in different ecological conditions. However, some rotifers that were dominant before farming, such as Brachionus quadridentatus and Keratella cochlearis, lost their dominant position after farming, indicating that they are more sensitive to environmental changes. The new environment after farming is no longer suitable for their large-scale reproduction [24]. Bosmina longirostris and Microcyclops varicans became dominant species after farming, indicating that agricultural activities are more conducive to the growth and reproduction of these crustacean zooplankton. In addition, zooplankton are the natural food sources for filter-feeding fish (such as common carp and bighead carp) and the initial food for juvenile fish. The community structure is affected by the top-down effect [57]. This study found that among the dominant species with significant differences before and after farming, only Asplanchna priodonta had a lower current population size after farming than before farming, and the decrease in the Asplanchna priodonta was mainly manifested in reservoir R1. We speculate that the silver carp and bighead carp in reservoir R1 have a certain predatory effect on the Asplanchna priodonta after farming, which is consistent with the research results of Yang Yu Feng and Chen Xinlei [62,63].
Many studies have shown that the stability of community structure is affected by the richness and abundance of dominant species of zooplankton [64,65]. The more dominant species there are, the lower the dominance index and the higher the stability of the zooplankton community structure. This study found that there was a total of 11 dominant species of zooplankton and the dominance index was low before farming. There were seven dominant species and the dominance index was high after farming. The result indicates that the stability of the zooplankton community structure before farming was higher, which is completely consistent with the results of the collinear network analysis in this study (Figure 7).

4.2. Relationship Between Zooplankton Community Structure and Environmental Factors

The community structure of zooplankton is not only influenced by biological factors such as predation and competition, but also by non-biological factors (water environmental factors) [66]. Different water environmental factors have different mechanisms of influencing the community structure of zooplankton [67]. Transparency (Trans), pH, permanganate index (CODMn), electrical conductivity (Cond) and chlorophyll a (Chl-a) had significant effects on the community structure of zooplankton before farming. Total nitrogen (TN), total phosphorus (TP) and electrical conductivity (Cond) had significant effects on the community structure of zooplankton after farming. This transformation is due to the increased input of nutrients resulting from agricultural activities. The degradation of fertilizers and pesticides in agricultural production can increase the total nitrogen (TN) and total phosphorus (TP) content in water bodies [68]. After farming, the contents of total nitrogen (TN) and total phosphorus (TP) increased (Table 2) and became the main environmental factors affecting the zooplankton community. Total nitrogen (TN) and total phosphorus (TP) include the nutrients on which phytoplankton grow, and total phosphorus (TP) can directly affect zooplankton such as Daphnia that contain phosphorus [69]. In addition, the content of chlorophyll an increase after farming. Chlorophyll a (Chl-a) can reflect the changes in the biomass of phytoplankton. As one of the main food sources for rotifers, phytoplankton exerts a bottom-up effect on the community structure of zooplankton [57]. Conductivity (Cond) can represent the ion concentration and nutrient salt concentration of the water body [69]. The correlation between zooplankton and conductivity (Cond) is relatively high before and after farming, indicating that the nutrient salt concentration of the water body is relatively high. The dominant species, Bosmina longirostris (S85), showed a significant positive correlation with conductivity (Cond) after farming. The result indicates that high nutrient salt concentration is conducive to the survival of Bosmina longirostris (S85). The permanganate Index (CODMn) can reflect the content of organic matter in the water body [70]. In this study, the CODMn of the water body significantly increased after farming, indicating that the organic matter in the water body was high. The abundant organic matter provides a favorable environment for the growth of bacterioplankton and phytoplankton, which in turn promotes the growth of zooplankton.

4.3. Analysis of Eutrophication of Small Reservoir Water Bodies and the Driving Factors

Human activities are the main cause of changes in water bodies [71,72]. This study used the comprehensive nutritional status index to assess the degree of eutrophication of small reservoirs before and after farming. The water quality of the reservoir was mild eutrophication before farming. It was moderate eutrophication after farming. The average nutritional status of the reservoirs before and after farming both belonged to eutrophication. The dominant species in both before and after farming included Brachionus, which indicate water eutrophication [73], indicating that the reservoirs in the agricultural area were more affected by agricultural activities than natural water bodies. Water eutrophication is closely related to water transparency (Trans). The lower the transparency (Trans), the higher the eutrophication of the water body [74,75]. The average transparency (Trans) of the water bodies after farming was lower than that before farming (Table 2). The results show that the eutrophication of the reservoirs has further increased after farming. This conclusion is consistent with the evaluation results obtained by the comprehensive nutritional status index method. It is speculated that the further eutrophication of the reservoir water body after farming is due to the fact that rainwater washed the surface during farming. The agricultural wastewater generated during agricultural activities was carried away by surface runoff and entered the reservoir in large quantities. The agricultural wastewater contains a large amount of nitrogen and phosphorus nutrient salt, which confirms this point [76].
Small reservoirs have important functions such as irrigation, power generation and water supply, which can better meet the water demands of various water-using sectors in terms of time and space and play an irreplaceable role in human society. Based on the evaluation results of the comprehensive nutritional status index in this study, the following suggestions are proposed for the water resource management of small reservoirs in agricultural areas: (1) Scientifically guide agricultural fertilizer use, appropriately control the input of nitrogen and phosphorus nutrients to prevent the aggravation of water body eutrophication; (2) Adapt measures according to the seasons, reasonably adjust the ecological fishery techniques, and appropriately adjust the proportion and quantity of fish reared with phytoplankton as the main filter-feeding objects.

Author Contributions

Conceptualization, Q.J. and H.Q.; Data curation, Y.S.; Formal analysis, M.S.; Funding acquisition, H.Q.; Investigation, X.B., S.Z. and S.H.; Methodology, H.Q.; Project administration, J.H.; Resources, H.Q.; Software, M.S.; Supervision, Y.S.; Validation, X.B.; Visualization, Z.C.; Writing—original draft, Q.J.; Writing—review and editing, H.Q. All authors have read and agreed to the published version of the manuscript.

Funding

This work was supported by the National Natural Science Foundation of China (No. 31560133).

Institutional Review Board Statement

Not applicable.

Data Availability Statement

The original contributions presented in the study are included in the article. Further inquiries can be directed to the corresponding author.

Acknowledgments

We thank Qian Meng, Sen Hou, Gege Dou of Qufu Normal University for their field assistance in this work. We are grateful to the anonymous reviewers for their valuable comments. We are grateful to the editors for their review and revision of the manuscript.

Conflicts of Interest

The authors declare no conflicts of interest.

References

  1. Yuan, L.G. Research on Innovative Strategies for Water Resource Management and Protection in Reservoir Construction and Operation. Water Sci. Technol. 2024, 7, 22–24. [Google Scholar]
  2. Liao, C.W.; Chen, X.D. Modern Management Framework for Small Reservoirs. China Sci. Tech. Inf. 2022, 02, 112–114. [Google Scholar]
  3. Makri, S.; Lami, A.; Lods-Crozet, B.; Loizeau, J.L. Reconstruction of trophic state shifts over the past 90 years in a eutrophicated lake in western Switzerland, inferred from the sedimentary record of photosynthetic pigments. J. Paleolimnol. 2019, 61, 129–145. [Google Scholar] [CrossRef]
  4. Wildemeersch, M.; Tang, S.H.; Ermolieva, T.; Ermoliev, Y.; Rovenskaya, E.; Obersteiner, M. Containing the Risk of Phosphorus Pollution in Agricultural Watersheds. Sustainability 2022, 14, 1717. [Google Scholar] [CrossRef]
  5. Lawniczak-Malińska, A.; Nowak, B.; Pajewski, K. Agricultural pressures on the quality of ground and surface waters in catchments of artificial reservoirs. Water 2023, 15, 661. [Google Scholar] [CrossRef]
  6. Allaf, M.M.; Erratt, K.J. Navigating aquaculture losses: Tackling fish-killing phytoflagellates in a changing global landscape. Rev. Aquac. 2024, 16, 2023–2033. [Google Scholar] [CrossRef]
  7. Guo, J.Y.; Wang, C.F.; Lin, L.; Dong, L.; Gao, Y.; Pan, X.; Guo, Z.W.; Wang, Z.R. Distribution Patterns and Influencing Factors of Nitrogen and Phosphorus Nutrients in the Danjiangkou Reservoir. Environ. Sci. Technol. 2025. Available online: http://kns.cnki.net/kcms/detail/42.1245.X.20250515.1431.002.html (accessed on 10 July 2025).
  8. Guan, Y.Q. Effects of eutrophication and socioeconomic development on water quality in Taizihe River of Liaoyang City. Water Resour. Hydropower Northeast China 2023, 41, 26–30+65. [Google Scholar]
  9. Lukhele, T.; Msagati, T.A.M. Eutrophication of Inland Surface Waters in South Africa: An Overview. Int. J. Environ. Res. 2024, 18, 27. [Google Scholar] [CrossRef]
  10. Akinnawo, S.O. Eutrophication: Causes, consequences, physical, chemical and biological techniques for mitigation strategies. Environ. Chall. 2023, 12, 100733. [Google Scholar] [CrossRef]
  11. Qi, Y.T.; Cao, X.; Cao, R.S.; Cao, M.J.; Yan, A.L.; Li, E.; Xu, D. Research on the Analysis of and Countermeasures for the Eutrophication of Water Bodies: Waihu Reservoir as a Case Study. Processes 2024, 12, 796. [Google Scholar] [CrossRef]
  12. Xiao, X.C.; Xie, D.T.; Ni, J.P. Coupling state of agricultural eco-economic system under emission mitigation and sink enhancement of non-point source pollution—A case study of Zhong County in the Three Gorges Reservoir Region. Chin. J. Eco. Agric. 2014, 22, 111–119. [Google Scholar] [CrossRef]
  13. Tomczyk, P.; Wierzchowski, P.S.; Dobrzynski, J.; Kulkova, I.; Wróbel, B.; Wiatkowski, M.; Kuriqi, A.; Skorulski, W.; Kabat, T.; Prycik, M.; et al. Effective Microorganism Water Treatment Method for Rapid Eutrophic Reservoir Restoration. Environ. Sci. Pollut. Res. 2024, 31, 2377–2393. [Google Scholar] [CrossRef]
  14. Wang, Z.Z.; He, S.; Chen, L. Characteristics of Planktonic Flora and Fauna and Eutrophication Evaluation of Xiaolangdi Reservoir. Henan Water Resour. South-North Water Divers. 2023, 52, 139–140. [Google Scholar]
  15. Liu, X.; Huang, W.; Qi, Z.X.; Li, C.B.; Cheng, G.H.; Cai, Y. Seasonal water storage of large reservoirs exacerbates eutrophication risk in the fluctuating backwater zone: A case study of Three Gorges Reservoir, China. Ecol. Indic. 2025, 171, 113100. [Google Scholar] [CrossRef]
  16. Xu, Y.B.; Guo, A.H.; He, W.F.; Yuan, J.L.; Li, M. Zooplankton community structure in relation to environmental factors in the Shanghetang reservoir. Hubei Agric. Sci. 2020, 59, 69–74. [Google Scholar]
  17. Chen, M.J.; Chen, F.Z. Water quality evaluation and eutrophication analysis of small reservoirs in Nanjing. Environ. Prot. Sci. 2020, 46, 87–91. [Google Scholar]
  18. Gu, X.H.; Mao, Z.G.; Ding, H.P.; Wang, Y.P.; Zeng, Q.F.; Wang, L.L. Progress and prospect of lake fishery. J. Lake Sci. 2018, 30, 1–14. [Google Scholar] [CrossRef]
  19. Burkholder, J.A.M.; Kinder, C.A.; Allen, E.H. Watershed development and eutrophying potable source-water reservoirs in a warming temperate/subtropical region. Water 2023, 15, 4007. [Google Scholar] [CrossRef]
  20. Chi, S.Y.; Wei, C.Z.; Hu, J.; Wang, R.; Zhou, L.F.; Hu, J.X. Correlation between macroinvertebrates and plankton in two deep eutrophic reservoirs. J. Lake Sci. 2020, 32, 1060–1075. [Google Scholar] [CrossRef]
  21. Wang, J.J. Fauna of Freshwater Rotifers in China; Science Press: Beijing, China, 1961. [Google Scholar]
  22. Li, H.R.; Gu, Y.; Cai, Q.H.; Dong, X.W.; Ye, L. Zooplankton Size Structure in Relation to Environmental Factors in the Xiangxi Bay of Three Gorges Reservoir, China. Front. Ecol. Evol. 2022, 10, 800025. [Google Scholar] [CrossRef]
  23. Liang, Y.D.; Kuang, Z.; Sun, N.Z.; Gu, J.L.; Xu, D.P. Effects of different ecological floating bed plant assemblages on water purification and zooplankton community structure in shallow eutrophic lakes. J. Dalian Ocean Univ. 2023, 38, 302–310. [Google Scholar]
  24. Yang, W.; Sun, Y.C.; Zhang, T.T.; Liu, Q.; Huang, Y.; Ge, Q.; Deng, D.G. Impact of eutrophication on the community structure and species diversity of crustacean zooplankton in small lakes. Acta Ecol. Sin. 2020, 40, 4874–4882. [Google Scholar]
  25. Wang, L.; Chen, J.; Su, H.J.; Ma, X.F.; Wu, Z.X.; Shen, H.; Yu, J.; Liu, J.R.; Wu, Y.; Ding, G.Y.; et al. Is zooplankton body size an indicator of water quality in (sub) tropical reservoirs in China? Ecosystems 2021, 25, 308–319. [Google Scholar] [CrossRef]
  26. Wei, N.; Xiang, M.; Wang, Q.Y.; Guo, Z.B.; Wu, Z.H.; Lin, G.; Yang, D.G.; Li, X.M. Characteristics of plankton community structures and impact factors in Geheyan Reservoir in autumn. Chin. J. Fish. 2025, 38, 74–81. [Google Scholar]
  27. Braun, L.M.; Brucet, S.; Mehner, T. Top-down and bottom-up effects on zooplankton size distribution in a deep stratified lake. Aquat. Ecol. 2021, 55, 527–543. [Google Scholar] [CrossRef]
  28. Tao, J.; Bu, Y.Q.; Shao, X.D.; Cai, K.; Li, Z.; Lü, X.Y.; Ye, W.R.; Ruan, X.J. Seasonal variations in the community structure of post larval zooplankton in the waters surrounding Xishan Island, Taihu Lake. Environ. Monit. Forewarn. 2025, 17, 22–28. [Google Scholar]
  29. Li, Y.; Chen, F.Z. Are zooplankton useful indicators of water quality in subtropical lakes with high human impacts? Ecol. Indic. 2020, 113, 106167. [Google Scholar] [CrossRef]
  30. Hu, H.; Wei, X.Y.; Liu, L.; Wang, Y.B.; Bu, L.K.; Jia, H.J.; Pei, D.S. Biogeographic patterns of meio-and micro-eukaryotic communities in dam-induced river-reservoir systems. Appl. Microbiol. Biotechnol. 2024, 108, 130. [Google Scholar] [CrossRef]
  31. Li, Y.X.; Wang, R.R.; Wang, W.; Yin, Y.M.; Liu, Z.P.; Dai, Z.; Li, M.H.; Yan, Q.L. Study on the changes in the community structure of marine zooplankton in Dalian Bay from 2013 to 2022 and its relationship with environmental factors. Mar. Environ. Sci. 2025, 44, 247–256. [Google Scholar]
  32. Wang, W.X.; Chen, F.Z.; Gu, X.H. Community structures of zooplankton and its relation to environmental factors in five medium reservoirs in Nanjing City. J. Lake Sci. 2017, 29, 216–223. [Google Scholar] [CrossRef]
  33. D’Alelio, D.; Libralato, S.; Wyatt, T.; d’Alcalà, M.R. Ecological-network models link diversity, structure and function in the plankton food-web. Sci. Rep. 2016, 6, 21806. [Google Scholar] [CrossRef] [PubMed]
  34. Peng, J.; Pang, W.T.; Chen, A.; Luo, J.; Qin, H.; Qian, Z.P.; Wang, Q.X. The indicator effect of rotifers for different nutrient states in water bodies: A case study in waters of Shanghai, China. J. Lake Sci. 2024, 36, 1706–1726. [Google Scholar] [CrossRef]
  35. Mineeva, N.M.; Lazareva, V.I.; Poddubnyi, S.A.; Zakonnova, A.V.; Kopylov, A.I.; Kosolapov, D.B.; Korneva, L.G.; Sokolova, E.A.; Pyrina, I.L.; Mitropol’skaya, I.V. Structure and functioning of zooplankton communities in the Rybinsk Reservoir under the conditions of climate change. Inland Water Biol. 2024, 17, 1–17. [Google Scholar] [CrossRef]
  36. Zhang, Z.S.; Huang, X.F. Freshwater Plankton Research Methods; Science Press: Beijing, China, 1991. [Google Scholar]
  37. Crustacean Research Group, Institute of Zoology, Chinese Academy of Sciences. Fauna Sinica: Arthropoda: Crustacea: Freshwater Copepoda; Science Press: Beijing, China, 1979. [Google Scholar]
  38. Jiang, X.Z.; Du, N.S. Fauna Sinica: Arthropoda: Crustacea: Freshwater Cladocera; Science Press: Beijing, China, 1979. [Google Scholar]
  39. Nie, X.; Hu, X.R.; Liu, G.H.; Jin, B.S.; Qin, H.M. Effects of water level on zooplankton community during ‘plate-shaped lake enclosed in autumn’ in a sub-lake of the Poyang Lake. Acta Hydrobiol. Sin. 2019, 43, 402–414. [Google Scholar]
  40. Hu, Y.; Zhang, Y.Z.; Jiang, X.Y.; Shao, K.Q.; Tang, X.M.; Gao, G. Seasonal characteristics of nestedness pattern and interaction of plankton assemblages in East Lake Taihu. J. Lake Sci. 2022, 34, 1620–1629. [Google Scholar] [CrossRef]
  41. GB 11893-89; Water Quality—Determination of Total Phosphorus—Ammonium Molybdate Spectrophotometric Method. Ministry of Ecology and Environment of People’s Republic of China: Beijing, China, 1990.
  42. HJ 199-2023; Water Quality—Determination of Total Nitrogen—Gas-Phase Molecular Absorption Spectrometry. Ministry of Ecology and Environment of People’s Republic of China: Beijing, China, 2024.
  43. HJ 897-2017; Water Quality—Determination of Chlorophyll a—Spectrophotometric Method. Ministry of Ecology and Environment of People’s Republic of China: Beijing, China, 2018.
  44. GB 11892-89; Water Quality—Determination of Permanganate Index—Acidic Potassium Permanganate method. Ministry of Ecology and Environment of People’s Republic of China: Beijing, China, 1990.
  45. Lampitt, R.S.; Wishner, K.F.; Turley, C.M.; Angel, M.V. Marine snow studies in the northeast Atlantic Ocean: Distribution, composition and role as a food source for migrating plankton. Mar. Biol. 1993, 116, 689–702. [Google Scholar] [CrossRef]
  46. Shannon, C.E.; Weaver, W. The Mathematical Theory of Communication; University of Illinois Press: Urbana, IL, USA, 1949. [Google Scholar]
  47. Pielou, E.C. Ecological Diversity; John Wiley & Sons Inc.: New York, NY, USA, 1975. [Google Scholar]
  48. Yang, G.M.; He, D.H.; Wang, C.S. Ecology characteristics in the island waters off Zhejiang I. Species dominance of the zooplankton and ecology character of waters. Mar. Environ. Sci. 1998, 17, 49–54. [Google Scholar]
  49. Xu, D.H.; Sun, X.M.; Chen, B.J.; Xia, B.; Cui, Z.G.; Zhao, J.; Jiang, T.; Liu, C.X.; Qu, K.M. The ecological characteristics of zooplankton in the central Bohai Sea. Prog. Fish. Sci. 2016, 37, 7–18. [Google Scholar]
  50. Wang, M.C.; Liu, X.Q.; Zhang, J.H. Evaluate method and classification standard on lake eutrophication. Environ. Monit. China 2002, 18, 47–49. [Google Scholar] [CrossRef]
  51. Wu, X.M.; Hao, R.J.; Pan, H.B.; Wei, H.; Wang, L.Q. Community structure of zooplankton and its relationship with environmental factors in Huangpu River. Ecol. Environ. Sci. 2018, 27, 1128–1137. [Google Scholar]
  52. Liu, X.; Lei, M.J.; Huang, X.L.; Wang, M.X.; Lei, Q. Diversity of metazoan zooplankton and its relationship with water environmental factors in Da’ao Reservoir. J. Yangtze River Sci. Res. Inst. 2024, 41, 53–59. [Google Scholar]
  53. Zheng, Z.X.; Zhu, X.G.; Ye, B.B.; Yuan, Z.; Yang, W.T.; Liu, Y.N. Structural characteristics and influencing factors of zooplankton community in the Xuancheng section of the Shuiyang River. J. Biol. 2025, 42, 75–83. [Google Scholar]
  54. Xiang, H.; Lin, F.; Wu, Y.P.; Tian, B.; Cai, Z.Y.; Wu, Y.P.; Huang, P.J.; Liu, Q.F.; Zhou, Z.G. Correlation analysis between zooplankton community structure characteristics and environmental factors in the Yichang section in middle reaches of the Yangtze River. Heilongjiang Fish. 2022, 5, 3–12. [Google Scholar]
  55. Lei, Q.; Bao, Y.F.; Tan, Q.J.; Xu, Y.Z.; Gong, B.; Jian, Y.Z.; Jin, L.; Xiong, D.N.; Li, T.C. Zooplankton community structure and its relationship with environmental factors in cascade reservoirs in the lower reaches of the Lancang River. J. Henan Norm. Univ. (Nat. Sci. Ed.) 2023, 51, 128–138. [Google Scholar]
  56. Zhang, J.M.; Zhou, X.X.; Li, Q.H.; Zhang, Y.F.; Shen, Y.J. Status of Plankton Community Structure, Diversity and Water Quality in the Lower Reaches of the Fu River. J. China West Norm. Univ. (Nat. Sci. Ed.) 2025. Available online: http://kns.cnki.net/kcms/detail/51.1699.N.20241226.1556.002.html (accessed on 10 July 2025).
  57. Zhang, Q.; Xu, X.M.; Chen, Q. Seasonal variation characteristics of zooplankton seasonal variation and drivers of zooplankton community in reservoirs of Chaobai River Basin. Acta Sci. Nat. Univ. Pekin. 2023, 59, 290–300. [Google Scholar]
  58. Wei, C.J.; Qiu, P.F.; Wang, F.C.; Qiao, Z.Y.; Zhan, X.L.; Feng, W.S.; Li, R.H.; Gong, Y.C. Zooplankton community dynamics and its relationship with the growth of Aphanizomenon sp. in Yuqiao Reservoir, Tianjin. J. Hydroecol. 2024, 45, 134–144. [Google Scholar]
  59. Li, J.; Liang, Y.Y.; Tang, X.X.; Han, Q.; Yin, F.; Guo, N.C.; Lu, W.X. Metazooplankton Community Structure and Trophic State Assessment of Chaohu Lake. J. Aquat. Ecol. 2023, 44, 73–81. [Google Scholar]
  60. Brito, S.L.; Maia-Barbosa, P.M.; Pinto-Coelho, R.M. Zooplankton as an indicator of trophic conditions in two large reservoirs in Brazil. Lakes Reserv. Res. Manag. 2011, 16, 253–264. [Google Scholar] [CrossRef]
  61. Dai, D.C.; Ma, X.Z.; Zhang, W.B.; Zhang, Y.; Zhou, Z. Metazooplankton community structure and ecological evaluation of water quality of Eriocheir sinesis ecological culture ponds. J. Ecol. Rural Environ. 2021, 37, 208–216. [Google Scholar]
  62. Yang, Y.F.; Huang, X.F. The influence of silver carp and bighead on the zooplankton community structure. J. Lake Sci. 1992, 4, 78–86. [Google Scholar] [CrossRef]
  63. Chen, X.L.; Shang, J.W.; Wang, Y.W.; Sun, M.F.; Han, J.M.; Zhang, S.Y.; Li, W.Q.; Qin, H.M. Seasonal dynamic changes and driving factors of zooplankton community in a silver carp and bighead carp stocked reservoir. J. Lake Sci. 2025, 37, 566–579. [Google Scholar] [CrossRef]
  64. Chen, J.Q.; Zhao, K.; Cao, Y.; Wu, B.; Pang, W.T.; You, Q.M.; Wang, Q.X. Zooplankton community structure and its relationship with environmental factors in Poyang Lake. Acta Ecol. Sin. 2020, 40, 6644–6658. [Google Scholar]
  65. Wang, Y.W.; Zhang, S.Y.; Sun, M.F.; Han, J.M.; Wang, Z.Y.; Chen, X.L.; Chen, Z.F.; Qin, H.M. Spatial-temporal pattern and stability analysis of zooplankton community structure in the Lower Yellow River in China. Diversity 2025, 17, 162. [Google Scholar] [CrossRef]
  66. La, H.S.; Park, K.; Wåhlin, A.; Arrigo, K.R.; Kim, D.S.; Yang, E.J.; Atkinson, A.; Fielding, S.; Im, J.; Kim, T.W.; et al. Zooplankton and micronekton respond to climate fluctuations in the Amundsen Sea polynya, Antarctica. Sci. Rep. 2019, 9, 10087. [Google Scholar] [CrossRef]
  67. Chen, S.; Xie, Q.; Fu, M.; Jiang, T.; Wang, Y.M.; Wang, D.Y. Structural characteristics of zooplankton and phytoplankton communities and its relationship with environmental factors in a typical tributary reservoir in the Three Gorges Reservoir region. Environ. Sci. 2021, 42, 2303–2312. [Google Scholar]
  68. Wang, L.J.; Du, Y.Y.; Zhang, S.H.; Zhang, Y.P.; Wang, T. Plankton community structure and its relationship with environmental factors in the Qingtu Lake wetland. Wetl. Sci. 2025, 23, 341–351. [Google Scholar]
  69. He, X.J.; Wang, W.X. Allocation and stoichiometric regulation of phosphorus in a freshwater zooplankton under limited conditions: Implication for nutrient cycling. Sci. Total Environ. 2020, 728, 138795. [Google Scholar] [CrossRef]
  70. Liao, X.L. Study on monitoring of permanganate index in water environment. China Resour. Compr. Util. 2022, 40, 136–138. [Google Scholar]
  71. Yang, H.Y. Relationship Between Phytoplankton Succession History and Human Activities in Watershed: A Case Study of Qilu Lake; Central China Normal University: Wuhan, China, 2020. [Google Scholar]
  72. Li, Y.J.; Cheng, D.Y.; Adam, N.A.; Mirzalevens, S.; Zhang, G.W. Exploring the nexus between coastal tourism growth and eutrophication: Challenges for environmental management. Mar. Pollut. Bull. 2025, 216, 117922. [Google Scholar] [CrossRef] [PubMed]
  73. Qian, F.P.; Xi, Y.L.; Wen, X.L.; Huang, L. Eutrophication impact on community structure and species diversity of rotifers in five lakes of Anhui. Biodivers. Sci. 2007, 15, 344–355. [Google Scholar] [CrossRef]
  74. Yang, G.L.; Lv, G.H.; Zhu, J.Q.; Xu, Z.; Jin, C.H. Characteristics of zooplankton community in Hengshan Reservoir and water quality assessment. Acta Hydrobiol. Sin. 2014, 38, 720–728. [Google Scholar]
  75. Li, L.M.; Ye, J.Q.; Zhou, L.C.; Huang, M. Investigation and evaluation of eutrophication in a river-type reservoir of Dazhou. J. Green Sci. Technol. 2024, 26, 129–132+137. [Google Scholar]
  76. Zhang, X.Y.; Fan, X.P.; Liu, D.Y.; Xu, F.S.; Gan, X.Y.; Fan, X.Y.; Dong, W.Z. Investigation and evaluation on agricultural non-point source pollution in Danjiangkou Reservoir area of Hubei Province. Hubei Agric. Sci. 2012, 51, 3460–3464. [Google Scholar]
Figure 1. Diagram of the 4 investigated reservoirs’ location in an agricultural area, China.
Diversity 17 00520 g001
Figure 2. Species richness of zooplankton in 4 small reservoirs (A), Venn diagrams of horizontal distribution of species before and after farming; (B) diagrams of species composition before and after farming.
Diversity 17 00520 g002
Figure 3. Shannon–Wiener index and Pielou evenness index of zooplankton before and after farming. (A), Shannon–Wiener index of zooplankton before and after farming; (B), Pielou evenness index of zooplankton before and after farming. “a and b” indicated that there was a significant difference in the diversity index of zooplankton before and after farming.
Diversity 17 00520 g003
Figure 4. Abundance of zooplankton in small reservoirs before and after farming. (A), Total abundance; (B), Rotifera; (C), Cladocera; (D), Copepoda; (E), Brachionus diversicornis (B. diversicornis); (F), Asplanchna priodonta (A. priodonta); (G), Polyarthra trigla (P. trigla); (H), Mesocyclops leuckarti (M. leuckarti). “a and b” indicated that there was a significant difference in the abundance of zooplankton before and after farming.
Diversity 17 00520 g004
Figure 5. Biomass of zooplankton in small reservoirs before and after farming. (A), Total abundance; (B), Rotifera; (C), Cladocera; (D), Copepoda; (E), Brachionus diversicornis (B. diversicornis); (F), Asplanchna priodonta (A. priodonta); (G), Polyarthra trigla (P. trigla); (H), Mesocyclops leuckarti (M. leuckarti). “a and b” indicated that there was a significant difference in the biomass of zooplankton before and after farming.
Diversity 17 00520 g005
Figure 6. Non-metric multidimensional scaling ordination of the month communities’ characteristics based on zooplankton abundance.
Diversity 17 00520 g006
Figure 7. The analysis of co-occurrence network among zooplankton abundance (A), collinear network analysis of zooplankton communities before farming; (B), collinear network analysis of zooplankton communities after farming. Different colors represent different groups of zooplankton.
Diversity 17 00520 g007
Figure 8. Redundancy analysis (RDA) of zooplankton abundance and environmental factors (A), sequencing diagram of zooplankton species (▲), samples () and environmental factors before farming; (B), sequencing diagram of zooplankton species, samples and environmental factors after farming.
Diversity 17 00520 g008
Table 1. Elevation, maximum depth and environmental characteristics of 4 investigated reservoirs.
Reservoir NumberElevationMaximum DepthReservoir Surrounding Environment
R1161.28 m1.68 m The breeding of silver carp and bighead carp is carried out. The downstream is adjacent to the artificial forest area, and there is a small area of farmland upstream. The domestic sewage from the surrounding residential areas is directly discharged into the reservoir. There are many human activities.
R2152.65 m1.47 m The left side and the upper reaches of the reservoir are surrounded by secondary forests. On the right side, there are residential areas distributed, but they are relatively far away, and there are fewer human activities.
R3141.52 m2.35 m Adjacent to the village, there are a large number of artificial forests on both sides of the upstream river where the reservoir flows into. There are many human activities, and the water body is yellowish-brown with high transparency.
R4129.95 m4.12 m The rivers flowing into the reservoir have many branches, and there are large areas of residential areas distributed upstream of each branch. There are artificial forests on both sides of the reservoir, and there are many human activities.
Table 2. Average of physic-chemical parameters before and after farming.
Research PeriodReservoirCondpHDOTransTNTPChl-aCODMn
(us/cm) (mg/L)(cm)(mg/L)(mg/L)(mg/m3)(mg/L)
Pre-farmingR1281.50 ± 3.33 a8.50 ± 0.14 a4.03 ± 0.36 a36.50 ± 2.522.07 ± 0.060.16 ± 0.028.92 ± 0.52 a6.97 ± 0.19 a
R2330.33 ± 3.68 a8.41 ± 0.03 a4.36 ± 0.3550.33 ± 4.42 a1.50 ± 0.10 a0.09 ± 0.00 a5.56 ± 0.95 a5.52 ± 0.21 a
R3300.33 ± 5.95 a8.99 ± 0.01 a4.07 ± 0.4234.83 ± 1.59 a1.94 ± 0.03 a0.13 ± 0.02 a8.70 ± 0.54 a6.07 ± 0.01 a
R4242.33 ± 4.92 a7.87 ± 0.12 a4.19 ± 0.27 a34.67 ± 2.172.08 ± 0.06 a0.15 ± 0.00 a12.99 ± 0.40 a6.79 ± 0.23 a
After farmingR1313.83 ± 0.93 b7.05 ± 0.18 b 5.71 ± 0.02 b30.17 ± 0.832.07 ± 0.020.20 ± 0.0031.64 ± 0.96 b8.38 ± 0.11 b
R2458.50 ± 5.57 b6.98 ± 0.155.36 ± 0.1226.17 ± 2.74 b2.91 ± 0.03 b0.19 ± 0.00 b53.67 ± 0.23 b7.63 ± 0.25 b
R3347.83 ± 0.44 b7.43 ± 0.18 b4.92 ± 0.1924.67 ± 2.73 b2.52 ± 0.11 b0.25 ± 0.01 b45.57 ± 0.95 b8.16 ± 0.02 b
R4298.17 ± 13.15 b6.64 ± 0.11 b5.47 ± 0.09 b31.00 ± 1.502.89 ± 0.08 b0.22 ± 0.00 b47.81 ± 1.91 b8.06 ± 0.05 b
Note: “a, b” indicates that there were significant differences in physicochemical factors between March (before farming) and October (after farming).
Table 3. Dominant species and the dominance of zooplankton.
Dominant SpeciesDominance(Y)Species Serial Number
Pre-FarmingAfter Farming
Rotifera
Brachionus calyciflorus*0.059 S8
Brachionus quadridentatus0.034 *S11
Brachionus diversicornis0.170 0.041 S15
Keratella cochlearis0.052 *S23
Argonotholca foliacea0.061 -S26
Asplanchna priodonta0.160 0.022 S37
Asplanchna girodi0.023 *S38
Polyarthra trigla0.063 0.050 S61
Cladocera
Ceriodaphnia quadrangula0.076 *S82
Scapholeberis mucronata0.029 *S83
Bosmina longirostris*0.157 S85
Chydorus ovalis0.020 *S98
Copepoda
Microcyclops varicans*0.159S112
Mesocyclops leuckarti0.0510.047S116
Note: “-“ means the species were not collected, “*” means the species dominance were less than 0.02.
Table 4. Comprehensive nutrient status index and eutrophication evaluation level results.
ReservoirTLI Comprehensive Nutrient Status Index and Eutrophication Evaluation Results
Before FarmingAfter Farming
R153.12 (Mild eutrophication)65.36 (Moderate eutrophication)
R256.74 (Mild eutrophication)65.27 (Moderate eutrophication)
R348.61 (mesotrophic level)68.87 (Moderate eutrophication)
R455.33 (Mild eutrophication)66.50 (Moderate eutrophication)
Note: the evaluation results of comprehensive trophic level were in ( ).
Disclaimer/Publisher’s Note: The statements, opinions and data contained in all publications are solely those of the individual author(s) and contributor(s) and not of MDPI and/or the editor(s). MDPI and/or the editor(s) disclaim responsibility for any injury to people or property resulting from any ideas, methods, instructions or products referred to in the content.

