
Analysis of Influencing Factors and Trend Prediction of Invasive Alien Plants in China


Abstract

1. Introduction
2. Materials and Methods
2.1. Overview of Data
2.2. Analytical Methods
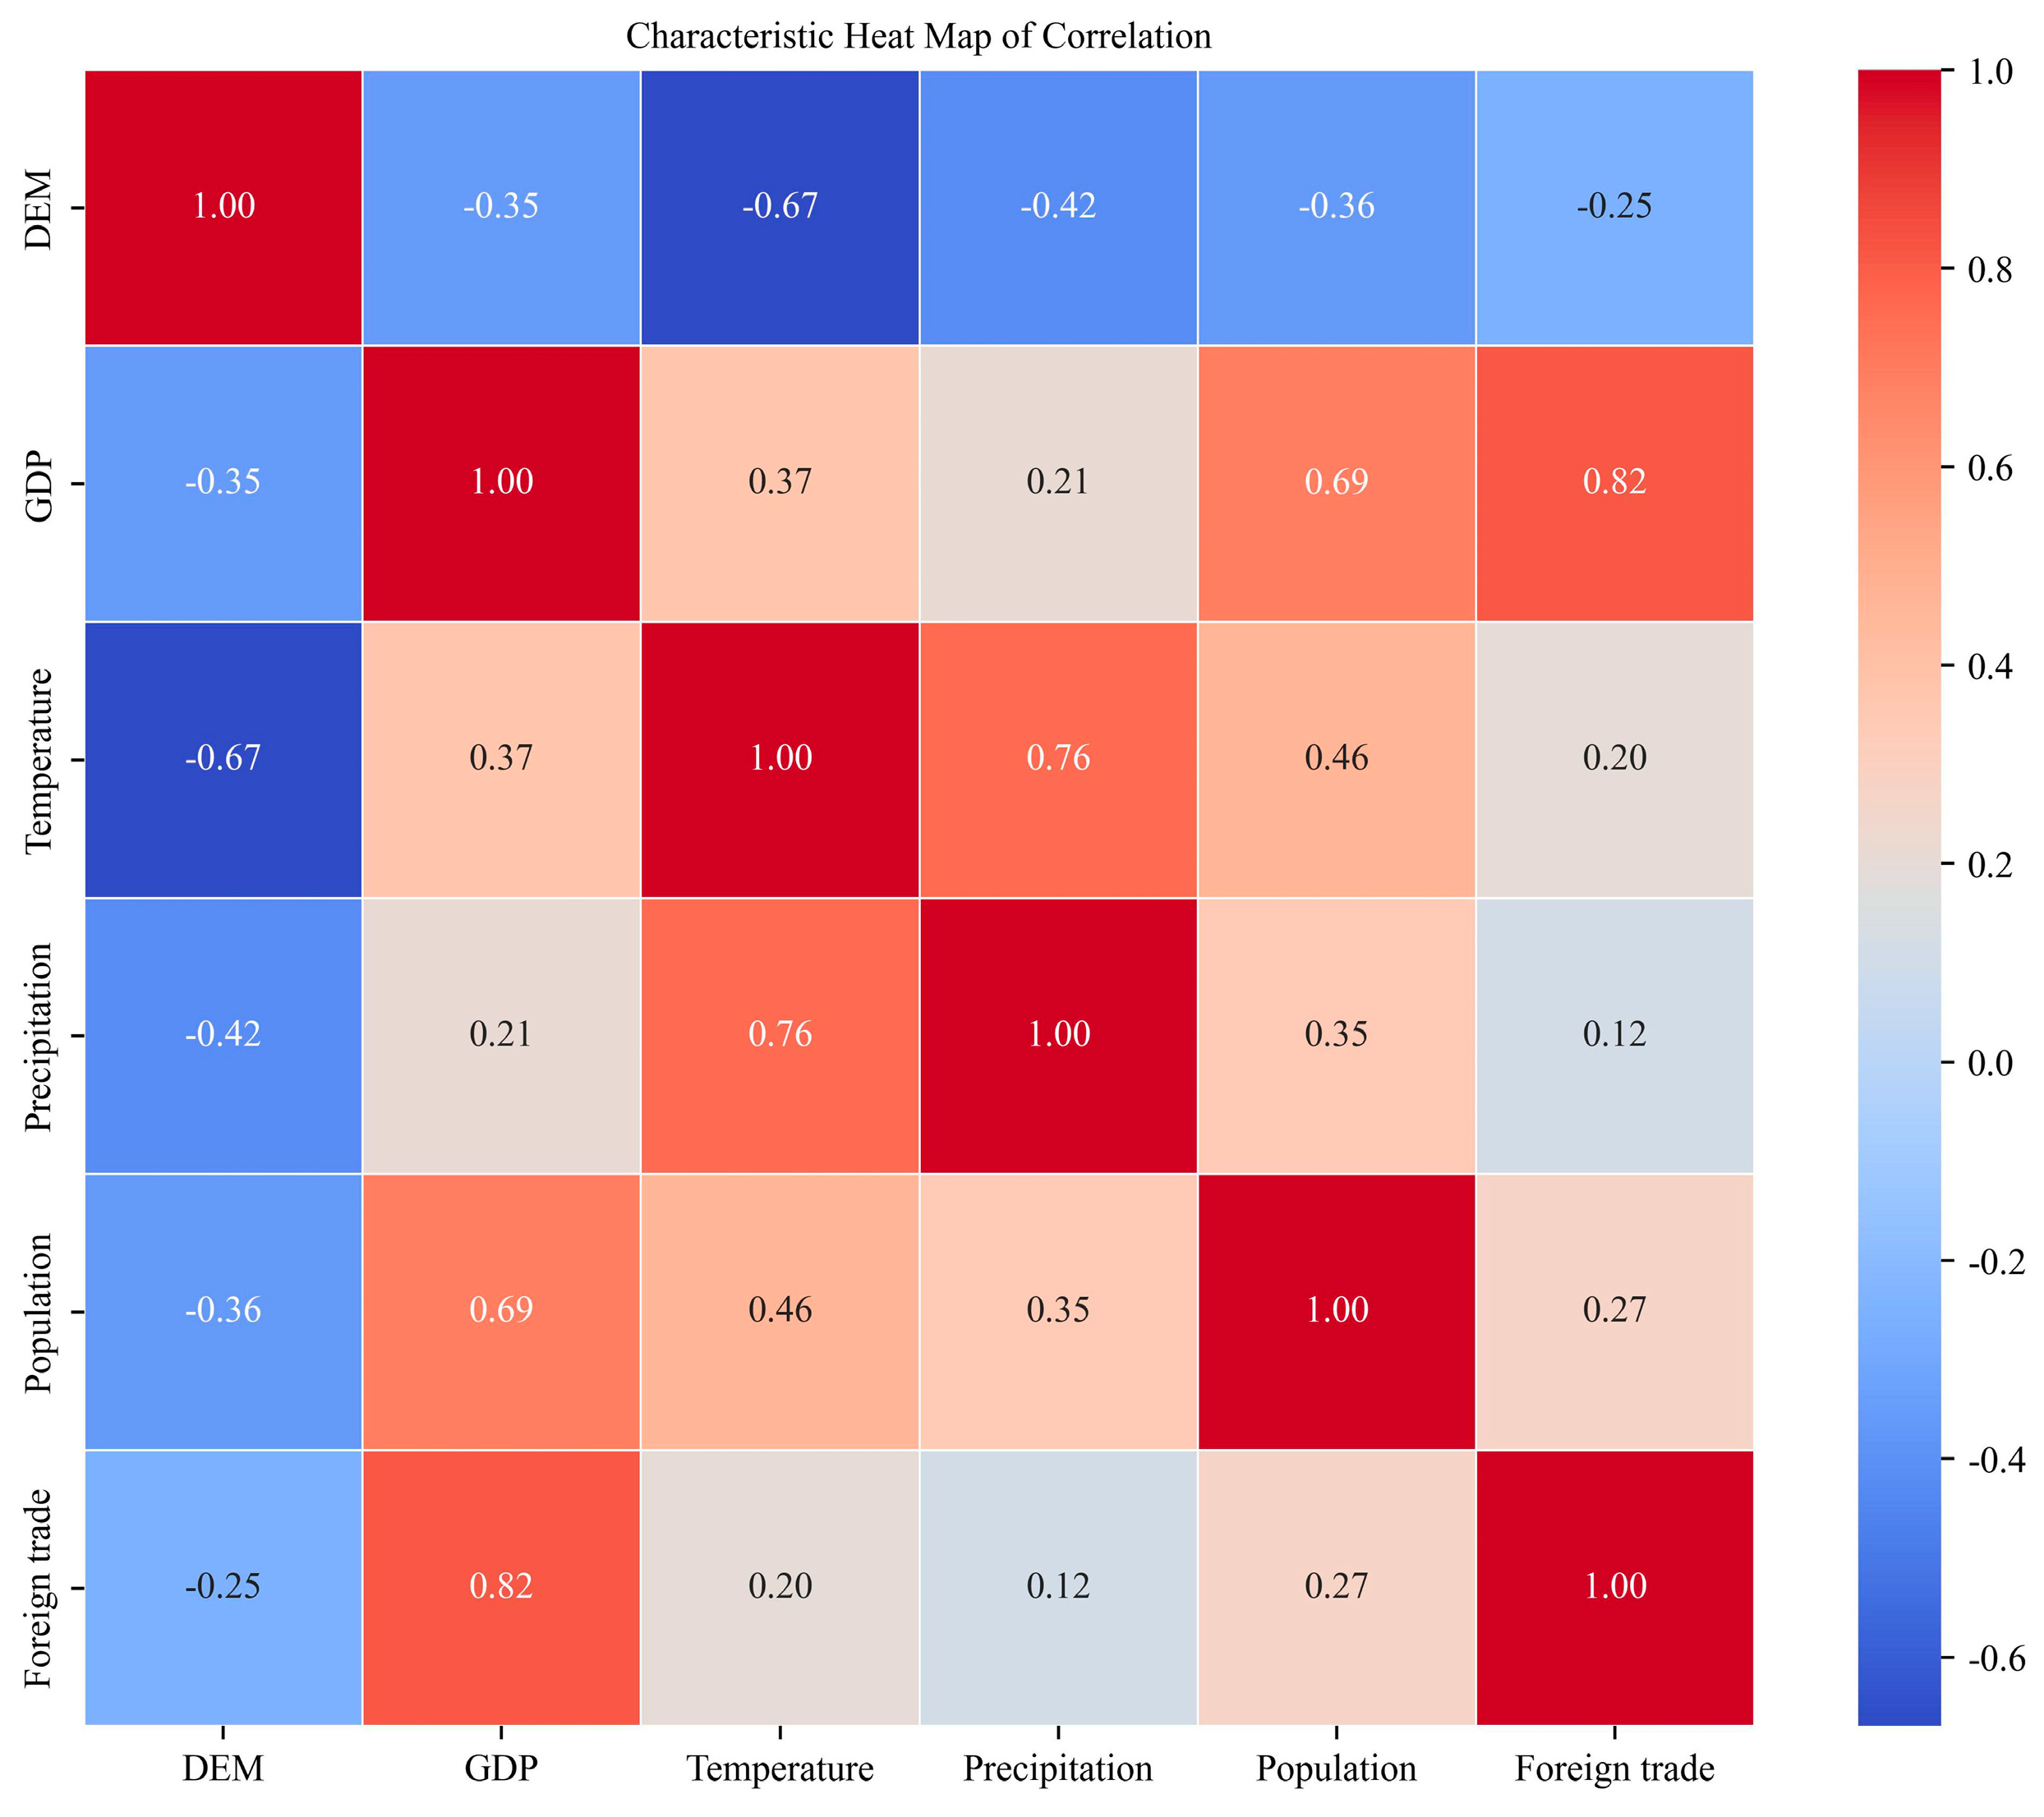
2.2.1. Variable Selection and Analysis
2.2.2. Urbanization Index Construction
2.2.3. Subdivision of Climate Zones
- Data standardization
- 2.
- K-means clustering
- 3.
- Clustering validity test
2.2.4. Modeling and Validation
- 1.
- Gradient Boosting Machine
- 2.
- eXtreme Gradient Boosting
- ①
- Using the second-order Taylor expansion of the loss function to guide tree splitting;
- ②
- Applying L1/L2 regularization constraints on leaf node weights;
- ③
- Implementing approximate tree splitting via a weighted quantile sketching algorithm, with native support for missing value handling.
- 3.
- Random Forest Regression
- ①
- Bootstrap sampling of the training dataset for each individual tree;
- ②
- Random selection of feature subsets at each node-splitting decision.
- 4.
- Light Gradient Boosting Machine
- 1.
- Stacking
- 2.
- Voting
3. Results
3.1. Analysis of Drivers
3.2. Climate Zones
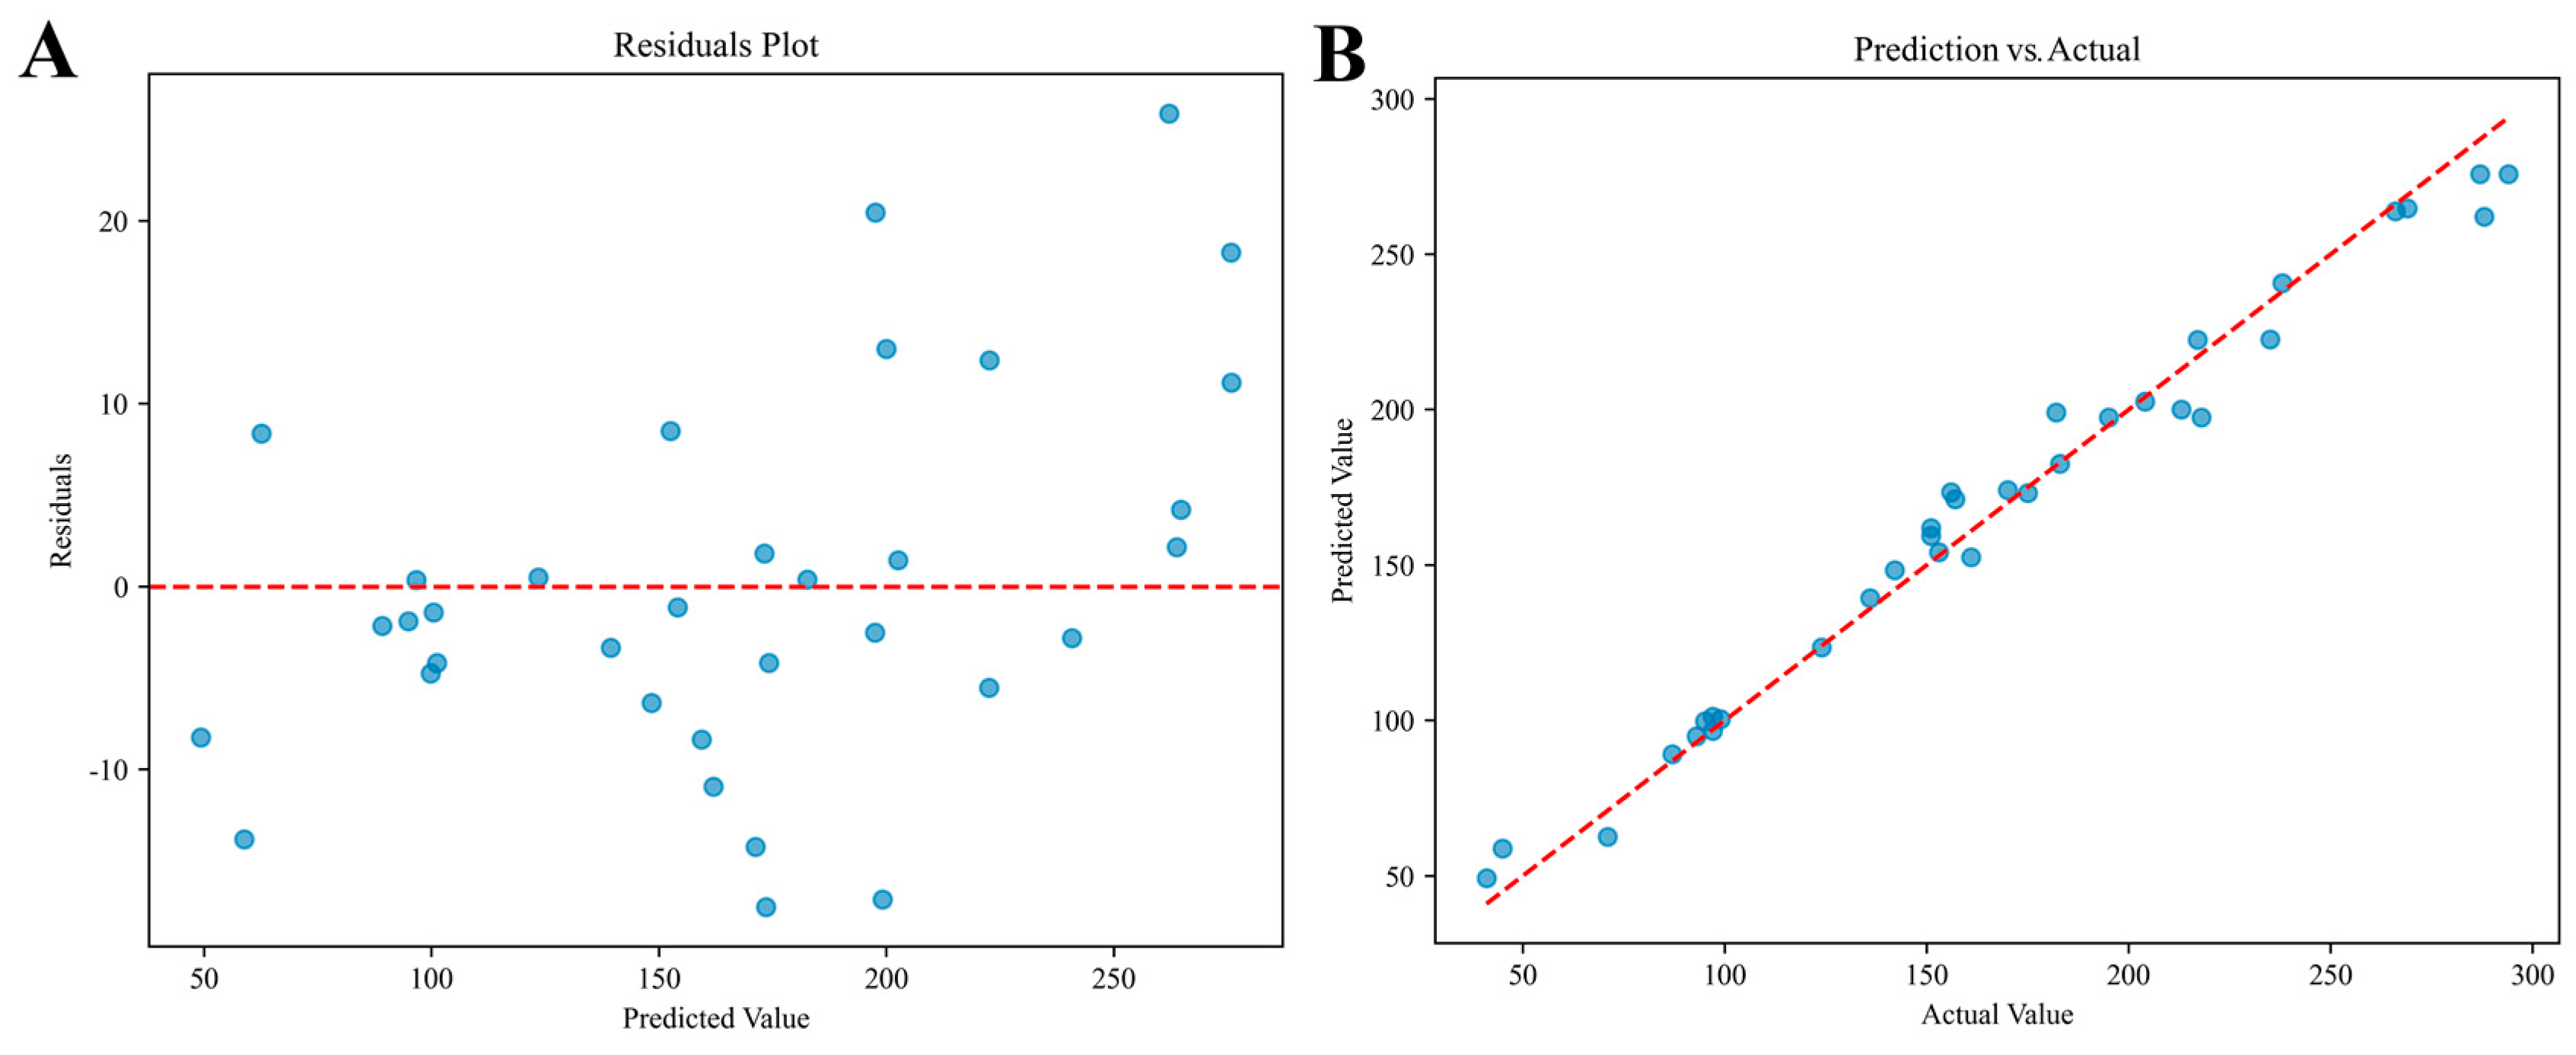
3.3. Ensemble Model Performance
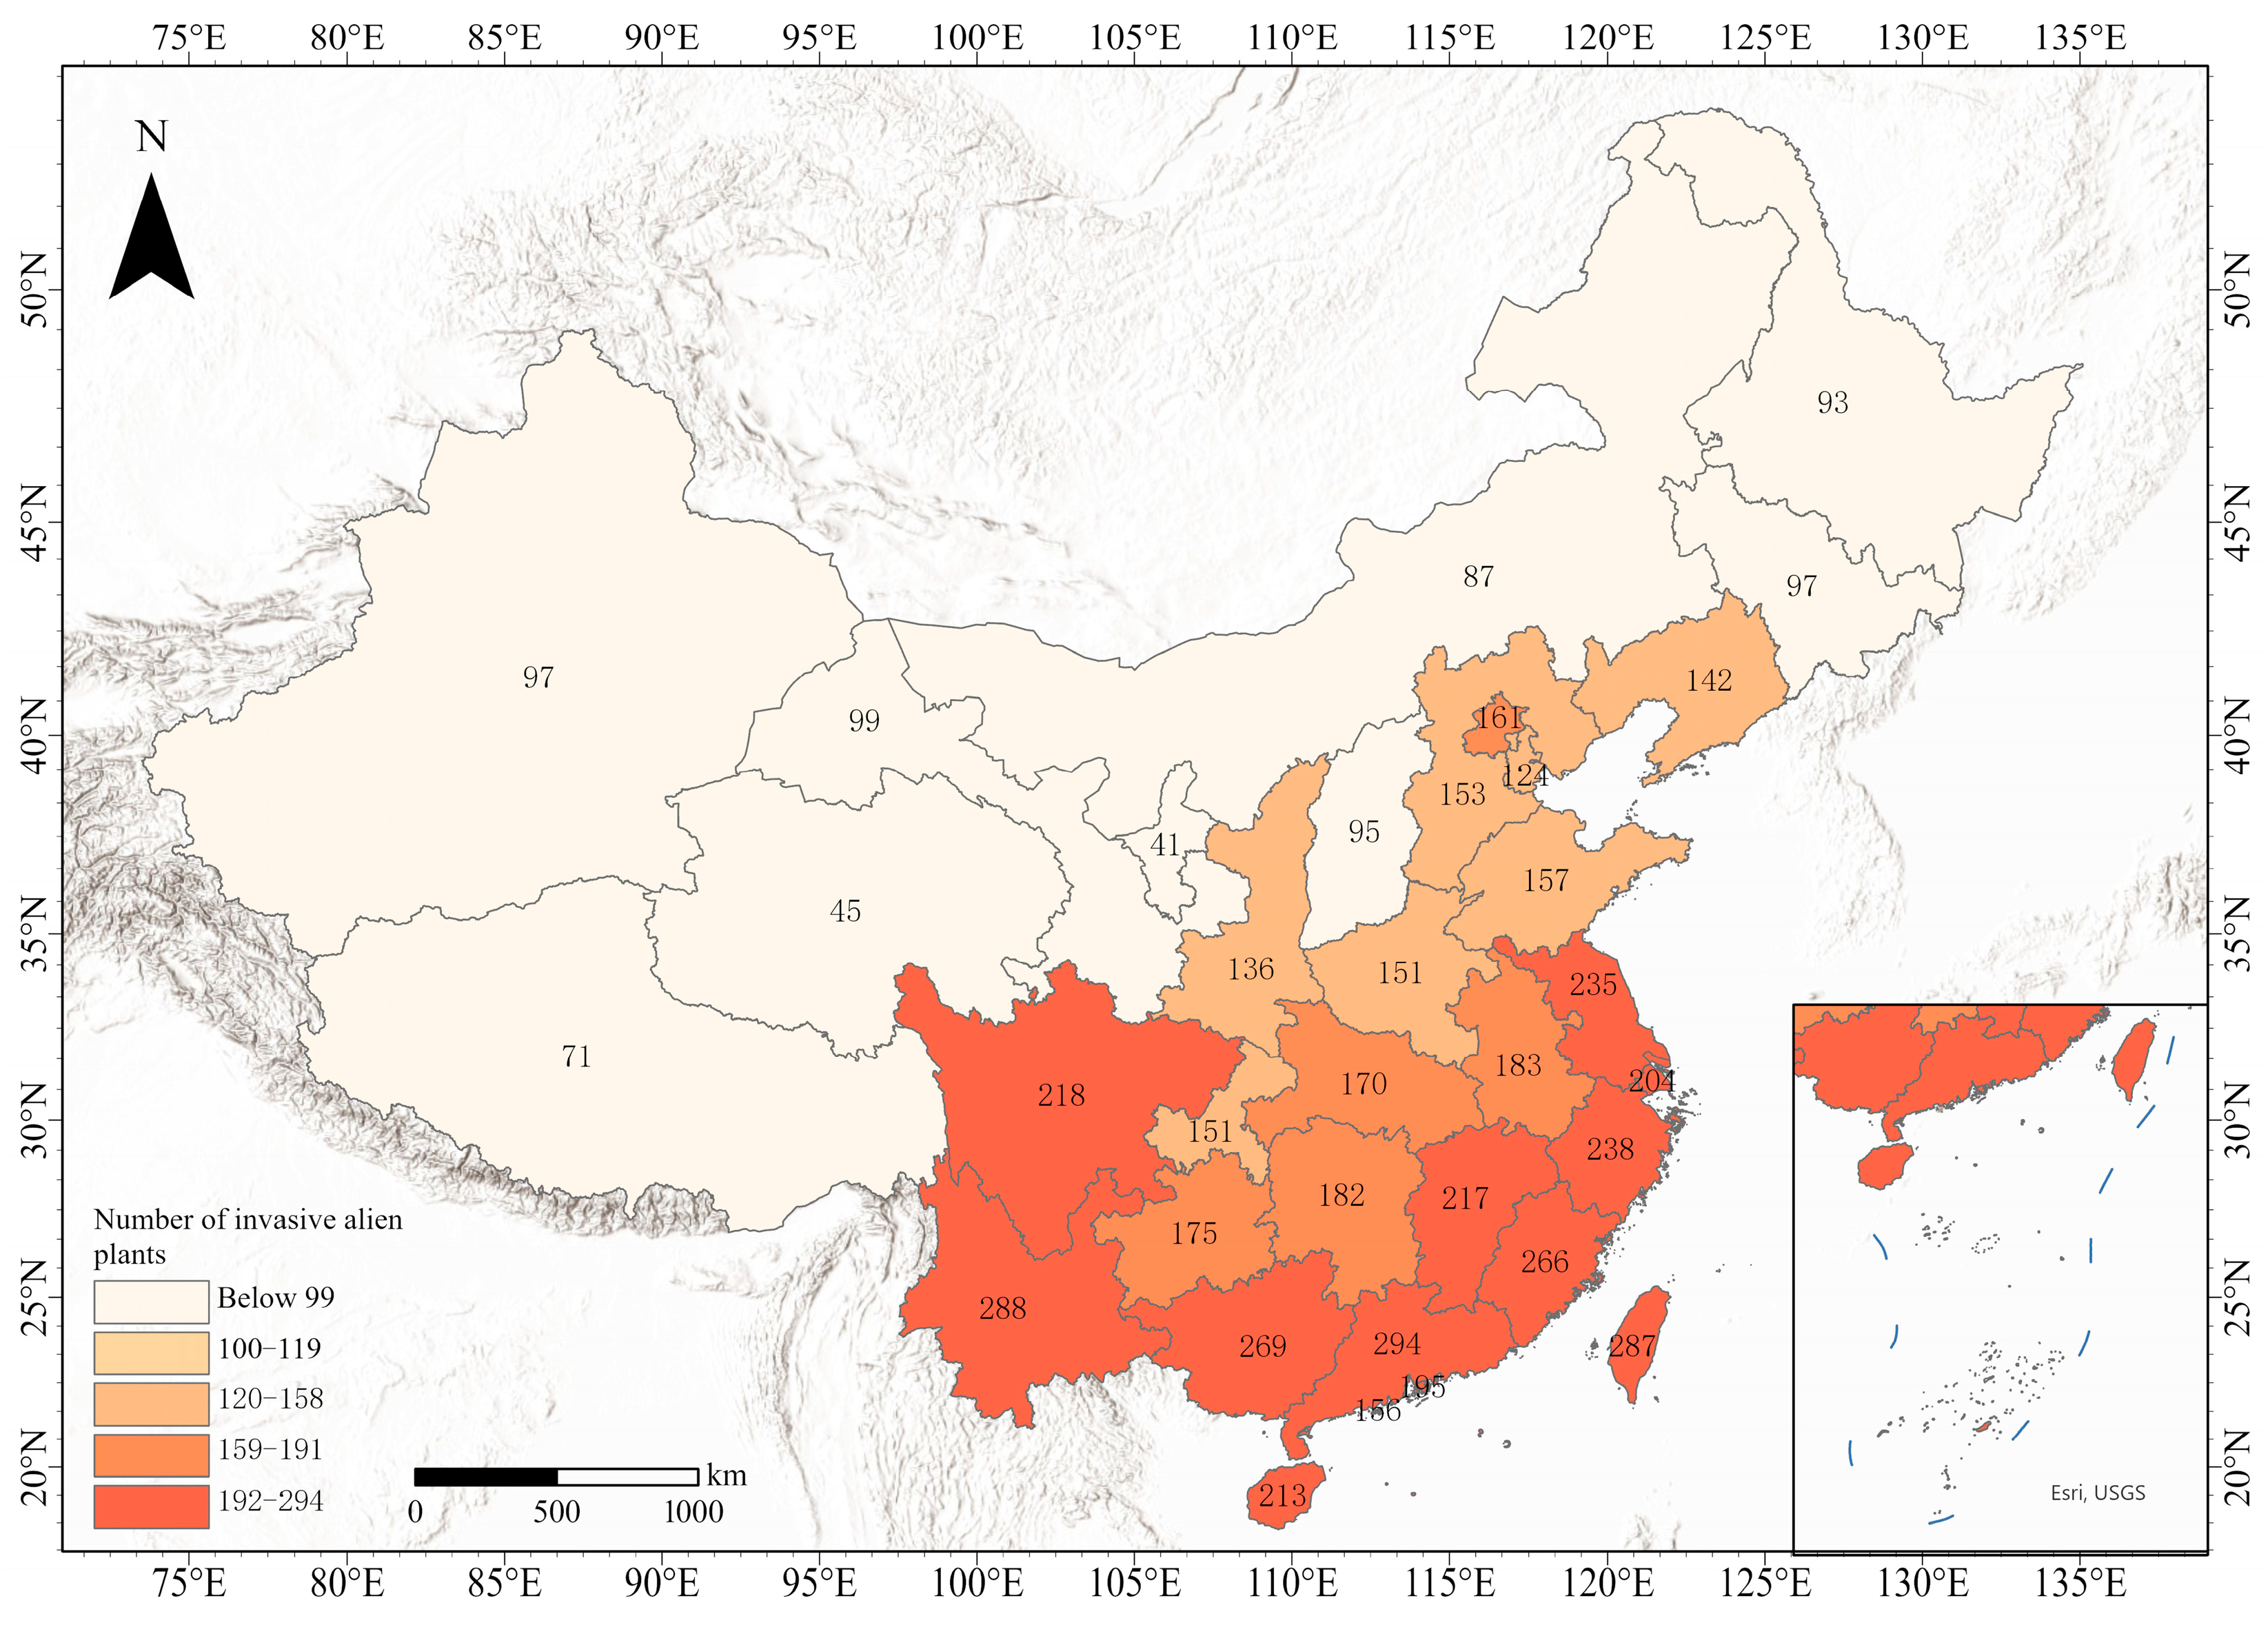
3.4. Status of Species Invasions
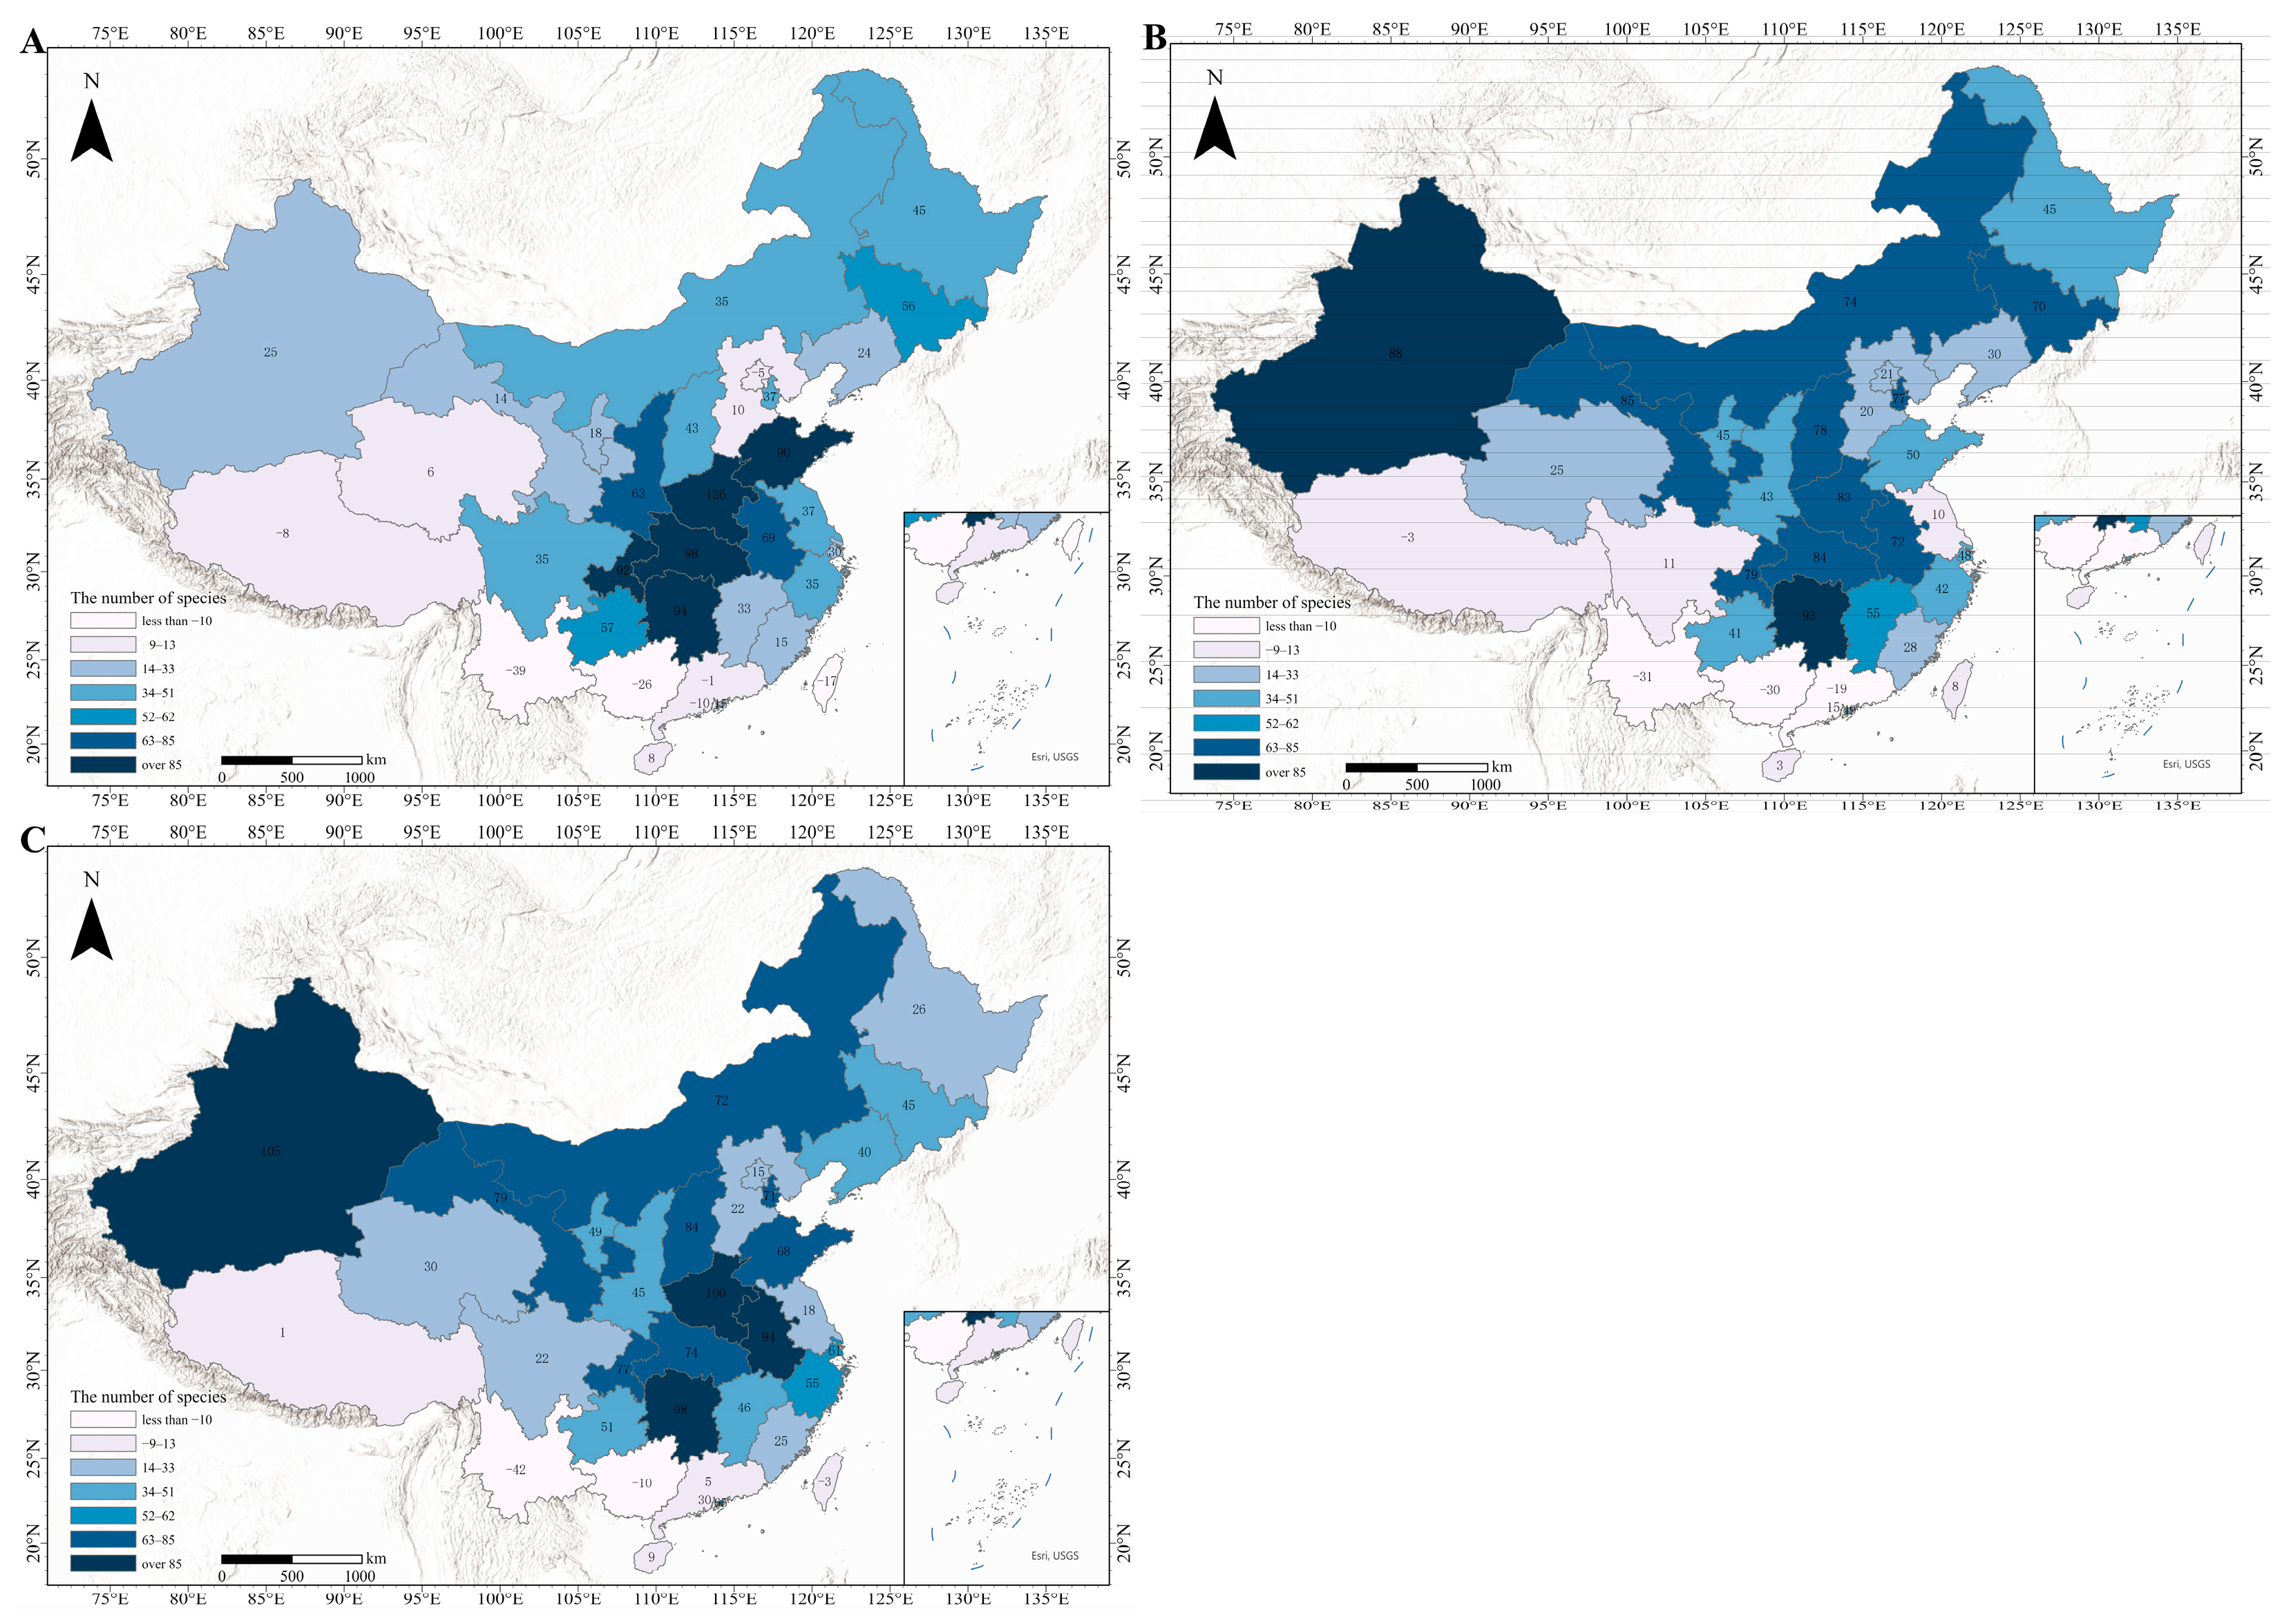
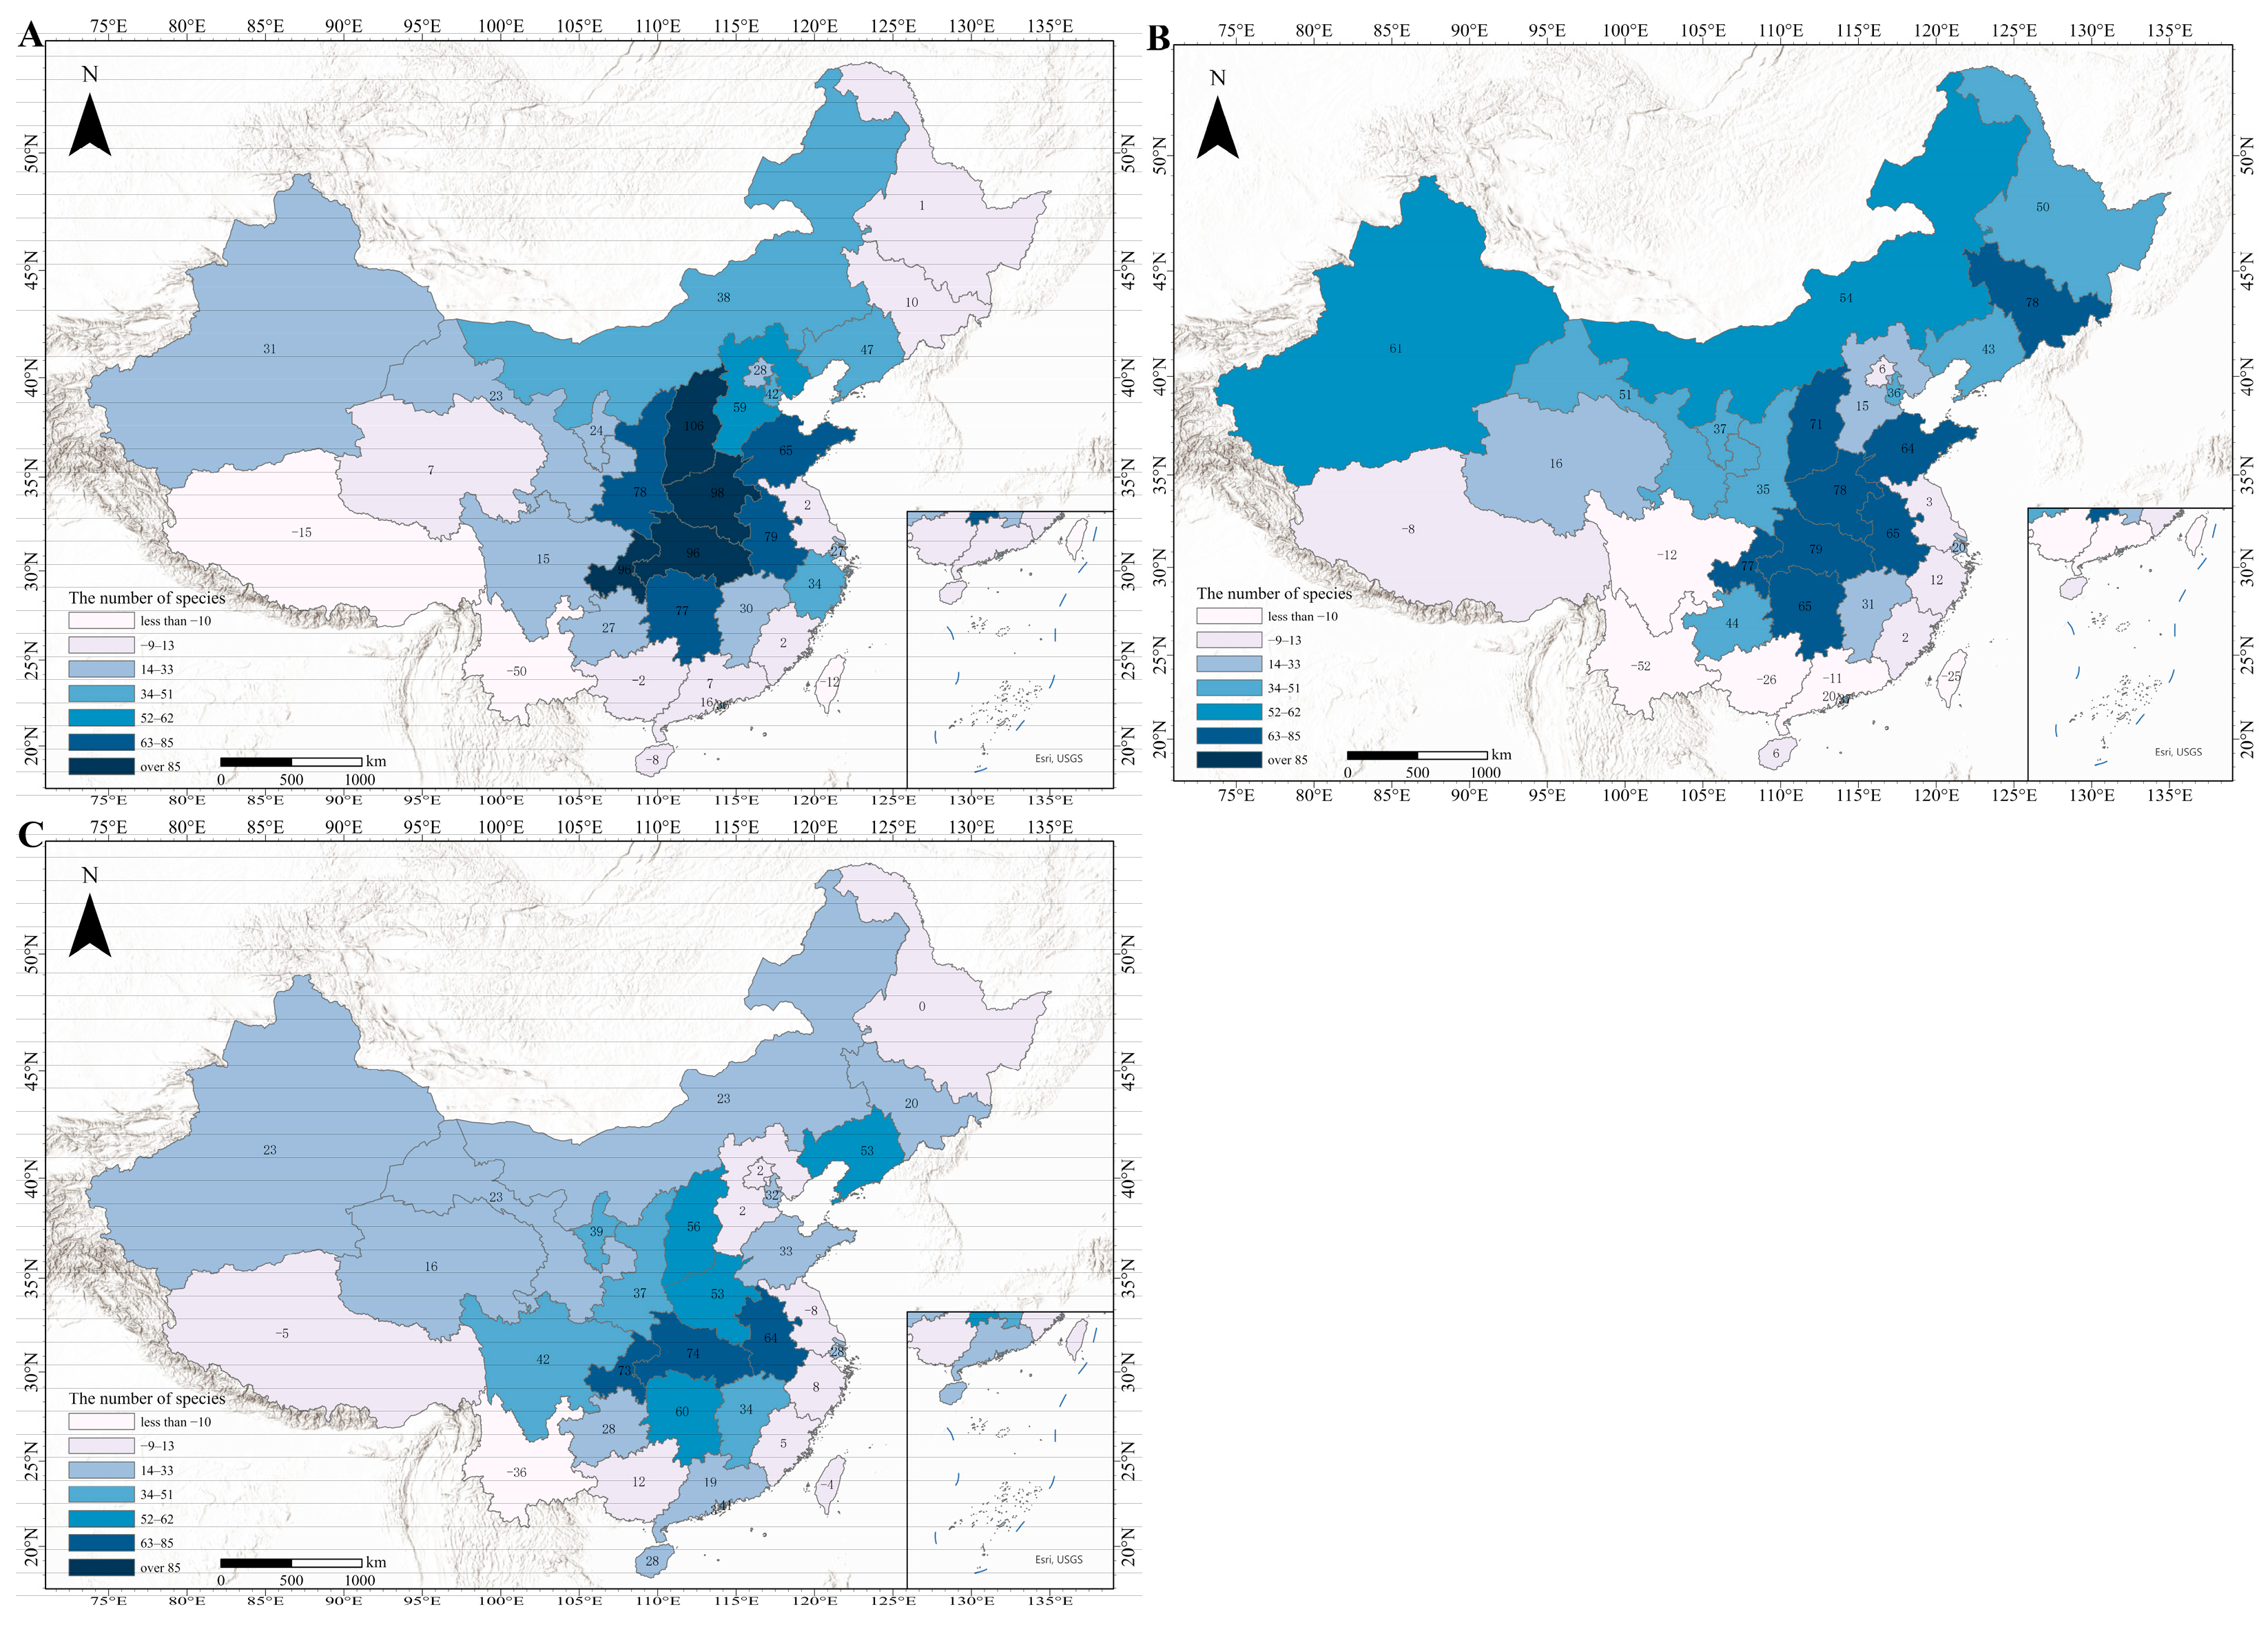
3.5. Overall Change Characteristics
3.6. Regional Variation and Emerging Invasion Hotspots
3.6.1. High-Risk Expansion Zones
3.6.2. Decreasing or Stabilizing Regions
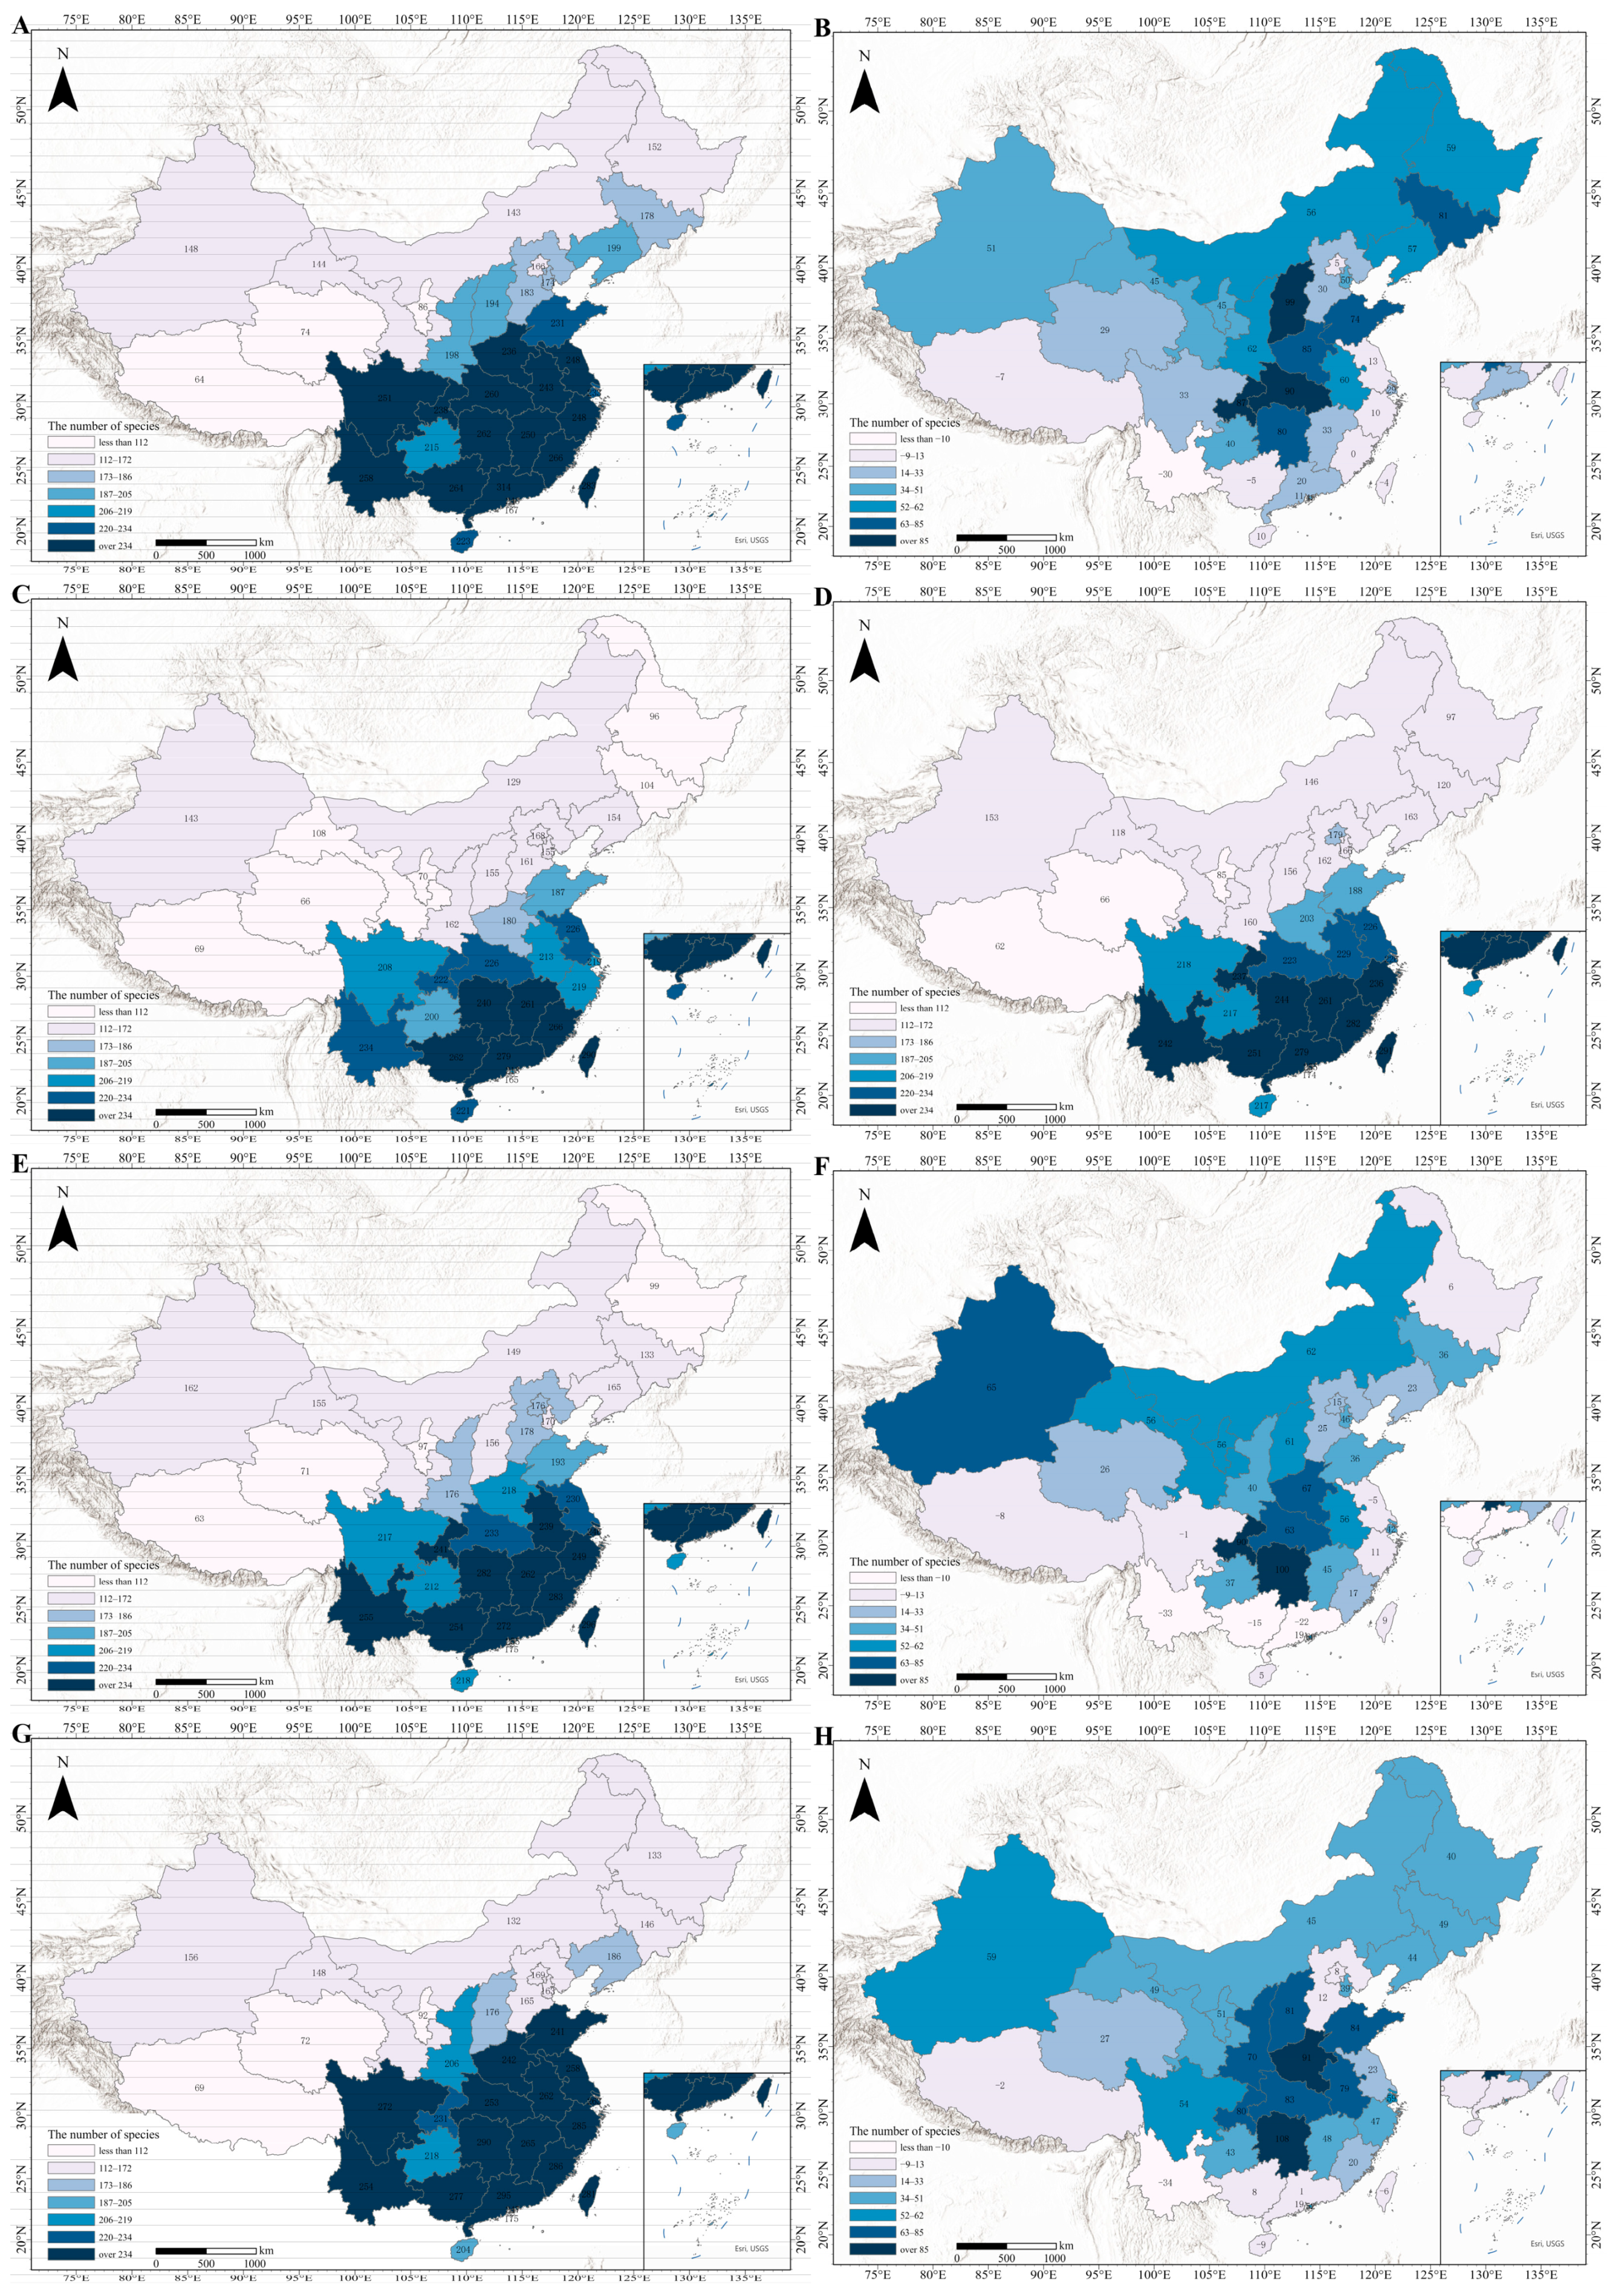
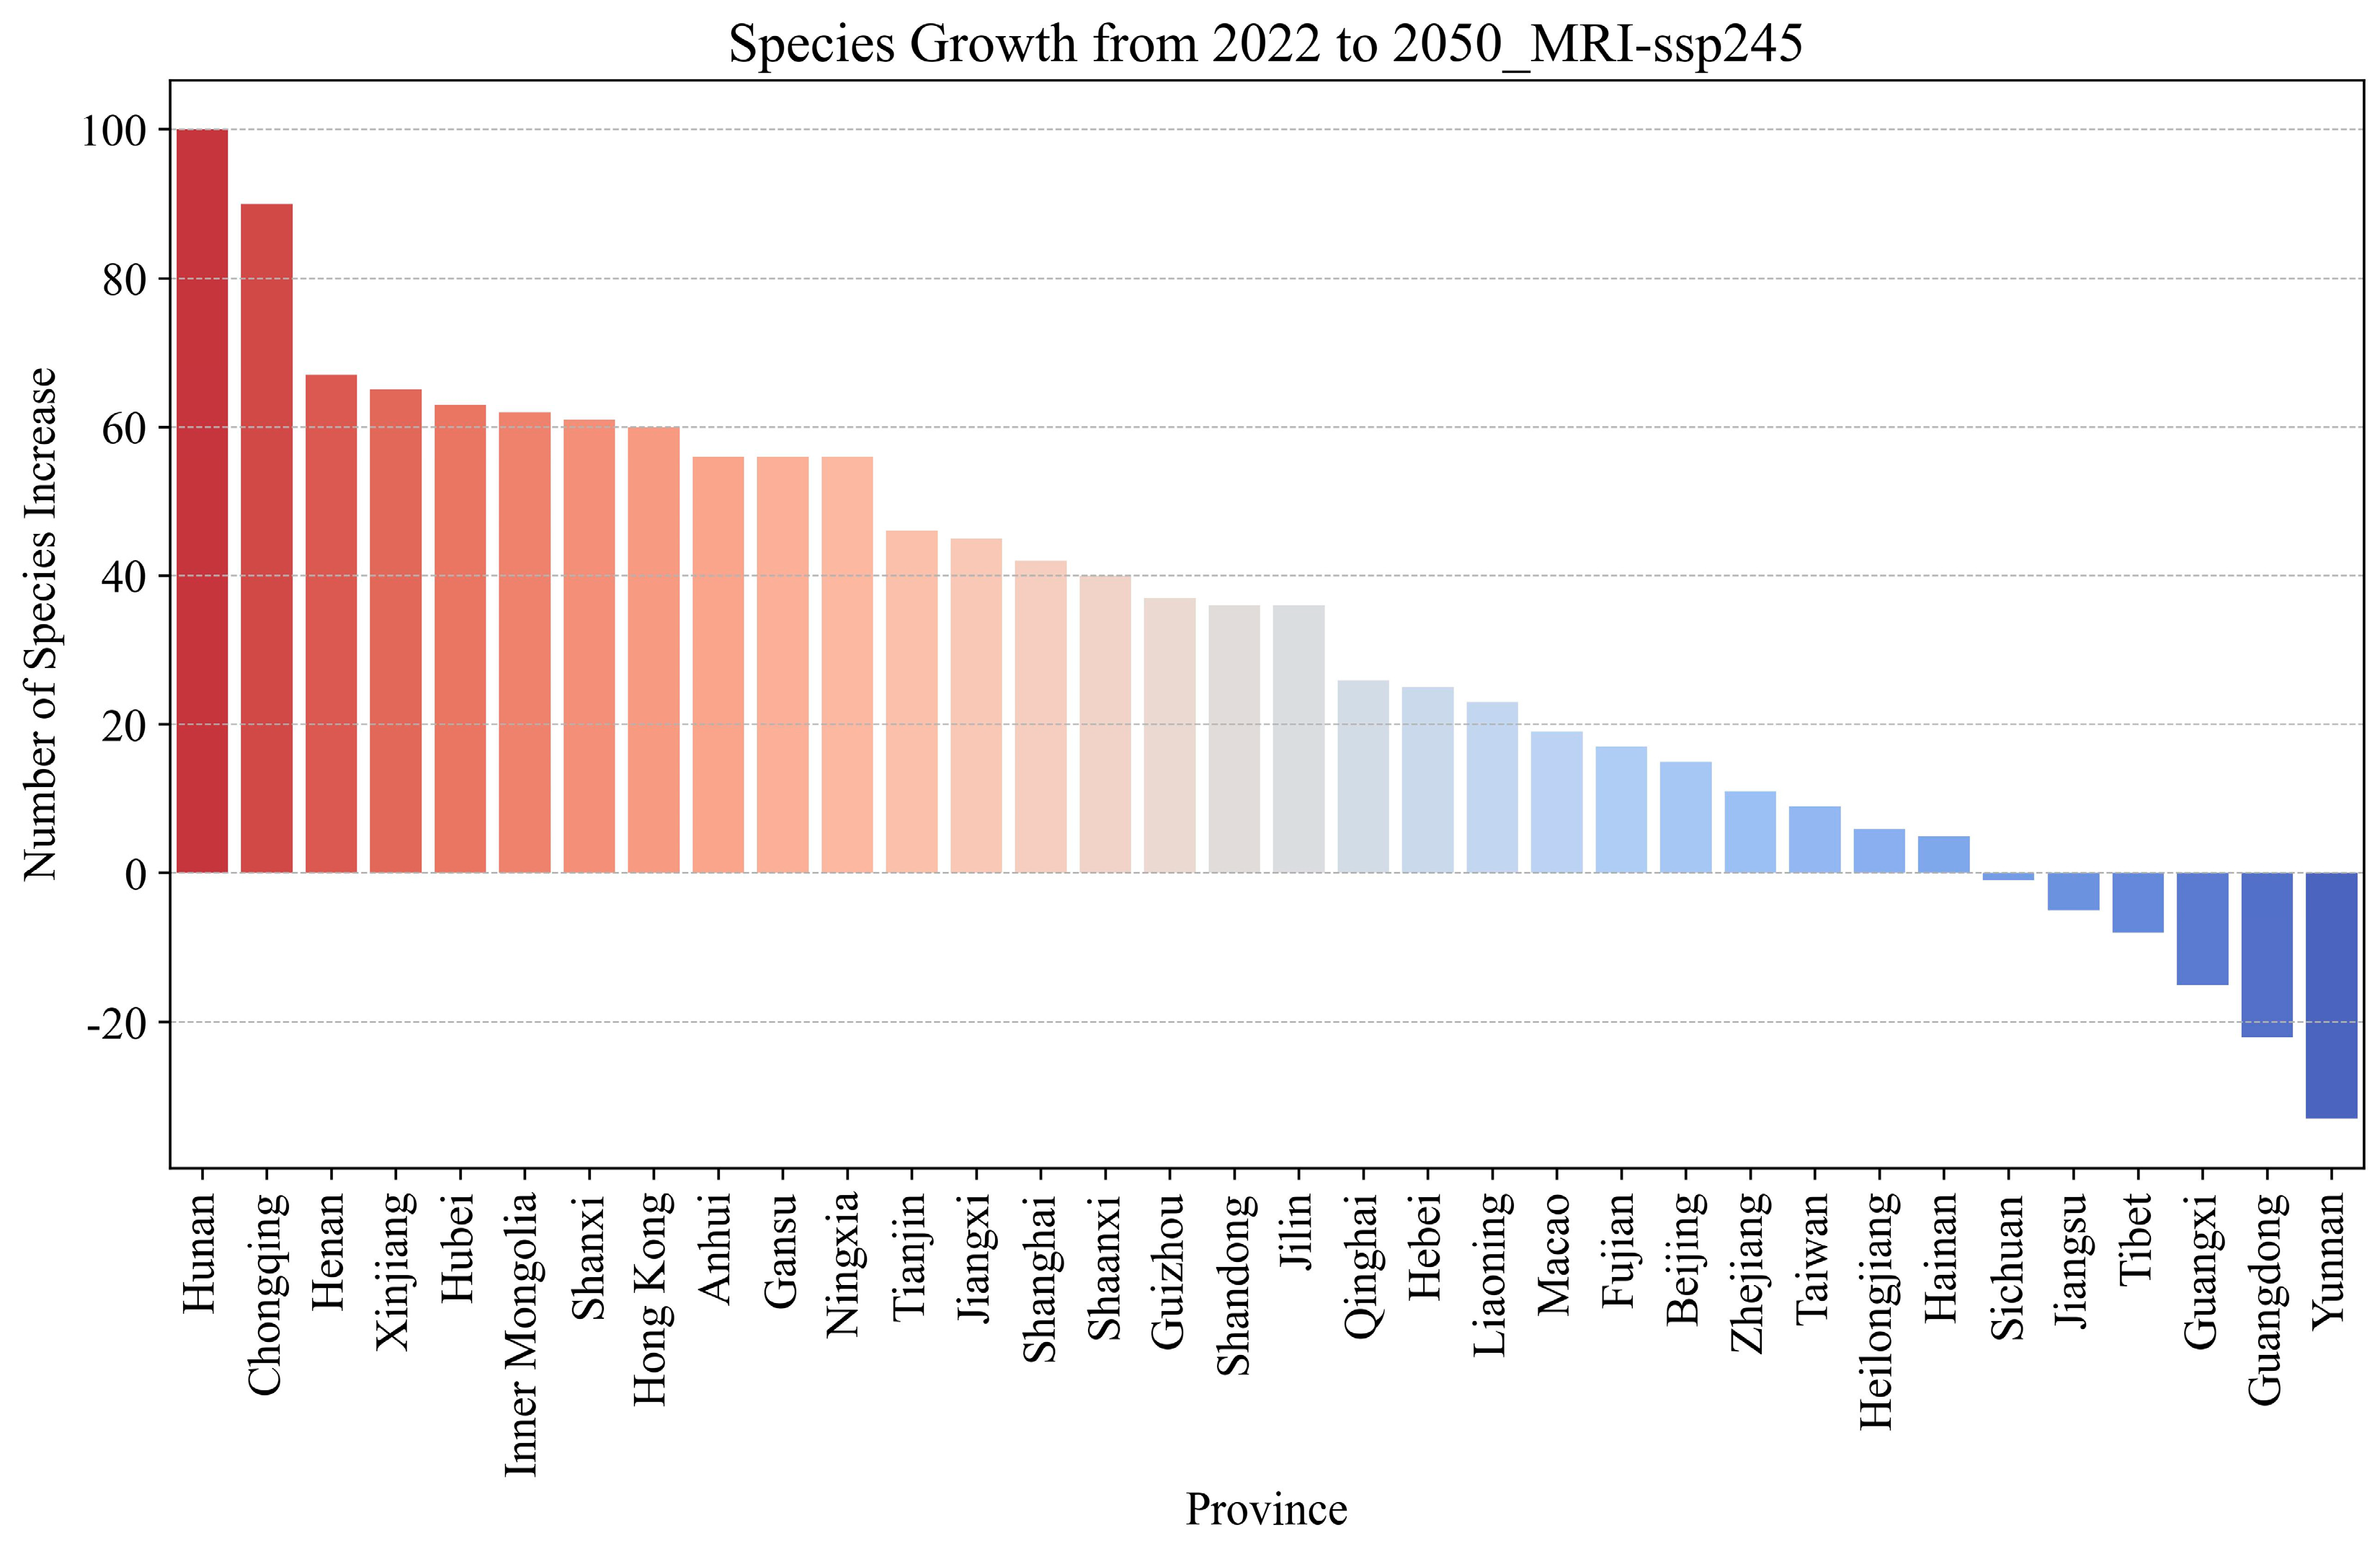
3.7. In-Depth Analysis of the SSP245 Scenario Based on MRI-ESM2-0 Modeling
- ①
- Temperate semi-arid zone (Climate Zone 0): This region includes Gansu, Heilongjiang, Jilin, Liaoning, Inner Mongolia, Sichuan, and Xinjiang. With mean annual temperatures ~6 °C and precipitation ~630 mm, this region experiences significant warming (+1.5–2.0 °C), resulting in generally slow but steady growth in invasive species. Xinjiang is an exception, where >2.2 °C warming drives a +60-species surge despite its cold, dry baseline.
- ②
- Subtropical humid zone (Climate Zone 1): This region includes Fujian, Guangxi, Hunan, Jiangxi, and Zhejiang (18–20 °C and 1500–1600 mm precipitation). The warm, humid conditions favor invasive species, leading to consistent growth (e.g., Hunan’s increase from 80 to 108 species, +28 species) that intensifies competition with native species. Dense native plant communities may face structural shifts due to altered recruitment and growth dynamics, with potential loss of functional diversity.
- ③
- Temperate humid zone (Climate Zone 2): This region covers nine provinces and cities, including Anhui, Chongqing, Guizhou, Henan, Hubei, Jiangsu, Shandong, Shanghai, and Yunnan. It is one of the regions with the most pronounced species growth under this scenario model. Between 2022 and 2050, mean annual temperature and annual precipitation increase slightly. Additionally, socioeconomic factors in the region, show sustained growth, for example, the GDP of Henan Province is projected to reach CNY 14.9 trillion in 2050, and the urbanization rate (UI) is expected to increase to 0.69. Such transformation may create urban-wildland edges that serve as corridors for invasive species spread, undermining peri-urban biodiversity. Under the combined influence of these factors, the number of invasive species exhibits a marked increase in the region.
- ④
- Tropical maritime humid zone (Climate Zone 3): This region includes Guangdong, Hainan, Hong Kong, Macao, and Taiwan. With mean annual temperatures >22 °C and precipitation >2000 mm, this region’s hydrothermal advantages intensify under the scenario (e.g., Guangdong reaching ~25 °C and 2200 mm precipitation). These conditions exacerbate thermal stress and drive the fluctuating changes in invasive species detailed in Section 3.6.1.
- ⑤
- Plateau cold and arid zone (Climate Zone 4): This region includes Qinghai and Tibet. The mean annual temperature is below 0 °C, annual precipitation is less than 500 mm, and the average altitude exceeds 4000 m. The temperature increases in this region will be more pronounced by 2050, for example, Qinghai’s mean annual temperature is projected to rise to ~2.5 °C. However, the precipitation shows a slight downward trend (less than 400 mm in 2050). Therefore, under the combined effect of these two factors, the number of species in Qinghai Province will increase, though not significantly. These conditions, combined with the demographic factors noted earlier, will result in a small decrease in the number of species in Tibet.
- ⑥
- Temperate semi-humid zone (Climate Zone 5): This region includes Beijing, Hebei, Ningxia, Shaanxi, Shanxi, and Tianjin (~11 °C and ~700 mm precipitation). The combination of moderate growth and high habitat connectivity facilitates rapid ecological community turnover (e.g., +60 species in Shanxi, +40 in Shaanxi under SSP245).
4. Discussion
4.1. Theoretical Limitations
4.1.1. Model Constraints
4.1.2. Spatial Scale Limitations
4.2. Future Perspectives and Management Implications
4.2.1. Research Priorities
- ①
- Constructing multi-factor composite models. Current models primarily rely on natural variables (e.g., temperature, precipitation), and socioeconomic variables (e.g., population, GDP) as predictive drivers, but the actual invasion process is more complex, with additional factors—beyond those mentioned—also playing important roles. Land-use changes (e.g., soil desertification, urban expansion, and agricultural land conversions between croplands and forests) directly alter species habitats, thereby influencing invasion risks. However, this study did not incorporate these factors, potentially leading to risk assessment biases—particularly in fine-scale future analyses. Therefore, future prediction frameworks should aim to construct higher-dimensional composite models.
- ②
- Enhancing spatiotemporal accuracy. Beyond the model itself, long-term time series of invasion data can help better identify the long-term dynamics of alien plant invasion and the long-term effects of various drivers. A limitation of the existing model is the short time scale of species count data, which is only available for 2022. Therefore, in future studies, if more comprehensive and representative long-term data become available, the model can be further optimized and its prediction accuracy will be improved. In terms of spatial scale, the current study area can only go up to the provincial scale, such as the central and western provinces, which are too large and have too many regional differences, and the current study does not effectively incorporate more refined climate zones or detailed economic and demographic data than those described in Section 4.1. Therefore, more detailed data will more accurately capture the unique ecological and socioeconomic characteristics of different regions (at the city and county scales) and improve the accuracy of the results.
4.2.2. Management Recommendations
- ①
- Develop a regional differentiation strategy. Fully consider the results of the previous risk assessment (Section 4.2.1; ②), and tailor strategies to regional risks through a unified framework with localized measures. For example, in regions with favorable climatic conditions but high species fluctuations (e.g., Guangdong and Yunnan), the risk of alien plant invasion should be reduced by strengthening the resistance of native ecosystems, leveraging the diversity of local ecosystems [66].
- ②
- Strengthen policy simulation and scenario analysis. Similar to climate data analysis under different SSPs (SSP119, SSP245, SSP585), management studies should conduct multi-scenario simulations of prevention and control policies, use policy simulation models to assess the effects of implementing different policy measures, and assess in depth the impacts of different levels of policies on the future pathways of species expansion, in order to provide a more targeted scientific basis for decision-making, and achieve effective control of invasive alien plant risks.
- ③
- Interdisciplinary synergy and social participation.
- (i)
- Addressing spatial mismatch. According to the trend of “ecological hotspots” shifting to central and northwestern China, reconfigure the layout of the monitoring network, and adopt a monitoring mode that combines policy and technological approaches, supplemented by manpower and machines.
- (ii)
- Incorporating invasion pathway-related factors. Include predictor variables and detailed data on introduction pathways (e.g., port interception records, nursery trade volumes, transportation corridors).
- (iii)
- Developing scenario-specific strategies. Develop targeted prevention and control strategies according to risk differences in climatic regions and the ecological habits of invasive species.
- (iv)
- Balancing ecosystem resilience. In regions like the Tibetan Plateau with “natural barriers,” monitoring intensity should be carefully calibrated.
5. Conclusions
Supplementary Materials
Author Contributions
Funding
Institutional Review Board Statement
Data Availability Statement
Conflicts of Interest
References
- Lloyd, M.C.; Gatenby, R.A.; Brown, J.S. Chapter 11-Ecology of the Metastatic Process. In Ecology and Evolution of Cancer; Ujvari, B., Roche, B., Thomas, F., Eds.; Academic Press: Cambridge, MA, USA, 2017; pp. 153–165. ISBN 978-0-12-804310-3. [Google Scholar] [CrossRef]
- Institute of Botany, Chinese Academy of Sciences. China Invasive Alien Species Information System. Available online: https://www.iplant.cn/ias/ (accessed on 15 October 2023).
- Wang, F. Historical, Impact, and Countermeasure Research on Invasive Alien Species. Stud. Dialect. Nat. 2005, 21, 5. [Google Scholar] [CrossRef]
- Liu, X.; Huang, W.; Liu, Y.; Zhan, A. Perspectives of Invasive Alien Species Management in China. Ecol. Appl. 2024, 34, e2926. [Google Scholar] [CrossRef]
- Qin, F.; Xue, T.T.; Liang, Y.F.; Zhang, W.; Liu, Q.; Chen, T.; Yu, S. Present Status, Future Trends, and Control Strategies of Invasive Alien Plants in China Affected by Human Activities and Climate Change. Ecography 2023, 2024, e06919. [Google Scholar] [CrossRef]
- Diagne, C.; Leroy, B.; Vaissière, A.C.; Gozlan, R.E.; Roiz, D.; Jarić, I.; Salles, J.M.; Bradshaw, C.J.A.; Courchamp, F. High and Rising Economic Costs of Biological Invasions Worldwide. Nature 2021, 592, 571–576. [Google Scholar] [CrossRef]
- Yang, Q.; Ye, W.; Deng, X.; Xu, K. Characteristics and Hazards of Invasive Alien Plants in China. Ecol. Sci. 2002, 21, 6. [Google Scholar] [CrossRef]
- Yan, X.; Zhenyu, L.; Gregg, W.P.; Dianmo, L. Invasive Species in China–An Overview. Biodivers. Conserv. 2001, 10, 1317–1341. [Google Scholar] [CrossRef]
- Wan, F.-H.; Guo, J.-Y.; Wang, D.-H. Alien Invasive Species in China: Their Damages and Management Strategies. Biodiv. Sci. 2002, 10, 119–125. [Google Scholar] [CrossRef]
- Guo, K.; Pyek, P.; Van Kleunen, M.; Kinlock, N.L.; Lučanová, M.; Leitch, I.J.; Pierce, S.; Dawson, W.; Essl, F.; Kreft, H.; et al. Plant Invasion and Naturalization Are Influenced by Genome Size, Ecology and Economic Use Globally. Nat. Commun. 2024, 15, 1330. [Google Scholar] [CrossRef]
- Ju, R.; Li, H.; Shih, C.; Li, B. Progress of Biological Invasions Research in China over the Last Decade. Biodiv. Sci. 2012, 20, 581–611. [Google Scholar] [CrossRef]
- Jiang, Q.; Yao, W. Preliminary Establishment of a Risk Assessment Index System for Harmful Organisms. Plant Quar. 1994, 8, 4. [Google Scholar]
- Chen, X.-L.; Ning, D.-D.; Xiao, Q.; Jiang, Q.-Y.; Lu, Y.-Y.; Xu, Y.-J. Factors Affecting the Geographical Distribution of Invasive Species in China. J. Integr. Agric. 2022, 21, 1116–1125. [Google Scholar] [CrossRef]
- Chen, J.; Ma, F.; Zhang, Y.; Wang, C.; Xu, H. Spatial Distribution Patterns of Invasive Alien Species in China. Glob. Ecol. Conserv. 2021, 26, e01432. [Google Scholar] [CrossRef]
- Ministry of Ecology and Environment of the People’s Republic of China. Notice on the Release of the First List of Invasive Alien Species in China: Huanfa [2003] No. 11. Available online: https://www.mee.gov.cn/gkml/zj/wj/200910/t20091022_172155.htm (accessed on 31 July 2024).
- Korniss, G.; Caraco, T. Spatial Dynamics of Invasion: The Geometry of Introduced Species. J. Theor. Biol. 2005, 233, 137–150. [Google Scholar] [CrossRef]
- Yang, C.; Han, C. Assessment of Economic Losses Caused by Invasive Alien Species. Environ. Prot. 2005, 13, 13–17. [Google Scholar] [CrossRef]
- Born, W.; Rauschmayer, F.; Bräuer, I. Economic Evaluation of Biological Invasions—A Survey. Ecol. Econ. 2005, 55, 321–336. [Google Scholar] [CrossRef]
- Wang, Y.; Wan, F.; Shen, J. Quantitative Models and Applications for Risk Assessment of Invasive Alien Species. Acta Entomol. Sin. 2007, 50, 512–520. [Google Scholar] [CrossRef]
- Wang, Y.; Xie, B.; Wan, F.; Xiao, M.; Dai, L. Application of ROC Curve Analysis in Evaluating Distribution Models of Invasive Species. Biodiversity 2007, 15, 8. [Google Scholar] [CrossRef]
- Chen, H.; Chen, L. Predicting the Potential Distribution of Invasive Exotic Species Using GIS and Remote Sensing. J. Remote Sens. 2007, 11, 426–432. [Google Scholar] [CrossRef]
- Zhang, Y.; Lu, J. Research Progress on Remote Sensing Monitoring of Invasive Alien Species Spartina alterniflora and Eichhornia crassipes. Sci. Technol. Bull. 2010, 1, 8. [Google Scholar] [CrossRef]
- Hao, C.; Lijun, C.; Albright, T.P. Predicting the Potential Distribution of Invasive Exotic Species Using GIS and Information-Theoretic Approaches: A Case of Ragweed (Ambrosia artemisiifolia L.) Distribution in China. Chin. Sci. Bull. 2007, 52, 8. [Google Scholar] [CrossRef]
- Xu, H.; Qiang, S.; Han, Z.; Guo, J.; Huang, Z.; Sun, H.; He, S.; Ding, H.; Wu, H.; Wan, F. The Status and Causes of Alien Species Invasion in China. Biodivers. Conserv. 2006, 15, 2893–2904. [Google Scholar] [CrossRef]
- Ministry of Ecology and Environment of the People’s Republic of China. Notice on the Release of the Second List of Invasive Alien Species in China: Huanfa 2010. No. 4. Available online: https://www.mee.gov.cn/gkml/hbb/bwj/201001/t20100126_184831.htm (accessed on 1 August 2024).
- Ministry of Ecology and Environment of the People’s Republic of China. Announcement on the Release of the Third List of Invasive Alien Species in China: Announcement 2014 No. 57. Available online: https://www.mee.gov.cn/gkml/hbb/bgg/201408/t20140828_288367.htm (accessed on 1 August 2024).
- Ministry of Ecology and Environment of the People’s Republic of China. Announcement on the Release of the Fourth List of Invasive Alien Species in China’s Natural Ecosystems: Announcement 2016 No. 78. Available online: https://www.mee.gov.cn/gkml/hbb/bgg/201612/t20161226_373636.htm (accessed on 1 August 2024).
- Ma, J.; Li, H. The Checklist of the Alien Invasive Plants in China; Higher Education Press: Beijing, China, 2018; 299p, ISBN 978-7-04-048875-3. [Google Scholar]
- Luquan, W. Current Situation and Future of Legislation on Precaution of Alien Species Invasion in China. In Biodiversity Laws, Policies and Science in Europe, the United States and China; Antonelli, G., Qin, T., Ferroni, M.V., Erwin, A., Eds.; Springer: Cham, Switzerland, 2024; pp. 1–16. [Google Scholar] [CrossRef]
- Liu, J.; Liang, S.-C.; Liu, F.-H.; Wang, R.-Q.; Dong, M. Invasive Alien Plant Species in China: Regional Distribution Patterns. J. Ecol. 2005, 11, 341–347. [Google Scholar] [CrossRef]
- Zhou, Q.; Wang, Y.; Li, X.; Liu, Z.; Wu, J.; Musa, A.; Ma, Q.; Yu, H.; Cui, X.; Wang, L. Geographical Distribution and Determining Factors of Different Invasive Ranks of Alien Species across China. Sci. Total Environ. 2020, 722, 137929. [Google Scholar] [CrossRef]
- Yan, X.; Liu, Q.; Shou, H.; Zeng, X.; Zhang, Y.; Chen, L.; Liu, Y.; Ma, H.; Qi, S.; Ma, J. The Categorization and Analysis on the Geographic Distribution Patterns of Chinese Alien Invasive Plants. Biodivers. Sci. 2014, 22, 667. [Google Scholar] [CrossRef]
- Xu, H.G.; Qiang, S. Invasive Alien Species in China, Revised ed.; Science Press: Beijing, China, 2018; 299p, ISBN 978-7-04-048875-3. [Google Scholar]
- Ministry of Agriculture and Rural Affairs, Ministry of Natural Resources, Ministry of Ecology and Environment, General Administration of Customs. Measures for the Management of Invasive Alien Species: Ministry of Agriculture and Rural Affairs Order 2022. No. 4. Available online: https://www.gov.cn/zhengce/zhengceku/2022-06/17/content_5696171.htm (accessed on 1 August 2024).
- National Plant Specimen Resource Center. Checklist of Invasive and Naturalized Plants in China, 2023 Edition. Available online: https://www.cvh.ac.cn/iapc/ (accessed on 1 August 2024).
- Pyšek, P.; Hulme, P.E.; Simberloff, D.; Bacher, S.; Blackburn, T.M.; Carlton, J.T.; Dawson, W.; Essl, F.; Foxcroft, L.C.; Genovesi, P.; et al. Scientists’ warning on invasive alien species. Biol. Rev. 2020, 95, 1511–1534. [Google Scholar] [CrossRef]
- Tu, W.; Xiong, Q.; Qiu, X.; Zhang, Y. Dynamics of invasive alien plant species in China under climate change scenarios. Ecol. Indic. 2021, 129, 107919. [Google Scholar] [CrossRef]
- Gallien, L.; Douzet, R.; Pratte, S.; Zimmermann, N.E.; Thuiller, W. Invasive species distribution models–how violating the equilibrium assumption can create new insights. Glob. Ecol. Biogeogr. 2012, 21, 1126–1136. [Google Scholar] [CrossRef]
- Yang, M.; Zhao, H.; Xian, X.; Wang, R.; Yang, N.; Chen, L.; Liu, W. Assessing risk from invasive alien plants in China: Reconstructing invasion history and estimating distribution patterns of Lolium temulentum and Aegilops tauschii. Front. Plant Sci. 2023, 14, 1113567. [Google Scholar] [CrossRef]
- GEBCO Compilation Group. GEBCO 2023 Grid. 2023. Available online: https://doi.org/10.5285/f98b053b-0cbc-6c23-e053-6c86abc0af7b (accessed on 1 May 2024).
- National Centers for Environmental Information. Global Summary of the Day. NOAA. Available online: https://www.ncei.noaa.gov/data/global-summary-of-the-day/archive/ (accessed on 1 August 2024).
- Muñoz Sabater, J. ERA5-Land Monthly Averaged Data from 1950 to Present. Copernicus Climate Change Service (C3S) Climate Data Store (CDS). 2019. Available online: https://cds.climate.copernicus.eu/cdsapp#!/dataset/reanalysis-era5-land-monthly-means?tab=overview (accessed on 1 May 2024).
- Peng, S.; Ding, Y.; Liu, W.; Li, Z. 1 km Monthly Temperature and Precipitation Dataset for China from 1901 to 2017. Earth Syst. Sci. Data 2019, 11, 1931–1946. [Google Scholar] [CrossRef]
- National Bureau of Statistics. China City Statistical Yearbook; China Statistics Press: Beijing, China, 2000–2023. Available online: https://www.stats.gov.cn/english/Statisticaldata/yearbook/ (accessed on 1 August 2024).
- Tong, J.; Su, B.; Jing, C.; Wang, Y.; Huang, J.; Guo, H.; Yang, Y.; Wang, G. Yong Luo National and Provincial Population and Economy Projection Databases under Shared Socioeconomic Pathways (SSP1-5)_v2. Sci. Data Bank 2024. [Google Scholar] [CrossRef]
- Chen, Y.; Guo, F.; Wang, J.; Cai, W.; Wang, C.; Wang, K. Provincial and Gridded Population Projection for China under Shared Socioeconomic Pathways from 2010 to 2100. Sci. Data 2020, 7, 83. [Google Scholar] [CrossRef]
- Census and Statistics Department. Hong Kong Population Projections 2017–2066. Hong Kong SAR Government. Available online: https://www.censtatd.gov.hk/tc/page_1335.html (accessed on 11 August 2024).
- Statistics and Census Service. Population Projections. Macao SAR Government. Available online: https://www.dsec.gov.mo/zh-MO/Statistic?id=102 (accessed on 11 August 2024).
- He, C.; Liu, Z.; Tian, J.; Ma, Q. Urban Expansion Dynamics and Natural Habitat Loss in China: A Multiscale Landscape Perspective. Glob. Change Biol. 2014, 20, 2886–2902. [Google Scholar] [CrossRef]
- Liu, Z.; Ying, J.; Bai, Q.; Pan, X.; He, C.; Huang, Q. Dataset of Global Urban. Expansion (1992–2070) V2.0. National Tibetan Plateau Third Pole Environment Data Center. 2023. Available online: https://doi.org/10.11888/HumanNat.tpdc.300871 (accessed on 15 May 2024).
- He, C.; Liu, Z.; Xu, M.; Lu, W. Dataset of Urban. Built-up Area in China (1992–2020) V1.0. National Tibetan Plateau/Third Pole Environment Data Center. 2022. Available online: https://doi.org/10.11888/HumanNat.tpdc.272851 (accessed on 15 May 2024).
- Chen, Z.; Yu, B.; Yang, C.; Zhou, Y.; Yao, S.; Qian, X.; Wang, C.; Wu, B.; Wu, J. An Extended Time Series (2000–2018) of Global NPP-VIIRS-like Nighttime Light Data from a Cross-Sensor Calibration. Earth Syst. Sci. Data 2021, 13, 889–906. [Google Scholar] [CrossRef]
- Chen, X.; Wang, Z.; Zhang, F.; Shen, G.; Chen, Q. A Global Annual Simulated VIIRS Nighttime Light Dataset from 1992 to 2023. Sci. Data 2024, 11, 1380. [Google Scholar] [CrossRef]
- World Trade Organization. World Trade Report 2023: Re-globalization for a Secure, Inclusive and Sustainable Future; WTO: Geneva, Switzerland, 2023; Volume xii, 130p, ISBN 978-92-870-7410-2. [Google Scholar]
- National Bureau of Statistics of China. China System of National Accounts (2016); China Statistics Press: Beijing, China, 2017; ISBN 978-7-5037-8136-5. [Google Scholar]
- Silva-Junior, V.; Souza, D.G.; Queiroz, R.T.; Souza, L.G.R.; Ribeiro, E.M.S.; Santos, B.A. Landscape Urbanization Threatens Plant Phylogenetic Diversity in the Brazilian Atlantic Forest. Urban. Ecosyst. 2018, 21, 625–634. [Google Scholar] [CrossRef]
- Boscutti, F.; Lami, F.; Pellegrini, E.; Buccheri, M.; Busato, F.; Martini, F.; Sibella, R.; Sigura, M.; Marini, L. Urban Sprawl Facilitates Invasions of Exotic Plants across Multiple Spatial Scales. Biol. Invasions 2022, 24, 1497–1510. [Google Scholar] [CrossRef]
- Bruederle, A.; Hodler, R. Nighttime Lights as a Proxy for Human Development at the Local Level. PLoS ONE 2018, 13, e0202231. [Google Scholar] [CrossRef]
- Levin, N.; Zhang, Q. A Global Analysis of Factors Controlling VIIRS Nighttime Light Levels from Densely Populated Areas. Remote Sens. Environ. 2017, 190, 366–382. [Google Scholar] [CrossRef]
- Friedman, J.H. Greedy Function Approximation: A Gradient Boosting Machine. Ann. Statist. 2001, 29, 1189–1232. [Google Scholar] [CrossRef]
- Chen, T.; Guestrin, C. XGBoost: A Scalable Tree Boosting System. In Proceedings of the 22nd ACM SIGKDD International Conference on Knowledge Discovery and Data Mining, San Francisco, CA, USA, 13–17 August 2016; pp. 785–794. [Google Scholar] [CrossRef]
- Breiman, L. Random Forests. Mach. Learn. 2001, 45, 5–32. [Google Scholar] [CrossRef]
- Ke, G.; Meng, Q.; Finley, T.; Wang, T.; Chen, W.; Ma, W.; Ye, Q.; Liu, T. LightGBM: A Highly Efficient Gradient Boosting Decision Tree. In Proceedings of the 31st Conference on Neural Information Processing Systems (NIPS 2017), Long Beach, CA, USA, 4–9 December 2017; pp. 3149–3157, ISBN 978-1-5108-6096-4. [Google Scholar]
- Wolpert, D.H. Stacked Generalization. Neural Netw. 1992, 5, 241–259. [Google Scholar] [CrossRef]
- Wani, N.; Mathias, S.; Gajjam, J.A.; Bhattacharyya, P. The Whole is Greater than the Sum of its Parts: Towards the Effectiveness of Voting Ensemble Classifiers for Complex Word Identification. In Proceedings of the 13th Workshop on Innovative Use of NLP for. Building Educational Applications, New Orleans, LA, USA, 5 June 2018; pp. 200–205. [Google Scholar] [CrossRef]
- Pan, Y.; Tang, S.; Wei, C.; Li, X.; Lü, S. Competition between Three Native Plants and Invasive Ageratina adenophora. Acta Ecol. Sin. 2022, 42, 2394–2404. [Google Scholar] [CrossRef]


| Data Type | Data Source | Source Website |
|---|---|---|
| Invasive Species | Invasive Alien Species of China | https://www.iplant.cn/ias/ (accessed on 15 August 2024) |
| Chinese Virtual Herbarium | https://www.cvh.ac.cn/ (accessed on 15 August 2024) | |
| DEM | British Oceanographic Data Centre (BODC) | https://www.gebco.net/data_and_products/gridded_bathymetry_data/ (accessed on 15 August 2024) |
| Precipitation Amount Data | National Oceanic and Atmospheric Administration (NOAA) | https://www.ncei.noaa.gov/data/global-summary-of-the-day/archive/ (accessed on 15 August 2024) |
| Temperature Data | European Centre for Medium-Range Weather Forecasts (ECMWF) | https://cds.climate.copernicus.eu/cdsapp#!/dataset/reanalysis-era5-land-Monthly-means?tab=overview (accessed on 15 August 2024) |
| Future precipitation and temperature data | Institute of Tibetan Plateau Research Chinese Academy of Sciences [43] | https://data.tpdc.ac.cn/home (accessed on 15 August 2024) |
| GDP and per capita GDP | the National Bureau of Statistics and the Report on Regional Economic and Social Development | https://www.stats.gov.cn/ (accessed on 15 August 2024) |
| Projected GDP data | Gridded datasets for population and economy under Shared Socioeconomic Pathways [45] | https://cstr.cn/31253.11.sciencedb.01683 (accessed on 15 August 2024) |
| Regional Government Statistical Centers | ||
| Projected population data | City-level population projection for China under different pathways from 2010 to 2100 [46] | https://doi.org/10.6084/m9.figshare.c.6669299.v1 (accessed on 15 August 2024) |
| Regional Government Statistical Centers | ||
| Urban built-up area | Institute of Tibetan Plateau Research Chinese Academy of Science [49] | https://data.tpdc.ac.cn/home (accessed on 15 August 2024) |
| VIIRS | Harvard Dataverse | https://dataverse.harvard.edu/dataset.xhtml?persistentId=doi:10.7910/DVN/YGIVCD (accessed on 15 August 2024) |
| Variables | Number of Species | DEM | GDP per Capita | Population | Precipitation | Temperature | GDP |
|---|---|---|---|---|---|---|---|
| Number of species | 1 | −0.389 * | 0.198 | 0.469 ** | 0.659 ** | 0.819 ** | 0.590 ** |
| Significance | 0.023 | 0.261 | 0.005 | 0.0002 | 0.0003 | 0.0002 |
| Province | MRI-ESM2-0 SSP119 | MRI-ESM2-0 SSP245 | MRI-ESM2-0 SSP585 | GFDL-ESM4 SSP119 | GFDL-ESM4 SSP245 | GFDL-ESM4 SSP585 | EC-Earth3 SSP119 | EC-Earth3 SSP245 | EC-Earth3 SSP585 |
|---|---|---|---|---|---|---|---|---|---|
| Anhui | 60 | 56 | 79 | 79 | 65 | 64 | 69 | 72 | 94 |
| Macao | 11 | 19 | 19 | 16 | 20 | 3 | −10 | 15 | 30 |
| Beijing | 5 | 15 | 8 | 28 | 6 | 2 | −5 | 21 | 15 |
| Chongqing | 87 | 90 | 80 | 96 | 77 | 73 | 92 | 79 | 77 |
| Fujian | 0 | 17 | 20 | 2 | 2 | 5 | 15 | 28 | 25 |
| Gansu | 45 | 56 | 49 | 23 | 51 | 23 | 14 | 85 | 79 |
| Guangdong | 20 | −22 | 1 | 7 | −11 | 19 | −1 | −19 | 5 |
| Guangxi | −5 | −15 | 8 | −2 | −26 | 12 | −26 | −30 | −10 |
| Guizhou | 40 | 37 | 43 | 27 | 44 | 28 | 57 | 41 | 51 |
| Hainan | 10 | 5 | −9 | −8 | 6 | 28 | 8 | 3 | 9 |
| Hebei | 30 | 25 | 12 | 59 | 15 | 2 | 10 | 20 | 22 |
| Heilongjiang | 59 | 6 | 40 | 1 | 50 | 0 | 45 | 45 | 26 |
| Henan | 85 | 67 | 91 | 98 | 78 | 53 | 126 | 83 | 100 |
| Hubei | 90 | 63 | 83 | 96 | 79 | 74 | 98 | 84 | 74 |
| Hunan | 80 | 100 | 108 | 77 | 65 | 60 | 94 | 93 | 98 |
| Jiangsu | 13 | −5 | 23 | 2 | 3 | −8 | 37 | 10 | 18 |
| Jiangxi | 33 | 45 | 48 | 30 | 31 | 34 | 33 | 55 | 46 |
| Jilin | 81 | 36 | 49 | 10 | 78 | 20 | 56 | 70 | 45 |
| Liaoning | 57 | 23 | 44 | 47 | 43 | 53 | 24 | 30 | 40 |
| Inner Mongolia | 56 | 62 | 45 | 38 | 54 | 23 | 35 | 74 | 72 |
| Ningxia | 45 | 56 | 51 | 24 | 37 | 39 | 18 | 45 | 49 |
| Qinghai | 29 | 26 | 27 | 7 | 16 | 16 | 6 | 25 | 30 |
| Shandong | 74 | 36 | 84 | 65 | 64 | 33 | 90 | 50 | 68 |
| Shanghai | 29 | 42 | 59 | 27 | 20 | 28 | 30 | 48 | 61 |
| Shaanxi | 62 | 40 | 70 | 78 | 35 | 37 | 63 | 43 | 45 |
| Shanxi | 99 | 61 | 81 | 106 | 71 | 56 | 43 | 78 | 84 |
| Sichuan | 33 | −1 | 54 | 15 | −12 | 42 | 35 | 11 | 22 |
| Taiwan | −4 | 9 | −6 | −12 | −25 | −4 | −17 | 8 | −3 |
| Tianjin | 50 | 46 | 39 | 42 | 36 | 32 | 37 | 77 | 71 |
| Hong Kong | 45 | 60 | 52 | 36 | 37 | 41 | 15 | 49 | 65 |
| Xinjiang | 51 | 65 | 59 | 31 | 61 | 23 | 25 | 88 | 105 |
| Tibet | −7 | −8 | −2 | −15 | −8 | −5 | −8 | −3 | 1 |
| Yunnan | −30 | −33 | −34 | −50 | −52 | −36 | −39 | −31 | −42 |
| Zhejiang | 10 | 11 | 47 | 34 | 12 | 8 | 35 | 42 | 55 |
Disclaimer/Publisher’s Note: The statements, opinions and data contained in all publications are solely those of the individual author(s) and contributor(s) and not of MDPI and/or the editor(s). MDPI and/or the editor(s) disclaim responsibility for any injury to people or property resulting from any ideas, methods, instructions or products referred to in the content. |
© 2025 by the authors. Licensee MDPI, Basel, Switzerland. This article is an open access article distributed under the terms and conditions of the Creative Commons Attribution (CC BY) license (https://creativecommons.org/licenses/by/4.0/).
Share and Cite
Cui, Y.; Ni, X.; Jiang, Z.; Song, Y.; Bao, X. Analysis of Influencing Factors and Trend Prediction of Invasive Alien Plants in China. Diversity 2025, 17, 521. https://doi.org/10.3390/d17080521
Cui Y, Ni X, Jiang Z, Song Y, Bao X. Analysis of Influencing Factors and Trend Prediction of Invasive Alien Plants in China. Diversity. 2025; 17(8):521. https://doi.org/10.3390/d17080521
Chicago/Turabian StyleCui, Yan, Xiliang Ni, Zhaolin Jiang, Yilin Song, and Xinrui Bao. 2025. "Analysis of Influencing Factors and Trend Prediction of Invasive Alien Plants in China" Diversity 17, no. 8: 521. https://doi.org/10.3390/d17080521
APA StyleCui, Y., Ni, X., Jiang, Z., Song, Y., & Bao, X. (2025). Analysis of Influencing Factors and Trend Prediction of Invasive Alien Plants in China. Diversity, 17(8), 521. https://doi.org/10.3390/d17080521