Article

DNA Barcode Contamination Screen (DBCscreen): A Pipeline to Rapidly Detect DNA Barcode Contamination for Biodiversity Research

Chongqing Key Laboratory of Big Data for Bio Intelligence, Chongqing University of Posts and Telecommunications, Chongqing 400065, China
*
Author to whom correspondence should be addressed.
Diversity 2025, 17(3), 186; https://doi.org/10.3390/d17030186
Submission received: 26 January 2025 / Revised: 25 February 2025 / Accepted: 4 March 2025 / Published: 6 March 2025

Abstract

:
NGS sequencing data are expanding exponentially, accompanied by a concomitant growth in non-target species contamination. Meanwhile, these seemingly undesirable sequences can actually provide valuable insights into the broad-scale diversity and distribution of their parasites or symbionts. In this study, we developed a pipeline called DBCscreen (DNA Barcode Contamination screen) to explore biodiversity and distribution across a broad range of living organisms, based on a DNA barcode contamination survey. We used DBCscreen to screen 39,302 eukaryotic assemblies in the NCBI TSA/WGS database, and after stringent filtering, we ultimately identified 110,880 contaminated contigs related to DNA barcodes in 10,717 assemblies. Subsequently, the taxonomic information of these contaminants was determined, and their heterogeneous distribution patterns revealed complex relationships between the hosts (assembly source) and their associated parasites or symbionts (contaminants). Finally, several application examples demonstrating the use of DBCscreen were described, such as identification of the most easily contaminated organisms associated with a specific host (ex. ticks), as well as the specification of which hosts are particularly prone to certain types of contamination (ex. Wolbachia and nematodes).

1. Introduction

Symbiotic and parasitic associations are widespread relationships between living organisms that profoundly impact their ecological and physiological characteristics. However, unraveling these relationships on a broad scale is challenging. With the rapid development of sequencing technology, genomic data have expanded exponentially, and continue to grow. Contamination in the genomic data is not unusual [1], reflecting the intricate relationships between living organisms, which encompass symbiotic, parasitic, and even dietary associations [2]. Indeed, when field samples are collected directly from natural environments, their associated organisms can be sequenced concurrently, leading to contamination. These unexpected sequences are typically filtered out during quality control. However, they can also provide valuable insights into the distribution and diversity of living organisms [3].
The utility of contamination in studying such relationships has been increasingly recognized; for example, deep data mining has revealed variable abundance and distribution of Wolbachia within and among diverse host species [4]. Furthermore, by screening over 30,000 publicly available shotgun DNA sequencing samples, 1000 Wolbachia genomes were assembled to clarify the evolution of Wolbachia [5]. Thus, these contaminants might seem like trash to some, but can be viewed as treasure by others [6]. Previously, we also designed a pipeline to investigate the distribution of protists and mites based on contamination in the TSA/WGS databases [7]. However, given the vast size of genomic databases, our method was limited to scanning for contamination caused by certain taxa of organisms. Indeed, without an elaborate approach, surveying all potential contamination within large databases would be computationally infeasible with limited computational resources.
To address this challenge and achieve the simultaneous detection of contamination from all species, in this report, we propose DBCscreen, a pipeline to quickly and sensitively unravel the presence of between class/phylum contamination of DNA barcodes. DBCscreen utilizes the GX in NCBI foreign contamination Screen (FCS-GX) tool suite to align sequences [8]. Unlike FCS-GX, which uses a whole genome of references to construct a database, DBCscreen employs the largest DNA barcode database, Barcode of Life Data Systems (BOLD) [9], to construct a database. Then, we utilized DBCscreen to screen for contamination in TSA/WGS database. Based on the contamination results, we describe some applications of DBCscreen for the study of the diversity and distribution of living organisms. Given its ability to rapidly and sensitively detect DNA barcode contaminants in large datasets, DBCscreen will aid significantly in ecological and evolutionary studies.

2. Materials and Methods

2.1. Database Retrieval

The BOLD database was downloaded from (https://bench.boldsystems.org/index.php/datapackages, version 15 November 2024, accessed on 15 November 2024). This package comprises 16,505,334 sequences from 583,903 species, primarily derived from the COI (82.6%), ITS (3.8%), and 18S rRNA (0.9%) genes. The RefSeq viral database was downloaded from (https://ftp.ncbi.nlm.nih.gov/refseq/release/viral, accessed on 13 January 2025).
For classifying the taxonomy of the contaminated contigs, the NCBI taxonomy database was downloaded from (https://ftp.ncbi.nlm.nih.gov/pub/taxonomy, accessed on 14 July 2023). A total of 39,302 assemblies of eukaryotic organisms were downloaded from the NCBI TSA/WGS database in Genbank [10] (https://www.ncbi.nlm.nih.gov/Traces/wgs, accessed on 30 June 2023).

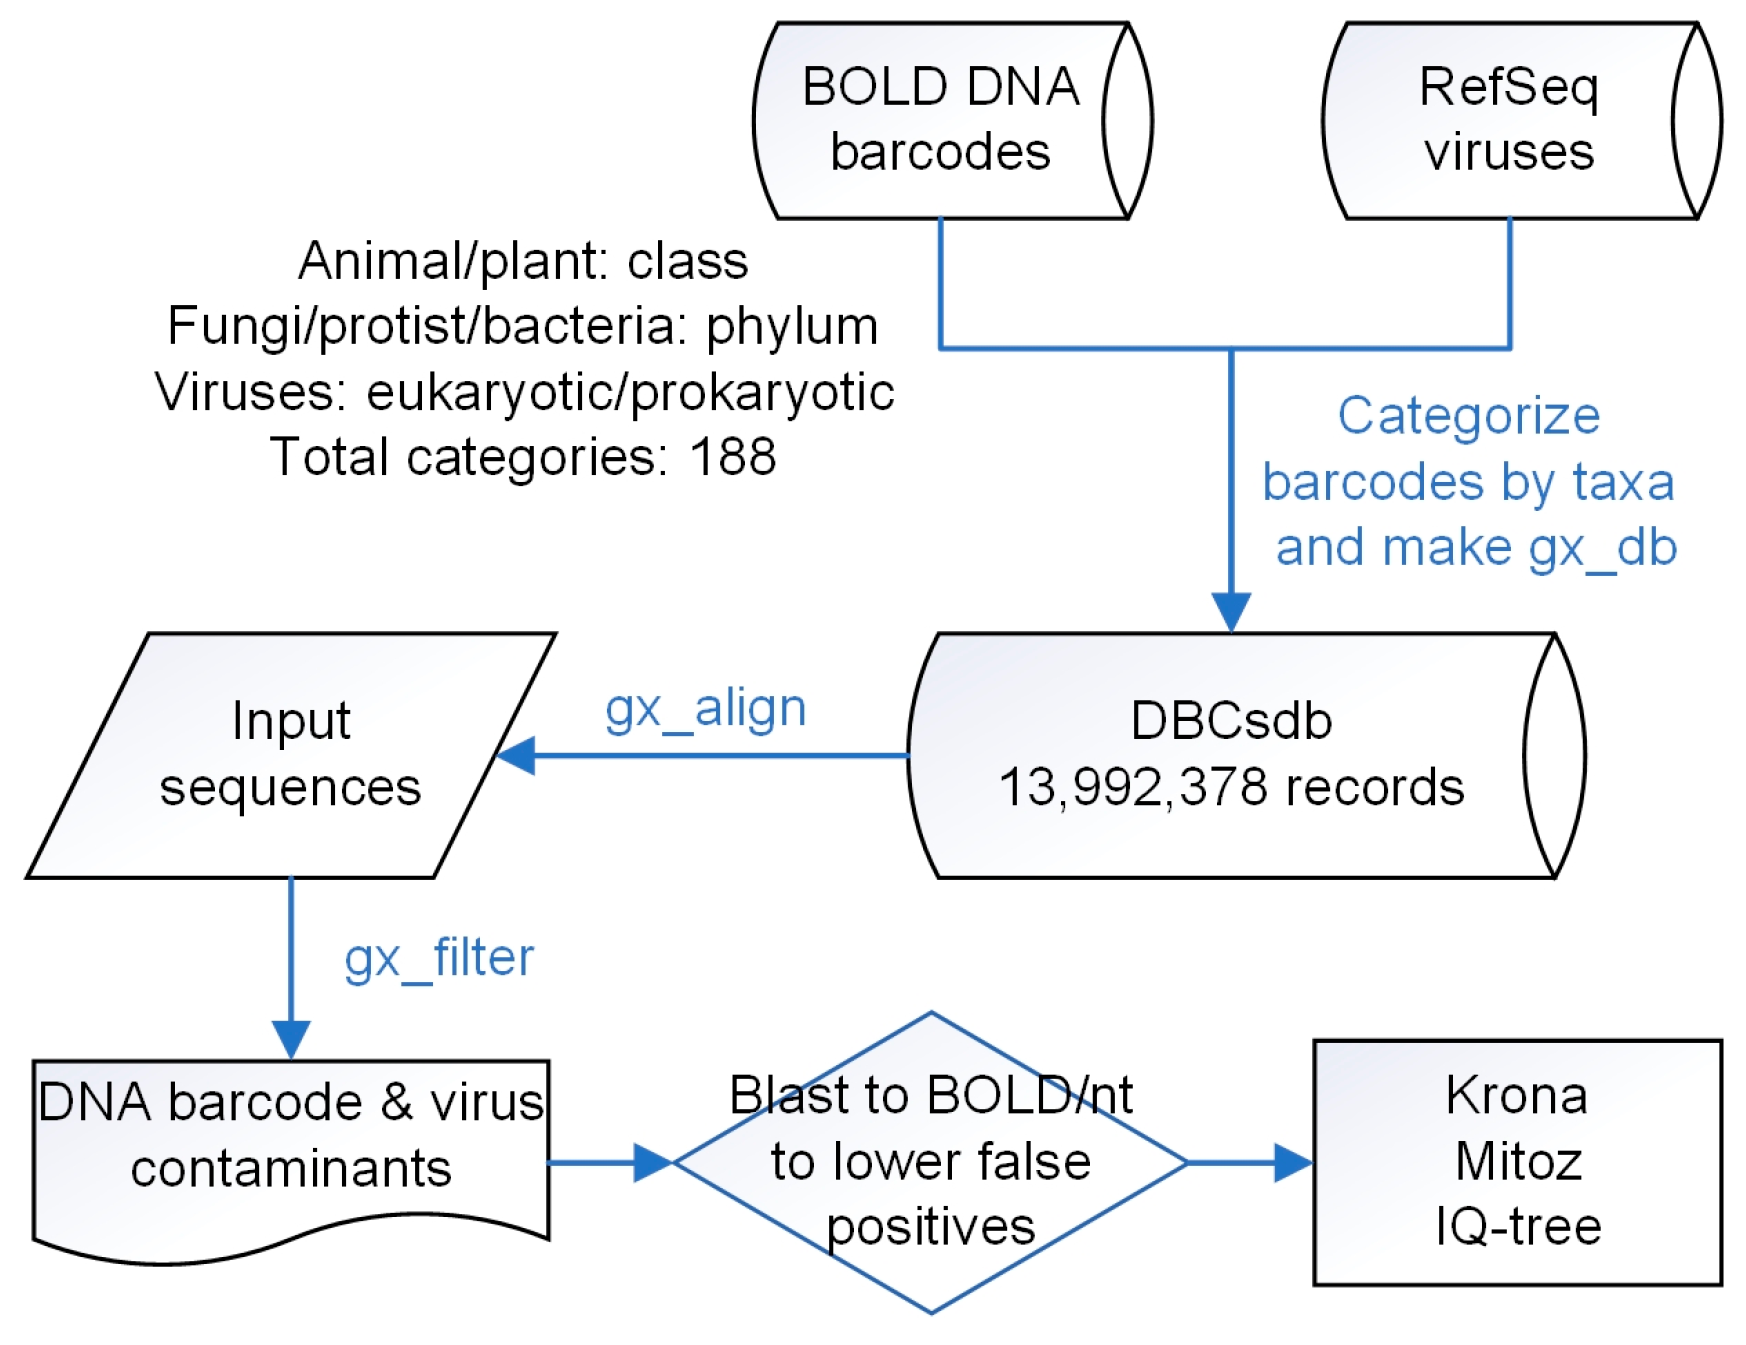
2.2. DBCscreen Database Construction

The pipeline of DBCscreen is illustrated in (Figure 1). We first categorized the BOLD DNA barcodes according to the NCBI taxonomy, and classified the barcodes of animals or plants to the class level, those of fungi, protists, and bacteria to the phylum level, and RefSeq viruses to either eukaryotic or prokaryotic classes. After filtering out sequences lacking detailed taxonomy information and those containing illegal characters, 13,992,378 sequences were assigned to 188 categories (Spreadsheet S1). Subsequently, the make-db command of GX was employed to format the database.

2.3. NCBI TSA/WGS Database Screening

A total of 39,302 assemblies belonging to eukaryotes in the TSA/WGS database (Spreadsheet S2) were aligned with GX to the DBCscreen database. As GX is designed to remove contamination across the entire genome, by leveraging whole-genome coverage and the ratios of apparent contaminants of host sequences to distinguish between kingdom and subkingdom contaminants, its classification standards are not suited for a database that just covers DNA barcode sequences. Therefore, we developed a custom script to filter the output of GX. The details of this process are as follows: we first filtered out records with a GX score of less than 40 and those that shared the same taxonomic division with the source of the assembly. We also considered the coverage and length of the contig, as in some instances, very long chromosomes might have only a few bases aligned with the DBCscreen database. Thus, we filtered out contigs with less than 300 bp aligned and contigs with less than 0.1% coverage. Secondly, the remaining contigs were subjected to BLAST V2.12.0+ analysis against the BOLD database. Only the contigs with the highest alignment scores, which matched DNA barcodes from the same taxonomic division as GX alignment in the first step, were retained. The corresponding genes of these DNA barcodes were then assigned to the selected contigs.

2.4. Contamination Taxonomy Classification

To minimize false positives, the resulting contaminated contigs were further aligned with the Core Nucleotide Database (core_nt) with the -outfmt “6 std staxid ssciname stitle” option. The staxid of the top hit were assigned to the contamination. Krona [11] was then applied to plot the distribution and hierarchy of these contaminants.

2.5. Phylogenetic Analysis

In the phylogenetic analysis, the Nematoda-contaminated contigs were blasted to 18S rRNA reference sequences downloaded from the SILVA [12] database (https://www.arb-silva.de, accessed on 18 January 2025), and any of the 18S rRNA sequences related to the contaminated contigs that were longer than 300 nucleotides were aligned with Nematoda 18S rRNA references by MAFFT [13]. Finally, maximum likelihood (ML) trees were constructed with IQ-tree V2.1.4 [14], with the following parameter setting: -m MFP -B 1000 -alrt 1000. The phylogenetic trees were visualized using FigTree version 1.4.4, which can be accessed at (http://tree.bio.ed.ac.uk/software/figtree, accessed on 18 January 2025).

3. Results

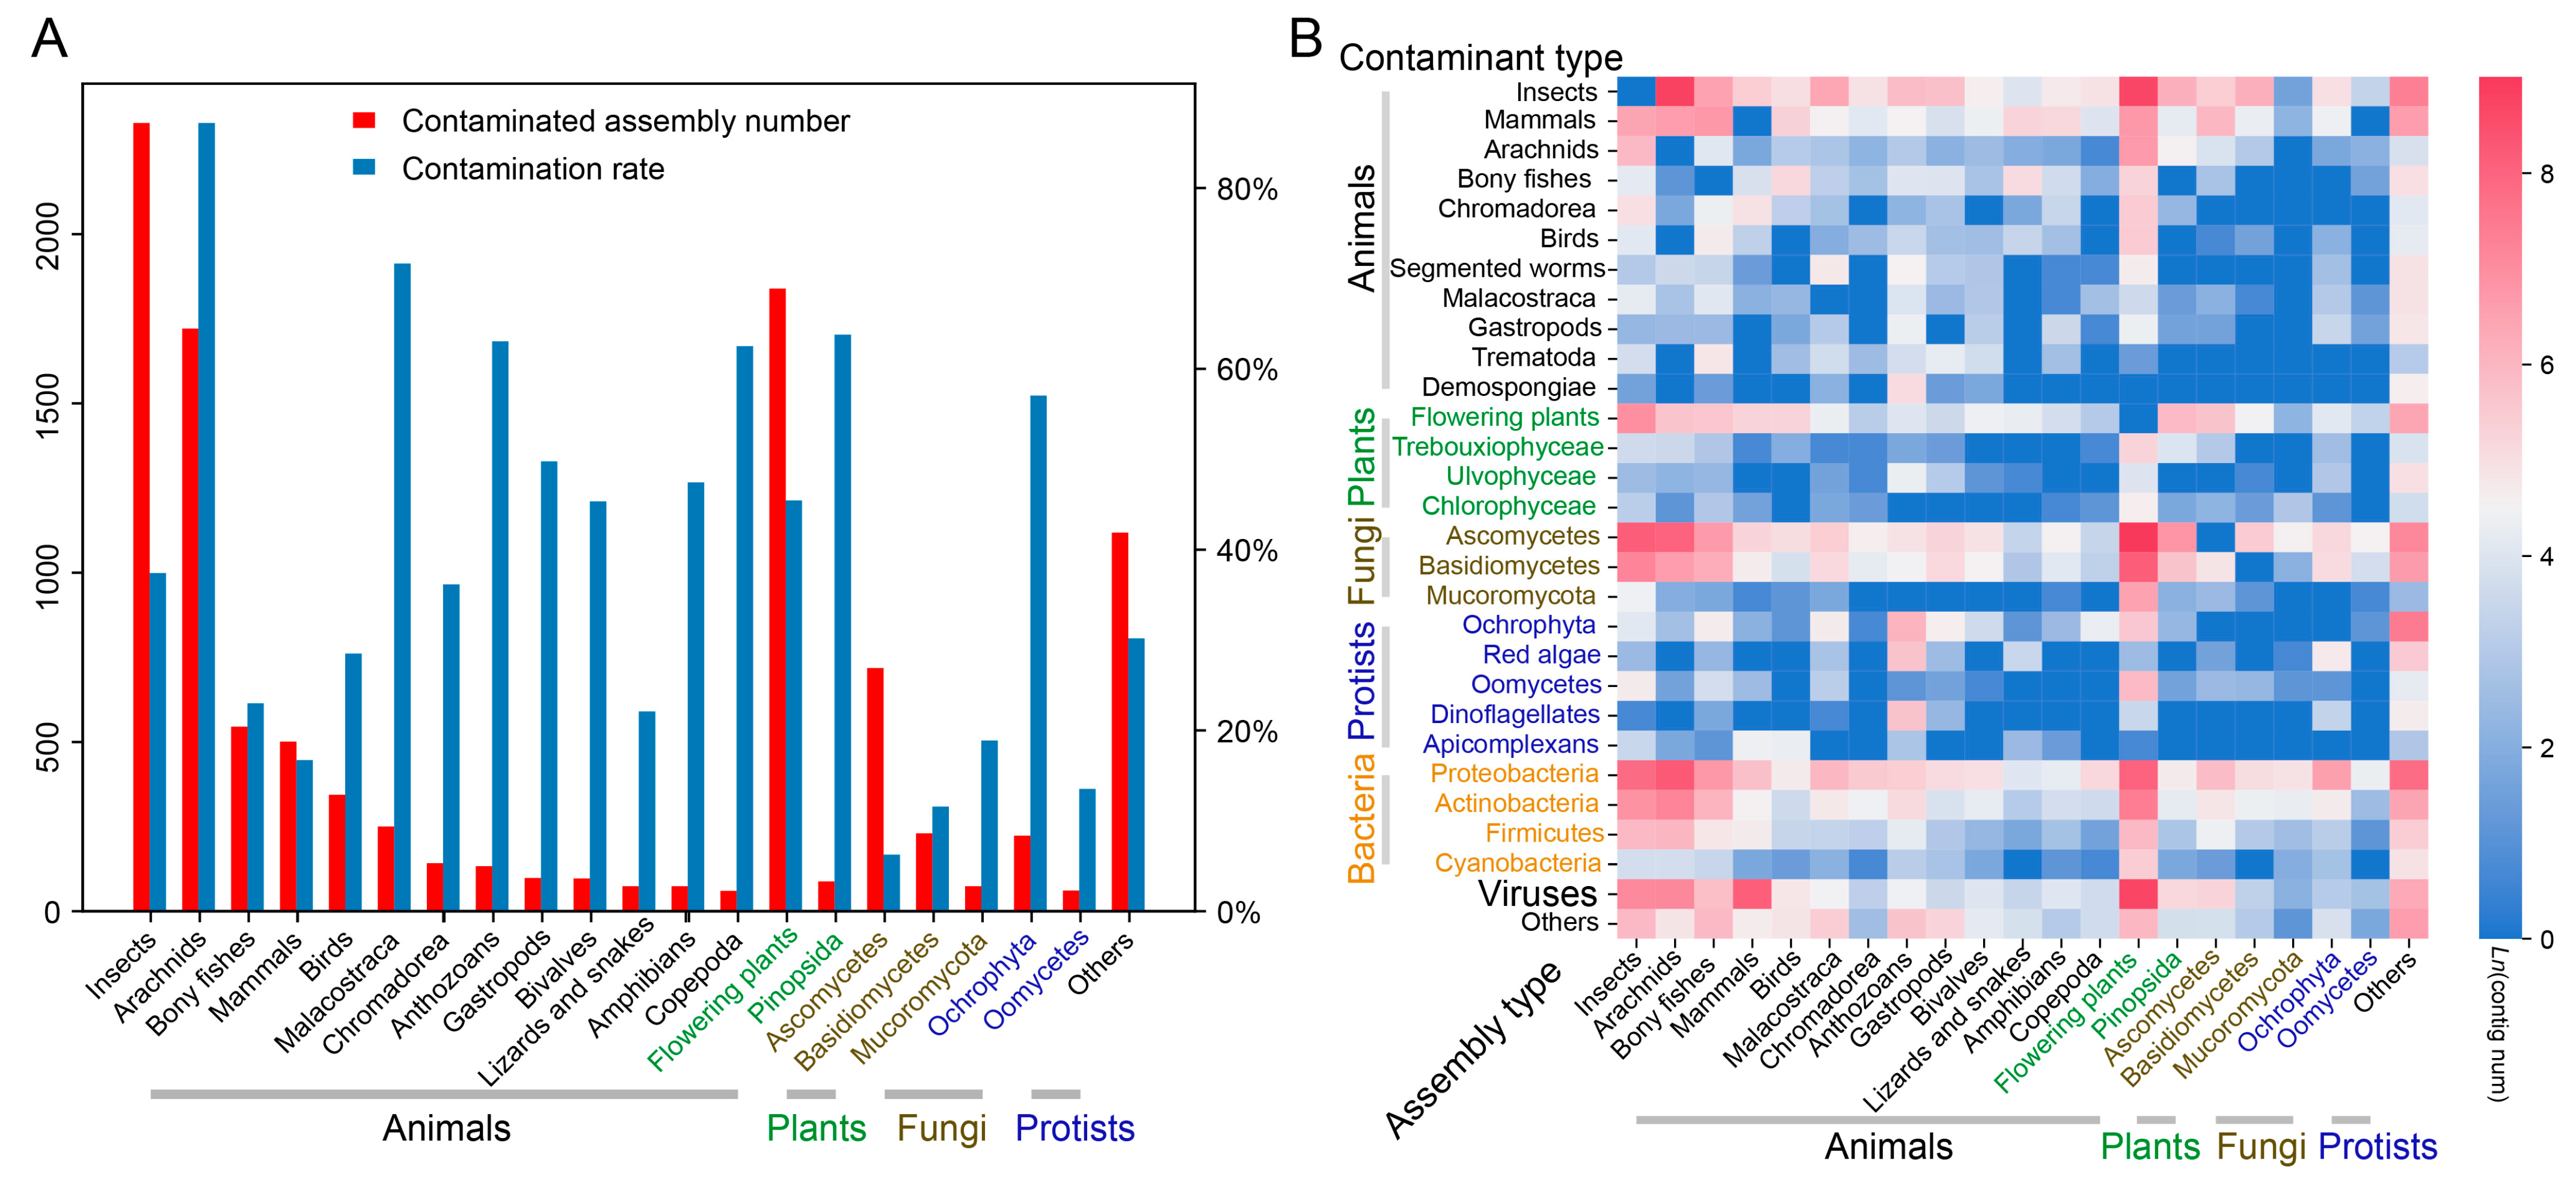
3.1. DBCscreen Detects a Vast Range of Contaminants in the TSA/WGS Database

The NCBI TSA/WGS database includes assemblies from a wide variety of species. We scanned these assemblies using DBCscreen, further filtered the contaminants by blasting them against the core_nt database, and ultimately obtained 110,880 contaminated contigs (Spreadsheet S3). Based on these contaminants, we analyzed the contamination rate and distribution of specific species within certain hosts. The results were as follows: despite having the highest number of total assemblies, ascomycete fungi exhibited the lowest contamination rate (718/11,469, 6.3%) (Figure 2A) (Spreadsheet S4), which may be attributed to their ease of culture and purification prior to sequencing [15]. In contrast, insects and flowering plants had the second-highest number of assemblies, and they also had the highest number of contaminated assemblies. Although arachnids only had the third-highest number of contaminated assemblies, they exhibited the highest contamination rate.
To further elucidate the distribution of these contaminants, we calculated the number of contaminated contigs for each taxon across different hosts (Figure 2B). Regarding the contamination species, ascomycetes (19,636/110,880, 17.7%), insects (18,363/110,880, 16.6%), and proteobacteria (16,141/110,880, 14.6%) (Spreadsheet S5) were the three most significant sources of contamination. Additionally, we uncovered some intriguing patterns. For instance, among protist contaminants, apicomplexan contaminants were predominantly found in mammals (83/252, 32.9%), birds (74/252, 29.4%), and insects (33/252, 13.1%); dinoflagellates were mainly associated with anthozoans (300/489, 61.3%); and oomycetes were primarily detected in flowering plants (361/666, 54.2%) and insects (109/666, 16.4%). In the animal category, contaminants of arachnids (class including mites and spiders) were largely found in flowering plants (812/1593, 60.0%), insects (381/1593, 23.9%), and Pinopsida (99/1593, 6.2%) assemblies. These findings align with our previous reports on the distribution of protists and mites [7,16].
Given the extensive information on biodiversity and ecology that these contaminants can provide, we will next describe four application examples to illustrate how DBCscreen can help to reveal the intrinsic relationships between living organisms. Our goal is not to provide precise numbers or rates of distribution for the species presented, but rather to visually illustrate the diversity and distribution evident in these data.

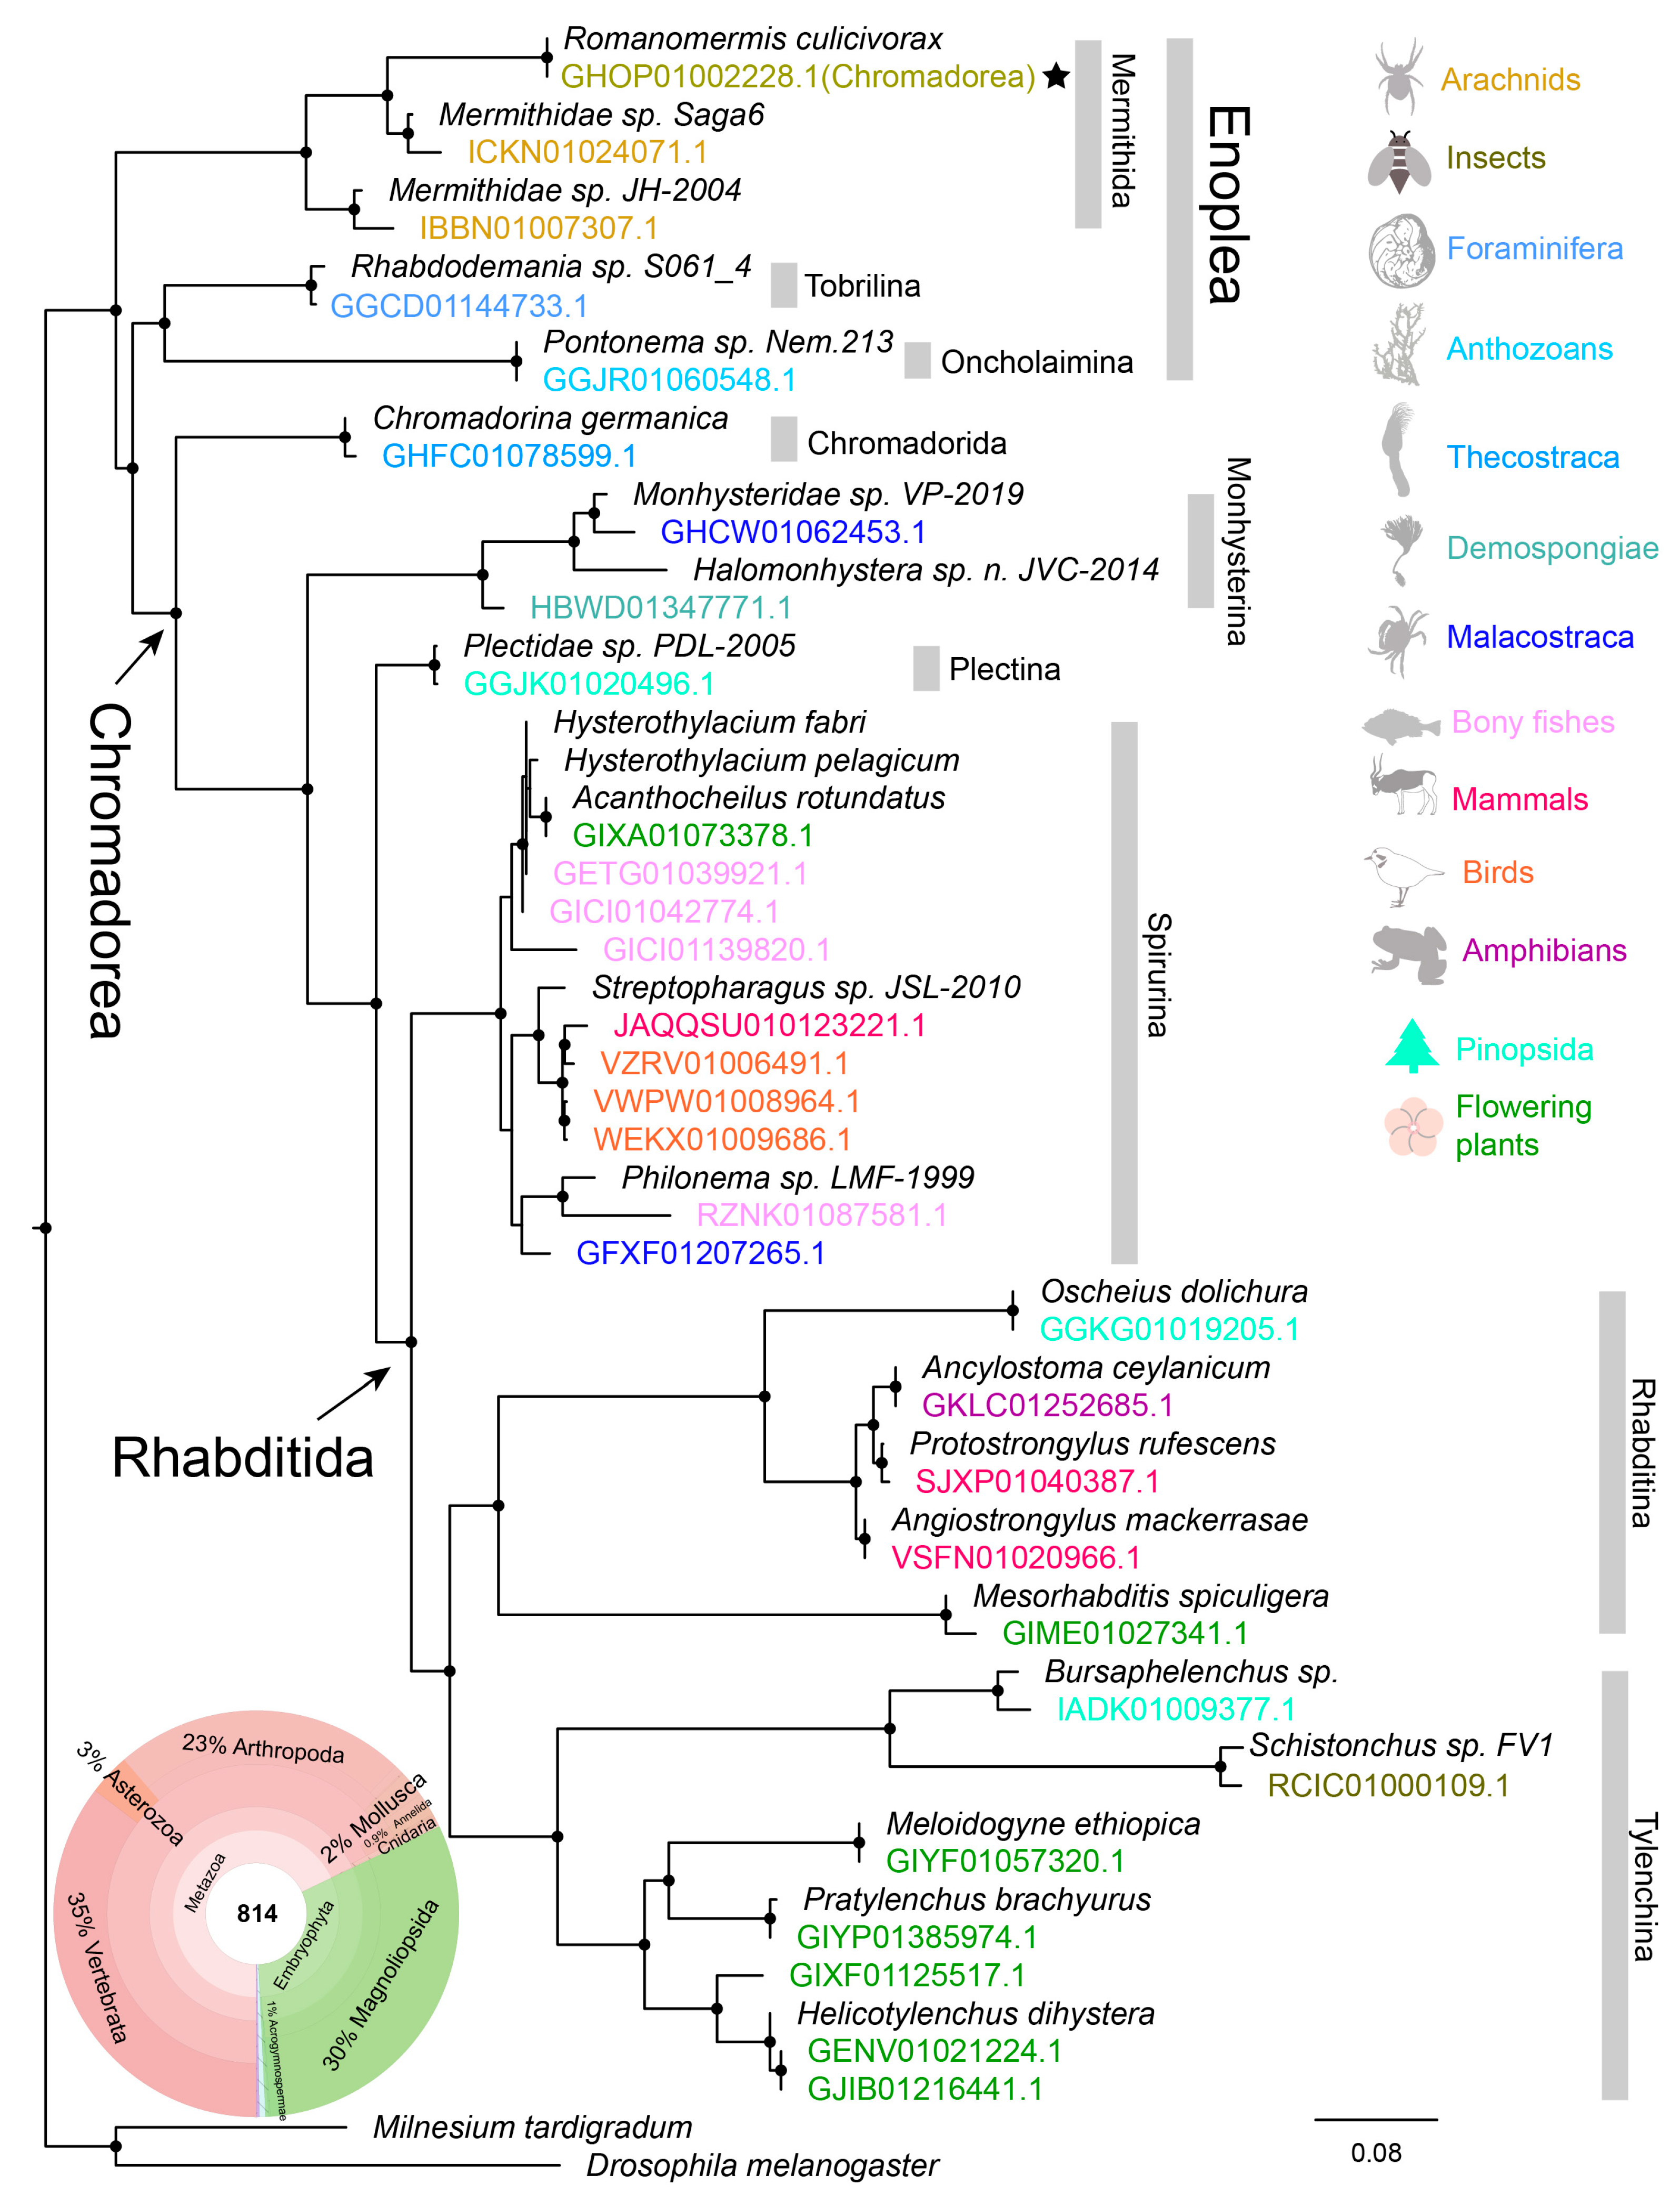
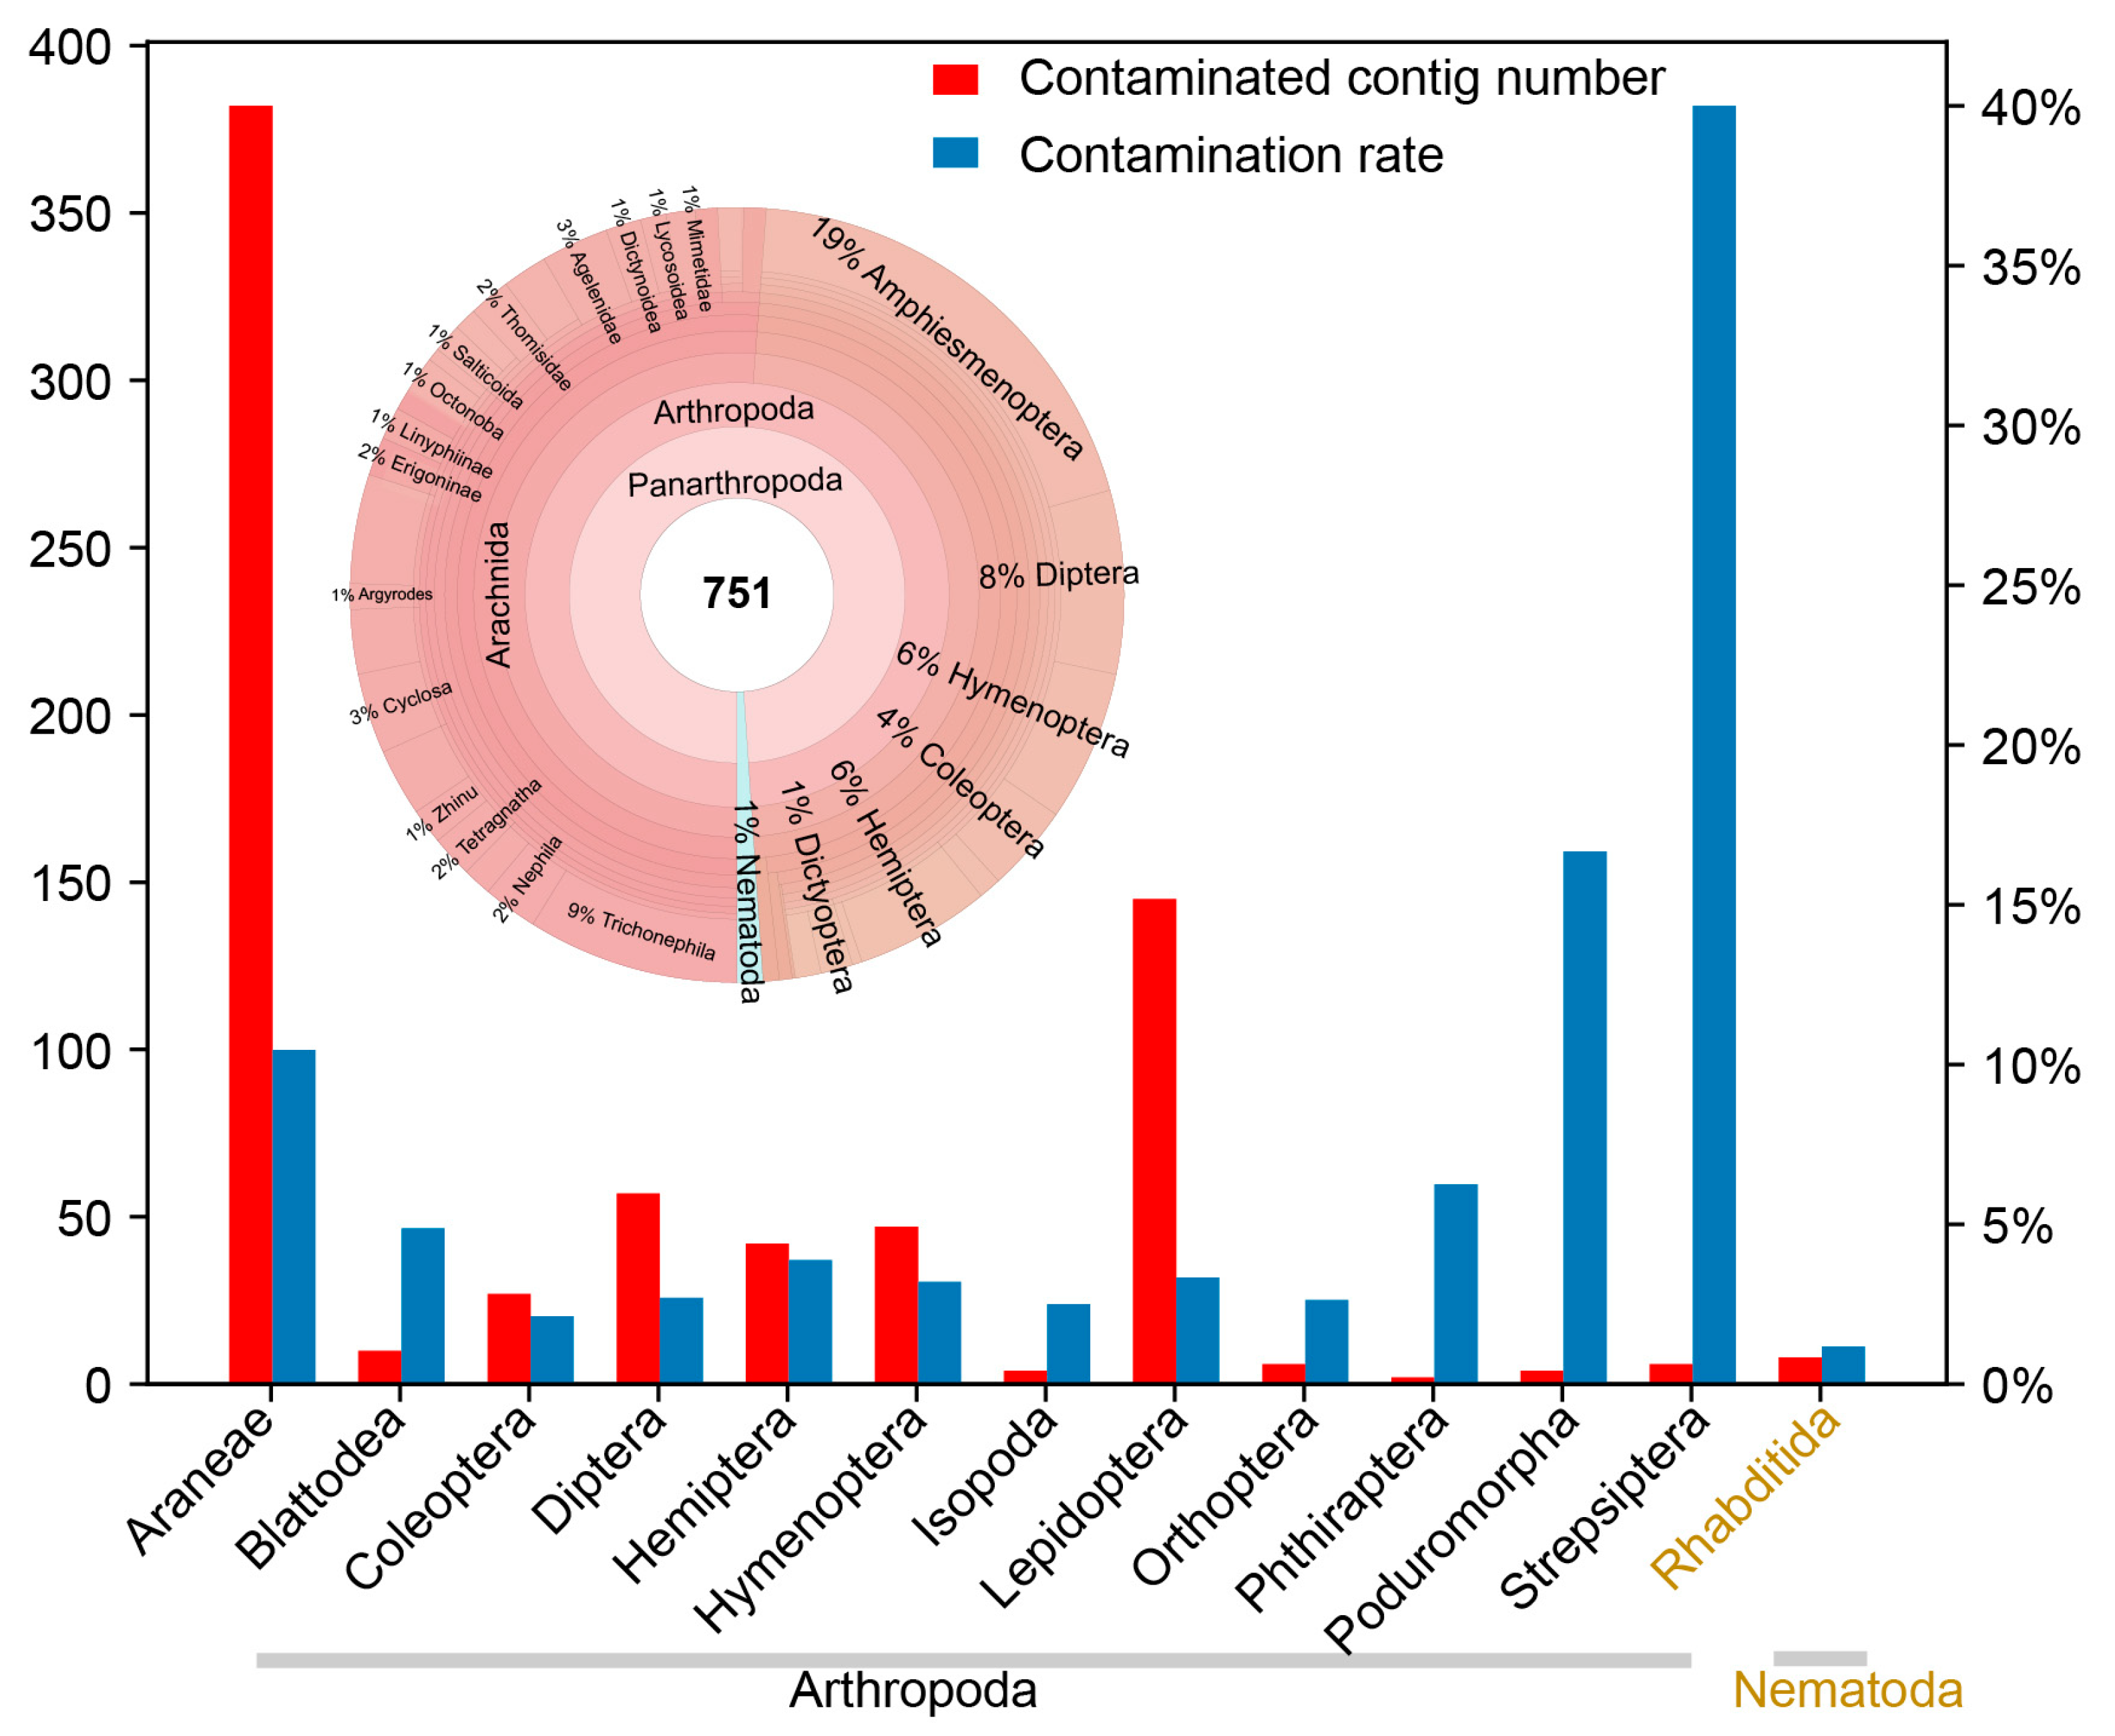
3.2. Application 1—Understanding the Diversity of Nematodes

Nematodes (phylum: Nematoda) are among the most diverse animal groups on the planet, with a large number of species living as parasites in animals and plants. However, their biodiversity is not well understood, due to their small size and the difficulties in identifying species using traditional morphological methods [17]. In this study, we identified 814 contigs of Nematoda contamination in TSA/WGS (Figure 3). Most of these contigs originated from Vertebrata (35%), Magnoliopsida (flowering plants) (30%), and Arthropoda (23%) assemblies. We further extracted the contaminated contigs of 18S rRNA with a length of more than 300 bp to construct a phylogenetic tree. The tree suggested that nematode contigs from plant assemblies were mostly located in the suborder Tylenchina. In contrast, the Spirurina suborder was predominantly associated with birds, bony fishes, and mammals. Nematodes in arachnids were mostly located in the suborder Enoplea. These results are in line with reports that the suborder Tylenchina encompasses species ranging from soil-dwelling bacteriovores to highly specialized plant parasites [18], while spirurine nematodes, a suborder of obligatory parasites, include helminths of both cold- and warm-blooded terrestrial and aquatic vertebrates [19]. Additionally, many spiders are known to be parasitized by mermithid nematodes (Enoplea: Mermithida) [20]. Interestingly, we found a contig (GHOP01002228.1) from a nematode assembly of the class Chromadorea, which was classified by DBCscreen as contamination with a nematode of the class Enoplea. Upon closer examination, we found that this contig had 100% similarity in identity with an Enoplea nematode (Romanomermis culicivorax DQ418791.1). Thus, DBCscreen can accurately and sensitively detect contamination between classes within the same phylum.

3.3. Application 2—Exploring the Distribution of Wolbachia

Wolbachia is a symbiotic bacterium that is ubiquitous in arthropods and nematodes. To explore the distribution of Wolbachia, we examined the contaminants classified as Wolbachia. A total of 751 contigs were identified as Wolbachia contaminants (Figure 4). Among them, 743 (99%) contigs were from Arthropoda, and 8 (1%) contigs were from Nematoda, all belonging to the Onchocercidae family. The contamination rate was the lowest in Nematoda, with 4 (1%) assemblies contaminated out of 341 assemblies. While Strepsiptera (2/5) and Poduromorpha (2/12) showed high contamination rates, due to the small total assembly numbers, these rates are not reliable. Araneae and Lepidoptera were found to have the most Wolbachia-contaminated contigs, with contamination rates of 181/1731 (10.5%) and 73/2191 (3.3%), respectively. These contamination rates are consistent with previous reports that Wolbachia infection rates vary greatly across families and genera, with 0–88% of members being infected [21].

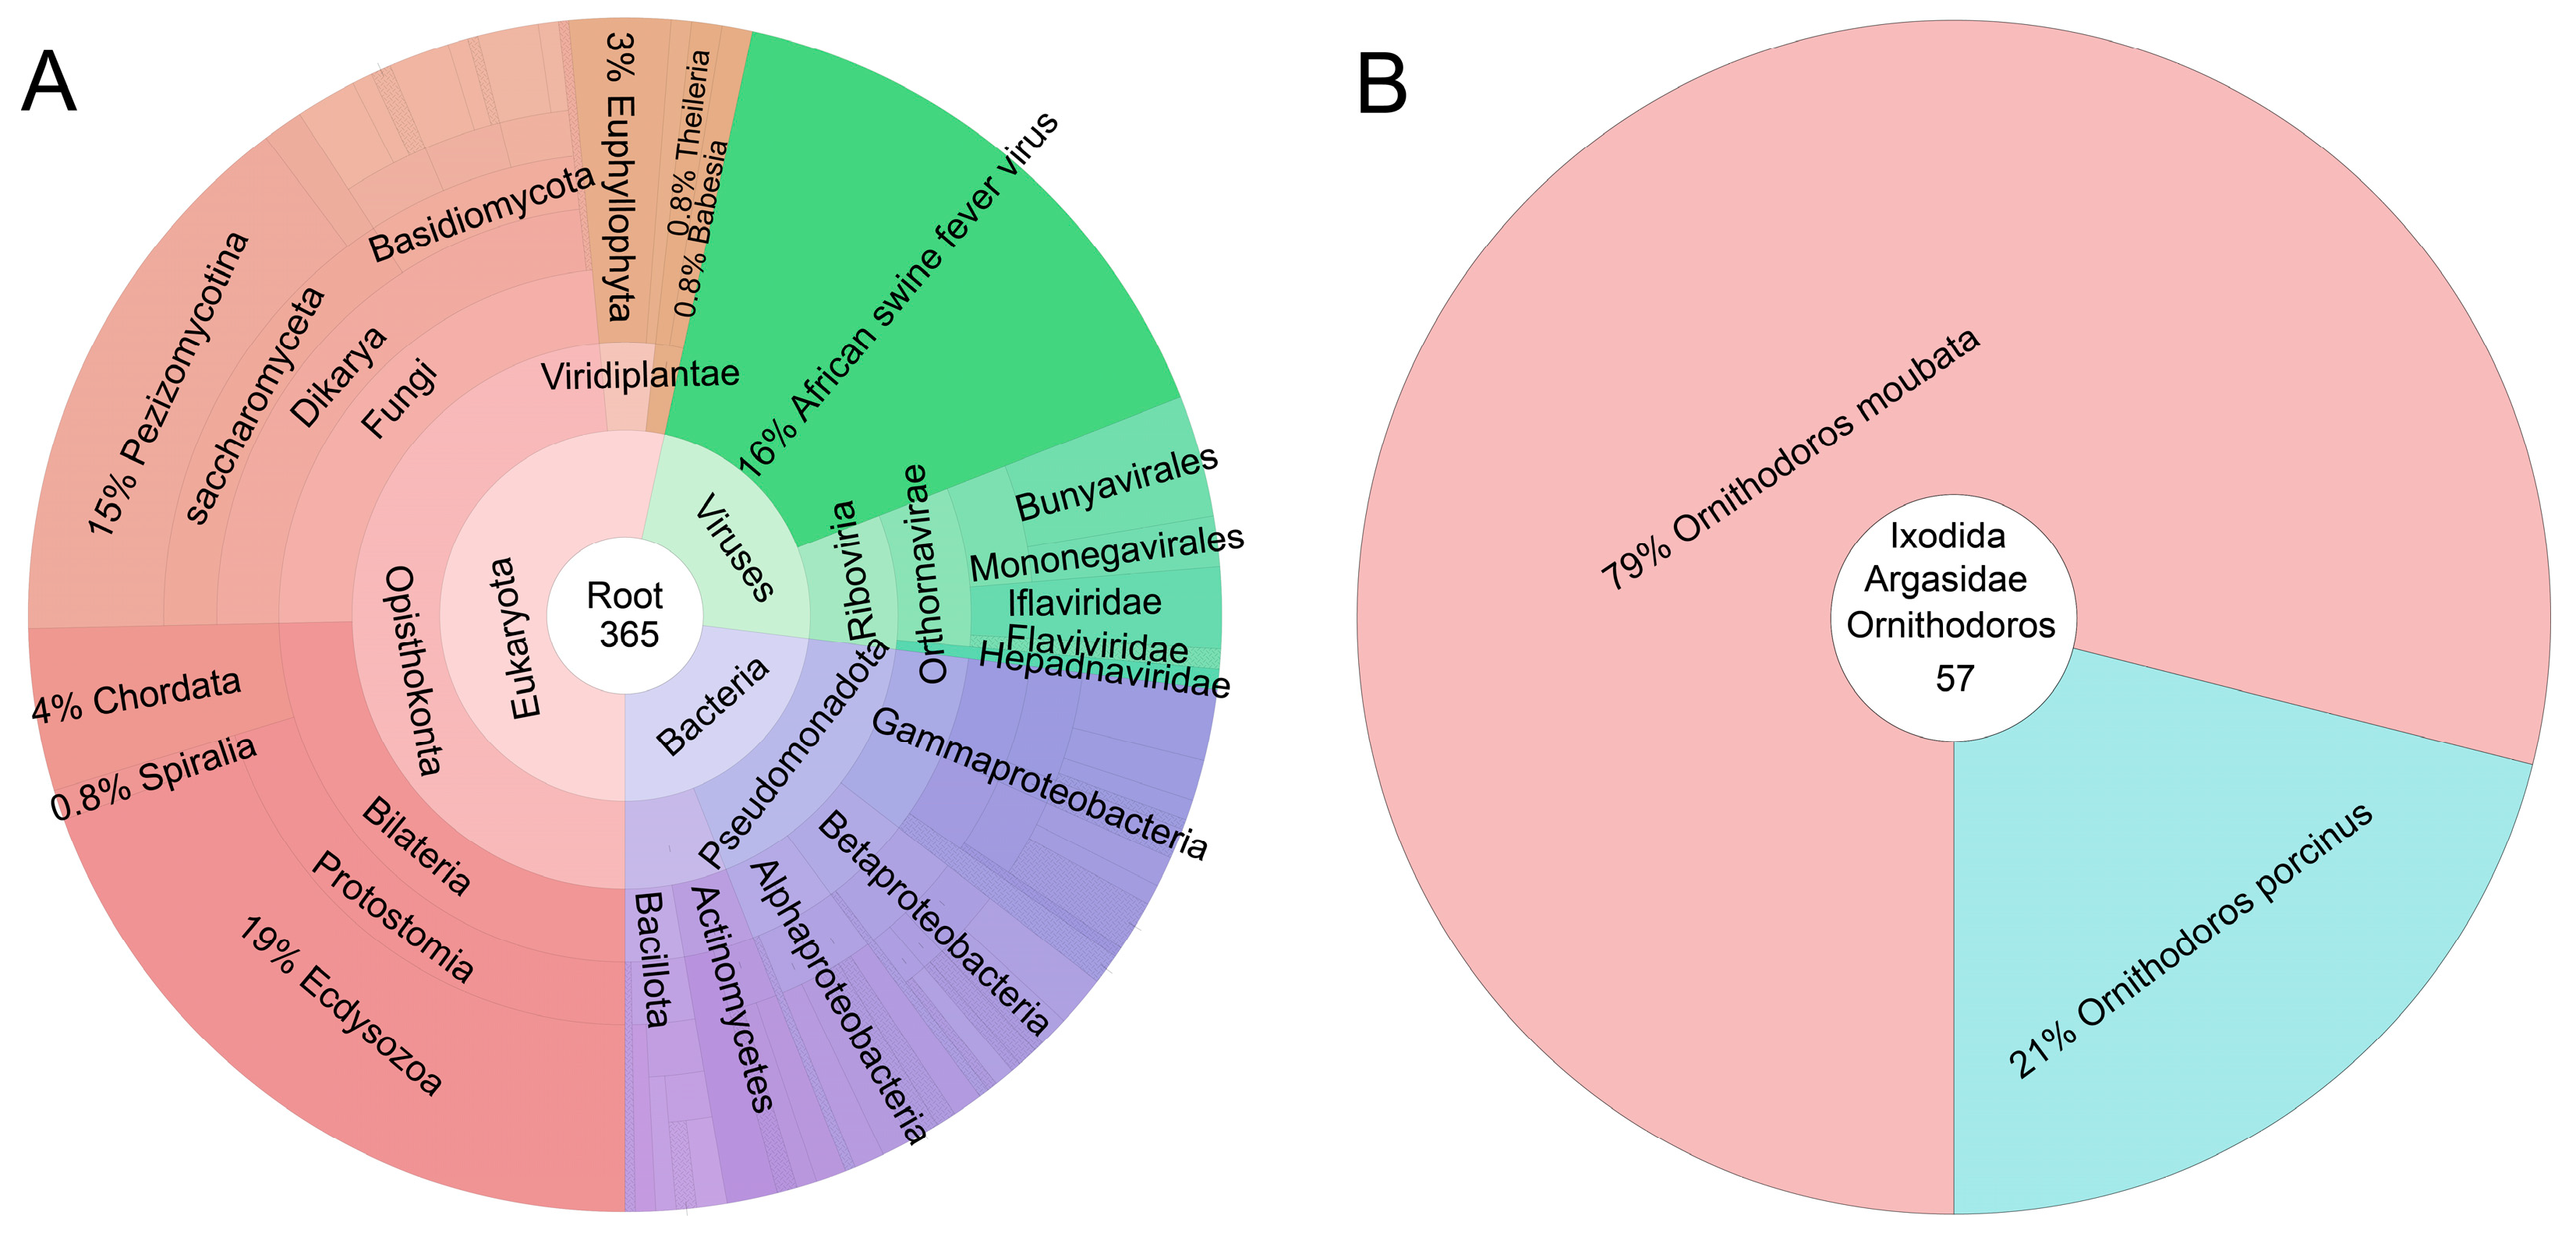
3.4. Application 3—Investigation of the Origins of Arboviruses

Ticks (order: Ixodida) host a wide variety of viruses, some of which are deadly to humans, such as the Crimean–Congo hemorrhagic fever virus (order: Bunyavirales) [22]. We examined the contamination in Ixodida assemblies (Figure 5). The results indicated that 365 contigs were contaminated by other organisms in Ixodida assemblies. Specifically, the virus-contaminated contigs were predominantly from African swine fever virus (16%), followed by Bunyavirales (3%), Iflaviridae (2%), and Mononegavirales (1%). Interestingly, we also found contigs related to protozoa (1.6%), including Babesia (assembly index GKEB) and Theileria (assembly indices GGIX, LYUQ, and GADI). This finding is consistent with the fact that ticks are not only vectors for viruses, but also for the transmission of protozoa such as Babesia and Theileria [23]. Given the high number of African swine fever virus-contaminated contigs, we further investigated sources for contamination by this virus in all 110,880 contaminated contigs. Notably, all contigs contaminated with African swine fever virus (57/57) were exclusively found in assemblies from the genus Ornithodoros (order: Ixodida). Thus, our contamination analysis suggests that African swine fever virus has the highest likelihood of co-existing with Ornithodoros ticks. This aligns with reports indicating that Ornithodoros ticks are the natural hosts of African swine fever viruses [24].

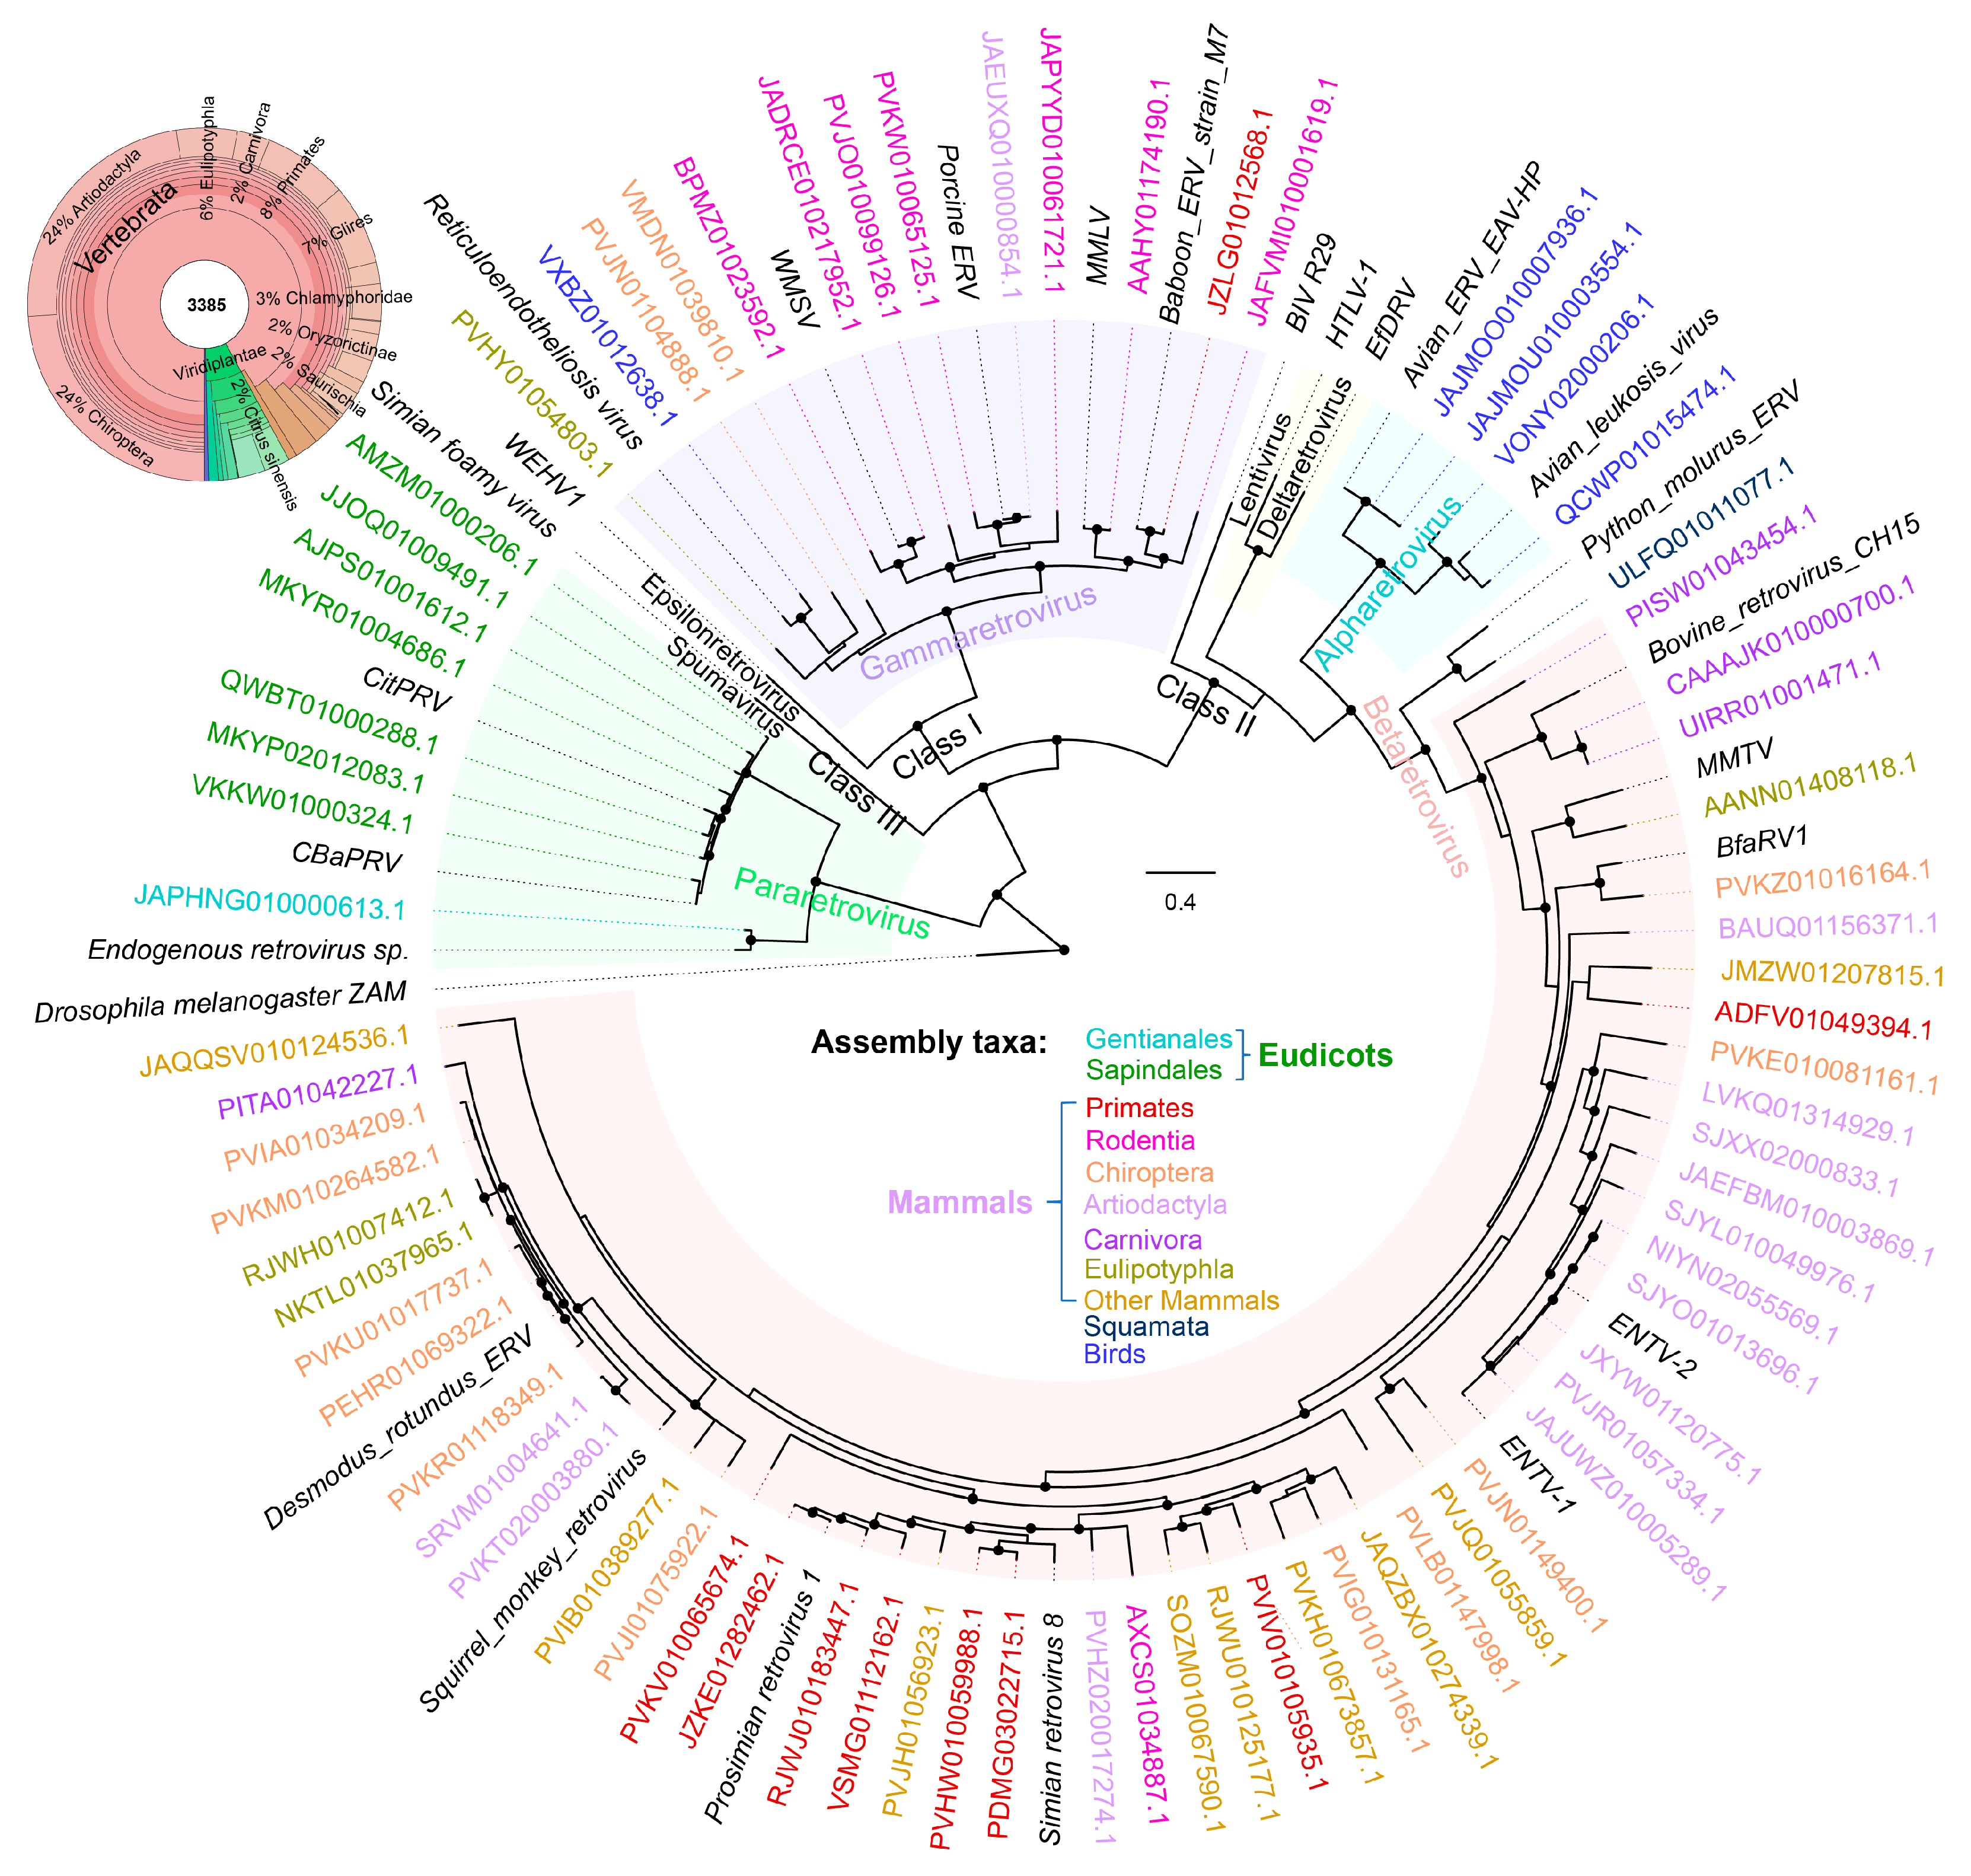
3.5. Application 4—Searching for Endogenous Retroviruses

As the final application example, we will delve into the diversity of widespread retroviruses. These viruses are specifically associated with vertebrates, characterized uniquely by their ability to integrate their reverse-transcribed DNA into the host’s chromosomes. When this integration occurs in a germline cell, the retroviral DNA becomes heritable, and is passed on to the next generation as endogenous retroviruses (ERVs) [25]. We examined the retrovirus contamination identified by DBCscreen, and found that a large number of retrovirus-contaminated contigs were from Microchiroptera (796/3385, order: Chiroptera) and Pecora (694/3385, order: Artiodactyla) (Figure 6). This finding is consistent with previous reports that bats (Chiroptera) harbor diverse endogenous retroviruses [26], and that the oldest and largest ERV-derived gagpol gene has been identified in Artiodactyla [27]. Surprisingly, we found that 255/3385 (7.5%) of Retroviridae-contaminated contigs were from Viridiplantae (green plants). This led us to question whether plants can be infected by retroviruses. Upon further inspection of these contigs, we found that among them, 162/255 were from Citrus, and were closely related to a citrus blight-associated pararetrovirus (CBaPRV, UUT43423) [28]. Given that endogenous pararetroviruses are ubiquitous in Citrus genomes, it is not uncommon to find 7.5% of retroviridae contaminants originating from plant assemblies.
To analysis endogenous retrovirus evolution, we collected contaminated contigs that met the following criteria: (1) those with a translated pol protein longer than 200 amino acids, (2) those with an identity with less than 80% similarity to existing retrovirus references, and (3) those from WGS assemblies, and with these, we constructed a phylogenetic tree. The results showed that, apart from plant pararetroviruses, the contaminated contigs were mostly from mammal genomes assigned to betaretroviruses. The alpharetroviruses found here were all from bird genomes.

4. Discussion

The world’s organisms exhibit incredible diversity and have evolved to inhabit every corner of our planet, from continents to oceans, and from hot springs to the cold Antarctic. Traditional methods for studying the diversity and distribution of organisms have been limited to specific taxa or regions. However, with the explosion of data, the availability of vast genomic datasets and advanced data mining tools has enabled the broad-scale identification of parasites and endosymbionts within hosts. This development has opened up new avenues for exploring the distribution and diversity of living organisms.
Although the value of contaminants in genomic data has been gradually recognized, few researchers have utilized them, due to the difficulty in distinguishing contaminants that have biological relevance from those that are accidentally included, without any relation. Therefore, this kind of study must be based on large-scale data analysis to draw conclusions, avoiding mistaken results that may arise from small sample sizes. Dedicated tools are needed to extract such subtle and complex information from vast datasets.
While large datasets are necessary to draw reliable conclusions about the distribution of living organisms, the large volume of data presents challenges for contamination analysis. The solution to this dilemma often involves reducing the input or the database size. Consequently, most tools are limited to handling specific organisms. Even the fast FCS-GX tool faces this challenge, as it is designed to screen for all contaminants, necessitating the inclusion of all typical reference genomes. With a database and RAM requirement of 470 GiB, FCS-GX has carefully balanced the trade-off between database size and sensitivity, ensuring the size is accessible for institutional compute clusters. Currently, the FCS-GX database contains sequences from 28,213 RefSeq and 19,541 GenBank assemblies. In contrast, the BOLD database, the largest DNA barcode database, encompasses DNA barcodes from ~413,000 animals, ~132,000 plants, and ~40,000 fungi, as well as other species. Thus, by leveraging BOLD DNA barcodes, DBCscreen is able to cover a broader range of species while significantly reducing its RAM demand to just 8 GiB. Therefore, using DBCscreen can yield more sensitive results in screening for DNA barcode contamination, making it a valuable tool for such analyses.
We want to emphasize that, despite the fact that the number of DBCscreen database categories has expanded to 188 to distinguish between class contamination in animals and plants, classifying contaminants between closely related species remains a challenging task, due to the high amount of sequence identity shared among them. In this study, we categorized the barcodes of animals and plants on a deeper class level, as we were particularly concerned about between-classes contaminations, such as nematodes in animals and mites in insects.
By applying DBCscreen, we scanned 39,302 eukaryotic assemblies in the NCBI TSA/WGS database and identified several noteworthy findings for discussion. First, among the different taxa, Malacostraca and Copepoda (subphylum: Crustacea), anthozoans (phylum: Cnidaria), gastropods, and bivalves (phylum: Mollusca) exhibited contamination rates exceeding 45% (Figure 2A). This is consistent with our previous reports, suggesting that the phyla/subphyla Mollusca, Crustacea, and Cnidaria are more prone to contamination [7]. The underlying reason may be that water samples are more prone to contamination due to their aquatic nature. The detailed mechanisms behind this phenomenon warrant further investigation in future studies. Secondly, DNA barcodes are the most useful sequences for classifying organisms, and are the most commonly used markers in evolutionary analysis. Therefore, utilizing DNA barcode contaminants to analyze ecological interactions represents a viable and accurate approach. For example, in our results, sponge (phylum: Porifera, class: Demospongiae) contaminants were predominantly found in anthozoans (164/293, 56.0%) (Figure 2B). This finding is consistent with the well-documented symbiotic associations between sponges and zoanthids (phylum: Cnidaria, class: Anthozoa), which are among the most common and widespread ecological interactions in marine environments [29]. Third, we identified 814 Nematoda-contaminated contigs and 3385 endogenous retrovirus (ERV) contigs. The resulting phylogenetic tree constructed using these contigs is robust, with most nodes exhibiting bootstrap support values (BSP) of ≥70%. Additionally, the tree encompasses the majority of clades, representing the high diversity and complexity of these organisms [30]. Therefore, the contigs identified by DBCscreen are readily handled and valuable resources for elucidating the evolutionary history of diverse symbionts.
In summary, this report provides a pipeline, DBCscreen, to quickly scan for DNA barcode contaminants in genomic data. We applied it to screen the TSA/WGS database, and identified a vast number of DNA barcode contaminants. Based on these contaminants, we drew several interesting conclusions, such as the distribution of nematodes and Wolbachia, and the diversity of retroviruses. These findings offer a new tool and perspective for studying the diversity and distribution of organisms by deeply mining extensive genomic databases.

Supplementary Materials

The following supporting information can be downloaded at https://www.mdpi.com/article/10.3390/d17030186/s1: Spreadsheet S1: Numbers of sequences in each division used to construct DBCscreen database; Spreadsheet S2: TSA and WGS assemblies screened in this study; Spreadsheet S3: Taxonomy and scores of 110,880 contaminated contigs identified in this study; Spreadsheet S4: Table of contaminated assembly numbers and contamination rates across different taxa; Spreadsheet S5: Distribution of contaminants across different host source divisions; Spreadsheet S6: Statistical analysis of Wolbachia contamination across various insect and nematode orders.

Author Contributions

Conceptualization, J.X.; formal analysis, J.X., Y.Z., L.W. and Y.D.; investigation, Y.Z., L.W. and Y.D.; writing—original draft preparation, J.X. All authors have read and agreed to the published version of the manuscript.

Funding

This work was supported by National Natural Science Foundation of China (Grant No. 31900152) and Chongqing Science and Technology Bureau (Grant No. CSTB2024NSCQ-MSX1213).

Institutional Review Board Statement

Not applicable.

Data Availability Statement

The eukaryotic WGS/TSA assemblies in this study can be found in GenBank (https://www.ncbi.nlm.nih.gov/Traces/wgs, accessed on 30 June 2023). The bold DNA barcode library can be found in Bold (https://boldsystems.org/, accessed on 15 November 2024). The pipeline DBCscreen, the corresponding database, and the bioinformatic code is available at (https://github.com/xiebio/DBCscreen, accessed on 27 January 2025).

Acknowledgments

We express our gratitude to all colleagues in the scientific community for making their sequencing data publicly available. We also acknowledge the National Center for Biotechnology Information (NCBI) for providing a comprehensive platform for the exchange of sequencing data.

Conflicts of Interest

The authors declare no conflicts of interest. The funders had no role in the design of the study; in the collection, analyses, or interpretation of data; in the writing of the manuscript; or in the decision to publish the results.

Abbreviations

The following abbreviations are used in this manuscript:
HTLV-1Human T-cell leukemia virus type I
ZAMDrosophila melanogaster ZAM
ENTV-1Ovine enzootic nasal tumor virus
ENTV-2Enzootic nasal tumor virus 2
WEHV1 Walleye epidermal hyperplasia virus 1
CBaPRVCitrus blight-associated pararetrovirus
CitPRVCitrus endogenous pararetrovirus
BIV R29Bovine immunodeficiency virus R29
EfDRVEptesicus fuscus deltaretrovirus
MMLVMoloney murine leukemia virus
BfaRV1Bat faecal associated retrovirus 1
MMTVMouse mammary tumor virus
WMSVWoolly monkey sarcoma virus

References

  1. Steinegger, M.; Salzberg, S.L. Terminating contamination: Large-scale search identifies more than 2,000,000 contaminated entries in GenBank. Genome Biol. 2020, 21, 115. [Google Scholar] [CrossRef] [PubMed]
  2. Zhou, J.; Zhang, X.; Wang, Y.; Liang, H.; Yang, Y.; Huang, X.; Deng, J. Contamination Survey of Insect Genomic and Transcriptomic Data. Animals 2024, 14, 3432. [Google Scholar] [CrossRef] [PubMed]
  3. Borner, J.; Burmester, T. Parasite infection of public databases: A data mining approach to identify apicomplexan contaminations in animal genome and transcriptome assemblies. BMC Genom. 2017, 18, 100. [Google Scholar] [CrossRef] [PubMed]
  4. Medina, P.; Russell, S.L.; Corbett-Detig, R. Deep data mining reveals variable abundance and distribution of microbial reproductive manipulators within and among diverse host species. PLoS ONE 2023, 18, e0288261. [Google Scholar] [CrossRef]
  5. Scholz, M.; Albanese, D.; Tuohy, K.; Donati, C.; Segata, N.; Rota-Stabelli, O. Large scale genome reconstructions illuminate Wolbachia evolution. Nat. Commun. 2020, 11, 5235. [Google Scholar] [CrossRef]
  6. Sangiovanni, M.; Granata, I.; Thind, A.S.; Guarracino, M.R. From trash to treasure: Detecting unexpected contamination in unmapped NGS data. BMC Bioinform. 2019, 20, 168. [Google Scholar] [CrossRef]
  7. Xie, J.; Tan, B.; Zhang, Y. A Large-Scale Study into Protist-Animal Interactions Based on Public Genomic Data Using DNA Barcodes. Animals 2023, 13, 2243. [Google Scholar] [CrossRef]
  8. Astashyn, A.; Tvedte, E.S.; Sweeney, D.; Sapojnikov, V.; Bouk, N.; Joukov, V.; Mozes, E.; Strope, P.K.; Sylla, P.M.; Wagner, L.; et al. Rapid and sensitive detection of genome contamination at scale with FCS-GX. Genome Biol. 2024, 25, 60. [Google Scholar] [CrossRef]
  9. Ratnasingham, S.; Hebert, P.D.N. BOLD: The Barcode of Life Data System (www.barcodinglife.org). Mol. Ecol. Notes 2007, 7, 355–364. [Google Scholar] [CrossRef]
  10. Benson, D.A.; Karsch-Mizrachi, I.; Lipman, D.J.; Ostell, J.; Sayers, E.W. GenBank. Nucleic Acids Res. 2009, 37, D26–D31. [Google Scholar] [CrossRef]
  11. Ondov, B.D.; Bergman, N.H.; Phillippy, A.M. Interactive metagenomic visualization in a Web browser. BMC Bioinform. 2011, 12, 385. [Google Scholar] [CrossRef] [PubMed]
  12. Quast, C.; Pruesse, E.; Yilmaz, P.; Gerken, J.; Schweer, T.; Yarza, P.; Peplies, J.; Glöckner, F.O. The SILVA ribosomal RNA gene database project: Improved data processing and web-based tools. Nucleic Acids Res. 2012, 41, D590–D596. [Google Scholar] [CrossRef] [PubMed]
  13. Katoh, K.; Standley, D.M. MAFFT Multiple Sequence Alignment Software Version 7: Improvements in Performance and Usability. Mol. Biol. Evol. 2013, 30, 772–780. [Google Scholar] [CrossRef] [PubMed]
  14. Minh, B.Q.; Schmidt, H.A.; Chernomor, O.; Schrempf, D.; Woodhams, M.D.; von Haeseler, A.; Lanfear, R. IQ-TREE 2: New Models and Efficient Methods for Phylogenetic Inference in the Genomic Era. Mol. Biol. Evol. 2020, 37, 1530–1534. [Google Scholar] [CrossRef]
  15. Espagne, E.; Lespinet, O.; Malagnac, F.; Da Silva, C.; Jaillon, O.; Porcel, B.M.; Couloux, A.; Aury, J.M.; Ségurens, B.; Poulain, J.; et al. The genome sequence of the model ascomycete fungus Podospora anserina. Genome Biol. 2008, 9, R77. [Google Scholar] [CrossRef]
  16. Xie, J.; Zhang, Y. Diversity and Distribution of Mites (ACARI) Revealed by Contamination Survey in Public Genomic Databases. Animals 2023, 13, 3172. [Google Scholar] [CrossRef]
  17. Bennett, J.; Poulin, R.; Presswell, B. Large-scale genetic investigation of nematode diversity and their phylogenetic patterns in New Zealand’s marine animals. Parasitology 2022, 149, 1794–1809. [Google Scholar] [CrossRef]
  18. Bert, W.; Leliaert, F.; Vierstraete, A.R.; Vanfleteren, J.R.; Borgonie, G. Molecular phylogeny of the Tylenchina and evolution of the female gonoduct (Nematoda: Rhabditida). Mol. Phylogenet. Evol. 2008, 48, 728–744. [Google Scholar] [CrossRef]
  19. Wijová, M.; Moravec, F.; Horák, A.; Lukeš, J. Evolutionary relationships of Spirurina (Nematoda: Chromadorea: Rhabditida) with special emphasis on dracunculoid nematodes inferred from SSU rRNA gene sequences. Int. J. Parasitol. 2006, 36, 1067–1075. [Google Scholar] [CrossRef]
  20. Fang, H.; Poinar, G.O.; Wang, H.; Wang, B.; Luo, C. First spider-parasitized mermithid nematode from mid-Cretaceous Kachin amber of northern Myanmar. Cretac. Res. 2024, 158, 105866. [Google Scholar] [CrossRef]
  21. Kajtoch, Ł.; Kotásková, N. Current state of knowledge on Wolbachia infection among Coleoptera: A systematic review. PeerJ 2018, 6, e4471. [Google Scholar] [CrossRef] [PubMed]
  22. Labuda, M.; Nuttall, P.A. Tick-borne viruses. Parasitology 2004, 129 (Suppl. 1), S221–S245. [Google Scholar] [CrossRef]
  23. Brites-Neto, J.; Duarte, K.M.; Martins, T.F. Tick-borne infections in human and animal population worldwide. Vet. World 2015, 8, 301–315. [Google Scholar] [CrossRef] [PubMed]
  24. Jori, F.; Bastos, A.; Boinas, F.; Van Heerden, J.; Heath, L.; Jourdan-Pineau, H.; Martinez-Lopez, B.; Pereira de Oliveira, R.; Pollet, T.; Quembo, C.; et al. An Updated Review of Ornithodoros Ticks as Reservoirs of African Swine Fever in Sub-Saharan Africa and Madagascar. Pathogens 2023, 12, 469. [Google Scholar] [CrossRef] [PubMed]
  25. Zheng, J.; Wei, Y.; Han, G.-Z. The diversity and evolution of retroviruses: Perspectives from viral “fossils”. Virol. Sin. 2022, 37, 11–18. [Google Scholar] [CrossRef]
  26. Farkašová, H.; Hron, T.; Pačes, J.; Hulva, P.; Benda, P.; Gifford, R.J.; Elleder, D. Discovery of an endogenous Deltaretrovirus in the genome of long-fingered bats (Chiroptera: Miniopteridae). Proc. Natl. Acad. Sci. USA 2017, 114, 3145–3150. [Google Scholar] [CrossRef]
  27. Simpson, J.Z.; Kozak Christine, A.; Boso, G. Evolutionary conservation of an ancient retroviral gagpol gene in Artiodactyla. J. Virol. 2023, 97, e00535-23. [Google Scholar] [CrossRef]
  28. Keremane, M.; Singh, K.; Ramadugu, C.; Krueger, R.R.; Skaggs, T.H. Next Generation Sequencing, and Development of a Pipeline as a Tool for the Detection and Discovery of Citrus Pathogens to Facilitate Safer Germplasm Exchange. Plants 2024, 13, 411. [Google Scholar] [CrossRef]
  29. Swain, T.D.; Wulff, J.L. Diversity and specificity of Caribbean sponge–zoanthid symbioses: A foundation for understanding the adaptive significance of symbioses and generating hypotheses about higher-order systematics. Biol. J. Linn. Soc. 2007, 92, 695–711. [Google Scholar] [CrossRef]
  30. Smythe, A.B.; Holovachov, O.; Kocot, K.M. Improved phylogenomic sampling of free-living nematodes enhances resolution of higher-level nematode phylogeny. BMC Evol. Biol. 2019, 19, 121. [Google Scholar] [CrossRef]
Figure 1. Overview of pipeline DBCscreen used to scan DNA barcode contamination.
Diversity 17 00186 g001
Figure 2. DBCscreen detection of DNA barcode contamination in the NCBI TSA/WGS database. (A) The numbers of contaminated assemblies and the contamination rates across different taxa. The contamination rates were calculated by dividing the count of contaminated assemblies by the total number of screened assemblies in each bin. (B) The distribution of contaminated contigs identified in assemblies from different taxa. The heatmap was generated by taking the natural logarithm (ln) of contig number in each bin. Only the top 20 assembly taxa and contaminated taxa identified in this study are displayed. For a more comprehensive list of taxa, please refer to Spreadsheet S5.
Diversity 17 00186 g002
Figure 3. Maximum likelihood phylogenetic tree of nematodes inferred from 18S rRNA sequence data. Colored sequences represent contaminated contigs detected by DBCscreen in this study, with different colors indicating taxa of assemblies. Scale represents substitutions per base. Outgroups include Milnesium tardigradum and Drosophila melanogaster. Nodes with bootstrap values (BSP) ≥ 70% are marked with black dots. The pentagram indicates an Enoplea nematode contaminated contig within the Chromadorea nematode assembly.
Diversity 17 00186 g003
Figure 4. Variation in contaminated contig numbers and contamination rates by Wolbachia across different taxa.
Diversity 17 00186 g004
Figure 5. Krona plots displaying the taxa of contaminated contigs in the order Ixodida (A), and the taxa of assemblies contaminated with African swine fever virus (B).
Diversity 17 00186 g005
Figure 6. Maximum likelihood phylogenetic tree of endogenous retroviruses inferred from Pol sequence data. Colored sequences represent contaminated contigs detected by DBCscreen in this study, with different colors indicating taxa of assemblies. Scale bar indicates amino acid changes per base. Tree was rooted with Drosophila melanogaster ZAM (accession number CAA04050) retroelement. Nodes with BSP ≥ 70% are marked with black dots.
Diversity 17 00186 g006
Disclaimer/Publisher’s Note: The statements, opinions and data contained in all publications are solely those of the individual author(s) and contributor(s) and not of MDPI and/or the editor(s). MDPI and/or the editor(s) disclaim responsibility for any injury to people or property resulting from any ideas, methods, instructions or products referred to in the content.

