Article

Assessing Land Use Ecological-Social-Production Functions and Interrelationships from the Perspective of Multifunctional Landscape in a Transitional Zone between Qinghai-Tibet Plateau and Loess Plateau

1
College of Resources and Environmental Sciences, Henan Agricultural University, Zhengzhou 450046, China
2
Lhasa Plateau Ecosystem Research Station, Key Laboratory of Ecosystem Network Observation and Modeling, Institute of Geographic Sciences and Natural Resources Research, Chinese Academy of Sciences, Beijing 100101, China
*
Author to whom correspondence should be addressed.
Diversity 2024, 16(10), 618; https://doi.org/10.3390/d16100618
Submission received: 9 August 2024 / Revised: 23 September 2024 / Accepted: 28 September 2024 / Published: 3 October 2024
(This article belongs to the Special Issue Landscape Science and Natural Resource Management)

Abstract

:
Investigating the evolution and drivers of multifunctional land use is essential for sustainable land management and regional biological conservation. This research focuses on the Hehuang Valley, where we developed an “ecological-social-production” evaluation system for assessing land use multifunctionality from the perspective of multifunctional landscape. Leveraging Geographic Information System technologies, we conducted a quantitative analysis of spatiotemporal variations in multifunctional land use across the valley in recently twenty years. Correlation coefficients were employed to identify trade-offs and synergies among various land use functions. Additionally, geographical detector and grey relational analysis models were utilized to pinpoint the factors influencing spatiotemporal changes in land use functions during the specified period. The results showed that: (1) During the period, the overall multifunctionality of land use in the Hehuang Valley exhibited an increasing trend. The economic production function of the land showed the highest growth, while the ecological and social functions showed lower growth. (2) In most areas of the Hehuang Valley, there was a positive correlation between social and economic production functions and a negative correlation between social and ecological functions, as well as between economic production and ecological functions. (3) Natural conditions were the main factors of spatial variation of land use comprehensive functions, but human factors, including land use intensity and the rate of farmland conversion to non-agricultural uses, were the primary drivers of temporal changes in multifunctional land use. The findings provide valuable references and scientific support for policymakers in optimizing land use and multifunctional landscape conservation.

1. Introduction

In 2015, the United Nations Sustainable Development Summit endorsed the document titled “Transforming Our World: The 2030 Agenda for Sustainable Development” [1]. The document outlines 17 Sustainable Development Goals. Three of these goals are particularly pertinent to land use, as they encompass the functions that describe how land use systems contribute to human well-being, which are SDG 11, Sustainable Cities and Communities; SDG 13, Climate Action; and SDG 15, Life on Land [2]. Land Use Function refers to the services and goods provided by the land use system resulting from the interactions between natural, economic, and social factors [3,4]. This includes the most relevant economic, environmental, and social issues [5]. The concept of multifunctionality was initially proposed by the Organization for Economic Co-operation and Development (OECD) in 2001 to describe the joint nature of agricultural production, including agricultural goods, environmental, and social non-commodity or public goods [6]. Although the field of land science in China has long described land functions, there have been limited comprehensive studies on multifunctional land use from the perspective of multifunctional landscape [7]. In contrast, international scholars have extensively classified land use functions. For example, Pérez–Soba et al. [8] classified land use functions into different aspects, including employment, recreation, residence, and health. Subsequently, scholars have defined land use functions based on their ability to provide social, economic, and environmental functions or goods and services to meet societal needs [9,10]. In this paper, land use function refers to the various functions of using land to meet different human needs and activities and to provide different products and services to humans, including an economic production function, social function, and ecological function.
In recent years, there has been widespread acceptance and application of land classification systems for functional indicators and quantitative evaluation methods by scholars, though Chinese scholars began their research on multifunctional land use later than their international counterparts. Scholars like Zhen et al. [11] and Xie et al. [12] constructed scientifically sound evaluation index systems. These systems comprehensively consider economic, social, and environmental roles, and emphasize the importance of selecting typical and scientifically feasible indicators. Currently, many Chinese scholars adopt research perspectives based on “production–life–ecology” and “economic–social–ecological” function classification systems [13]. For example, Xiang et al. [14] have selected three primary indicators—living functions, production functions, and ecological functions. These indicators comprise 21 tertiary indicators for evaluating multifunctional land use. The researchers have empirically tested the influencing factors using an obstacles model. Similarly, Lin et al. [15] used the concept of “three-living spaces”, selecting 27 indicators to evaluate multifunctional land use in the Guangxi border region. Since 2001, when the European Union developed a multifunctional land use analysis framework from a sustainability perspective, categorizing land use functions into “social, economic, and ecological (environmental)” functions [6], many international scholars conducted related studies [16,17,18,19,20,21]. For instance, Reidsma et al. [16] established a methodological framework based on a multi-criteria analysis and stakeholder impact to assess the impact of land use policies on developing countries. Plieninger et al. [17] categorized rural area functions in Germany into five main functions, including residence and agricultural production. Due to varying evaluation objectives and focal points, no unified or standard evaluation index system for multifunctional land use has been established. Different scholars have different classifications for land use functions. While many scholars have developed various evaluation index systems at provincial, county, municipal, township, and grid scales [22], a relatively unified standard has not been formed due to differing evaluation purposes and focal points.
The evaluation of land use multifunctionality requires a comprehensive assessment from multiple levels, dimensions, and perspectives. Additionally, it necessitates exploration of the interrelationships between its sub-functions. Moreover, scholars have increasingly explored the coupling, co-ordination, trade-offs, and synergies among diverse land use functions [23,24,25,26,27]. This exploration has elucidated spatial conflicts, co-ordination challenges, and dominant patterns in land use functions. Researchers have extensively investigated these interactions through the lens of spatial heterogeneity. For instance, Zhang et al. [27] utilized spatiotemporal analysis techniques and an enhanced co-ordination degree model to analyze the evolutionary characteristics and coupling co-ordination degrees of land use functions. Additionally, Liu et al. [28] and Li et al. [29] assessed land use functions from the perspective of sustainable utilization, measuring trade-off intensities and synergies among multifunctional land uses using the trade-off synergy model and production possibility frontier. In recent years, China’s land use has undergone significant changes, generally associated with improvements in human well-being and economic development [30,31,32]. However, these changes have also contributed to serious environmental issues [33,34]. Assessing the sustainability impacts of these transformations presents a significant challenge to policymakers and the scientific community. As a fundamental aspect of land sustainable utilization research, evaluating land use multifunctionality and balancing various land functions to achieve rational and efficient use of limited land resources is crucial for regional sustainable development and is a major focus of academic interest [35,36]. Land use functions include ecological, social, and economic production functions, and their sustainable utilization directly affects economic development, the ecological environment, and social development. Different land use functions interact in various ways, resulting in trade-offs and synergies. Trade-offs indicate a state of mutual exclusion, whereas synergies represent a positively reinforcing cycle [37,38]. Analyzing these trade-offs and synergies helps policymakers better implement land policies and achieve optimal land resource allocation, especially in resource-scarce regions.
Current research frequently overlooks in-depth examinations of the trade-offs, synergies, spatial distributions, and driving forces influencing land use functions [36,39,40,41]. Consequently, there is a critical need for quantitative assessments of land use functions and exploration of their trade-offs and synergies. Such efforts are crucial for comprehending the intricate interactions among diverse land use systems to promote regional sustainable development [36,42]. This study investigates the trade-offs and synergies between land use functions at a 1km grid scale, providing a reliable basis for accurately identifying land use conflicts and developmental imbalances, which is crucial for identifying land use issues at fine scale.
The Hehuang Valley, situated in eastern Qinghai Province, is considered a significant ecological and climatic “sensitive area” in Asia [43,44,45,46]. Against the backdrop of ongoing urbanization, Qinghai Province is planning to establish the Xining-Haidong metropolitan area, centered on Xining and Haidong, with the aim of driving economic development. Given the unique geographical and environmental characteristics of the Hehuang Valley, its future development potential will undeniably impact its ecosystem and ecological environment. Qinghai Province places ecological protection as its top priority while promoting high-quality development. Achieving this goal necessitates the co-ordination of land use multifunctionality and optimization of the layout of production, living, and ecological spaces.
As a result, this study focuses on the multifunctionality of land use in the Hehuang Valley. It aims to explore the spatiotemporal characteristics and driving factors of land use functions, with the following three objectives: (i) to establish a grid scale evaluation index system for land use multifunctionality and identify their spatiotemporal evolution; (ii) to identify the trade-offs and synergies between land use multifunctionality; (iii) to identify the influencing factors of land use functions.

2. Materials and Methods

2.1. Study Area

The Hehuang Valley is situated in the fertile triangular region between the Yellow River and the Huangshui River basins (Figure 1). It is surrounded by the Dabanshan Mountains to the northwest, the Qinghai-Tibet Plateau to the south, and the Loess Plateau to the northeast, resulting in a region with higher altitude in the west and lower altitude in the east. Acting as a transitional zone between the Qinghai-Tibet Plateau and the Loess Plateau, it covers a total area of approximately 35,273.77 km2. The Hehuang Valley experiences concentrated precipitation, characterized by simultaneous rain and heat, thus showing its advantageous agricultural location and resources. It is the oldest and most intensively developed area in Qinghai Province [47], serving as the largest agricultural area on the Qinghai-Tibet Plateau. Despite accounting for only 5% of the province’s area, it contains 72% of the province’s population and 60% of its arable land, thus earning the title of “feeding three-quarters of Qinghai’s population with one-thirtieth of its land area [48]”. The Hehuang Valley can be divided into 14 administrative units, and the Xining urban area was merged from the Chengdong, Chengzhong, Chengxi, and Chengbei districts because of a smaller land area and similar land use characteristics. As of 2020, the total population of the Hehuang Valley was 4.1666 million, with a per capita GDP of 64,537 RMB. In 2020, the total grain and meat production in the Hehuang Valley were 1.038 million tons and 271,000 tons, respectively, representing increases of 47.3% and 58.5% compared to the year 2000.

2.2. Data Sources

The data utilized in this study primarily consist of three categories: natural geographic data, socio-economic statistical data, and land use-related data. For detailed information regarding the specific data usage and sources, please refer to Table 1.

2.3. Research Design

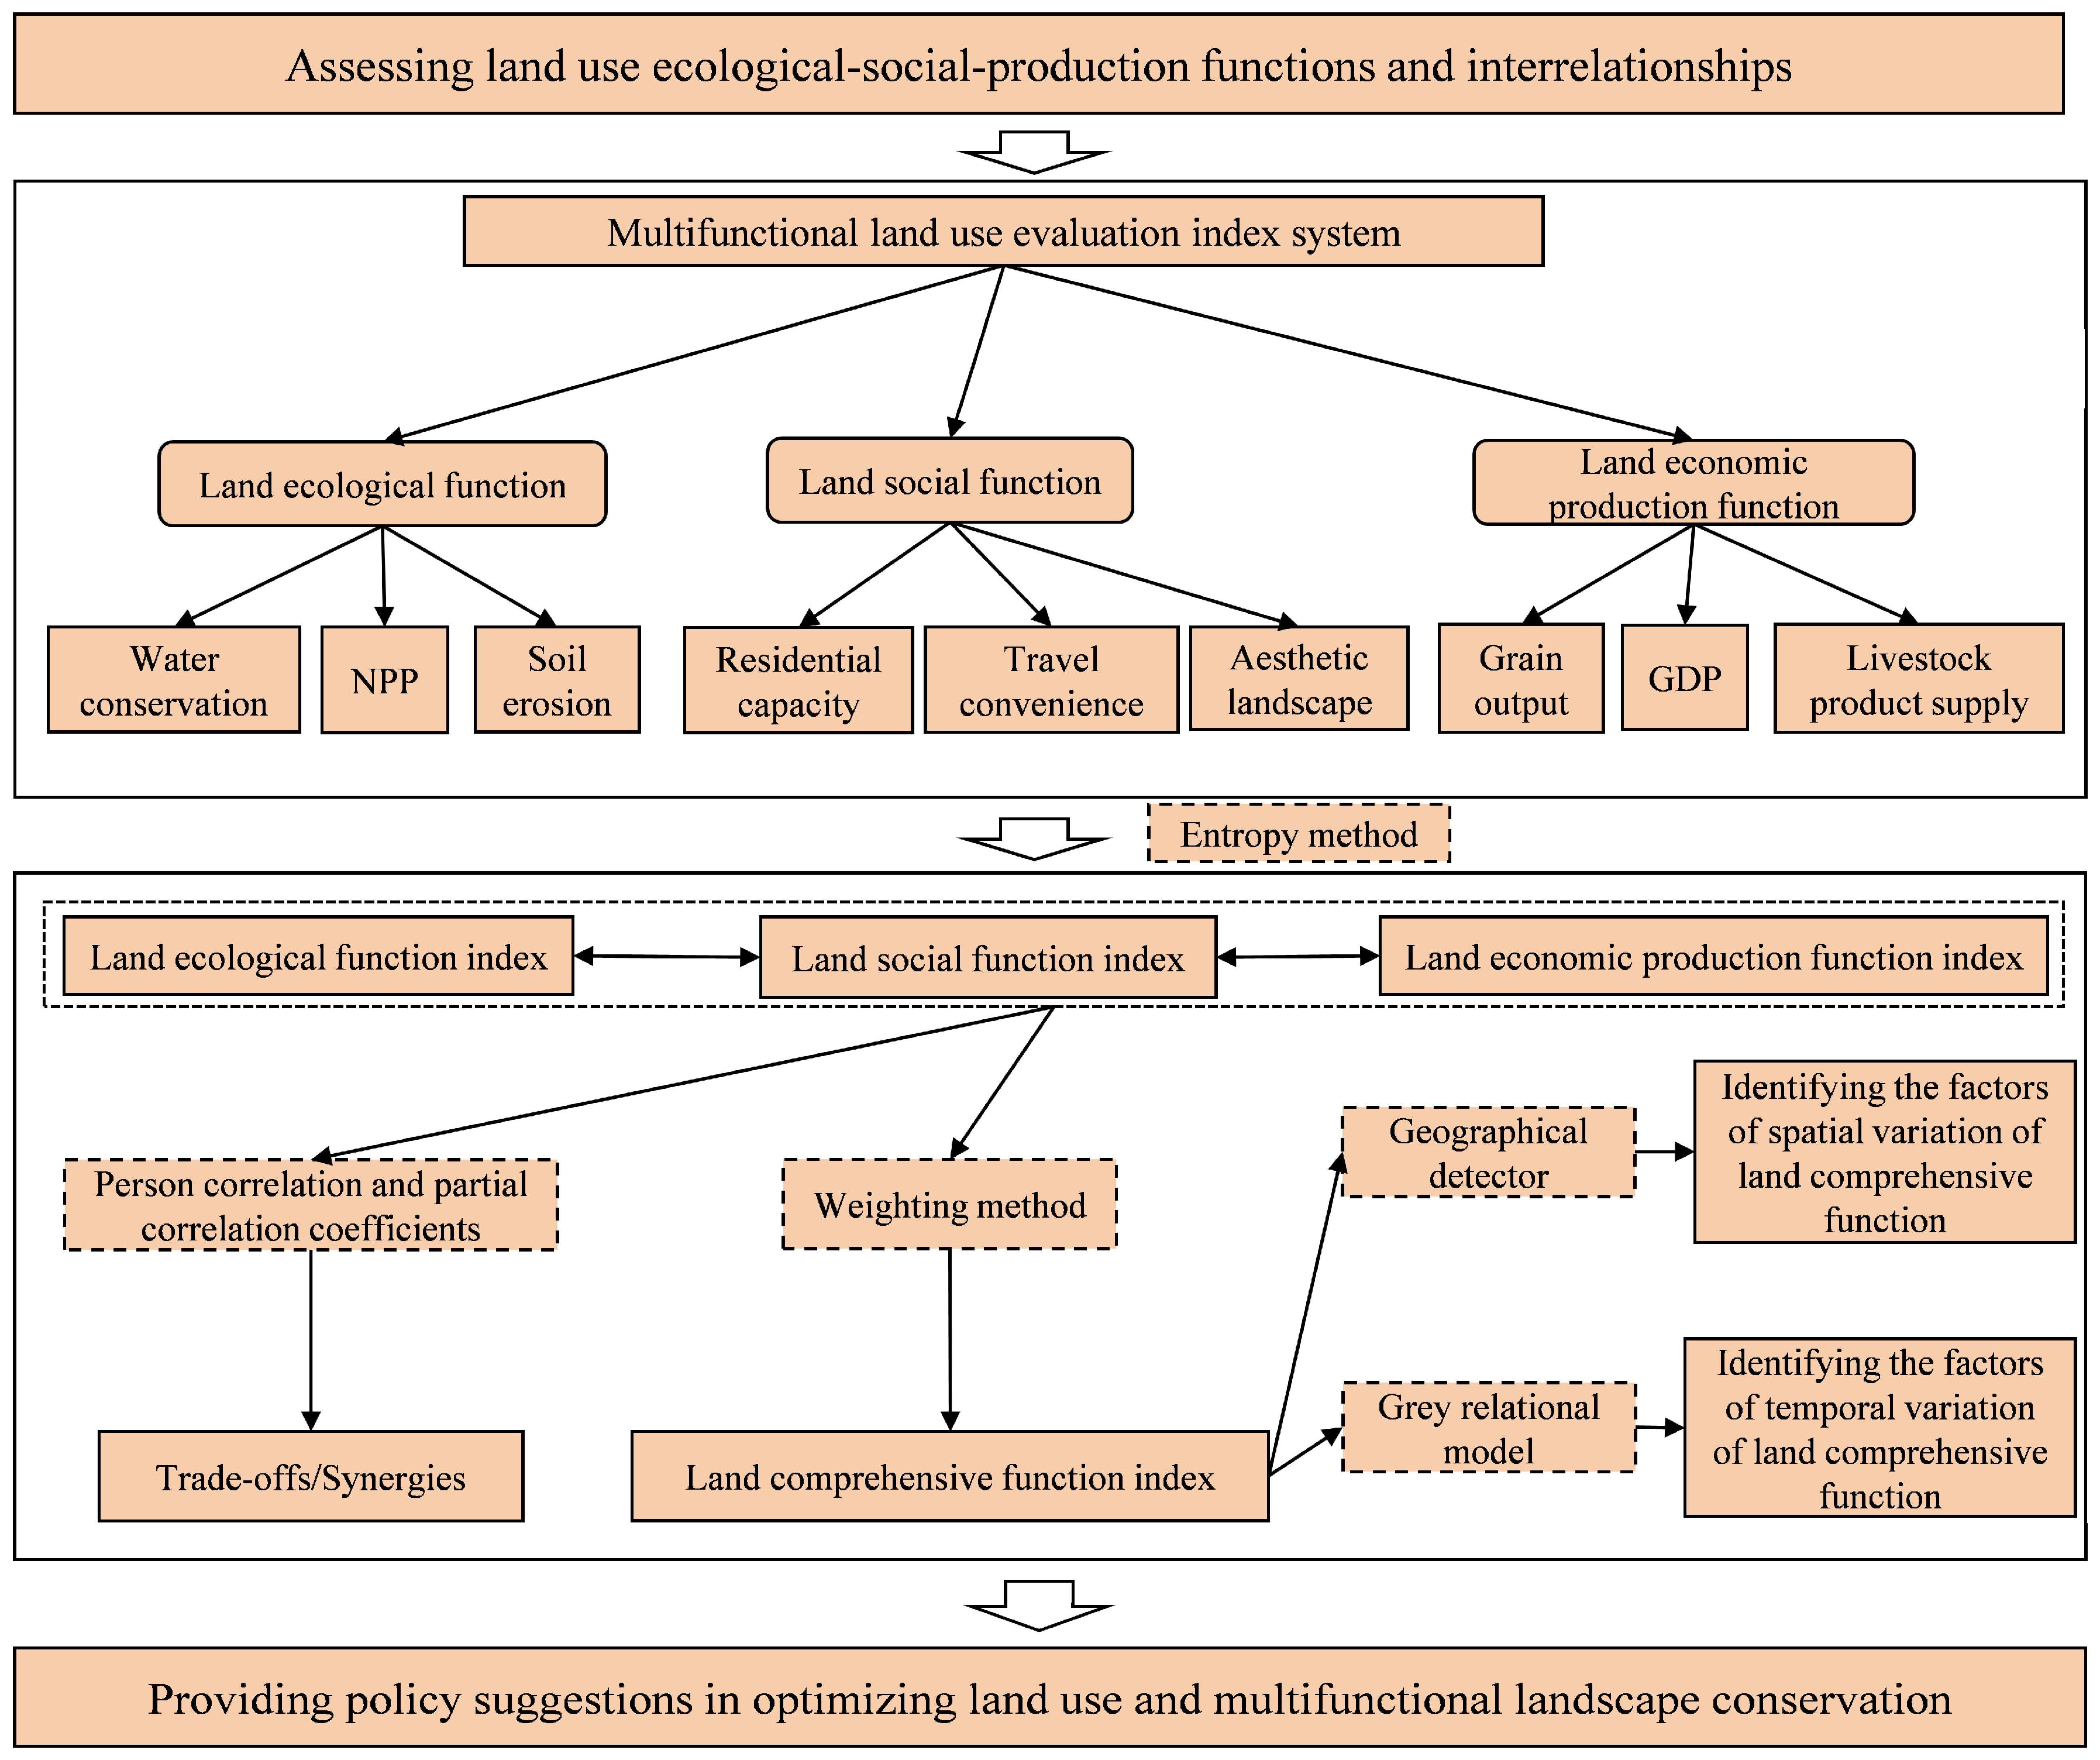
By integrating land use ecological-social-production functions, our study attempts to assess multifunctional level, identify the interrelationships among functions, and analyze the influencing factors of spatiotemporal variation of land use comprehensive function to provide policy suggestions in optimizing land use and multifunctional landscape conservation. The specific execution steps are shown in Figure 2. Moreover, the research units in this paper include grid-scale units and administrative units. This study adopts grid-scale evaluation units to assess multifunctional land use. By evaluating at the grid scale, the study area is divided into 35,273 grids of 1 km2 in size, wherein all indicator calculations are conducted. The administrative units within the study area include 14 counties and districts in the Hehuang Valley.

2.4. Quantification Method of Multifunctional Land Use Levels

The establishment of a multifunctional land use evaluation index system should be rooted in scientific theoretical foundations, with each selected evaluation indicator possessing a clear meaning. Given the multitude of direct and indirect factors that influence land use functions in the study area, it is impractical to select all indicators. Instead, indicators that reflect the unique characteristics of the study area should be chosen. Furthermore, consideration must be given to the primary factors influencing land use functions, selecting representative indicators that directly reflect land use functions to ensure the credibility and accuracy of the evaluation results. Evaluating multifunctional land use entails a complex functional system evaluation, which takes into account social, economic, and ecological factors.
Multifunctional landscape refers to a design concept and practice that meets multiple functions and needs within a landscape area. This landscape not only has aesthetic value, but also covers multiple aspects such as ecological protection, social demand, and economic development. The theory of “three-living” space refers to the interaction and integration of “production space”, “living space”, and “ecological space”. This theory emphasizes the need to co-ordinate the relationship between these three spaces in the planning and design process to achieve sustainable development. Production space focuses on economic activities and production efficiency, living space focuses on the quality of life and social services, and ecological space focuses on environmental protection and ecosystem health. From a sustainable development perspective, three dimensions—economic production, social, and ecological—were selected based on the multifunctional landscape and “three-living” space theory.
For the quantitative indicators’ selection of different land use functions, we followed the principles of scientific rigor, representativeness, and data availability. The selected indicators must be related to the corresponding land use function. The selected indicators must be quantifiable at the grid scale. The data used to calculate the indicators must be publicly available. Finally, nine indicators were chosen to construct the multifunctional land use evaluation index system (Table 2). The further explanations were as follows.
Land ecological function refers to the ecological products and services provided by land ecosystems. The ecological function corresponds to the environmental dimension, and excellent ecological function is also the objective of sustainable land development. By considering the special characteristics and ecological sensitivity of the Hehuang Valley, three indicators—water conservation, soil erosion, and NPP—were selected to quantify the land’s ecological function. The Hehuang Valley is located in an arid and semi-arid area with complex terrain, and its ecosystem is sensitive to climate change. Therefore, the above three indicators were selected to quantify the ecological functions of the land.
Land social function refers to the role of land in social life, including its impact on social activities, quality of life, and public services, which supports the stability and development of social structure, and promotes social welfare. In this paper, land social function also involves living function and cultural function. The healthy development of social functions is closely related to the fundamental human needs for land use. To comprehensively reflect the impact of regional land resources on social functions, three indicators—residential capacity, travel convenience, and aesthetic landscape—were selected to quantify the social function. The description of residential capacity, travel convenience, and aesthetic landscape indicators supporting land social function is show in Table 2.
Land economic production function refers to the direct or indirect economic value generated by land use activities. Given the typical and unique characteristics of the Hehuang Valley, GDP, grain production, and livestock product supply were selected to quantify the region’s economic production function. The Hehuang Valley is the important agricultural and livestock area, and the core economic development area in Qinghai Province. Therefore, the above three indicators were selected to quantify the economic production functions of the land.
The specific steps for quantifying the multifunctional level of land use in the Hehuang Valley were divided into three steps. Firstly, each indicator was normalized to between 0 and 1. Secondly, the weight of each indicator at different levels was calculated. For the three land use ecological-social-production functions, this paper considered them to be of equal weight. The explanations were as follows. The Hehuang Valley is the most important agricultural area and the core economic and social development area in Qinghai Province. Moreover, the area is located in an arid and semi-arid area, and the ecosystem is relatively sensitive to climate change. The three land use ecological-social-production functions were the indispensable products and services provided by land use in the Hehuang Valley, and as an important component of land use functions, they play an equally positive role, so they have equal weight. For the indicators of each function, the weight was calculated by the entropy method. The entropy method is an objective method of property rights confirmation and is not subject to subjective influence. Thirdly, each land use function level and the comprehensive land use function level were calculated by the weighting method.

2.5. Identification Method of Influencing Factors

The study quantified the spatial and temporal variations of the multifunctional level of land use in the Hehuang Valley. For the spatial variation, the study selected geographic detectors to identify the influencing factors of multifunctional land use levels. For the temporal variation, the study selected grey correlation analysis to identify its influencing factors. Determining the indicators of influencing factors is the prerequisite for identifying influencing factors.

2.5.1. Selection of Influencing Factors

Land use involves a wide range of fields and complex systems. The multifunctionality of land use is affected by many factors. These factors are diverse because land plays multiple roles in social and natural systems, and is closely related to different environmental, economic, social and policy conditions. Based on the existing literature [15,23,39,42,54], considering the geographical characteristics and data availability of the Hehuang Valley, we selected three types of influencing factors—natural conditions, accessibility, and human factors—comprising a total of nine indicators to investigate the driving factors affecting the land use function in the Hehuang Valley (Table 3). Land use is affected by natural factors, which vary in space, resulting in different applicable functions for each piece of land. The Hehuang Valley is located in an arid and semi-arid area with complex landforms, and is sensitive to climate change, so elevation, slope, temperature, and precipitation were selected as the indicators of natural conditions affecting multifunctional land use. Areas with high accessibility usually attract more types of land use because convenient transportation and good infrastructure make the combination of different land use functions more feasible. Good accessibility can promote the multifunctional development of land because it promotes the mixing and optimization of different land uses. According to the existing literature [23,54] and the study area characteristics, accessibility considered the distance to the county center and the distance to the city center. Human factors also have an important impact on the level of multifunctional land use. According to the existing literature [23,54], the data availability, and the study area characteristics, the farmland non-agricultural rate, land use intensity, and human activity intensity were selected as the indicators of human factors affecting multifunctional land use. The specific calculations of the driving factors are presented in Table 3.
The calculation of land use intensity is divided into two steps. In the first step, a specific intensity value is assigned to each land use type. We utilized previous studies that categorized land use intensity into four levels [60] (Table 4). In the second step, the weighted average of the intensities of different land use types in each 1 km2 grid cell was calculated as the land use intensity value.

2.5.2. Geographical Detector

In this study, we utilized the geographical detector [61] to assess the explanatory power of internal indicators within the land use multifunctionality index system. Geographical Detector is a statistical method that detects spatial differentiation and studies the drivers that influence this differentiation. It works with both qualitative and quantitative data, and can be used to explore interactions between two factors. Its development principle is based on the spatial differentiation of geographical features. Geographical Detector can detect the relationship between a certain geographical attribute and its explanatory factors, and can also be used to explore the differences and influencing factors of geographical spatial elements in the study area. Compared with traditional statistical analysis methods, Geographical Detector has significant advantages in that it does not require too many assumptions and takes into account the geospatial location of variables, so is it widely used and is especially suitable for the Hehuang Valley, which has complex geomorphic units. The specific model formula is calculated as follows:
P X , Y = 1 1 n δ 2 i = 1 m n X i δ X i 2
where P X , Y represents the explanatory power of influence indicator X in Table 3 on the comprehensive land use function level Y, and n and δ2 denote the total number of samples and variance for a specific function in the study area, respectively. m represents the number of categories of the indicator, while n X i and δ X i 2 are the number of samples and variance of indicator X in category i, respectively. P ranges from 0 to 1; a higher P value indicates stronger explanatory power. The impact of each factor in Table 3 on the comprehensive land function Y was examined based on the explanatory strength of the factors. Additionally, the driving factors X1–X9 were organized into five classes using the natural breaks method in ArcGIS and subsequently calculated in GeoDetector.

2.5.3. Grey Relational Model

Grey relational analysis was employed to establish numerical relationships among influencing factors within a system by assessing the similarity in the geometric shapes of the reference and comparison sequences [62]. The Hehuang Valley’s ecological environment is fragile, and its land use functions are influenced by various natural, social, and economic factors. Considering the uncertainty of these factors, the land use functions in the study area form a grey system. Therefore, we applied the grey relational evaluation model to calculate the correlation coefficients of various indicators and further explore the driving factors of land use functions over time. The specific calculation formula is as follows:
ξ U i j , g j = min i min j U i j g j + ρ max i max j U i j g j U i j g j + ρ max i max j U i j g j
where ξ U i j , g j represents the correlation coefficient between the j-th evaluation index of the i-th evaluation area and the standard sequence G; min i min j U i j g j and max i max j U i j g j are the minimum and maximum differences of the two levels of samples, respectively. ρ is the resolution coefficient. The smaller the ρ value, the greater the resolution. When ρ ≤ 0.563, the resolution is best, usually ρ = 0.5.

2.6. Identification Method of Trade-Offs/Synergies in Land Use Multifunctionality

This study utilized long-term sequence data from 2000, 2005, 2010, 2015, and 2020 to conduct trade-off and synergy analyses of land use functions. For measurement purposes, Pearson correlation analysis and P-value tests were employed at a 1 km grid scale [63]. These analyses assess the trade-offs and synergies among ecological, social, and economic production functions of the land at the grid scale. Additionally, to account for potential correlations among different land use functions and a confounding variable related to land use multifunctionality, partial correlation analysis was employed to minimize the impact on the results [64,65]. The calculation formula is as follows:
r = t = 1 n ( p x t p t ¯ ) ( q x t q t ¯ ) t = 1 n ( p x t p t ¯ ) 2 t = 1 n q x t q t ¯ 2
where r represents the correlation coefficient among the land use production, social, and ecological function indices at grid point x , p x t stands for the level of land use function at year t for grid x , p t ¯ refers to the mean level of land use function at year t for grid x, q x t stands for the level of land use function at year t for grid x, q t signifies the mean level of land use function at year t for grid x.
Using the correlation coefficient r obtained from the above formula, we calculated the partial correlation coefficient:
r i j , h = r i j r i h × r j h 1 r i h 2 × ( 1 r j h 2 )
where r i j , h stands for the partial correlation coefficient between two land use functions while controlling for another land use function, and r i j , r i h , and r j h refer to the Pearson correlation coefficients between each pair of land use functions. The partial correlation coefficient r i j , h ranges from [−1, 1]. A negative partial correlation coefficient signifies a trade-off between land use functions, whereas a positive correlation indicates synergy between them [66].

3. Results

3.1. Spatiotemporal Evolution of Land Use Multifunctionality in the Hehuang Valley

3.1.1. Spatiotemporal Evolution of Land Ecological Function

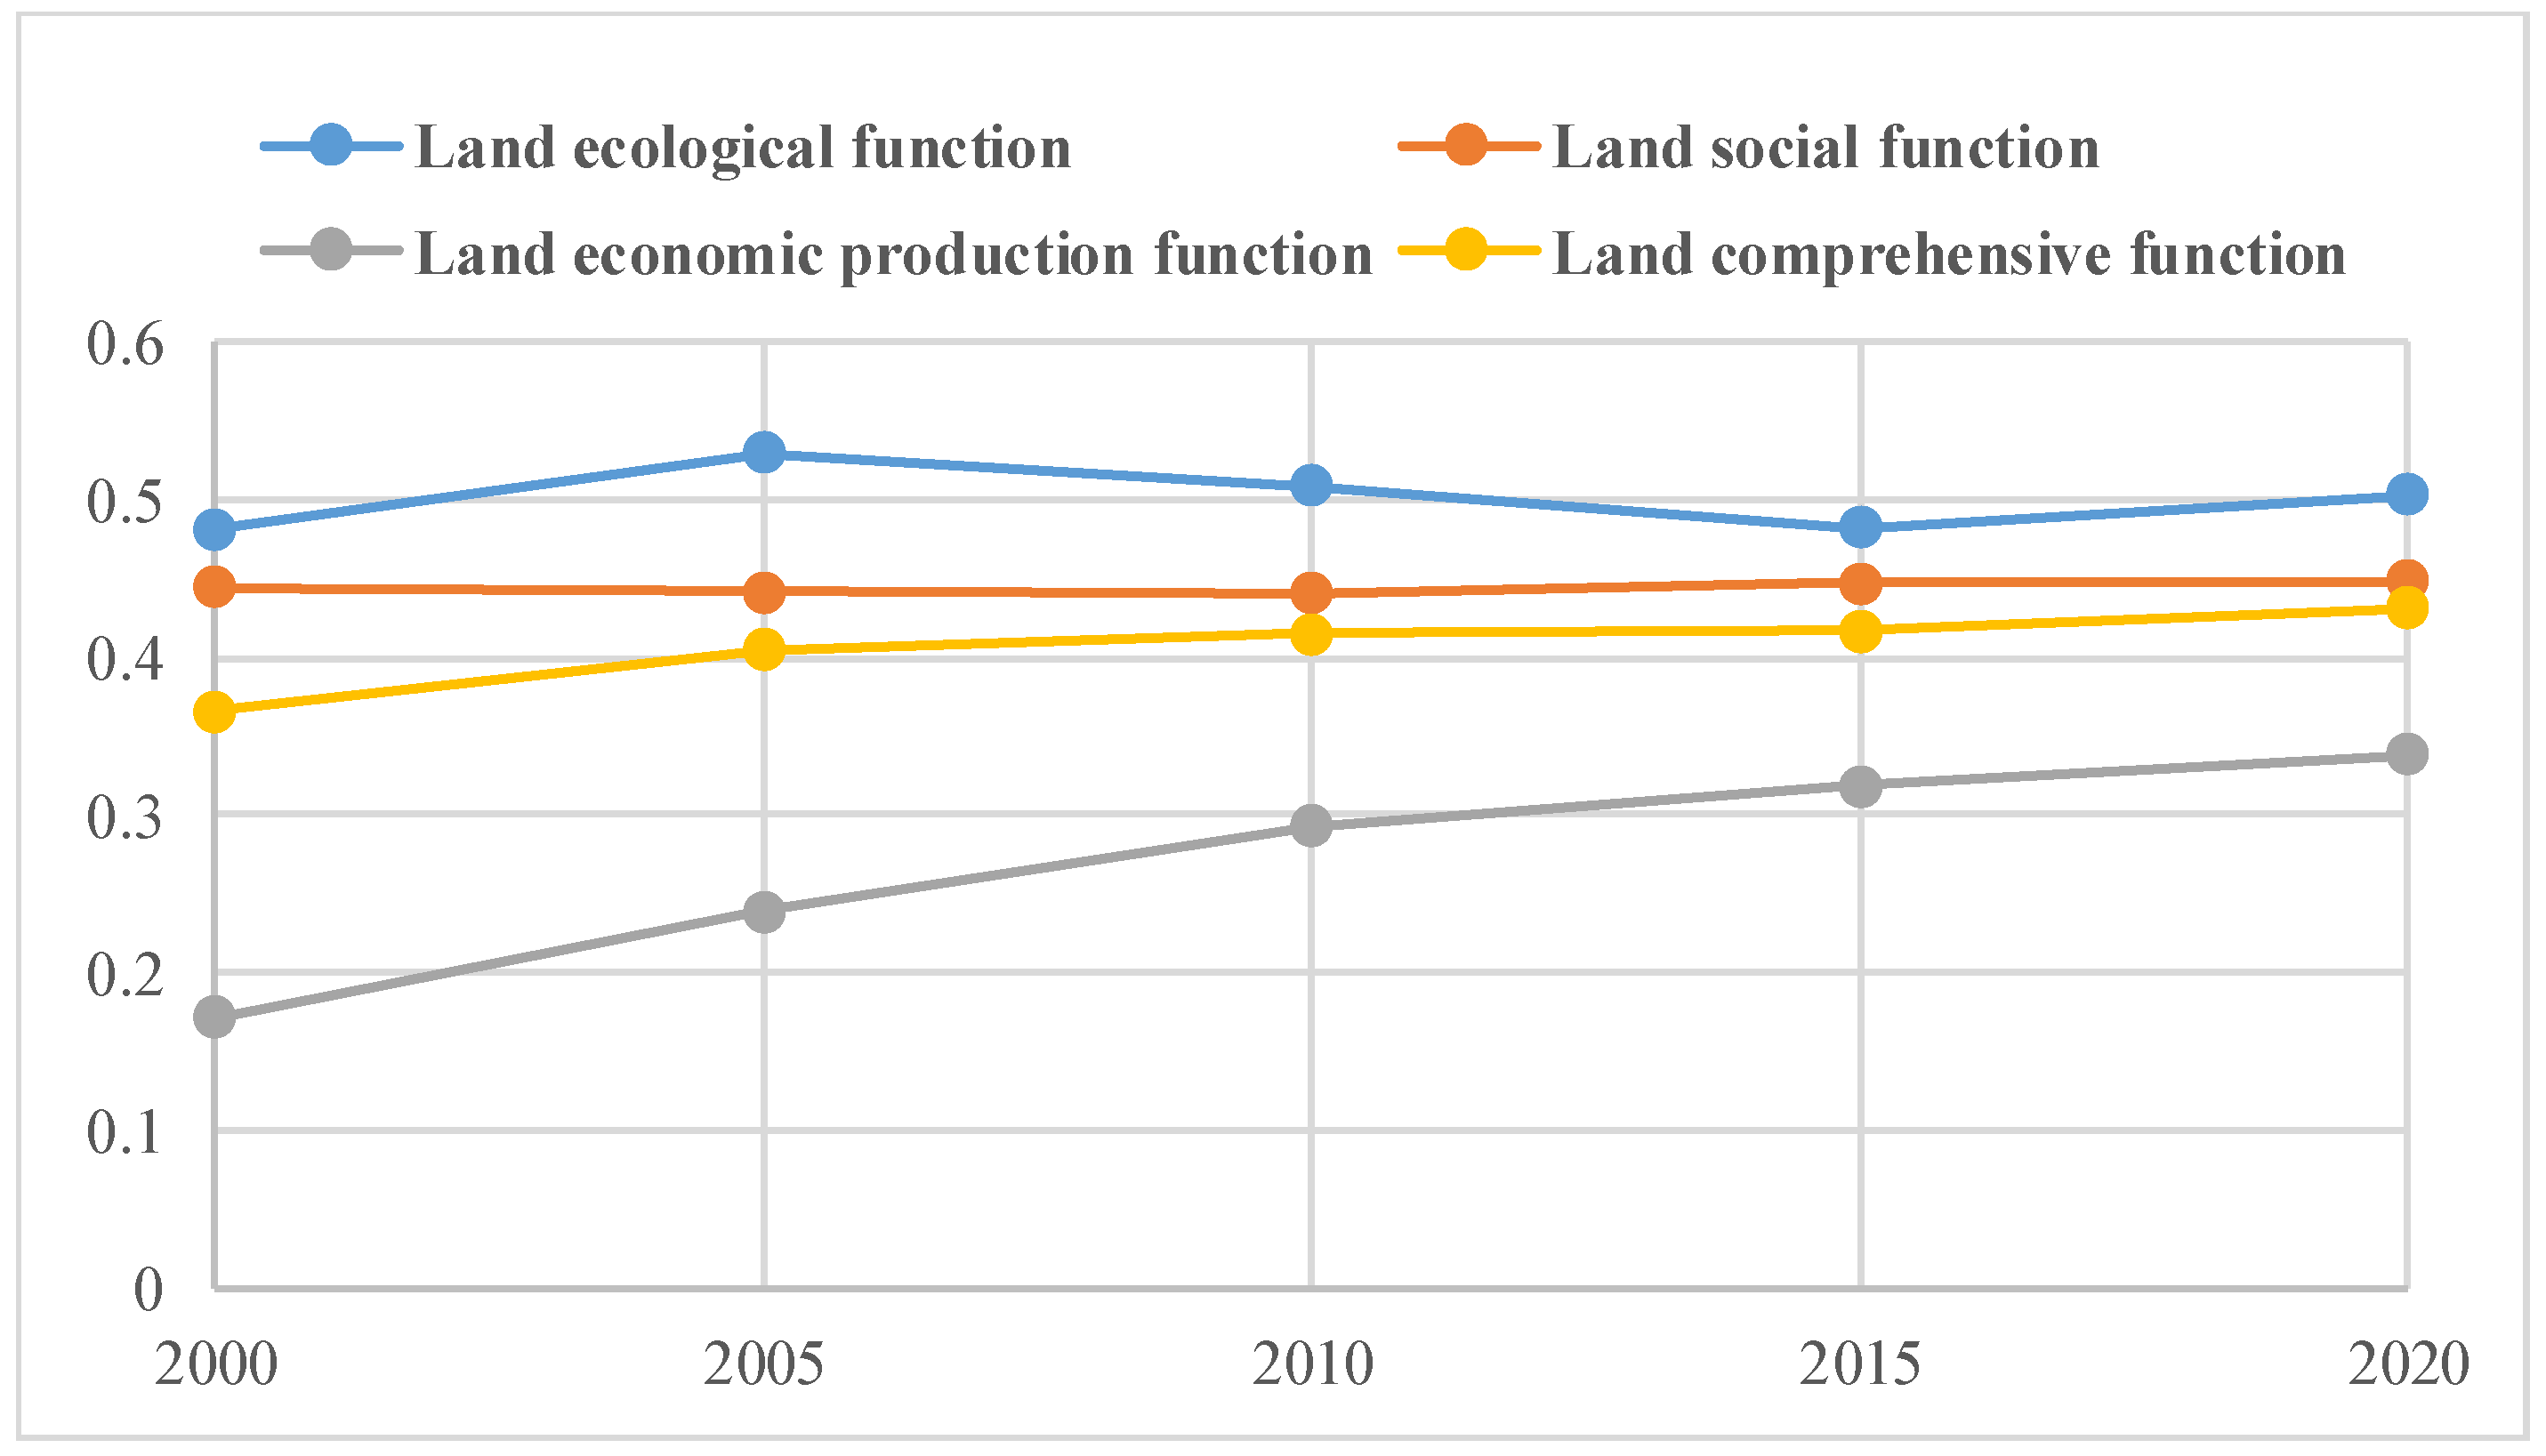
Over the period from 2000 to 2020, the land ecological function in the Hehuang Valley exhibited an overall increasing trend (Figure 3). The land ecological function index rose from 0.481 to 0.503, indicating a growth of 4.5%. Notably, the most significant increase occurred between 2000 and 2005, with a growth rate of 10.19%.
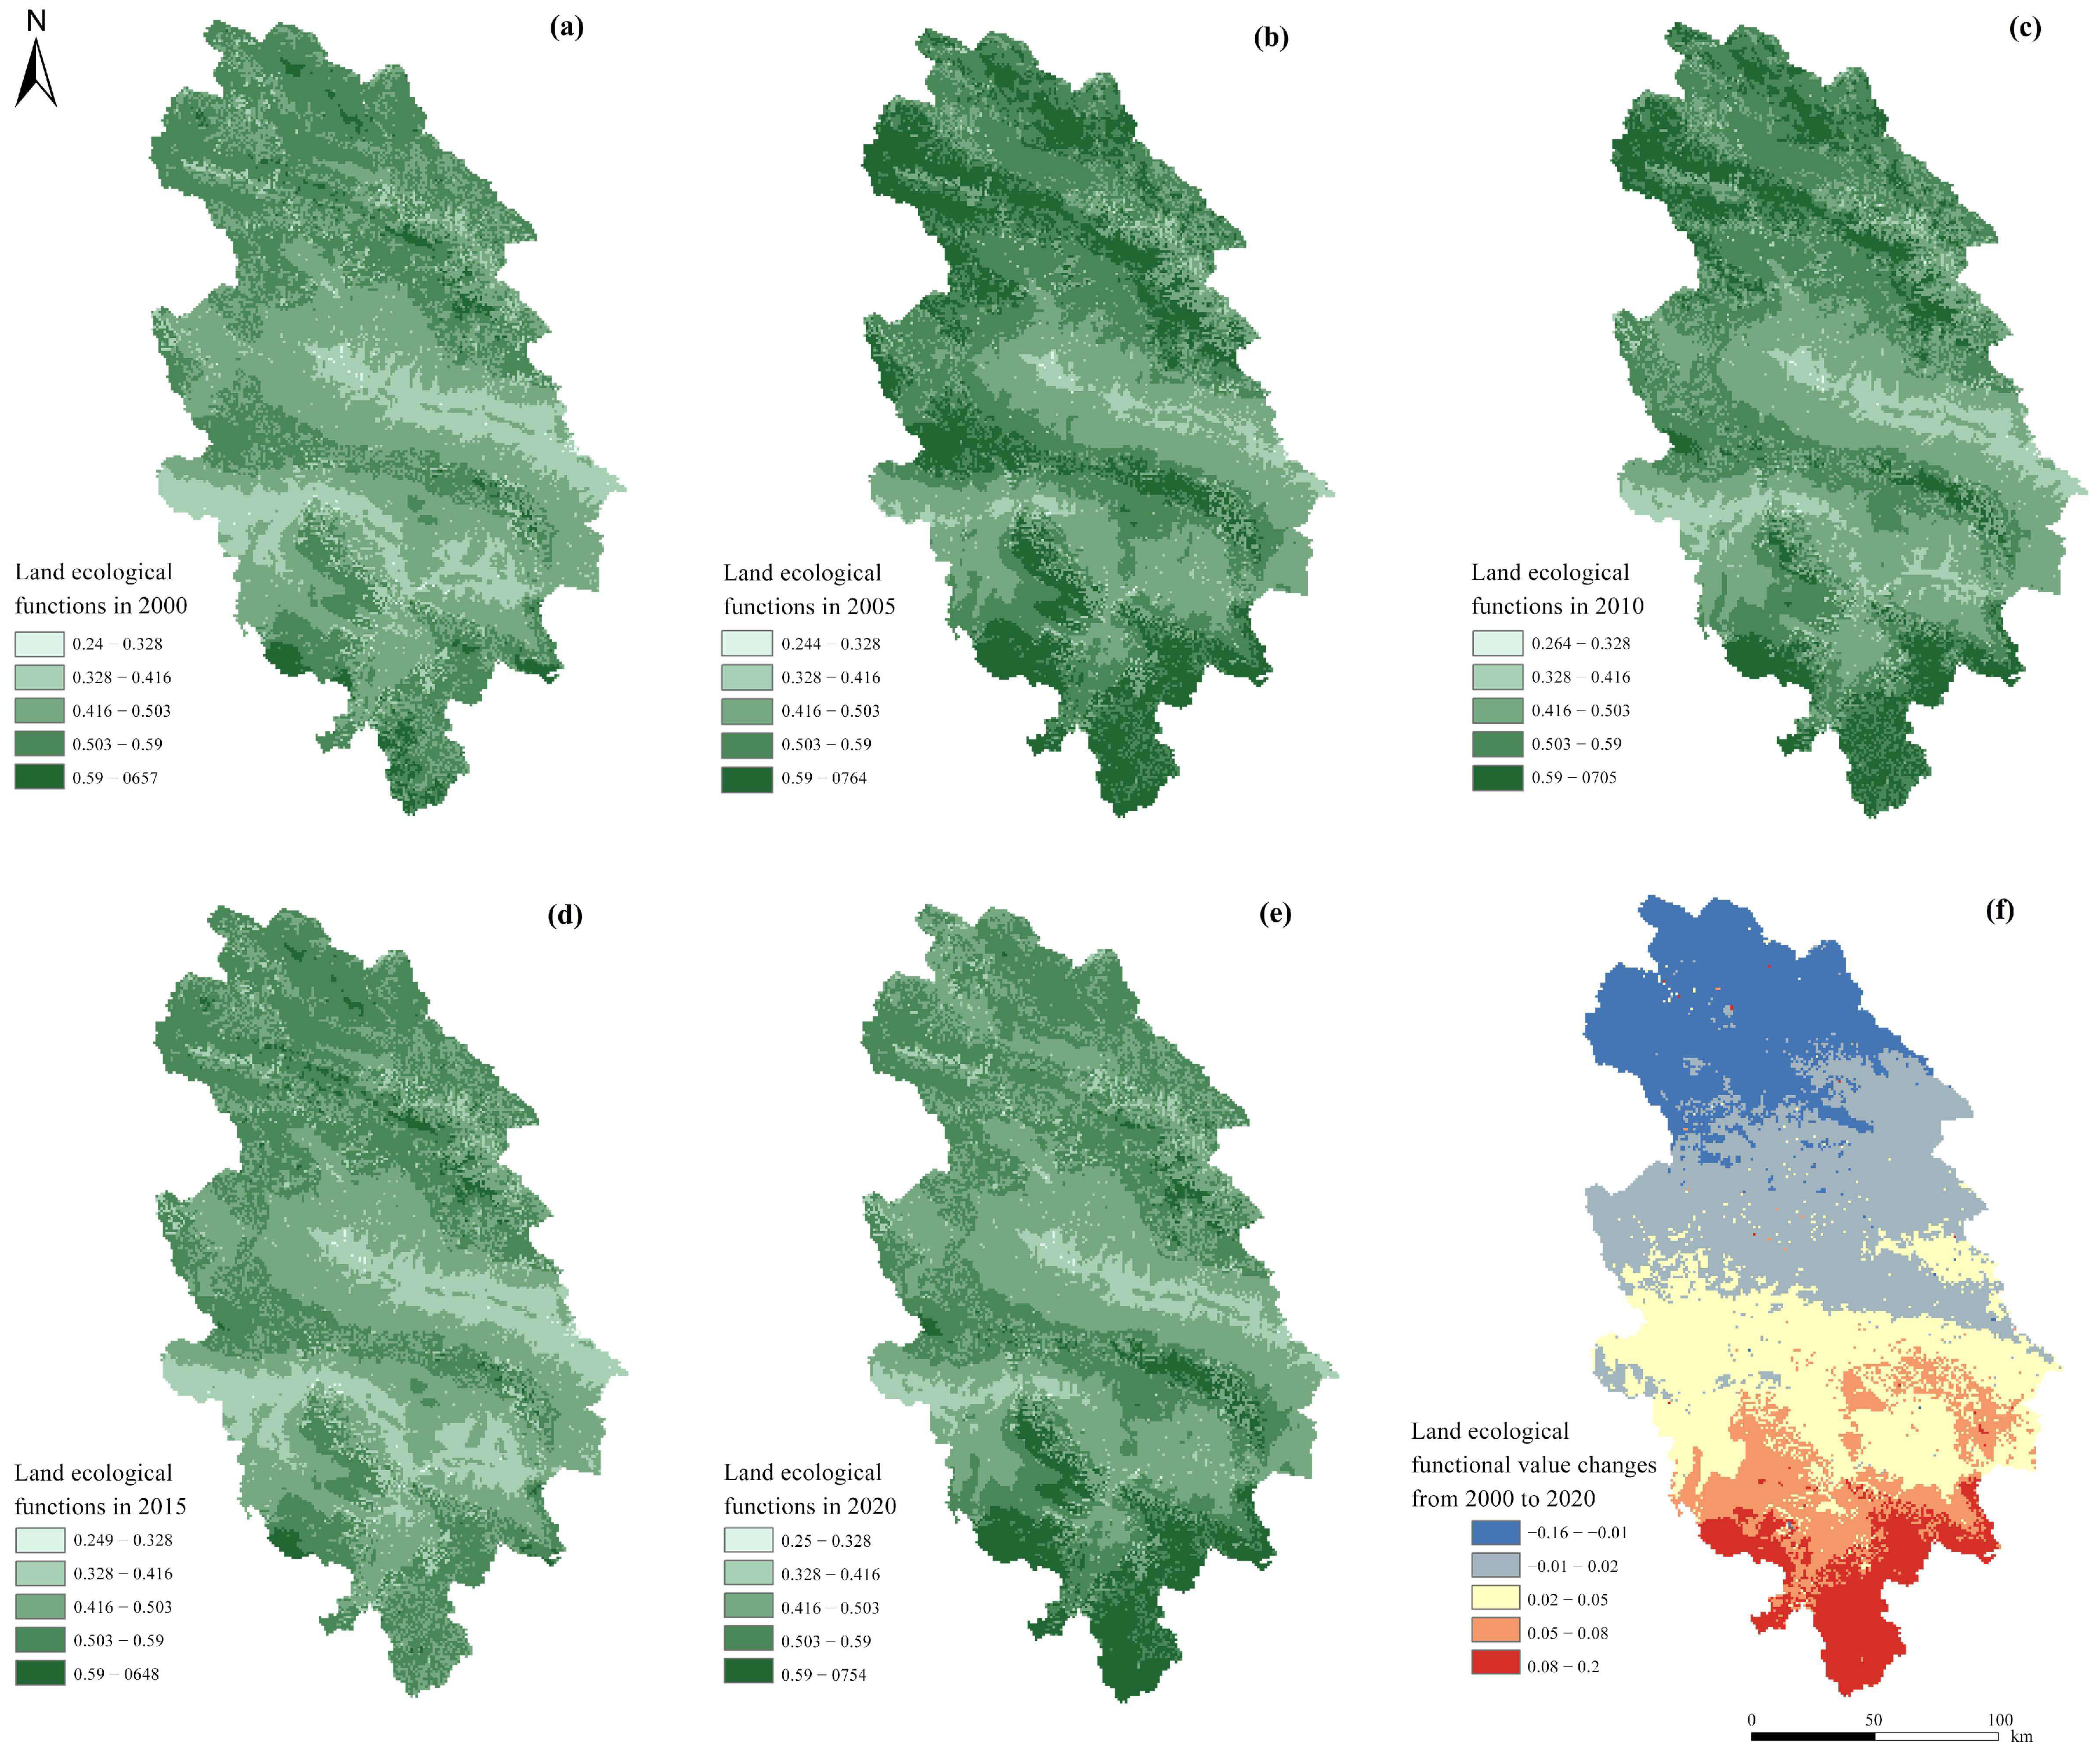
Regarding spatial distribution, the pattern of the land ecological function index remained largely consistent from 2000 to 2020, with only minor variations (Figure 4). High-value areas predominantly clustered in the southern, northern, and central-southern regions of the Hehuang Valley. In contrast, low-value areas were concentrated in the central and central-southern regions. Generally, the spatial distribution of the land ecological function index closely mirrored the elevation profile of our site, with lower values in lower-elevation areas and higher values in higher-elevation areas.
Areas with an increasing land ecological function index were mainly found in the central and southern parts of the Hehuang Valley, indicating a gradual upward trend. Conversely, areas with a declining land ecological function index were primarily located in the northern part of the valley. Specifically, 70.90% of the study units exhibited varying degrees of increase, while 29.10% demonstrated varying degrees of decrease. The maximum increase recorded in the land ecological function index was 0.2, whereas the maximum decrease was 0.16. The decrease in ecological function observed in the northern region from 2000 to 2020 can be attributed to the reduction in high-value areas pertaining to water conservation and NPP in 2020 compared to 2000.

3.1.2. Spatiotemporal Evolution of Land Social Function

Between 2000 and 2020, the land social function in the Hehuang Valley exhibited a modest overall increase. The land social function index rose from 0.444 to 0.448, representing a 0.90% increment. Overall, the land social function index experienced a slight decline from 2000 to 2010, followed by a gradual increase from 2010 to 2020, reaching its zenith in 2020 (Figure 3). This trend primarily stemmed from the dominant influence exerted by the residential capacity indicator and the relatively sluggish population growth in the Hehuang Valley from 2000 to 2020. Furthermore, the travel assurance and aesthetic landscape indicators also demonstrated varying degrees of increase, although their contributions were not decisive.
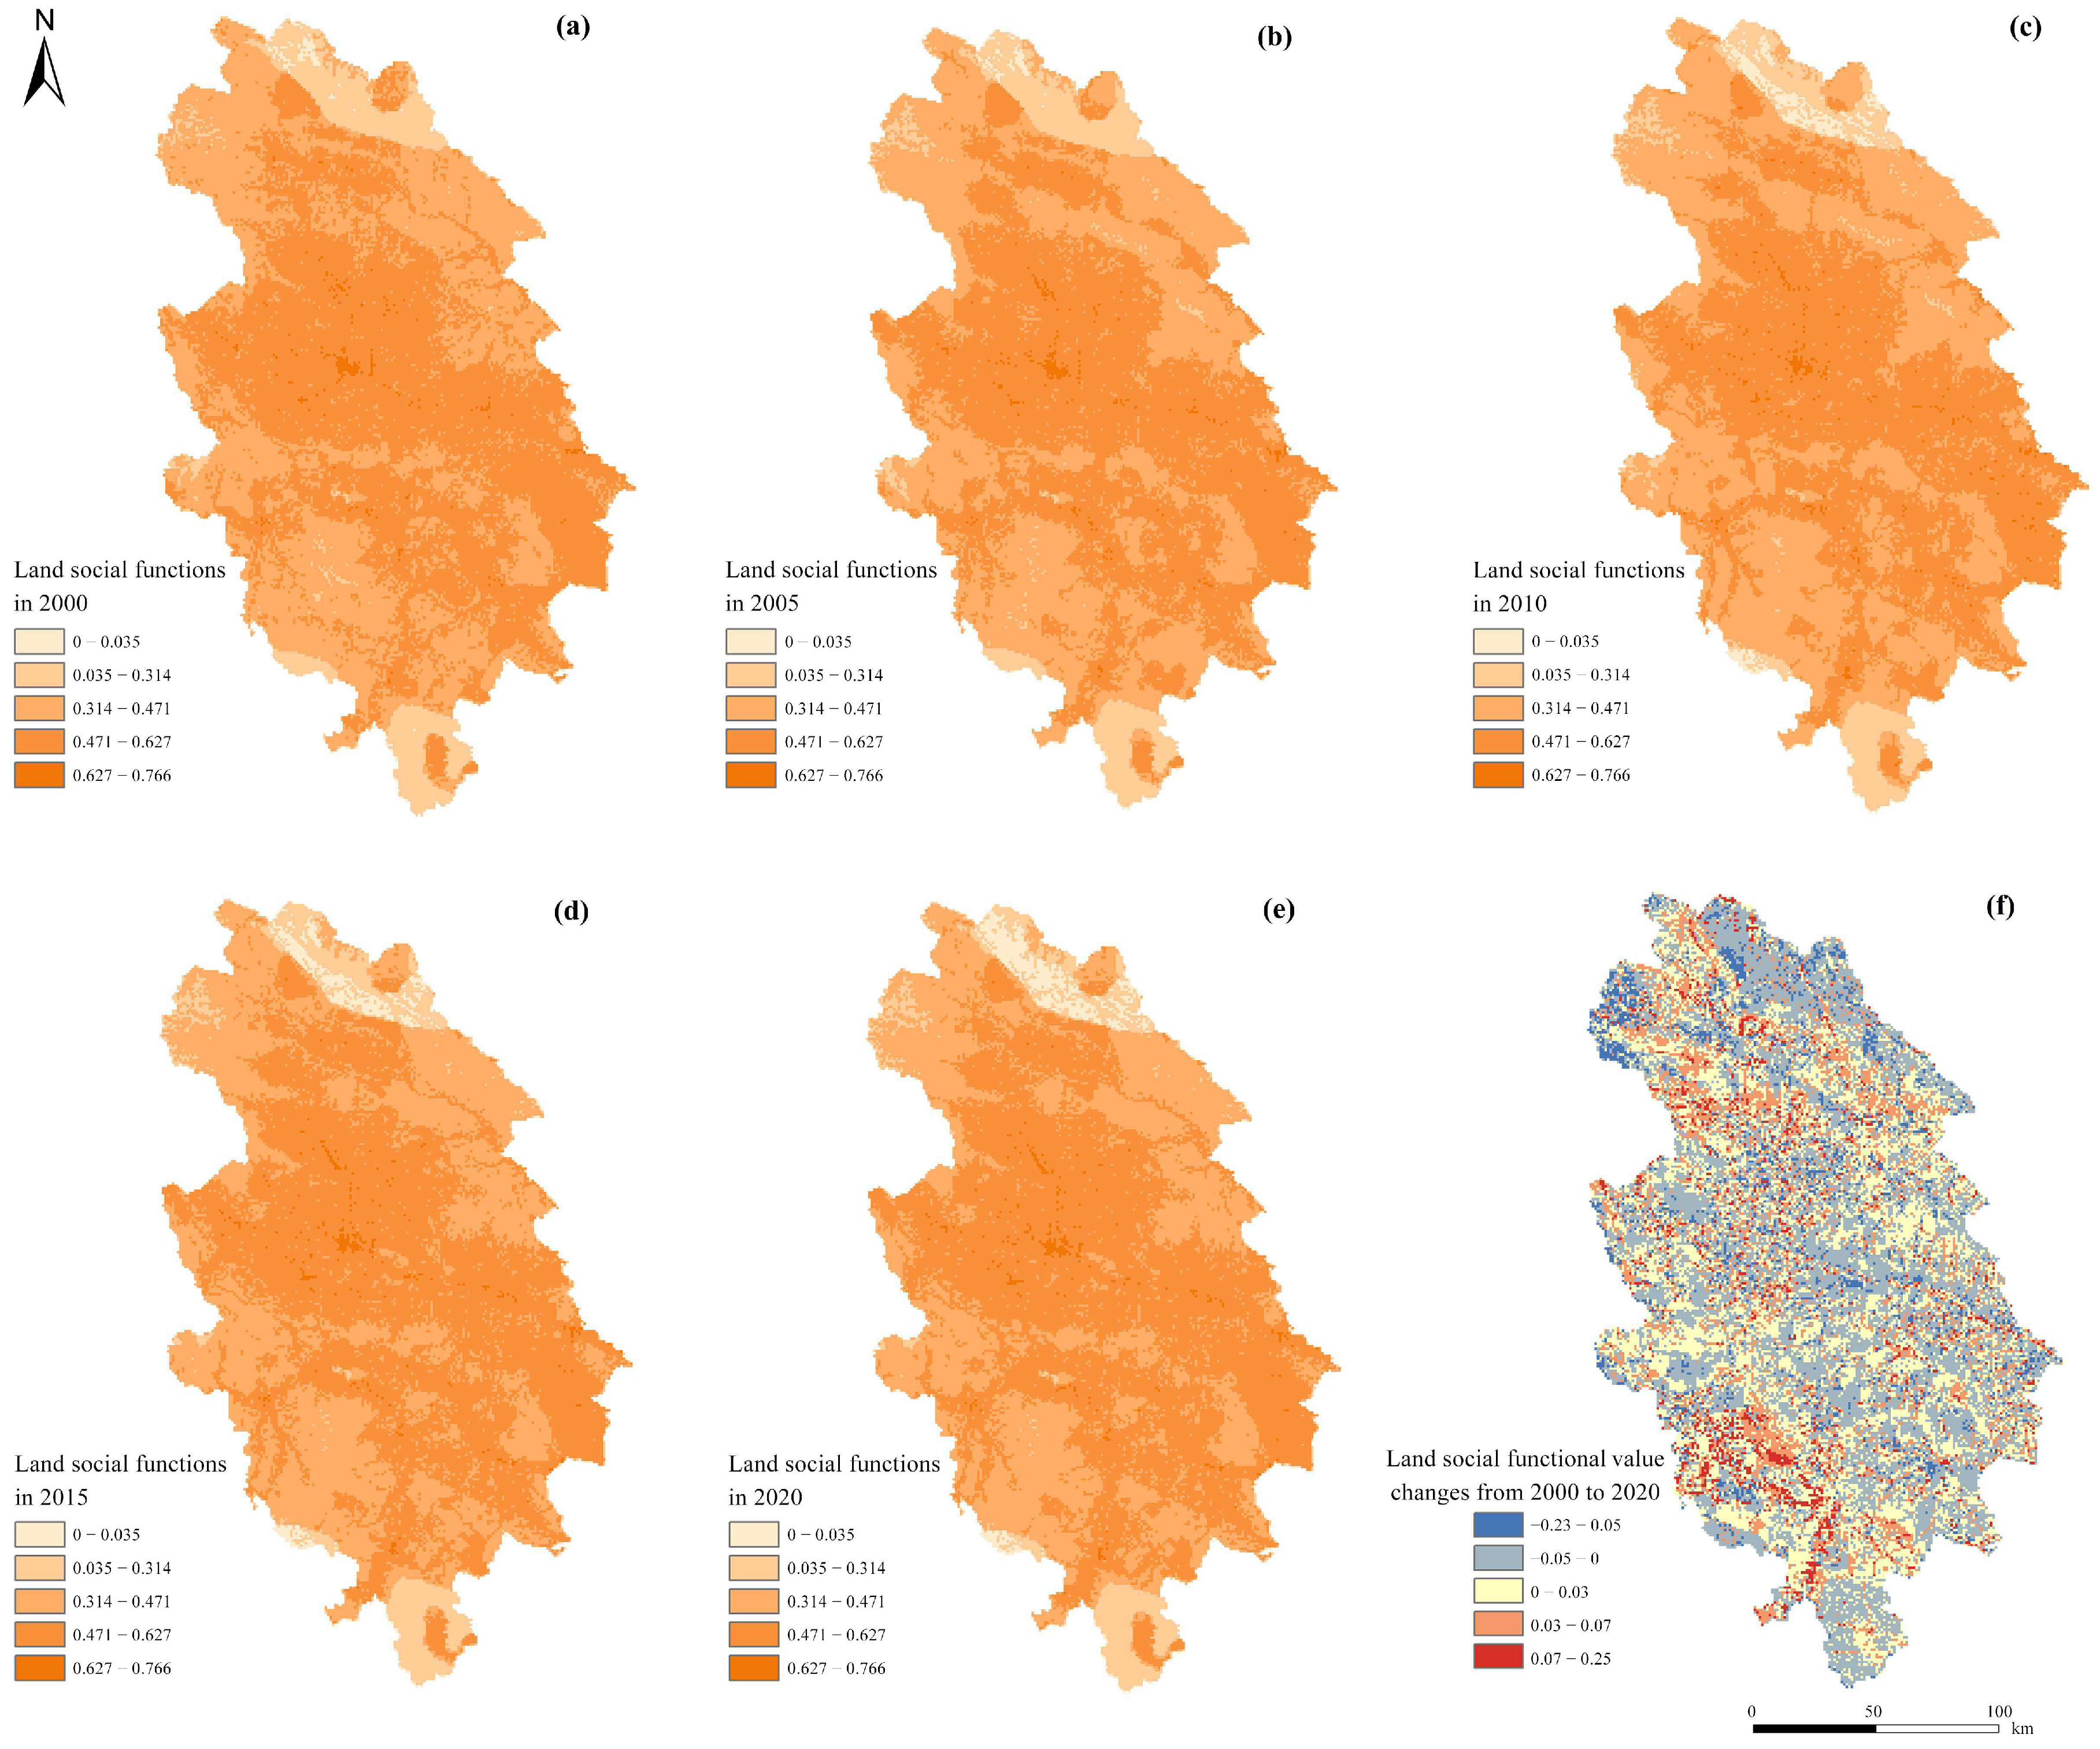
Spatially, significant changes were observed between 2000 and 2005, with both low-value and high-value areas undergoing shifts (Figure 5). High-value areas expanded notably in the central region, centered around Xining City, radiating outward. Conversely, low-value areas expanded in the central-western and northwestern regions of the study area. Despite the conspicuous spatial expansion of high-value areas, the overall land social function value exhibited a relative decline compared to 2000, owing to the simultaneous expansion of low-value areas and the conversion of certain higher-value areas into medium-low value regions. Between 2005 and 2020, the spatial distribution of the land social function index showed overall stability, with specific regions experiencing changes. High-value areas were concentrated in the central and central-northern parts of the area studied, while low-value areas were found in the northernmost and southernmost regions. There was a gradual expansion of low-value areas in the northern region, while high-value areas remained consistent. In the southwestern Hehuang Valley, certain medium-low value regions decreased in size over time, being replaced by medium-value areas. The map of changes in the land social function index from 2000 to 2020 indicates no significant spatial pattern for areas of increase and decrease, which are scattered and interspersed throughout the study area. Specifically, 51.84% of the study units showed varying degrees of increase, while 48.16% showed varying degrees of decrease. The maximum increase in the land social function index was 0.25, and the maximum decrease was 0.23.

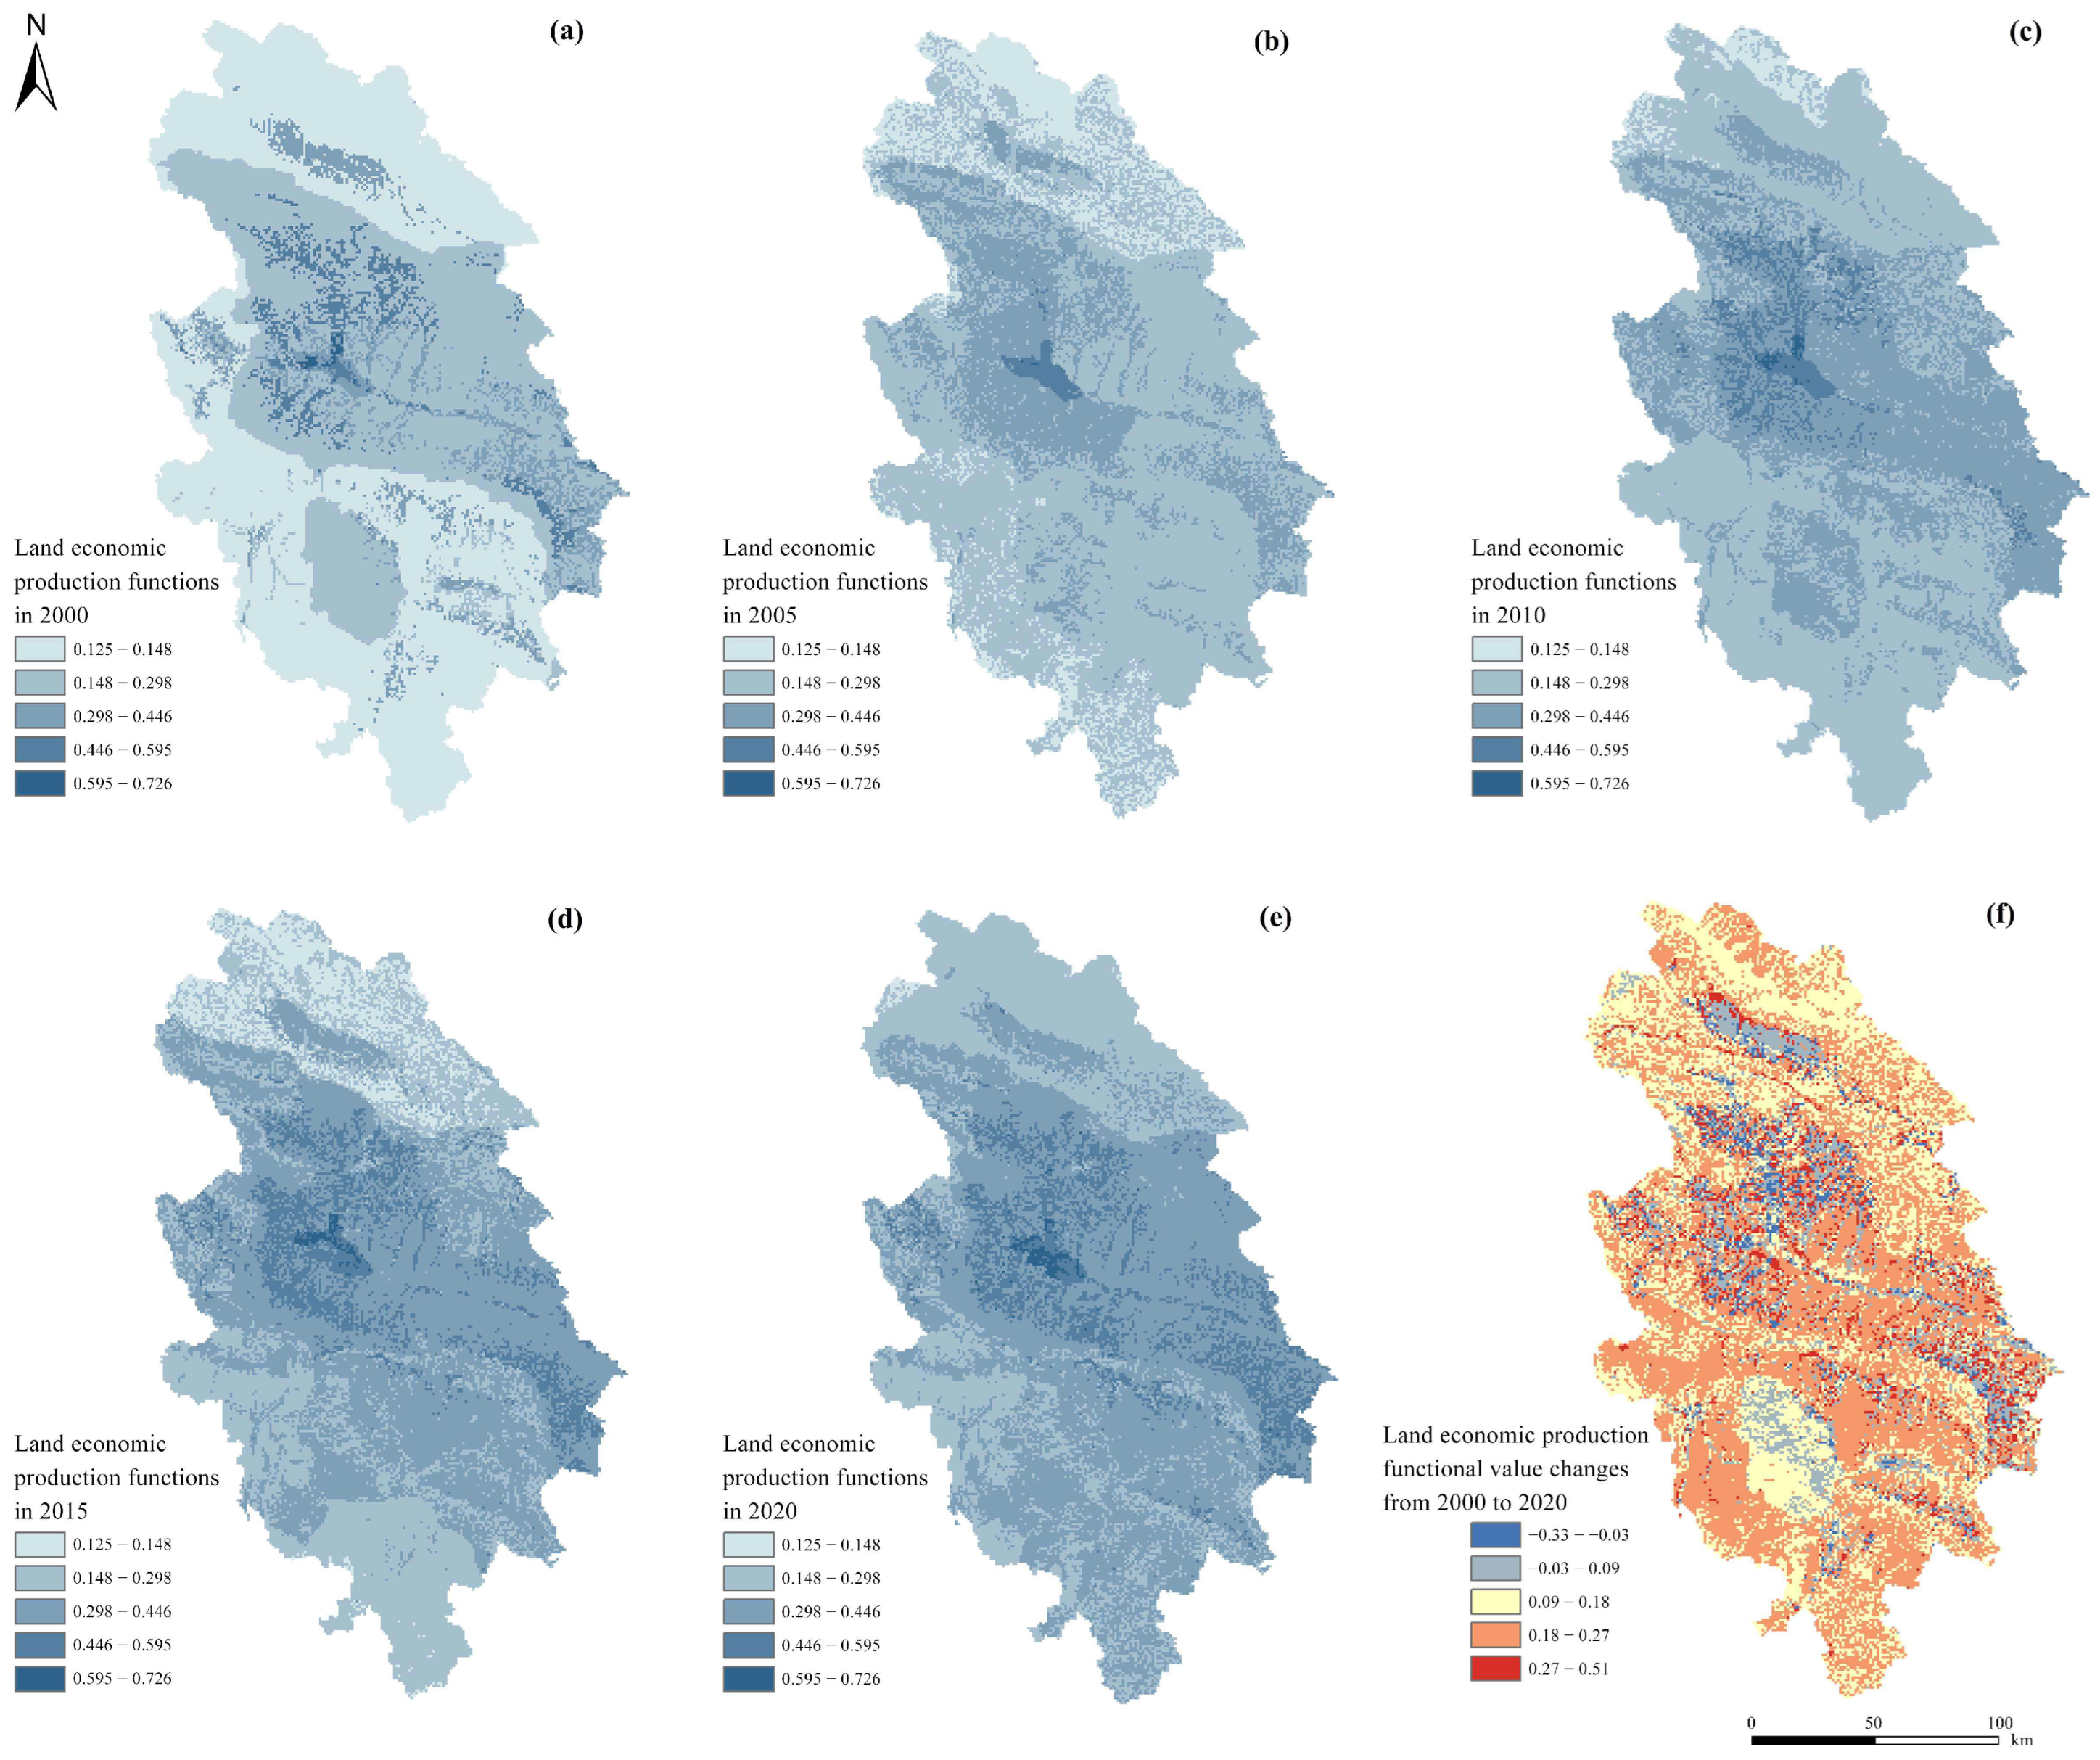
3.1.3. Spatiotemporal Evolution of Land Economic Production Function

From 2000 to 2020, the land economic production function in the Hehuang Valley showed an overall increasing trend (Figure 3). The land economic production function index rose from 0.171 to 0.338, representing a growth of 97.66%. The index values for the years 2000, 2005, 2010, 2015, and 2020 were 0.171, 0.239, 0.293, 0.318, and 0.338, respectively. Furthermore, the land economic production index displayed a continuous upward trend throughout this period, with its peak recorded in 2020.
Regarding spatial distribution, significant changes occurred between 2000 and 2005 (Figure 6). There was an increase in high-value areas in the central-northern region, while low-value areas in the central-southern region experienced a decrease. From 2005 to 2020, the spatial distribution characteristics remained relatively consistent, with high-value areas expanding consistently. The spatial distribution pattern of the land economic production function aligns with that of the land social function and GDP. High-value areas are concentrated in the central basin regions, while low-value areas are observed in the northern, southern, and southwestern regions of our site. The map illustrating changes in the land economic production function index for the period from 2000 to 2020 shows that areas with increased economic production function dominate the study area. On the other hand, areas with decreased economic production function are confined mainly to the northern region, appearing as small patches. Specifically, 94.99% of the study units exhibited varying degrees of increase, while 5.01% displayed varying degrees of decrease. The maximum increase in the land economic production function index was 0.51, and the maximum decrease was 0.33.

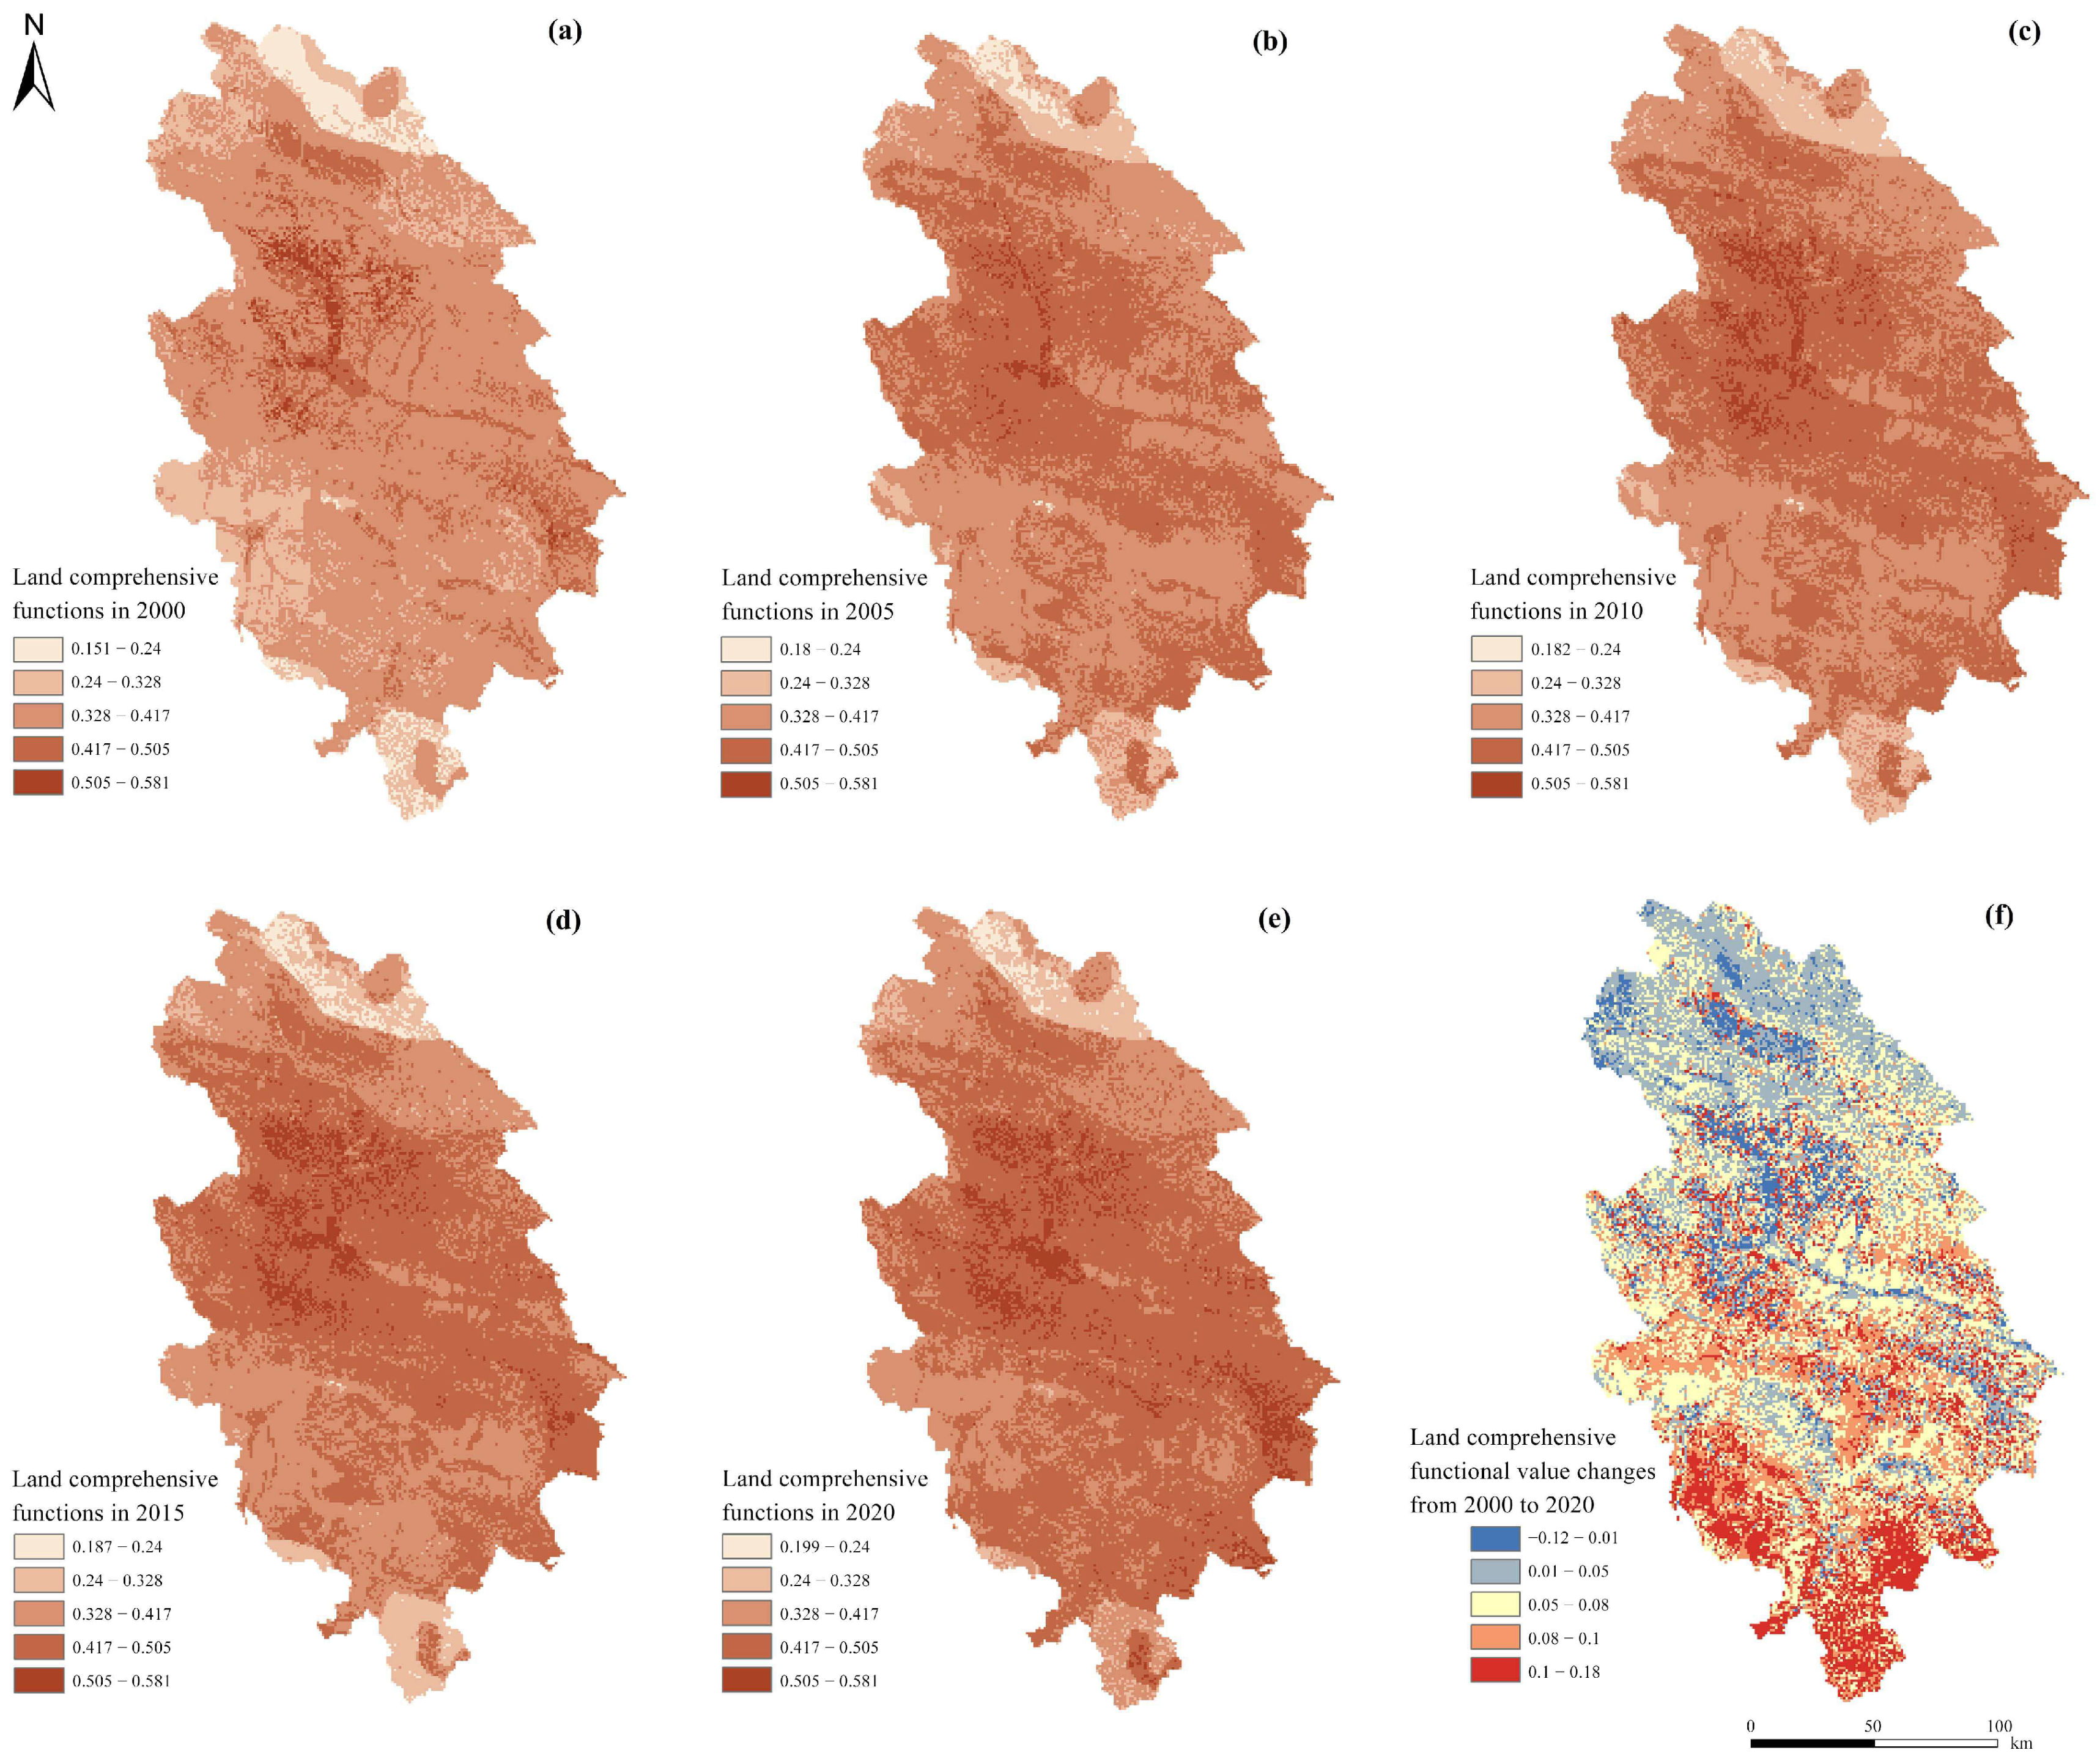
3.1.4. Spatiotemporal Evolution of Land Comprehensive Function

From 2000 to 2020, the overall land comprehensive function in the Hehuang Valley showed an increasing trend (Figure 3). The land comprehensive function index improved from 0.366 to 0.431, reflecting a growth rate of 17.76%. The comprehensive land function index values for the years 2000, 2005, 2010, 2015, and 2020 were 0.366, 0.405, 0.415, 0.417, and 0.431, respectively. Similar to the land economic production function, the comprehensive land function index exhibited a continuous upward trend from 2000 to 2020, reaching its peak in 2020.
Spatially, the distribution of the land comprehensive function index remained stable from 2000 to 2020 (Figure 7). High-value areas were predominantly concentrated in the central and central-northern parts of the Hehuang Valley, whereas low-value areas were concentrated in the northern, central-southern, and southern regions. Throughout this period, the high-value and medium-high-value areas in the central-northern regions continued to expand, while low-value areas in the northern and southern regions gradually decreased. The map depicting changes in the land comprehensive function index from 2000 to 2020 reveals that regions experiencing increased comprehensive function were primarily concentrated in the central and southern parts of the Hehuang Valley, occupying a significant portion of the area. Conversely, regions experiencing decreased comprehensive function were mostly situated in the northern part of the valley, appearing as isolated patches. Specifically, 95.08% of the study units exhibited varying degrees of increase, while 4.92% showed varying degrees of decrease. The maximum increase in the land comprehensive function index was 0.18, and the maximum decrease was 0.12.

3.2. Trade-Offs and Synergies in Land Use Multifunctionality in the Hehuang Valley

3.2.1. Pearson Correlation Coefficients of Land Use Multifunctionality

A pairwise correlation analysis of the multifunctional levels of land use for each year revealed that from 2000 to 2020 (Figure 8), the Pearson coefficient between the social and economic production functions of land in the Hehuang Valley consistently remained above 0.43, reaching its peak of 0.55 in 2010. This implies a relatively strong positive correlation overall. During the same period, the Pearson coefficient between the social and ecological production functions of land remained below −0.39, with the lowest value of −0.46 observed in 2010, indicating a relatively strong negative correlation. The Pearson coefficient between the economic and ecological production functions of land also remained below −0.18, with a minimum value of −0.22 in 2010, indicating a weak negative correlation overall.

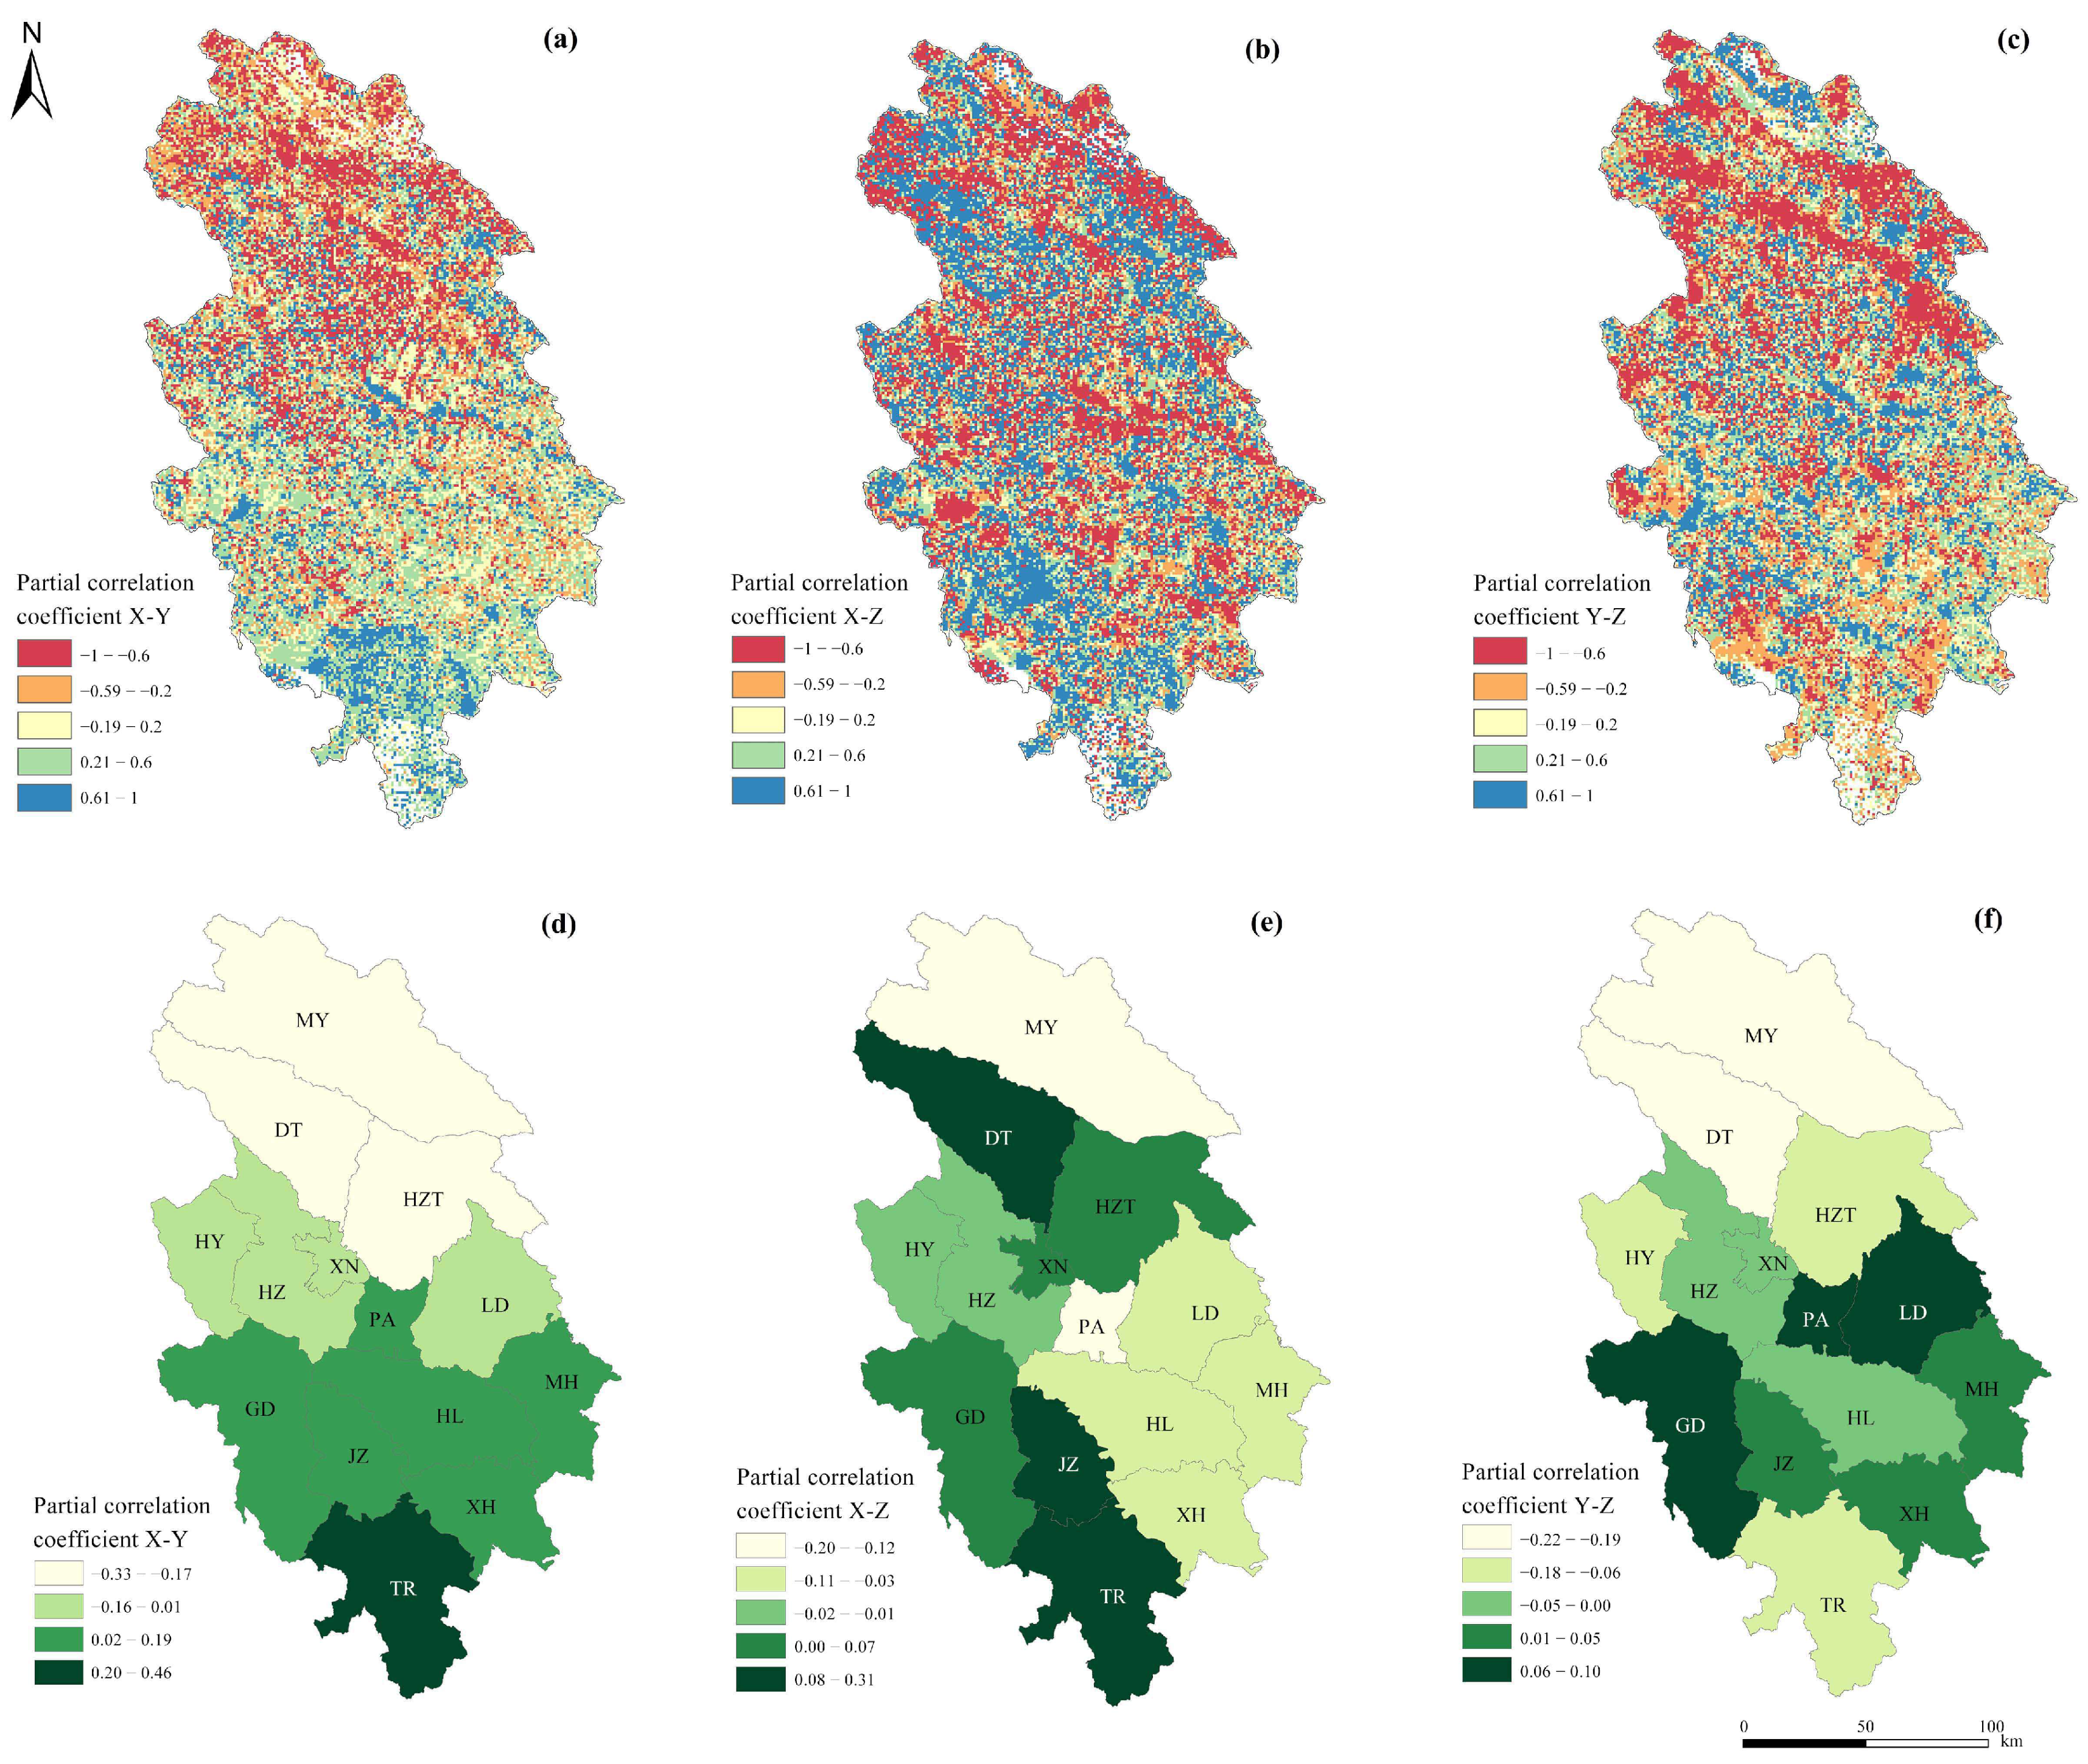
3.2.2. Partial Correlation Coefficients of Land Use Multifunctionality

Figure 9 depicts the partial correlation coefficients between the ecological and social functions, social and economic production functions, and ecological and economic production functions of land spanning from 2000 to 2020. Overall, the correlation between the economic production function and the ecological function of land tends to be negative. Spatially, areas exhibiting negative partial correlation coefficients are predominantly clustered in the northern section of the study area, whereas those with positive coefficients are primarily found in the southern and central regions. In general, the partial correlation coefficient between the economic production function and the social function of land is positive in most regions. Spatially, there is no clear distribution pattern as research units with negative partial correlation coefficients and those with positive coefficients are interspersed. Similarly, the partial correlation coefficient between the ecological function and the social function of land is negative in most regions. The spatial distribution of units with negative and positive partial correlation coefficients for ecological and social functions is interwoven, similar to the spatial distribution pattern of economic production and social functions, without a clear distribution feature. We conducted an analysis of the partial correlation coefficients between land use functions for the 14 counties and cities within the Hehuang Valley. The results were visualized using average values to show the spatial distribution. The partial correlation coefficient between the economic production function and the ecological function of land ranges from −0.33 to 0.46 for each county, increasing progressively from the northern counties (Menyuan County, Datong County, and Huzhu County) to the southern counties (Tongren County, Jianzha County, and Guide County). The partial correlation coefficient between the economic production function and the social function of land ranges from −0.20 to 0.31, with Menyuan County and Ping’an District showing a stronger trade-off. The partial correlation coefficient between the ecological function and the social function of land ranges from −0.22 to 0.1, with Ledou District and Ping’an District showing weaker synergies.
To further explore the trade-offs and synergies between land use functions in each county, we classified the synergies into four types (Table 5). These include synergy (+++) and trade-off (–––), which indicate that all three land use functions exhibit a synergy or trade-off within the same county, and synergy (++–) and trade-off (––+), which indicate that two of the three land use functions show a synergy or trade-off within the same county. The detailed results can be found in Table 5. Guide County and Jianzha County are the counties with the strongest synergies between land use functions, whereas Huangyuan County, Menyuan County, and Huangzhong County have the strongest trade-offs.

3.3. Influencing Factors of Spatiotemporal Changes in Land Use Function Levels in the Hehuang Valley

3.3.1. Influencing Factors of the Spatial Distribution of Land Use Functions

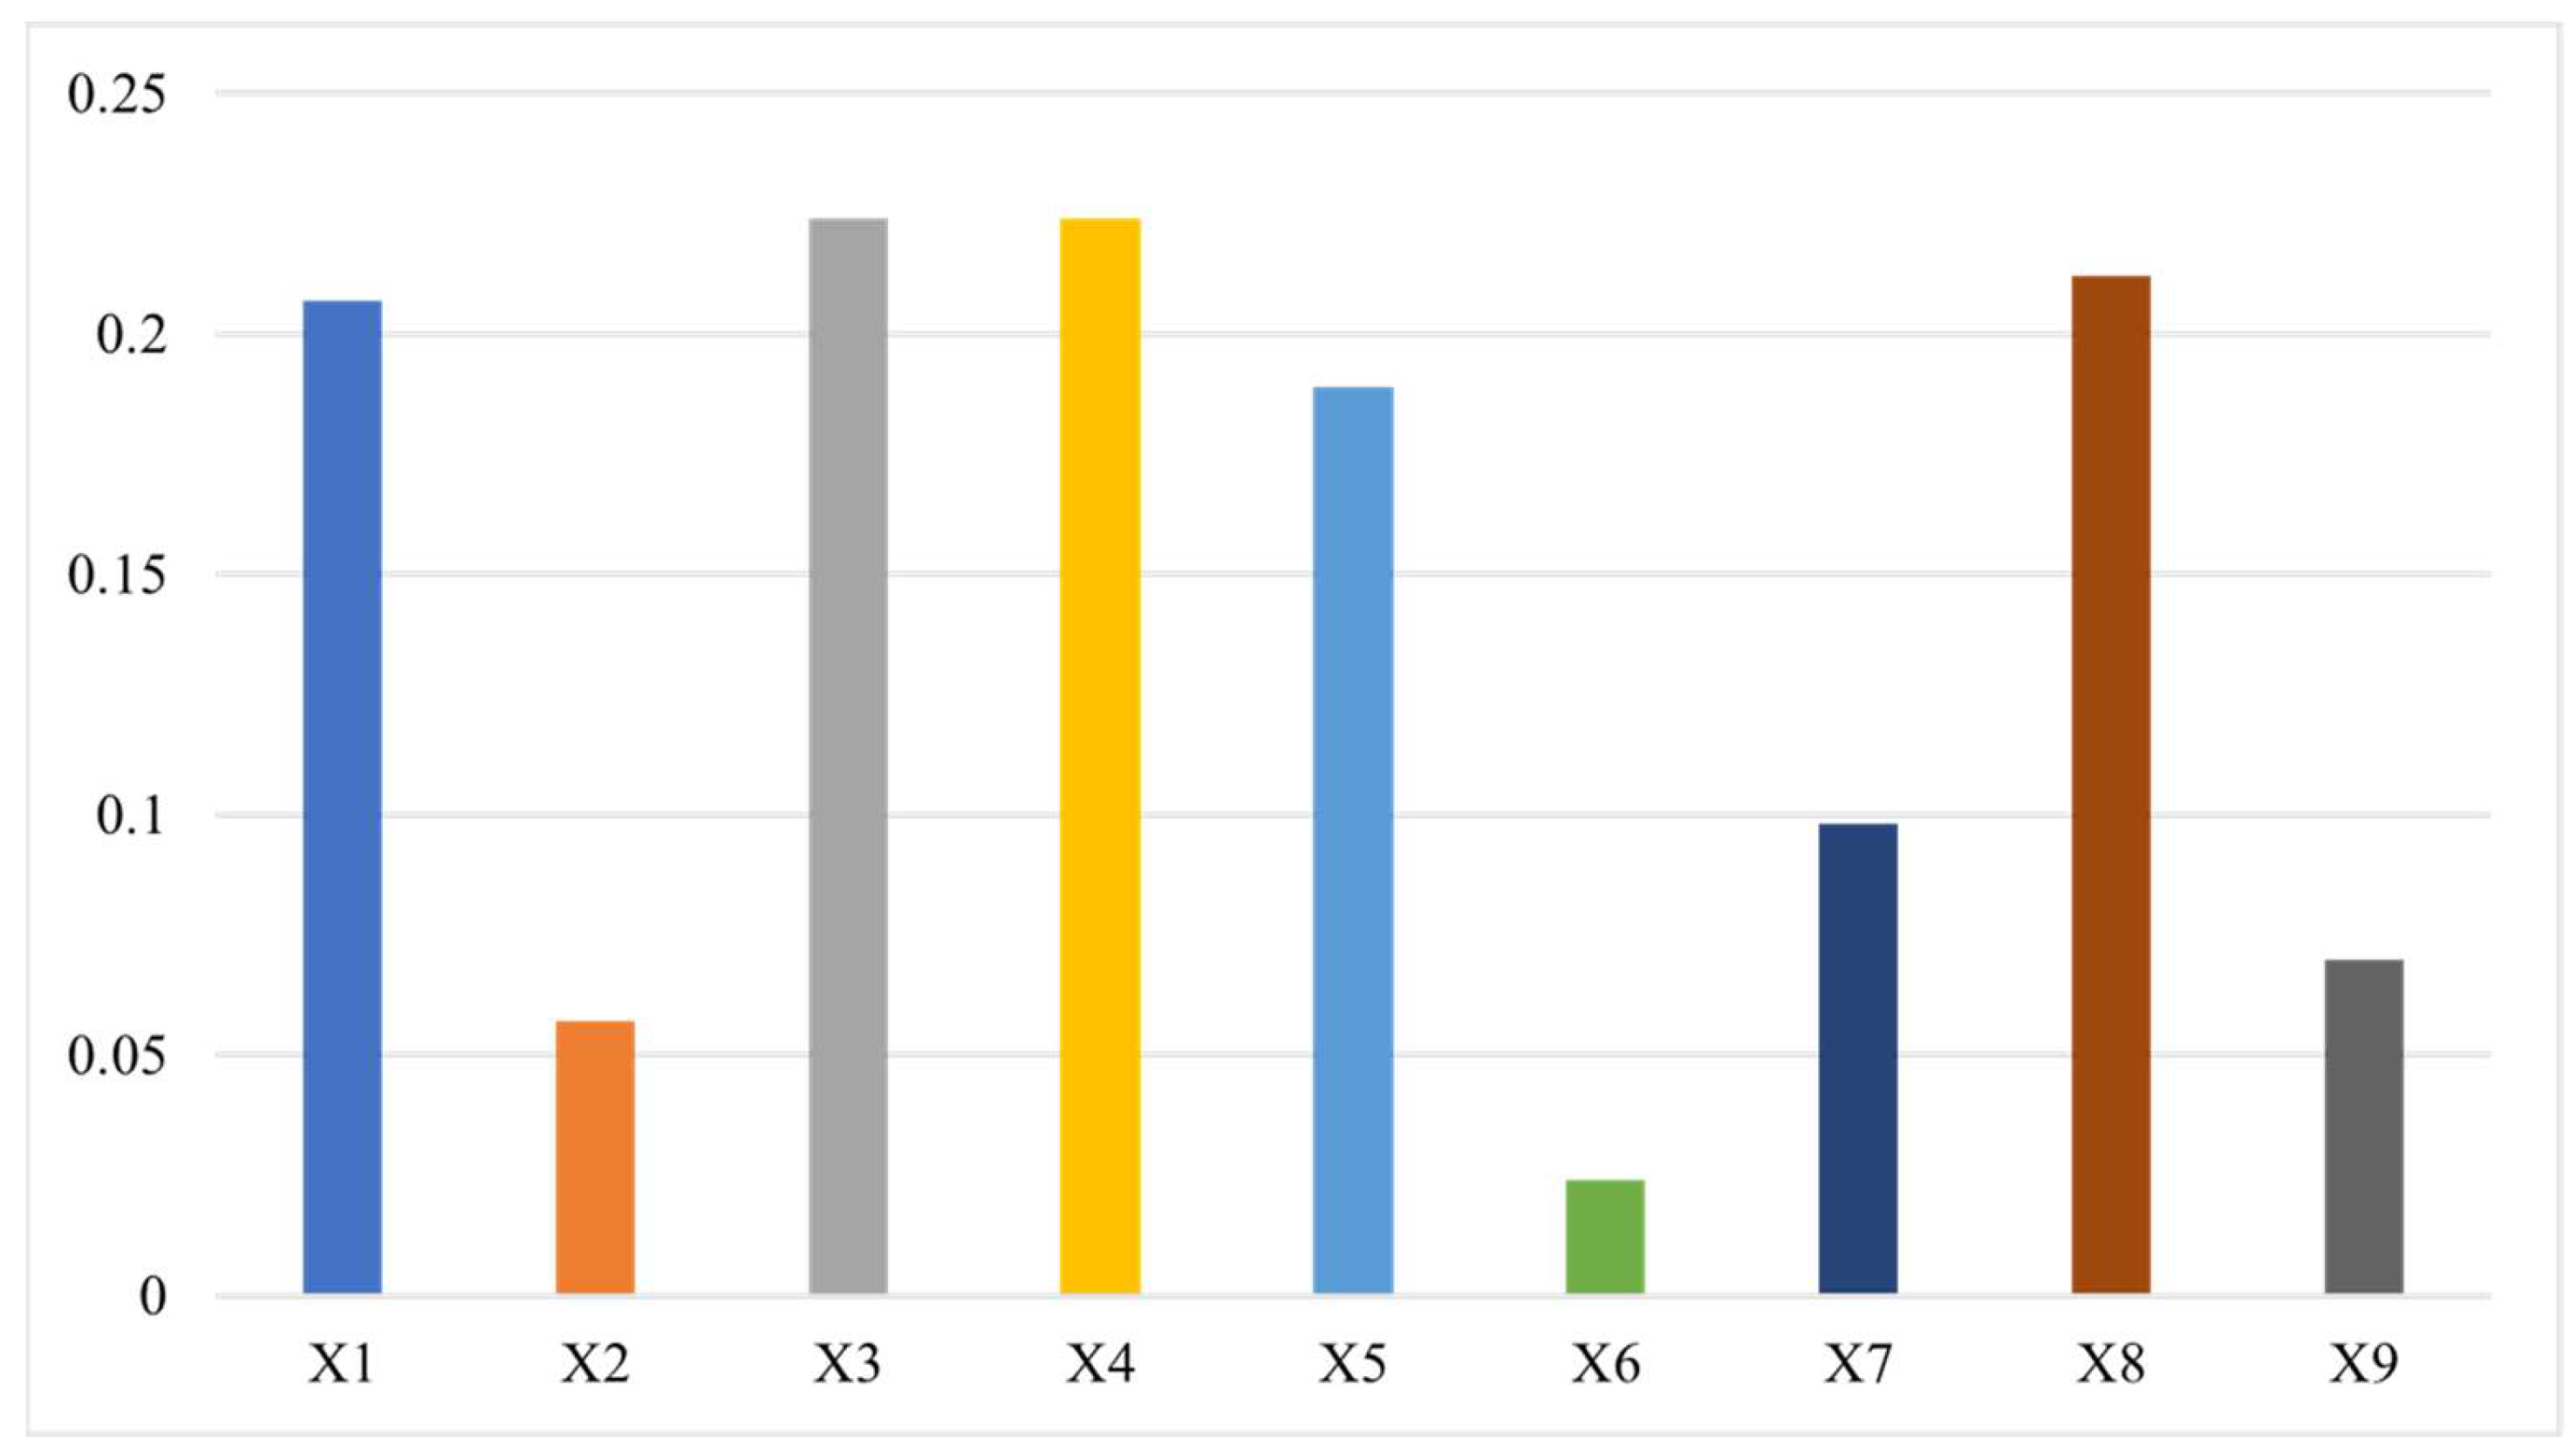
A geographical detector was utilized to analyze the driving factors of the spatial distribution of comprehensive land use functions in the Hehuang Valley. The results of the factor detection indicate the explanatory power of nine factors on the spatial variation of comprehensive functions. The factors, ranked in order of their explanatory power on changes in comprehensive land function (Y), are as follows: precipitation (X4) > temperature (X3) > land use intensity (X8) > elevation (X1) > distance to county (X5) > farmland non-agricultural rate (X7) > human activity intensity (X9) > slope (X2) > distance to city (X6). Precipitation, land use intensity, temperature, elevation, and distance to county have the highest q-values (Figure 10).
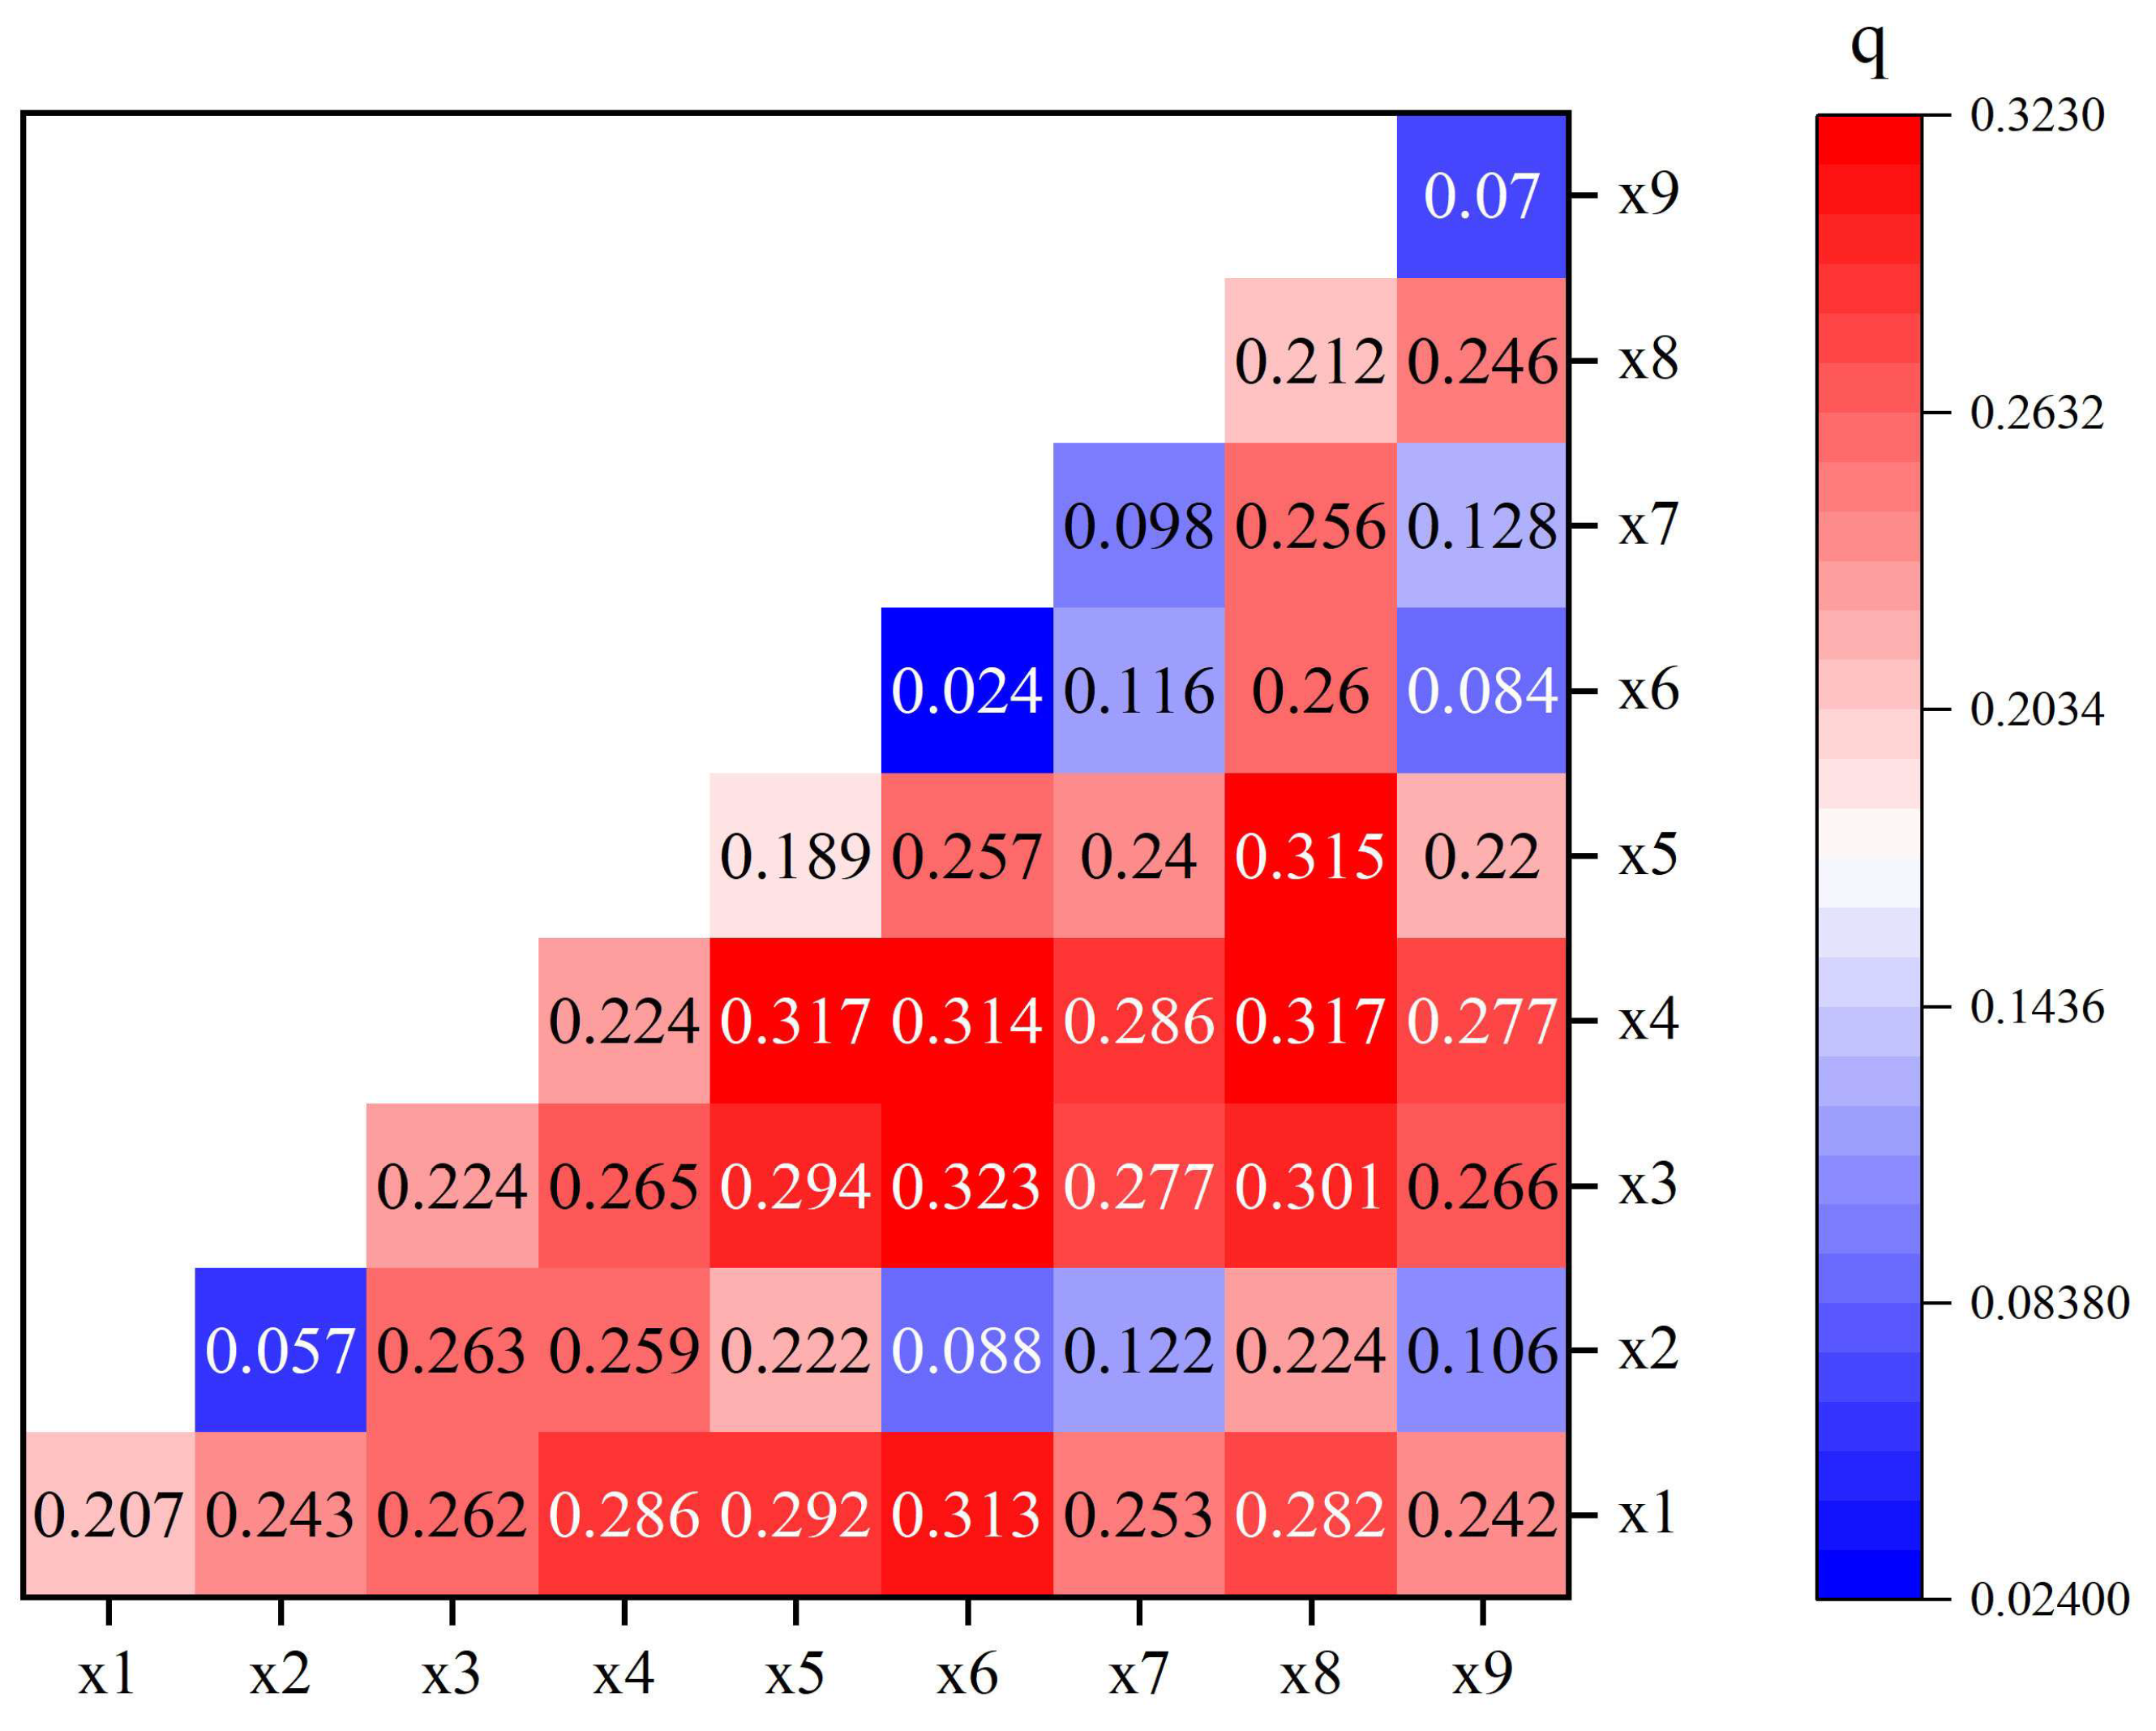
The results of the interaction detection (Figure 11) indicate that the interactions between factors exhibit both two-factor enhancement and non-linear enhancement relationships, suggesting that the comprehensive land use function is a result of the combined effects of multiple influencing factors. The highest interaction explanatory q-value is 0.323, for the interaction between temperature and distance to city (X3∩X6), which demonstrates the strongest explanatory power for the comprehensive land function. The q-values for the interactions between precipitation and distance to county (X4∩X5), precipitation and distance to city (X4∩X6), precipitation and land use intensity (X4∩X8), distance to county and land use intensity (X5∩X8), and elevation and distance to city (X1∩X6) are all above 0.31, indicating a very strong explanatory power for the spatial distribution of comprehensive land use functions.

3.3.2. Temporal Changes in Land Use Function Drivers in the Hehuang Valley

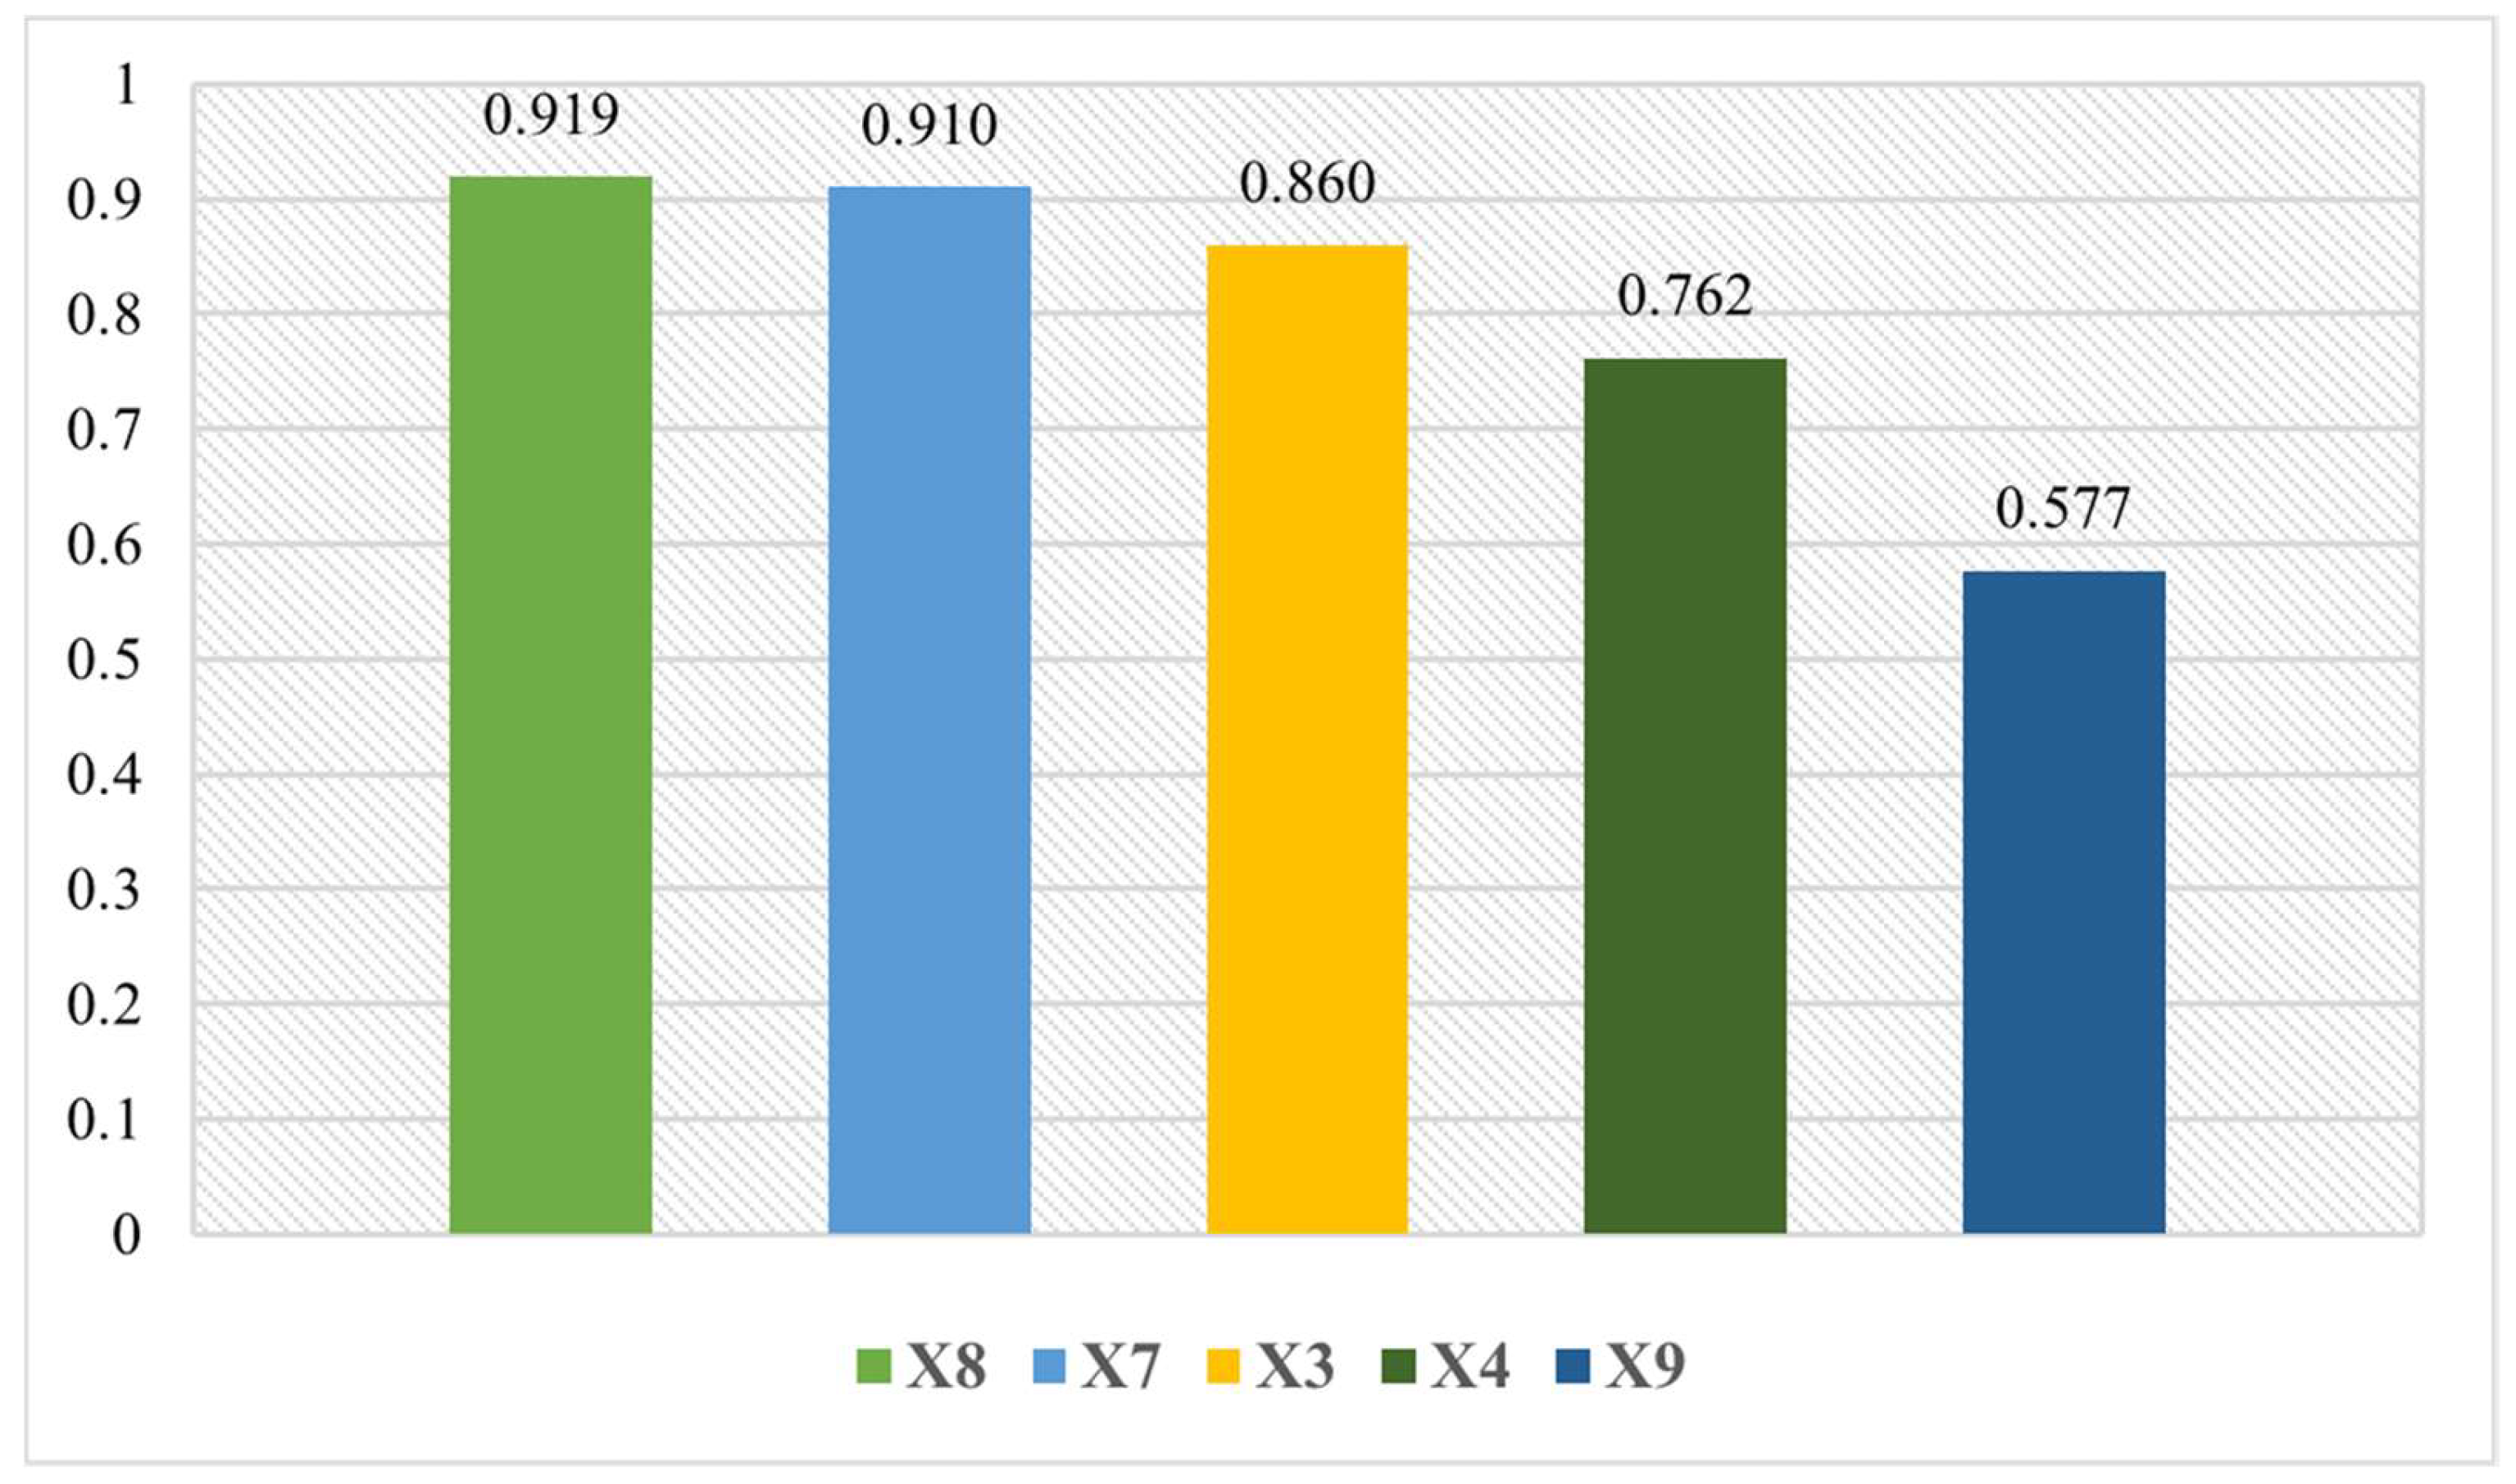
A geographical detector method was used to conduct a spatial analysis of the driving factors for land use functions, resulting in the identification of key factors. Factors with minimal temporal variation were excluded, and factors X3, X4, X7, X8, and X9 were selected for further analysis. However, the geographical detector method can only explore driving factors spatially and not temporally. Thus, a grey relational model was employed to investigate the association between land use multifunctionality and driving factors over time. This model identified the main factors influencing changes in land use multifunctionality, with land use intensity, farmland non-agriculturalization rate, temperature, precipitation, and human activity intensity ranking as the primary influences (Figure 12). Specifically, land use intensity (X8) and farmland non-agriculturalization rate (X7) were found to be the main driving factors for the temporal variation in land use multifunctionality.

4. Discussion

4.1. Understanding the Changes and Interactions of Multifunctional Land Use

The results show that the spatial variation of land use multifunctionality in the Hehuang Valley presents a certain regularity. High-value regions in the spatial distribution of land use multifunctionality are predominantly clustered in the central and north-central sections of the study area, contrasting with low-value areas concentrated in the northern, south-central, and southern parts of the Hehuang Valley. On a spatial scale, precipitation (X4) primarily influences regional climate and water resource supply, thus affecting the overall level and interactions of land use multifunctions [67]. Areas with higher precipitation may experience greater crop yields and attract more human activities, thereby enhancing the region’s land economic production function and land social function. As for the temperature (X3) indicator, the significant variation in daily temperatures in the Hehuang Valley, with high daytime temperatures promoting robust photosynthesis, contributes to crop growth [68,69]. Additionally, suitable temperatures and cultivation environments favor human habitation, providing a high interaction explanatory power for production and living functions. The spatial distribution of land use multifunctionality is primarily influenced by regional background conditions because of the complex landforms and the climate of the Hehuang Valley. Located on the Qinghai-Tibet Plateau, the area has high overall elevation, with population and economic activity concentrated in lower-elevation basins, while higher-elevation areas remain uninhabited and unused. Elevation plays a crucial role in determining the land use structure in the valley, as it also influences temperature and precipitation changes. Although precipitation and temperature explain the spatial distribution of land use multifunctionality, elevation fundamentally determines the distribution of comprehensive land functions. The combined effects of multiple factors contribute to the complexity of factors influencing the spatial variation of comprehensive land functions.
Figure 3 shows that the comprehensive land use function level in the Hehuang Valley has increased from 2000 to 2020. Land use intensity (X8) and agricultural land non-agriculturalization rate (X7) are the main driving factors affecting the temporal changes in the comprehensive functions of land use. Land use intensity reflects changes in land use structure, which have been continuously increasing in the Hehuang Valley from 2000 to 2020. This rise can be attributed to the expansion of agricultural land, construction land, forest, grassland, and water areas. However, this intensifying land use presents challenges to the sustainability of agricultural production due to non-agriculturalization [70]. Additionally, the farmland non-agriculturalization rate also increased during this period, reflecting the continuous expansion of construction land and socioeconomic development. Thus, land use intensity and the farmland non-agriculturalization rate are the primary drivers of the temporal changes in land use multifunctionality. High-intensity human activities can have a negative impact on climate, soil, and biodiversity [71,72], increasing the trade-offs between production and living functions, as well as between living and ecological functions. The results of the interactive detection reveal that the interaction between human activity intensity and slope (X9∩X2), the distance to the city (X9∩X6), and the farmland non-agriculturalization rate (X9∩X7) are relatively weak, with values of 0.106, 0.084, and 0.128, respectively. This suggests that human activity intensity significantly affects the interaction between production and living functions, while its impact on interactions among other factors is minimal, consistent with previous research findings [23].
Maintaining a balance and synergy between the economic production function, ecological function, and living function of land is crucial for effective land resource management [73,74,75]. Research conducted in the Hehuang Valley reveals a trade-off between the economic production function and ecological function of land, which agrees with previous studies [73,74]. There is also a trade-off between the ecological function and living function of land. Human activities and behaviors can affect the ecological function of land. Uncontrolled urbanization, excessive industrialization, and unsustainable agricultural practices can result in soil degradation, water pollution, and loss of biodiversity, consequently impacting the quality of human life [76,77]. Therefore, it becomes essential to consider the balance and co-ordination of these three functions in policy-making and decision-making processes.

4.2. Policy Implications

Rational land planning and management can play a crucial role in protecting the ecological environment, improving the quality of human life, and promoting economic development [78]. Different areas within the Hehuang Valley exhibit varied land use characteristics, necessitating tailored strategies.
In areas with relatively low comprehensive land use functions, like Menyuan County, Tongren County, Guide County, and Jianzha County, the primary constraints are low levels of economic production and social functions. These regions should prioritize enhancing these two aspects. Leveraging their favorable agricultural production conditions, these areas can maximize the economic production functions of the land by focusing on livestock products, wheat, and barley while also incorporating industrial, service, and ecological products. However, it is crucial to restrict large-scale, high-intensity industrial development to preserve and enhance the agricultural production capacity of the region. The land use strategy should mainly revolve around arable and grassland, protecting and integrating high-quality arable and grassland through stringent protection policies. Strengthening agricultural infrastructure, ensuring stability in grain and livestock production, and enhancing comprehensive agricultural production capacity are of the utmost importance for ensuring a steady supply of primary agricultural and livestock products for the entire province. To address China’s shortage of arable land reserves, the mechanisms of “occupying and replenishing balance” and “in-out balance” should be reasonably promoted and strictly implemented. The “occupying and replenishing balance” mechanism allows for the restoration of orchards and forest land to arable land, as outlined in the 2022 Arable Land Occupying and Replenishing Balance Management Measures. On the other hand, the essence of the “in-out balance” system is to co-ordinate the conversion relationships between arable land and other agricultural land, striking a balance between land protection and efficient use of other agricultural land to fulfill diverse land use demands. These mechanisms provide flexibility for economic development in the Hehuang Valley, aiding the development of regions with lower land function levels.
In areas such as Xining City and Huangzhong County, where land use multifunctionality is relatively high, there exist trade-offs between different functions. The primary objective in these areas is to protect and restore the ecological environment, with specific attention given to the human–land relationship. It is crucial to guide population concentration in urban areas in alignment with the capacity of resources and the environment to ensure sustainable urban development. Emphasis should be placed on the protection of natural resources through large-scale afforestation projects. Additionally, strict policies such as mountain closure and forest and grassland cultivation should be implemented. The construction of soil and water conservation forests as well as artificial grasslands can help reduce the destruction of mountain vegetation. To rebuild and restore damaged ecosystems, comprehensive land consolidation policies that involve slope conversion to terraces and slope water system construction should be adopted. Overgrazing must be strictly prohibited, and control measures should be implemented to manage livestock carrying capacity. Industries that are compatible with available resources, such as specialty agriculture, forestry, animal husbandry, and agricultural and livestock product processing, should be developed in order to enhance the level of animal husbandry development. To enhance co-ordination between different land functions and minimize trade-offs, it is essential to strengthen land planning and management. Comprehensive land use planning and management policies should clearly define the boundaries and proportions of economic, ecological, and residential land. Planning should consider the multifunctionality and sustainability of land use, avoiding excessive development and resource wastage. Efficient land use and resource utilization can promote co-ordinated development between economic production and ecological functions. The adoption of modern agricultural technologies and production methods can increase farmland yield and value. Encouraging a circular economy and low-carbon development can reduce resource consumption and environmental pollution. The increased supervision of land development and utilization is necessary to prevent illegal land use and environmental damage. Establishing a robust land management system and monitoring network is important to promptly monitor land use conditions and environmental changes.

4.3. Limitations and Future Prospects

The multifunctional land use was evaluated on a grid scale, and an evaluation index system for multifunctional land use was established to identify the change characteristics from 2000 to 2020 in time and space in the Hehuang Valley. However, the evaluation index system for multifunctional land use, as presented in this paper, requires further refinement. Due to the limitations of spatializing data to a 1km raster scale, only nine indicators for land use functions were selected based on principles of indicator selection. It should be noted that these indicators need to be further improved to fully capture the multifunctionality of land use in the future. Some indicators that are closely related to the social function of land use, such as education and medical care, can be spatialized using big data methods. Adding indicators such as education, medical care, and employment to the social function assessment of land can provide a more complete and adequate assessment of the land social function. As the evaluation index system for multifunctional land use and the methods for spatializing indicators continue to improve, there will be opportunities to enhance the land use evaluation index system for the Hehuang Valley. The partial correlation coefficient between land use functions is calculated based on 1km grid data, resulting in a low overall average level, and only an overall relative analysis can be performed. The geographic detector and the grey correlation model are used to analyze the driving factors of spatial and temporal changes in the multifunctional level of land use, respectively, which is an innovation. In the future, the two methods can be integrated to jointly identify the spatiotemporal coupling relationship between land use functions and influencing factors. Moreover, about the selection of influencing factors, this paper selected nine influencing indicators from nature conditions, accessibility, and human factors based on existing research and the characteristics of the study area. Also, due to the limitations of spatializing data to a 1km raster scale, some more detailed indicators, like soil fertility, were not included. These limitations need to be improved further in the future.

5. Conclusions

This study used a 1 km raster scale as the research unit in the Hehuang Valley. By utilizing natural geographic data, socioeconomic statistical data, and land use-related data, we established a multifunctional land use evaluation index system for the Hehuang Valley. This system quantitatively assessed the ecological, social, economic production, and comprehensive functions of land use at a 1 km raster scale from 2000 to 2020. Further analysis was conducted on the spatiotemporal variations, interactions, and influencing factors of multifunctional land use levels in the Hehuang Valley. The findings of this study provide valuable theoretical references for the territorial spatial planning regarding land use in the Hehuang Valley, with the aim of enhancing land use efficiency and sustainability. The main conclusions are as follows:
(1) The comprehensive land use function index in the Hehuang Valley showed a steady increase from 2000 to 2020, reaching its highest value in 2020. Spatially, the areas with high and moderately high comprehensive function indices expanded in the central and northern regions from 2000 to 2020, while low-value areas in the northern and southern regions continuously decreased.
(2) In the factor detection analysis, the variables with the highest q-values were precipitation, land use intensity, temperature, elevation, and distance to the county seat, indicating that they had the greatest explanatory power for the spatial distribution of comprehensive land use functions. In the interaction detection analysis, the q-values for the following pairs of variables were above 0.31, suggesting that their interactions strongly explained the comprehensive land use functions: temperature and distance to the city (X3∩X6), precipitation and distance to the county seat (X4∩X5), precipitation and distance to the city (X4∩X6), precipitation and land use intensity (X4∩X8), distance to the county seat and land use intensity (X5∩X8), and elevation and distance to the city (X1∩X6). Using a grey relational model, the main driving factors influencing the comprehensive land use function in the Hehuang Valley over time were identified as land use intensity (X8) and the rate of farmland conversion to non-agricultural uses (X7).
(3) Among the counties analyzed, Guinan County and Jianzha County exhibited the strongest synergistic relationships among land use functions, whereas Hualong County, Menyuan County, and Huangzhong County showed the strongest trade-offs among land use functions.
According to the assessment results of multifunctional land use and their interrelationships in Hehuang Valley, differentiated land use planning measures should be implemented in areas with different land characteristics, such as the areas with relatively low comprehensive land use functions and the areas with high comprehensive land use functions but with trade-offs between different functions. In the process of policy formulation and decision-making, it is necessary to consider the balance and co-ordination of land ecology, economic production, and living functions, and adopt comprehensive measures and strategies to promote sustainable development.
In this study, due to the limitation of data spatialization to grid scale, the selected indicators were limited, which cannot fully represent the multifunctional land use and the influencing factors. With the improvement of the multifunctional land use evaluation system and the further development of the indicator spatialization method, the multifunctional land use evaluation system of the Hehuang Valley can be further improved in the future. This is conducive to the more accurate identification of land use function levels at a finer scale and provides more accurate scientific support for national space planning and ecological conservation.

Author Contributions

Conceptualization, Y.M., Q.M. and M.L.; funding acquisition, H.W.; investigation, Y.M.; methodology, Y.M.; visualization, W.J.; writing—original draft, Y.M.; writing—review and editing, H.W., Y.Z. and L.L. All authors have read and agreed to the published version of the manuscript.

Funding

This research was funded by the Second Tibetan Plateau Scientific Expedition and Research Program (2019QZKK0608), the Key project of Henan Provincial Science and Technology R&D Plan Joint Fund (225200810045), and the Science and Technology Research Project of Henan Province (222102320041).

Institutional Review Board Statement

Not applicable.

Data Availability Statement

The data presented in this study are available on request from the corresponding author.

Conflicts of Interest

The authors declare no conflicts of interest.

References

  1. Colglazier, W. Sustainable development agenda: 2030. Science 2015, 349, 1048–1050. [Google Scholar] [CrossRef] [PubMed]
  2. Verburg, P.H.; van de Steeg, J.; Veldkamp, A.; Willemen, L. From land cover change to land function dynamics: A major challenge to improve land characterization. J. Environ. Manag. 2009, 90, 1327–1335. [Google Scholar] [CrossRef] [PubMed]
  3. Schößer, B.; Helming, K.; Wiggering, H. Assessing Land Use Change Impacts—A Comparison of the SENSOR Land Use Function Approach with Other Frameworks. J. Land Use Sci. 2010, 5, 159–178. [Google Scholar]
  4. Zou, L.; Liu, Y.; Yang, J.; Yang, S.; Wang, Y.; Hu, X. Quantitative identification and spatial analysis of land use ecological-production-living functions in rural areas on China’s southeast coast. Habitat Int. 2020, 100, 102182. [Google Scholar] [CrossRef]
  5. Wiggering, H.; Dalchow, C.; Glemnitz, M.; Helming, K.; Müller, K.; Schultz, A.; Stachow, U.; Zander, P. Indicators for multifunctional land use—Linking socio-economic requirements with landscape potentials. Ecol. Indic. 2006, 6, 238–249. [Google Scholar] [CrossRef]
  6. Vereijken, P.H. Multifunctionality: Applying the OECD Framework, a Review of Literature in the Netherlands; OECD: Paris, France, 2001. [Google Scholar]
  7. Song, X.Q.; Ouyang, Z. Connotation of multifunctional cultivated land and its implications for cultivated land protection. Prog. Geogr. 2012, 31, 859–868. [Google Scholar]
  8. Pérez-Soba, M.; Petit, S.; Jones, L.; Bertrand, N.; Briquel, V.; Omodei-Zorini, L.; Contini, C.; Helming, K.; Farrington, J.H.; Tinacci Mossello, M.; et al. Land use functions—A multifunctionality approach to assess the impact of land use changes on land use sustainability. In Sustainability Impact Assessment of Land Use Changes; Helming, K., Pérez-Soba, M., Tabbush, P., Eds.; Springer: Berlin, Germany, 2008; pp. 375–404. [Google Scholar]
  9. De Groot, R.S. Function-analysis and valuation as a tool to assess land use conflicts in planning for sustainable, multi-functional landscapes. Landsc. Urban Plan. 2006, 75, 175–186. [Google Scholar] [CrossRef]
  10. Burkhard, B.; Kroll, F.; Müller, F.; Windhorst, W. Landscapes’ Capacities to Provide Ecosystem Services—A Concept for Land-Cover Based Assessments. Landsc. Online 2009, 15, 1–22. [Google Scholar] [CrossRef]
  11. Zhen, L.; Chao, S.Y.; Wei, Y.J.; Xie, G.D.; Li, F.; Yang, L. Land use functions: Conceptual framework and application for China. Resour. Sci. 2009, 31, 544–551. [Google Scholar]
  12. Xie, G.; Zhen, L.; Zhang, C.; Deng, X.; Koenig, H.J.; Tscherning, K.; Helming, K. Assessing the multifunctionalities of land use in China. J. Resour. Ecol. 2010, 1, 311–318. [Google Scholar]
  13. Yin, R.; Li, X.; Fang, B. The Relationship between the Spatial and Temporal Evolution of Land Use Function and the Level of Economic and Social Development in the Yangtze River Delta. Int. J. Environ. Res. Public Health 2023, 20, 2461. [Google Scholar] [CrossRef] [PubMed]
  14. Xiang, H.; Yang, Q.-Y.; Su, K.-c.; Zhang, Z.-X. Spatiotemporal Dynamics and Obstacles of the Multi-Functionality of Land Use in Xiangxi, China. Appl. Sci. 2019, 9, 3649. [Google Scholar] [CrossRef]
  15. Lin, S.G.; Lu, R.C.; Liu, S.K.; Ye, Z.D.; Wei, Q.T.; Luo, J.L. Land use pattern and multifunctional evolution in the border areas in the Guangxi Zhuang Autonomous Region based on “production-living-ecosystem” space. Trans. Chin. Soc. Agric. Eng. 2021, 1817, 265–274. [Google Scholar]
  16. Reidsma, P.; König, H.; Feng, S.; Bezlepkina, I.; Nesheim, I.; Bonin, M.; Sghaier, M.; Purushothaman, S.; Sieber, S.; van Ittersum, M.K.; et al. Methods and tools for integrated assessment of land use policies on sustainable development in developing countries. Land Use Policy 2011, 28, 604–617. [Google Scholar] [CrossRef]
  17. Plieninger, T.; Torralba, M.; Hartel, T.; Fagerholm, N. Perceived ecosystem services synergies, trade-offs, and bundles in European high nature value farming landscapes. Landsc. Ecol. 2019, 34, 1565–1581. [Google Scholar] [CrossRef]
  18. Drescher, J.; Rembold, K.; Allen, K.; Beckschäfer, P.; Buchori, D.; Clough, Y.; Faust, H.; Fauzi, A.M.; Gunawan, D.; Hertel, D.; et al. Ecological and socio-economic functions across tropical land use systems after rainforest conversion. Philos. Trans. R. Soc. B Biol. Sci. 2016, 371, 20150275. [Google Scholar] [CrossRef]
  19. Manning, P.; van der Plas, F.; Soliveres, S.; Allan, E.; Maestre, F.T.; Mace, G.; Whittingham, M.J.; Fischer, M. Redefining ecosystem multifunctionality. Nat. Ecol. Evol. 2018, 2, 427–436. [Google Scholar] [CrossRef]
  20. Kienast, F.; Bolliger, J.; Potschin, M.; de Groot, R.S.; Verburg, P.H.; Heller, I.; Wascher, D.; Haines-Young, R. Assessing landscape functions with broad-scale environmental data: Insights gained from a prototype development for Europe. Environ. Manag. 2009, 44, 1099–1120. [Google Scholar] [CrossRef]
  21. Paracchini, M.L.; Pacini, C.; Jones, M.L.M.; Pérez-Soba, M. An aggregation framework to link indicators associated with multifunctional land use to the stakeholder evaluation of policy options. Ecol. Indic. 2011, 11, 71–80. [Google Scholar] [CrossRef]
  22. Xue, D. Research on the Spatiotemporal Evolution of Land Use Functions and Its Coupling Relationship with Human Well-Being: A Case Study of Hehuang Valley. Master’s Thesis, The Henan Agricultural University, Zhengzhou, China, 2023. [Google Scholar]
  23. Zhu, C.; Dong, B.; Li, S.; Lin, Y.; Shahtahmassebi, A.R.; You, S.; Zhang, J.; Gan, M.; Yang, L.; Wang, K. Identifying the Trade-Offs and Synergies among Land Use Functions and Their Influencing Factors from a Geospatial Perspective: A Case Study in Hangzhou, China. J. Clean. Prod. 2021, 314, 128026. [Google Scholar] [CrossRef]
  24. Yang, Y.; Ren, X.; Yan, J. Trade-offs or synergies? Identifying dynamic land use functions and their interrelations at the grid scale in urban agglomeration. Cities 2023, 140, 104384. [Google Scholar] [CrossRef]
  25. Huang, S.; Wang, Y.; Liu, R.; Jiang, Y.; Qie, L.; Pu, L. Identification of Land Use Function Bundles and Their Spatiotemporal Trade-Offs/Synergies: A Case Study in Jiangsu Coast, China. Land 2022, 11, 286. [Google Scholar] [CrossRef]
  26. Zhang, Y.; Long, H.; Tu, S.; Ge, D.; Ma, L.; Wang, L. Spatial Identification of Land Use Functions and Their Tradeoffs/Synergies in China: Implications for Sustainable Land Management. Ecol. Indic. 2019, 107, 105550. [Google Scholar] [CrossRef]
  27. Zhang, X.; Jin, X.; Fan, Y.; Liu, J.; Shan, W.; Zhou, Y. Spatial-temporal characteristics and coordination status of the land use function transition in Jiangsu province from 1995 to 2015. J. Nat. Resour. 2019, 34, 689–706. [Google Scholar] [CrossRef]
  28. Liu, Y.; Gao, Y.B.; Pan, Y.C.; Tang, L.N.; Tu, M.G. Spatial differentiation characteristics and trade-off or synergy relationships of rural multi-functions based on multi-source data. Sci. Geogr. Sin. 2021, 40, 2036–2050. [Google Scholar]
  29. Li, X.; Fang, B.; Yin, R.; Rong, H. Spatial-temporal change and collaboration/trade-off relationship of “production-living-ecological” functions in county area of Jiangsu province. J. Nat. Resour. 2019, 34, 2363–2377. [Google Scholar]
  30. Song, W.; Deng, X.Z. Land-use/land-cover change and ecosystem service provision in China. Sci. Total Environ. 2016, 576, 705–719. [Google Scholar] [CrossRef]
  31. Wang, J.; Chen, Y.; Shao, X.; Zhang, Y.; Cao, Y. Land-use changes and policy dimension driving forces in China: Present, trend and future. Land Use Policy 2012, 29, 737–749. [Google Scholar] [CrossRef]
  32. Wang, J.; Lin, Y.; Glendinning, A.; Xu, Y. Land-use changes and land policies evolution in China’s urbanization processes. Land Use Policy 2018, 75, 375–387. [Google Scholar] [CrossRef]
  33. Liu, Y.; Huang, X.; Yang, H.; Zhong, T. Environmental effects of land-use/cover change caused by urbanization and policies in Southwest China Karst area—A case study of Guiyang. Habitat Int. 2014, 44, 339–348. [Google Scholar] [CrossRef]
  34. Foley, J.A.; DeFries, R.; Asner, G.P.; Barford, C.; Bonan, G.; Carpenter, S.R.; Carpenter, S.R.; Chapin, F.S.; Coe, M.T.; Daily, G.C.; et al. Global consequences of land use. Science 2005, 309, 570–574. [Google Scholar] [CrossRef] [PubMed]
  35. Li, X.; Wu, K.; Liang, Y. A Review of Agricultural Land Functions: Analysis and Visualization Based on Bibliometrics. Land 2023, 12, 561. [Google Scholar] [CrossRef]
  36. Liu, C.; Xu, Y.; Sun, P.; Liu, J. Progress and prospects of multi-functionality of land use research. Prog. Geogr. 2016, 35, 1087–1099. (In Chinese) [Google Scholar]
  37. Morizet-Davis, J.; Marting Vidaurre, N.A.; Reinmuth, E.; Rezaei-Chiyaneh, E.; Schlecht, V.; Schmidt, S.; Singh, K.; Vargas-Carpintero, R.; Wagner, M.; Von Cossel, M. Ecosystem Services at the Farm Level—Overview, Synergies, Trade-Offs and Stakeholder Analysis. Glob. Chall. 2023, 7, 2200225. [Google Scholar] [CrossRef] [PubMed]
  38. Adolph, B.; Allen, M.; Beyuo, E.; Banuoku, D.; Barrett, S.; Bourgou, T.; Bwanausi, N.; Dakyaga, F.; Derbile, E.K.; Gubbels, P.; et al. Supporting smallholders’ decision making: Managing trade-offs and synergies for sustainable agricultural intensification. Int. J. Agric. Sustain. 2020, 19, 456–473. [Google Scholar] [CrossRef]
  39. Peng, J.; Chen, X.; Liu, Y.; Lü, H.; Hu, X. Spatial identification of multifunctional landscapes and associated influencing factors in the beijing-tianjin-hebei region, China. Appl. Geogr. 2016, 74, 170–181. [Google Scholar] [CrossRef]
  40. Shao, Y.; Xiao, Y.; Sang, W. Land Use Trade-Offs and Synergies Based on Temporal and Spatial Patterns of Ecosystem Services in South China. Ecol. Indic. 2022, 143, 109335. [Google Scholar] [CrossRef]
  41. Zhang, Y.; Liu, X.; Ren, J.; Xu, Y. Study on cultivated land use transformation based on multi-functional trade-off and collaborative analysis of cultivated land—A case study of Beijing. Chin. J. Agric. Resour. Reg. Plan. 2020, 41, 25–33. [Google Scholar]
  42. Fan, Y.; Jin, X.; Gan, L.; Jessup, L.H.; Pijanowski, B.C.; Yang, X.; Xiang, X.; Zhou, Y. Spatial identification and dynamic analysis of land use functions reveals distinct zones of multiple functions in eastern China. Sci. Total Environ. 2018, 642, 33–44. [Google Scholar] [CrossRef]
  43. Zhu, J.; Gong, J.; Li, J. Spatiotemporal change of habitat quality in ecologically sensitive areas of eastern Qinghai-Tibet Plateau: A case study of the Hehuang Valley, Qinghai Province. Resour. Sci. 2020, 42, 991–1003. [Google Scholar] [CrossRef]
  44. Hou, G.; Xu, C.; Li, X.; Qi, B. Spatial Pattern of Water Conservation Function in Hehuang Valley. Ecol. Sci. 2021, 40, 169–176. (In Chinese) [Google Scholar]
  45. Gong, J.; Li, J.; Yang, J.; Li, S.; Tang, W. Land Use and Land Cover Change in the Qinghai Lake Region of the Tibetan Plateau and Its Impact on Ecosystem Services. Int. J. Environ. Res. Public Health 2017, 14, 818. [Google Scholar] [CrossRef] [PubMed]
  46. Li, X.; Xin, Z.; Yang, J.; Liu, J. The spatiotemporal changes and influencing factors of vegetation NDVI in the Hehuang Valley of Qinghai Province from 2000 to 2020. J. Soil Water Conserv. 2023, 13, 79–90. [Google Scholar]
  47. Guo, R.; Liu, F.G.; Chen, Q.; Zhou, Q.; Gu, X.J.; Cai, X.C.M. Reconstruction of cultivated land pattern in the upper reaches of the Yellow River in the late Northern Song Dynasty: Take Hehuang Valley as an example. J. Nat. Resour. 2021, 36, 27–37. [Google Scholar]
  48. Chen, R.; Zhou, Q.; Liu, F.; Zhang, Y.; Chen, Q.; Chen, Y. Contribution of climate change to food yield in Yellow River-Huangshui River Valley. Hubei Agric. Sci. 2018, 57, 114–119. (In Chinese) [Google Scholar]
  49. Wu, Y.; Shi, K.; Chen, Z.; Liu, S.; Chang, Z. Developing Improved Time-Series DMSP-OLS-Like Data (1992–2019) in China by Integrating DMSP-OLS and SNPP-VIIRS. IEEE Trans. Geosci. Remote Sens. 2022, 60, 4407714. [Google Scholar] [CrossRef]
  50. Zhu, W.Q.; Pan, Y.Z.; Zhang, J.S. Estimation of net primary productivity of Chinese terrestrial Vegetation based on remote sensing. J. Plant Ecol. 2007, 31, 413–424. [Google Scholar]
  51. Sharp, R.; Douglass, J.; Wolny, S.; Arkema, K.; Bernhardt, J.; Bierbower, W.; Chaumont, N.; Denu, D.; Fisher, D.; Glowinski, K.; et al. InVEST 3.10.2. User’s Guide; The Natural Capital Project, Stanford University: Stanford, CA, USA, 2020. [Google Scholar]
  52. Renard, K.G. Predicting Soil Erosion by Water: A guide to Conservation Planning with the Revised Universal Soil Loss Equation (RUSLE); United States Department of Agriculture: Washington, DC, USA, 1997. [Google Scholar]
  53. Angima, S.D.; Stott, D.E.; O’Neill, M.K.; Ong, C.K.; Weesies, G.A. Soil erosion prediction using RUSLE for central Kenyan highland conditions. Agric. Ecosyst. Environ. 2003, 97, 295–308. [Google Scholar] [CrossRef]
  54. Ren, J.; Ma, R.R.; Huang, Y.H.; Wang, Q.X.; Guo, J.; Li, C.Y.; Zhou, W. Identifying the trade-offs and synergies of land use functions and their influencing factors of Lanzhou-xining urban agglomeration in the upper reaches of Yellow River Basin, China. Ecol. Indic. 2024, 158, 111279. [Google Scholar] [CrossRef]
  55. Liu, C.; Xu, Y.Q.; Huang, A.; Li, Y.X.; Wang, H.; Lu, L.H.; Sun, P.L.; Zheng, W. Spatial identification of land use multifunctionality at grid scale in farming-pastoral area: A case study of Zhangjiakou City, China. Habitat Int. 2018, 76, 48–61. [Google Scholar] [CrossRef]
  56. Xie, G.; Zhen, L.; Lu, C.-X.; Xiao, Y.; Chen, C. Expert knowledge based valuation method of ecosystem services in China. J. Nat. Resour. 2008, 23, 911–919. (In Chinese) [Google Scholar]
  57. Wei, H.; Han, Q.; Yang, Y.; Li, L.; Liu, M. Spatial Heterogeneity of Watershed Ecosystem Health and Identification of Its Influencing Factors in a Mountain–Hill–Plain Region, Henan Province, China. Remote Sens. 2023, 15, 3751. [Google Scholar] [CrossRef]
  58. Meng, Q.; Zhang, L.; Wei, H.; Cai, E.; Xue, D.; Liu, M. Linking Ecosystem Service Supply–Demand Risks and Regional Spatial Management in the Yihe River Basin, Central China. Land 2021, 10, 843. [Google Scholar] [CrossRef]
  59. Zhao, J.; Yang, D.H.; Pan, J.H. A study on spatial pattern of GDP in Lanzhou City based on spatialization and land utilization. J. Northwest Norm. Univ. 2010, 46, 92–96+102. [Google Scholar]
  60. Zhang, Y.Y.; Cai, X.B.; Yang, C.; Song, X.X.; Li, R.D.; Li, E.H.; Wang, X.L. Driving force analysis of landscape pattern changes in Honghu Wetland Nature Reserve in recent 40 years. J. Lake Sci. 2019, 31, 171–182. [Google Scholar]
  61. Wang, J.-F.; Li, X.-H.; Christakos, G.; Liao, Y.-L.; Zhang, T.; Gu, X.; Zheng, X.-Y. Geographical detectors-based health risk assessment and its application in the neural tube defects study of the Heshun Region, China. Int. J. Geogr. Inf. Sci. 2010, 24, 107–127. [Google Scholar] [CrossRef]
  62. Kuo, Y.; Yang, T.; Huang, G.W. The use of grey relational analysis in solving multiple attribute decision-making problems. Comput. Ind. Eng. 2008, 55, 80–93. [Google Scholar] [CrossRef]
  63. Long, H.; Ge, D.; Zhang, Y.; Tu, S.; Qu, Y.; Ma, L. Changing man-land interrelations in China’s farming area under urbanization and its implications for food security. J. Environ. Manag. 2018, 209, 440–451. [Google Scholar] [CrossRef]
  64. King, R.S.; Baker, M.E.; Whigham, D.F.; Weller, D.E.; Jordan, T.E.; Kazyak, P.F.; Hurd, M.K. Spatial considerations for linking watershed land cover to ecological indicators in streams. Ecol. Appl. 2005, 15, 137–153. [Google Scholar] [CrossRef]
  65. Wei, H.; Fan, W.; Ding, Z.; Weng, B.; Xing, K.; Wang, X.; Lu, N.; Ulgiati, S.; Dong, X. Ecosystem Services and Ecological Restoration in the Northern Shaanxi Loess Plateau, China, in Relation to Climate Fluctuation and Investments in Natural Capital. Sustainability 2017, 9, 199. [Google Scholar] [CrossRef]
  66. Zhen, L.; Wei, Y.; Xie, G.; Helming, K.; Cao, S.; Yang, L.; Pan, Y.; Koenig, H. Regional analysis of dynamic land use functions in China. Acta Ecol. Sin. 2010, 30, 6749–6761. [Google Scholar]
  67. Boone, R.B.; Conant, R.T.; Sircely, J.; Thornton, P.K.; Herrero, M. Climate change impacts on selected global rangeland ecosystem services. Glob. Change Biol. 2018, 24, 1382–1393. [Google Scholar] [CrossRef] [PubMed]
  68. Zhang, J.Y.; Li, X.M.; Lin, H.X.; Chong, K. Crop improvement through temperature resilience. Annu. Rev. Plant Biol. 2019, 70, 753–780. [Google Scholar] [CrossRef] [PubMed]
  69. Moore, C.E.; Meacham-Hensold, K.; Lemonnier, P.; Slattery, R.A.; Benjamin, C.; Bernacchi, C.J.; Lawson, T.; Cavanagh, A.P. The effect of increasing temperature on crop photosynthesis: From enzymes to ecosystems. J. Exp. Bot. 2021, 72, 2822–2844. [Google Scholar] [CrossRef] [PubMed]
  70. Xiao, R.; Liu, Y.; Huang, X.; Shi, R.; Yu, W.; Zhang, T. Exploring the driving forces of farmland loss under rapidurbanization using binary logistic regression and spatial regression: A case study of Shanghai and Hangzhou Bay. Ecol. Indic. 2018, 95, 455–467. [Google Scholar] [CrossRef]
  71. Li, B.J.; Chen, D.X.; Wu, S.H. Spatio-temporal assessment of urbanization impacts on ecosystem services: Case study of Nanjing City, China. Ecol. Indic. 2016, 71, 416–427. [Google Scholar] [CrossRef]
  72. Zhu, C.; Zhang, X.; Zhou, M.; He, S.; Gan, M.; Yang, L.; Wang, K. Impacts of urbanization and landscape pattern on habitat quality using OLS and GWR models in Hangzhou, China. Ecol. Indic. 2020, 117, 106654. [Google Scholar] [CrossRef]
  73. Zhao, J.; Zhao, Y. Synergy/trade-offs and differential optimization of production, living, and ecological functions in the Yangtze River Economic Belt, China. Ecol. Indic. 2023, 147, 109925. [Google Scholar] [CrossRef]
  74. Wang, Y.; Cheng, L.; Zheng, Y.; Wang, J.; Cui, H. Evolution of land use functions and their trade-offs/synergies relationship in resource-based cities. Ecol. Indic. 2024, 165, 112175. [Google Scholar] [CrossRef]
  75. Zhao, Y.; Liu, J.; Zhang, J.; Zhang, X.; Li, H.; Gao, F.; Zhan, Y. Spatial Identification and Evaluation of Land Use Multifunctions and Their Interrelationships Improve Territorial Space Zoning Management in Harbin, China. Land 2024, 13, 1092. [Google Scholar] [CrossRef]
  76. Okorondu, J.; Umar, N.A.; Ulor, C.O.; Onwuagba, C.G.; Diagi, B.E.; Ajiere, S.I.; Nwaogu, C. Anthropogenic Activities as Primary Drivers of Environmental Pollution and Loss of Biodiversity A Review. Int. J. Trend Sci. Res. Dev. 2022, 6, 621–643. [Google Scholar]
  77. Singh, R.L.; Singh, P.K. Global environmental problems. In Principles and Applications of Environmental Biotechnology for a Sustainable Future; Springer: Berlin/Heidelberg, Germany, 2017; pp. 13–41. [Google Scholar]
  78. Long, H.; Liu, Y.; Hou, X.; Li, T.; Li, Y. Effects of land use transitions due to rapid urbanization on ecosystem services: Implications for urban planning in the new developing area of China. Habitat Int. 2014, 44, 536–544. [Google Scholar] [CrossRef]
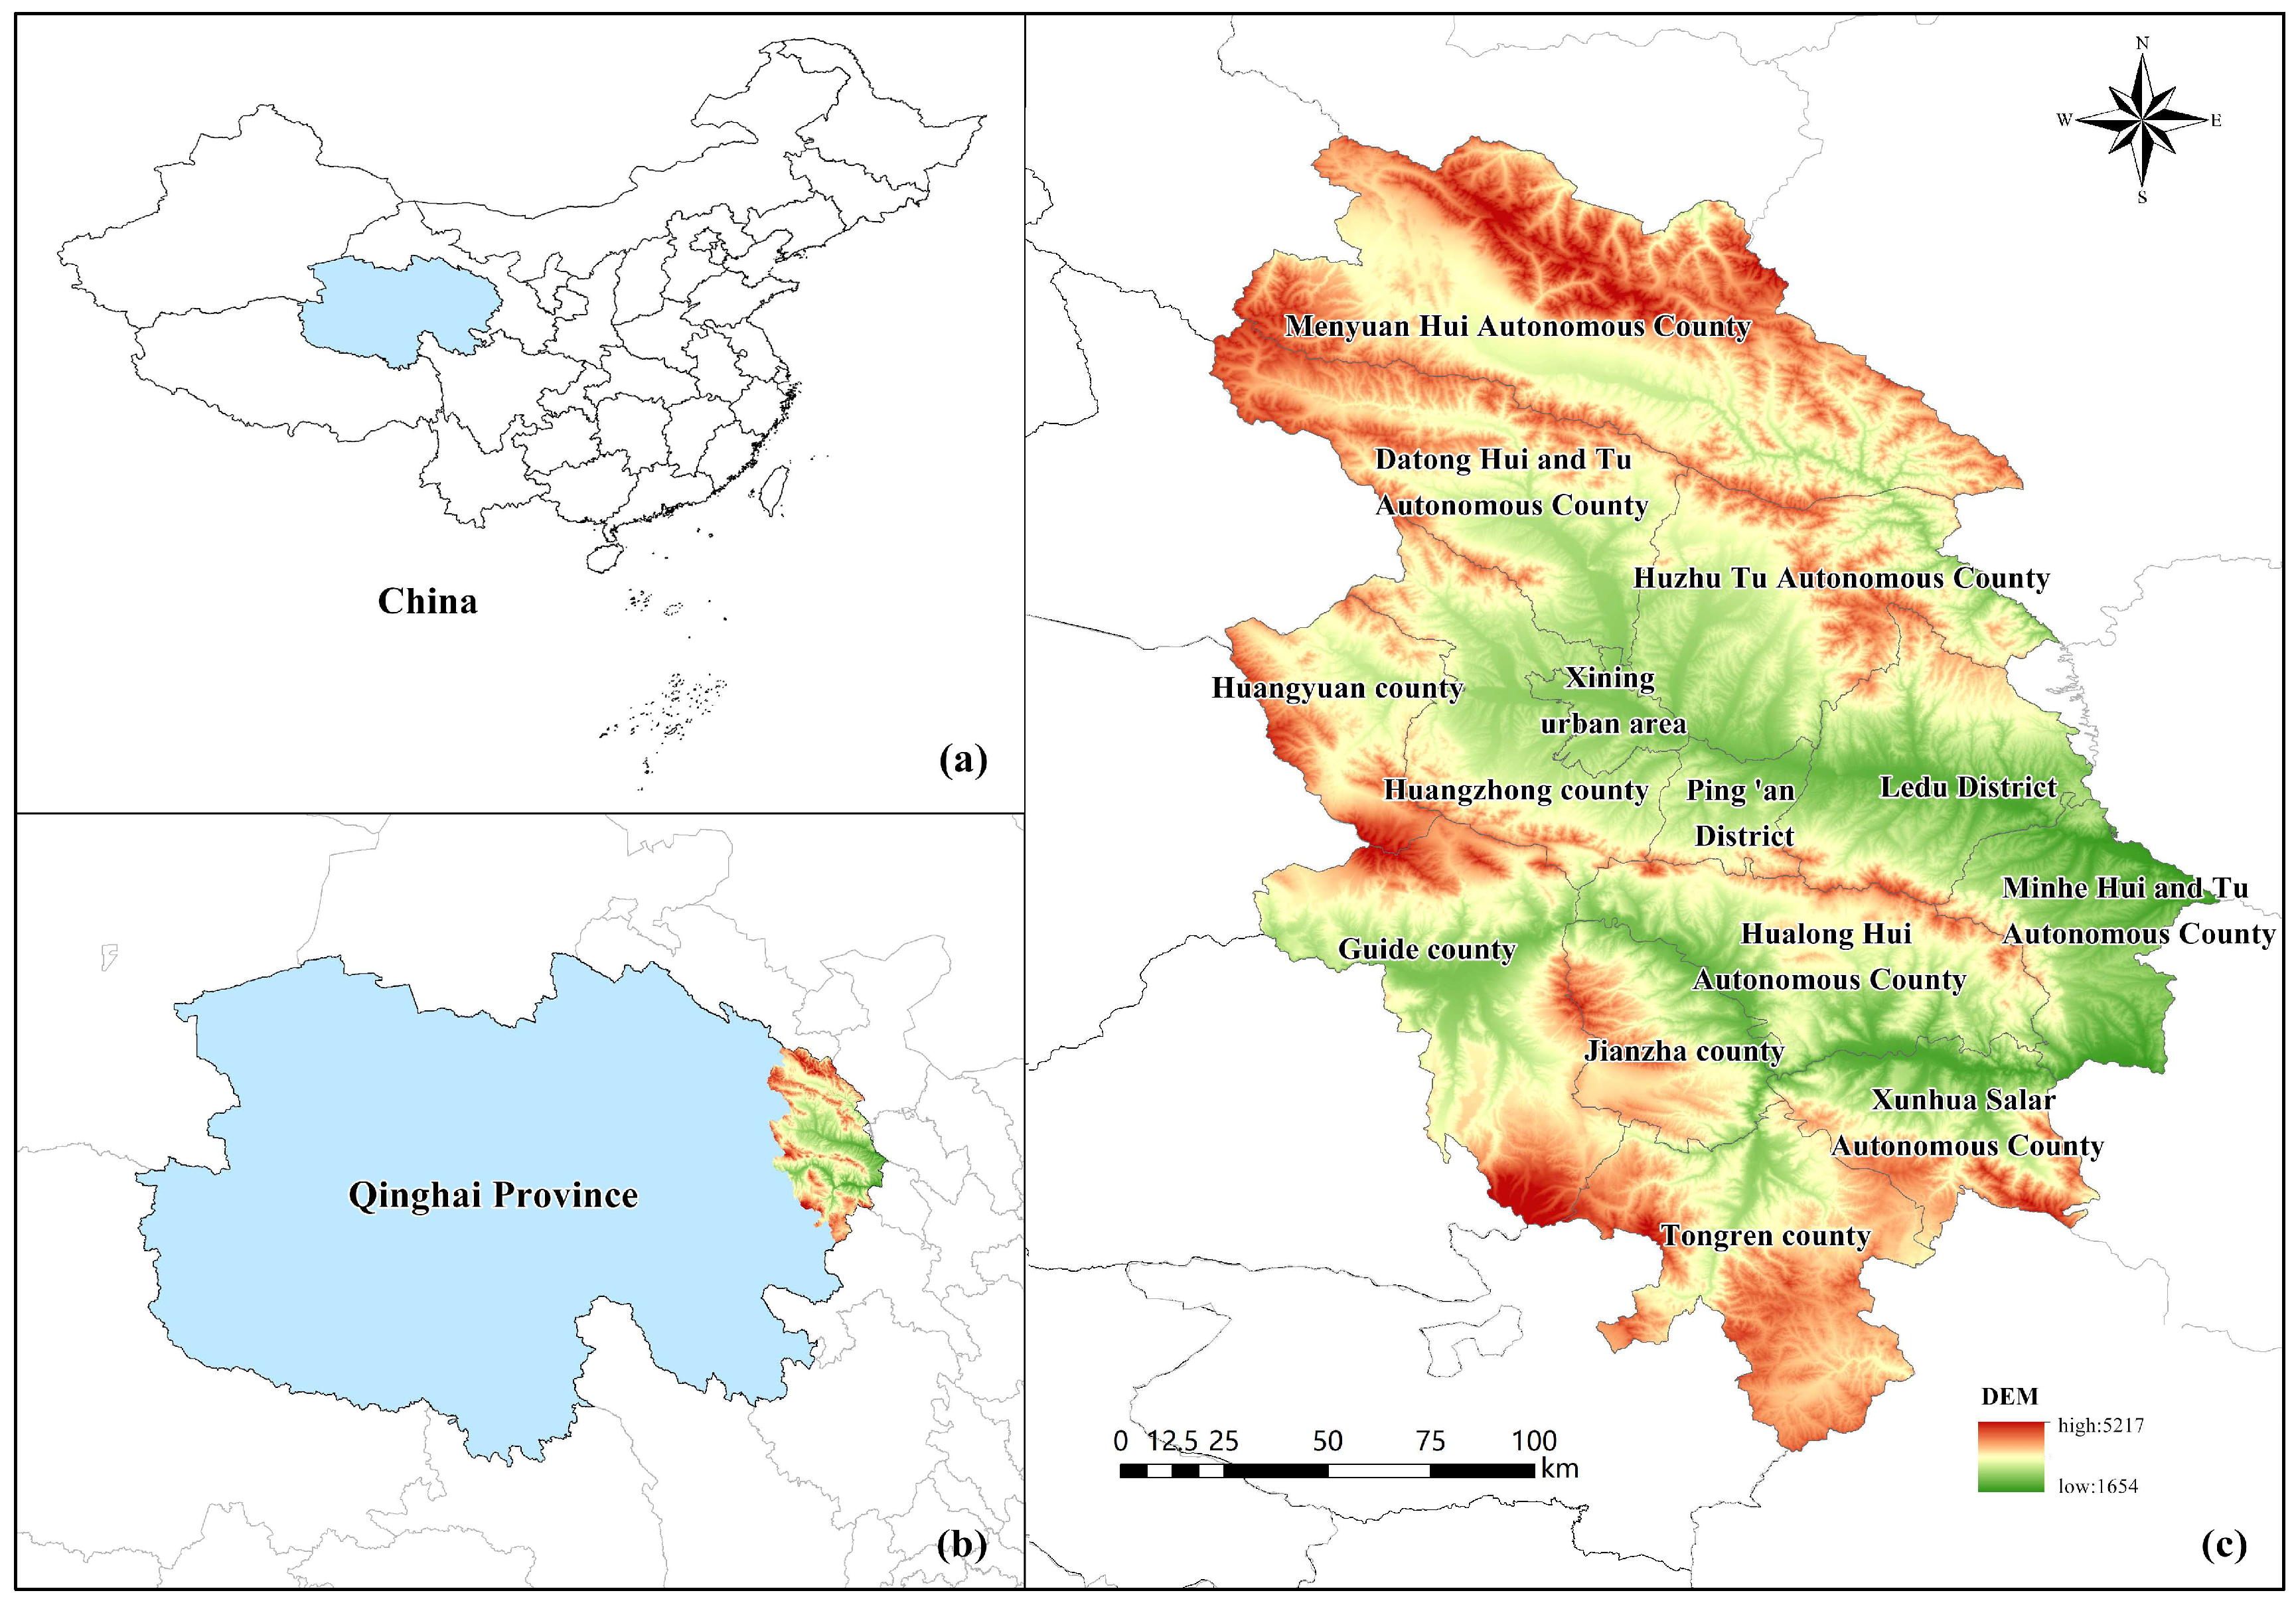
Figure 1. Location of the study area (c) in Qinghai Province (b), China (a).
Diversity 16 00618 g001
Figure 2. Research flowchart.
Diversity 16 00618 g002
Figure 3. Temporal changes of land use functions of Hehuang Valley.
Diversity 16 00618 g003
Figure 4. Spatial–temporal distribution of land ecological functions in 2000 (a), 2005 (b), 2010 (c), 2015 (d), and 2020 (e), and changes from 2000 to 2020 (f).
Diversity 16 00618 g004
Figure 5. Spatial–temporal distribution of land social functions in 2000 (a), 2005 (b), 2010 (c), 2015 (d), and 2020 (e), and changes from 2000 to 2020 (f).
Diversity 16 00618 g005
Figure 6. Spatial–temporal distribution of land economic production functions in 2000 (a), 2005 (b), 2010 (c), 2015 (d), and 2020, (e) and changes from 2000 to 2020 (f).
Diversity 16 00618 g006
Figure 7. Spatial–temporal distribution of land comprehensive functions in 2000 (a), 2005 (b), 2010 (c), 2015 (d), and 2020 (e), and changes from 2000 to 2020 (f).
Diversity 16 00618 g007
Figure 8. Pearson correlation coefficient between land use functions from 2000 to 2020. Note: X, Y, and Z represent economic production function, ecological function, and social function of land, respectively. Same as below.
Diversity 16 00618 g008
Figure 9. Partial correlation coefficient between land economic production function and ecological function at grid scale (a) and county scale (d), between land economic production function and social function at grid scale (b) and county scale (e), and between ecological function and social function at grid scale (c) and county scale (f). Note: HY: Huangyuan County; HZT: Huzhu County; HZ: Huangzhou County; XN: Xining Urban Area; PA: Ping’an District; LD: Ledu District; MH: Minhe County; HL: Hualong County; JZ: Jiazha County; GD: Guide County; XH: Xunhua County; TR: Tongren County.
Diversity 16 00618 g009
Figure 10. Factor detection results for X1–X9 to comprehensive land function (Y).
Diversity 16 00618 g010
Figure 11. X1–X9 interaction detection results to comprehensive land function (Y).
Diversity 16 00618 g011
Figure 12. Grey correlation of land comprehensive functions drivers from 2000 to 2020.
Diversity 16 00618 g012
Table 1. Data sources and their uses.
Data TypeData NameData FormatData SourceData Use
Natural geographic dataDEM Elevation DataRaster data with 30 m resolutionGeospatial Data Cloud (http://www.gscloud.cn/search, accessed on 8 June 2022)Basic parameter input for soil erosion equation and wind erosion model
MOD13Q1Raster data with 250 m resolutionNASA website (https://www.nasa.gov/, accessed on 8 June 2023)Obtain Normalized Difference Vegetation Index (NDVI) and vegetation coverage data
Soil Moisture DataRaster data with 1000 m resolutionCold and Arid Regions Science Data CenterTopsoil moisture factor (0–10 cm depth range)
Precipitation DataList dataChina Meteorological Data Network (http://data.cma.cn/, accessed on 5 July 2022)Obtain rainfall erosion factor and annual average rainfall raster maps
Temperature, Precipitation, Radiation DataList dataChina Meteorological Data Network (http://data.cma.cn/, accessed on 5 July 2022)Obtain monthly average temperature, radiation raster data, and annual potential evaporation data
Socio-economic statistical dataAnnual Meat, Grain Production, and Population DataStatistical dataQinghai Statistical Yearbook, China County Statistical YearbookObtain grain and meat production and county population data
Land use-related dataLand Use Remote Sensing DataRaster data with 30 m resolutionResources, Environment and Science and Data Center (http://www.resdc.cn/, accessed on 2 October 2022)Basic parameter input for NPP (Net Primary Productivity), water conservation, and soil erosion models
Global Land Cover Data (China subset)Raster data with 100 m resolutionCold and Arid Regions Science Data CenterObtain vegetation type data for the study area
Road Network DataVector dataResources, Environment, and Science and Data Center (http://www.resdc.cn/, accessed on 2 January 2023)Obtain road and railway data for 1995, 2012, and 2020
Night Light Index [49]Raster data with 1000 m resolutionAn improved time–series DMSP–OLS–like data (1992–2021) in China by integrating DMSP–OLS and SNPP–VIIRS—Harvard DataverseInput for the PLUS model
Table 2. Multifunctional land use evaluation index system in Hehuang Valley.
Functions (Weight)Indicators (Indicator Sign)/WeightIndicator DescriptionCalculation MethodFormula/Calculation Description
Ecological Function
(1/3)
NPP (+)/0.251NPP can directly reflect the ability of vegetation community to produce organic matter in natural environment.NPP was estimated by utilizing the Carnegie-Ames-Stanford Approach based on the principle of light energy utilization. The detailed model and parameter selection are based on Zhu et al. [50].
NPP x , t   =   APAR x , t   × ε x , t
NPP x , t represents the net primary productivity of the pixel x in month t (g·C·m−2); APAR x , t is the photosynthetically active radiation of the pixel x in month t (MJ·m−2); ε x , t is the actual light-use efficiency of the pixel x in month t (g·C·MJ−1).
Water Conservation (+)/0.484Water conservation can provide support for improving regional water circulation and rational utilization of water resources.Water conservation was assessed by the Water Yield module of the InVEST model [51] based on the principle of water balance.
WY(x) = (1 − A E T ( x ) P ( x ) ) × P(x)
WY(x) is the annual water yield of a landscape type (mm); AET(x) is the actual annual evapotranspiration of the grid cell (mm); P(x) is the annual precipitation of the grid cell (mm).
Soil Erosion (–)/0.265Soil erosion refers to the process of soil erosion, transport and accumulation, which affects the stability and productivity of ecosystems.The RUSLE is used to quantify soil erosion in the Hehuang Valley. Soil retention is determined by the difference between potential soil erosion and actual soil erosion [52,53].
USLE = R × K × C × LS × P
USLE is the actual soil erosion amount (t·hm−2·a−1); R is the rainfall erosivity factor (MJ·mm·hm−2·h−1·a−1); K is the soil erodibility factor (t·hm2·h·MJ−1·mm−1·hm−2); LS is the topographic factor; C is the cover management factor; P is the support practice factor.
Social Function
(1/3)
Residential Capacity (+)/0.675Due to the fixed location and area of land, it has a spatial carrying function and provides space for human habitation and activities.Using the Habitat Index and population size to quantify indicators of residential capacity and the detailed formulas could be found be in [54,55].
H S I i = 1 N D V I m a x + O L S 1 O L S + N D V I m a x + O L S × N D V I m a x
R i =   U i × H S I i × P O P j U j × H S I j
R i is the population density of the grid i ; U i and U j are the areas of urban and rural residential points in grid i and county j, respectively; I i and I j represent the habitation indices of grid i and county j, respectively; P O P j is the population of county j; OLS and O L S m a x are the value and maximum value of nighttime lights in grid x; OLS′ represents the normalized nighttime light value; N D V I m a x is the maximum normalized difference vegetation index.
Travel Convenience (+)/0.182Travel convenience is the basic support of social functions. An effective road system can promote the overall progress of society and improve residents’ sense of happiness.Calculating the road network density of each 1 km grid cell to quantify the level of travel security.Establish a 1 km grid in the Hehuang Valley, intersect with road data, calculate the road length within each grid cell, summarize by the FID field of the grid, and obtain the total road length within each 1 km grid cell.
Aesthetic Landscape (+)/0.143Aesthetic landscapes are a key component of the social and life functions of land, which can improve quality of life and psychological well-being, promote social interaction, and provide educational functions.Measured based on the value equivalent method [56] and appropriately adjusted using the local grown grains.
Ea = 1 7 × A O V S
Ea is the ecosystem service value per unit equivalent factor in the Hehuang Valley (yuan/hectare); AOV is the average agricultural production value over the years in the Hehuang Valley (yuan); S is the average grain planting area over the years in the Hehuang Valley (hectares).
Economic Production Function
(1/3)
Grain Output (+)/0.217The Hehuang Valley is the most important grain-producing area in Qinghai Province and plays an important role in the land economic production.Spatialization of statistical grain output data based on the significant linear correlation between cropland NDVI and crop product yields [57,58].
Gi = Gsum × N D V I i N D V I s u m
Gi is the grain output in grid i (t); Gsum is the total grain output in the Hehuang Valley (t); NDVIi is the NDVI value of cultivated land in grid i; NDVIsum is the sum of NDVI values of cultivated land in the study area.
Livestock Product Supply (+)/0.115The Hehuang Valley has a large amount of temperate grassland suitable for grazing, and livestock products are an indispensable daily necessity for local residents.Spatialization of statistical livestock production data based on the significant linear correlation between grassland NDVI and livestock product yields [57,58].
Li = Lsum × N D V I i N D V I s u m
Li is the meat output in grid i (t); Lsum is the total meat output in the Hehuang Valley (t); NDVIi is the NDVI value of grassland in grid i; NDVIsum is the sum of NDVI values of grassland in the study area.
GDP (+)/0.668GDP represents the economic development level of a region and is also an important indicator of regional land economic output.GDP is spatialized by the GDP statistical value of the county-level administrative, the land use type, and nighttime light brightness et al. [22,59].
G D P i j = G D P × Q i j Q
GDPij is the raster unit value after spatialization; GDP is the GDP statistical value of the county-level administrative unit where the raster unit is located; Qij is the total weight of land use type, nighttime light brightness, and residential point density in the raster unit; Q is the total weight of land use type, nighttime light brightness, and residential point density in the county-level administrative unit where the raster unit is located.
Table 3. Multifunctional drivers of land use in the Hehuang Valley.
TypeFactorsSpecific CalculationCode
Natural conditionsElevationDEMX1
SlopeExtracted from DEMX2
TemperatureAverage annual temperature over five periodsX3
PrecipitationAverage annual precipitation over five periodsX4
AccessibilityDistance to CountyArcGIS tool: Euclidean distance (County locations in 2020)X5
Distance to CityArcGIS tool: Euclidean distance (City locations in 2020)X6
Human FactorsFarmland Non-agricultural RateProportion of construction land per 1 km2 unit, annual averageX7
Land Use IntensityAssigned based on different land types, annual averageX8
Human Activity IntensityAnnual average nighttime light indexX9
Table 4. Land use intensity grading standards in the Hehuang Valley.
TypeUnused LandForest, Grassland, Water LandAgricultural LandConstruction Land
Land Use TypeUnused land, Permanent ice and snowForest land, Grassland, LakesArable land, Reservoirs, Ponds, and River channelsBeach land, Urban and rural land, Industrial and mining land, Residential land
Classification Index1234
Table 5. Trade-offs and synergistic types between land economic production functions, ecological functions, and social functions in counties and cities in Hehuang Valley.
CountyTrade-off and Synergy Types
Ledu DistrictSynergy (++–)
Tongren CountySynergy (++–)
Guide CountySynergy (+++)
Minhe CountySynergy (++–)
Ping’an DistrictSynergy (++–)
Huangyuan CountyTrade-off (–––)
Menyuan CountyTrade-off (–––)
Huzhu CountyTrade-off (––+)
Jainca CountySynergy (+++)
Huangzhong CountyTrade-off (–––)
Xunhua CountySynergy (++–)
Datong CountyTrade-off (––+)
Xining Urban AreaTrade-off (––+)
Hualong CountyTrade-off (––+)
Disclaimer/Publisher’s Note: The statements, opinions and data contained in all publications are solely those of the individual author(s) and contributor(s) and not of MDPI and/or the editor(s). MDPI and/or the editor(s) disclaim responsibility for any injury to people or property resulting from any ideas, methods, instructions or products referred to in the content.