Article

Palaeoenvironmental Analysis of the Southern Part of the Danube–Tisza Interfluve (Hungary): The Northern Loess Wall of Katymár and the Hay Meadows and Loess Banks of Hajós

by
Tamás Zsolt Vári
1,*,
Elemér Pál-Molnár
1 and
Pál Sümegi
1,2
1
Department of Geology, Institute of Geosciences, University of Szeged, 2-6 Egyetem Street, H-6722 Szeged, Hungary
2
HUN-REN Institute for Nuclear Research, 18/C Bem Square, H-4026 Debrecen, Hungary
*
Author to whom correspondence should be addressed.
Diversity 2024, 16(10), 619; https://doi.org/10.3390/d16100619
Submission received: 30 August 2024 / Revised: 25 September 2024 / Accepted: 2 October 2024 / Published: 6 October 2024

Abstract

:
This study presents a comprehensive palaeoenvironmental reconstruction of the southern part of the Danube–Tisza interfluve in the Carpathian Basin from the Late Pleistocene to Early Holocene, addressing the region’s response to global climate forcings and local environmental factors based on multi-proxy analyses of two key protected areas: the Katymár brickyard and the hay meadows and loess banks of Hajós. By integrating radiocarbon-dated malacological, macrobotanical, pollen, phytolith, geochemical, and sedimentological analyses, it was possible to provide a picture of past climate–ecosystem interactions. The Katymár North sequence provides an extended chronology from Marine Isotope Stage 3 (MIS3, ca. 36,000 cal BP) through the Last Glacial Maximum (LGM) and into the Early Holocene, while the Hajós sequence offers high-resolution data for the LGM–Holocene transition. By the late Ice Age, humidity and surface moisture superseded temperature as primary palaeoecological limiting factors, promoting ecotone-like forest–steppe environments during cooling periods.

1. Introduction

The Duna–Tisza interfluve, a region characterised by diverse wetland and loess plateau habitats, is undergoing significant environmental changes due to predicted temperature increases in this century. These changes are particularly pronounced in the southern part of the interfluve, encompassing the Katymár brickyard and the Hajós–Kaszálók grasslands within the Kiskunság National Park. These sites, crucial for understanding the impact of climate change on both wetland and terrestrial environments, have experienced a complex history of human intervention and natural restoration efforts.
Previous research [1] has established the significance of the Katymár brickyard as housing the thickest loess sequence in Europe, providing a valuable record of palaeoenvironmental changes over the last 35,000 years. The Hajós hay meadows and loess banks, on the other hand, have been recognised for their unique wetland habitat and peat-forming environment. Building upon earlier investigations of the Katymár West loess–palaeosol sequence [1], this study expands the scope of analysis to encompass the northern section of Katymár, introducing radiocarbon-dated sedimentological, geochemical, phytolith, and malacological analyses. On one hand, a difficult situation was encountered when comparing the analyses conducted in the region, as the basic approach for palaeoecological studies is considered to be conducting multiproxy analysis on the same samples [2]. On the other hand, the basis for comparison between profiles can be provided by sampling with adequate geochronological data and appropriate temporal resolution in fine stratigraphy [2,3,4]. However, despite the large number of processed profiles in the region [5,6,7,8,9,10,11,12,13,14,15,16,17,18,19,20,21], comparison problems were posed by the significantly greater geological development thickness of the Katymár profile compared to previously published profiles, or the sporadic occurrence [5,6,7] or complete lack of geochronological data. As a result, the results of samples collected from the northern part of the Katymár brickyard could only be sequentially compared with those of studies conducted in Vojvodina in the Crvenka brickyard [15,19,20] and in the Madaras brickyard [21]. However, due to the extraordinary thickness (1120 cm) of the Katymár profile and the 4 cm sampling, changes could be reconstructed on a century scale, while in the Crvenka profile [19,20], only a millennial-scale approach was allowed by the sampling.
This study aimed to fill the gaps by conducting an integrated environmental historical analysis of the Hajós hay meadows and loess banks and Katymár brickyard. Our approach allowed us to gain specific insights into the impacts of the palaeotemperature changes in the diverse habitats within the Katymár brickyard site. Additionally, this research provides more details on the palaeoenvironmental context of the Neolithic transition in Central Europe [3], based on the Hajós study area, which is a critical period in human history marked by the shift from hunter–gatherer lifestyles to settled agriculture. With these new analyses, this study will provide a detailed understanding of the region’s palaeoenvironmental history, contributing to both climate change research and conservation efforts.

2. Materials and Methods

2.1. Study Areas and Sampling

The initial phase of this study was conducted on a 1120 cm vertical loess profile exposed in a north-facing sequence at the Katymár brickyard (Figure 1). Scaffolds and digging were used during sampling to reach the higher and lower sections, respectively. The wall section was cleaned before samples were collected in 4 cm intervals. From each interval, 1 dm3 (cca. 2.7 kg) sediment was collected for malacological examination and an additional 0.5 kg for other analyses. The material of anthracological examination [22] was extracted during the wet sieving of the malacological sediment. Troels-Smith classification [23] was used to describe the lithostratigraphy during the sampling process.
Katymár is located on the northern edge of the Bácska Loess area in southern Hungary, in which an area of significant sand movement commenced at relatively high altitudes during the drier climatic periods of the Late Pleistocene [24,25]. This aeolian activity contributed to the formation of a varied landscape by the early stage of the last glacial period. During the Middle and Upper Weichselian phases, these sandy areas were subsequently covered by loess deposits, forming horizons that reached a thickness of 1000 to 1100 cm [25,26]. The exposition settings of a sequence, such as the direction and intensity of insolation, play a crucial role in managing local environmental conditions, which in turn influence the species composition of Pleistocene snail fauna [27,28]. This north-facing sequence receives less insolation compared to the west-facing wall [1].
Four cores were extracted from the hay meadows and loess banks of Hajós [3] by a Russian peat corer [29,30,31]. The longest core (430 cm), taken from the deepest point beneath the high bluff, was selected for processing [3]. Substantial lacustrine sediment accumulation was indicated by the core in the middle of the oxbow lake. Toward the edge, the sediment narrowed and transitioned into peat layers due to biogenic infilling.
The Hajós study area is a former Danube River basin located on the eastern edge of the Sárköz region (Figure 2). It is a classic horseshoe-shaped lakebed that formed when a meander of the river was cut off from the main channel. This unique formation is only connected to the main river system during significant floods, functioning as a standalone lake during normal conditions.
The nearby 400–600 cm loess banks played a crucial role in maintaining the lake’s water level between flood events and also created a distinct microenvironment that influenced the vegetation growing on the bluff and near the lake [3]. At the foot of the loess bank, seeping groundwater supplies, tall sedge meadows, swamp meadows, wet hay meadows, fen meadows, and reed beds can be found. Unlike other lowland landscapes, this freely accessible reserve has an outstandingly diverse topography with picturesque landscape architecture [32].

2.2. Walter-Lieth Diagram

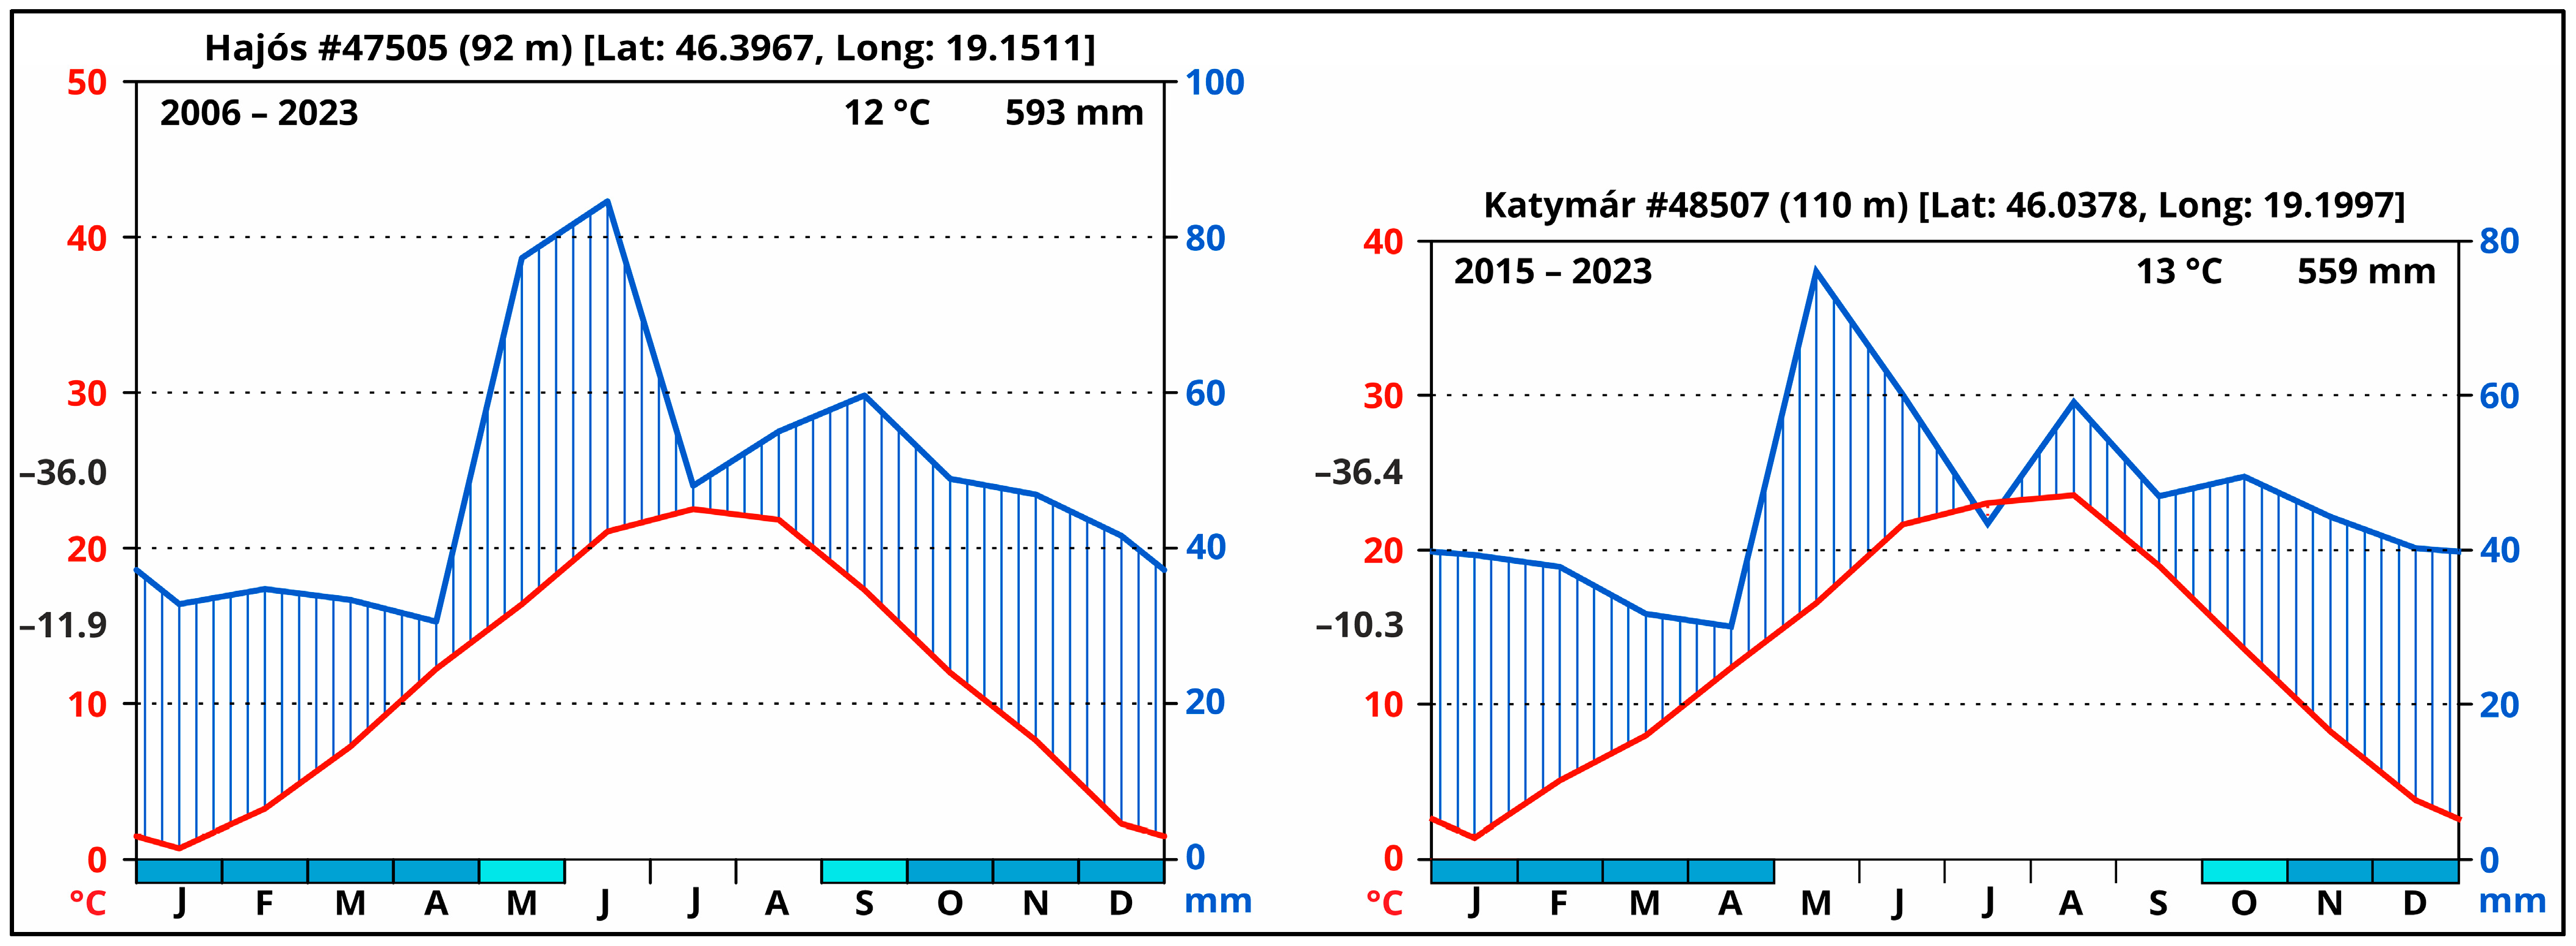
A Walter–Lieth diagram [33] was created in climatol 4.1.0 [34] in RStudio 2024.04.1 [35] using data provided by the National Meteorological Service [36,37] for the city of Katymár (110 m above sea level) between January 2015 and December 2023 (9 years) and for the city of Hajós (92 m above sea level) between January 2006 and December 2023 (18 years).

2.3. Radiocarbon Analysis

For the Katymár sequence, dating was conducted on one Holocene organic soil sample, two charcoal samples, and ten Pupilla muscorum samples. The preparation and pre-treatment of the samples followed Sümegi et al. [1]. These measurements were performed at the Hertelendi Laboratory of Environmental Studies (HEKAL), part of the Institute for Nuclear Research of the Hungarian Academy of Sciences in Debrecen, Hungary. Conventional radiocarbon ages for Hajós were derived from previous studies conducted on the same core [3,38,39]. Age-depth modelling (Bacon) and the estimation of the sedimentation rate (accrate.depth) were conducted using RBacon 2.5.8 [40] in RStudio 2024.04.1 [35] and an IntCal20 calibration curve [41,42]. The BP and BC/AD dates used in the text and figures are the calibrated median ages.

2.4. Magnetic Susceptibility, Grain Size, Loss on Ignition, and Geochemical Analysis

Bulk samples underwent magnetic susceptibility analysis [43]. Samples were taken at 4 cm intervals and were first crushed in a glass mortar after weighing. The samples were then placed in plastic boxes and air-dried in an oven at 40 °C for 24 h. The magnetic susceptibilities of the samples were then measured at a frequency of 2 kHz using a Bartington MS2 magnetic susceptibility meter with an MS2E high-resolution sensor [44]. Each sample was measured three times, and the average values of magnetic susceptibility were calculated and reported.
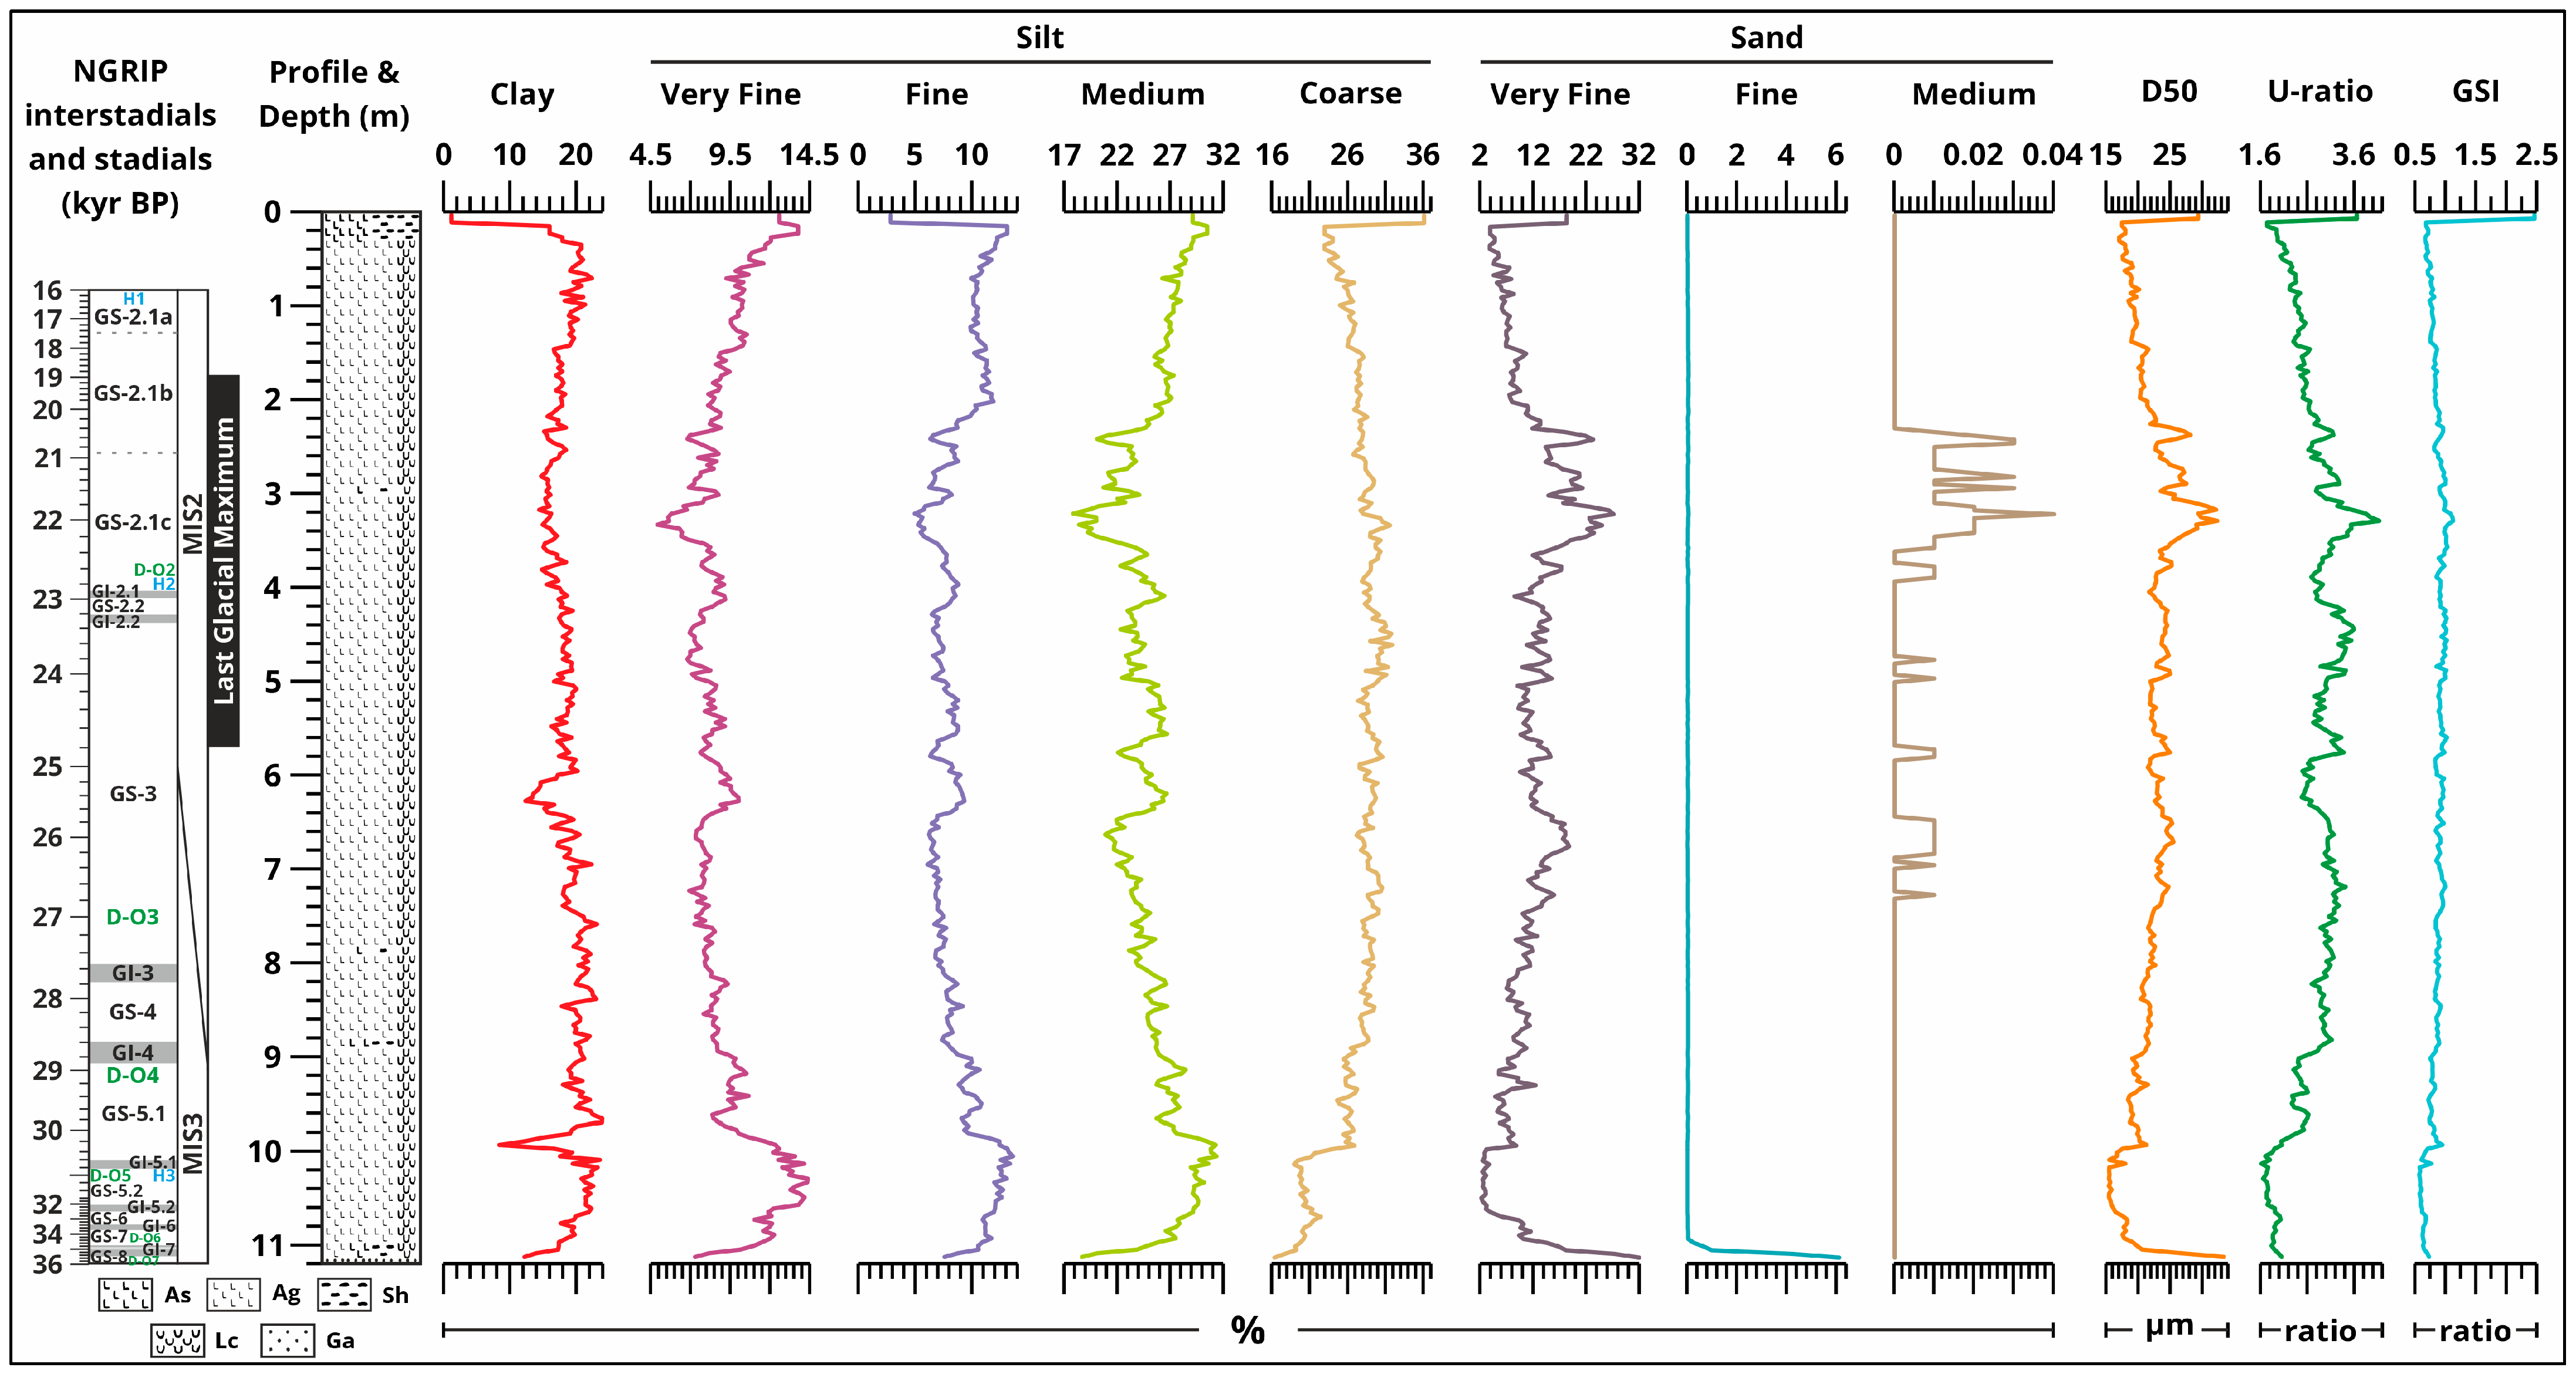
The grain size data of the pre-treated sediment samples [1] were obtained at 4 cm intervals for 42 grain-size classes ranging from 0.1 μm to 500 μm, respectively, using laser diffraction with an OMEC Easysizer20 laser particle size analyser [45]. The Easysizer20 performs all measuring steps automatically after the initial parameter setup, which provides easy operation and accurate results. The U-ratio (16–44 μm/5.5–16 μm) was calculated to determine the dominant and subordinate phases of wind transport during cold–warm and dry–wet periods [46,47,48,49,50]. High U-ratio values indicate more intense sediment transport, which is characteristic of dry periods, while low values may suggest wet periods. Additionally, the grain size index (GSI—20–50 μm/<20 μm) was calculated, which considers the clay fraction and is suitable for determining the formation, transportation, and accumulation of loess [51,52]. The GSI, like the U-ratio, is a measure of climatic conditions during sediment accumulation, but post-accumulation processes such as pedogenesis also play a role. Low GSI values indicate a wet climate or soil formation, while high GSI values indicate dry climatic conditions.
The organic matter, inorganic matter, and carbonate content of the samples were determined using the loss-on-ignition method [53] with a 4 cm sample interval. Initially, the empty ceramic containers were weighed, and then the samples were placed in the crucibles and dried at 105 °C for 24 h in a laboratory furnace. Subsequently, the dried samples in the crucibles were weighed and placed in a furnace again for 1 h at 550 °C to ignite the organic carbon (OM or LOI550). The samples were weighed again after cooling to room temperature. Third, the samples were put into the furnace for 1 h at 900 °C and, after cooling to room temperature, the weight lost was equal to the carbonate content (CC or LOI900). The residuum (IM or LOIres) represents the inorganic matter content [53,54].
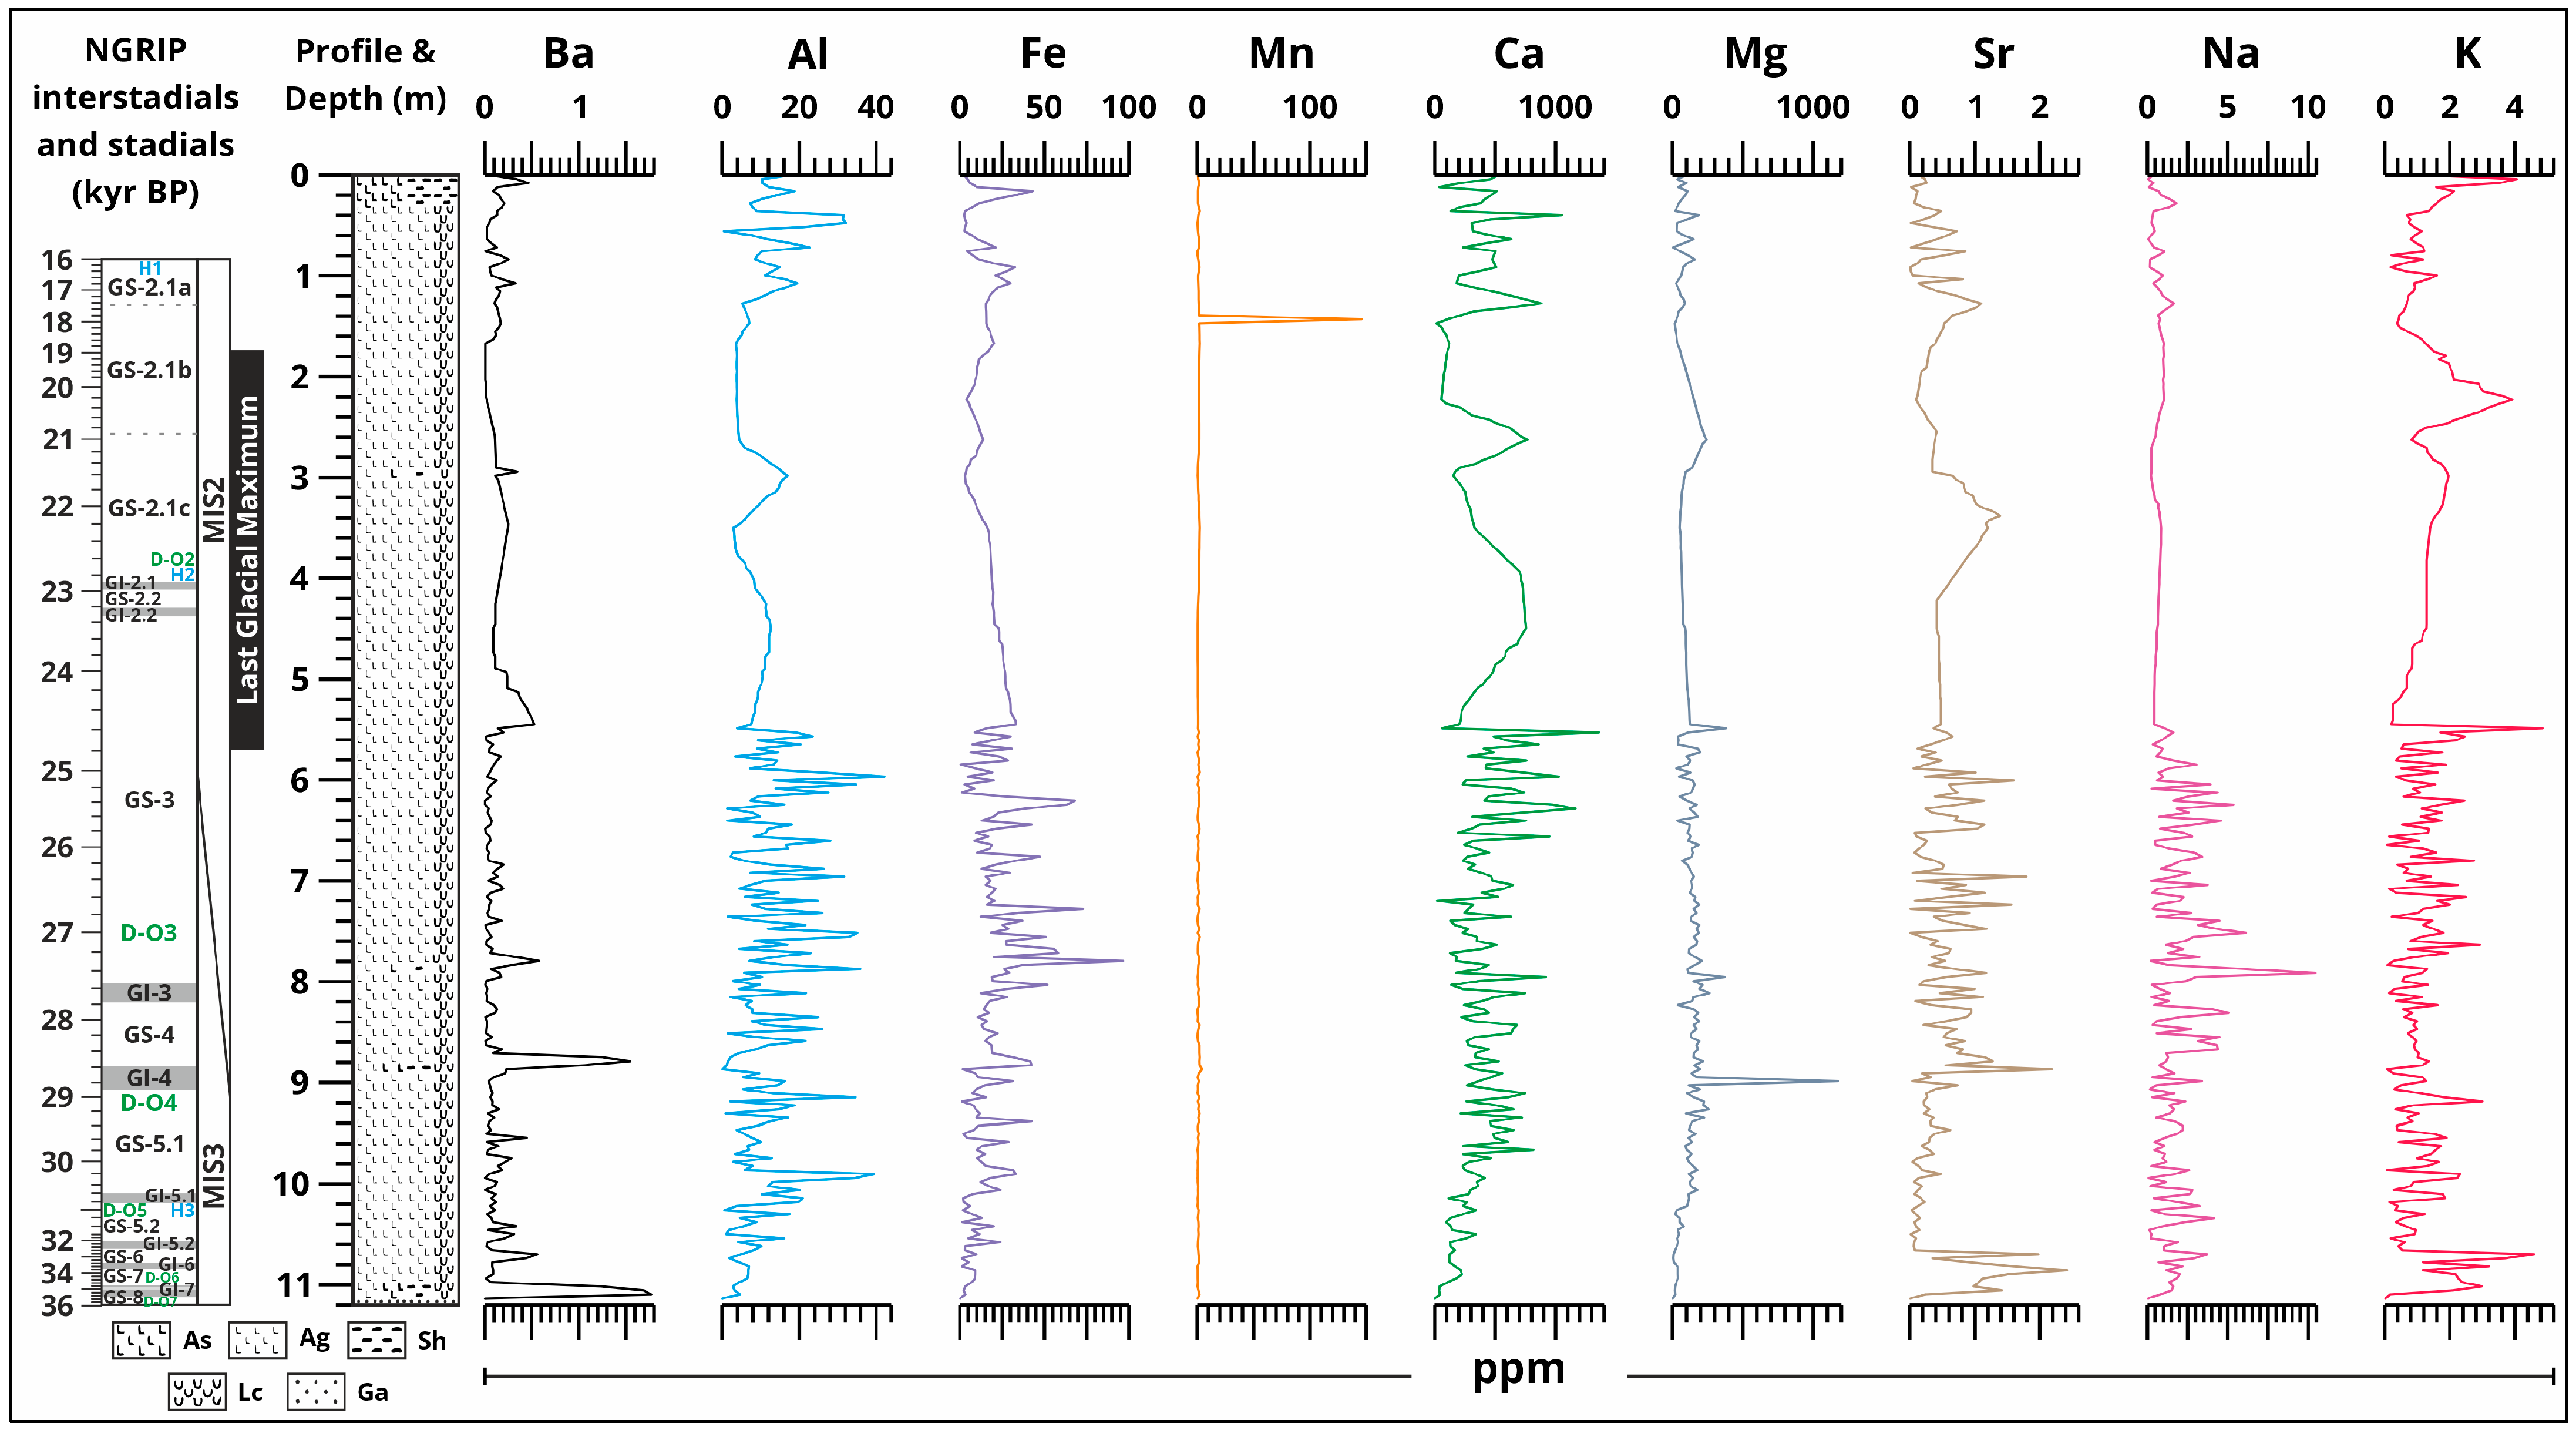
The content of the water-soluble elements barium (Ba), aluminium (Al), iron (Fe), manganese (Mn), strontium (Sr), calcium (Ca), magnesium (Mg), sodium (Na), and potassium (K) in the samples was determined using Dr Péter Dániel’s sequential extraction geochemical analysis method with a 4 cm sample interval [55,56].

2.5. Malacological Analysis

All samples from the Katymár site were washed and sieved using a 0.5 mm mesh sieve to remove fine wind-blown sand, loess, and soil material. After sieving, mollusc shells were dried, sorted, and identified under a stereo dissecting microscope at magnifications 6–50×. The malacofauna were divided into different palaeoecological groups following the palaeoecological classifications in [28,57,58,59,60]. The malacological record was also classified according to the recent geographical distribution of the species [61,62,63,64,65,66,67,68] and based on palaeoclimatological indicator roles [58,59,69]. July palaeotemperature values were obtained with the help of a malaco-thermometer [70].

2.6. Anthracological Analysis

The charcoal material from the Katymár site was obtained from uniformly 2.7 kg of 4 cm interval samples [22,71] according to German standards [72]. Charcoal remains were found on three levels on the loess wall. The double flotation method of Gyulai [73] was adopted, using 0.5 and 0.25 mm Ø mesh size sieves. Material was initially passed through the 0.5 mm mesh size sieve. The residue was then passed through the next sieve of a smaller mesh size to retrieve smaller-sized remains as well. Charcoal samples were selected and counted. The charcoal fragment counts are presented following the methodology outlined by Chabal et al. [74]. In the case of floated samples, it made no difference if we counted or weighed the amount of charred wood remains [75]. Charcoals were identified using a polarisation microscope with magnifications of 100×, 200×, and 500×. Taxon identification was carried out using reference books [76,77,78].

2.7. Phytolith Analysis

A personally modified version of the heavy-liquid extraction was adopted in the analysis of the soil and loess samples, developed at the Department of Geology and Paleontology, University of Szeged [79]. In total, 5 g of the samples were air-dried and shaken with the addition of a Calgon solution to remove the organic matter and the carbonates from the samples. This was followed by the removal of the clay fraction and those with a grain size higher than 250 μm. A floatation with a heavy liquid of 2.3 g/cm3 enabled the separation of plant opalites from other non-vegetal quartz grains. The retrieved phytoliths were stored in an Eppendorf tube in glycerine for further study. For the determination process, individual slides were prepared, and opalites were counted at a magnification of 500× under a biological stereomicroscope-type Nikon Eclipse E600 line by line. Counts were double-checked preceding the final quantification of the results. The secondary features of the identified phytoliths were also documented [80].

3. Results

3.1. Walter–Lieth Diagram

The modern climate data provide a baseline for interpreting the past temperature reconstructions. This helps in understanding how current conditions differ from those inferred for various points in the past. The Walter–Lieth diagrams [33] (Figure 3) of the two study areas are almost identical with only small differences in, for example, an average yearly rainfall of only 34 mm, and around ±1 °C differences regarding average temperatures. Katymár has a meteorological monthly data log history dating back to 2014 and is located approximately 3 km away from the study site; meanwhile, Hajós has a meteorological monthly data log history dating back to 2005 and is located about 500 m away from the study site, making them the most suitable meteorological locations for the analysis. The mean annual temperature was 12–13 °C with an annual precipitation of 559–593 mm, respectively. The most probable frost months are from October to April (Katymár) and from September to May (Hajós), when the absolute monthly minimums were equal to or lower than 0 °C. The precipitation graph shows that July is an arid period, with the highest chance for a draught event in both cases, as indicated by the dotted red vertical lines. The period with the highest precipitation is in May (76 mm at Katymár) and May–June (77–85 mm at Hajós). The average minimum temperature was recorded in January (−10.3 °C Katymár and −11.8 °C Hajós), while the average maximum temperature was recorded in August for Katymár (36.4 °C) and July for Hajós (36 °C).

3.2. Radiocarbon Results

3.2.1. Katymár North Loess Wall

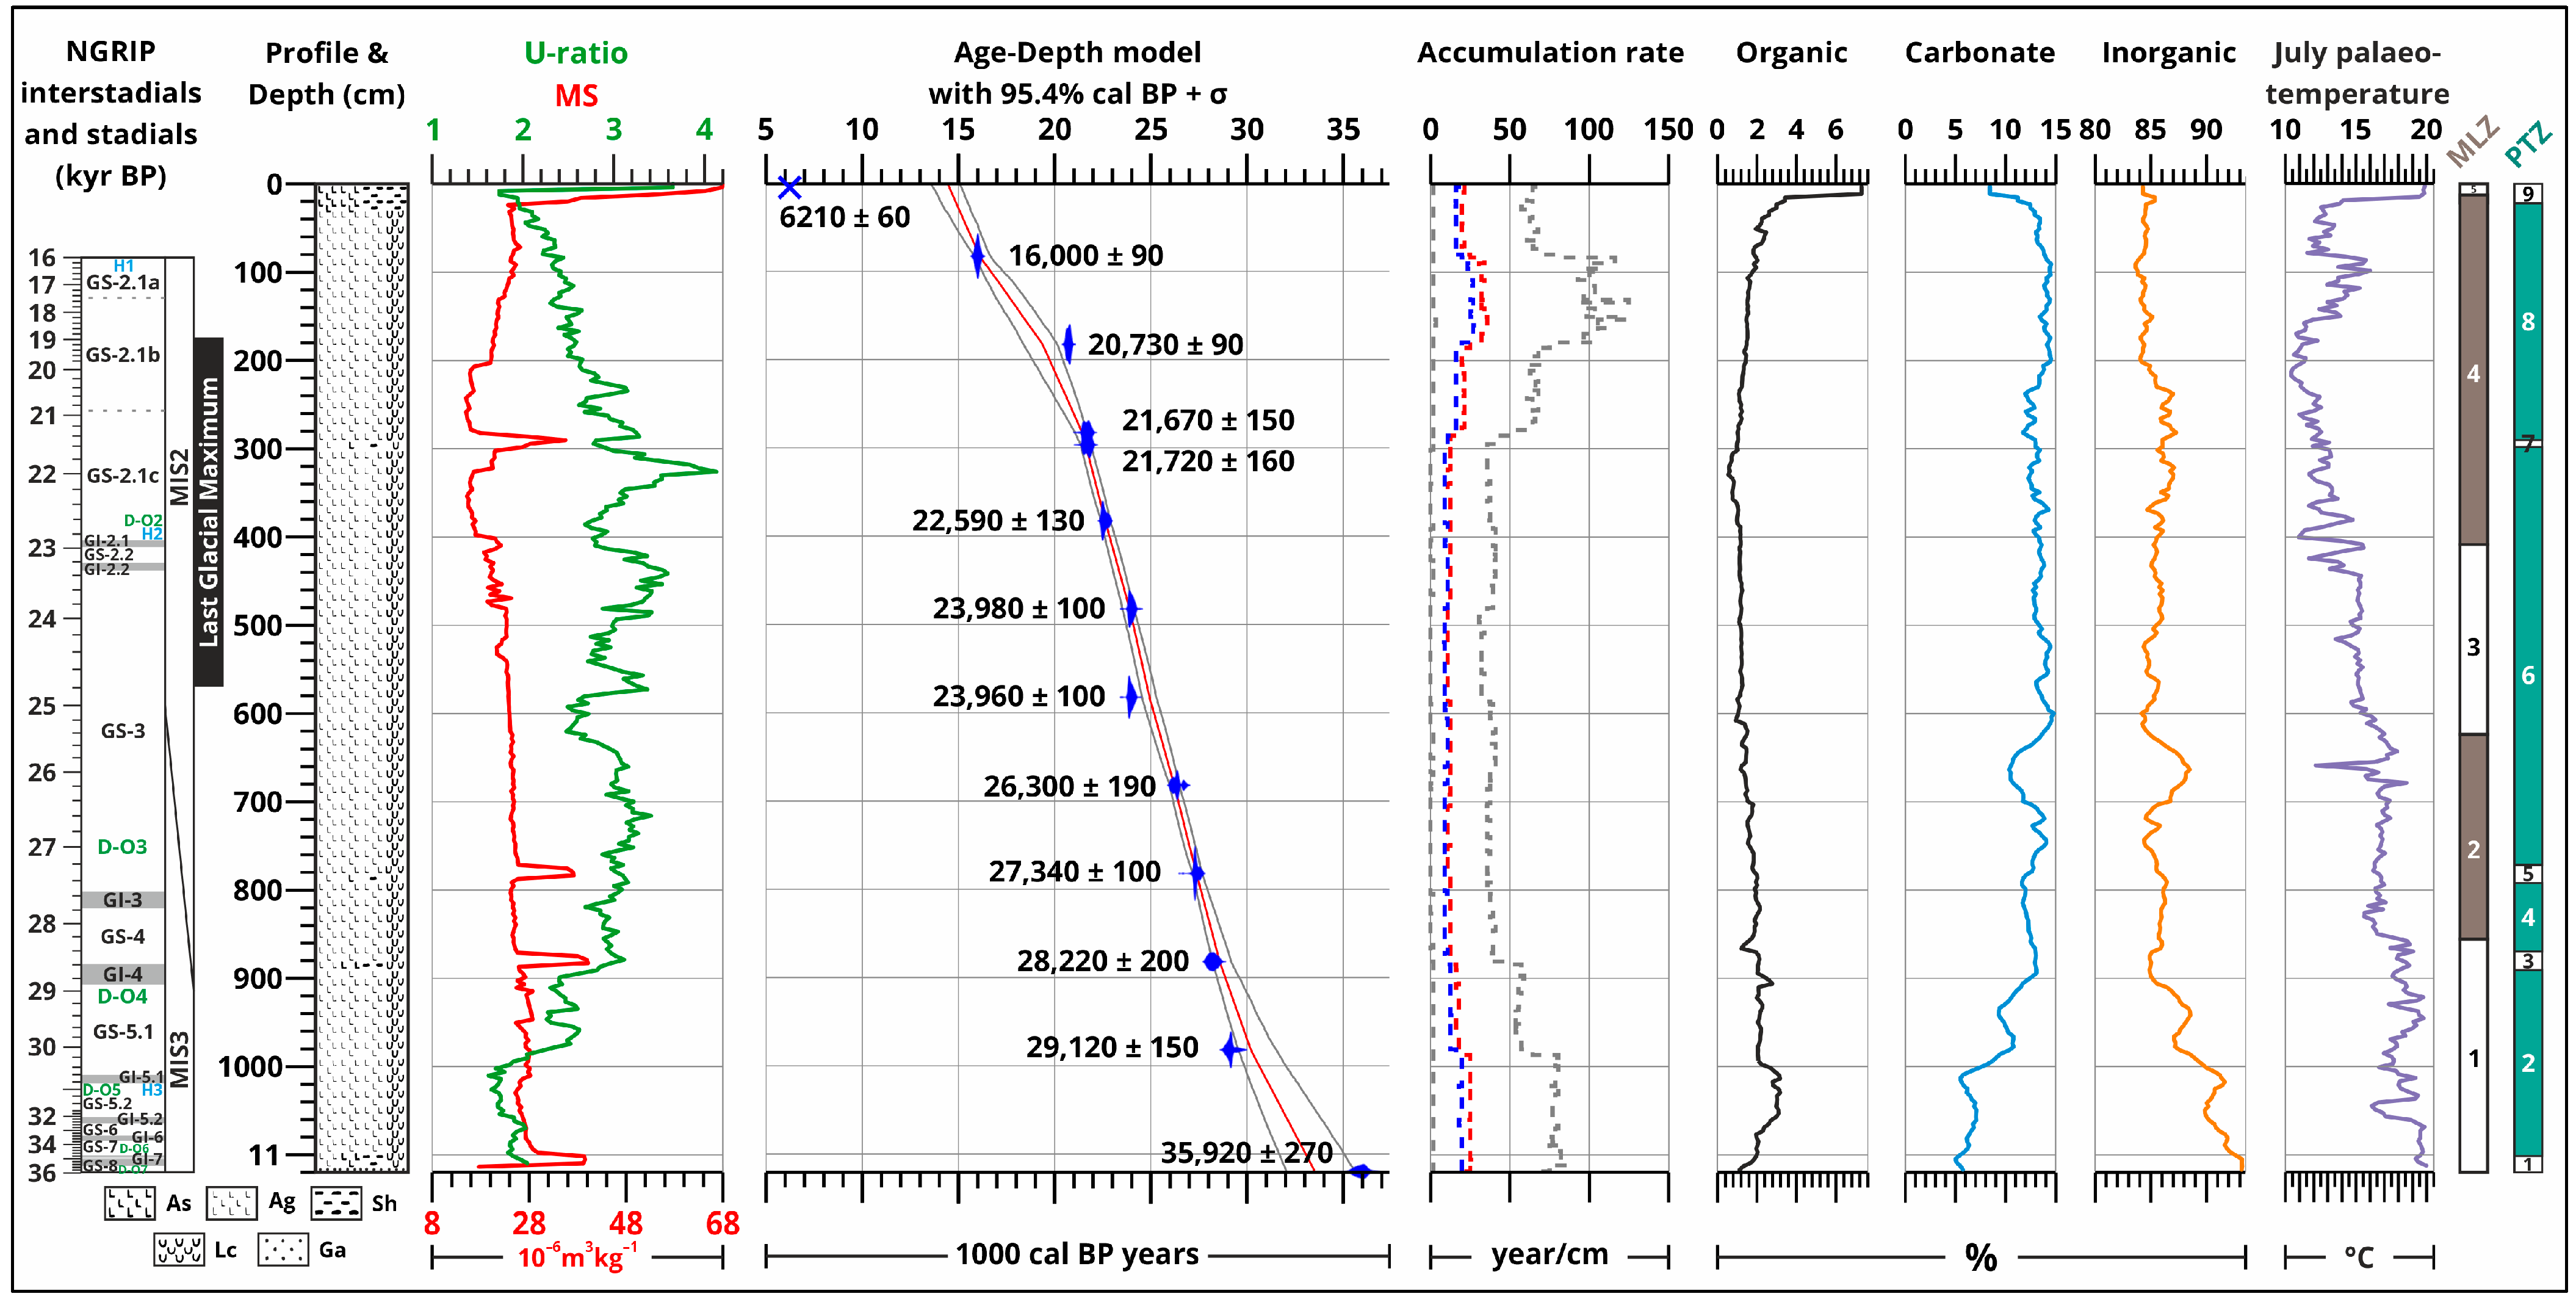
The sequence spans approximately 36,000 to 16,000 cal BP (Table 1, Figure 4), encompassing the late Marine Isotope Stage (MIS) 3, the transition from MIS 2 to MIS 3, the MIS 2 stage, and the Last Glacial Maximum (LGM). This age interval is broadly similar but approximately 3000 years younger at the base compared to the western section of the Katymár brickyard, which dates to around 39,000 cal BP [1]. The MIS 3/MIS 2 transition is recorded between 26,000 and 24,000 cal BP [1]; in contrast, we propose that this transition at Katymár North occurred between approximately 28,200 and 25,000 cal BP. The LGM is defined as occurring between approximately 24,800 and 19,000 cal BP, during which the average July palaeotemperature is estimated to have dropped to nearly 10 °C. Within this period, Greenland Interstadials GI-2.1 and GI-2.2 are characterised by relatively warmer temperatures, with average July palaeotemperatures of 15.5 °C and 14 °C, respectively. Greenland Stadial GS-2.2, which occurs between these two warmer interstadials, is characterised by a lower average July palaeotemperature of 11.5 °C. The unmodelled cal BP and modelled cal BP radiocarbon dates (Table 1) show similar values and are correlated with GISP2 stadials and interstadials [81] with Heinrich events and Dansgaard–Oeschger cycles [82,83,84] (Figure 4). The calibrated ages of Sample DeA–22498 (2 cm) at 6210 ± 60 years and Sample DeA–22499 (82 cm) at 16,000 ± 90 years are accurate; however, the calibrated ages between these two depths exhibit reduced accuracy and are not usable. Furthermore, the ages at 982 cm (DeA–22507) and 1120 cm (DeA–22508) are accurate, although the modelled, calibrated, and correlated ages between these depths exhibit a lower degree of precision; however, they remain within an acceptable range for use.
The sediment accumulation rate initially progresses slowly for approximately 6000 years. This period is succeeded by a phase of slightly increased accumulation from approximately 29,000 to 28,000 cal BP. Subsequently, the accumulation rate accelerates until around 21,700 cal BP, which represents the interval of greatest sediment deposition (approximately 600 cm). Following this peak, the accumulation rate decreases over a thousand years. This trend of reduced accumulation continues until around 16,000 cal BP, after which the rate of accumulation increases once more, continuing to the surface.

3.2.2. Hajós Hay Meadows and Loess Banks

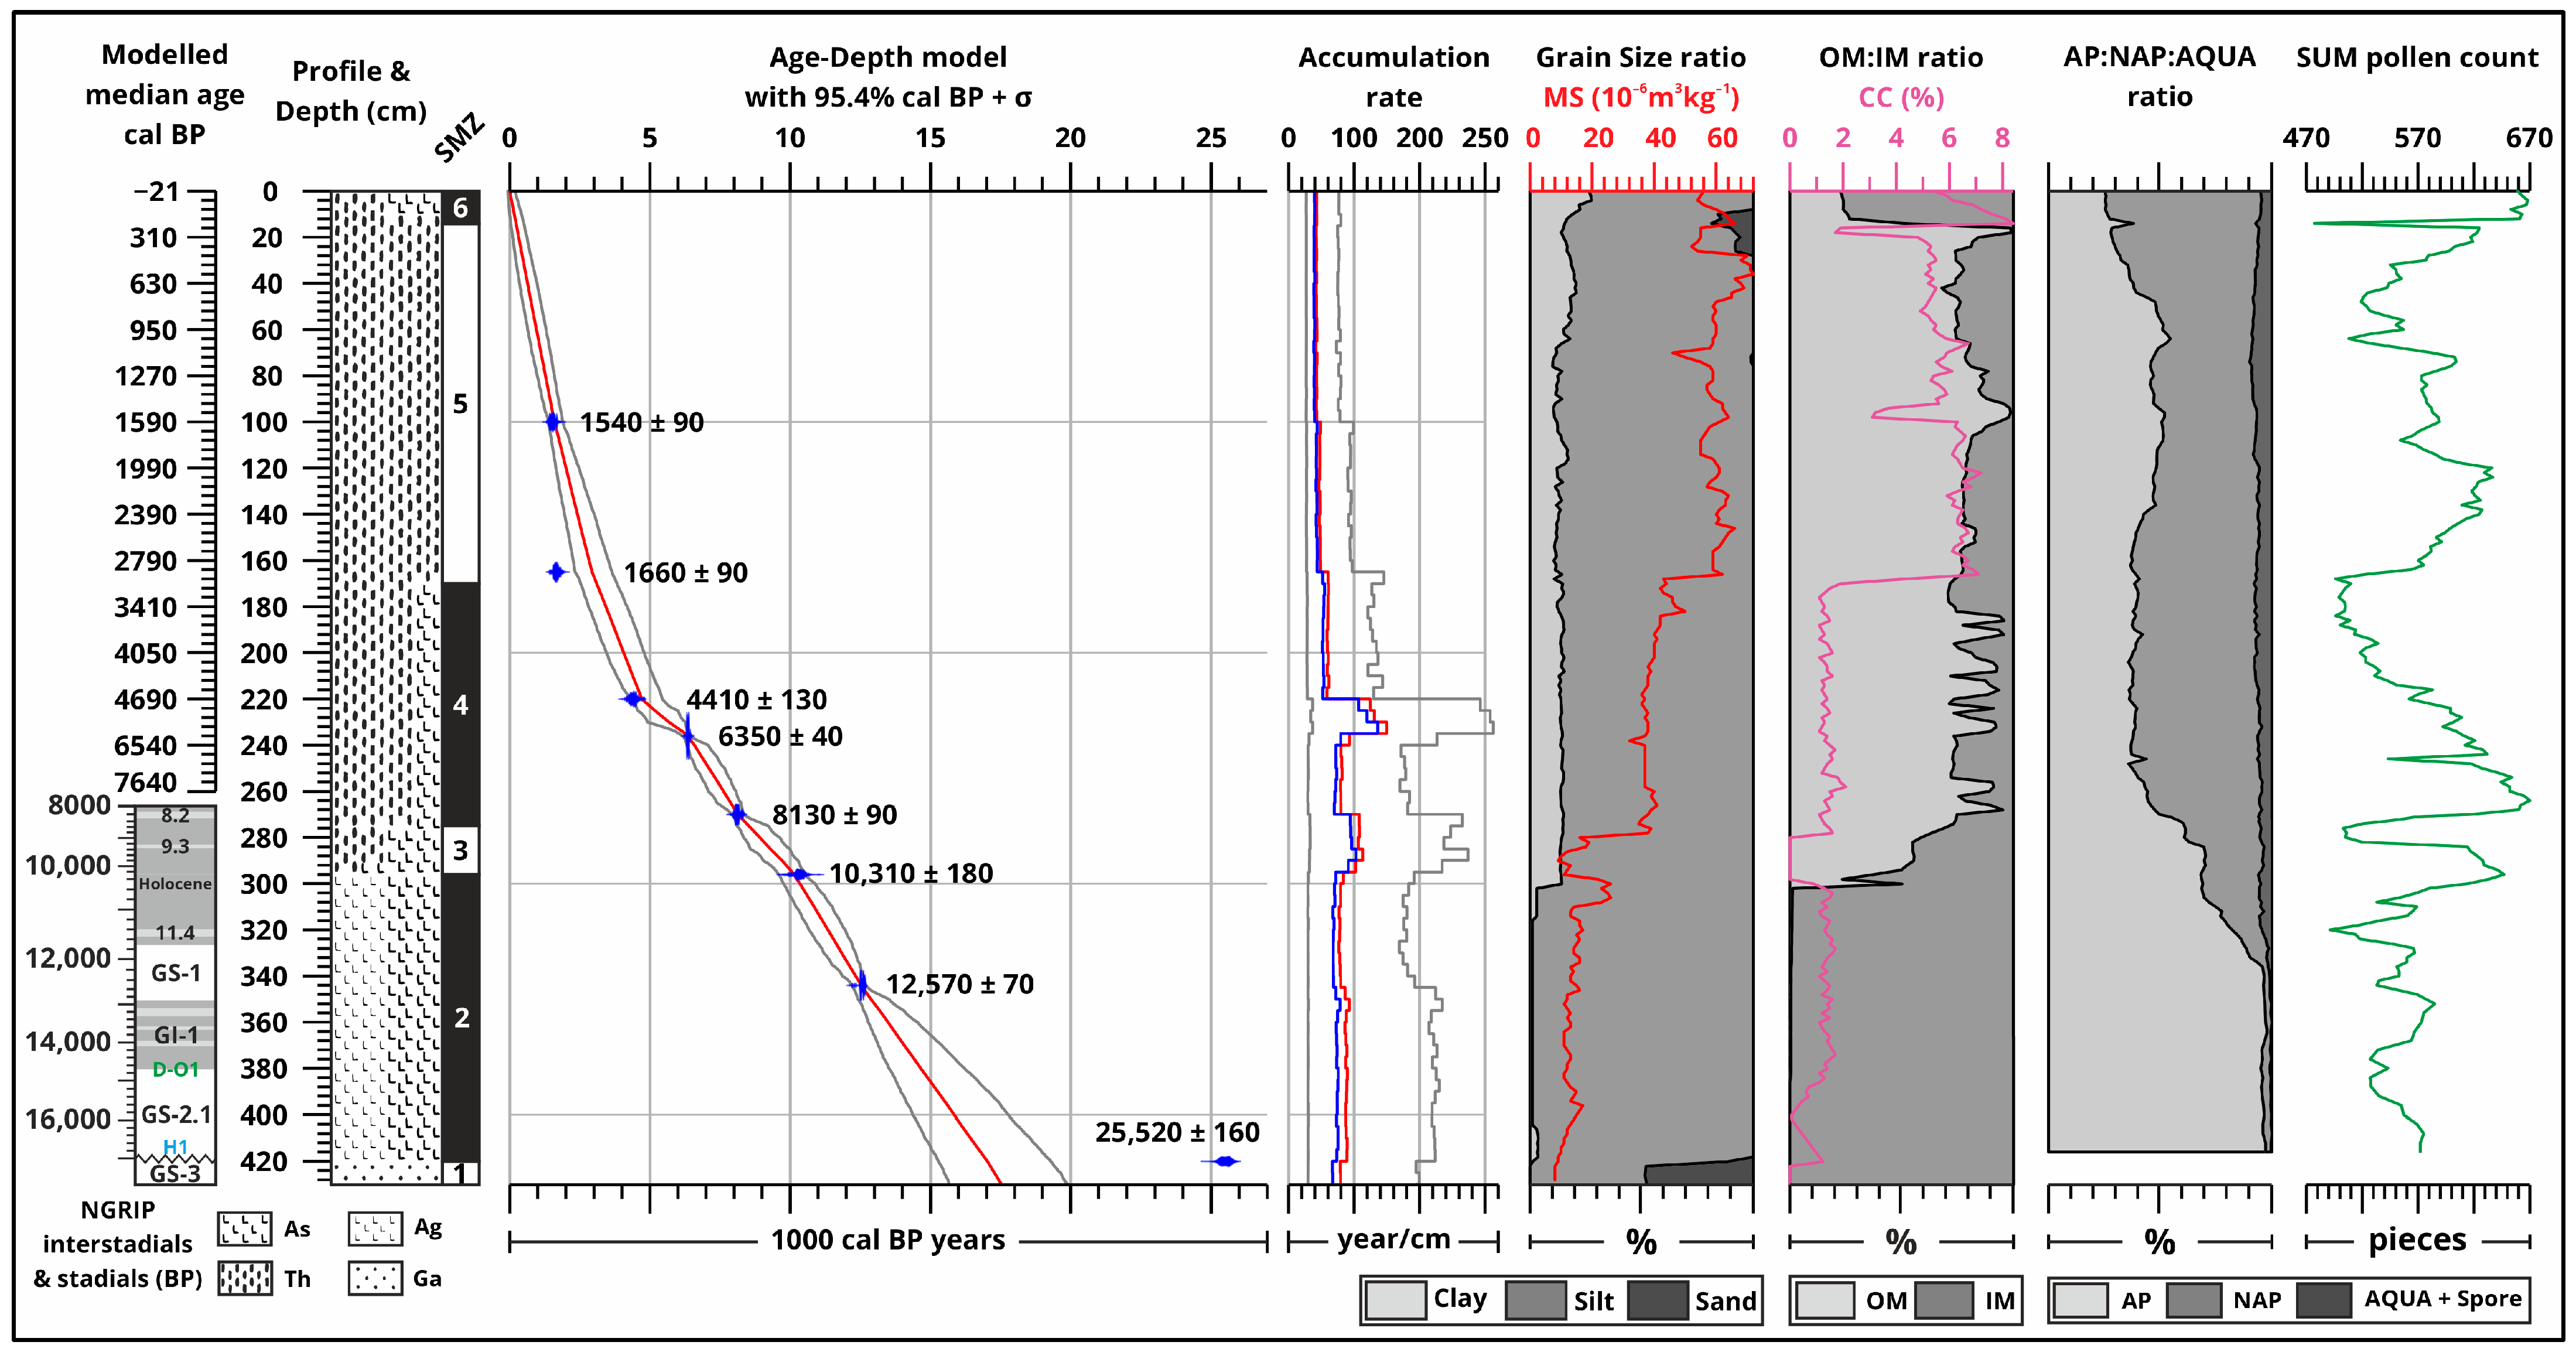
The record spans from the Late Pleistocene (approximately 25,500 cal BP) to the present day, providing an almost continuous archive of environmental change through the Late Pleistocene and Holocene (Table 2, Figure 5). The bottom of the Hajós sequence is around the MIS3/MIS2 transition or the start of MIS2 (430–420 cm). The sedimentological characteristics of the section between 430 and 420 cm differ significantly from the subsequent layer (420–296 cm). This distinct change suggests that the ages corresponding to the 420–297 cm section are likely closer to the modelled ages starting from 296 cm, rather than being a continuation of the age at 420 cm. Immediately above 420 cm, there is an abrupt jump of approximately 8000 years in the chronology. This would place the age from around 419 cm at ca. 17,000 cal BP. The sequence has 10 cm of MIS3/MIS2 or early MIS2 sediment (430–420 cm) and 20 cm of late-MIS2 sediment (420–400 cm) as well.
From around ca. 17,000 cal BP at 400 cm, date-wise, the sequence continues where the Katymár North loess wall sequence left off (around 16,000 cal BP at 82 cm), but ca. 40 km away in an oxbow lake environment, and right next to a loess wall. The Bølling–Allerød Interstadial [81,85], a major warm and moist phase, is represented approximately between 380 and 350 cm. The 11.4-kiloyear event [81,85], a brief cold spell at the onset of the Holocene, can be located around a depth of ca. 324–320 cm in the core. The 9.3-kiloyear cooling event [81,85,86,87] can be approximately located at around 284 cm in depth. The 8.2-kiloyear event [81,85,86,88,89,90], a widely studied cooling episode, can be identified at ca. 272–268 cm. The 4.2-kiloyear drought event [81,85,86,91,92] can be identified between ca. 204 and 220 cm.

3.3. Sedimentological and Geochemical Results

3.3.1. Katymár North Loess Wall

The data (Table 3, Figure 4) suggest an inverse relationship between carbonate and inorganic material content, as evidenced by their complementary ranges, with the only exception at around the surface from ca. 100 to 0 cm. The organic matter content starts off with an increasing trend, only to remain consistently low, up until the modern-day topsoil layer where it reaches its maximum of 7.29%. Carbonate content fluctuates within a small range as well, generally remaining around 12–13%. The dominance of inorganic matter highlights the significant role of physical processes, especially aeolian transport, in shaping the depositional environment (Figure 5 and Figure 6). From 1120 cm to ca. 548 cm, the analysed elements show rapid changes and fluctuations (Figure 7). Some peak around palaeosol levels (296 cm, 780–788 cm, 880–888 cm) where charcoal remains were found, like magnetic susceptibility: Ba, Al, Ca, Sr, Na, and K. After, up until 142 cm, more steady geochemical element values with slow and extended changes can be observed. Mn stays at a minimum up until 142 cm, where it peaks, after which Ca, Mg, Sr, Na, and K elements start to increase and fluctuate more again. The U-ratio shows an increasing trend, along with the appearance of very fine and medium sand grain sizes (ca. 700–220 cm) (Figure 4 and Figure 6), with a lot of peaks from ca. 900 to 300 cm, up until the middle of the LGM, from where the U-ratio decreases toward the surface. In the top 20–30 cm, the U-ratio, MS value, and organic matter content peak, while carbonates and Mn, Sr, and Na elements decrease. Longer, finer cycles and shorter loess cycles are observed at the bottom. From ca. 24,000 cal BP onward, the loess cycles become longer, the finer-grained cycles become shorter.

3.3.2. Hajós Hay Meadows and Loess Banks

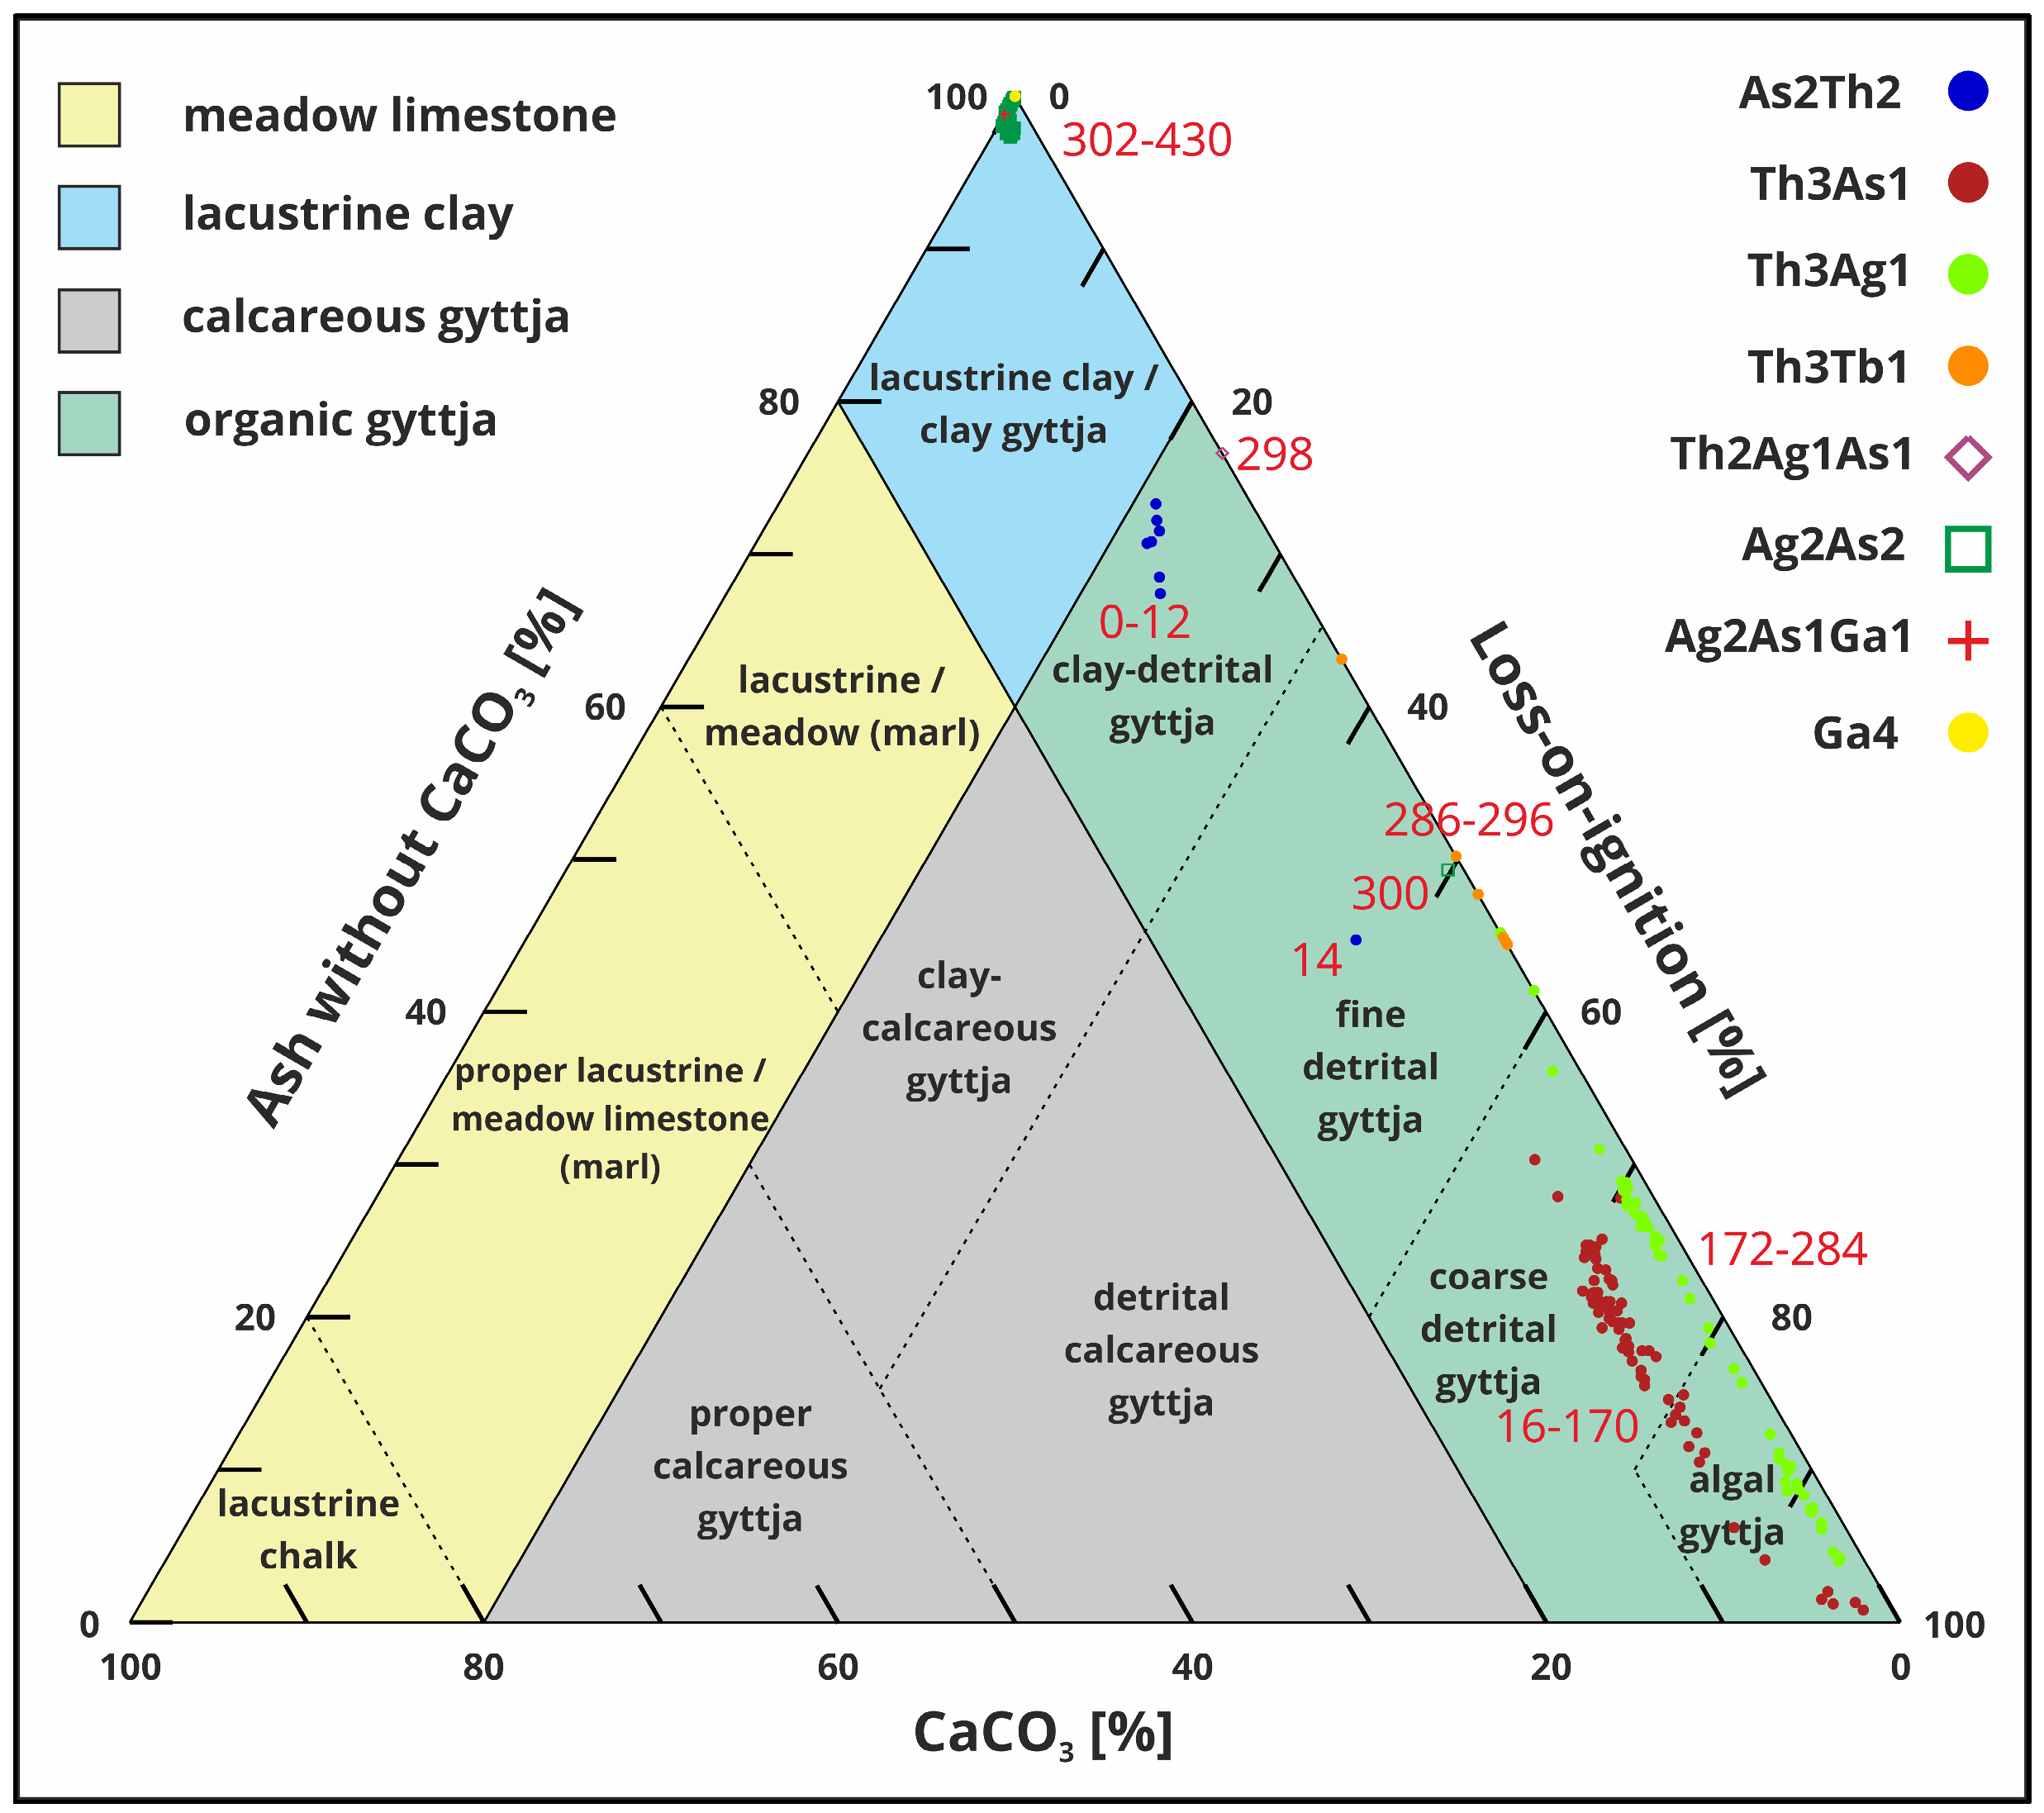
The data (Table 4, Figure 5 and Figure 8) suggest an inverse relationship between organic and inorganic material content, as evidenced by their complementary ranges, although only from 300 cm, from which the organic matter content increases from 1.12% to 49.8%. This also marks the second interval between 298 and 280 cm, where carbonate content reaches 0%. This exact interval is where Ca, Mg, and Na contents decrease, while Fe and Mn contents peak (Figure 9). After 280 cm, carbonate content is positively correlated with Ca, Mg, Na, and K content fluctuations.
The Polish bottom lake classification system (Figure 8) [93,94], which is based on loss-on-ignition data (Figure 5, Table 4) [3], was used to differentiate between the phases and provide a clearer understanding of the evolution and development of the oxbow lake-mire system. With this system, it is possible to interpret the LOI data to describe the sediment types, especially if paired with the Troels-Smith classification [23], grain size, magnetic susceptibility, and geochemical analysis (Figure 9) [95,96].
SMZ-1 (430–420 cm, around 25,500 cal BP): The bottom layer is characterised by cross-bedded fluvial fine sand layers, indicating a riverine environment. No pollen or macrobotanical remains, but it contains shell and snail fragments, suggesting a well-oxygenated, shallow-water habitat [3]. Sand and coarse silt grain sizes dominate with high inorganic matter and low carbonate content. The lowest magnetic susceptibility value in the sequence. No organic matter or carbonate content, 100% inorganic matter.
SMZ-2 (420–296 cm, ca. 17,000–10,200 cal BP): A shift to a lacustrine environment, as evidenced by the fine silt, clay content, and lack of riverine sand. This suggests that the oxbow lake was cut off from the main river channel, leading to calmer waters and the deposition of finer sediments (fine, medium, and coarse silt). During this period, the magnetic susceptibility values, as well as the carbonate content, stay relatively stable and show a stable lacustrine environment. From ca. 15,200 cal BP (388 cm), all the water-soluble geochemical elements increased noticeably.
SMZ-3 (296–275 cm, ca. 10,200–9000 cal BP): Between 296 and 280 cm, a carbonate-free zone with reduced Ca, Mg, and Na content, along with increased organic matter and peak Fe and Mn content. This shows the start of the biogen infilling of the oxbow lake, where it became a marshy wetland habitat with “brown moss carpet” [97], and where mainly local and extra-local pollen grains accumulated [3]. An increase in clay and very fine silt grain sizes and a decrease in medium silt grain sizes.
SMZ-4 (275–170 cm, ca. 9000–1700 cal BP): The evolution of the catchment basin changed into a peatland, rich in pollen and macrobotanical remains. The sediment type also changed to coarse detrital gyttja and algal gyttja, indicating the continuous dominance of the organic matter with at least 70% organic matter content. Altogether, eight peaks of organic matter content can be described (more than 80% of organic matter: 268–266 cm, 260–256 cm, 234–230 cm, 224 cm, 218–212 cm, 208–200 cm, 194–190 cm, 186–184 cm), which might have had better conditions during vegetation periods. Low geochemical element values along with low clay and very fine silt grain size values. Increased magnetic susceptibility values. A decrease in the NAP count throughout the zone.
SMZ-5 (170–14 cm, ca. 1700–310 cal BP): An increase in the pollen count, carbonate content, and Ca, Mg, Na, K, Fe, and Mn element contents. Peatland phase with high organic matter content (algal and coarse detrital gyttja), especially between 104 and 78 cm (79.6–95.6%) and 20–16 cm (80.3–97.5%). A negative peak in carbonate content along with Ca, Mg, Na, and K content, and an increase in organic matter content between 98 and 90 cm. Low fluctuation in clay and very fine silt grain size values. Another increase in magnetic susceptibility values with small changes and a drop at the end of the zone along with carbonate and pollen count (477 pieces at 14 cm).
SMZ-6 (14–0 cm, ca. 310 cal BP to present): Fast transition from algal gyttja to coarse, and then from fine detrital gyttja (4) to clay detrital gyttja (5), which means a decrease in organic content, and an increase in inorganic and carbonate content. An increase in clay, very fine silt, and very fine, fine, and medium sand grain sizes near the surface.

3.4. Malacological Results

3.4.1. Hajós Hay Meadows and Loess Banks

The living water of Hajós lacked macrophytes, was well oxygenated, and was relatively rich in nutrients as indicated by the number of rheophilic molluscs (Valvata piscinalis, Valvata naticina, Lymnaea stagnalis, Planorbis cf. carinatus, Unio cf. crassus, Pisidium amnicum) from the base sand-rich layer between 430 and 420 cm [3].

3.4.2. Katymár North Loess Wall

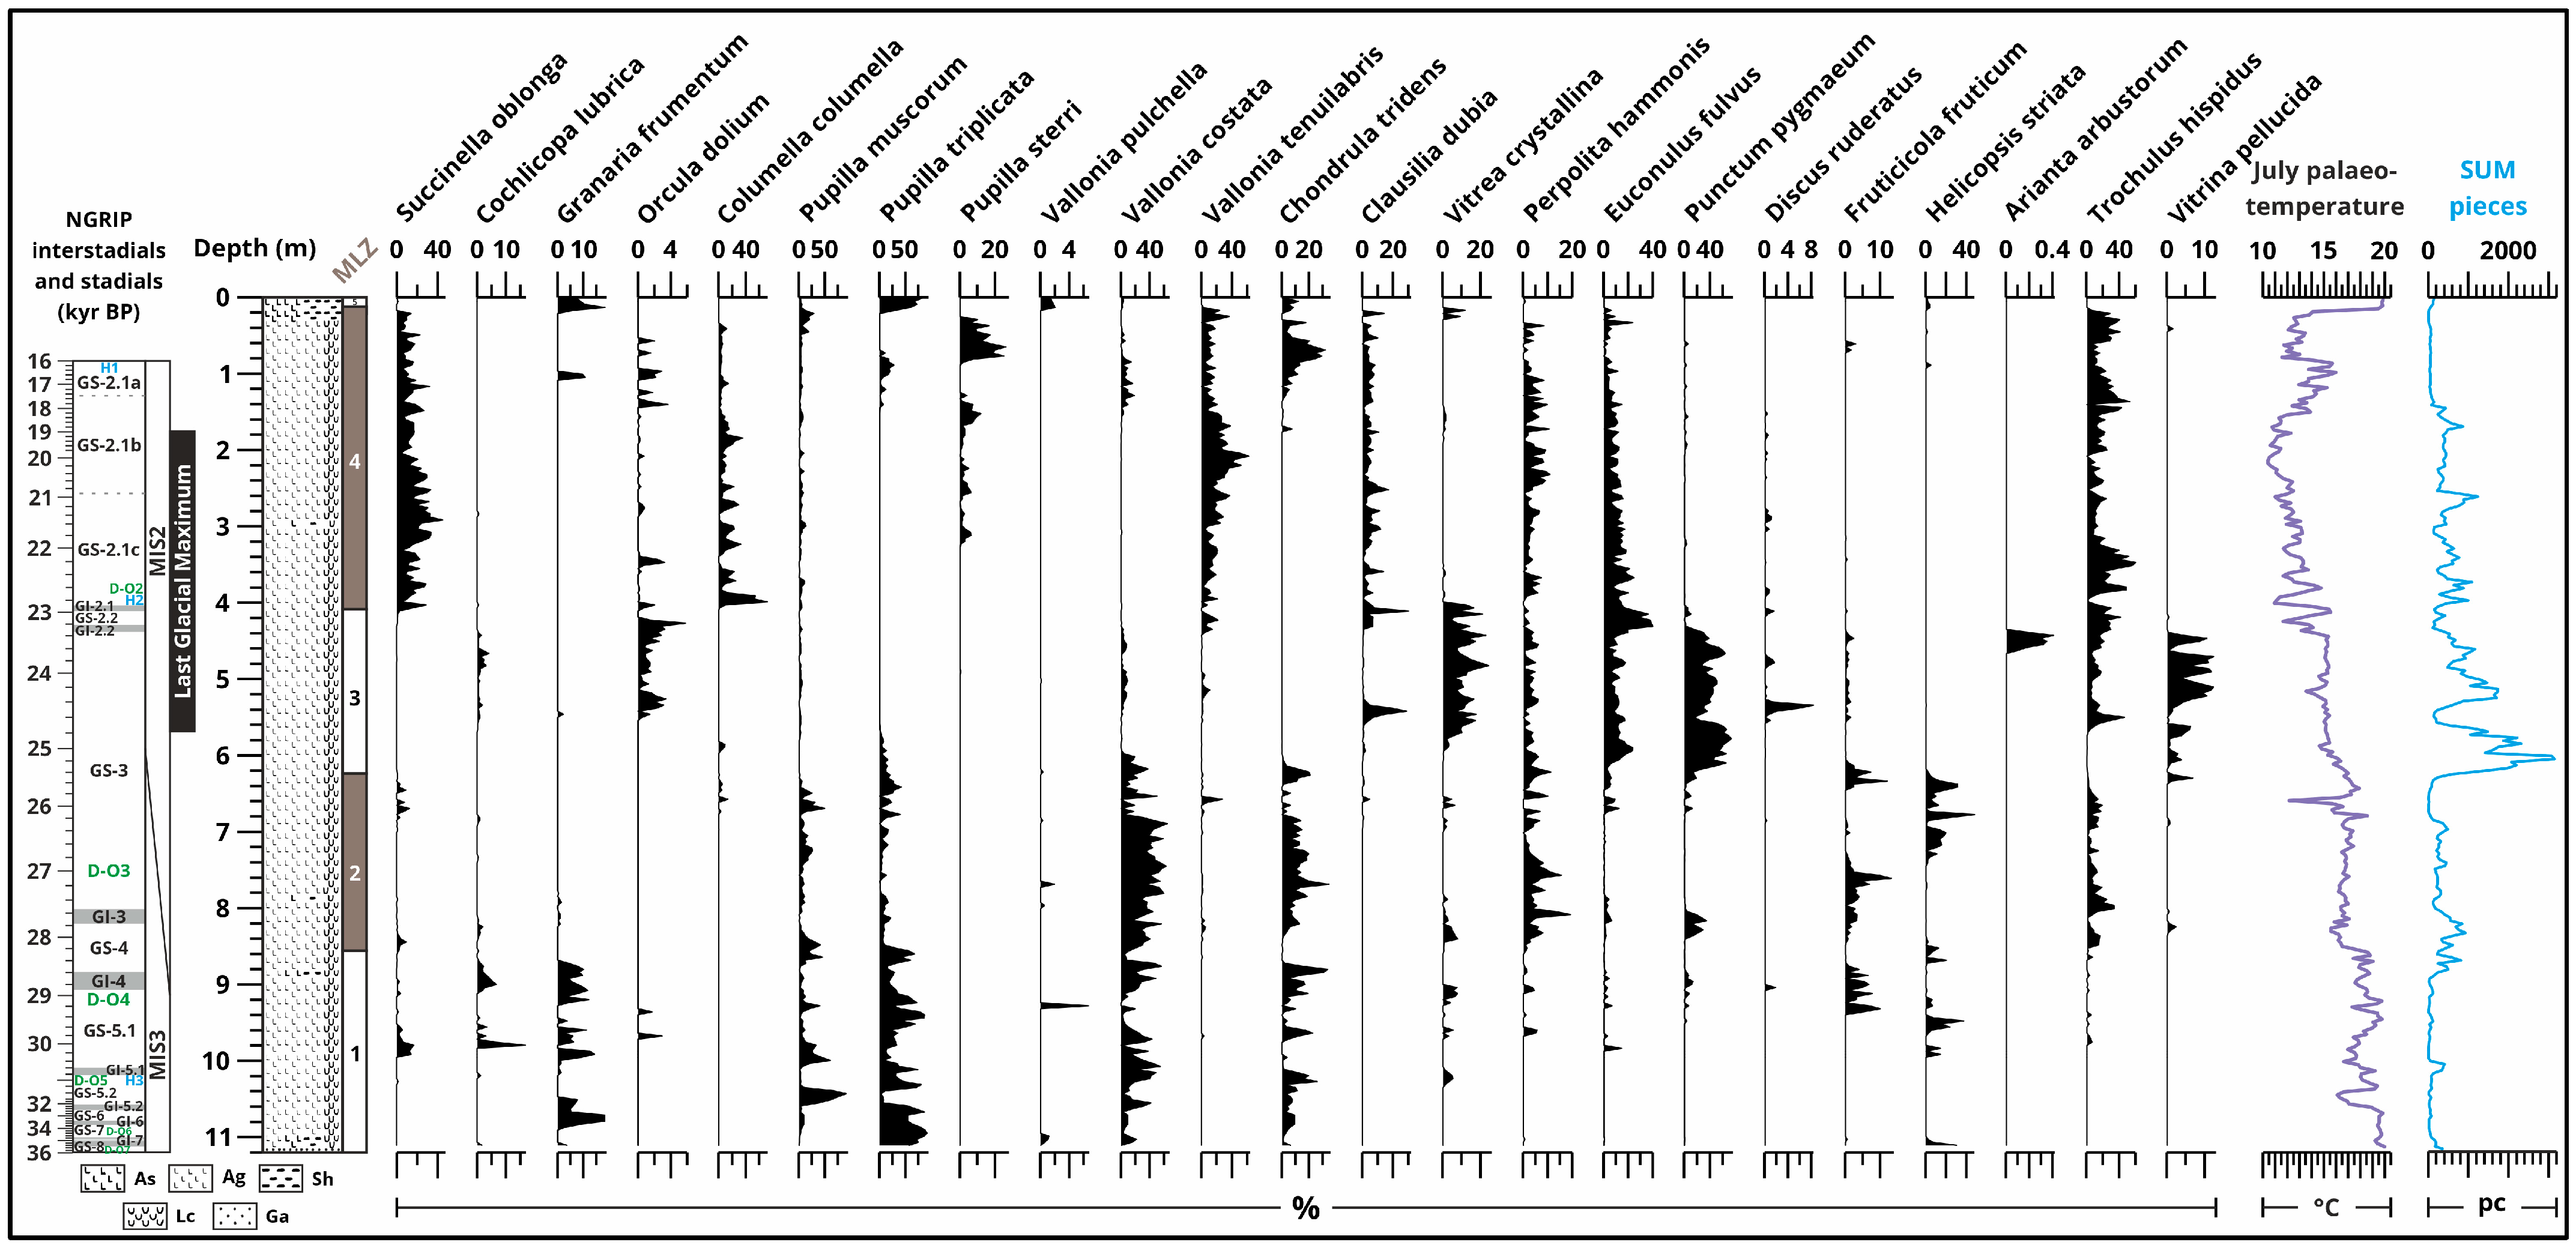
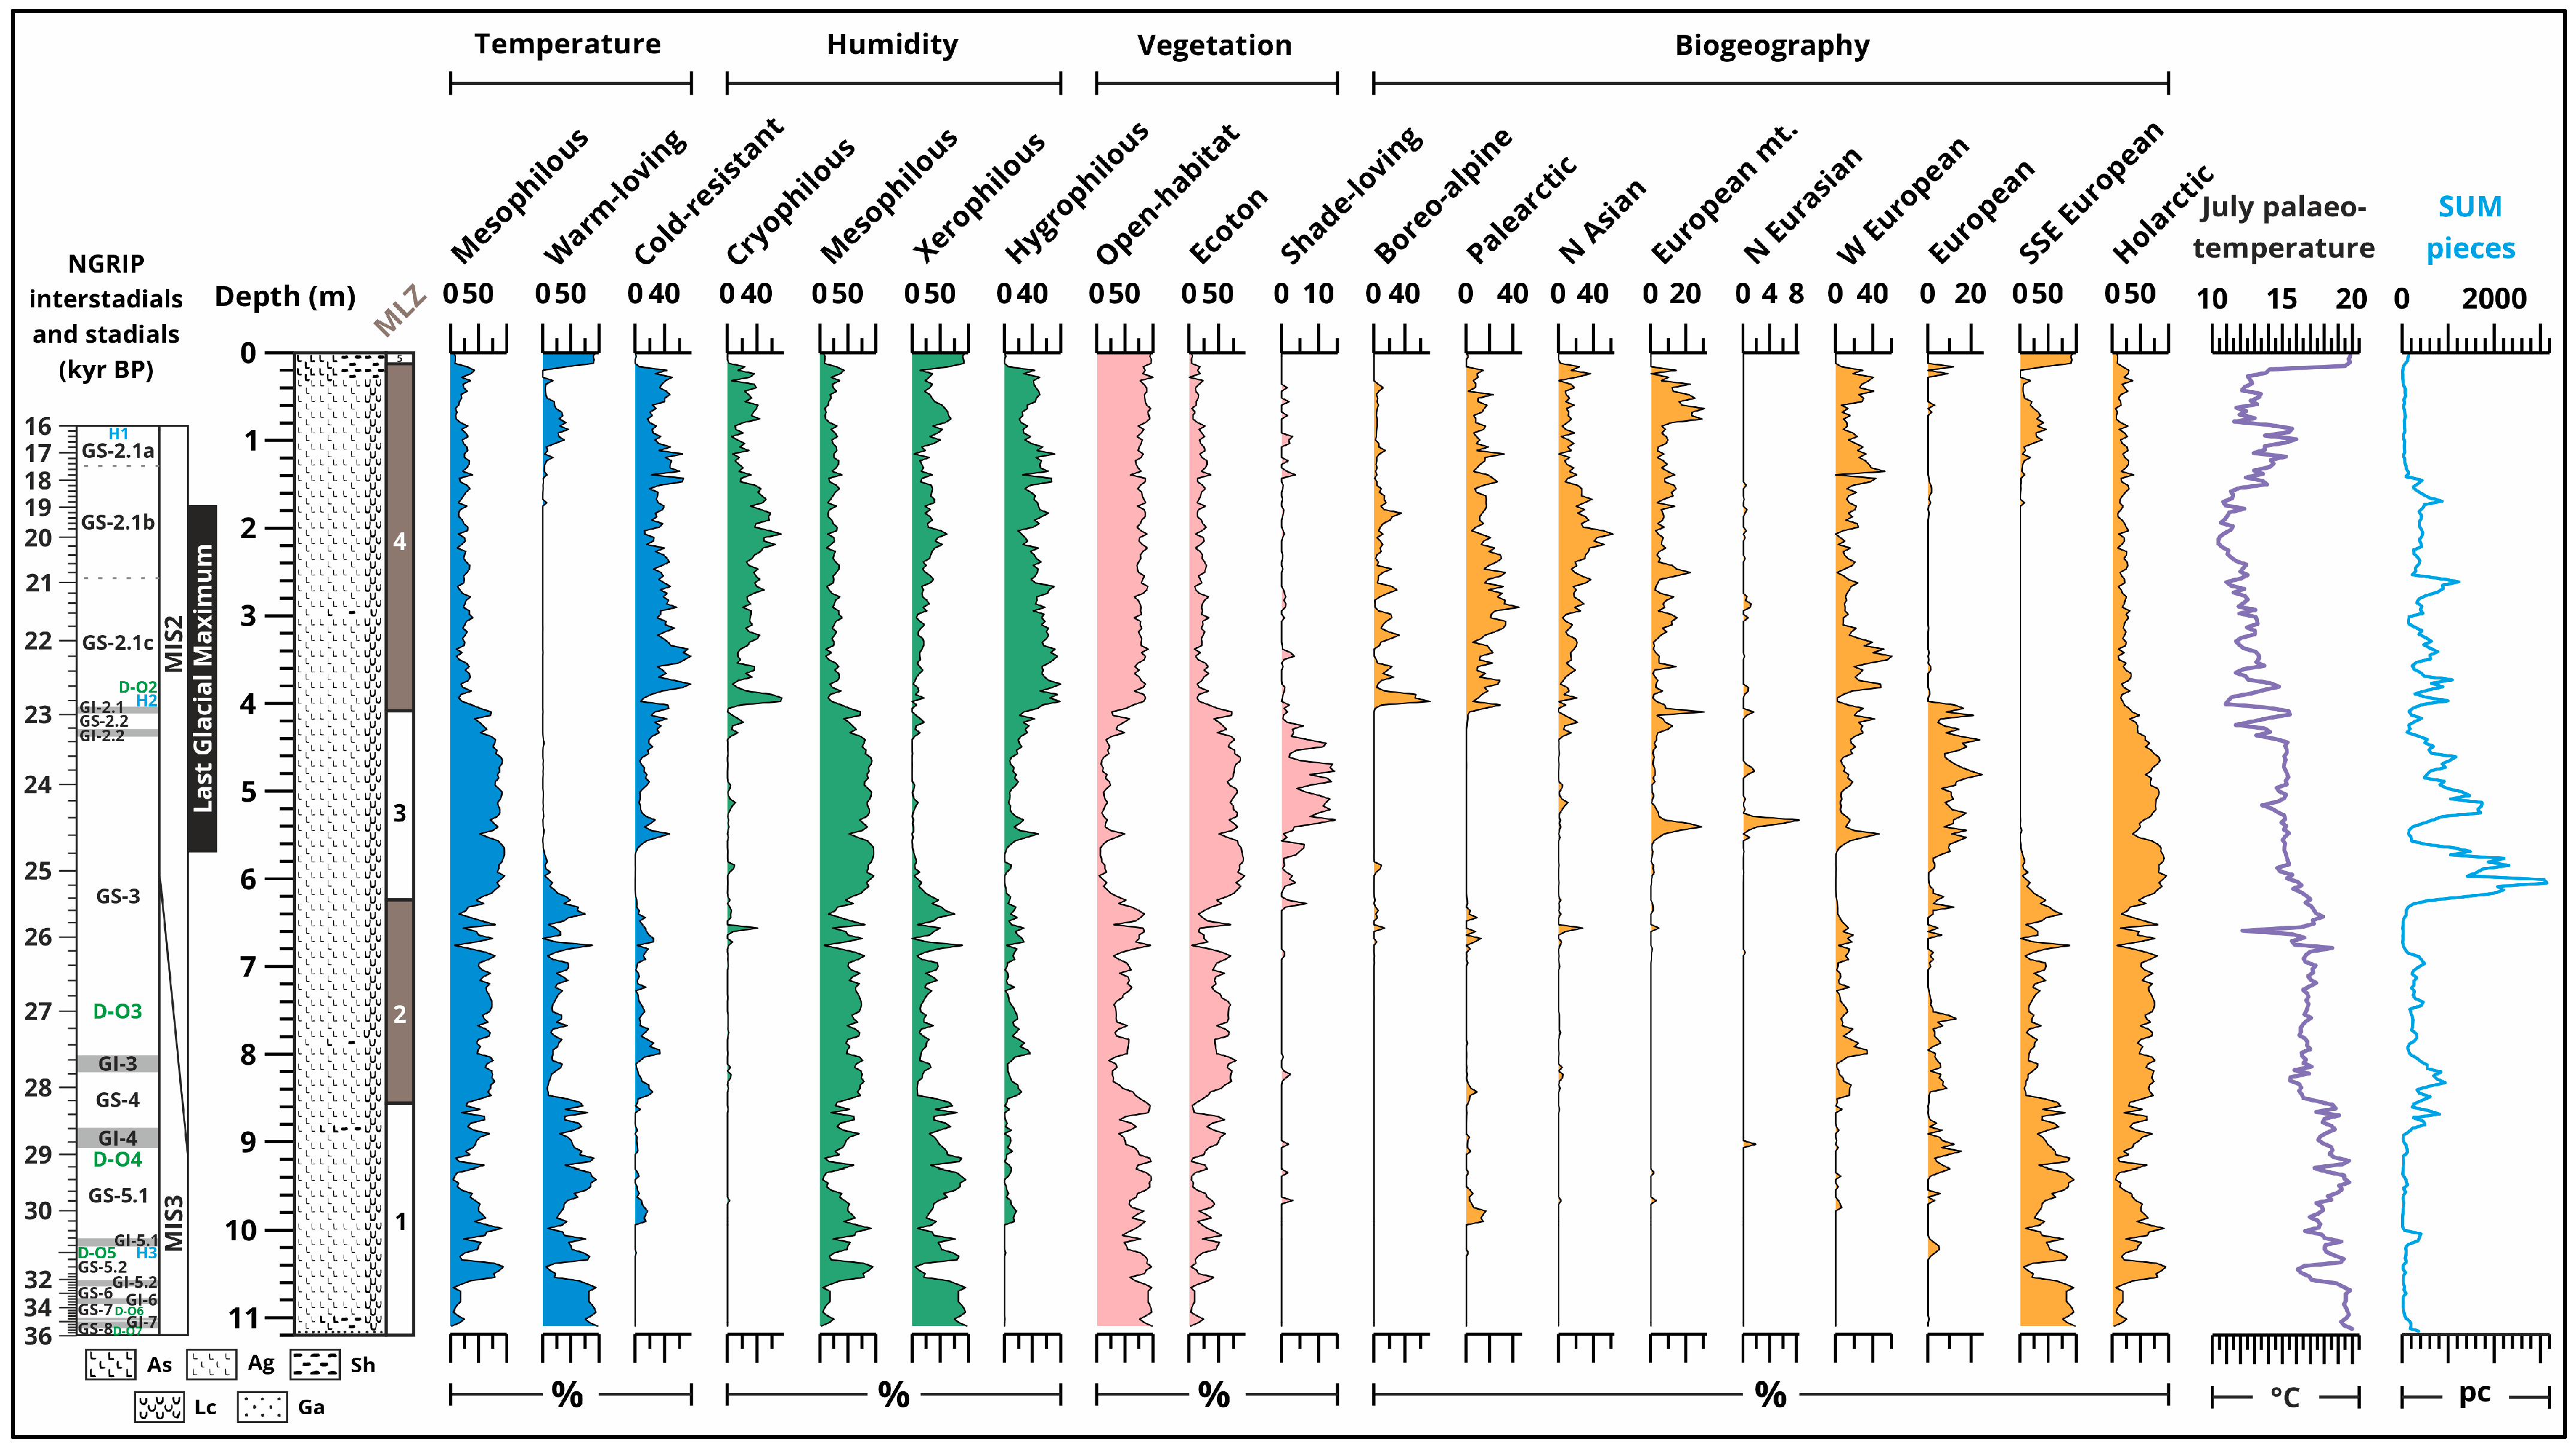
The malacological analysis (Figure 10 and Figure 11) of the Katymár North loess wall site reveals distinct ecological shifts over the past 36,000 years, reflecting changes in climate, vegetation, and biogeography. This sequence shows similarities to the Madaras sequence [21] as well as the Katymár West profile [3]. The malacological record provides high-resolution insights into local climatic conditions [3,21], complementing regional environmental reconstructions [5,6,7,8,9,10,11,12,13,14,15,16,17,18,19,20,21]. Based on the comprehensive analysis of mollusc assemblages, temperature preferences, humidity requirements, vegetation affinities, and biogeographical distributions [57,58,59,60,61,62,63,64,65,66,67,68,69,70], malacological zones (MLZ) were set (Table 5 and Table 6).
An increase in species diversity from around 998 cm can be observed (Figure 10 and Figure 11). In the MLZ-2, the appearance and peak of Fruticicola fruticum and Perpolita hammonis, alongside Vallonia costata and Chondrula tridens, suggest a more humid environment (Table 5 and Table 6). The disappearance of Succinella oblonga, Cochlicopa lubrica, and Granaria frumentum indicates a significant ecological shift, possibly related to the onset of colder conditions preceding the LGM. The dominance of mesophilous species increase up to 96% in the MLZ-3, and warm-loving species slowly withdraw and give place to clod-resistant species around the start of the LGM (572 cm) (Table 5 and Table 6). The transformation is indicated by the afforestation that occurred during the LGM, with shade-loving snail species (Vitrea crystallina, Punctum pygmaeum, Vitrina pellucida) reaching a maximum of 14% and ecoton species taking over the dominance (at 624 cm) with an average of 75% and maximum of 93%. The disappearance of several species (e.g., Pupilla muscorum, Pupilla triplicata, Vallonia costata, Chondrula tridens, Fruticicola fruticum, and Helicopsis striata) and the emergence of others (e.g., Vitrea crystallina, Orcula dolium, Punctum pygmaeum, and Vitrina pellucida) reflect the harsh conditions of the LGM. The peak in pollen count at 600 cm suggests a brief period of increased vegetation cover, as well as starts a transition. The MLZ-4 encompasses the second half of the LGM, the Late Glacial period and the Bølling–Allerød interstadial and Younger Dryas stadial. The malacofauna show rapid fluctuations in species composition, reflecting the climatic instability of this period. Succinella oblonga, Columella columella, Vallonia tenuilabris, and Clausilia dubia appear again and stay until the end of the zone. The reappearance of thermophilous species like Chondrula tridens, alongside cold-tolerant taxa, suggests a dynamic environment responding to abrupt climate changes and suggests increasing habitat diversity (Pupilla sterri). The pollen count decreases and reaches a count of ca. <200 from 140 cm onwards, from which point the temperature starts to increase again. Granaria frumentum (max. 18%), Pupilla triplicate (82%), Vallonia pulchella (2%), and Chondrula tridens (12%) peak at the surface (16–0 cm), but the MLZ-5 is species and individual poor. The Holocene malacofauna indicate a return to steppe-like conditions, raising questions about the relative roles of climate and human activity in shaping the modern landscape (Figure 10 and Figure 11, Table 5 and Table 6).

3.5. Phytolith and Anthracological Results

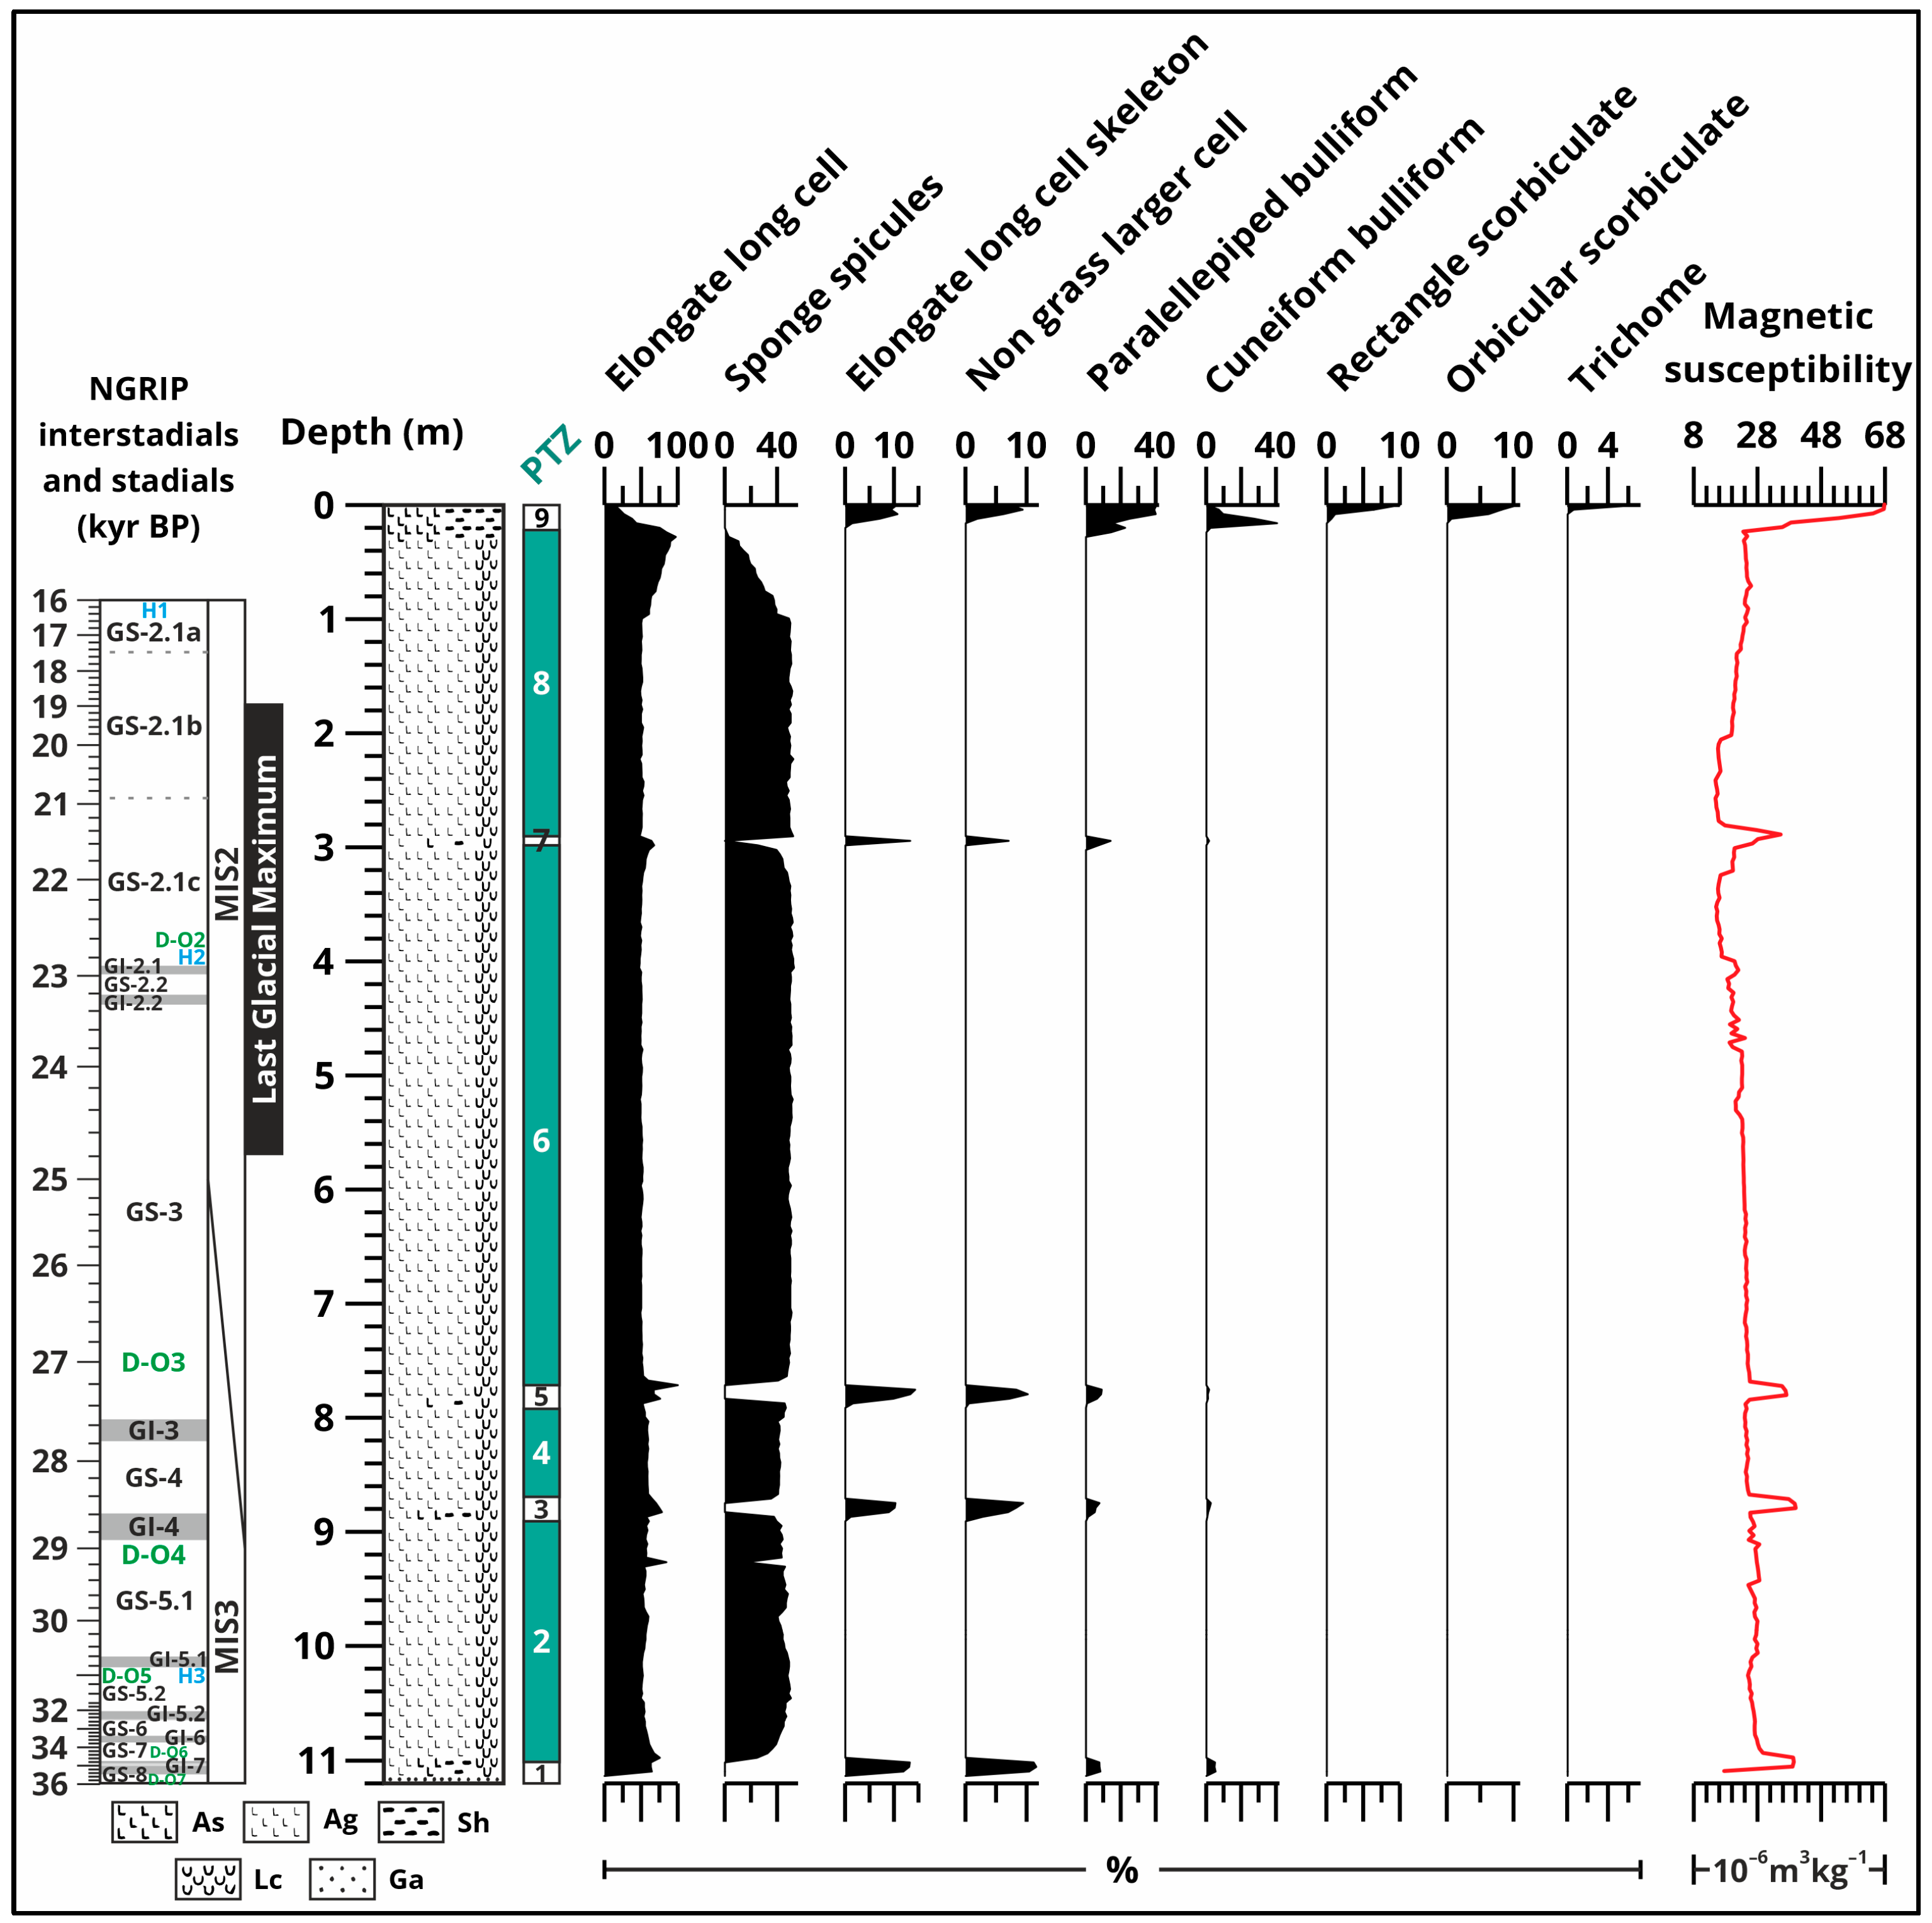
Phytoliths from the northern wall of the Katymár brickyard indicate a simple, almost homogeneous, species-poor steppe environment, with the soil levels primarily suggesting an open parkland or forest–steppe vegetation cover (Figure 12, Table 7). This interpretation is supported by the pollen profile from Hajós [3], which reveals the presence of species-poor steppes and open parklands at the end of the glacial period. The data (Figure 12, Table 7) show a cyclical pattern alternating between periods dominated by elongate long cell and sponge spicules (PTZ-2, 4, 6, 8) and periods with more diverse phytolith forms (PTZ-1, 3, 5, 7, 9) in the palaeosol layers and modern-day soil. Although, like in the western part, Katymár lacks well-developed palaeosol layers [1]. Pinus and Betula remains are present in the palaeosol layers; meanwhile, Quercus remains were found at the surface (Table 7). The presence of burnt Pinus remains in several zones indicates natural fires. The core can be separated into three main compositions: one that consists of elongate long cells, elongate long-cell skeletons, non-grass larger cells, parallelepiped bulliforms, and cuneiform bulliforms with greatly reduced sponge spicules, which correlates with the magnetic susceptibility peaks and the palaeosol levels (PTZ-1, 3, 5, 7); another one with only elongate long cells and sponge spicules (PTZ-2, 4, 6, 8), for which the composition is dominant throughout the sequence; and the last one near the surface, which is similar to the first composition (PTZ-1, 3, 5, 7), but the elongate long cells are minimal and with new phytolith forms—rectangle scorbiculate, orbicular scorbiculate, and trichome (PTZ-9).

4. Discussion

The comparison of the Hajós and Katymár profiles was made possible by radiocarbon measurements. However, even before these measurements, the Danube Valley was considered to be between 25,000 and 35,000 years old [98,99,100,101,102]. This dating was based on the understanding that during this period, the Danube River slid off the alluvial fan that had developed in the Danube–Tisza interfluve and incised into its current location. The channel exposed at Hajós, which became marshy during the Holocene, belonged to the oldest generation of Danube riverbeds. This channel dates back to the MIS3/MIS2 boundary. The multi-proxy analyses of the Katymár North loess–palaeosol sequence and the Hajós hay meadow and loess bank cores provide compelling evidence for the climatic and environmental evolution of the Carpathian Basin over the Late Pleistocene and Early Holocene. These two sequences offer complementary insights into the region’s palaeoenvironmental history, demonstrating both shared sensitivities to global climate forcings and site-specific responses to local environmental conditions.
The Katymár North sequence presents an extended chronology, spanning from the latter part of Marine Isotope Stage 3 (MIS3) through the Last Glacial Maximum (LGM), Late Glacial period, and into the early Holocene. This comprehensive record provides a broader context for understanding the long-term climate variability and environmental dynamics of the region. In contrast, the Hajós sequence focuses on a shorter timeframe, capturing the transition from the LGM through the Late Glacial interstadial and into the Holocene, including its early climatic instabilities. For Hajós, the transition from fluvial deposits to lacustrine sediments and finally to peat layers reflects not only local [3,38,39] geomorphological processes but also broader regional changes in hydrology [95,98,99,100,101,102].
Both sequences clearly demonstrate the high responsiveness of the Carpathian Basin to global climate forcings, particularly during periods of rapid change. The distinct signal of the Bølling–Allerød Interstadial, evident in both records, exemplifies the synchronous regional response to large-scale climate oscillations. This correlation between the two sequences not only validates their individual findings but also underscores the coherent nature of climate-driven environmental changes across the Carpathian Basin. The comparison of these two sequences highlights the value of multi-site studies in palaeoclimatological research. While the overall trends align, subtle differences between the sites offer insights into local factors influencing environmental responses.
Due to the malacofauna strongly tied to the local environment in the area, it can primarily be compared to the Serbian Vojvodina [15,19,20] and Croatian Baranja [103,104], which can be considered continuations of the loess area. However, a significant problem with this comparison is that our analysis, based on finer sampling, has a century-scale time resolution, while the Serbian and Croatian profiles have millennial-scale malacological analyses due to coarser sampling. A global comparison could be made with the malacological materials of Chinese loess profiles [105,106]. The results clearly show that in the southern part of the Carpathian Basin, at the end of the Pleistocene, a different faunal development took place compared to the rest of the basin. Based on the continuous presence of thermophilic steppe-dwelling faunal elements, it can be assumed that the temperate grassland habitat [60,66,67,68,107,108,109], even if in patches, persisted in the studied region during the most significant glaciations (cooling periods).
The same changes observed in quartermalacological data were also detected in the southern Great Hungarian Plain profiles [45,58,59]. A key characteristic is that during significant warming periods (MIS2/MIS3 transition, early Holocene), soil formation processes were accompanied by the appearance of Cepaea vindobonensis, a characteristic taxon of Pannonian forest–steppe environments [110,111,112,113,114,115,116]. Károly Bába’s works [114,115,116] highlighted the recent relationship between the temperate forest–steppe vegetation and snail fauna in the southern Great Hungarian Plain. Consequently, Cepaea vindobonensis is the characteristic element of the final malaco-successional community of the Pannonian –steppe, which developed under the influence of the regional climate resulting from the basin situation [117], rather than Drobacea banatica (Helicigona banatica [20]). The regional connection is established by the cyclical appearances of Granaria frumentum, which is also characteristic of temperate forest–steppe environments, during warming periods. This taxon only appears in the southern part of the Carpathian Basin during the MIS2 time horizon [58,59,118], primarily during warming phases [58,59]. In the LGM horizon, temperate Pannonian forest–steppe elements appear in subordinate proportions during the so-called micro-interstadial phases [119,120,121]. This characteristic is unique to the central and southern parts of the Great Hungarian Plain [1,45,69]. Thus, both geochemical and malacological data from the Katymár loess profile indicate the development of an independent regional role for malacological changes observable only within this region, signalling the formation of an Ice Age ecoregion in the central and southern parts of the basin. This is further supported by malacological changes observed only in the region, such as the last spatial occurrence of cold-loving, xeromontane Asian elements in the basin, which do not appear further south [58]. Moreover, the finer temporal changes in the malacofauna already differ from those in the southern part of Transdanubia. However, alongside the spatial pattern, the temporal pattern of changes and faunal composition is characteristic of this ecoregion. A prominent feature of the ecoregion, as revealed by local data [1,45,69], is that during the LGM horizon, in the Upper Palaeolithic and then Mesolithic levels, an extremely species-rich fauna characteristic of mesophilic boreal and temperate forest–steppe developed. This faunal horizon then evolved into a hygrophilous forest–steppe fauna rich in forest-dwelling elements at the end of the LGM and the beginning of the post-LGM period. A notable characteristic of the profile is that following the faunal horizon associated with the micro-interstadial in the LGM level, a merging temperature minimum can be reconstructed at the end of and following the LGM [25]. Similar changes were detected in the region based on pollen, anthracological, and phytolith remains [1,45,69,119,120,121,122,123,124,125,126,127,128,129,130,131,132,133].
During the late glacial cooling, various species-rich boreal forest–steppes developed, with the main differences being the proportion of tree-covered areas (boreal open parkland, parkland, boreal forest–steppe) and the composition of woody vegetation [130]. During warming periods, a cascade-type change [134] led to a decrease in species numbers in both vegetation and malacofauna. Based on malacofaunal changes, the number of temperate forest–steppe taxa is about one-third of the number of taxa detectable in the late glacial mixture of boreal steppe/forest–steppe/forest patches (ecotone [117,135]). As a result, in the southern and central parts of the Carpathian Basin, temperature was no longer the most significant palaeoecological limiting factor for biota at the end of the Ice Age, but rather humidity and surface moisture. Thus, during Quaternary cooling periods, humidity increased, favouring the species and individual numbers of ecotone-like forest–steppe intermittently mixed with tundra and temperate forest–steppe elements. During warming periods, the ecotone structure remained, but Boreo-Alpine, Asian xeromontane, and Central European montane elements were displaced, leading to a decrease in species numbers, while trees and herbaceous plants characteristic of temperate forest–steppe spread across this ecotone vegetation structure. The most prominent feature of the late glacial ecoregion in the studied area, including the examined profiles, was that in contrast to the northern and western parts of the basin where Picea (spruce) was the most important woody taxon, in this region, Pinus sylvestris, Betula, and Abies taxa appeared. Thus, on the southern edge of the extremely heterogeneous Eurasian loess zone, the central and southern parts of the Carpathian Basin form an independent mosaic (ecoregion) due to the basin’s climatic influence and the Danube alluvial fan background. This can be imagined as if the Eurasian loess belt (zone) were a parquet floor (parquet–mosaic, fragment, fractal element from an environmental history perspective [136]) composed of fragments (fractal elements) with independent developmental histories covering several million km2, and one independently developing part of about 40–50 thousand km2 is located in the central and southern part of the Carpathian Basin. The developmental history of this fractal element bears characteristic differences even within the loess belt of the Carpathian Basin and is markedly distinct from the SE European and other European loess belt regions in terms of its developmental moments.

4.1. MIS3 Level (ca. 36,000–29,000 cal BP)

The malacological assemblage during Marine Isotope Stage 3 (MIS3) at the Katymár North loess wall site is characterised by a diverse fauna dominated by xerophilous and thermophilous species. The presence of Granaria frumentum, Pupilla triplicata, and Chondrula tridens suggests a predominantly open, steppe-like environment with patches of shrubland or sparse woodland (Figure 10 and Figure 11). This assemblage is indicative of relatively warm and dry conditions, with estimated July palaeotemperatures ranging from 16 to 20 °C. The occurrence of Vallonia costata in the accompanying fauna further supports the interpretation of a mosaic landscape, where open grasslands were interspersed with areas of denser vegetation. The gradual increase in species diversity observed from around 998 cm in depth (corresponding to the latter part of MIS3) indicates a shift toward more favourable environmental conditions. This diversification may reflect an increase in habitat heterogeneity, possibly due to localised increases in moisture availability or the development of more complex vegetation structures. Geochemically, this level is characterised by elevated levels of Ba, Al, and Fe, suggesting enhanced weathering and soil formation processes, which is corroborated by the lower carbonate content (Ca and Mg) compared to later, colder periods [137,138,139,140,141,142,143,144,145,146] (Figure 7). The organic content, while generally low throughout the sequence, shows slight increases during this period, further supporting the interpretation of a more productive ecosystem (Figure 4). The U-ratio is lower, and magnetic susceptibility is higher, indicating finer particle deposition and potential pedogenesis, consistent with more stable, warmer conditions (Figure 4 and Figure 6).

4.2. MIS3/MIS2 Transition (ca. 29,000–25,000 cal BP)

The transition from MIS3 to MIS2 is marked by gradual changes in multiple proxies, reflecting the shift toward colder and drier conditions. This period is characterised by the dominance of the Pupilla muscorum palaeoassociation, indicating a general cooling trend with July palaeotemperatures dropping to approximately 15–17 °C (Figure 10 and Figure 11). The appearance and peak abundance of Fruticicola fruticum and Perpolita hammonis, alongside the persistence of Vallonia costata and Chondrula tridens, suggest an increase in environmental humidity and the development of more mesic habitats. A notable feature of this transitional period is the disappearance of several species that were prominent during MIS3, including Succinella oblonga, Cochlicopa lubrica, and Granaria frumentum. This faunal turnover reflects a significant ecological shift, likely driven by the increasingly cold conditions preceding the LGM. The persistence of some thermophilous elements, such as Chondrula tridens, alongside the emerging cold-tolerant fauna, indicates a complex environmental mosaic during this transition. This pattern suggests that while the regional climate was cooling, local topographic and microclimatic factors may have allowed for the maintenance of diverse habitats, supporting a mixed malacofauna adapted to varying environmental conditions. Geochemically, this transition is characterised by decreasing trends in Ba, Al, and Fe, indicating reduced weathering intensity. Conversely, Ca and Mg concentrations begin to increase, signalling enhanced carbonate content in the sediments (Figure 7). The U-ratio starts to increase while magnetic susceptibility decreases, reflecting a shift toward coarser particle deposition typical of loess accumulation under colder, windier conditions (Figure 4 and Figure 6). These changes collectively point to the onset of more severe glacial conditions, with reduced biological productivity and increased aeolian activity.

4.3. MIS2 Level (ca. 25,000–14,000 cal BP)

The most significant cooling events in the Carpathian Basin occurred during the LGM, with the snail fauna (Figure 10 and Figure 11) indicating temperatures of 10–12 °C. However, we must acknowledge that we collected the fauna on the northern side, which did not receive sunlight, unlike the already published western side [1]. We hypothesise that the cooling was accompanied by an increase in humidity, leading to the development of greater vegetation cover (maximum dominance of shade-loving, Holarctic snail species). The MIS2 level displays clear signatures of a cold and dry environment and reflects the harshest climatic conditions of the sequence. The early part of this period sees a marked increase in mesophilous species, while warm-loving taxa gradually withdrew (Figure 11). The disappearance of species such as Pupilla muscorum, Pupilla triplicata, and Vallonia costata, coupled with the emergence of cold-tolerant taxa like Columella columella and Vallonia tenuilabris, clearly demarcates the onset of full glacial conditions. As the LGM progresses, the malacofauna shows signs of adaptation to extreme cold and dry conditions (Figure 10). The appearance and increasing abundance of species such as Vitrea crystallina, Orcula dolium, Punctum pygmaeum, and Vitrina pellucida suggest the development of patchy, humid microhabitats, possibly associated with sparse vegetation cover or sheltered locations. The transformation from 600 cm is indicated by the afforestation, with shade-loving species reaching a maximum dominance of over 20%. The fauna composition at the end of the Ice Age was blurred, with no marked difference between the LGM and post-LGM snail fauna. The maximum dominance of the Boreo-Alpine Columella columella, the South and North Asian Vallonia tenuilabris, the Central European mountainous Clausilai dubia, the Palearctic Succinella oblonga, and the Western European Trocholus hispidus developed. However, in levels younger than 18,000 years (cal BP), the appearance of SE European thermophilic species began, along with a parallel decrease in the combined proportion of cold-loving species. This process culminated in the Holocene soil level. Geochemically, this period is marked by low concentrations of Ba, Al, and Fe, reflecting minimal weathering and soil formation [137,138,139,140,141,142,143,144,145,146] (Figure 7). In contrast, Ca and Mg levels reach their peak, indicating maximum carbonate content in the loess deposits. The U-ratio is at its highest, while magnetic susceptibility is at its lowest, clearly indicating an intense loess deposition of coarser particles under cold, arid, and windy conditions (Figure 4 and Figure 6). Organic content is minimal, suggesting very low biological productivity. The accumulation rate shows a slight increase during this period, consistent with enhanced loess deposition under glacial conditions (Figure 4).
During the MIS2 level at the Hajós site, corresponding to the Last Glacial Maximum and early deglaciation, the sedimentary record indicates a predominantly cold and dry climate. A dominance of coarse silt and fine sand is observed, suggesting aeolian deposition under periglacial conditions. The environment shifts to lacustrine, as evidenced by the fine silt, clay content, and lack of riverine sand (Figure 5, Figure 8 and Figure 9). This suggests that the oxbow lake was cut off from the main river channel, leading to calmer waters and the deposition of finer sediments. The macrobotanical record [3] for this period is notably sparse, dominated by Monocot. Undiff., U.O.M, a low amount of Phragmites, and sporadic occurrences of Equisetum cf. fluitantis. The pollen assemblage [3] during this time was overwhelmingly dominated by the Pinus subgenus Diploxylon pollen type (Pinus sylvestris), but other cold-tolerant taxa were also present like Betula, or steppe elements like Artemisia and Poaceae, indicating that the landscape was not uniformly forested but rather a complex mosaic of boreal forest and cold steppe vegetation. A significant decrease in Pinus pollen and a concurrent increase in deciduous trees indicate the slow replacement of a boreal forest–steppe mosaic with the mixed deciduous forest consisting of Betula, Ulmus, Quercus, and Fraxinus [3]. This mosaic structure likely provided a variety of habitats for the Pleistocene fauna and potentially for human populations of the Upper Palaeolithic.

4.4. Late Glacial Level (14,000–11,700 cal BP)

The Late Glacial period in Katymár is characterised by rapid and significant changes across all proxies, reflecting the transition out of full glacial conditions. The reappearance and increasing abundance of species such as Succinella oblonga, Columella columella, and Vallonia tenuilabris indicate a gradual amelioration of climatic conditions (Figure 10). This period is marked by fluctuations between warmer interstadials (e.g., Bølling–Allerød) and cooler stadials (e.g., Younger Dryas), which are reflected in the alternating dominance of more thermophilous and cryophilous species, respectively (Figure 11). The emergence of Pupilla sterri and the return of Chondrula tridens during this period suggest an increase in habitat diversity and the development of a mosaic landscape. The decrease in pollen count observed from around 140 cm depth, coupled with rising temperatures, may indicate a shift toward more open vegetation structures, possibly due to increased seasonality or changes in precipitation patterns. The malacological record during this period provides valuable insights into ecosystem responses to rapid climate change, demonstrating the sensitivity of terrestrial mollusc communities to environmental fluctuations. Geochemically, this period sees a reversal of MIS2 trends, with increasing Ba, Al, and Fe concentrations indicating renewed weathering and soil formation processes [137,138,139,140,141,142,143,144,145,146] (Figure 7). Carbonates reach another high period, followed by a decreasing trend. The U-ratio decreases while magnetic susceptibility increases, showing a shift toward finer particle deposition and potential pedogenesis (Figure 4 and Figure 6). Organic content begins to increase, albeit slowly, suggesting gradually improving conditions for biological productivity. These changes collectively indicate the onset of warmer and more humid conditions, leading to the reestablishment of more diverse and productive ecosystems as the region transitions toward Holocene conditions.
The Late Glacial period marks a significant shift in the vegetation dynamics at the Hajós site (Figure 5). As the climate began to warm, there was a gradual expansion of boreal forest–steppe vegetation, with Pinus sylvestris and Betula becoming more prevalent [3]. This transition reflects the amelioration of climatic conditions, with rising temperatures and increased moisture availability supporting the re-establishment of tree species in the region. The pollen data [3] indicate a mosaic landscape, where patches of boreal forest were interspersed with open areas, reflecting the ongoing but incomplete recovery of forest cover following the LGM.

4.5. Early Holocene (11,700–8200 cal BP)

The Early Holocene at the Hajós site is characterised by significant environmental changes, reflecting the peak of post-glacial warming: the transition from pine-dominated landscape to temperate forest ecosystems, an increase in forest diversity, the development of wetland habitats with “brown moss carpet” [97], and a vegetation response to Early Holocene climate fluctuations. The pollen assemblage [3] suggests the development of a mixed deciduous forest (Quercus, Ulmus, Tilia, and Corylus) in the region, with a mosaic of different forest types depending on local conditions. The rapid expansion of Corylus is especially noteworthy from ca. 10,500 cal BP, showing a distinct peak that may be associated with early Mesolithic human activities or climate-driven vegetation changes, evidenced by local (Great Hungarian Plain) [147,148,149,150,151,152] and regional (Carpathian Basin) [153,154,155,156] studies. Sedimentological and geochemical data support this transition (Figure 5, Figure 8 and Figure 9). The early part of this period shows a shift from riverine to lacustrine conditions, with fine silt and clay dominating the sediment (Figure 5). This suggests that the oxbow lake was cut off from the main river channel, leading to calmer waters. The later part indicates the start of the biogenic infilling of the oxbow lake, with increased organic matter content and peak Fe and Mn values. The macrobotanical record [3] shows increased plant diversity, with species like Carex elata, Menyanthes trifoliata, and various mosses indicating rich fen ecosystems. The emergence of aquatic plants such as Chara oogonia, Phragmites australis, and Glyceria cf. maxima suggests the formation of shallow water habitats, reflecting more favourable growing conditions.

4.6. Mid-Holocene (8200–4200 cal BP)

The Holocene malacofauna of Katymár North indicate a return to steppe-like conditions, but with lower diversity compared to the bottom of the sequence (MLZ-1) (Figure 10 and Figure 11). This raises questions about the relative roles of climate and human activity in shaping the modern landscape. The reduced diversity could be a result of anthropogenic habitat modification or a sign of ongoing environmental change. Phytolith diversity increases with a peak in magnetic susceptibility (Figure 12).
During the mid-Holocene, the Hajós site witnessed the establishment of mature, diverse forest communities, as well as the first clear evidence of human impact on the landscape [3,38,39]. The pollen record [3] shows the appearance of cereal pollen, indicating the onset of agriculture in the region. Concurrently, there is an increase in pollen from plants associated with human activities, such as Plantago lanceolata and Rumex. The forest composition continues to change, with an increase in Fagus and Carpinus pollen toward the upper part of this interval. This shift might reflect both climatic changes (toward slightly cooler and more humid conditions) and potentially the human management of forest resources. NAP percentages increase gradually through this interval, suggesting a progressive opening of the landscape, likely due to agricultural activities and forest clearance. The catchment basin transforms into a reed-dominated peatland (Thelypteris palustris) [3], rich in pollen and macrobotanical remains. The sediment type changed to coarse detrital gyttja and algal gyttja, indicating the continuous dominance of organic matter with at least 70% organic matter content (Figure 5, Figure 8 and Figure 9). This period is characterised by low geochemical element values along with low clay and very fine silt grain size values but increased magnetic susceptibility values (Figure 5 and Figure 9). The pollen count shows a steady decrease toward the end of the zone, possibly reflecting changing local conditions or human impact (Figure 5).

4.7. Late Holocene (4200 cal BP to Present)

The modern July temperature (Figure 3) in Katymár (around 23–24 °C) is higher than most of the reconstructed July palaeotemperatures, which generally range between 14 and 20 °C (Figure 4). This suggests overall warmer summer conditions in the present compared to much of the past record. The modern climate diagram (Figure 3) shows July as potentially arid, with high temperatures and lower precipitation. This could be compared to past periods with lower July temperatures, which might have experienced less evaporation and potentially different moisture regimes. The generally lower past July temperatures compared to the present suggest a long-term warming trend in the region, which aligns with broader patterns of climate change.
The Late Holocene at the Hajós site is marked by significant fluctuations in vegetation cover, driven by a combination of climatic variability and increasing human activity. Pollen data indicate periods of forest contraction, likely associated with cooler and drier climatic episodes, as well as the expansion of open landscapes, which may have been influenced by anthropogenic activities such as agriculture and deforestation. The gradual increase in human impact indicators, particularly in the upper part of the sequence, reflects the intensification of agricultural practises and the growing influence of human populations on the landscape [3,38,39]. Local variations in species composition and the timing of vegetation shifts at Hajós suggest that site-specific factors, such as microclimate and soil conditions, played a significant role in modulating the response of vegetation to these broader environmental drivers. The overall pollen assemblage points to a landscape that was increasingly open and managed, with a mosaic of cultivated fields, pastures, settlements, and remnant woodland. This transformation reflects the intensification of human impact on the environment, likely associated with population growth, technological advancements, and changing socio-economic structures. A peak in plant diversity around 4300–1600 cal BP occurs due to favourable climatic conditions first, with the abundance of species such as Carex, Schoenoplectus, Cyperus, Drepanocladus, and Calliergonella, along with a rise in Equisetum cf. fluitans, which is followed by a small decrease in the abundance of certain species, yet overall diversity remains high [3]. From ca. 1540 cal BP, partial reforestation, shift in forest composition, potential changes in land use intensity, and possible climatic fluctuations affecting vegetation patterns occur. In the last thousand years, agriculture has intensified and diversified, the area has maintained an open landscape with managed woodlands, and recent alterations due to modern land management practises can be observed. Fluctuations in organic matter content, carbonate content, and various elemental compositions reflect changing local conditions and possibly human influences on the landscape. The upper parts of the core suggest the presence of a relatively stable wetland ecosystem with minor fluctuations, which could be attributed to local hydrological changes or minor climate variations. The water level rises with the abundance of Carex elata, a critical peat-forming species within the mire; also, Phragmites australis is present, contributing to the peat composition [3]. The deterioration of the diverse tussock–hollow vegetation complex also reflects the changes in the ecosystem’s structure and function. The most recent part of the record (SMZ-6) (Figure 5) shows a rapid transition in sediment composition, with decreasing organic content and increasing inorganic and carbonate content, possibly reflecting modern land use changes and drainage activities.

5. Conclusions

This study, integrating multi-proxy analyses from the Katymár North loess–palaeosol sequence and the Hajós hay meadow and loess bank cores, provides a comprehensive reconstruction of the palaeoenvironmental evolution in the Carpathian Basin from the Late Pleistocene to the Early Holocene. Our findings reveal the region’s high responsiveness to global climate forcings and highlight the development of a unique Ice Age ecoregion in the central and southern parts of the basin.
The data from both sites demonstrate synchronous responses to large-scale climate oscillations, such as the Bølling–Allerød Interstadial, while also capturing site-specific environmental changes. The persistence of thermophilic steppe-dwelling faunal elements throughout significant glaciations suggests the continuous presence of temperate grassland habitats in the region, even during cooling periods. This characteristic distinguishes the southern part of the Carpathian Basin from other areas within the Eurasian loess belt, indicating the formation of an independent mosaic or ecoregion influenced by the basin’s unique climatic conditions and the Danube alluvial fan.
Our results indicate that by the end of the Ice Age, humidity and surface moisture, rather than temperature, became the most significant palaeoecological limiting factors for biota in the southern and central parts of the Carpathian Basin. This shift led to the development of ecotone-like forest–steppe environments during cooling periods, characterised by increased species richness and individual numbers. Conversely, warming periods saw a reduction in species diversity but an expansion of temperate forest–steppe elements.
The transition from the Last Glacial Maximum to the Holocene is marked by significant changes in vegetation dynamics, with a shift from boreal forest–steppe mosaics to more diverse, temperate forest ecosystems. The Early Holocene witnessed rapid environmental changes, including increased forest diversity and the development of wetland habitats, reflecting the peak of post-glacial warming.
Human impact becomes increasingly evident in the Mid to Late Holocene, with clear indications of agricultural activities and landscape modification. This anthropogenic influence, combined with ongoing climatic changes, led to a progressive opening of the landscape and alterations in forest composition.
In conclusion, this study underscores the complex interplay between global climate forcings, regional environmental conditions, and human activities in shaping the palaeoenvironmental history of the Southern part of the Carpathian Basin, more specifically the southern part of the Danube–Tisza Interfluve. The identification of a distinct Ice Age ecoregion in the central and southern parts of the basin contributes to our understanding of the spatial heterogeneity within the Eurasian loess belt. These findings have important implications for palaeoclimatic reconstructions, ecological modelling, and our understanding of human–environment interactions in Central Europe during the Late Quaternary.

Supplementary Materials

The following supporting information can be downloaded at: https://www.mdpi.com/article/10.3390/d16100619/s1.

Author Contributions

Conceptualization, P.S., T.Z.V., and E.P.-M.; funding acquisition, P.S., T.Z.V., and E.P.-M.; investigation, P.S. and T.Z.V.; methodology P.S. and T.Z.V.; visualisation T.Z.V.; writing—original draft, P.S. and T.Z.V.; writing—review and editing, T.Z.V. All authors have read and agreed to the published version of the manuscript.

Funding

This research was funded by the ÚNKP-23-3-SZTE-533 New National Excellence Program of the Ministry for Culture and Innovation and National Research, Development and Innovation Office. Financial support was also provided by the University of Szeged Institute of Geosciences.

Data Availability Statement

Data are available upon request from the corresponding author. Data used from referenced sources are available from the referenced articles, their authors, or from the Supplementary Materials of the referenced articles.

Acknowledgments

This research has been carried out within the framework of the University of Szeged, Interdisciplinary Excellence Centre, Institute of Geosciences, Long Environmental Changes Research Team. The authors are also grateful to the reviewers who helped to improve the quality of this publication.

Conflicts of Interest

The authors declare no conflicts of interest. The funders had no role in the design of the study; in the collection, analyses, or interpretation of data; in the writing of the manuscript; or in the decision to publish the results.

References

  1. Sümegi, P.; Molnár, D.; Gulyás, S.; Náfrádi, K.; Sümegi, B.P.; Törőcsik, T.; Persaits, G.; Molnár, M.; Vandenberghe, J.; Zhou, L. High-resolution proxy record of the environmental response to climatic variations during transition MIS3/MIS2 and MIS2 in Central Europe: The loess-paleosol sequence of Katymár brickyard (Hungary). Quat. Int. 2019, 504, 40–55. [Google Scholar] [CrossRef]
  2. Birks, H.J.B.; Birks, H.H. Quaternary Palaeoecology; Edward Arnold Press: London, UK, 1980; p. 289. [Google Scholar]
  3. Sümegi, P.; Náfrádi, K.; Törőcsik, T.; Jakab, G.; Bodor, E.; Molnár, M.; Sümegi, B.P.; Tapody, R.O.; Knipl, I.; Kustár, R.; et al. Prehistoric environment of the Sárköz region in the Danube Valley, southern Hungary. Case studies from infilled oxbow lakes. In The Environmental History of the Prehistoric Sárköz Region in Southern Hungary; Bánffy, E., Ed.; Confinia et Horizontes 1; Beier & Beran: Langenweißbach, Germany, 2020; pp. 83–160. [Google Scholar]
  4. Evans, J.G.; O’Connor, T. Environmental Archaeology; Shutton Publishing: Stroud, UK, 1999; pp. 1–242. [Google Scholar]
  5. Újvári, G.; Varga, A.; Balogh-Brunstad, Z. Origin, weathering, and geochemical composition of loess in southwestern Hungary. Quat. Res. 2008, 69, 421–437. [Google Scholar] [CrossRef]
  6. Hum, L. Geochemical investigations of the Dunaszekcső loess-paleosoil sequence. Acta Mineral. Petrogr. 1998, 39, 139–150. [Google Scholar]
  7. Hum, L.; Fényes, J. The geochemical characteristics of loesses and paleosols in the South-Eastern Transdanube (Hungary). Acta Mineral. Petrogr. 1995, 36, 89–100. [Google Scholar]
  8. Buggle, B.; Glaser, B.; Zöller, L.; Hambach, U.; Marković, S.; Glaser, I.; Gerasimenko, N. Geochemical characterization and origin of southeastern and eastern European loesses (Serbia, Romania, Ukraine). Quat. Sci. Rev. 2008, 27, 1058–1075. [Google Scholar] [CrossRef]
  9. Buggle, B.; Hambach, U.; Glaser, B.; Gerasimenko, N.; Marković, S.; Glaser, I.; Zöller, L. Stratigraphy and spatial and temporal paleoclimatic trends in Southeastern/Eastern European loess–paleosol sequences. Quat. Int. 2009, 196, 86–106. [Google Scholar] [CrossRef]
  10. Buggle, B.; Glaser, B.; Hambach, U.; Gerasimenko, N.; Marković, S. An evaluation of geochemical weathering indices in loess–paleosol studies. Quat. Int. 2011, 240, 12–21. [Google Scholar] [CrossRef]
  11. Buggle, B.; Hambach, U.; Müller, K.; Zöller, L.; Marković, S.B.; Glaser, B. Iron mineralogical proxies and Quaternary climate change in SE-European loess–paleosol sequences. Catena 2014, 117, 4–22. [Google Scholar] [CrossRef]
  12. Stevens, T.; Marković, S.B.; Zech, M.; Hambach, U.; Sümegi, P. Dust deposition and climate in the Carpathian Basin over an independently dated last glacial–interglacial cycle. Quat. Sci. Rev. 2011, 30, 662–681. [Google Scholar] [CrossRef]
  13. Obreht, I.; Zeeden, C.; Schulte, P.; Ham bach, U.; Eck meier, E.; Timar-Gabor, A.; Lehmkuhl, F. Aeolian dynamics at the Orlovat loess-paleosol sequence, northern Serbia, based on detailed textural and geochemical evidence. Aeolian Res. 2015, 18, 69–81. [Google Scholar] [CrossRef]
  14. Marković, S.B.; Kostić, N.S.; Oches, E.A. Paleosols in the Ruma loess section (Vojvodina, Serbia). Rev. Mex. Ciencias Geol. 2004, 21, 79–87. [Google Scholar]
  15. Marković, S.B.; Oches, E.A.; McCoy, W.D.; Frechen, M.; Gaudenyi, T. Malacological and sedimentological evidence for “warm” glacial climate from the Irig loess sequence, Vojvodina, Serbia. Geochem. Geophys. Geosyst. 2007, 8, 1–13. [Google Scholar] [CrossRef]
  16. Marković, S.B.; Bokhorst, M.P.; Vandenberghe, J.; McCoy, W.D.; Oches, E.A.; Hambach, U.; Gaudényi, T.; Jovanović, M.; Zöller, L.; Stevens, T.; et al. Late Pleistocene loess-palaeosol sequences in the Vojvodina region, north Serbia. J. Quat. Sci. 2008, 23, 73–84. [Google Scholar] [CrossRef]
  17. Marković, S.B.; Hambach, U.; Catto, N.; Jovanović, M.; Buggle, B.; Machalett, B.; Zöller, L.; Glaser, B.; Frechen, M. Middle and late Pleistocene loess sequences at Batajnica, Vojvodina, Serbia. Quat. Int. 2009, 198, 255–266. [Google Scholar] [CrossRef]
  18. Marković, S.B.; Timar-Gabor, A.; Stevens, T.; Hambach, U.; Popov, D.; Tomić, N.; Obreht, I.; Jovanović, M.; Lehmkuhl, F.; Kels, H.; et al. Environmental dynamics and luminescence chronology from the Orlovat loess–palaeosol sequence (Vojvodina, northern Serbia). J. Quat. Sci. 2014, 29, 189–199. [Google Scholar] [CrossRef]
  19. Marković, S.B.; Stevens, T.; Kukla, G.J.; Hambach, U.; Fitzsimmons, K.E.; Gibbard, P.; Jovanović, M.; Svirčev, Z. Danube loess stratigraphy—Towards a pan-European loess stratigraphic model. Quat. Int. 2015, 376, 29–61. [Google Scholar] [CrossRef]
  20. Marković, S.B.; Sümegi, P.; Stevens, T.; Schaetzl, R.J.; Obreht, I.; Chu, W.; Buggle, B.; Zech, M.; Zech, R.; Zeeden, C.; et al. The Crvenka loess-paleosol sequence: A record of continuous grassland domination in the southern Carpathian Basin during the Late Pleistocene. Palaeogeogr. Palaeoclimatol. Palaeoecol. 2018, 509, 33–46. [Google Scholar] [CrossRef]
  21. Sümegi, P.; Gulyás, S.; Molnár, D.; Molnár, M.; Sümegi, B.P.; Makó, L.; Almond, P.; Zeeden, C.; Törőcsik, T.; Nett-Bösken, J.; et al. New chronology and extended paleoenvironmental data to the 1975 loess profile of Madaras brickyard, S Hungary. J. Quat. Sci. 2021, 36, 1364–1381. [Google Scholar] [CrossRef]
  22. Náfrádi, K.; Barna, P.J.; Sümegi, P. Geoarchaeological investigations at Sormás, Török-földek, a Neolithic site in Southwestern Transdanubia, Hungary. J. Archaeol. Sci. Rep. 2015, 1, 8–20. [Google Scholar] [CrossRef]
  23. Troels-Smith, J. Characterization of unconsolidated sediments. Dan. Geol. Unders. 1955, 4, 10. (In Danish) [Google Scholar]
  24. Miháltz, I. Az Észak-Alföld keleti részének földtani térképezése. In A Magyar Állami Földtani Intézet évi jelentése (1951.); Magyar Állami Földtani Intézet: Budapest, Hungary, 1953; pp. 61–68. (In Hungarian) [Google Scholar]
  25. Molnár, B.; Krolopp, E. Latest Pleistocene geohistory of the Bácska Loess Area. Acta Miner. Petro. 1978, 23, 245–264. [Google Scholar]
  26. Molnár, B.; Geiger, J. Possibility for subdividing apparently homogeneous depositional sequences by combined use of sedimentological, palaeontological and mathematical method. GeoJournal 1995, 36, 169–177. [Google Scholar] [CrossRef]
  27. Frömming, E. Biologie der Mitteleuropäischen Landgastropoden; Deucher et Humboldt: Berlin, Germany, 1954. [Google Scholar]
  28. Ložek, V. Quartärmollusken der Tschechoslowakei. Rozpr. Ústredniho Ust. Geol. 1964, 31, 1–374. [Google Scholar]
  29. Belokopytov, I.E.; Beresnevich, V.V. Giktorf’s peat borers. Torfyanaya Promyfhlennost 1955, 8, 9. [Google Scholar]
  30. Aaby, B.; Digerfeldt, G. Sampling techniques for lakes and mires. In Handbook of Holocene Palaeoecology and Palaeohydrology; Berglund, B.E., Ed.; JohnWiley & Sons: Chichester, UK, 1986; pp. 181–194. [Google Scholar]
  31. Vleeschouwer, F.; Chambers, F.; Swindles, G. Coring and sub-sampling of peatlands for palaeoenvironmental research. Mires Peat 2010, 7, 10. [Google Scholar]
  32. Hay Meadows and Loess Banks of Hajós|Kiskunsági Nemzeti Park. Available online: https://www.knp.hu/en/hay-meadows-and-loess-banks-of-hajos (accessed on 7 March 2024).
  33. Walter, H.; Lieth, H. Klimadiagramm Weltatlas; G. Fischer: Jena, Germany, 1960. [Google Scholar]
  34. The Climatol R Package. Available online: http://www.climatol.eu (accessed on 1 June 2024).
  35. RStudio Desktop—Posit. Available online: https://posit.co/download/rstudio-desktop/ (accessed on 1 June 2024).
  36. Országos Meteorológiai Szolgálat. Available online: https://www.met.hu (accessed on 1 June 2024).
  37. Országos Meteorológiai Szolgálat—Meteorológiai Adattár. Available online: https://odp.met.hu (accessed on 1 June 2024).
  38. Jakab, G.; Sümegi, P.; Magyari, E. A new paleobotanical method for the description of Late Quaternary organic sediments (mire-development pathway and paleoclimatic records from southern Hungary). Acta Geol. Hung. 2004, 47, 373–409. [Google Scholar] [CrossRef]
  39. Jakab, G.; Sümegi, P.; Magyari, E. New quantitative method for the palaeobotanical description of Late Quaternary organic sediments (mire-development pathway and paleoclimatic records from southern Hungary). Antaeus 2004, 27, 181–212. [Google Scholar]
  40. rbacon: Age-Depth Modelling Using Bayesian Statistics. Available online: https://cran.r-project.org/web/packages/rbacon/index.html (accessed on 1 June 2024).
  41. Blaauw, M.; Christen, J.A. Flexible paleoclimate age-depth models using an autoregressive gamma process. Bayesian Anal. 2011, 6, 457–474. [Google Scholar] [CrossRef]
  42. Reimer, P.; Austin, W.; Bard, E.; Bayliss, A.; Blackwell, P.; Ramsey, C.B.; Butzin, M.; Cheng, H.; Edwards, R.L.; Friedrich, M.; et al. The IntCal20 Northern Hemisphere Radiocarbon Age Calibration Curve (0–55 cal kBP). Radiocarbon 2020, 62, 725–757. [Google Scholar] [CrossRef]
  43. Oldfield, F.; Thompson, R.; Barber, K.E. Changing atmospheric fallout of magnetic particles recorded in recent ombrotrophic peat sections. Science 1978, 199, 679–680. [Google Scholar] [CrossRef]
  44. Dearing, J. Environmental Magnetic Susceptibility: Using the Bartington MS2 System; Chi Publishing: Keniloworth, UK, 1994. [Google Scholar]
  45. Sümegi, P.; Náfrádi, K.; Molnár, D.; Sávai, S. Results of paleoecological studies in the loess region of Szeged-Öthalom (SE Hungary). Quat. Int. 2015, 372, 66–78. [Google Scholar] [CrossRef]
  46. Nugteren, G.; Vandenberghe, J.; Ko van Huissteden, J.; An, Z. A Quaternary Climate Record Based on Grain Size Analysis from the Luochuan Loess Section on the Central Loess Plateau, China. Glob. Planet. Chang. 2004, 41, 167–183. [Google Scholar] [CrossRef]
  47. Konert, M.; Vandenberghe, J. Comparison of Laser Grain Size Analysis with Pipette and Sieve Analysis: A Solution for the Underestimation of the Clay Fraction. Sedimentology 1997, 44, 523–535. [Google Scholar] [CrossRef]
  48. Vandenberghe, J.; Mücher, H.; Roebroeks, W.; Gemke, D. Lithostratigraphy and Palaeoenvironment of the Pleistocene Deposits at Maastricht-Belvédère. Meded. Rijks Geol. Dienst. 1985, 39, 7–18. [Google Scholar]
  49. Vandenberghe, J.; Nugteren, G. Rapid Climatic Changes Recorded in Loess Successions. Glob. Planet. Chang. 2001, 28, 1–9. [Google Scholar] [CrossRef]
  50. Vandenberghe, J. Grain Size of Fine-GrainedWindblown Sediment: A Powerful Proxy for Process Identification. Earth-Sci. Rev. 2013, 121, 18–30. [Google Scholar] [CrossRef]
  51. Rousseau, D.D.; Antoine, P.; Hatté, C.; Lang, A.; Zöller, L.; Fontugne, M.; Othman, D.B.; Luck, J.M.; Moine, O.; Labonne, M.; et al. Abrupt Millennial Climatic Changes from Nussloch (Germany) UpperWeichselian Eolian Records during the Last Glaciation. Quat. Sci. Rev. 2002, 21, 1577–1582. [Google Scholar] [CrossRef]
  52. Rousseau, D.; Sima, A.; Antoine, P.; Hatté, C.; Lang, A.; Zöller, L. Link between European and North Atlantic Abrupt Climate Changes over the Last Glaciation. Geophys. Res. Lett. 2007, 34, 2007GL031716. [Google Scholar] [CrossRef]
  53. Dean, W.E. Determination of carbonate and organic matter in calcareous sediments and sedimentary rocks by loss on ignition; comparison with other methods. J. Sediment. Petrol. 1974, 44, 242–248. [Google Scholar]
  54. Heiri, O.; Lotter, A.F.; Lemcke, G. Loss on ignition as a method for estimating organic and carbonate content in sediments: Reproducibility and comparability of results. J. Paleolim. 2001, 25, 101–110. [Google Scholar] [CrossRef]
  55. Dániel, P. Results of the geochemical analysis of the samples from Bátoliget II profile. In The Geohistory of Bátorliget Marshland; Sümegi, P., Gulyás, S., Eds.; Archaeolingua Press: Budapest, Hungary, 2004; pp. 95–128. [Google Scholar]
  56. Dániel, P.; Kovács, B.; Gyori, Z.; Sümegi, P. A Combined Sequential Extraction Method for Analysis of Ions Bounded to Mineral Component. In Proceedings of the 4th Soil and Sediment Contaminant Analysis Workshop, Lausanne, Switzerland, 23–25 September 1996; p. 396. [Google Scholar]
  57. Krolopp, E.; Sümegi, P. Palaeoecological reconstruction of the late Pleistocene, based on loess malacofauna in Hungary. GeoJournal 1995, 36, 213–222. [Google Scholar] [CrossRef]
  58. Sümegi, P. Loess and Upper Paleolithic Environment in Hungary; Aurea Kiadó: Nagykovácsi, Hungary, 2005; pp. 1–312. [Google Scholar]
  59. Sümegi, P.; Krolopp, E. Quartermalacological analyses for modeling of the upper weichselian palaeoenvironmental changes in the Carpathian Basin. Quat. Int. 2002, 91, 53–63. [Google Scholar] [CrossRef]
  60. Alexandrowicz, W.P. Molluscan assemblages of Late Glacial and Holocene calcareous tufa in Southern Poland. Folia Quat. 2004, 75, 3–309. [Google Scholar]
  61. Krolopp, E. Biostratigraphic division of Hungarian Pleistocene Formations according to their Mollusc fauna. Acta Geol. Hung. 1983, 26, 62–89. [Google Scholar]
  62. Soós, L. A Kárpát-Medence Mollusca-Faunája; Akadémiai Kiadó: Budapest, Hungary, 1943. [Google Scholar]
  63. Evans, J.G. Land Snails in Archeology; Seminar Press: London, UK, 1972; pp. 1–436. [Google Scholar]
  64. Welter-Schultes, F.W. European Non-Marine Molluscs, a Guide for Species Identification; Planet Poster Edition: Göttingen, Germany, 2012. [Google Scholar]
  65. Kerney, M.P.; Cameron, R.A.; Jungbluth, J.H. Die Landschnecken Nord-Und Mitteleuropas; Parey Press: Berlin, Germany, 1983; pp. 1–384. [Google Scholar]
  66. Horsák, M.; Chytrý, M.; Danihelka, J.; Kočí, M.; Kubešová, S.; Lososová, Z.; Otýpková, Z.; Tichý, L. Snail faunas in the Southern Ural forests and their relations to vegetation: An analogue of the Early Holocene assemblages of Central Europe? J. Molluscan Stud. 2009, 76, 1–10. [Google Scholar] [CrossRef]
  67. Horsák, M.; Chytrý, M.; Pokryszko, B.M.; Danihelka, J.; Ermakov, N.; Hájek, M.; Hájková, P.; Kintrová, K.; Kočí, M.; Kunešová, S.; et al. Habitats of relict terrestrial snails in southern Siberia: Lessons for the reconstruction of palaeoenvironments of full-glacial Europe. J. Biogeogr. 2010, 37, 1450–1462. [Google Scholar] [CrossRef]
  68. Horsák, M.; Chytrý, M.; Hájková, P.; Hájek, M.; Danihelka, J.; Horsáková, V.; Ermakov, N.; German, D.A.; Kočí, M.; Lustyk, P.; et al. European glacial relict snails and plants: Environmental context of their modern refugial occurrence in southern Siberia. Boreas 2015, 44, 638–657. [Google Scholar] [CrossRef]
  69. Sümegi, P.; Magyari, E.; Dániel, P.; Molnár, M.; Törőcsik, T. Responses of terrestrial ecosystems to Dansgaard–Oeshger cycles and Heinrich-events: A 28,000-year record of environmental changes from SE Hungary. Quat. Int. 2013, 293, 34–50. [Google Scholar] [CrossRef]
  70. Sümegi, P. Refuting ideas based on a small batch of data: Malacothermometry aid in the reconstruction of mean July paleo-temperatures in the Carpathian Basin for the last glacial of the Pleistocene. Archeometriai Műhely 2019, 16, 143–166. [Google Scholar]
  71. Sümegi, P.; Gulyás, S.; Persaits, G.; Páll, D.G.; Molnár, D. The chronostratigraphy of the Basaharc double paleosol complex and the mende upper paleosol complex as seen from recent paleoecological results from the brickyard of Basaharc, Hungary. Quat. Int. 2011, 240, 181–192. [Google Scholar] [CrossRef]
  72. Jacomet, S.; Kreuz, A. Archäobotanik. Aufgaben, Methoden und Ergebnisse Vegetations- und Agrargeschichtlicher Forschung; Verlag Eugen Ulmer: Stuttgart, Germany, 1999. (In German) [Google Scholar]
  73. Gyulai, F. Arcaeobotany in Hungary. Seed, Fruit, Food and Beverage Remains In the Carpathian Basin from the Neolitic to the Late Middle Ages; Jószöveg Műhely Kiadó: Budapest, Hungary, 2001. (In Hungarian) [Google Scholar]
  74. Chabal, L.; Fabre, L.; Terral, J.F.; Théry-Parisot, I. L’anthracologie (Anthracology). In La Botanique; Bourquin-Mignot, C., Brochier, J.E., Chabal, L., Crozat, S., Fabre, L., Guibal, F., Marinval, P., Richard, H., Terral, J.F., Théry, I., Eds.; Editions Errance: Paris, France, 1999; pp. 43–104. [Google Scholar]
  75. Asouti, E.; Austin, P. Reconstructing woodland vegetation and its exploitation by past societies, based on the analysis and interpretation of archaeological wood charcoal macro-remains. Environ. Archaeol. 2005, 10, 1–18. [Google Scholar] [CrossRef]
  76. Greguss, P. A Középeurópai Lomblevelő Fák És Cserjék Meghatározása Szövettani Alapon; Országos Magyar Természettudományi Múzeum: Budapest, Hungary, 1945. [Google Scholar]
  77. Greguss, P. Xylotomy of the Living Conifers; Akadémia Kiadó: Budapest, Hungary, 1972. [Google Scholar]
  78. Schweingruber, F.H. Mikroskopische Holzanatomie. Eidgenössiche Forschungsantalt für Wald; Schnee Landchaft: Birmensd, Germany, 1990. (In German) [Google Scholar]
  79. Persaits, G.; Gulyás, S.; Náfrádi, K.; Sümegi, P.; Szalontay, C. Phytolithic aided paleoenvironmental studies from the Dutch Neolithic. Open Geosci. 2015, 7, 732–741. [Google Scholar] [CrossRef]
  80. Golyeva, A.A. Fitoliti I Ih Informacionaja Rol V Izucsenii Prirodnih I Arceologicseszkih Objektov; Nauki Rossziszkaja Akademija: Moskva, Russia, 2001. [Google Scholar]
  81. Rasmussen, S.O.; Bigler, M.; Blockley, S.P.; Blunier, T.; Buchardt, S.L.; Clausen, H.B.; Gkinis, V. A stratigraphic framework for abrupt climatic changes during the Last Glacial period based on three synchronized Greenland ice-core records: Refining and extending the INTIMATE event stratigraphy. Quat. Sci. Rev. 2014, 106, 14–28. [Google Scholar] [CrossRef]
  82. Bond, G.; Heinrich, H.; Broecker, W.; McManus, J.; Labeyrie, L.; Andrews, J. Evidence for massive discharges of icebergs into the North Atlantic Ocean during the last glacial period. Nature 1992, 360, 245–249. [Google Scholar] [CrossRef]
  83. Bond, G.; Broecker, W.; Johansen, S.; Labeyrie, L.; McManus, J.; Jouzel, J.; Bonani, G. Correlation between climate records from North Atlantic sediments and Greenland ice. Nature 1993, 365, 245–249. [Google Scholar] [CrossRef]
  84. Bond, G.C.; Showers, W.; Elliot, M.; Evans, M.; Lotti, R.; Hajdas, I.; Bonani, G.; Johnson, S. The North Atlantic’s 1–2 kyr climate rhythm: Relation to Heinrich events, Dansgaard/Oeschger cycles, and the Little Ice Age. In Mechanisms of Global Climate Change at Millennial Time Scales; Clark, P.U., Webb, R.S., Keigwin, L.D., Eds.; American Geophysical Union: Washington, DC, USA, 1999; Volume 112, pp. 35–58. [Google Scholar]
  85. Obase, T.; Abe-Ouchi, A.; Saito, F. Abrupt climate changes in the last two deglaciations simulated with different Northern ice sheet discharge and insolation. Sci. Rep. 2021, 11, 22359. [Google Scholar] [CrossRef]
  86. Rasmussen, S.O.; Vinther, B.M.; Clausen, H.B.; Andersen, K.K. Early Holocene climate oscillations recorded in three Greenland ice cores. Quat. Sci. Rev. 2007, 26, 1907–1914. [Google Scholar] [CrossRef]
  87. Fleitmann, D.; Mudelsee, M.; Burns, S.J.; Bradley, R.S.; Kramers, J.; Matter, A. Evidence for a widespread climatic anomaly at around 9.2 ka before present. Paleoceanography 2008, 23, PA1102. [Google Scholar] [CrossRef]
  88. Kobashi, T.; Severinghaus, J.P.; Brook, E.J.; Barnola, J.M.; Grachev, A.M. Precise timing and characterization of abrupt climate change 8200 years ago from air trapped in polar ice. Quat. Sci. Rev. 2007, 26, 1212–1222. [Google Scholar] [CrossRef]
  89. Cheng, H.; Fleitmann, D.; Edwards, R.; Wang, X.; Cruz, F.; Auler, A.; Mangin, A.; Wang, Y.; Kong, X.; Burns, S.; et al. Timing and structure of the 8.2 kyr B.P. event inferred from δ¹⁸O records of stalagmites from China, Oman, and Brazil. Geology 2009, 37, 1007–1010. [Google Scholar] [CrossRef]
  90. Alley, R.B.; Mayewski, P.A.; Sowers, T.; Stuiver, M.; Taylor, K.C.; Clark, P.U. Holocene climatic instability: A prominent, widespread event 8200 yr ago. Geology 1997, 25, 483–486. [Google Scholar] [CrossRef]
  91. Li, C.H.; Li, Y.X.; Zheng, Y.F.; Yu, S.Y.; Tang, L.Y.; Li, B.B.; Cui, Q.Y. A high-resolution pollen record from East China reveals large climate variability near the Northgrippian-Meghalayan boundary (around 4200 years ago) exerted societal influence. Palaeogeogr. Palaeoclimatol. Palaeoecol. 2018, 512, 156–165. [Google Scholar] [CrossRef]
  92. Staubwasser, M.; Sirocko, F.; Grootes, P.M.; Segl, M. Climate change at the 4.2 ka BP termination of the Indus Valley civilization and Holocene South Asian monsoon variability. Geophys. Res. Lett. 2003, 30, 1425. [Google Scholar] [CrossRef]
  93. Kabała, C.; Charzyński, P.; Chodorowski, J.; Drewnik, M.; Glina, B.; Greinert, A.; Hulisz, P.; Jankowski, M.; Jonczak, J.; Łabaz, B.; et al. Polish soil classification, 6th edition—Principles, classification scheme and correlations. Soil Sci. Annu. 2019, 70, 71–97. [Google Scholar] [CrossRef]
  94. Łachacz, A.; Nitkiewicz, S. Classification of soils developed from bottom lake deposits in north-eastern Poland. Soil Sci. Annu. 2021, 72, 140643. [Google Scholar] [CrossRef]
  95. Vári, T.Z.; Gulyás, S.; Sümegi, P. Reconstructing the paleoenvironmental evolution of Lake Kolon (Hungary) through integrated geochemical and sedimentological analyses of Quaternary sediments. Quaternary 2023, 6, 39. [Google Scholar] [CrossRef]
  96. Vári, T.Z.; Sümegi, P. Geochemical and sedimentological analyses on the Romanian Sphagnum peat bog Tăul fără fund. Mires Peat 2024, 31, 4. [Google Scholar]
  97. Boros, Á. Duna-Tisza Köze Növényföldrajza. Földrajzi Értesítő 1952, 1, 39–53. [Google Scholar]
  98. Vári, T.Z.; Pál-Molnár, E.; Sümegi, P. Reconstructing the Paleoenvironmental Evolution of Lake Kolon (Hungary) through Palaeoecological, Statistical and Historical Analyses. Diversity 2023, 15, 1095. [Google Scholar] [CrossRef]
  99. Molnár, B. The Geology and Hydrogeology of Kiskunsági (Little Cumania) National Park; JATE Press: Szeged, Hungary, 2015; p. 524. (In Hungarian) [Google Scholar]
  100. Gábris, G.; Nádor, A. Long-term fluvial archives in Hungary: Response of the Danube and Tisza rivers to tectonic movements and climatic changes during the Quaternary: A review and new synthesis. Quat. Sci. Rev. 2007, 26, 2758–2783. [Google Scholar] [CrossRef]
  101. Vandenberghe, J.; Kasse, C.; Gábris, G.; Bohncke, S.; Van Huissteden, K. Fluvial style changes during the last 35,000 years in the Tisza valley. In Proceedings of the XVI INQUA Congress, Reno, NV, USA, 23–30 July 2003; p. 68. [Google Scholar]
  102. Kiss, T.; Hernesz, P.; Sümeghy, B.; Gyöngyövics, K.; Sipos, G. The evolution of the Great Hungarian Plain fluvial system: Fluvial processes in a subsiding area from the beginning of the Weichselian. Quat. Int. 2015, 388, 142–155. [Google Scholar] [CrossRef]
  103. Molnár, D.; Sávai, S.; Hupuczi, J.; Galović, L.; Sümegi, P. Malacological investigations on East-Croatian loess-paleosol profiles. Archeometriai Műhely 2010, 8, 127–136. [Google Scholar]
  104. Banak, A.; Mandić, O.; Kovačić, M.; Pavelić, D. Late Pleistocene climate history of the Baranja loess plateau–Evidence from the Zmajevac loess-paleosol section (northeastern Croatia). Geol. Croat. 2012, 65, 411–422. [Google Scholar] [CrossRef]
  105. Jia, Y.-N.; Yan, H.; Dong, J.; Kang, S.; Wang, G.; Liu, C.; Zhang, Q.; Dodson, J. Hydrothermal and eco-environmental evolution on the southeastern Chinese Loess Plateau since the last deglaciation: Evidence from terrestrial mollusk records. Quat. Sci. Rev. 2024, 311, 108648. [Google Scholar] [CrossRef]
  106. Dong, Y.; Wu, N.; Li, F.; Huang, L.; Lu, H.; Stenseth, N.C. Paleorecords reveal the increased temporal instability of species diversity under biodiversity loss. Quat. Sci. Rev. 2021, 269, 107147. [Google Scholar] [CrossRef]
  107. Alexandrowicz, W.P.; Dmytruk, R. Molluscs in Eemian-Vistulian deposits of the Kolodiiv section, Ukraine (East Carpathian Foreland) and their palaeoecological interpretation. Geol. Q. 2007, 51, 173–178. [Google Scholar]
  108. Horsák, M.; Juricková, L.; Picka, J. Měkkýši České a Slovenské Republiky. Molluscs of the Czech and Slovak Republics; Kabourek: Zlín, Czech Republic, 2013; 264p. [Google Scholar]
  109. Horsák, M.; Chytrý, M.; Axmanová, I. Exceptionally poor land snail fauna of central Yakutia (NE Russia): Climatic and habitat determinants of species richness. Polar Biol. 2013, 36, 185–191. [Google Scholar] [CrossRef]
  110. Varga, Z.; Borhidi, A.; Fekete, G.; Debreczy, Z.; Bartha, D.; Bölöni, J.; Molnár, A.; Kun, A.; Molnár, Z.; Lendvai, G.; et al. The concept, types and their characterization of the forest steppe relicts. In Lowland Forest Steppe Relicts in Hungary; Molnár, Z., Kun, A., Eds.; World Wide Foundation: Budapest, Hungary, 2000; pp. 7–19. (In Hungarian) [Google Scholar]
  111. Fekete, G.; Molnár, Z.; Kun, A.; Botta-Dukát, Z. On the structure of the Pannonian forest steppe: Grasslands on sand. Acta Zool. Acad. Sci. Hung. 2002, 48, 137–150. [Google Scholar]
  112. Fekete, G.; Molnár, Z.; Magyari, E.; Somodi, I.; Varga, Z. A new framework for understanding Pannonian vegetation patterns: Regularities, deviations, and uniqueness. Community Ecol. 2014, 15, 12–26. [Google Scholar] [CrossRef]
  113. Molnár, Z.; Biró, M.; Bartha, S.; Fekete, G. Past trends, present state and future prospects of Hungarian forest steppes. In Eurasian Steppes: Ecological Problems and Livelihoods in a Changing World; Werger, M.J.A., van Staalduinen, M.A., Eds.; Springer: Dordrecht, Netherlands, 2012; pp. 209–252. [Google Scholar]
  114. Bába, K. Malacocoenological investigation of some sandy grasslands and forests in the Danube-Tisza Interfluve. Szegedi Tanárképző Főisk. Tud. Közl. 1969, 14, 83–92. (In Hungarian) [Google Scholar]
  115. Bába, K. A history and present-day situation of the investigation of the recent land snails in the Great Hungarian Plain. Tiscia 1980, 15, 93–102. [Google Scholar]
  116. Bába, K. History of the investigation of the terrestrial snails of the Great Hungarian Plain and its present situation. II. Tiscia 1983, 18, 83–95. [Google Scholar]
  117. Sümegi, P.; Persaits, G.; Gulyás, S. Woodland-grassland ecotonal shifts in environmental mosaics: Lessons learnt from the environmental history of the Carpathian Basin (Central Europe) during the Holocene and the Last Ice Age based on investigation of paleobotanical and mollusk remains. In Ecotones Between Forest and Grassland; Myster, R.W., Ed.; Springer: New York, NY, USA, 2012; pp. 17–57. [Google Scholar]
  118. Sümegi, P.; Molnár, D.; Sávai, S.; Náfrádi, K.; Novák, Z.; Szelepcsényi, Z.; Törőcsik, T. First radiocarbon dated paleoecological data from the freshwater carbonates of the Danube-Tisza Interfluve. Open Geosci. 2015, 7, 1–13. [Google Scholar] [CrossRef]
  119. Gábori, M.; Gábori-Csánk, V. Études archéologiques et stratigraphiques dans les stations de loess paléolithiques de Hongrie. Acta Archaeol. Hung. 1957, 8, 249–285. [Google Scholar]
  120. Gáboriné Csánk, V. Az ősember Magyarországon; Gondolat: Budapest, Hungary, 1980; p. 264. (In Hungarian) [Google Scholar]
  121. Pécsi, M. Negyedkor és Löszkutatás; Akadémiai Kiadó: Budapest, Hungary, 1993; p. 375. [Google Scholar]
  122. Willis, K.J. The vegetational history of the Balkans. Quat. Sci. Rev. 1994, 13, 769–788. [Google Scholar] [CrossRef]
  123. Willis, K.J.; Sümegi, P.; Braun, M.; Tóth, A. The Late Quaternary environmental history of Bátorliget, N.E. Hungary. Palaeogeogr. Palaeoclimatol. Palaeoecol. 1995, 118, 1–47. [Google Scholar] [CrossRef]
  124. Willis, K.J.; Braun, M.; Sümegi, P.; Tóth, A. Does soil change cause vegetation change or vice versa? A temporal perspective from Hungary. Ecology 1997, 78, 740–750. [Google Scholar] [CrossRef]
  125. Willis, K.J.; Sümegi, P.; Braun, M.; Bennett, K.D.; Tóth, A. Prehistoric land degradation in Hungary: Who, how and why? Antiquity 1998, 72, 101–113. [Google Scholar] [CrossRef]
  126. Willis, K.J.; Rudner, E.; Sümegi, P. The full-glacial forests of central and southeastern Europe: Evidence from Hungarian palaeoecological records. Quat. Res. 2000, 53, 203–213. [Google Scholar] [CrossRef]
  127. Willis, K.J.; Van Andel, T.H. Trees or no trees? The environments of central and eastern Europe during the Last Glaciation. Quat. Sci. Rev. 2004, 23, 2369–2387. [Google Scholar] [CrossRef]
  128. Feurdean, A.; Perşoiu, A.; Tanţău, I.; Stevens, T.; Magyari, E.K.; Onac, B.P.; Marković, S.; Andrič, M.; Connor, S.; Fărcaş, S.; et al. Climate variability and associated vegetation response throughout Central and Eastern Europe (CEE) between 60 and 8 ka. Quat. Sci. Rev. 2014, 106, 206–224. [Google Scholar] [CrossRef]
  129. Magyari, E.K.; Kuneš, P.; Jakab, G.; Sümegi, P.; Pelánková, B.; Schäbitz, F.; Braun, M.; Chytrý, M. Late Pleniglacial vegetation in eastern-central Europe: Are there modern analogues in Siberia? Quat. Sci. Rev. 2014, 95, 60–79. [Google Scholar] [CrossRef]
  130. Magyari, E.K.; Chapman, J.C.; Passmore, D.G.; Allen, J.R.M.; Huntley, J.P.; Huntley, B. Holocene persistence of wooded steppe in the Great Hungarian Plain. J. Biogeogr. 2010, 37, 915–935. [Google Scholar] [CrossRef]
  131. Pató, Z.A.; Standovár, T.; Gałka, M.; Jakab, G.; Molnár, M.; Szmorad, F.; Magyari, E. Exposure matters: Forest dynamics reveal an early Holocene conifer refugium on a north-facing slope in Central Europe. Holocene 2020, 30, 1833–1848. [Google Scholar] [CrossRef]
  132. Damblon, F.; Haesaerts, P. Anthracology and radio-chronology of the Upper Pleistocene in the loessic areas of Eurasia. In Charcoal Analysis. Methodological Approaches, Palaeoecological Results and Wood Uses; Thiébault, S., Ed.; BAR International Series 1063; Archaeopress: Oxford, UK, 2002; pp. 65–71. [Google Scholar]
  133. Damblon, F.; Haesaerts, P. Charcoal as tracer of local tree taxa in the Pleistocene loess field of Central Europe. Which relationship with flora, vegetation, landscape or climate? Sagvntvm Extra 2011, 11, 28. [Google Scholar]
  134. Dong, Y.; Wu, N.; Jiang, W.; Li, F.; Lu, H. Cascading response of flora and terrestrial mollusks to last deglacial warming. Glob. Ecol. Conserv. 2020, 24, e01360. [Google Scholar] [CrossRef]
  135. Sümegi, P.; Gulyás, S.; Molnár, D.; Sümegi, B.P.; Almond, P.C.; Vandenberghe, J.; Zhou, L.; Pál-Molnár, E.; Törőcsik, T.; Hao, Q.; et al. New chronology of the best-developed loess/paleosol sequence of Hungary capturing the past 1.1 Ma: Implications for correlation and proposed pan-Eurasian stratigraphic schemes. Quat. Sci. Rev. 2018, 191, 144–166. [Google Scholar] [CrossRef]
  136. Sümegi, P. Late Quaternary Environmental History of Hungary; MTA Doktori Értekezés: Budapest-Szeged, Hungary, 2007; p. 428, (In Hungarian with English Summary). [Google Scholar]
  137. Gallet, S.; Jahn, B.; Torii, M. Geochemical characterization of the Luochuan loess-paleosol sequence, China, and paleoclimatic implications. Chem. Geol. 1996, 133, 67–88. [Google Scholar] [CrossRef]
  138. Gallet, S.; Jahn, B.; Vliet Lanoe, B.; Dia, A.; Rossello, E. Loess geochemistry and its implications for particle origin and composition of the upper continental crust. Earth Planet. Sci. Lett. 1998, 156, 157–172. [Google Scholar] [CrossRef]
  139. Jahn, B.; Gallet, S.; Han, J. Geochemistry of the Xining, Xifeng, and Jixian sections, Loess Plateau of China: Eolian dust provenance and paleosol evolution during the last 140 ka. Chem. Geol. 2001, 178, 71–94. [Google Scholar] [CrossRef]
  140. Liang, L.; Sun, Y.; Beets, C.J.; Prins, M.A.; Wu, F.; Vandenberghe, J. Impacts of grain size sorting and chemical weathering on the geochemistry of Jingyuan loess in the northwestern Chinese Loess Plateau. J. Asian Earth Sci. 2013, 69, 177–184. [Google Scholar] [CrossRef]
  141. Muhs, D.R.; Bettis, E.A., III. Geochemical variations in Peoria Loess of western Iowa indicate paleowinds of midcontinental North America during last glaciation. Quat. Res. 2000, 53, 49–61. [Google Scholar] [CrossRef]
  142. Taylor, S.R.; McLennan, S.M.; McCulloch, M.T. Geochemistry of loess, continental crustal composition, and crustal model ages. Geochim. Cosmochim. Acta 1983, 47, 1897–1905. [Google Scholar] [CrossRef]
  143. Ahmad, I.; Chandra, R. Geochemistry of loess-paleosol sediments of Kashmir Valley, India: Provenance and weathering. J. Asian Earth Sci. 2013, 66, 73–89. [Google Scholar] [CrossRef]
  144. Nesbitt, H.W.; Young, G.M. Formation and diagenesis of weathering profiles. J. Geol. 1989, 97, 129–147. [Google Scholar] [CrossRef]
  145. Bosq, M.; Kreutzer, S.; Bertran, P.; Degeai, J.P.; Dugas, P.; Kadereit, A.; Lanos, P.; Moine, O.; Pfaffner, N.; Queffelec, A.; et al. Chronostratigraphy of two Late Pleistocene loess-palaeosol sequences in the Rhône Valley (southeast France). Quat. Sci. Rev. 2020, 245, 106473. [Google Scholar] [CrossRef]
  146. Bosq, M.; Bertran, P.; Degeai, J.P.; Queffelec, A.; Moine, O. Geochemical signature of sources, recycling, and weathering in the Last Glacial loess from the Rhône Valley (southeast France) and comparison with other European regions. Aeolian Res. 2020, 42, 100561. [Google Scholar] [CrossRef]
  147. Sümegi, P.; Hertelendi, E.; Magyari, E.; Molnár, M. Evolution of the environment in the Carpathian Basin during the last 30,000 BP years and its effects on the ancient habits of the different cultures. In Archeometrical Research in Hungary II; Költő, L., Bartosiewicz, L., Eds.; Budapest-Kaposvár: Budapest, Hungary, 1998; pp. 183–197. [Google Scholar]
  148. Sümegi, P.; Kertész, R. Palaeogeographic characteristic of the Carpathian Basin—An ecological trap during the Early Neolithic? In From the Mesolithic to the Neolithic; Kertész, R., Makkay, J., Eds.; Archaeolingua Press: Budapest, Hungary, 2001; pp. 405–416. [Google Scholar]
  149. Sümegi, P.; Gulyás, S.; Jakab, G. Holocene paleoclimatic and paleohydrological changes in Lake Balaton as inferred from a complex quantitative environmental historical study of a lacustrine sequence of the Szigliget embayment. Doc. Praehist. 2008, 35, 33–43. [Google Scholar] [CrossRef]
  150. Bánffy, E.; Juhász, I.; Sümegi, P. A prelude to the Neolithic in the Balaton region—New results to an old problem. In A Short Walk through the Balkans: The First Farmers of the Carpathian Basin and Adjacent Regions; Spataro, M., Biagi, P., Eds.; Atti della Società per la Preistoria e Protostoria della Regione Friuli; Venezia Giulia, XVI: Trieste, Italy, 2009; pp. 223–237. [Google Scholar]
  151. Sümegi, P. Palaeogeographical background of the Mesolithic and Early Neolithic settlement in the Carpathian Basin. In Mesolithic/Neolithic Interactions in the Balkans and in the Middle Danube Basin; Kozlowski, J.K., Nowak, M., Eds.; BAR International Series 1726; Archeopress: Oxford, UK, 2007; pp. 45–53. [Google Scholar]
  152. Magyari, E.K.; Jakab, G.; Sümegi, P. Holocene vegetation dynamics in the Bereg Plain, NE Hungary—The Báb-tava pollen and plant macrofossil record. Acta Geo. Debrecina 2009, 42, 1–16. [Google Scholar]
  153. Smith, A.G. The influence of Mesolithic and Neolithic man on British vegetation. In Studies in the Vegetational History of the British Isles; Walker, D., West, R.G., Eds.; Cambridge University Press: Cambridge, UK, 1970; pp. 81–96. [Google Scholar]
  154. Zvelebil, M. Mesolithic prelude and Neolithic revolution. In Hunters in Transition; Zvelebil, M., Ed.; Cambridge University Press: Cambridge, UK, 1986; pp. 5–16. [Google Scholar]
  155. Zvelebil, M.; Rowley-Conwy, P. Foragers and farmers in Atlantic Europe. In Hunters in Transition; Zvelebil, M., Ed.; Cambridge University Press: Cambridge, UK, 1986; pp. 67–93. [Google Scholar]
  156. Grøn, O.; Klokkernes, T.; Turov, M.G. Cultural small-scale variations in a hunter-gatherer society: Or ‘everybody wants to be a little bit different!’ An ethno-archaeological study from Siberia. In Proceedings of the Seventh International Conference on the Mesolithic in Europe, Belfast 2005; McCartan, S., Schulting, R., Warren, G., Woodman, P., Eds.; Oxbow Books: Oxford, UK, 2009; pp. 203–209. [Google Scholar]
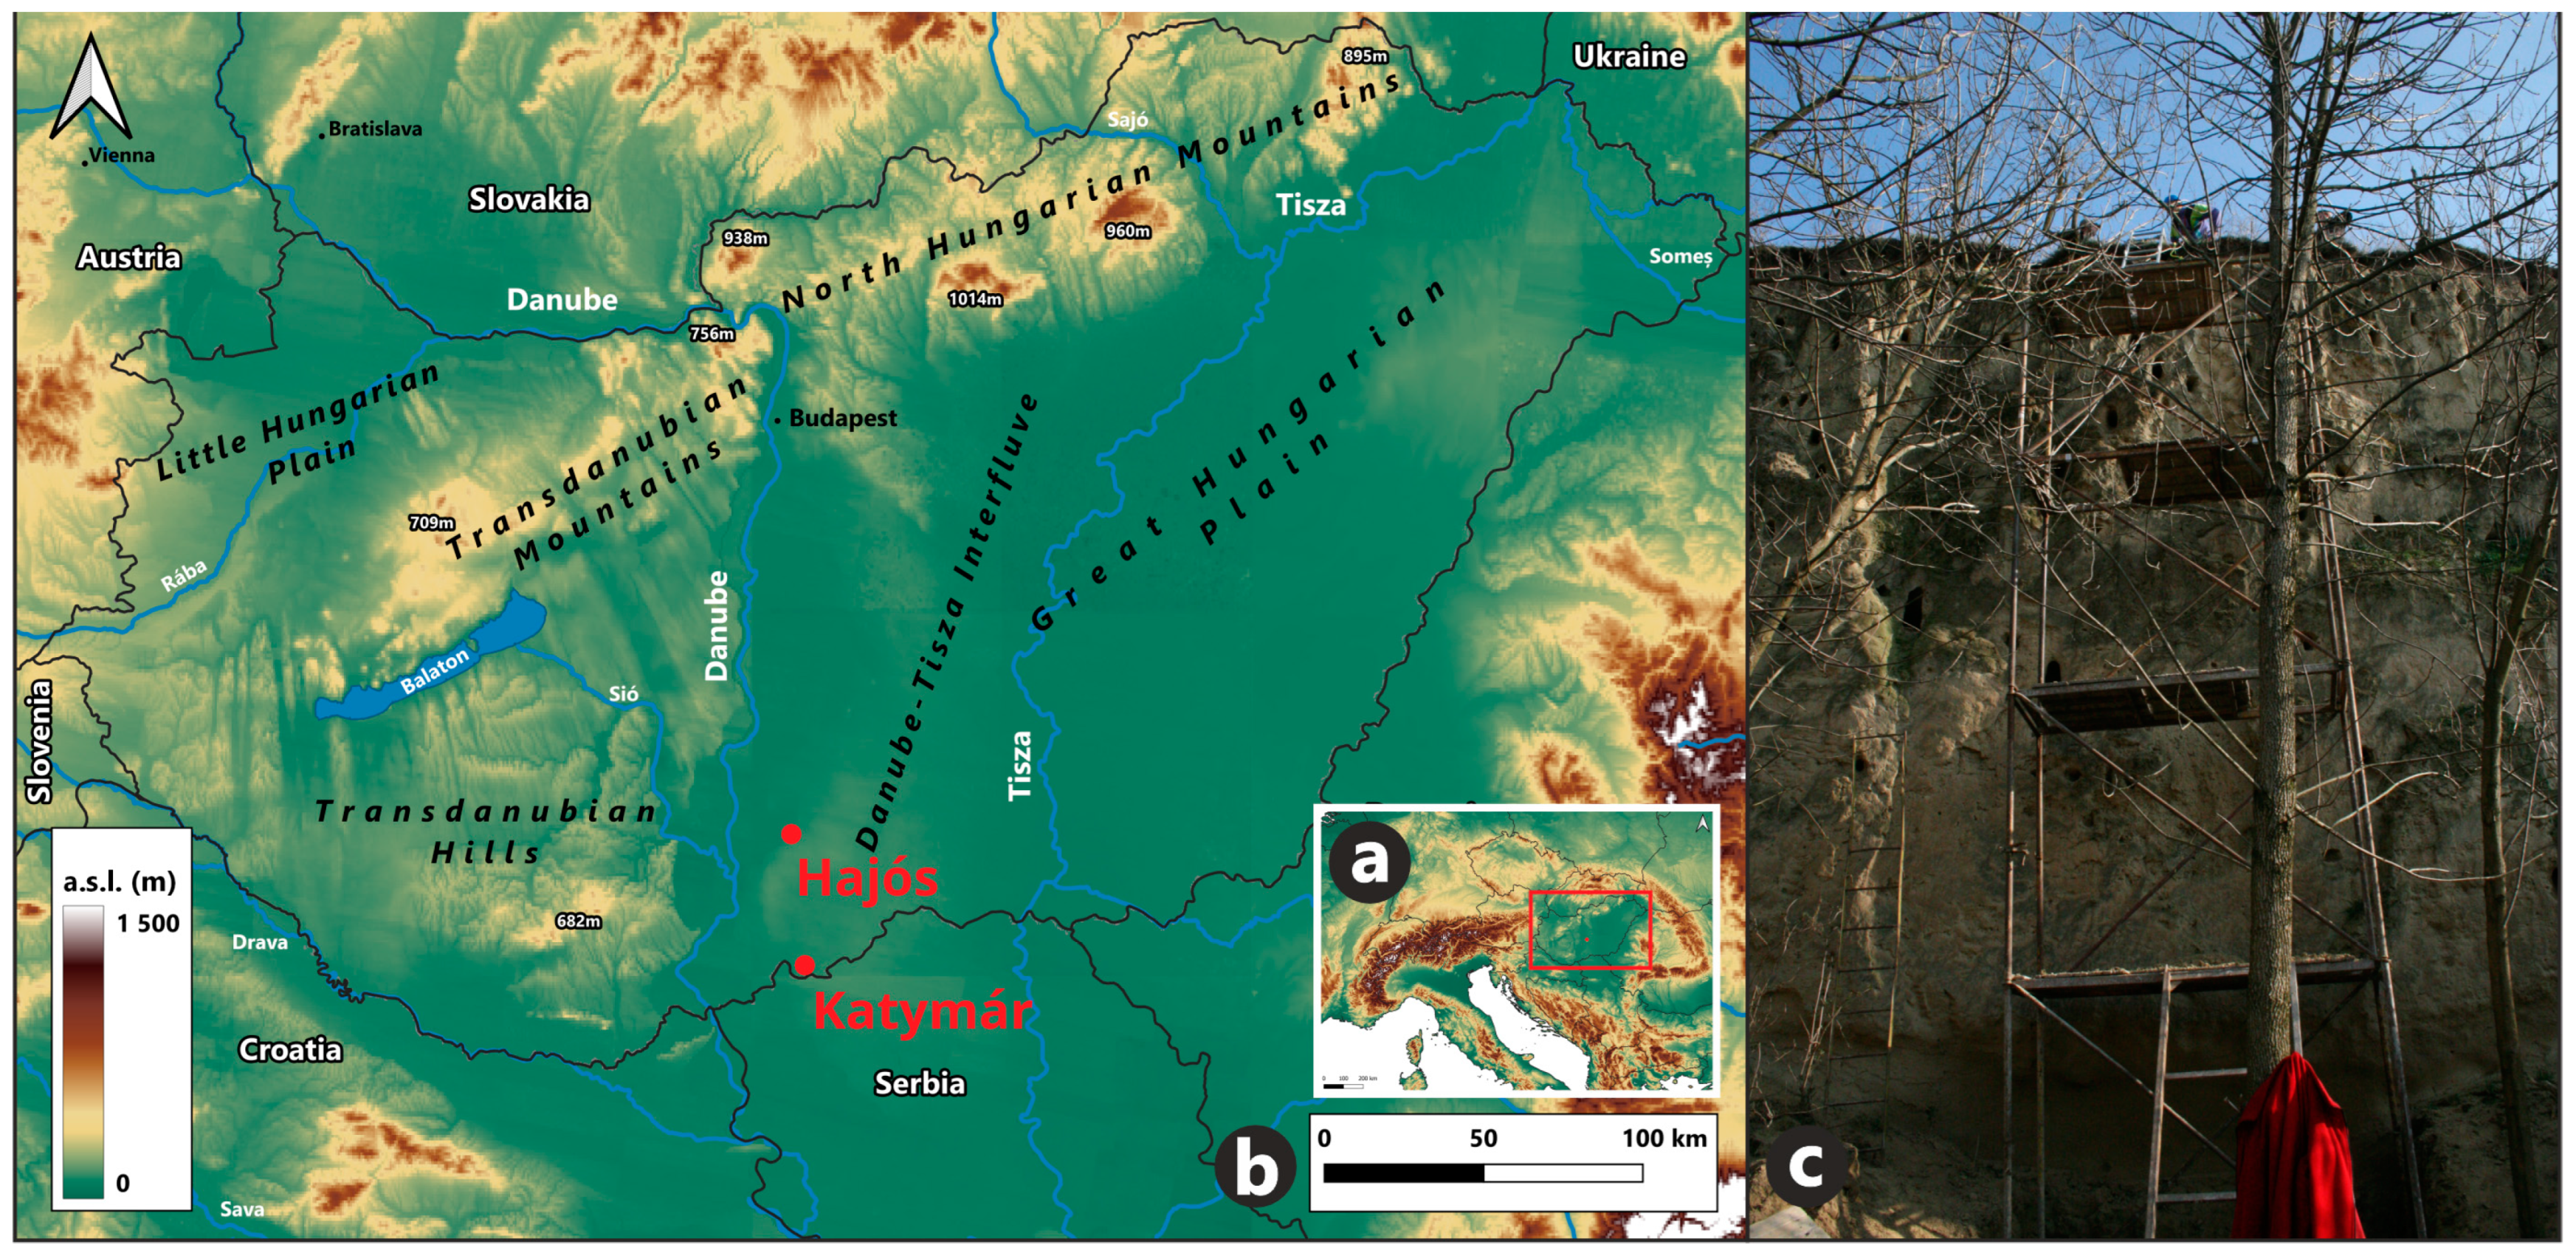
Figure 1. (a) Location of Hungary in Europe in a red square; (b) location of Hajós and Katymár study areas (red points) in Hungary; (c) northern wall of Katymár, sampling location.
Diversity 16 00619 g001
Figure 2. (a) Land use map of the Hajós study area based on the first military survey in 1785; (b) land use map of the Hajós study area based on the second military survey in 1859; (c) land use map of the Hajós study area based on a World War II military survey with the coring locations (I-IV); (d) location of the undisturbed core points (HK1-HK4) in the Hajós study area [3].
Diversity 16 00619 g002
Figure 3. Walter–Lieth diagrams [33] of Hajós (2006–2023) and Katymár (2015–2023) with their station numbers (#), above sea level (m), and coordination. The red-coloured values show the average temperature, and the blue-coloured values show the average precipitation during the 12 months Probable frost months are marked with blue on the bottom scale.
Diversity 16 00619 g003
Figure 4. Results of the LOI, MS, grain size (U-ratio), July palaeotemperature [70], malacological (MLZ), and phytolith (PTZ) zones, and the age-depth model and accumulation rates of the Katymár sequence. The cal BP and modelled cal BP ages are correlated with the GISP2 stadials and interstadials [81] with Heinrich events and Dansgaard–Oeschger cycles [82,83,84].
Diversity 16 00619 g004
Figure 5. Results of the LOI, MS, grain size, and pollen analysis [3], the sedimentological zones (SMZ), and the age-depth model and accumulation rates of the Hajós sequence. The cal BP and modelled cal BP ages are correlated with the GISP2 stadials and interstadials [81] with Heinrich events and Dansgaard–Oeschger cycles [82,83,84].
Diversity 16 00619 g005
Figure 6. Results of the grain size analysis of the Katymár sequence with D50, U-ratio, and GSI.
Diversity 16 00619 g006
Figure 7. Results of the geochemical analysis for the Be, Al, Fe, Mn, Ca, Mg, Sr, Na, and K elements of the Katymár sequence.
Diversity 16 00619 g007
Figure 8. Results of LOI analysis from the Hajós sequence on a ternary plot (OM%, IM%, and CC%). Symbols represent the Troels-Smith classification [23], and the background represents the bottom lake deposit classification system [93,94]—sample depth values (cm) with red-coloured text.
Diversity 16 00619 g008
Figure 9. Results of the grain size and geochemical analysis of the Hajós sequence.
Diversity 16 00619 g009
Figure 10. Results of the malacological analysis of the Katymár sequence: species.
Diversity 16 00619 g010
Figure 11. Results of the malacological analysis of the Katymár sequence: groups.
Diversity 16 00619 g011
Figure 12. Results of the phytolith and MS analysis of the Katymár sequence.
Diversity 16 00619 g012
Table 1. Results of 14C AMS analysis of the Katymár samples.
Depth (cm)Lab CodeMaterialUncal BP + σ(95.4%)
cal BP + σ
Modelled
cal BP + σ
Modelled
cal BP Median
2DeA–22498Holocene organic soil5390 ± 266210 ± 6014,450 ± 60014,510
82DeA–22499Pupilla muscorum shell13,309 ± 4516,000 ± 9016,220 ± 37016,080
182DeA–22500Pupilla muscorum shell17,178 ± 5920,730 ± 9019,230 ± 83019,430
282DeA–22501Pupilla muscorum shell17,846 ± 7121,670 ± 15021,380 ± 30021,440
296DeA–23495Pinus charcoal17,881 ± 6921,720 ± 16021,630 ± 25021,610
382DeA–22502Pupilla muscorum shell18,655 ± 6722,590 ± 13022,660 ± 24022,610
482DeA–22503Pupilla muscorum shell19,952 ± 7823,980 ± 10023,830 ± 29023,890
582DeA–22504Pupilla muscorum shell19,925 ± 7423,960 ± 10024,930 ± 36024,940
682DeA–22505Pupilla muscorum shell22,119 ± 9126,300 ± 19026,220 ± 25026,210
782DeA–23497Pinus charcoal23,046 ± 9427,340 ± 10027,440 ± 25027,340
882DeA–22506Pupilla muscorum shell24,070 ± 11028,220 ± 20028,720 ± 49028,560
982DeA–22507Pupilla muscorum shell24,917 ± 12129,120 ± 15030,610 ± 104030,020
1120DeA–22508Pupilla muscorum shell31,598 ± 25935,920 ± 27033,890 ± 178033,510
Table 2. Results of 14C AMS analysis of the Hajós samples.
Depth (cm)Lab CodeMaterialUncal BP + σ(95.4%)
cal BP + σ
Modelled
cal BP + σ
Modelled
cal BP Median
100Deb–9329Peat1650 ± 801540 ± 901640 ± 2561586
165Deb–9326Peat1770 ± 801660 ± 902989 ± 6612906
220Deb–9328Peat3960 ± 804410 ± 1304858 ± 5784686
236ETH–41278Typha5560 ± 406350 ± 406306 ± 1446332
270Deb–9325Peat7310 ± 808130 ± 908132 ± 2318127
296Deb–9327Peat9130 ± 13010,310 ± 18010,070 ± 48110,179
344ETH–41275Peat10,540 ± 4512,570 ± 7012,445 ± 24412,550
420GdA–554Shell21,190 ± 14025,520± 16017,290 ± 200316,953
Table 3. Statistics of LOI, MS, grain size, and geochemical results of the Katymár North sequence.
FactorsUnitsMinimumAverageMedianMaximumStandard Deviation
Organic material%0.541.681.517.290.75
Carbonate content%4.9612.0512.8914.812.38
Inorganic material%83.6186.2785.7293.182.09
Magnetic susceptibility10−6 m3kg−114.924.1824.267.96.69
Clay%1.1818.3918.7123.892.92
Silt%49.870.3270.2382.874.52
Sand%2.1511.2810.8438.035.34
Calcium (Ca)ppm12.8391.87345.881355.3235.71
Magnesium (Mg)ppm1.15111.43103.231173.1387.98
Sodium (Na)ppm0.011.220.7710.41.25
Potassium (K)ppm0.041.241.154.830.81
Iron (Fe)ppm0.317.5215.8696.5512.68
Manganese (Mn)ppm0.011.340.711468.7
Aluminium (Al)ppm0.0710.528.8642.17.71
Barium (Ba)ppm00.150.11.770.22
Strontium (Sr)ppm00.50.412.410.4
Table 4. Statistics of LOI, MS, grain size, geochemical, and pollen [3] results of the Hajós sequence.
FactorsUnitsMinimumAverageMedianMaximumStandard Deviation
Organic material%050.8570.997.535.1
Carbonate content%02.971.58.42.43
Inorganic material%0.846.1825.610036.15
Magnetic susceptibility10−6 m3kg−1737.29387120.02
Clay%010.6113.1527.66.42
Silt%51.587.7786.451007.21
Sand%01.63048.52.36
Calcium (Ca)ppm113086.431905.585142415.27
Magnesium (Mg)ppm81027.026422855808.62
Sodium (Na)ppm3328.27205.44913.6257.14
Potassium (K)ppm3241.49112.29721.74213.87
Iron (Fe)ppm7366.53386.93852173.54
Manganese (Mn)ppm0134.52142.59315.2465.63
Arbour pollen (AP)pieces166303.6275567115.71
Non-arbour pollen (NAP)pieces9238.26267467117.26
Aqua + Sporepieces032.16356013.29
Total pollen countpieces477574.0257267045.65
Table 5. Malacological zones (MLZ) for the Katymár sequence.
ZoneDepth (cm)Age
(cal BP)
EnvironmentDominant GroupsDominant Species
MLZ-11116–85636,000–28,400Warm steppe,
forest–steppe
Mesoph., Xeroph.
SSE EU, Holarctic
Granaria frumentum, Pupilla triplicate, Chondrula tridens
MLZ-2856–62428,400–25,400Cold steppeMesoph., Xeroph.
SSE EU, W EU, EU, Holarctic
Pupilla muscorum, Pupilla triplicata, Chondrula tridens, Vallonia costata
MLZ-3624–40825,400–23,000Cold steppeMesoph., Hygroph.
EU, W EU, Holarctic
Vitrea crystallina, Punctum pygmaeum
MLZ-4408–1223,000–6200Cold open habitatMost diverse groups by
humidity and biogeography
Vallonia tenuilabris, Pupilla sterri
MLZ-512–06200–Warm steppe,
forest–steppe
Mesoph., Xeroph.
SSE European, Holarctic
Granaria frumentum, Pupilla triplicata
Table 6. Average July palaeotemperature [70] statistics for the Katymár sequence.
ZoneUnitsMinimumAverageMedianMaximumStandard Deviation
MLZ-1°C16.1418.5118.5520.030.98
MLZ-2°C12.2016.6916.7518.620.81
MLZ-3°C11.7115.0815.2516.760.88
MLZ-4°C10.4612.6212.4616.041.29
MLZ-5°C19.5219.7819.8519.920.18
Table 7. Results of the phytolith and anthracological results with modelled cal BP ages.
ZoneDepth (cm)Age (cal BP)Main CharacteristicsPlant Remains
PTZ-11120–110036,000–34,800Elongate long cells, elongate long-cell skeletons, non-grass larger cells, a small number of parallelepipedal bulliforms and cuneiform bulliformsPinus, Betula, burnt Pinus
PTZ-21100–89234,800–28,700Abundant only in elongate long cells and sponge spicules
PTZ-3892–87028,700–28,550A decrease in elongate long cells, sponge spicules drop to 0, and an increase in other formsPinus, burnt Pinus
PTZ-4870–79228,550–27,450Abundant only in elongate long cells and sponge spicules
PTZ-5792–77627,450–27,250A decrease in elongate long cells, sponge spicules drop to 0, and an increase in other formsPinus, burnt Pinus
PTZ-6776–30027,250–21,650Abundant only in elongate long cells and sponge spicules
PTZ-7300–29621,650–21,550A decrease in elongate long cells, sponge spicules drop to 0, and an increase in other formsburnt Pinus
PTZ-8296–2021,550–6200Abundant only in elongate long cells and sponge spicules, declining from 100 cm
PTZ-920–06200–Sponge spicules drop to 0, and various phytolith forms increaseQuercus at 0 cm
Disclaimer/Publisher’s Note: The statements, opinions and data contained in all publications are solely those of the individual author(s) and contributor(s) and not of MDPI and/or the editor(s). MDPI and/or the editor(s) disclaim responsibility for any injury to people or property resulting from any ideas, methods, instructions or products referred to in the content.