Article

Bacterial Community of Heermann’s Gull (Larus heermanni): Insights into Their Most Common Species and Their Functional Role during the Breeding Season in the Gulf of California

by
Enrico A. Ruiz
1,*,
Araceli Contreras-Rodríguez
2,
Oliva Araiza
2,
Ma G. Aguilera-Arreola
2,
Juan A. Hernández-García
2,
José J. Flores-Martínez
3,
Víctor Sánchez-Cordero
3 and
Zulema Gomez-Lunar
2,*
1
Departamento de Zoología, Escuela Nacional de Ciencias Biológicas, Instituto Politécnico Nacional, Prolongación de Carpio y Plan de Ayala s/n, Col. Santo Tomás, Ciudad de México 11340, Mexico
2
Departamento de Microbiología, Escuela Nacional de Ciencias Biológicas, Instituto Politécnico Nacional, Prolongación de Carpio y Plan de Ayala s/n, Col. Santo Tomás, Ciudad de México 11340, Mexico
3
Laboratorio de Sistemas de Información Geográfica, Instituto de Biología, Universidad Nacional Autónoma de México, Cto. Zona Deportiva S/N, C.U., Ciudad de Mexico 04510, Mexico
*
Authors to whom correspondence should be addressed.
Diversity 2024, 16(10), 617; https://doi.org/10.3390/d16100617
Submission received: 18 July 2024 / Revised: 30 September 2024 / Accepted: 1 October 2024 / Published: 3 October 2024
(This article belongs to the Section Marine Diversity)

Abstract

:
The seabird intestinal microbiota, or bacteriome, predominantly consists of bacteria that establish during embryonic development through vertical transfer from females and horizontal transfer during growth and copulation. This study focuses on the Heermann’s Gull (Larus heermanni), a seabird that breeds mainly within the Gulf of California. Our goal was to understand its gut bacteriome composition and its implications for conservation and public health. Using microbiological techniques, 16S rRNA gene sequencing, and mass spectrometry, we characterized the HG gut bacteriome and compared it with other bird species. Our findings reveal a diverse bacteriome, particularly in the intestine and rectum, with dominant phyla including Firmicutes, Proteobacteria, Bacteroidetes, Cyanobacteria, and Fusobacteria. Seasonal and sex-related differences were observed, with significant correlations between some pairs of bacteria. Notably, we identified various pathogens and potential zoonotic bacteria, underscoring the public health risks associated with Heermann’s Gull interaction with humans and other animals. These results highlight the importance of the Heermann’s Gull gut bacteriome in nutrient production, pathogen control, and digestive health, and emphasize the need for further research on pathogen transmission involving seabirds. Our study provides crucial insights for conservation strategies and underscores the role of wild birds in the epidemiology of zoonotic diseases.

1. Introduction

The seabird intestinal microbiota consists mainly of bacteria, and the term bacteriome is used to refer to all members of the Bacteria domain [1]. The seabird intestinal microbiota is established at the beginning of the embryonic development, before the eggshell formation, or at the time of chick hatching. This occurs by vertical transfer from females to eggs; however, the bacteriome is also modified during growth and transferred horizontally during copulation [2,3]. To colonize the digestive tract, the bacteria establish themselves in the mucin layer found on the digestive tract epithelium, which also stands as the first line of defense against infections and repels other bacteria. This bacterial community is dynamic, since it changes depending on the intestinal segment they are thriving on. It is more diverse in the intestine and rectal segments than in the crop, the proventriculus, or the gizzard. This is due to the physicochemical conditions and available resources provided by the host [4,5]. Likewise, the bacterial community may differ between sexes due to seasonal factors such as reproduction, hormonal changes, and behavior [6,7]. The relationship with the host can be positive or harmful, depending on available nutrients, physiology, or the immune system [5]. The consequences of such microbial community/host interaction within the digestive tract are the degradation of polysaccharides, the control of pathogens, and the production of nutrients. It also promotes the conditions for the digestive tract morphological and physiological development [5].
The study on the bacteriome in birds has been oriented mainly to poultry of the orders Galliformes and Anseriformes (e.g., ducks, turkeys, and chickens), due to their importance in the food industry [4,5]. Thus, a wide variety of bacterial pathogens that affect the development and production of such poultry have been described, such as Salmonella spp., Escherichia coli, Mycoplasma gallisepticum and Clostridium spp. [8,9]. Conversely, the description of the microbial community associated with the digestive tract of wild birds is scarce, despite several studies indicating that these birds may be equally prone to contracting common pathogens that affect poultry [10]. Furthermore, there is differences in the susceptibility to acquire pathogens depending on the age, the sex of the individuals, their habits, and their size [10]. Moreover, the species that make up the bacteriome are transferred horizontally between females and males during the reproductive period, commonly from males to females through seminal fluids [2,3,11]. Therefore, the transfer of microorganisms is influenced by mate selection mechanisms, mating systems, and the ability of the immune system to protect the individual [11,12,13]. Within mating systems, monogamy is considered more efficient in controlling pathogens as they increase the mortality of individuals or decrease reproductive success; conversely, when pathogens are of low virulence and the individuals are immunocompetent, polygyny is a better mechanism to develop immunity [13].
In wild birds, differences in the bacterial community have been reported between sexes, both in reproductive and non-reproductive periods [6]. For example, in the herring gull (Larus argentatus), the search for Salmonella pathogenic species was carried out [14], and the results indicated that females have a higher rate of bacterial transport compared to males during the non-reproductive season, while no differences between the sexes were found in the reproductive season [14]. The authors associated this with ethological observations, which showed that females tend to consume lower quality food than males [15] determined the intestinal bacteriome of the herring gull during nesting in coastal and island colonies on the east coast of the United States. The authors identified the phyla Firmicutes, Actinobacteria, Bacteroidetes, Proteobacteria, Cyanobacteria and Fusobacteria as the most abundant. Among these, they identified groups of clinical importance such as species within Enterobacteriaceae and Campylobacteraceae families. Other important species found were Clostridium perfringens, E. coli, and Campylobacter jejuni. In North America, bacterial identification has been carried out in the digestive tract of the laughing gull (Larus atricilla) and the ring-billed gull (Larus delawarensis) through the analysis of the 16S rRNA gene, recognizing the occurrence of 38 genera of globally distributed bacteria, among which ten are considered pathogens [16]. In Mexico, there is one study that found pathogen species of the genera Staphylococcus sp., Vibrio sp. and Escherichia sp. in the Heermann’s gull (Larus heermanni) [17]; this was performed by using microbiological techniques, 16S rRNA gene sequencing, and mass spectrometry. Such findings are important as within the Staphylococcus genus there are pathogenic species for both humans and birds. In poultry, for example, Staphylococcus aureus infection may become systemic and disseminate to involve bones, joints, and tendons. Also, it causes a decrease in mobility, leading to inability to access food and water, which in turn causes morbidity and mortality of chicks [18].
The Heermann’s Gull (hereafter HG) is distributed along the coasts of the Pacific Ocean from southern Canada to Guatemala [19]. Their breeding season occurs in some islands within the Gulf of California (hereafter, GoC), which is recognized by its high primary productivity associated with biotic and abiotic factors [20]. During the breeding season, all HG couples inhabits appropriated GoC islands (mainly Isla Rasa and Isla Cardonosa) and both parents take care of eggs and chicks [19]. This species is classified as “Near Threatened D2” by the International Union for Conservation of Nature (IUCN) red list [21]. This category includes species that could become vulnerable by factors that negatively affect their viability, which determines the need to promote their conservation and to avoid extinction. Therefore, in this study, which establish the Heermann’s Gull bacteriome for the first time, we investigated the HG interactions with microbial species, focusing on the bacteriome of the digestive tract’s last portion. The description of this bacteriome in both males and females will determine whether the associated bacterial community is homogeneous or heterogeneous among individuals, but also between the sexes during the reproductive period. Furthermore, the identification of bacteria with the potential to cause infections that could negatively impact the HG viability will provide with the information needed for conservation policy makers for the better management of this species. Finally, describing the pathogens with potential for zoonoses could be informative of the role of HG in the transmission of diseases, due to its interaction with other birds, humans, and contamination sources during its migration.

2. Materials and Methods

2.1. The Study Area, Sampling, DNA Extraction, and Molecular Sexing

Specific characteristics of the study area have already been described elsewhere [22]. Sample collection (blood and stool samples from adult HG individuals) was carried out on Cardonosa Island (28°53′16″ N and 113°01′51″ W), within the Midriff Island region of the GoC, in June 2019 (Permit SGPA/DGVS/13340/19). Fish and offal were placed as bait at the ground level, with a mist net right in front to capture approaching individuals. Subsequently, the captured birds were wrapped up with individual square blankets and placed in small plastic baskets where they were kept until blood sampling. The blood samples (60 µL) were extracted from the brachial vein using a glass capillary and placed in 1.5 mL microtubes with 600 µL of lysis buffer solution (Longmire buffer) [23]. The fecal samples were obtained non-invasively by rubbing a cotton swab against the cloaca and/or by rubbing the cotton swab immediately after fecal sample deposition and placed in RNAlater Stabilization Solution preservation medium (Thermo Fisher Scientific, Waltham, MA, USA), following the manufacturer’s protocol. Subsequently, both types of samples were deposited in containers with liquid nitrogen and transported to the facilities of the Escuela Nacional de Ciencias Biológicas del Instituto Politécnico Nacional. Once in the laboratory, the samples were kept frozen at –20 °C until processing. Twenty individuals of unknown sex were captured for blood and stool sampling.
As HG presents little to hardly noticeable sexual dimorphism, sex determination was performed by means of molecular sexing of the individuals via PCR of the Chromo-Helicase-DNA banding gene (CHD). This technique has been previously used with positive results for various groups of birds [24]. By visualizing the electrophoresis profile obtained, bird sex can be inferred: a single band of 600 bp corresponds to the ZZ chromosomes present in male individuals; conversely, the presence of two bands (600 and 400 bp), corresponds to the ZW chromosomes observed in females [24]. Cell lysis, purification, and DNA isolation were carried out from the blood sample following the protocol for nucleated blood of the DNeasy Blood and Tissue Kit extraction kit (QIAGEN, Stockach, Germany).
To amplify the Chromo-Helicase-DNA binding region (CHD) gene, the touchdown PCR technique was performed [24]. The PCR reaction primers were 2550F and 2718R, during 35 cycles upon reaching the alignment temperature, and it was performed in a T100 Thermal Cycler (Bio-Rad Laboratories, Inc, Hercules, CA, USA). From the electrophoretic profiles of 20 HG samples, 11 were attributed to males and 9 to females. Once the sex of the individuals was determined, the preserved fecal samples of eight individuals were selected: four females and four males. The selection was carried out based on the available sample mass, choosing those that presented more than 1 g of fecal sample and had a higher proportion of solids than uric acid. Uric acid in bird feces corresponds to the whitish fraction, while the excreta part has a darker color and a pasty texture. Based on this criterion, fecal samples from four males (M04, M05, M10 and M20) and four females (H03, H08, H13 and H14) were selected.

2.2. Isolation of Metagenomic DNA and Massive Semiconductor Sequencing

DNA isolation was performed using the PureLink Microbiome DNA Purification Kit (Thermo Fisher Scientific) for fecal samples, following the manufacturer’s protocol. Once the genomic DNA (gDNA) of the samples was obtained, the amplification of 16S rRNA fragments (around 420–430 bp, variable regions V3–V4) was carried out using the Ion Torrent sequencing technology. The PCR reaction consisted of 35 cycles and was also performed in the same T100 Thermal Cycler. The concentration and volume of each reagent used is shown in Supplementary Table S3 and PCR conditions in Supplementary Table S4. The primers 341F and 805R were used [25], as well as the Ion Torrent adapters. The amplicon size from each reaction was verified by performing 2% agarose gel electrophoresis. The PCR products were mixed and purified with the GeneJET Gel Extraction Kit (Thermo Scientific). The preparation of the libraries was carried out using the Ion Plus Fragment Library Kit (Thermo Scientific) according to the manufacturer’s method through emulsion PCR. The quality of the libraries was quantified using the Qubit 2.0 fluorometer (Thermo Scientific). Finally, massive semiconductor sequencing was performed on the Ion S5TM XL platform (Thermo Scientific). Metagenomic DNA isolation, library preparation, sequencing, and preprocessing were outsourced to Novogene (Sacramento, CA, USA), to which the selected samples were sent.

2.3. Library Analysis

Raw sequence analysis was performed according to the preprocessing described by Douglas et al. [26]. The sequences were analyzed to evaluate the quality using the FastQC ver. 0.12.0 [27], along with the Phred quality score (Q20). This last measure indicates the probability that 1 in 100 bases was incorrectly assigned during the sequencing process. To filter out low-quality sequences, the FASTX-Toolkit ver. 0.0.13 program http://hannonlab.cshl.edu/fastx_toolkit/index.html (acceded on 4 April 2023) was used. Finally, BBMap ver. 39.06 program http://sourceforge.net/projects/bbmap/ (acceded on 13 April 2023) was used to eliminate sequences that were shorter than 400 bp and longer than 450 bp, non-specific sequences, adapters, and primers.

2.4. Bioinformatic and Reference Operational Taxonomic Units (OTUs)

From the purified libraries, taxonomic determination was carried out according to the protocol by Rincón-Molina et al. [28], as described below: To identify the largest possible number of taxa in the community, the Quantitative Insights Into Microbial Ecology (QIIME) ver1.4.0 program was used [29]. The open-reference, closed-reference and de novo methods were chosen. From each library the first sequences were selected as reference Operational Taxonomic Units (OTUs), and the rest of the sequences were grouped into clusters with a criterion of 97% identity. This was performed with the UCLUST ver 1.2.22q program [30]. After the alignment, a biological observation matrix (BIOM) file was generated with the abundance of the OTUs in each sample (OTU table). On the other hand, with those sequences that did not meet the clustering criterion, the de novo method was performed and new reference OTUs were established. The references were compared under the same clustering criterion with the rest of the sequences (97% identity) and, again, a BIOME file was generated. On this occasion, those reads that did not cluster were removed from subsequent analyses. Finally, both matrices were concatenated into one.

2.5. Search and Identification of Chimeric Sequences

During amplification of the 16S rRNA gene, chimeric sequences are the result of multiple hybridizing parental sequences [31]. To search for and identify these chimeric sequences, the representative OTUs (previously obtained), were aligned with the Python Nearest Alignment Space Termination Tool (PyNAST) ver. 1.2.2 program [32]. The resulting FASTA file was used as input file for chimeric sequence identification in Chimera Slayer v1.40.0 software [31]. Then, terminal fragments were taken from the reference OTUs to align with chimera-free reference sequences from the Greengenes database (http://greengenes.lbl.gov/ (accessed on 4 April 2023)) [33]. In case similarities were found between more than one sequence, such references were taken as candidate parental sequences of the chimeric sequences. Multiple alignments were run between fragments of each chimeric sequence and both parental sequences. With these possible chimeric sequences, a bootstrap analysis of 1000 pseudoreplicates was then carried out to determine if the assignment with their parental sequences was correct, this being the case when a homology between them was at least 90%. In addition, a search for divergence between them was carried out. If one of them had a minimum radius of divergence (and met the criteria of the bootstrap analysis), the sequence was considered a chimera and was eliminated from subsequent analyzes [31].

2.6. Taxonomic Assignment

From the matrices without chimeric sequences, the reference OTUs were selected to perform the alignment with sequences from the Greengenes database, using the PyNAST software. The taxonomic assignment of the reference OTUs was carried out with the Ribosomal Database Project (RDP) classifier algorithm (http://rdp.cme.msu.edu/classifier/classifier.jsp (accessed on 4 April 2023)) [34]. To determine the confidence level of the taxonomic determinations, a bootstrap analysis of 1000 pseudoreplicates was performed. These assignments were considered correct when they had a confidence value of >80%, that is, the same taxonomic identity was found in at least 80% of the pseudoreplicates.

2.7. Alpha and Beta Diversity Analyses

Sequences with only one or two taxonomic assignments (singletons and doubletons, respectively) were excluded from subsequent bacterial community diversity analyses. Likewise, the samples were rarified to the lowest number of sequences in the libraries to avoid biases in the estimation. Subsequently, the Good’s coverage estimator [35] was used to determine the coverage carried out in the bacterial community of each sample. The table in BIOM (Biological Observation Matrix) format obtained at the end of the rarefaction was used as an input file in the Metagenome Analyzer ver. 6.25.9 (MEGAN6) program [36] to visualize some of the characteristics of the community, such as the abundance of OTUs at different taxonomic levels. Species richness was evaluated with the non-parametric species richness estimators, abundance-based coverage estimator (ACE), Chao1, and the Simpson’s reciprocal index [37,38]. Alpha diversity was calculated with the Shannon–Weaver and Simpson indices [38,39], along with Faith’s phylogenetic alpha diversity [40].
To evaluate the difference between individuals and sexes, beta diversity was evaluated using the Bray Curtis index, Jaccard’s similarity coefficient, and Euclidean distance [41]. Also, we used the weighted and unweighted UniFrac phylogenetic distance method [42,43]. The matrices resulting from these analyzes were in turn analyzed in a Principal Coordinate Analysis (PCoA), using the PAleontological STatistics (PAST) ver. 4.16.c program [44]. To test for differences among samples, an Analysis of Similarities (ANOSIM) was performed for the three indices (Bray–Curtis, Jaccard index, and Euclidean distance). From the phylogenetic distance analyzes (unweighted and weighted UniFrac) it was determined whether the difference between the samples was significant, through Monte Carlo simulations [42]. If statistically significant differences were found (p < 0.05), the Bonferroni correction was performed to determine whether such differences correspond to false positives [45].

2.8. Metabolic Predictions

A metabolic prediction analysis was performed to identify the metabolic functions of the bacterial community. This analysis was carried out from representative sequences of the 16S rRNA gene (reference OTUs) selected trough QIIME, from which phylogenetically close reference genomes and the annotation of their genes were searched (both deposited in databases) [46]. First, the clustering of OTUs was performed by the closed-reference method (see above). The most abundant sequences were selected as reference OTUs, and clusters with 97% identity were generated using the UCLUST program. To assign taxonomic identity, the alignment of the reference OTUs (in the BIOM file format) was carried out using the PyNAST program, and they were compared with the Greengenes database and the Ribosomal Database Project algorithm. The data from the BIOM file were normalized and subsequently entered in the Phylogenetic Investigation of Communities by Reconstruction of Unobserved States (PICRUSt) package ver. 1.1.4 [46]. Then, to search for phylogenetically close reference genomes the sequences were compared to the Kyoto Encyclopedia of Genes and Genomes (KEGG) database [47]. Subsequently, the assignment data from the BIOM file were used to quantitatively determine the presence of the genes in the community of each sample. In QIIME, predictions were visualized as functional categories at hierarchical level two and three. For statistical support, the Nearest Sequenced Taxon Index (NSTI) [46] was run to determine the precision of the predictions, based on the information available in the databases used.

2.9. Identification of Pathogens of Birds and Humans

To identify pathogenic species of birds and humans, the core bacteriome was first determined at the hierarchical species level in the QIIME program, which is composed of the species that are present in at least 50% of the samples. Subsequently, a bibliographic search was carried out for the species included in the central bacteriome to determine which of these species have been reported or associated with infections in humans, other vertebrates, and farmed and/or wild birds.

2.10. Determination of Correlations Between Species

To infer interactions that may occur between members of the core bacteriome, a Spearman correlation analysis was performed to determine whether species abundance correlates with the presence or absence of other species. The significance of these relationships, positive or negative, was determined through a two-way t test [44].

3. Results

3.1. Partial 16S rRNA Gene Sequencing and Library Preprocessing

Between 98,613 and 197,304 sequences were retrieved from the eight libraries, and after quality analysis, 86,156 to 139,342 sequences were obtained. The average sequence size was 417 bp (Table 1) (BioProject accession number PRJNA1136531; https://www.ncbi.nlm.nih.gov/sra/PRJNA1136531 (acceded on 4 April 2023)). The Phred quality levels (Q20) of the sequences were >75% in all cases, and in seven of them >80%. Such values suggest that the sequencing process correctly recognized most nucleotides. On the other hand, the effectiveness percentages of preprocessing analysis and sequencing were >70% in all libraries, and >80% in seven of them. These values demonstrated to be optimal for community analysis.

3.2. Taxonomic Bacteriome Composition

To reveal the composition of the intestinal bacteriome, the open-reference method was used using the QIIME program. A total of 439,833 readings were obtained, with values from 27,966 (sample H03) to 73,263 (sample M10). On average, the samples consist of 54,979 readings (s.d. = 12,780). Data rarefaction was performed at a value of 27,966 reads (the lowest value in the community). After the taxonomic assignment of the OTUs, the presence of the phylum Euryarchaeota (Archaea domain), along with other 19 bacterial phyla, was determined. The community is mainly composed by: Cyanobacteria (29.42%), Firmicutes (29.17%), Proteobacteria (26.58%), Bacteroidetes (8.76%), Fusobacteria (4.02%) and Actinobacteria (1.36%), all of which represent 99.3% of the intestinal bacteriome (Figure 1). On the other hand, the phyla Acidobacteria, Chlorobi, Chloroflexi, Deferribacteres, Deinococcus-Thermus, Eucyarchaeota, Gemmatimonadetes, Nitrospirae, Planctomycetes, Spirochaetes, Synergistetes, Tenericutes, and Verrucomicrobia make up only the remaining 0.7%.

3.3. Richness, Alpha, and Beta Diversity

Overall, richness species was >350. The Chao 1 estimator indicated the presence of at least 553 species and the ACE estimator 618 species. Among the most abundant species were: Bacteroides uniformis, Faecalibacterium prausnitzii, Cetobacterium somerae, E. coli, Psychrobacter sanguinis and Photobacterium angustum.
The bacteriome community showed greater differences in observed species richness in the intestinal tract of HG males than in females (male mean = 989.8 female mean = 807.3). Other species richness estimators showed the same pattern. For example, in the Chao 1 estimator, the mean value was 1384.9 in males, and 1114.5 in females. With the ACE estimator, a mean value of 1388.9 was obtained in males, and 1146.6 in females. Extreme sets of lower and higher values are represented by H13 and M20. The sample H13 presented the lowest richness values (350), (Chao 1 = 553.3 and ACE = 618.7). Conversely, sample M20 showed the highest richness values (1415), (Chao 1 estimator = 1893.3 and ACE = 1849.8) (Table 2). Good’s coverage was greater than 98% in all samples, including the average value. This indicates a high probability of sequences been detected within all the samples (Table 2). On the alpha diversity, high values were obtained with all estimators. The Shannon index presented values greater than 2.73 in all samples and a mean of 4.98; Simpson’s reciprocal reported values were greater than 0.69 with a mean of 0.86. Like the species richness estimators, there was a trend toward greater diversity in the bacteriome community of males than females. A mean value of the Shannon index of 5.3 in males and 4.7 in females was observed. Simpson’s reciprocal was 0.9 in males and 0.83 in females. For the average value of phylogenetic diversity, this was 67.8 in males and 55.7 in females. On the most extreme values, female sample H13 presented the lowest alpha diversity values (Shannon = 2.73; Simpson = 0.69; phylogenetic diversity = 32.62), while the highest were found in male sample M20 (Shannon = 6.35; Simpson = 0.93; phylogenetic diversity = 67.8).
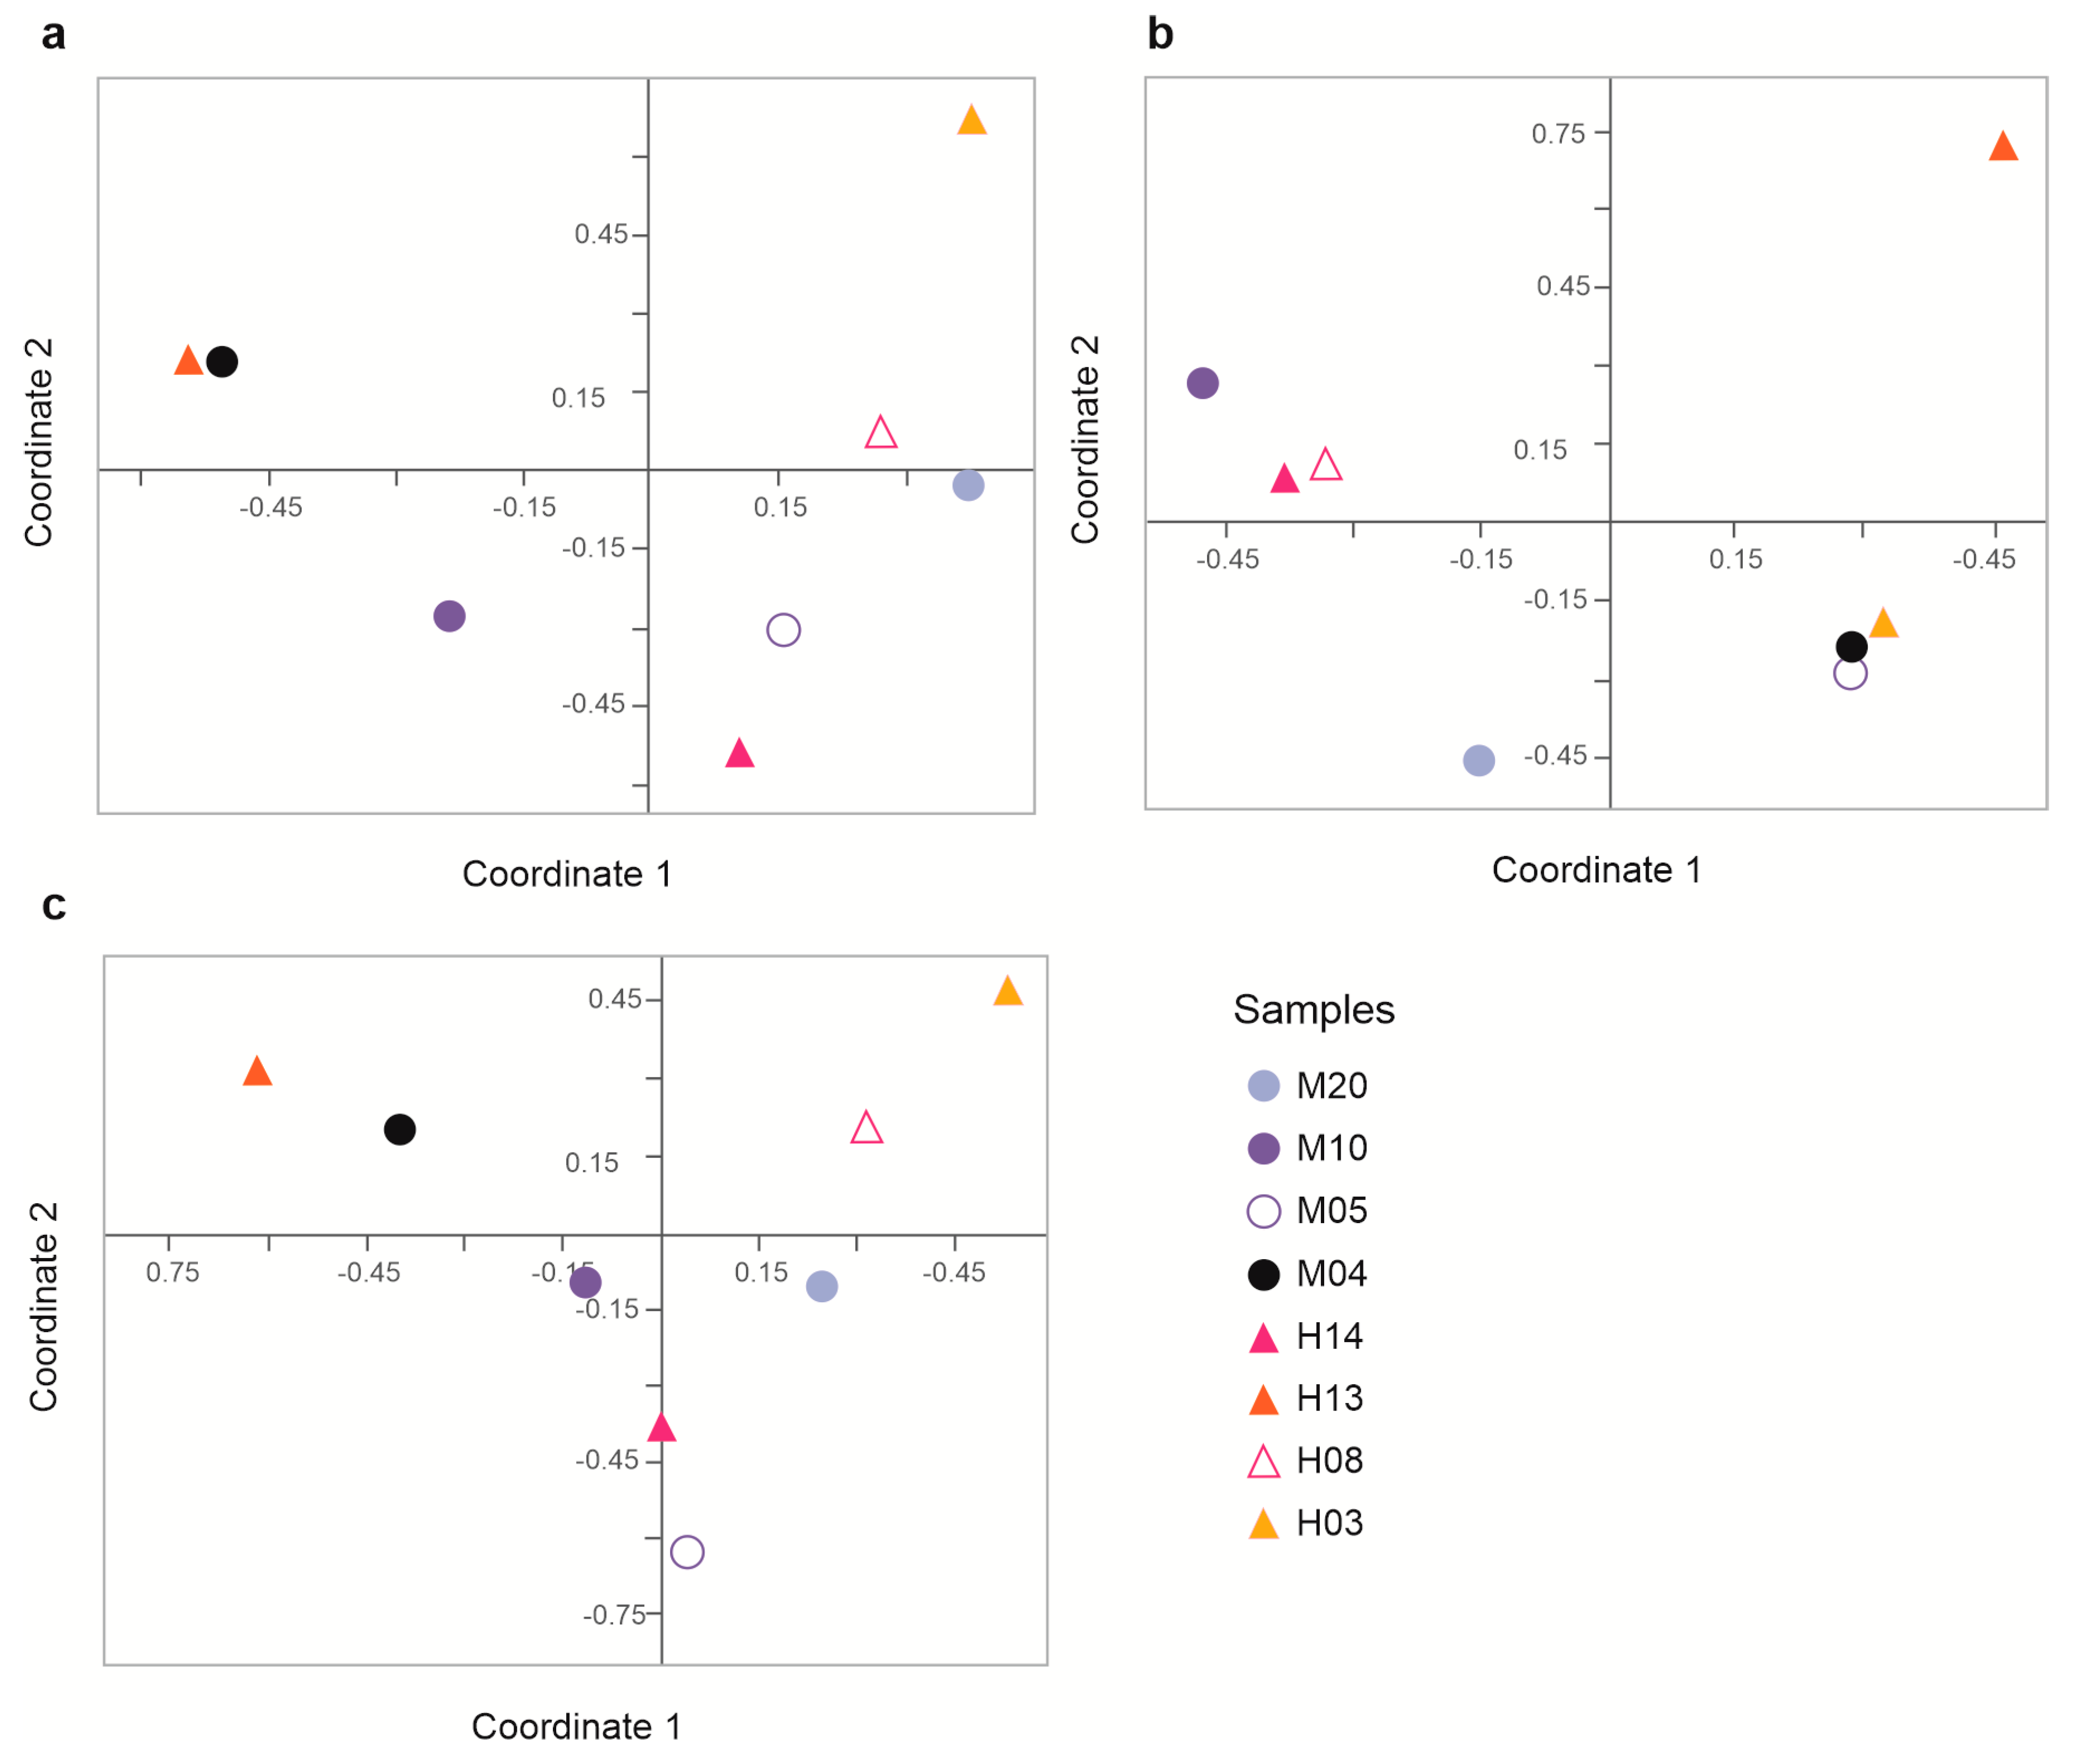
Regarding beta diversity, the results of the Bray–Curtis index showed that, considering all HG samples, dissimilarity ranges from 0.266 to 0.938 (H13 vs. M04 and H03 vs. M10, respectively) (Table 3). However, among males, the range of this dissimilarity is lower, ranging from 0.581 to 0.877. For its part, in females the dissimilarity is wider than in males, ranging from 0.519 to 0.929. When evaluated within the sexes, the mean value of dissimilarity is slightly lower among females (0.762) than among males (0.781). With the ordering of the samples via PCoA (Figure 2a), it was observed that there is no pattern that allows to recognize different bacteriomes in females and males separately. Samples H13 vs. M04 have the smallest distance between them, followed by samples H08 vs. M20, and H14 vs. M05. On the other hand, samples M10 vs. H03 are far from the rest. The Jaccard index showed that the samples have a similarity between 0.605 (H14 vs. M10) and 0.858 (H13 vs. M20). These values were very similar among males (0.762 to 0.837), while values between 0.629 and 0.829 were found in females. The mean value of these paired comparisons showed that the similarity is higher between the bacterial communities of males (0.79) than that of females (0.775) (Table 3). PCoA analysis did not show a pattern of clustering of female or male samples separately. On the contrary, these samples were found without any type of apparent association (Figure 2b). The value of the Euclidean distance between the samples was from 4929.2 (H14 vs. M10) to 20,246.1 (H13 vs. H03). Values from 7695.3 to 12,954.8 were found among males, and in females the differences in range were greater, from 7195.5 to 20,246.1. In males the Euclidean distance had a mean value of 10,779.5, while among females it was higher, 13,770.3 (Table 3). As in the previous cases of the Bray–Curtis and Jaccard indices, the PCoA did not show a pattern of clustering of females or males, or any other type of obvious groups (Figure 2c). For all three indices (Bray–Curtis, Jaccard index, and Euclidean distance), ANOSIM analyses showed no statistically significant differences (p > 0.05).
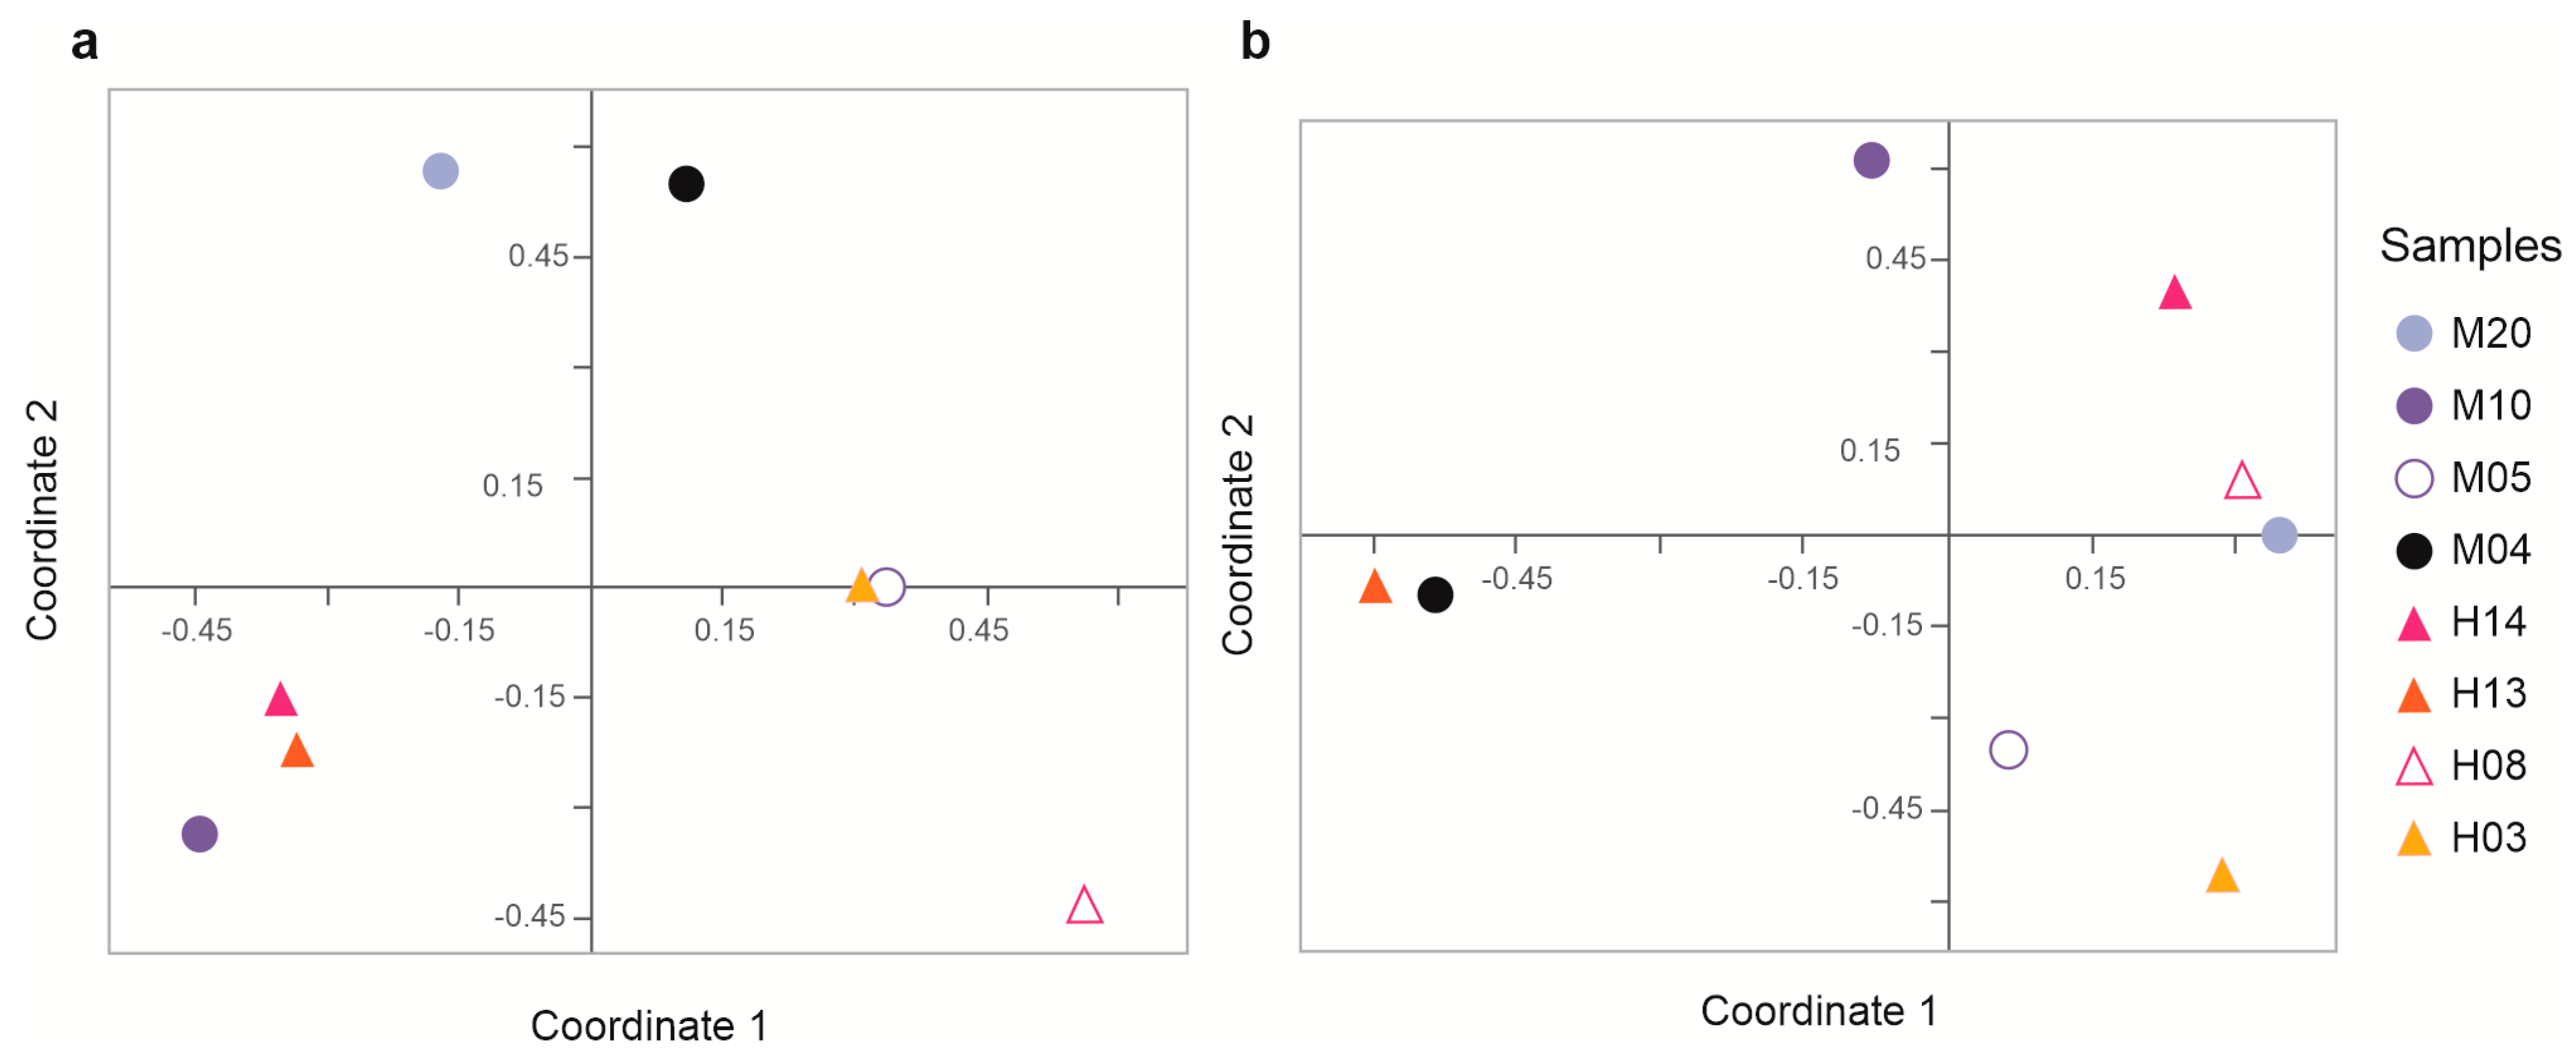
Unweighted UniFrac phylogenetic distance analysis considers qualitative values to calculate the distance between samples. These values were between 0.462 (samples M10 vs. H14) and 0.716 (samples H13 vs. M20) (Table 4). There were values between 0.561 and 0.663 among males, while they were between 0.483 and 0.679 in females. On the other hand, the average value for males was 0.621, very similar to that of females, which was 0.615. With the PCoA analysis it was not possible to observe any clusters of either males or females. The samples with the shortest distance were H03 and M05, then H14, H08 and M10, followed by M20 and M04, while the one with the greatest distance from the rest was H13 (Figure 3a). The differences between all samples were statistically significant (p = 0), the same as with the Bonferroni correction (p ≤ 0.01). The weighted UniFrac analysis, which considers quantitative and qualitative values to calculate the distance, resulted in values from 0.134 (samples H13 vs. M04) to 0.766 (between M10 vs. H3) (Table 4).
Values of 0.503 to 0.717 were found among males, while there were values of 0.35 to 0.753 in females. In this case, there is slightly greater variation among females than among males. On the other hand, the average value of males was 0.6, very similar to that of females (0.598). In the PCoA, no ordering was found that indicates a differential pattern between both sexes. Samples H13 and M04, as well as M20 and H08, presented a shorter distance, compared to the rest of the samples. It was observed that M10, H14, M05 and H03 have a considerable distance from the rest of the samples (Figure 3b). On the other hand, significant differences were found between samples H14 and M04 (p = 0.03), H14 and M05 (p = 0.03), M04 and M05 (p = 0), and M05 and M10 (p = 0.04). For the rest of the samples the difference was not significant (p ≥ 0.05). After Bonferroni corrections, it was determined that the differences between samples were not significant (p ≥ 0.84), except for samples M04 and M10 (p ≤ 0.01). The differences found between the samples with both analyzes do not correspond to differences attributable to the sex of the individuals.

3.4. Assessed Metabolic Predictions

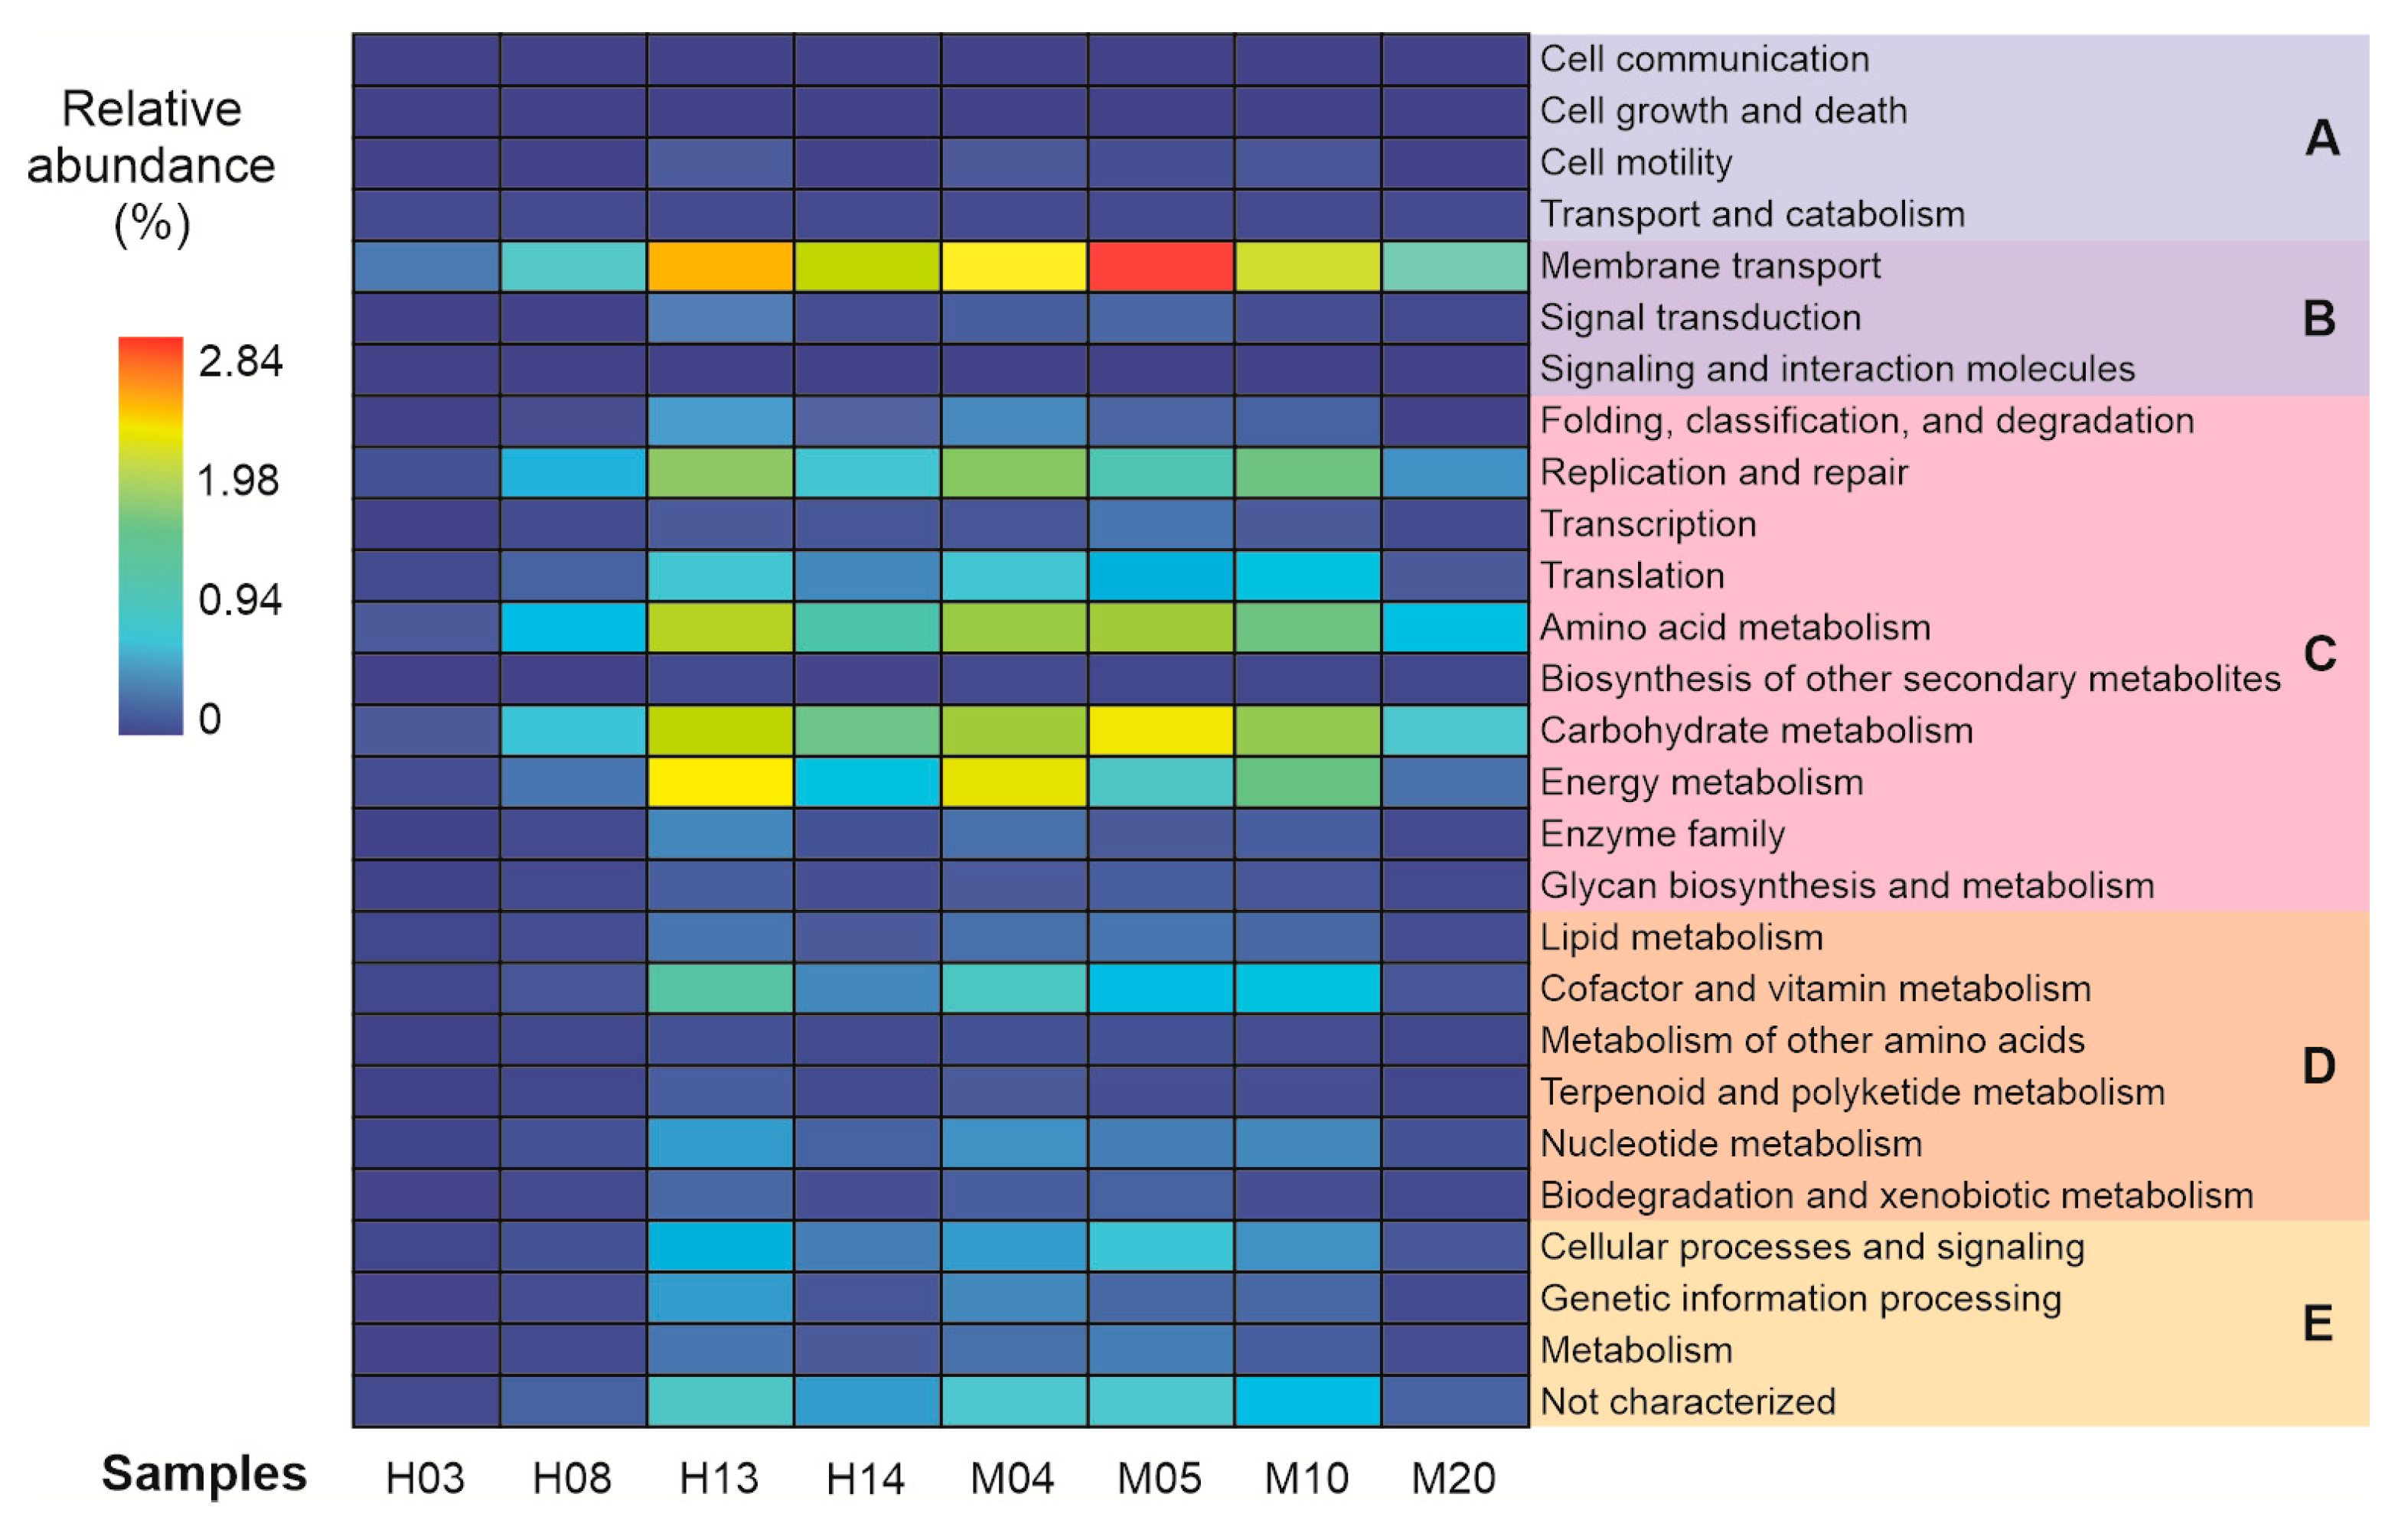
To assess the possible ecological niche of HG individuals’ gut bacteriome members, as well as the presence of possible pathogenicity factors, the prediction of 41 metabolic activities was carried out at hierarchical level two, associated with cellular processes, processing of environmental information, processing of genetic information, and metabolism of biomolecules. The NSTI results presented values between 0.07 (sample H13) and 0.297 (sample M04), which indicates a high accuracy in metabolic predictions. After debugging metabolic predictions, 27 metabolic activities were highlighted, of which the highest relative abundance was mainly associated with functions such as membrane transport (relative abundance, 13.01%), carbohydrate metabolism (9.93%), amino acid metabolism (8.95%), energy metabolism (8.03%), and cell replication and repair (7.69%) (Figure 4). 242 activities classified at hierarchical level three in the KEEG Database were found. As part of membrane transport, there are several systems that stand out: ABC transporters, bacterial secretion systems, the phosphotransferase system, secretion systems, and transporters. In carbohydrate metabolism, the metabolism of amino sugars, ascorbate and aldarate, butanoate, citrate cycle, fructose and mannose, glycolysis, and starch degradation (among others), stand out. In amino acid metabolism, the metabolism of alanine, aspartate and glutamate, tryptophan, tyrosine, synthesis and degradation of valine, and leucine and isoleucine, among others, stand out. In energy metabolism, carbon fixation by photosynthetic organisms, carbon fixation pathways of prokaryotes, methane metabolism, nitrogen metabolism, oxidative phosphorylation, photosynthesis, and sulfur metabolism stand out. Finally, in cell replication and repair, base excision repair, DNA repair and protein recombination, DNA replication and protein replication stand out.

3.5. Identification of Pathogenic Bacteria

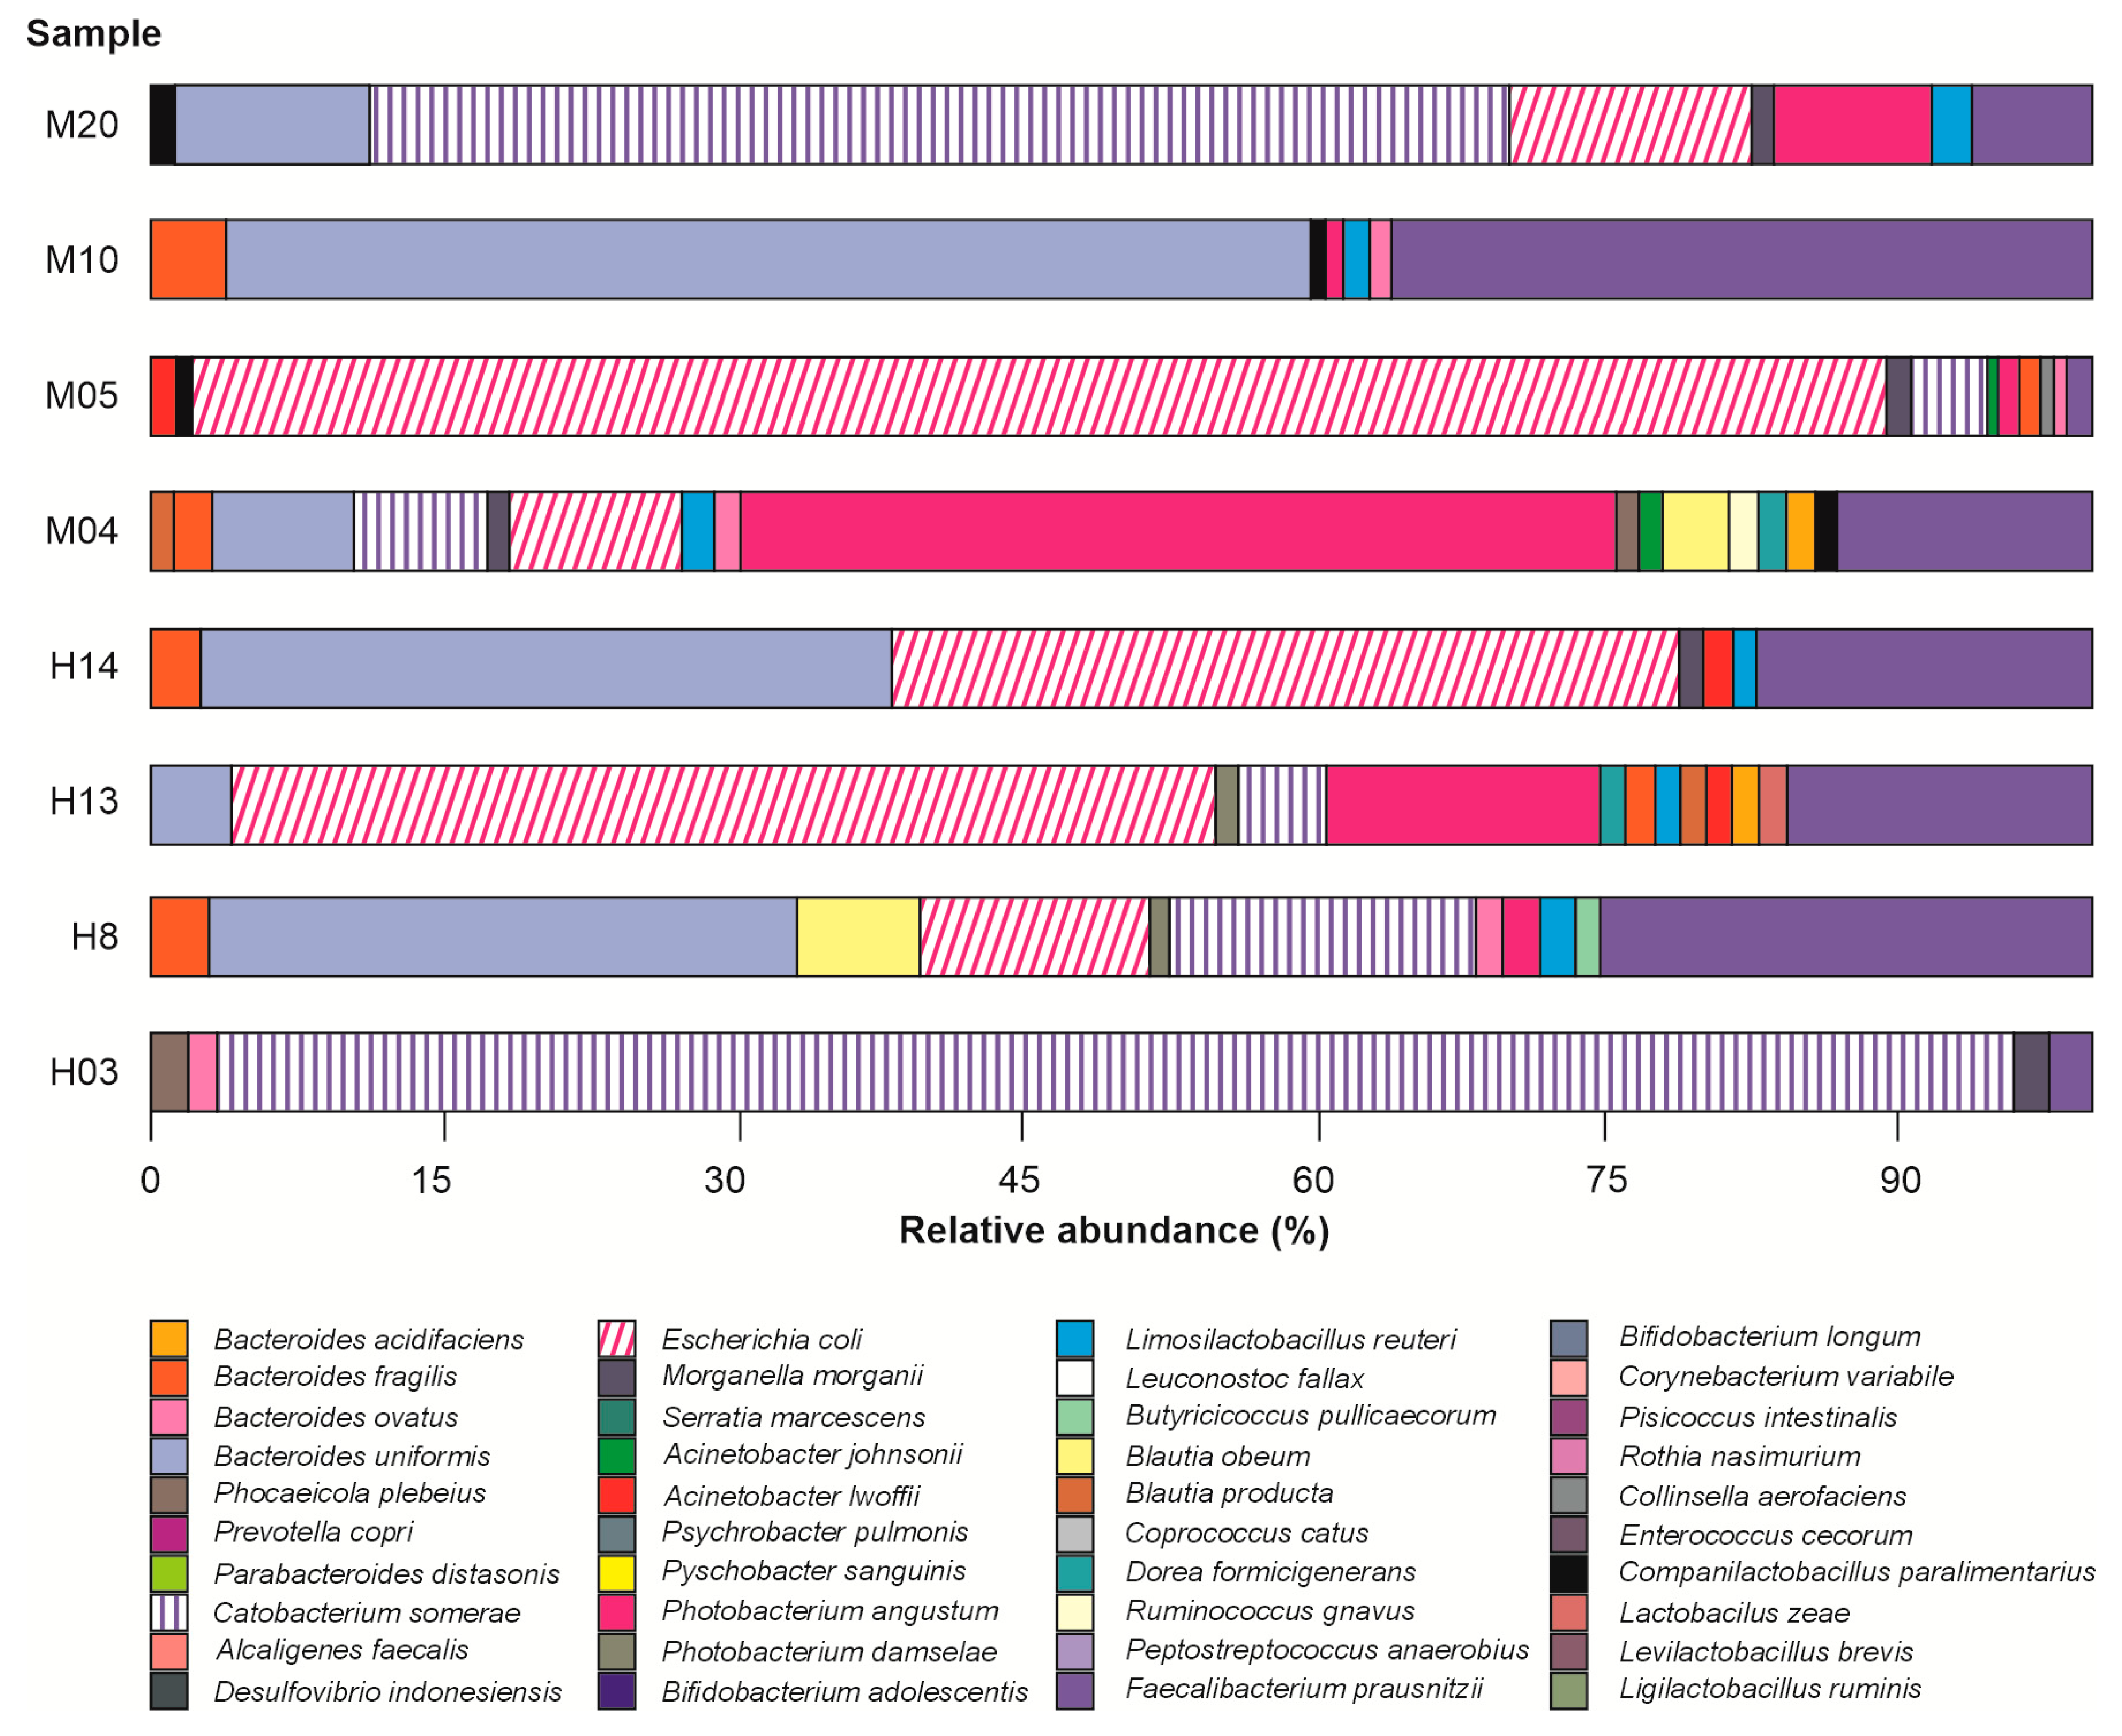
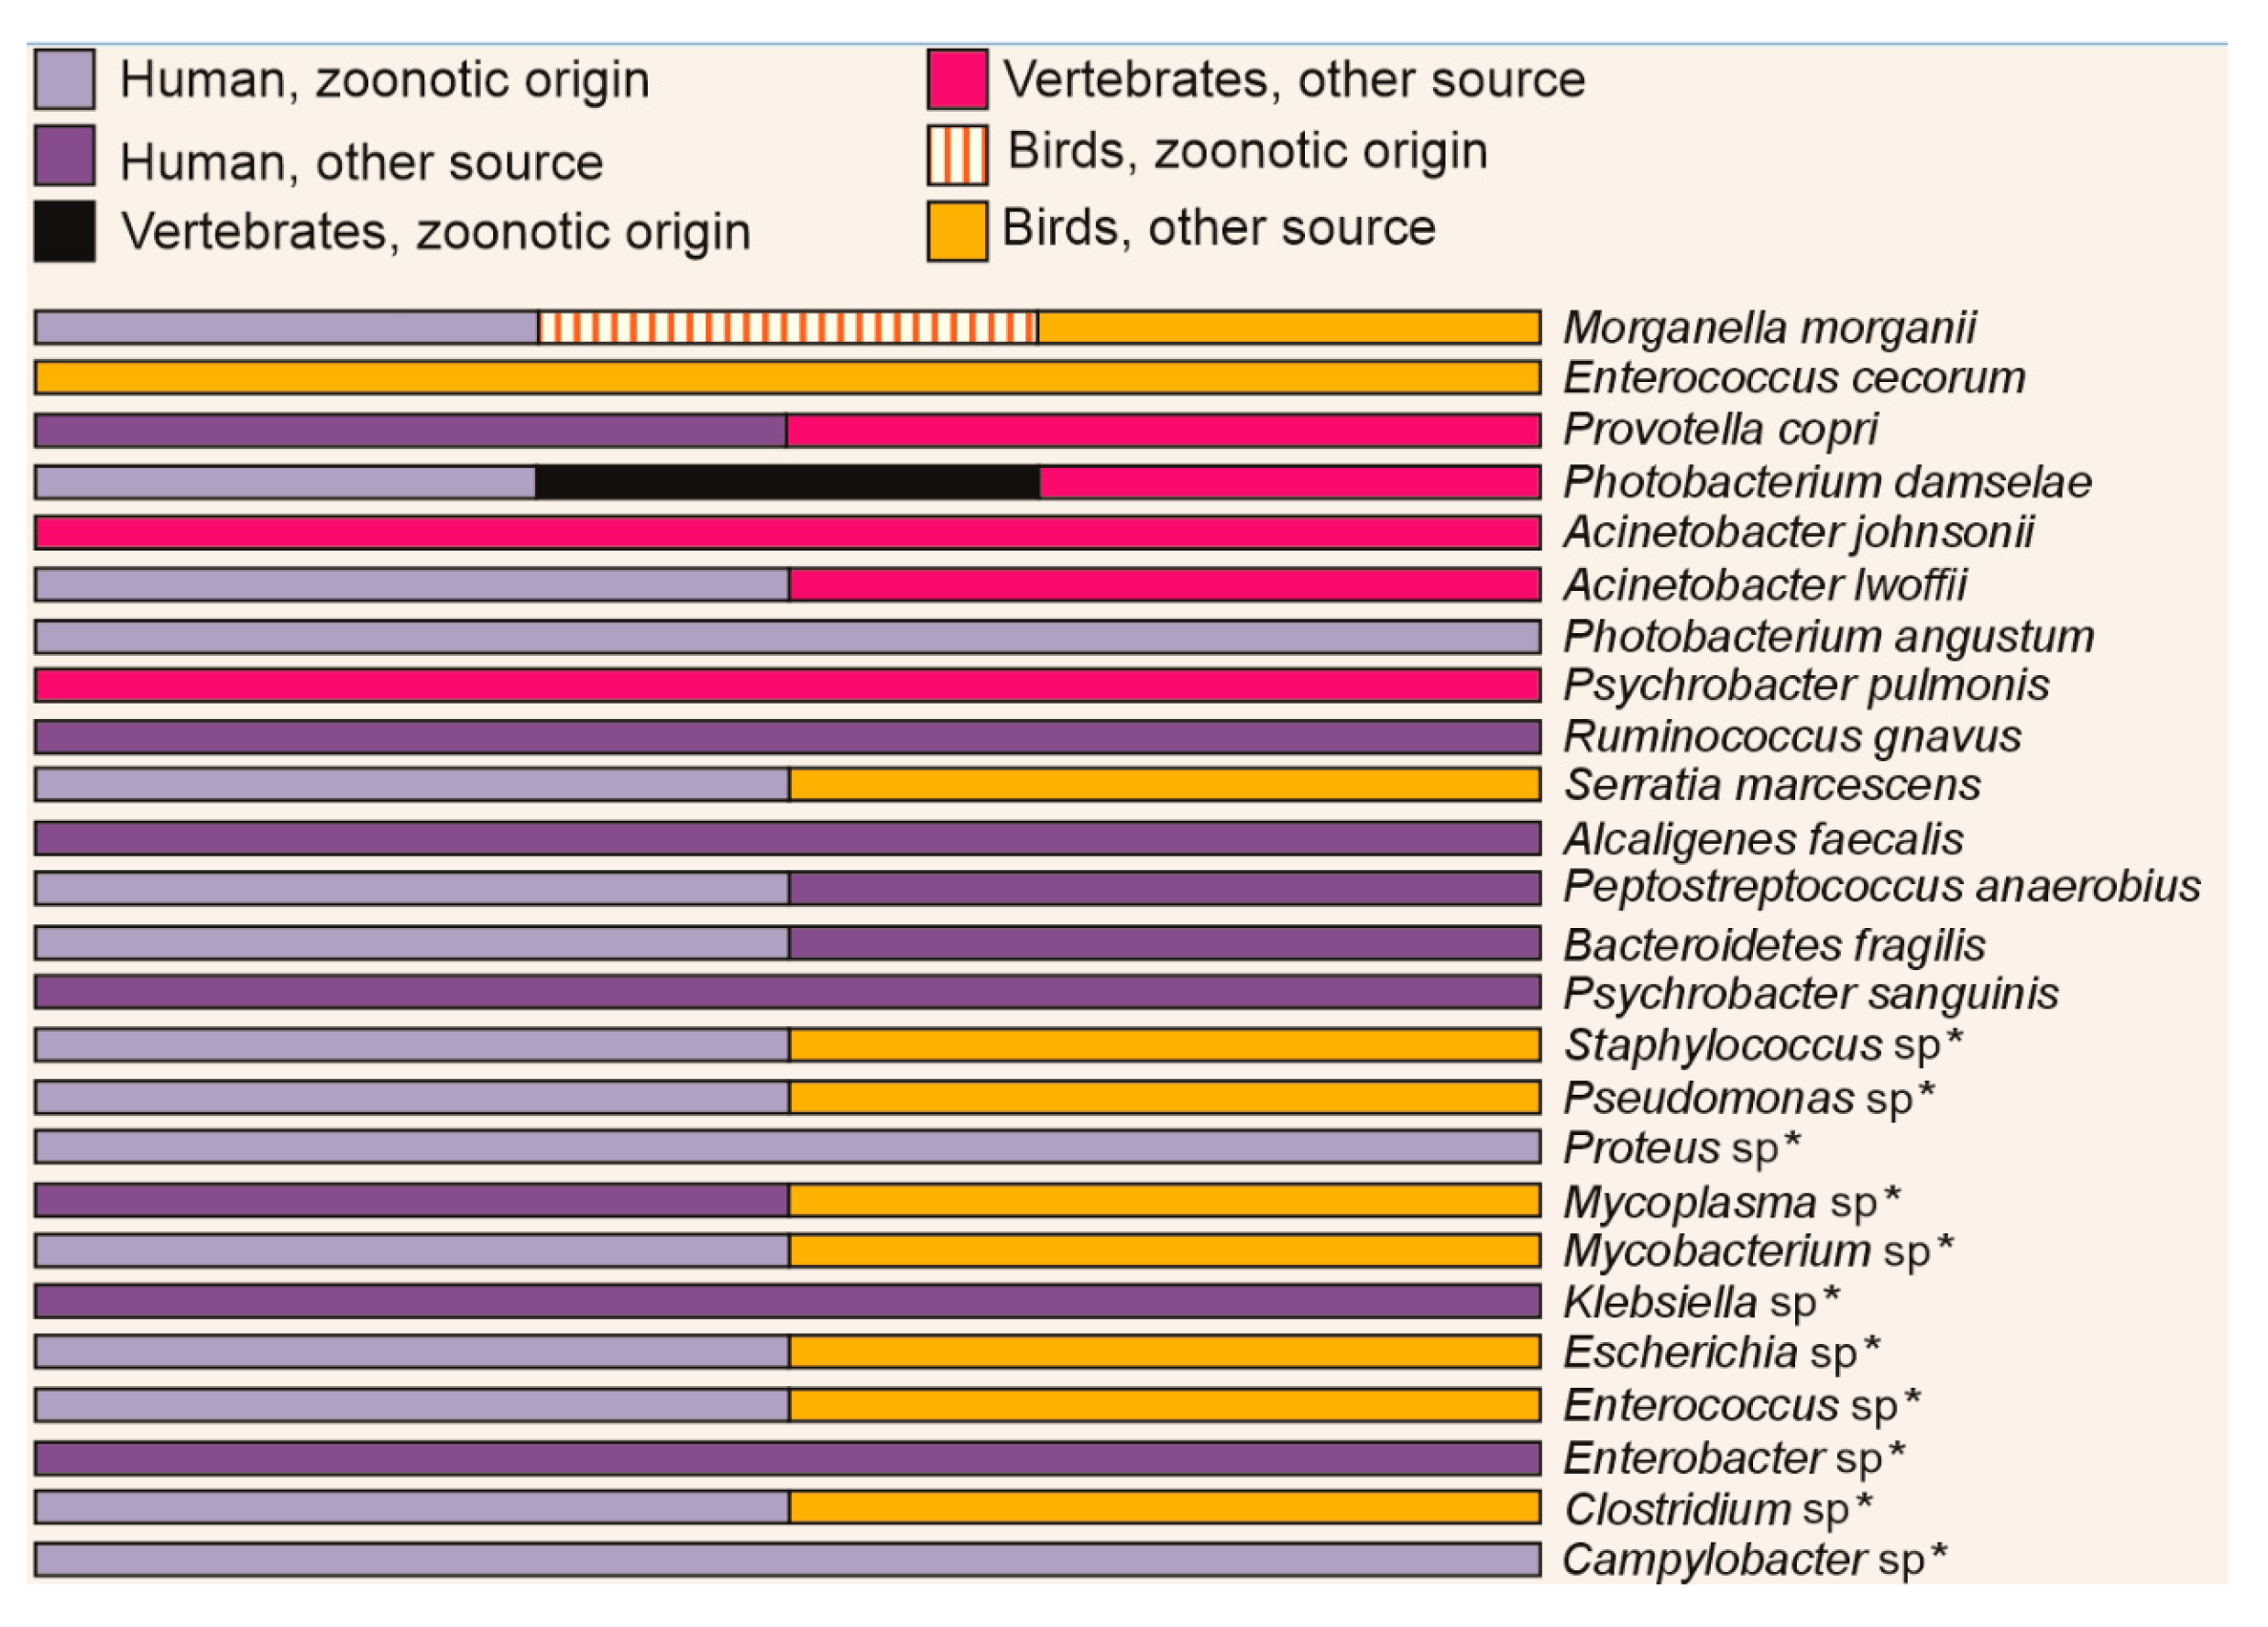
Core bacteriome was determined in at least 50% of the HG individuals and consisted of 40 species, the highest relative abundance was for C. somerae, E. coli, Alcaligenes faecalis, B. uniformis and P. angustum (Figure 5). Inside core bacteriome we search for pathogens for different animals previously described in the literature. We search for six different types of pathogens: (1) human pathogens of zoonotic origin, (2) human pathogens from other source, (3) vertebrate pathogens of zoonotic origin, (4) vertebrate pathogens from other source, (5) poultry and/or wild bird pathogens of zoonotic origin, and (6) poultry and/or wild bird pathogens from other source.
Regarding human pathogens from other source, the following genera were found Staphylococcus sp., Pseudomonas sp., Proteus sp., Mycoplasma sp., Mycobacterium sp., Klebsiella sp., Escherichia sp., Enterococcus sp., Enterobacter sp., Clostridium sp., and Campylobacter sp. Other relevant species were Bacteroides fragilis (pathogen that affects humans and can be of zoonotic origin), Peptostreptococcus anaerobius (pathogen that affects humans and can be of zoonotic origin), Alcaligenes faecalis (pathogen for humans), Serratia marcescens (pathogen which affects humans and can be of zoonotic origin, as well as a pathogen of poultry and/or wild birds), Psychrobacter pulmonis (pathogen of other vertebrates), Ruminococcus gnavus (human pathogen), P. sanguinis (human pathogen), P. angustum (human pathogen and can be of zoonotic origin), Acinetobacter lwoffii (human and other vertebrates pathogen), Acinetobacter johnsonii (pathogen of other vertebrates), Photobacterium damselae (for humans and other vertebrates pathogen from other sources and of zoonotic origin), Prevotella copri (humans and other vertebrates pathogen), Enterococcus cecorum (pathogen of poultry and/or wild birds from other source) and Morganella morganii (human pathogens of zoonotic origin, pathogen for poultry and/or wild birds of zoonotic origin or other source) (Figure 6).

3.6. Correlations between Members of HG Gut Bacteriome

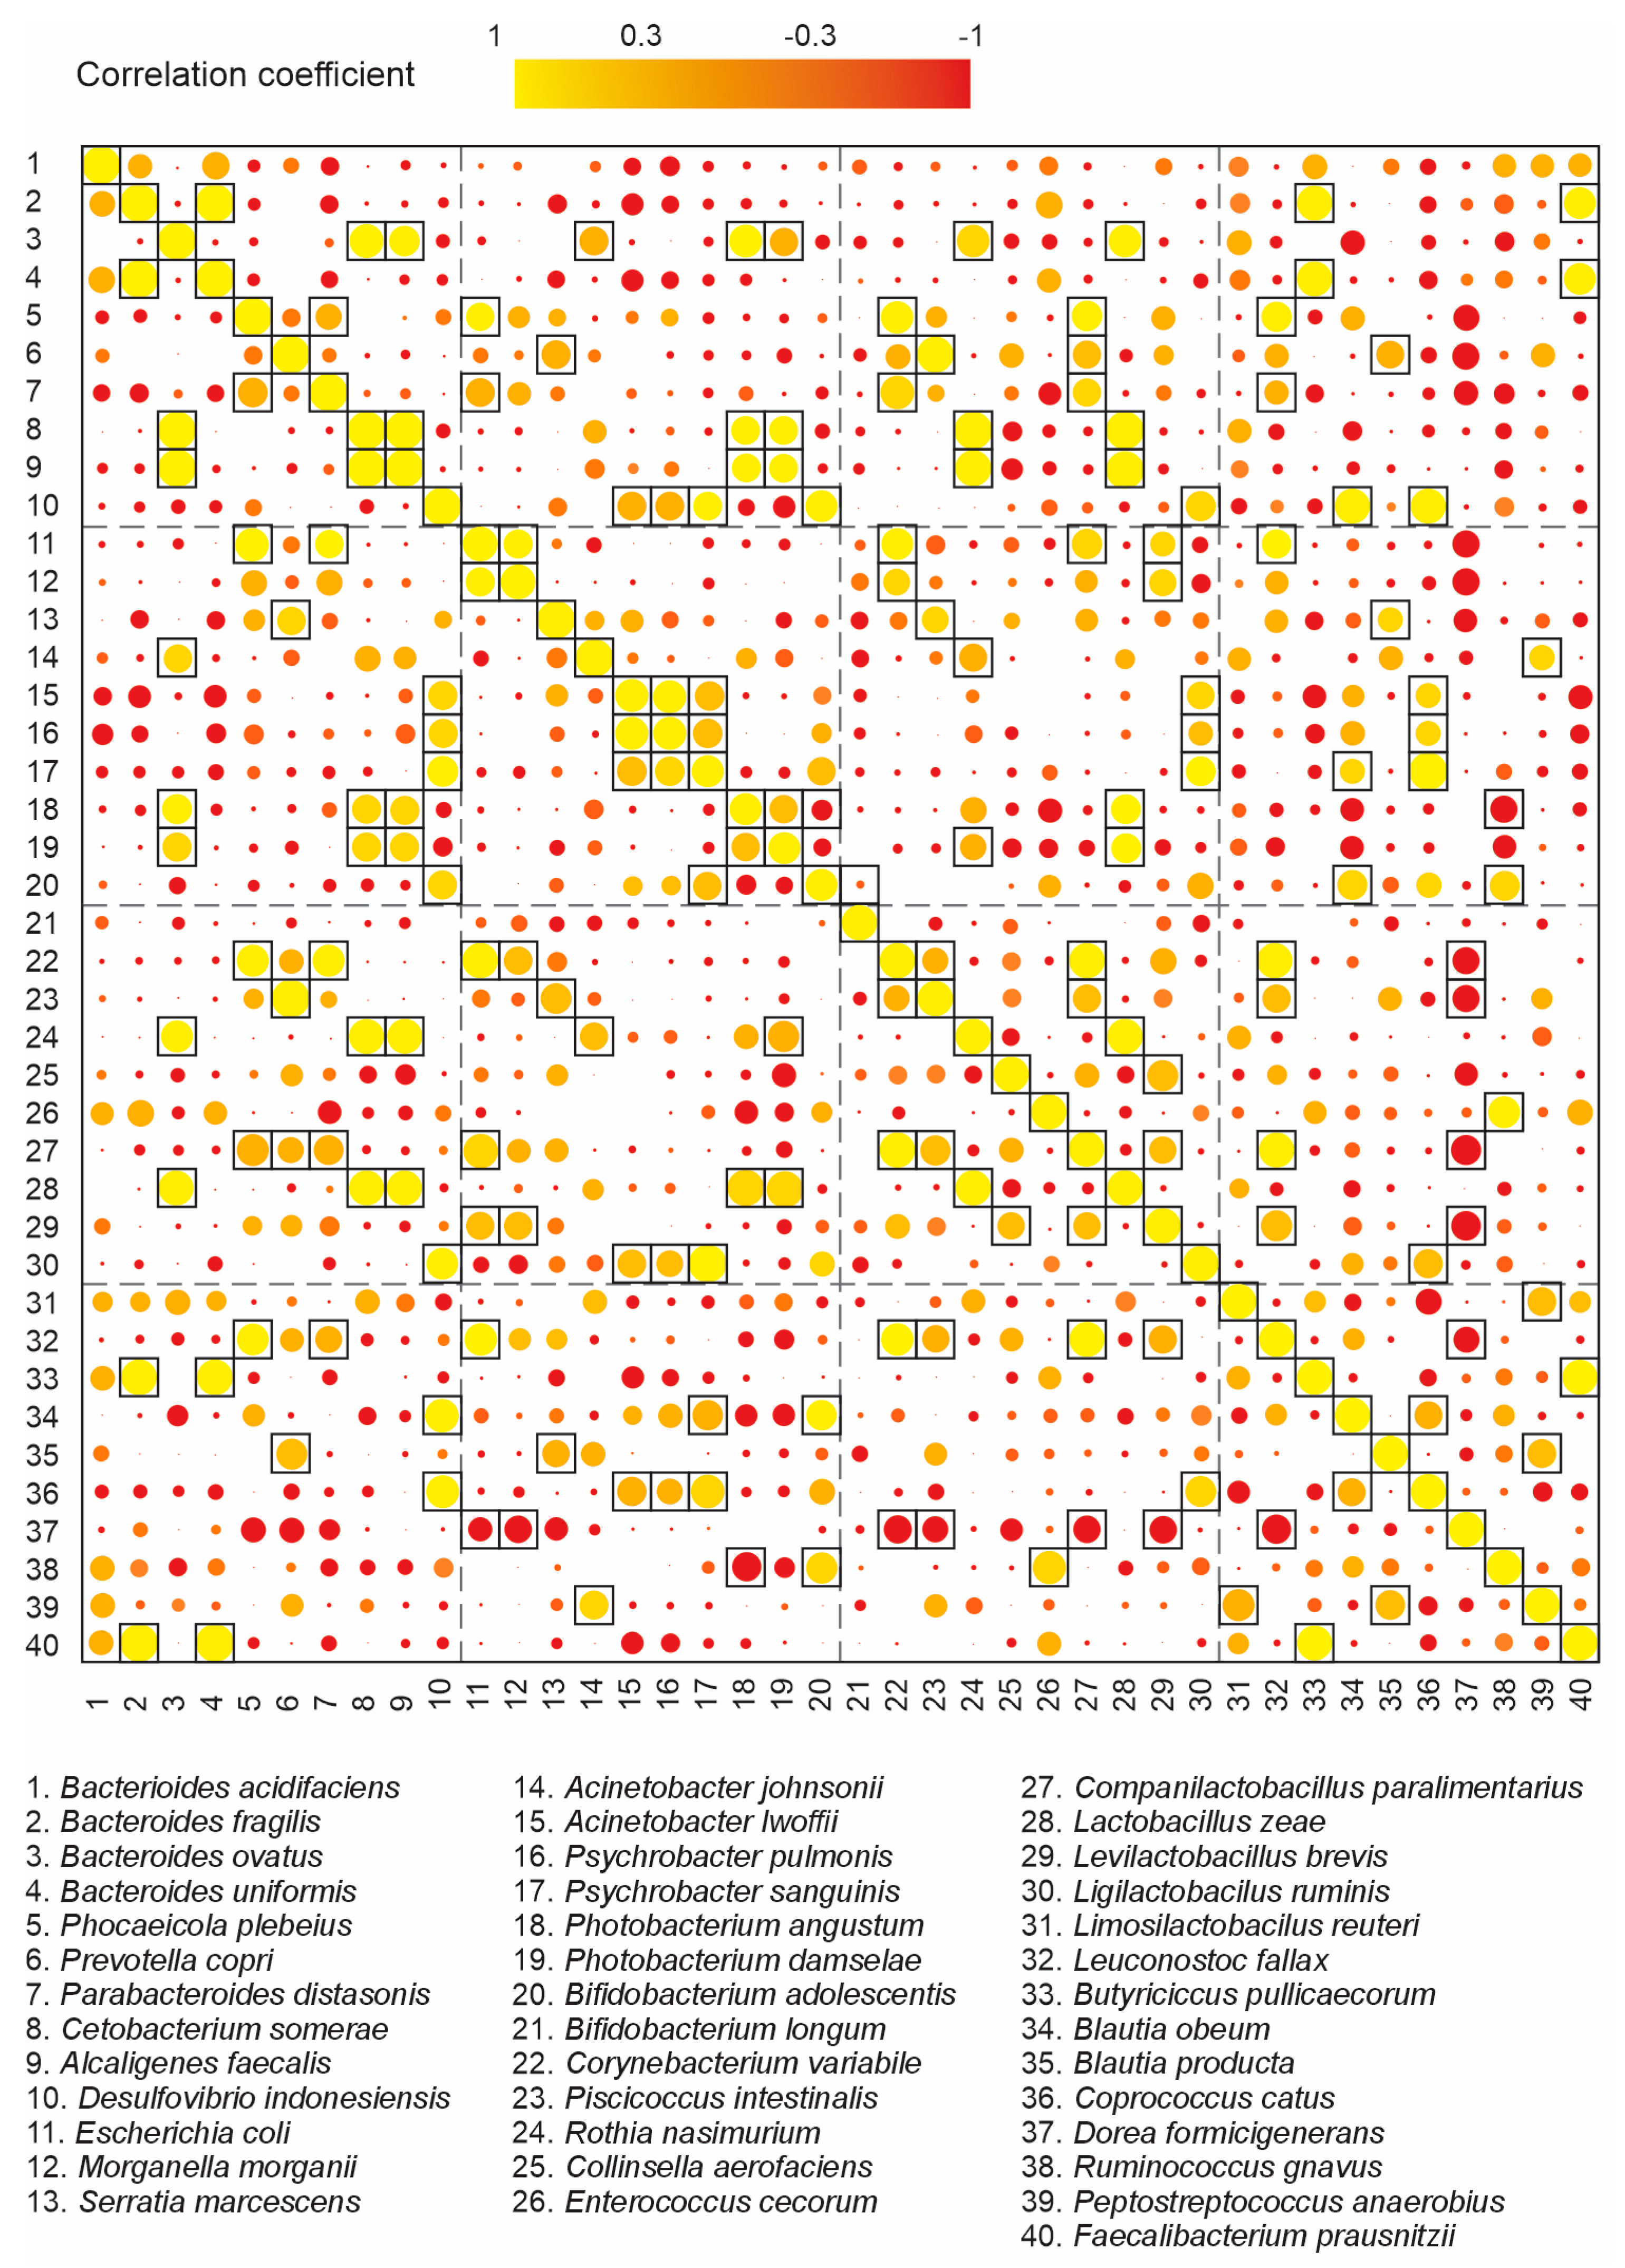
A Spearman correlation analysis was performed to determine if there is a correlation between core bacteriome species (Figure 7), whether positive or negative. In this work, we focus on species of interest as pathogens of humans, other vertebrates, or birds, as well as species with probiotic function. A significant positive or negative correlation (ρ ≈ +1, p < 0.05) was found for some species (Table 5).

4. Discussion

4.1. HG Gut Bacteriome Diversity

Richness analyses show that the average number of species observed in the gut bacteriome of HG (898) is lower than the average number of species reported for the western gull (Larus occidentalis) (1722) [48]. However, the number of species observed in HG is more akin to that observed in chicken (Gallus gallus domesticus) (915) and turkey (Meleagris gallopavo) (464) [9]. Regarding Chao1 richness estimator, the HG gut bacteriome presented an average value of 1249.7, higher compared to chicken (904), turkey (984), and barn swallow (Hirundo rustica) (179–967.5) [9,49,50]. Based on non-parametric ACE estimator, the HG gut bacteriome had a lower average value compared to western gull (1267.78 and 2479, respectively) [48]; but slightly higher than in chicken (968) and turkey (1136) [9]. Because ACE is also a non-parametric estimator that also reflects the high presence of low-abundant species, it is confirmed that the HG gut bacteriome mostly consists of rare or low-abundant species.
Regarding alpha diversity, the Simpson index of the HG gut bacteriome average was 0.86, lower than Galliformes like chicken (1.7) and turkey (3.8) [51]. A previous study indicates that gut diversity in vertebrates is driven by body mass and gut volume. Our results are consistent due to HG weight at approximately 0.5 kg, chicken at 1.5 kg and turkey at 8 kg [51]. Nonetheless, the Shannon index estimator showed that the HG gut bacteriome was 4.98 on average, a very similar value to that reported for the western gull, which is of 5.02 [48]. Therefore, the Shannon index contrast with the Simpson index, as such results do not indicate a direct relationship with body mass [52].

4.2. HG Gut Bacteriome Diversity Unassociate with Sex

On beta diversity, PCoA did not show groups differences in HG gut bacteriome diversity associate with sex. Weighted and unweighted UniFrac analyzes confirmed that the HG gut bacteriome is symmetrical and homogeneous between males and females. Homogeneous bacteriome between HG sexes could be associated with breeding season. During breading, HG females and males share the nest and food resources. Also, both members raise chicks, which strengthens contact between individuals that may homogenizes bacterial communities in both sexes. Similar results have been observed in wild populations of the herring gull [14]. In other monogamous birds, such as HG, a homogenize community has also been observed between males and females in couples [49,50]. In black-legged kittiwake (Rissa tridactyla), the exchange of bacteria occurs during copulation, which promotes homogenization of the bacteriome between sexes [2].

4.3. Funtional Roles of the HG Gut Bacteriome Based on Metabolic Recostruction of Dominant Species

Dominant phyla in the HG gut bacteriome were Firmicutes (29.17%), Proteobacteria (29.17%), Bacteroidetes (8.76%), and Actinobacteria (1.36%), but Cyanobacteria (29.42%) and Fusobacteria (4.02%) are dominant just in HG. Comparing with herring gull we observed that both species present similar dominant phyla [16]. In turkey, a Galliformes, Firmicutes are predominant (70%), Proteobacteria (9.3%), and Bacteroidetes (12.3%), while chicken also dominant phyla is Firmicutes (60%) and Bacteroidetes (28%) [9]. In Passeriformes (nine species), Firmicutes (49.2%) also are in high relative abundance, following Proteobacteria (25.6%), and Actinobacteria (12.7%) [53]. Despite Firmicutes being predominant in HG, they have a lower relative abundance than Galliformes and Passeriformes. Likewise, the HG gut bacteriome has a greater diversity compared to Galliformes and Passeriformes. Bacterial diversity in HG gut may be associated with a broad diet, from terrestrial and marine sources (pelagic fish, insects, crustaceans, mollusks, eggs of other birds, carrion, and fishing offal) unlike Galliformes (poultry with a controlled diet) and the Passeriformes (insects, fruit, and nectar).
It is noteworthy that the HG gut bacteriome includes a large proportion of Cyanobacteria (29.42%). Unlike in the other bird orders, this phylum was not previously reported as abundant. For example, it was only reported in herring gull from the west coast of USA, with very low abundance [16]. The high relative abundance of Cyanobacteria in HG may be the result of the trophic chain in the GoC. Particularly, Synechococcus sp. is part of plankton that maintains primary production in the GoC [20,54]. Cianobacteria can be consumed by fishes part of the HG diet like monterrey sardine, anchovy, and mackerel [55]. It is possible that Cyanobacteria are allochthonous members of HG gut, acquired through the food chain. Bacteroidetes is also another phylum associated with the diet of HG. It has been reported that, in human gut, Bacteroidetes degrade difficult digestion metabolites [56]. Our results indicated that the high abundance of Cyanobacteria corresponds to a high relative abundance of energy metabolism (photosynthesis) in metabolic predictions. Also, in HG we identified Bacteroidetes Phocaeicola plebeius and Bacteroides ovatus, which degrade porphyrins from red algae and hemicellulose from plants cell wall, respectively [57,58]. High presence of red algae in the GoC has been report, and the accumulation of red algae in fishes, could be related to the presence of P. plebeius and B. ovatus for degradation of porphyrins [59]. According to these results metabolic predictions also indicate a high relative abundance of carbohydrates metabolisms (porphyrins) in most individuals.
On the other hand, Firmicutes was another phylum abundant in HG gut. Particularly, F. prausnitzii has been used as a bioindicator of health in humans, as its abundance decreases during inflammatory processes of gut and colorectal cancer, and acts as glucose fermentative bacteria to produce butyrate [60]. The presence of F. prausnitzii corresponds with results of metabolic predictions where butyrate metabolism was observed. Also, Blautia obeum and Butyrococcus pullicaecorum was found, which have been reported to have high antimicrobial activity against intestinal pathogens and potential probiotic use [61,62]. Other relevant Firmicutes found was Ligilactobacillus ruminis, Limosilactobacillus reuteri and Levilactobacillus brevis which have been reported to be antagonistic pathogen inhibitors and immunoregulators in other animals [63,64,65].

4.4. Search for Pathogens in Different Animals

Related to the search for pathogens for wild and/or farmed birds, the most abundant genera were Enterococcus, Escherichia, Mycobacterium, Mycoplasma, Pseudomonas, and Staphylococcus, many of which have been previously reported in birds and in HG [17]. These pathogens can cause infections in the intestine, respiratory system, and reproductive system, also affect the eggs, and even can promote the development of botulism, arthritis, or osteomyelitis [66,67,68]. In this sense, E. coli was one of the most abundant species in the community; however, no enterotoxigenic or infectious varieties were found, as previously reported for HG [17]. Likewise, E. cecorum was found. It causes enterococcal spondylitis; however, no specific pathogenic varieties were found [69]. Conversely, two no reported pathogens for HG were identified, M. morganii, which has been isolated in necropsies of poultry with symptoms of avian typhoid, and S. marcescens, which is considered the causal agent of intestinal hyperemia in swallow-tailed hummingbird [69].
Related to potential zoonotic pathogens, results showed the presence of Clostridium, Escherichia, Proteus, Campylobacter, and Pseudomonas, as well as the species P. angustum and P. damselae. All of them have reports of being transmitted to humans mainly through animal-origin products [70,71,72,73]. Moreover, other species identified in this study are potential zoonotic pathogens, although they have not been fully demonstrated yet. For example, species of genus Enterococcus normally inhabit the intestines of humans and animals and have also been associated with bacterial infections that can be acquired in different ways, such as contact with pets, the environment, farmed animals and contaminated meat [74]. On the other hand, Mycobacterium bovis was also observed, it is considered responsible for zoonosis associated with contact with animals and products of animal [74]. Additionally, Bacteroidetes fragilis has been found in lesions caused by horse or pig bites in humans [75]. Peptostreptococcus anaerobius has been isolated in lesions caused by pet bites [76]. Serratia marcescens is transmitted by the bite of green iguana (Iguana iguana) [77]. A. lwoffii is transmitted by the bite of marsupials such as the Virginia opossum (Didelphis virginiana) [78]. Morganella morganii is transmitted by the bite of snakes of the genus Bothrops [79]. On the other hand, some genera associate with human pathogens were identified to as R. gnavus that is associated with diseases of the digestive system such as regional enteritis [80]. And P. sanguinis, which has been isolated from skin infections in fishermen [81].
Pathogens of other vertebrates were also found in HG gut. Such P. pulmonis, related to pulmonary congestion in sheep [82]. Also, the psychotropic histamine-producing species P. angustum, native to fish gut and which can affect people who consume raw fish [70]. A. lwoffii and A. johnsonii, considered opportunistic pathogens of fish [83]. Likewise, P. damselae, which causes ulcers on the skin of fishermen and the skin of temperate water fish [84], and Prevotella copri, which is associated with to the development of rheumatoid arthritis in humans and mice [85].

4.5. Correlations bewteen Dominant Members of HG Gut Bacteriome

Correlations between members of the HG gut bacteriome were predominant between Firmicutes and Proteobacteria, mostly negatives. Relevant negative correlation occurred between probiotic B. obeum and pathogen P. damselae. It has been reported that the B. obeum has antimicrobial activity against C. perfringens and Escherichia spp. [86]. Most relevant followed by Firmicutes and Bacteroidetes. Positive correlations were between probiotic B. pullicaecorum with probiotic Francisella prausnitzii and pathogen B. fragilis [60,61]. This could suggest a synergistic activity between these two species to cope with pathogen infections. F. prausnitzii and B. pullicaecorum produce metabolites that inhibit gut inflammation and growth of bacteria pathogens [60,61].
Finally, the evidence indicates that many pathogens or potential zoonotic pathogens are abundant in HG gut bacteriome, which could be considered a risk to public health due HG is a bird closely related to humans [87]. The transmission of pathogens from wild to farm animals and humans is promoted by the increasingly common contact between all of these. Therefore, the invasion of environments by humans, urbanization, as well as a high anthropogenic impact on some coastal ecosystems, could increase the risk of zoonotic diseases. Thus, it remains to be studied to what extent HG or other groups of seabirds are or could constitute a transmission vector, as has been seen to occur with other migratory birds [88].

5. Conclusions

During the breeding season, the gut bacteriome of HG is symmetrical and homogeneous between males and females. Firmicutes were found to be the dominant phylum in HG, although they are less abundant than in Galliformes and Passeriformes. Cyanobacteria were identified as abundant allochthonous members. Additionally, members of the Firmicutes and Bacteroidetes phyla showed potential probiotic functions. However, the presence of pathogens such as Enterococcus, Escherichia, Mycobacterium, Mycoplasma, Pseudomonas, and Staphylococcus poses a potential health risk for HG during the breeding season, when adults and chicks are in close contact. Some pathogens were identified at the species level, including M. morganii, E. cecorum, S. marcescens, and E. coli. Concerning the potential for zoonotic diseases, results showed the presence of important pathogenic genera not previously described in the genus Larus, which could pose a risk to public health due to the growing interaction between HG and humans. High human impact in protected natural areas in the GoC could increase the emergence of zoonotic diseases.

Supplementary Materials

The following supporting information can be downloaded at: https://www.mdpi.com/article/10.3390/d16100617/s1, Table S1: Concentration and volume of each reagent used to amplify the Chromo-Helicase-DNA binding region (CHD) gene; Table S2: Touchdown PCR conditions used to amplify the Chromo-Helicase-DNA binding region (CHD) gene; Table S3: Concentration and volume of each reagent used to amplify the 16S rRNA gene; Table S4: PCR conditions used to amplify the16S rRNA gene.

Author Contributions

Conceptualization, E.A.R. and Z.G.-L.; methodology, E.A.R., Z.G.-L., J.J.F.-M., V.S.-C., O.A., A.C.-R., M.G.A.-A. and J.A.H.-G.; software, E.A.R., Z.G.-L., J.A.H.-G. and O.A.; validation, E.A.R., Z.G.-L., A.C.-R., M.G.A.-A. and J.A.H.-G.; formal analysis, E.A.R., Z.G.-L., A.C.-R., M.G.A.-A., J.A.H.-G. and O.A.; investigation, E.A.R., Z.G.-L., A.C.-R., M.G.A.-A., J.A.H.-G. and O.A.; resources, E.A.R., Z.G.-L., A.C.-R., M.G.A.-A., J.J.F.-M. and V.S.-C.; data curation, Z.G.-L., A.C.-R., M.G.A.-A., J.A.H.-G. and O.A.; writing—original draft preparation, E.A.R., Z.G.-L. and O.A.; writing—review and editing, E.A.R., Z.G.-L., A.C.-R., M.G.A.-A., J.A.H.-G., J.J.F.-M., V.S.-C. and O.A.; visualization, Z.G.-L., J.A.H.-G. and O.A.; supervision, E.A.R. and Z.G.-L.; project administration, E.A.R. and Z.G.-L.; funding acquisition, E.A.R. and Z.G.-L. All authors have read and agreed to the published version of the manuscript.

Funding

This research was funded by Instituto Politécnico Nacional (IPN), projects SIP-20171835, SIP-20181044, and SIP-20195761 granted to E.A.R., and SIP-20210369 to Z.G.-L. It was also partially funded by The Next Generation Sonoran Desert Researchers in Collaborative Investigation Grant in 2019.

Institutional Review Board Statement

This study complies with Mexican regulations regarding the ethical treatment of research subjects. The Dirección General de Vida Silvestre, Subsecretaría de Gestión para la Protección Ambiental, Secretaría de Medio Ambiente y Recursos Naturales, granted the corresponding research and sample collection permit (SGPA/DGVS/13340/19).

Data Availability Statement

The data presented in this study are available in Supplementary Materials. Additionally, can be found at the GenBank (https://www.ncbi.nlm.nih.gov/ accessed on 16 July 2024), or requested from the corresponding authors.

Acknowledgments

We thank the personnel of the Prescott College Kino Bay Center (Lorayne Meltzer) for their logistic support and transportation to Isla Cardonosa. We also thank Santiago Romero, Alejandra Cano, Alma Reyna Osorio, and Daniel Mancilla for their help and assistance in the field work. We appreciate the comments and suggestions of reviewers.

Conflicts of Interest

The authors declare no conflicts of interest.

References

  1. Berg, G.; Rybakova, D.; Fischer, D.; Cernava, T.; Vergès, M.-C.C.; Charles, T.; Chen, X.; Cocolin, L.; Eversole, K.; Corral, G.H.; et al. Microbiome definition re-visited: Old concepts and new challenges. Microbiome 2020, 8, 103. [Google Scholar] [CrossRef]
  2. White, J.; Mirleau, P.; Danchin, E.; Mulard, H.; Hatch, S.A.; Heeb, P.; Wagner, R.H. Sexually transmitted bacteria affect female cloacal assemblages in a wild bird. Ecol. Lett. 2010, 13, 1515–1524. [Google Scholar] [CrossRef] [PubMed]
  3. Knell, R.J. Sexually transmitted disease and parasite-mediated sexual selection. Evolution 1999, 53, 957–961. [Google Scholar] [CrossRef]
  4. Pedroso, A.; Maurer, J.; Cheng, Y.; Lee, M. Remodeling the intestinal ecosystem toward better performance and intestinal health. J. Appl. Poult. Res. 2012, 21, 432–443. [Google Scholar] [CrossRef]
  5. Pan, D.; Yu, Z. Intestinal microbiome of poultry and its interaction with host and diet. Gut Microbes 2014, 5, 108–119. [Google Scholar] [CrossRef]
  6. Escallón, C.; Belden, L.K.; Moore, I.T. The Cloacal Microbiome Changes with the Breeding Season in a Wild Bird. Integr. Org. Biol. 2019, 1, oby009. [Google Scholar] [CrossRef] [PubMed]
  7. Noguera, J.C.; Aira, M.; Pérez-Losada, M.; Domínguez, J.; Velando, A. Glucocorticoids modulate gastrointestinal microbiome in a wild bird. R. Soc. Open Sci. 2018, 5, 171743. [Google Scholar] [CrossRef]
  8. Oakley, B.B.; Lillehoj, H.S.; Kogut, M.H.; Kim, W.K.; Maurer, J.J.; Pedroso, A.; Lee, M.D.; Collett, S.R.; Johnson, T.J.; Cox, N.A. The chicken gastrointestinal microbiome. FEMS Microbiol. Lett. 2014, 360, 100–112. [Google Scholar] [CrossRef]
  9. Wei, S.; Morrison, M.; Yu, Z. Bacterial census of poultry intestinal microbiome. Poult. Sci. 2013, 92, 671–683. [Google Scholar] [CrossRef]
  10. Benskin, C.M.; Wilson, K.; Jones, K.; Hartley, I.R. Bacterial pathogens in wild birds: A review of the frequency and effects of infection. Biol. Rev. Camb. Philos. Soc. 2009, 84, 349–373. [Google Scholar] [CrossRef]
  11. Poiani, A. Do Cloacal Pathogenic Microbes Behave as Sexually Transmitted Parasites in Birds? Open Ornithol. J. 2010, 3, 72–85. [Google Scholar] [CrossRef]
  12. Loehle, C. Social Barriers to Pathogen Transmission in Wild Animal Populations. Ecology 1995, 76, 326–335. [Google Scholar] [CrossRef]
  13. Thrall, P.H.; Antonovics, J.; Bever, J.D. Sexual transmission of disease and host mating systems: Within-season reproductive success. Am. Nat. 1997, 149, 485–506. [Google Scholar] [CrossRef]
  14. Monaghan, P.; Shedden, C.B.; Ensor, K.; Fricker, C.R.; Girdwood, R.W.A. Salmonella Carriage by Herring-Gulls in the Clyde Area of Scotland in Relation to Their Feeding Ecology. J. Appl. Ecol. 1985, 22, 669–680. [Google Scholar] [CrossRef]
  15. Fuirst, M.; Veit, R.R.; Hahn, M.; Dheilly, N.; Thorne, L.H. Effects of urbanization on the foraging ecology and microbiota of the generalist seabird Larus argentatus. PloS ONE 2018, 13, e0209200. [Google Scholar] [CrossRef]
  16. Lu, J.; Santo Domingo, J.W.; Lamendella, R.; Edge, T.; Hill, S. Phylogenetic diversity and molecular detection of bacteria in gull feces. Appl. Environ. Microbiol. 2008, 74, 3969–3976. [Google Scholar] [CrossRef]
  17. Contreras-Rodríguez, A.; Aguilera-Arreola, M.G.; Osorio, A.R.; Martin, M.D.; Guzmán, R.L.; Velarde, E.; Ruiz, E.A. Detection of Potential Human Pathogenic Bacteria Isolated From Feces of Two Colonial Seabirds Nesting on Isla Rasa, Gulf of California: Heermann’s Gull (Larus heermanni) and Elegant Tern (Thalasseus elegans). Trop. Conserv. Sci. 2019, 12, 1–8. [Google Scholar] [CrossRef]
  18. Swayne, D.E. Diseases of Poultry, 14th ed.; Wiley-Blackwell: Hoboken, NJ, USA, 2020; p. 1451. [Google Scholar]
  19. Velarde, E. Breeding biology of Heermann’s Gulls on Isla Rasa, Gulf of California, Mexico. Auk 1999, 116, 513–519. [Google Scholar] [CrossRef]
  20. Alvarez-Borrego, S. Physical Oceanography. In A New Island Biography of the Sea of Cortes; Chase, T.J., Cody, M.L., Ezcurra, E., Eds.; Oxford University Press: Oxford, UK, 2002; pp. 41–59. [Google Scholar]
  21. Bird International. Larus heermanni. The IUCN Red List of Threatened Species 2020. Available online: https://www.iucnredlist.org/species/22694296/178958787 (accessed on 14 November 2023).
  22. Mancilla-Morales, M.D.; Velarde, E.; Aguilar, A.; Contreras-Rodriguez, A.; Ezcurra, E.; Rosas-Rodriguez, J.A.; Sonanez-Organis, J.G.; Ruiz, E.A. Strong Philopatry, Isolation by Distance, and Local Habitat Have Promoted Genetic Structure in Heermann’s Gull. Diversity 2022, 14, 108. [Google Scholar] [CrossRef]
  23. Longmire, L.J.; Maltbie, M.; Baker, J.R. Use of "Lysis buffer" in DNA isolation and Its implication for museum collections. Mus. Tex. Tech Univ. 1997, 163, 1–3. [Google Scholar]
  24. Fridolfsson, A.K.; Ellegren, H. A simple and universal method for molecular sexing of non-ratit birds. J. Avian Biol. 1999, 30, 116–121. [Google Scholar] [CrossRef]
  25. Herlemann, D.P.; Labrenz, M.; Jürgens, K.; Bertilsson, S.; Waniek, J.J.; Andersson, A.F. Transitions in bacterial communities along the 2000 km salinity gradient of the Baltic Sea. ISME J. 2011, 5, 1571–1579. [Google Scholar] [CrossRef] [PubMed]
  26. Douglas, G.M.; Comeau, A.M.; Langille, M.G.I. Processing a 16S rRNA Sequencing Dataset with the Microbiome Helper Workflow. In Microbiome Analysis: Methods in Molecular Biology; Beiko, R., Hsiao, W., Parkinson, J., Eds.; Humana Press: New York, NY, USA, 2018; Volume 1849, pp. 131–141. [Google Scholar] [CrossRef]
  27. Leggett, R.M.; Ramirez-Gonzalez, R.H.; Clavijo, B.J.; Waite, D.; Davey, R.P. Sequencing quality assessment tools to enable data-driven informatics for high throughput genomics. Front. Genet. 2013, 4, 288. [Google Scholar] [CrossRef] [PubMed]
  28. Rincón-Molina, C.I.; Hernández-García, J.A.; Rincón-Rosales, R.; Gutiérrez-Miceli, F.A.; Ramírez-Villanueva, D.A.; González-Terreros, E.; Peña-Ocaña, B.A.; Palomeque-Domínguez, H.; Dendooven, L.; Ruíz-Valdiviezo, V.M. Structure and Diversity of the Bacterial Communities in the Acid and Thermophilic Crater-Lake of the Volcano “El Chichón”, Mexico. Geomicrobiol. J. 2019, 36, 97–109. [Google Scholar] [CrossRef]
  29. Caporaso, J.G.; Kuczynski, J.; Stombaugh, J.; Bittinger, K.; Bushman, F.D.; Costello, E.K.; Fierer, N.; Pena, A.G.; Goodrich, J.K.; Gordon, J.I.; et al. QIIME allows analysis of high-throughput community sequencing data. Nat. Methods 2010, 7, 335–336. [Google Scholar] [CrossRef]
  30. Edgar, R.C. Search and clustering orders of magnitude faster than BLAST. Bioinformatics 2010, 26, 2460–2461. [Google Scholar] [CrossRef]
  31. Haas, B.J.; Gevers, D.; Earl, A.M.; Feldgarden, M.; Ward, D.V.; Giannoukos, G.; Ciulla, D.; Tabbaa, D.; Highlander, S.K.; Sodergren, E.; et al. Chimeric 16S rRNA sequence formation and detection in Sanger and 454-pyrosequenced PCR amplicons. Genome Res. 2011, 21, 494–504. [Google Scholar] [CrossRef]
  32. Caporaso, J.G.; Bittinger, K.; Bushman, F.D.; DeSantis, T.Z.; Andersen, G.L.; Knight, R. PyNAST: A flexible tool for aligning sequences to a template alignment. Bioinformatics 2010, 26, 266–267. [Google Scholar] [CrossRef]
  33. McDonald, D.; Price, M.N.; Goodrich, J.; Nawrocki, E.P.; DeSantis, T.Z.; Probst, A.; Andersen, G.L.; Knight, R.; Hugenholtz, P. An improved Greengenes taxonomy with explicit ranks for ecological and evolutionary analyses of bacteria and archaea. ISME J. 2012, 6, 610–618. [Google Scholar] [CrossRef]
  34. Wang, Q.; Garrity, G.M.; Tiedje, J.M.; Cole, J.R. Naive Bayesian classifier for rapid assignment of rRNA sequences into the new bacterial taxonomy. Appl. Environ. Microbiol. 2007, 73, 5261–5267. [Google Scholar] [CrossRef]
  35. Chao, A.; Lee, S.-M.; Chen, T.-C. A Generalized Good’s Nonparametric Coverage Estimator. Chin. J. Math. 1988, 16, 189–199. [Google Scholar]
  36. Huson, D.H.; Auch, A.F.; Qi, J.; Schuster, S.C. MEGAN analysis of metagenomic data. Genome Res. 2007, 17, 377–386. [Google Scholar] [CrossRef] [PubMed]
  37. Chao, A.; Lee, S.-M. Estimating the Number of Classes via Sample Coverage. J. Am. Stat. Assoc. 1992, 87, 210–217. [Google Scholar] [CrossRef]
  38. Simpson, E.H. Measurement of Diversity. Nature 1949, 163, 688. [Google Scholar] [CrossRef]
  39. Shannon, C.E.; Weaver, W. The Mathematical Theory of Communication; University of Illinois Press: Champaign, IL, USA, 1949. [Google Scholar]
  40. Faith, D.P. Conservation evaluation and phylogenetic diversity. Biol. Conserv. 1992, 61, 1–10. [Google Scholar] [CrossRef]
  41. Legendre, P.; De Cáceres, M. Beta diversity as the variance of community data: Dissimilarity coefficients and partitioning. Ecol. Lett. 2013, 16, 951–963. [Google Scholar] [CrossRef] [PubMed]
  42. Lozupone, C.; Knight, R. UniFrac: A new phylogenetic method for comparing microbial communities. Appl. Environ. Microbiol. 2005, 71, 8228–8235. [Google Scholar] [CrossRef]
  43. Lozupone, C.A.; Hamady, M.; Kelley, S.T.; Knight, R. Quantitative and qualitative beta diversity measures lead to different insights into factors that structure microbial communities. Appl Environ. Microbiol. 2007, 73, 1576–1585. [Google Scholar] [CrossRef]
  44. Hammer, Ø.; Harper, D.A.T.; Ryan, P.D. PAST: Paleontological Statistics Software Package for Education and Data Analysis; Palaeontologia Electronica: Oslo, Norway, 2001. [Google Scholar]
  45. Abdi, H. Bonferroni and Sidák Corrections for Multiple Comparisons. In Encyclopedia of Measurement and Statistics; Salkind, C.S.N., Ed.; SAGE Publications: Dallas, TX, USA, 2007; pp. 103–107. [Google Scholar]
  46. Langille, M.G.; Zaneveld, J.; Caporaso, J.G.; McDonald, D.; Knights, D.; Reyes, J.A.; Clemente, J.C.; Burkepile, D.E.; Vega Thurber, R.L.; Knight, R.; et al. Predictive functional profiling of microbial communities using 16S rRNA marker gene sequences. Nat. Biotechnol. 2013, 31, 814–821. [Google Scholar] [CrossRef]
  47. Kanehisa, M.; Goto, S.; Sato, Y.; Furumichi, M.; Tanabe, M. KEGG for integration and interpretation of large-scale molecular data sets. Nucleic Acids Res. 2012, 40, D109–D114. [Google Scholar] [CrossRef]
  48. Cockerham, S.; Lee, B.; Orben, R.A.; Suryan, R.M.; Torres, L.G.; Warzybok, P.; Bradley, R.; Jahncke, J.; Young, H.S.; Ouverney, C.; et al. Microbial Ecology of the Western Gull (Larus occidentalis). Microb. Ecol. 2019, 78, 665–676. [Google Scholar] [CrossRef] [PubMed]
  49. Kreisinger, J.; Cízková, D.; Kropácková, L.; Albrecht, T. Cloacal Microbiome Structure in a Long-Distance Migratory Bird Assessed Using Deep 16sRNA Pyrosequencing. PLoS ONE 2015, 10, e0137401. [Google Scholar] [CrossRef] [PubMed]
  50. Musitelli, F.; Ambrosini, R.; Rubolini, D.; Saino, N.; Franzetti, A.; Gandolfi, I. Cloacal microbiota of barn swallows from Northern Italy. Ethol. Ecol. Evol. 2018, 30, 362–372. [Google Scholar] [CrossRef]
  51. Godon, J.J.; Arulazhagan, P.; Steyer, J.P.; Hamelin, J. Vertebrate bacterial gut diversity: Size also matters. BMC Ecol. 2016, 16, 12. [Google Scholar] [CrossRef] [PubMed]
  52. Reese, A.T.; Dunn, R.R. Drivers of Microbiome Biodiversity: A Review of General Rules, Feces, and Ignorance. Mbio 2018, 9, 10–1128. [Google Scholar] [CrossRef]
  53. Bodawatta, K.H.; Sam, K.; Jonsson, K.A.; Poulsen, M. Comparative Analyses of the Digestive Tract Microbiota of New Guinean Passerine Birds. Front. Microbiol. 2018, 9, 1830. [Google Scholar] [CrossRef]
  54. Hernández-Becerril, D.U. Biodiversity of marine planktonic algae (Cyanobacteria, Prasinophyceae, Euglenophyta, Chrysophyceae, Dictyochophyceae, Eustigmatophyceae, Parmophyceae, Raphidophyceae, Bacillariophyta, Cryptophyta, Haptophyta, Dinoflagellata) in Mexico. Rev. Mex. Biodivers. 2014, 85, 44–53. [Google Scholar] [CrossRef]
  55. Velarde, E.; Cartron, J.L.E.; Drummond, H.; Anderson, D.W.; Rebon Gallardo, F.; Palacios, E.; Rodriguez, C. Nesting seabirds of the Gulf of California’s offshore islands: Diversity, ecology and conservation. In Biodiveristy, Ecosystemes, and Conservation in Northern Mexico; Cartron, J.L.E., Ceballos, G., Felger, R.S., Eds.; Oxford University Press: New York, NY, USA, 2005; pp. 452–470. [Google Scholar]
  56. Renouf, M.; Hendrich, S. Is a Putative Bacterial Species Associated with the Degradation of the Isoflavone Genistein in Human Feces. J. Nutr. 2011, 141, 1120–1126. [Google Scholar] [CrossRef]
  57. Hehemann, J.H.; Correc, G.; Barbeyron, T.; Helbert, W.; Czjzek, M.; Michel, G. Transfer of carbohydrate-active enzymes from marine bacteria to Japanese gut microbiota. Nature 2010, 464, 908–912. [Google Scholar] [CrossRef]
  58. Martens, E.C.; Lowe, E.C.; Chiang, H.; Pudlo, N.A.; Wu, M.; McNulty, N.P.; Abbott, D.W.; Henrissat, B.; Gilbert, H.J.; Bolam, D.N.; et al. Recognition and Degradation of Plant Cell Wall Polysaccharides by Two Human Gut Symbionts. PLoS Biol. 2011, 9, e1001221. [Google Scholar] [CrossRef]
  59. Espinoza-Avalos, J. Macroalgas marinas del Golfo de California. In Biodiversidad Marina y Costera de México; Salazar-Vallejo, S., González, N., Eds.; Comisión Nacional Para el Conocimiento y Aprovechamiento de la Biodiversidad: Mexico City, Mexico, 1993; pp. 328–357. [Google Scholar]
  60. Ferreira-Halder, C.V.; Faria, A.V.D.; Andrade, S.S. Action and function of Faecalibacterium prausnitzii in health and disease. Best Pract. Res. Clin. Gastroenterol. 2017, 31, 643–648. [Google Scholar] [CrossRef] [PubMed]
  61. Eeckhaut, V.; Wang, J.; Van Parys, A.; Haesebrouck, F.; Joossens, M.; Falony, G.; Raes, J.; Ducatelle, R.; Van Immerseel, F. The Probiotic Butyricicoccus pullicaecorum Reduces Feed Conversion and Protects from Potentially Harmful Intestinal Microorganisms and Necrotic Enteritis in Broilers Front. Microbiol. 2016, 7, 1416. [Google Scholar] [CrossRef]
  62. Liu, X.; Mao, B.; Gu, J.; Wu, J.; Cui, S.; Wang, G.; Zhao, J.; Zhang, H.; Chen, W. Blautia—A new functional genus with potential probiotic properties? Gut Microbes 2021, 13, 1875796. [Google Scholar] [CrossRef]
  63. Yu, X.; Åvall-Jääskeläinen, S.; Koort, J.; Lindholm, A.; Rintahaka, J.; Von Ossowski, I.; Palva, A.; Hynönen, U. A comparative characterization of different host-sourced Lactobacillus ruminis strains and their adhesive, inhibitory, and immunomodulating functions. Front. Microbiol. 2017, 5, 657. [Google Scholar] [CrossRef]
  64. Singh, T.P.; Kaur, G.; Kapila, S.; Malik, R.K. Antagonistic activity of Lactobacillus reuteri strains on the adhesion characteristics of selected pathogens. Front. Microbiol. 2017, 8, 486. [Google Scholar] [CrossRef]
  65. Liu, H.; Ji, H.F.; Zhang, D.Y.; Wang, S.X.; Wang, J.; Shan, D.C.; Wang, Y.M. Effects of Lactobacillus brevis preparation on growth performance, fecal microflora and serum profile in weaned pigs. Livest. Sci. 2015, 178, 251–254. [Google Scholar] [CrossRef]
  66. Buckles, E.; Ruiz, J.; Korich, J.; Torres, A.; Banda, A.; Mondal, S.; Lucio-Martínez, B. Atlas of Avian Diseases. Available online: https://partnersah.vet.cornell.edu/avian-atlas/#/disease/Avian_Encephalomyelitis (accessed on 22 May 2024).
  67. Kirkwood, J.K.; Macgregor, S.K. Infectious Diseases of Garden Birds—Minimising the Risks. Available online: https://www.ufaw.org.uk/animal-welfare-publications/infectious-diseases-of-garden-birds---minimising-the-risks (accessed on 22 May 2024).
  68. Canturri, A.; Doria-Torra, G.; Casanova, I.; Martínez, J.; Domingo, M.; Majó, N. Espondilitis enterocócica Asociada a Enterococcus cecorum en Reproductores y Aves de Engorde. Available online: https://www.wpsa-aeca.es/articulo.php?id_articulo=4070 (accessed on 22 May 2024).
  69. Zhao, C.; Tang, N.; Wu, Y.; Zhang, Y.; Wu, Z.; Li, W.; Qin, X.; Zhao, J.; Zhang, G. First reported fatal Morganella morganii infections in chickens. Vet. Microbiol. 2012, 156, 452–455. [Google Scholar] [CrossRef]
  70. Saidenberg, A.B.S.; Teixeira, R.H.F.; Astolfi-Ferreira, C.S.; Knöbl, T.; Ferreira, A.J.P. Serratia marcescens infection in a swallow-tailed hummingbird. J. Wildlife Dis. 2007, 43, 107–110. [Google Scholar] [CrossRef]
  71. Bjornsdottir-Butler, K.; McCarthy, S.A.; Dunlap, P.V.; Benner, R.A. Photobacterium angustum and Photobacterium kishitanii, Psychrotrophic High-Level Histamine-Producing Bacteria Indigenous to Tuna. Appl. Environ. Microb. 2016, 82, 2167–2176. [Google Scholar] [CrossRef]
  72. Dhanashekar, R.; Akkinepalli, S.; Nellutla, A. Milk-borne infections. An analysis of their potential effect on the milk industry. Germs 2012, 2, 101–109. [Google Scholar] [CrossRef]
  73. Kim, H.R.; Kim, J.W.; Lee, M.K.; Kim, J.G. Septicemia progressing to fatal hepatic dysfunction in an cirrhotic patient after oral ingestion of Photobacterium damsela: A case report. Infection 2009, 37, 555–556. [Google Scholar] [CrossRef] [PubMed]
  74. Hammerum, A.M. Enterococci of animal origin and their significance for public health. Clin. Microbiol. Infec. 2012, 18, 619–625. [Google Scholar] [CrossRef] [PubMed]
  75. O’Reilly, L.M.; Daborn, C.J. The epidemiology of Mycobacterium bovis infections in animals and man: A review. Tuber. Lung Dis. 1995, 76, 1–46. [Google Scholar] [CrossRef] [PubMed]
  76. Brook, I. Management of human and animal bite wounds: An overview. Adv. Skin Wound Care 2005, 18, 197–203. [Google Scholar] [CrossRef] [PubMed]
  77. Asante, J.; Noreddin, A.; El Zowalaty, M.E. Systematic Review of Important Bacterial Zoonoses in Africa in the Last Decade in Light of the ‘One Health’ Concept. Pathogens 2019, 8, 50. [Google Scholar] [CrossRef]
  78. Grim, K.D.; Doherty, C.; Rosen, T. Serratia marcescens bullous cellulitis after iguana bites. J. Am. Acad. Dermatol. 2010, 62, 1075–1076. [Google Scholar] [CrossRef]
  79. Howell, J.M.; Dalsey, W.C. Aerobic-Bacteria Cultured from the Mouth of the American Opossum (Didelphis virginiana) with Reference to Bacteria Associated with Bite Infections. J. Clin. Microbiol. 1990, 28, 2360–2361. [Google Scholar] [CrossRef]
  80. Sachett, J.A.G.; da Silva, I.M.; Alves, E.C.; Oliveira, S.S.; Sampaio, V.S.; do Vale, F.F.; Romero, G.A.S.; dos Santos, M.C.; Marques, H.O.; Colombini, M.; et al. Poor efficacy of preemptive amoxicillin clavulanate for preventing secondary infection from snakebites in the Brazilian Amazon: A randomized controlled clinical trial. PLoS Neglect. Trop. Dis. 2017, 11, e0005745. [Google Scholar] [CrossRef]
  81. Henke, M.T.; Kenny, D.J.; Cassilly, C.D.; Vlamakis, H.; Xavier, R.J.; Clardy, J. Ruminococcus gnavus, a member of the human gut microbiome associated with Crohn’s disease, produces an inflammatory polysaccharide. Proc. Natl. Acad. Sci. USA 2019, 116, 12672–12677. [Google Scholar] [CrossRef]
  82. Bonwitt, J.; Tran, M.; Droz, A.; Gonzalez, A.; Glover, W.A. Wound Infection Associated with Marine Environment Exposure, Washington, USA. Emerg. Infect. Dis. 2018, 24, 1942–1944. [Google Scholar] [CrossRef]
  83. Vela, A.I.; Collins, M.D.; Latre, M.V.; Mateos, A.; Moreno, M.A.; Hutson, R.; Domínguez, L.; Fernández-Garayzábal, J.F. Psychrobacter pulmonis sp nov., isolated from the lungs of lambs. Int. J. Syst. Evol. Microbiol. 2003, 53, 415–419. [Google Scholar] [CrossRef] [PubMed]
  84. Kozinska, A.; Pazdzior, E.; Pekala, A.; Niemczuk, W. Acinetobacter johnsonii and Acinetobacter lwoffii—The emerging fish pathogens. J. Vet. Res. 2014, 58, 193–199. [Google Scholar] [CrossRef]
  85. Hundenborn, J.; Thurig, S.; Kommerell, M.; Haag, H.; Nolte, O. Severe Wound Infection with Photobacterium damselae ssp. damselae and Vibrio harveyi, following a Laceration Injury in Marine Environment: A Case Report and Review of the Literature. Case Rep. Med. 2013, 2013, 610632. [Google Scholar] [CrossRef] [PubMed]
  86. Drago, L. Prevotella Copri and Microbiota in Rheumatoid Arthritis: Fully Convincing Evidence? J. Clin. Med. 2019, 8, 1837. [Google Scholar] [CrossRef] [PubMed]
  87. Hatziioanou, D.; Gherghisan-Filip, C.; Saalbach, G.; Horn, N.; Wegmann, U.; Duncan, S.H.; Flint, H.J.; Mayer, M.J.; Narbad, A. Discovery of a novel lantibiotic nisin O from Blautia obeum A2-162, isolated from the human gastrointestinal tract. Microbiology 2017, 163, 1292–1305. [Google Scholar] [CrossRef]
  88. Hosseini, P.R.; Mills, J.N.; Prieur-Richard, A.-H.; Ezenwa, V.O.; Bailly, X.; Rizzoli, A.; Suzán, G.; Vittecoq, M.; García-Peña, G.E.; Daszak, P.; et al. Does the impact of biodiversity differ between emerging and endemic pathogens? The need to separate the concepts of hazard and risk. Philos. Trans. R. Soc. B Biol. Sci. 2017, 372, 20160129. [Google Scholar] [CrossRef]
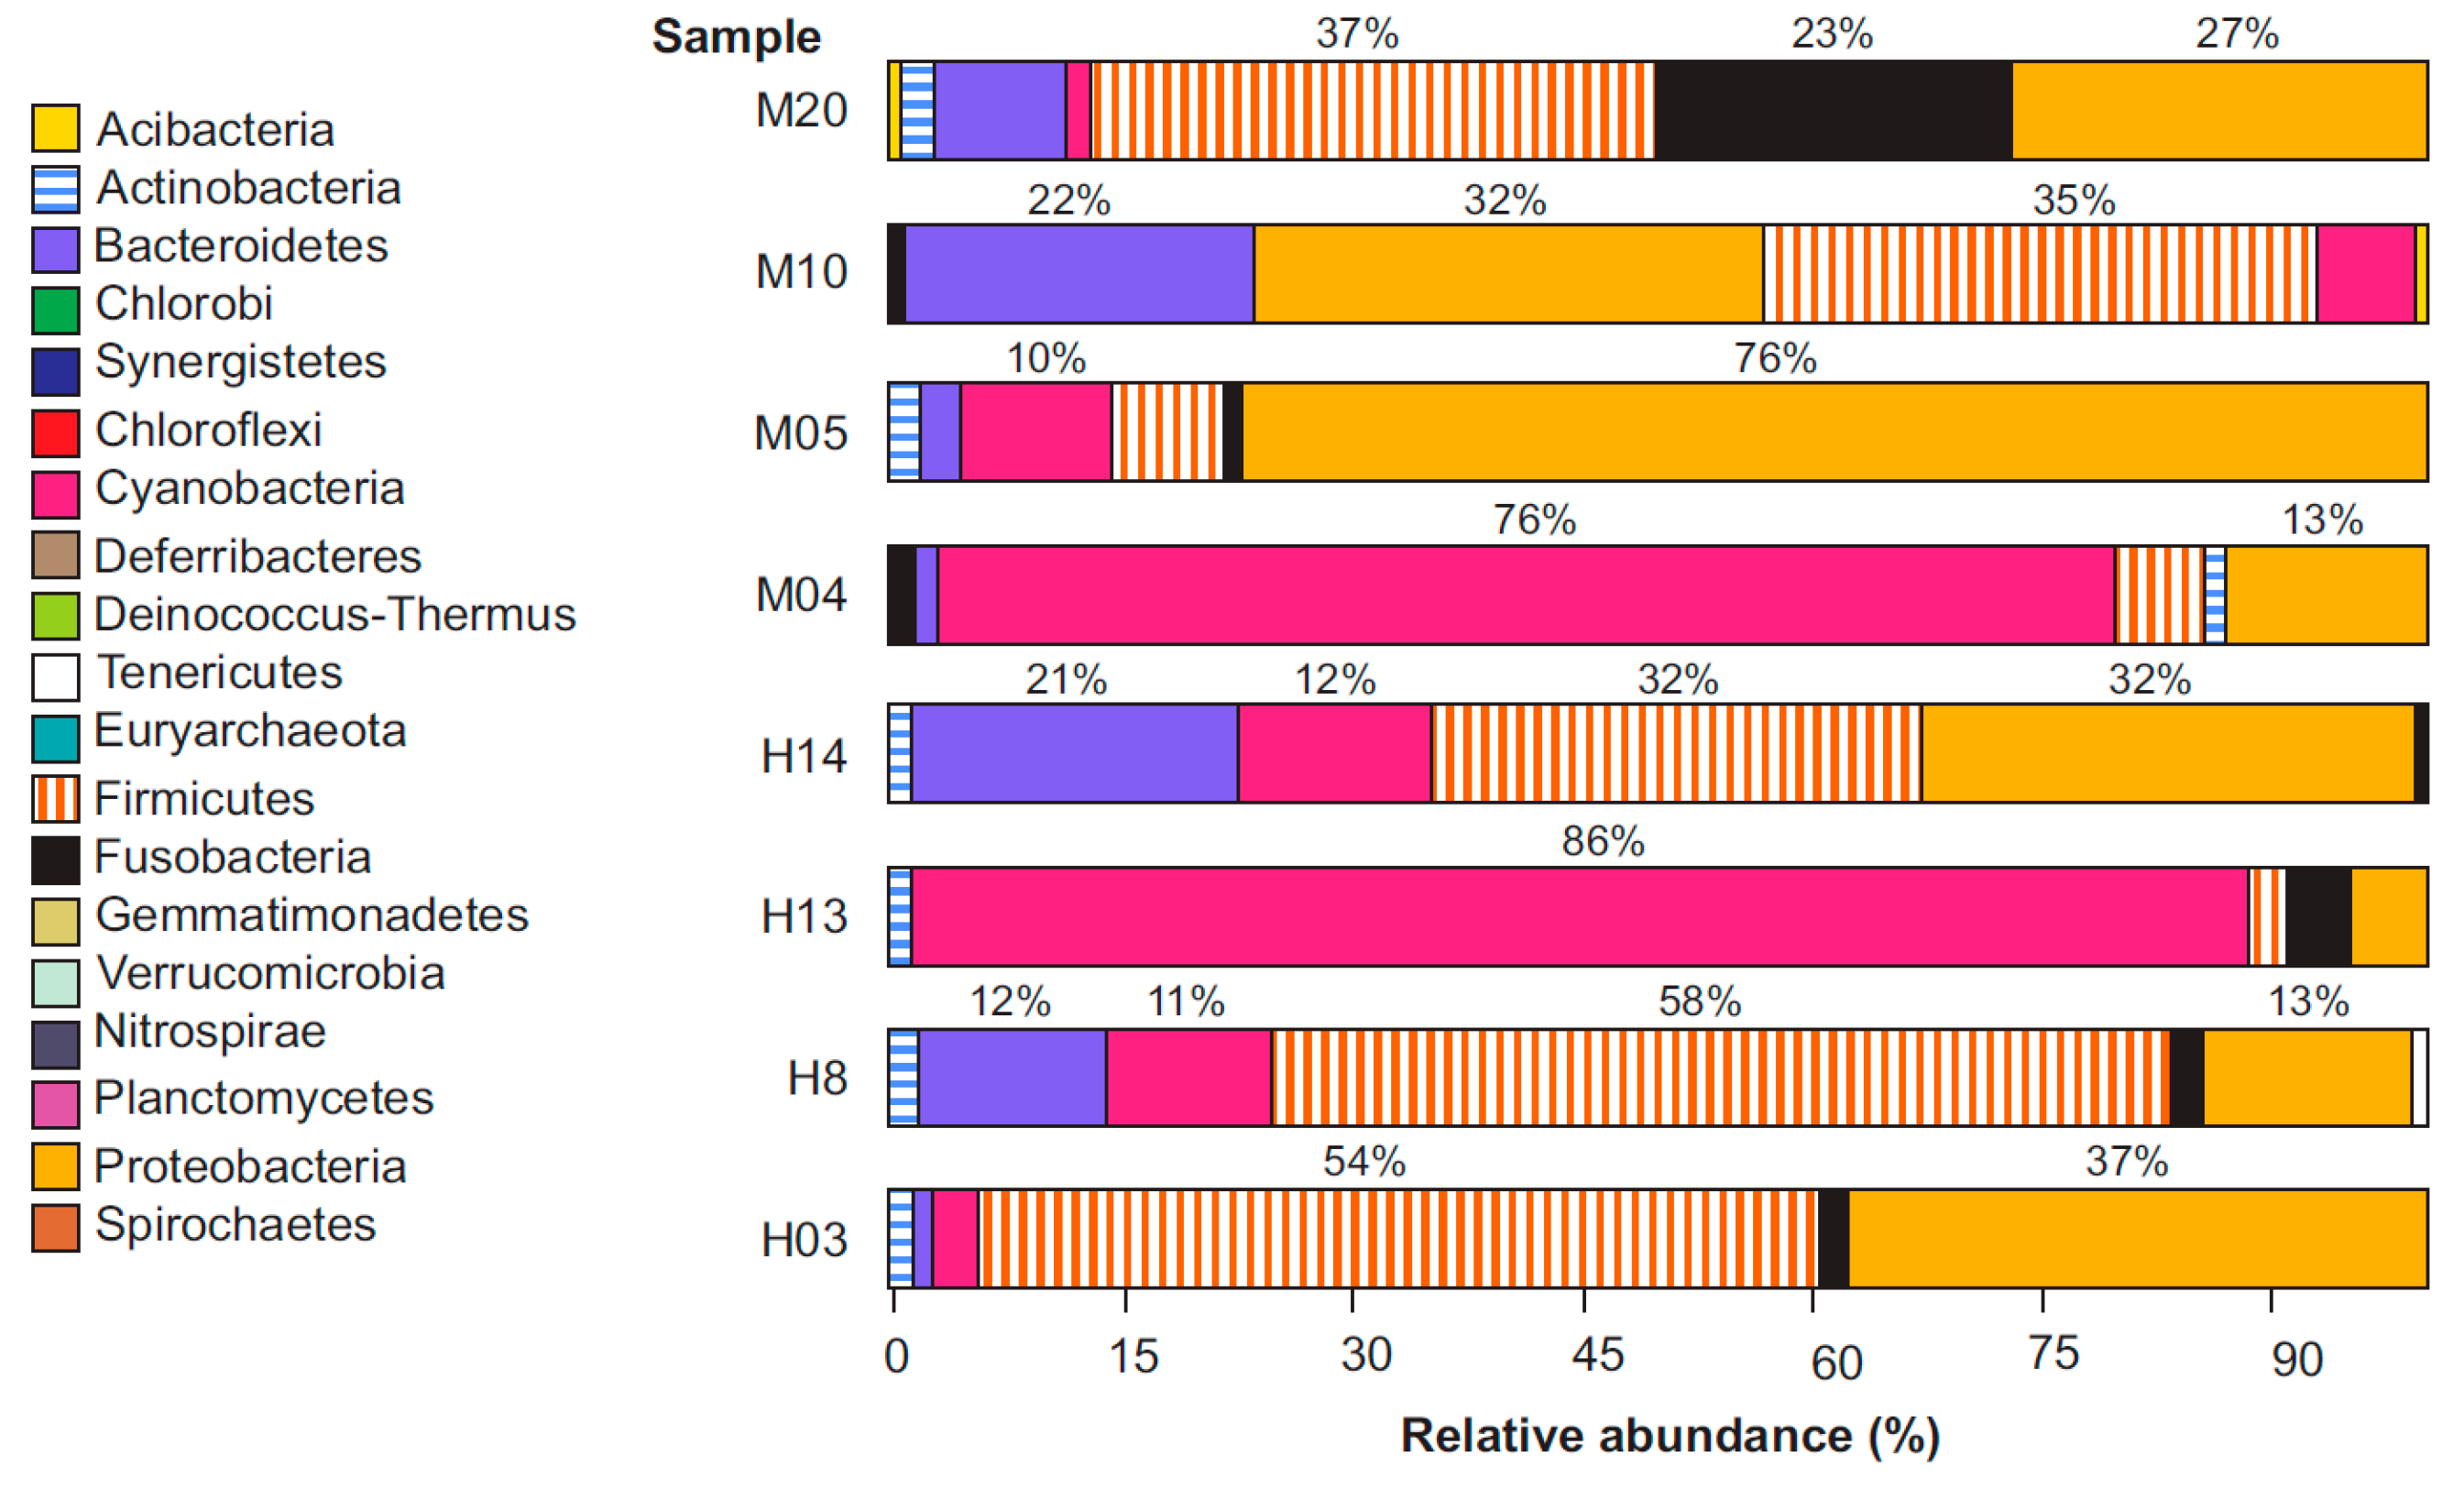
Figure 1. The relative abundance of the phyla identified in the intestinal bacteriome of Larus heermanni. The relative abundance of the phyla of the bacteriome is shown on the horizontal axis and the code for each sample is shown on the vertical axis. The colors correspond to the phyla with the highest relative abundance in the community.
Diversity 16 00617 g001
Figure 2. Principal Component Analysis (PCoA). (a) Bray–Curtis index data. (b) Jaccard index data. (c) Euclidean distance index data.
Diversity 16 00617 g002
Figure 3. Principal Component Analysis (PCoA). (a) UniFrac analysis with the unweighted, and (b) UniFrac analysis with weighted data.
Diversity 16 00617 g003
Figure 4. Heat map of the relative abundance of metabolic predictions made in the HG gut bacteriome community. The functions correspond to: A. Cellular processes; B. Processing of environmental information; C. Processing of genetic information; D. Metabolism; E. Unclassified.
Diversity 16 00617 g004
Figure 5. The relative abundance of the species identified in the HG gut core bacteriome community. Most of the species in this figure correspond to non-pathogenic species.
Diversity 16 00617 g005
Figure 6. Pathogenic species present in the HG gut core bacteriome. The species shown in the figure have been reported in the literature as pathogens of humans, other vertebrates, poultry and/or wild birds. The genera with an asterisk correspond to those previously reported in species of the genus Larus. The legend of the graph, “other sources” refers to pathogen acquisition mechanisms that do not involve zoonosis processes (contact with other animals), but are related to the state of food, or the environment, among others.
Diversity 16 00617 g006
Figure 7. Spearman’s correlation. For the species of the core bacteriome, the circles found within a square correspond to those where the relationship between both species was significant (p < 0.05). Circles, positive or negative correlation: color codes go from absolute positive (yellow) to absolute negative (red) correlations. Squares, statistically significant correlations.
Diversity 16 00617 g007
Table 1. Summary of sequencing quality parameters. In “Sample code” column, H stands for female HG, and M stands for male HG.
SampleNumber of
Sequences
Number of Sequences Recovered% Sequences
Recovered
Number of Bases (nt)Mean of Readings (nt)Quality (Q20)%GC%
H3197,304139,34270.625.89 × 10−742287.1351.31
H08124,918111,48589.254.69 × 10−742086.1651.51
H1398,61395,37196.713.90 × 10−740982.8654.79
H14112,09695,16484.93.98 × 10−741886.2651.67
M04109,037107,05398.184.40 × 10−741075.7654.98
M0598,79786,15687.213.65 × 10−742386.4553.61
M10197,294160,06681.136.65 × 10−741582.651.53
M2099,38090,80391.373.82 × 10−742084.1151.3
H, female HG; M, male HG.
Table 2. Species richness and alpha diversity estimators for each HG individual sample, along with female (H), male (M), and total mean and standard deviation (SD).
EstimatorSample
H03H08H13H14Female Mean (SD)M04M05M10M20Male Mean (SD)Total Mean (SD)
Species richness 77410033501102807.3 (334.4)8287829341415989.8 (290.6)898.5 (306)
Chao 11020.11345.9553.31538.71114.5 (431)1173.11085.51387.81893.31384.9 (361.9)1249.7 (395.8)
ACE1099.71310.6618.71557.31146.6 (398.5)1201.41077.11427.51849.81388.9 (339.8)1267.8 (366.5)
Good’s coverage0.990.990.990.990.99 (0)0.990.990.980.980.99 (0)0.99 (0)
Shannon4.035.82.736.234.7 (1.6)3.94.955.846.355.3 (1.1)4.98 (1.3)
Simpson0.770.890.690.950.83 (0.1)0.840.880.950.930.9 (0)0.86 (0.1)
Phylogenetic diversity54.5764.3832.6271.5155.77 (16.9)70.6851.9859.9888.667.8 (15.8)61.79 (16.5)
Chao 1, non-parametric estimator of species richness; ACE, abundance-based coverage estimator; Good’s coverage, Good’s non-parametric coverage estimator; Shannon, Shannon–Wiener function; Simpson, non-parametric measure of diversity by Simpson; Phylogenetic diversity, Faith’s phylogenetic alpha diversity.
Table 3. Dissimilarity semimatrix generated with the Bray–Curtis index (upper diagonal), similarity semimatrix generated with the Jaccard index (lower diagonal), and Euclidean distance (upper diagonal, cursive).
M10M05H08M20H03H14M04H13
M10-0.863
10,861.9
0.558
9622.4
0.785
8867.9
0.938
14,639.9
0.384
4926.2
0.581
7695.3
0.63
12,047.3
M050.837-0.756
12,531.1
0.745
10,736.8
0.882
16,132.8
0.559
6806.8
0.837
13,560.1
0.855
16,625.8
H080.6340.766-0.532
6721.7
0.548
7195.5
0.519
9720.5
0.792
12,863.7
0.825
16,618.3
M200.7620.7790.725-0.734
11,149.3
0.627
8122.5
0.877
12,954.8
0.926
16,881.5
H030.8190.7450.7870.795-0.924
14,609.6
0.903
16,944.2
0.929
20,246.1
H140.6050.740.6290.7150.787-0.819
10,622.7
0.827
14,231.8
M040.810.7670.7790.7860.7850.81-0.266
5956
H130.8470.7930.8190.8580.7970.8290.804-
Pairwise comparisons for each HG individual sample include males (M), females (H), or both.
Table 4. Distance matrix generated in UniFrac analysis with the unweighted (upper diagonal) and weighted (lower diagonal) data.
M10M05H08M20H03H14M04H13
M10-0.6630.4980.6240.6500.4620.6450.695
M050.431-0.6110.6370.5720.5980.5950.604
H080.5710.549-0.5920.6260.4830.6230.676
M200.7660.5030.361-0.6320.5640.5610.716
H030.250.5090.3950.5-0.6090.6110.617
H140.5420.4660.350.4010.639-0.6090.679
M040.5860.5770.6790.7170.7090.69-0.668
H130.4310.6290.7210.7620.7530.7280.134-
Pairwise comparisons for each HG individual sample include males (M), females (H), or both.
Table 5. Significative correlations between species of HG gut core bacteriome.
PhylaSpecies 1Species 2Correlation (Positive/Negative)
Firmicutes/ProteobacteriaDorea formicigeneransMorganella morganiinegative
Enterococcus cecorumPhotobacterium angustumnegative
Ruminococcus gnavusP. angustumnegative
Blautia obeumPhotobacterium damselaenegative
Firmicutes/BacteroidetesButyricicoccus pullicaecorumBacteroides fragilispositive
B. pullicaecorumBacteroides uniformispositive
B. pullicaecorumFaecalibacterium prausnitziipositive
Firmicutes/FirmicutesE. cecorumRuminococcus gnavuspositive
Peptostreptococcus anaerobiusLimosilactobacillus reuteripositive
Proteobacteria/ProteobacteriaMorganella morganiiEscherichia colipositive
Acinetobacter lwoffiiPsychrobacter pulmonispositive
Bacteroidetes/ActinobacteriaPrevotella copriPiscicoccus intestinalispositive
P. copriCorynebacterium variablepositive
Firmicutes/ActinobacteriaC. variabileLevilactobacillus brevispositive
Bacteroidetes/BacteroidetesBacteroides fragilisBacteroides uniformispositive
Proteobacteria/FusobacteriaAcinetobacter johnsoniiCetobacterium someraepositive
Bold indicates a positive or negative correlation with more than one species.
Disclaimer/Publisher’s Note: The statements, opinions and data contained in all publications are solely those of the individual author(s) and contributor(s) and not of MDPI and/or the editor(s). MDPI and/or the editor(s) disclaim responsibility for any injury to people or property resulting from any ideas, methods, instructions or products referred to in the content.