Abstract
The identification of species present in an ecosystem and the assessment of a faunistic inventory is the first step in any ecological survey and conservation effort. Thanks to technological progress, DNA barcoding has sped up species identification and is a great support to morphological taxonomy. In this work, we used a “Reverse Taxonomy” approach, where molecular (DNA barcoding) analyses were followed by morphological (skeletal features) ones to determine the specific status of 70 echinoid and 22 crinoid specimens, collected during eight different expeditions in the Ross and Weddell Seas. Of a total of 13 species of sea urchins, 6 were from the Terra Nova Bay area (TNB, Ross Sea) and 4 crinoids were identified. Previous scientific literature reported only four species of sea urchins from TNB to which we added the first records of Abatus cordatus (Verrill, 1876), Abatus curvidens Mortensen, 1936 and Abatus ingens Koehler, 1926. Moreover, we found a previous misidentification of Abatus koehleri (Thiéry, 1909), erroneously reported as A. elongatus in a scientific publication for the area. All the crinoid records are new for the area as there was no previous faunistic inventory available for TNB.
1. Introduction
The increasing application of integrated taxonomy, coupled with new modelling approaches, requires data to be findable, accessible, interoperable and reusable in the long term [1].
The most common challenges facing studies or the construction of biodiversity inventories are accurate species identification and the absence of detailed information on the distribution of taxa throughout the different geographical regions of the planet [2]. Morphology-based identification represents the classic approach to taxonomy but is strongly dependent on the level of experience and expertise of the identifier. This method is, thus, largely prone to mistakes whenever intraspecific variability has not been previously tested. However, the increase in molecular advances has made it evident that this approach comes with some inherent limitations [3]. Taxonomic discrepancies, such as synonymous or cryptic species, are extremely common when a traditional taxonomic approach is used. Neither molecular nor morphological taxonomic methods are sufficient on their own [4] and the number of examples where this integrated approach is applied to identify species is rapidly increasing (sea stars (e.g., [5,6,7,8,9,10,11]), brittle stars (e.g., [12]), holothurians (e.g., [13]), fish (e.g., [14]) and many more.
With the rapid accumulation of samples in museums and the co-occurring decline in taxonomic expertise in recent years [15], molecular tools, phylogenetics and coalescent-based analyses have become the practices used for species identification or discrimination. Among all these, DNA barcoding in particular has provided a useful method for fast, efficient and reliable species identification and discovery [5,16,17]. It is based on the concept of the “barcode gap” routine occurrence [16], where significantly higher interspecific divergence for the cytochrome c oxidase subunit I (COI) gene is lower compared to an intraspecific one. DNA barcoding exhibits remarkable effectiveness in taxonomic assignments, overcoming challenges commonly associated with morphology-based identification methods. It not only circumvents the difficulties encountered when diagnostic traits are lacking due to damaged specimens, but also establishes connections between various stages of animal development [18]. A 658-bp region of the COI gene is, thus, largely used as an effective marker to pinpoint species delimitation boundaries in different groups of marine organisms [5,12,19,20,21,22,23,24].
Several studies have demonstrated the efficiency of COI sequencing and that integrative taxonomy brings added value to address some species complexes or identify cryptic species within Echinodermata phylum [5,11,25,26].
Crinoidea, an important class of echinoderms, include a stalked form commonly referred to as sea lily and a more mobile form known as feather star. Sea lilies, which account for 80 crinoid species, live mostly at depths greater than several hundred meters. Sea lilies’ calyx and arms are supported above the substrate by a stalk composed of disc-shaped plates called columnals. By contrast, feather stars are more successful ecologically, with about 570 species occupying diverse habitats from the intertidal to the deep sea, and from tropic to polar sea. They lack a stem in the adult stage and are usually anchored much closer to the substrate by claw-like cirri that radiate from the centrodorsal plate [27]. Although pentacrinoid larvae of feather stars do have stalks, they abandon them during development. For this class, there is no specific diagnostic tool and information is scattered in a variety of scientific papers.
Among the five echinoderm extant classes, echinoids represent a conspicuous and important element of many marine benthic communities and are always reported in local checklists. They exploit a wide array of marine habitats, from the poles to the equator and from the intertidal zone to the deep sea, although they achieve their greatest levels of diversity and abundance in shallow shelf areas [28,29]. Their typically large size coupled with their purportedly fairly easily identifiable characters have contributed to this success (e.g., [30,31,32]). As a result, a comprehensive database and identification guides have been produced, comprising the Southern Ocean [33]. For this area, in fact, there exists the Southern Ocean Antarctic Echinoidea database assembled by David et al. in 2005 [33,34], which is a powerful interactive database synthesizing the results of more than 130 years of Antarctic expeditions and providing the main morphological characteristics for species identification. It represents one of the most complete collections of information for any Antarctic taxa but still reveals major gaps in the geographic and bathymetric distributions of many species.
Since the establishment of the Italian research station “Mario Zucchelli”, the benthic fauna of Terra Nova Bay (TNB) has been widely investigated. Many of these ecological studies were conducted on some of the most conspicuous and easy to find species of echinoderms, mainly asteroids ([35,36]). With the introduction in 2016 of the Ross Sea region Marine Protected Area (RSMPA) through the RSMPA Monitoring Plan (CCAMLR Conservation Measure 91-05: Ross Sea region Marine Protected Area. 2016 [37]) and the inclusion of the TNB area in the marine protected area (MPA), the accurate description of the benthic communities has become a new priority, with the aim of implementing monitoring and conservation efforts for species and communities.
However, to date, a complete faunistic inventory for all echinoderm classes is still lacking, despite the fact that continuous research has been undertaken in the area. Specifically, the TNB echinoid species inventory was assessed for the first time by Chiantore et al., 2006 [38], based on morphological identifications leading to a list of four species in the area. For crinoids, there is a general assessment for the Ross Sea [39], but a comprehensive list for this taxon in the TNB area is still lacking.
The objectives of the study are: (i) to update the checklist for echinoids of the TNB area; and (ii) to evaluate the first comprehensive inventory for crinoids from the same location. To achieve this goal, we used an integrated approach using both DNA barcoding and morphological characters. The results will serve as a baseline for future works in ecology, monitoring and management of the study area. The current paper represents a further contribution of the Italian National Antarctic Museum (MNA), Genoa section, as the custodian of biodiversity data for the Ross Sea area. Many contributions to the Antarctic Biodiversity Portal have been published by the MNA over the years, with the aim of increasing the knowledge of the area [11,40,41,42,43,44,45,46,47,48] (http://www.biodiversity.aq, accessed on 25 November 2022).
2. Materials and Methods
The samples available at Italian National Antarctic Museum (MNA), Genoa section, analysed in this study derive from the Antarctic Peninsula (Figure 1a) and the Ross Sea sector, specifically the TNB area, which is part of both the marine protected area and the Antarctic Special Protected Area (n.161) (CIT 62) (Figure 1b).
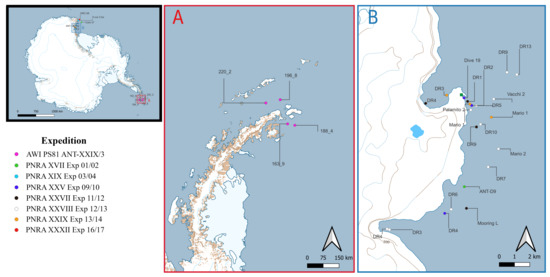
Figure 1.
Antarctica (high left); highlighted in red is the Antarctic Peninsula and in blue the Terra Nova Bay (Ross Sea) sector. (A) Sampling station of the Antarctic Peninsula and (B) sampling sites in Terra Nova Bay with Mario Zucchelli Station (Italy) highlighted in green square. Legend is colour coded for expedition.
Specimens were collected in the framework of several recent scientific expeditions performed in the Southern Ocean and which are now permanently stored and curated at MNA. The Italian National Antarctic Program (PNRA) expedition “XVII” (2001/2002), “XIX” (2003/2004), “XXV” (2009/2010), “XXVII” (2011/2012), “XXVIII” (2012/2013), “XXIX” (2013/2014), “XXXII” (2016/2017) were all from the Ross Sea, and additional samples collected from the Antarctic Peninsula were obtained from the Alfred Wegner Institute (AWI) ANT-XXIX/3, PS81 expedition (2013).
2.1. Sampling and DNA Extraction
A total of 92 samples, 70 belonging to echinoids and 22 to crinoids, were analysed and the distributional data considered here originated from 31 different sampling stations, ranging from 15 and 750 m in depth (Table 1). Sampling was performed through deployments of a variety of sampling gear comprising SCUBA diving (see Table 1 for details). Six pentacrinoid larvae (MNA-03760, MNA-03766, MNA-03795, MNA-03855 and MNA-07967) were included in the analyses and were obtained by examining biological materials (e.g., polychaetes tubes) on which they settled; one of these (MNA-09159) was found on the metal structures of Mooring L.

Table 1.
Sampling stations and data. Abbreviations: Mario Zucchelli Station (MZS); number of specimens (N). Additional information on individual specimens can be found in Supplementary Materials S1.
Whenever possible, following the collection and sorting phase, the live specimens were photographed by one of us (SS) to avoid the loss of potential diagnostic characteristics such as colours that would fade or disappear once the organism was fixed in ethanol.
Samples were fixed in ethanol (95% Et-OH) or frozen (−20 °C) in order to preserve them for further genetic analysis. Sorting and classification on a morphological basis were performed at the MNA using the available literature and keys from Koehler (1926) [49], Clark (1967) [50], Moore (1983) [51] and Speel at al. (1983) [52]. All the samples were acquired as permanent vouchers at the MNA (https://steu.shinyapps.io/MNA-generale/, accessed on 21 November 2022). The clipped material from each sample was sent to the Canadian Center for DNA Barcoding using microplates (University of Guelph, Guelph, ON, Canada), which performed extraction, amplification and sequencing. Primers used for amplification were LCOech1aF1 (5′-TTTTTTCTACTAAACACAAGGATATTGG-3′) or EchinoF1 (5′-TTTCAACTAATCATAAGGACATTGG-3′) and HCO2198 (5′-TAAACTTCAGGGTGACCAAAAAATCA-3′). Sequences were uploaded to the BOLD platform (Barcode Of Life Data systems, http://www.boldsystems.org, accessed on 21 November 2022).
Manual taxonomic assignation was performed in BOLD (Accessed 16 November 2022) of which sequences are available for 5147 echinoid and 4291 crinoid specimens, representing, respectively, 307 and 203 species. Comparison was also performed in the National Center for Biotechnology Information (NCBI) database with BLAST (https://blast.ncbi.nlm.nih.gov/Blast.cgi, accessed on 21 November 2022) for definitive assignment. A correct identification was defined as a sequence match that exceeds 98% similarity to the reference database [53]. The taxonomic names and classification used in this study were obtained from the World Register of Marine Species (WoRMS) website (www.marinespecies.org, last accessed on 21 November 2022). Sequences were edited and corrected in CodonCode Aligner v9.0.1, developed by CodonCode Corporation in Centerville, MA, USA (http://www.codoncode.com/aligner/, accessed on 21 November 2022). The MUSCLE algorithm was used to align sequences, which is available within CodonCode Aligner, and result was visually inspected for accuracy. Odontaster validus Koehler, 1906 (GenBank accession number: ON103477) was selected as outgroup. The substitution pattern was determined by analysing the Bayesian information criterion (BIC) scores in MEGA X [43], and the T92 + G (Tamura 3-parameter + Gamma distribution [44]) model was found to have the lowest scores, indicating the best fit. Phylogenies were inferred using Bayesian, maximum likelihood (ML) and maximum parsimony (MP) approaches. Bayesian estimation of phylogeny was carried out using Mr Bayes [54,55]. Additionally, a generalized time reversible (GTR) model with gamma(G)-correction was used to avoid risk of obtaining unsupported results with under parametrization in Bayesian inference. Markov chain Monte Carlo (MCMC) algorithm with two simultaneous independent runs was performed starting from different random trees. Each run comprised four chains (one cold and three heated), which were sampled every 100 generations for a total of 2 × 10⁸ generations. To ensure appropriate effective sampling size (ESS all > 100), Tracer v.1.6 was utilized. The final result trees for comparison were performed using FigTree v1.4.4 (http://tree.bio.ed.ac.uk/software/figtree/, accessed on 21 November 2022) for graphical representation. Sequences obtained in this study have been deposited in GenBank: accession numbers OR157781-OR157864.
2.2. Species Delimitation Methods
The assumption of using species delimitation methods dictates that two or more species are distinct by exhibiting a “barcode gap” [56]; that is, genetic variation between species (interspecific) greater than genetic variation within species (intraspecific) [57]. Four methods were conducted for primary species hypotheses to identify the number of molecular operational taxonomic units (MOTUs) within our dataset. The Barcode Index Number System (BIN) [58] and Automatic Barcode Gap Discovery (ABGD) [16] rely on pairwise sequence distances between specimens to determine the number of OTUs within a dataset. Standard BIN assignments are available on BOLD (http://www.boldsystems.org, accessed on 13 December 2022), but they are generated through the analysis of all barcode sequences on BOLD, meaning that the results are not strictly comparable with those obtained with other methods (because they are based on a more inclusive dataset). ABGD analysis was performed on the web interface (http://wwwabi.snv.jussieu.fr/public/abgd/, accessed on accessed on 15 December 2022), Kimura (K80) was used as the genetic distance with default range of 0.001 to 0.1 and was examined for intraspecific distances, while gap values from 1 to 1.5 were employed. The Generalized Mixed Yule Coalescent (GMYC) [59] differs strongly from the other methods because it is a model-based approach, aiming to discover the maximum likelihood solution for the threshold between the branching rates of speciation and coalescent processes on a tree. The tree-based methods employ a coalescent framework to independently identify evolving lineages without gene flow, each representing a putative species [60]. They can be performed using a single marker and are used to establish a threshold that identifies the separation of intraspecific population substructure from interspecific divergence. It therefore identifies those groups that may be candidate species [61]. The last species delimitation approach was implemented using a PTP process [62]. Here, we used the Bayesian implementation of the Poisson tree processes model (bPTP) [62], the ML tree was used as input. The bPTP analysis (species.h-its.org/ptp) runs parameters that were 500,000 generations of MCMC, a thinning of 100 and a 25% burn-in. In all the species partition methods used, the outgroup (Odontaster validus) was removed.
2.3. Morphological Identification
Following the “Reverse Taxonomy” approach [63,64], morphological analyses were conducted for a re-examination of our molecular results on available specimens. Observations were carried out under a stereoscopic microscope. For determination to species level, each sea urchin individual was identified according to the morphological features indicated in the taxonomic keys for Antarctic Echinoidea by Thomas Saucède (http://echinoidea-so.identificationkey.org/mkey.html, accessed on 13 January 2023). Crinoids were identified with available literature from Clark (1967) [50], Moore (1983) [51] and Speel at al. (1983) [52]. For echinoids, our morphological analysis focused on morphological skeletal features, such as accessory structures and spines. We particularly focused our attention on pedicellariae, which are defensive structures consisting of a head composed of two or more valves hinged to one another, a stem and sometimes a neck. The four main types of pedicellariae analysed were: globiferous, dentate, triphyllous and ophicephalous.
Given the taxonomic relevance of pedicellariae shape morphology for species identification, the small mandibular appendage that articulates on the test was removed from selected samples corresponding to putative species partition highlighted by the molecular analysis. The tissue portion was treated with sodium hypochlorite (NaClO) to remove organic matter. Subsequently, the skeletal elements obtained were washed with deionized water then after with water and ethanol (Et-OH). Proportions were increased until the skeletal elements were completely washed with 100% Et-OH. This made it possible to observe skeletal characteristics in detail under the stereomicroscope in order to obtain the correct identification of the species.
For crinoids, we compared the external morphological features. All diagnostic characters were analysed in detail, including the cirri, oral pinnules, genital pinnules, arm number, and segments of the cirri and arms under a stereomicroscope. Specimens identified in this study showed morphological characteristics corresponding to those described in the literature [39,40,41], and molecular species identification was cross-referred with the morphological result.
3. Results
A total of 92 specimens were analysed in the current study, and all were correctly sequenced to obtain a final COI sequence length of 628 bp. The COI dataset employed for analyses is reported as Supplementary Material (M1). Of the 92 sequences generated in this study, 70 belonged to echinoids and 22 to crinoids. All sequences were barcode-compliant (Supplementary File S2) and received a BIN, which aided species delimitation [58]. The other species delimitation methods recovered a different number of secondary species hypotheses (SSH) for sea urchin, but were all in agreement regarding the crinoid’s investigation (Supplementary File S2). The most problematic method was bPTP because in the echinoids’ SSH investigation, it showed an overestimation in species partition. The maximum likelihood and Bayesian analysis results were consistent and revealed 13 putative species of echinoids and 4 of crinoids (Figure 2 and Supplementary File S2).
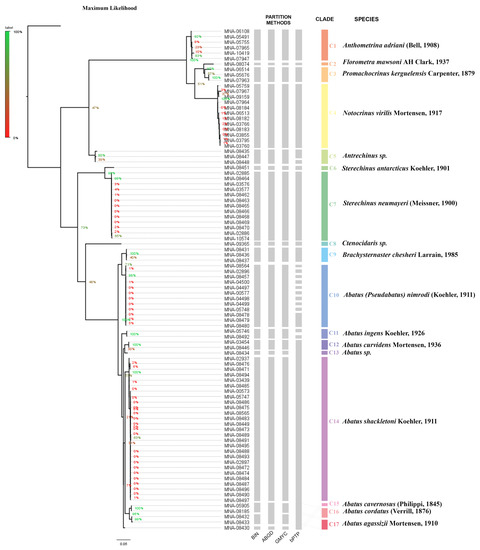
Figure 2.
Tree topology comparison of maximum likelihood. Posterior probability node values are shown on the tree with corresponding legend for each analysis. BIN: barcode index number; BOLD: automatic species delimitation [58]; ABGD: results from automatic barcode gap discovery method [16]; GMYC: species delimitation from generalized mixed Yule coalescent method [59]; bPTP: species delimitation using Bayesian Poisson tree processes method [62].
3.1. Molecular Results
Identification through barcoding requires specimens from the same species to cluster together using the barcode markers. Detailed and high-resolution trees’ comparison (ML and Bayesian interference) with species partition method results are available in Supplementary File S3.
3.1.1. Crinoidea
The 22 crinoids analysed here were assigned to four morphospecies, all of them corresponding to described and well-known species. Our crinoid specimens were correctly grouped into four putative species by the species delimitation methods, showing consistency between the analyses. Clade 1 (posterior probability 92% ML and value of 0.97 in Bayesian interference) corresponded to individuals of Anthometrina adriani (Bell, 1908), and Clade 2 (posterior probability 97% ML and value of 1.00 in Bayesian) to Florometra mawsoni AH Clark, 1937individuals. Promachocrinus kerguelensis Carpenter, 1879 individuals were included in Clade 3 (posterior probability 97% ML and value of 1.00 in Bayesian). Notocrinus virilis Mortensen, 1917 individual were included in Clade 4 (posterior probability 100% ML and value of 1.00 in Bayesian). All pentacrinoids stage larva feltt in the N. virilis clade.
3.1.2. Echinoidea
The 70 echinoids studied represented 13 morphospecies, five of which were given provisional identifications based on molecular taxonomy: Clades 12, 13 and 16 (Abatus sp.), Clade 5 (Antrechinus sp.) and Clade 8 (Ctenocidaris sp.). This was due to a lack of matching sequences in the online database (cross-check on BOLD and GenBank. Accessed 22 November 2022). COI-based species delimitation methods identified 13 (BIN and GMYC), 12 (ABGD) and 19 putative species (bPTP). The results are consistent between the species delimitation methods for Sterechinus antarcticus Koehler, 1901 (Clade 6), Sterechinus neumayeri (Meissner, 1900) (Clade 7) and Brachysternaster chesheri Larrain, 1985 (Clade 9).
Sequences belonging to Clades 16 and 17 were grouped together by ABGD. In bPTP, those sequences are similarly grouped with Clades 12, 13, 14 and 15. However, bPTP seems to overpartition putative species of Abatus ingens Koehler, 1926 (Clade 11), Antrechinus sp. (Clade 5) and Abatus (Pseudabatus) nimrodi (Koehler, 1911) (Clade 10).
Posterior probability node values, which are shown on the tree (Supplementary File S3), range from 47% to 100% for ML tree reconstruction and a value included from 0.56 to 1 in Bayesian interference. In our samples, no corresponding sequence matched Abatus koehleri (Thiéry, 1909) (previously reported from the TNB area as A. elongatus), a species previously reported from Terra Nova Bay water [55].
3.2. Morphological Analysis
A total of 70 echinoid and 22 crinoid individuals were morphologically examined after primary species partition based on molecular screening following the “Reverse Taxonomy” approach. Clades 12 and 16 were assigned on a sole morphological base, as they did not match any sequence in the online databases.
The main descriptors to distinguish the species are given below for crinoids and echinoids, respectively, in Table 2 and Table 3; the more in-depth descriptions of the species are reported in Supplementary Materials S4. The results of the molecular analysis were combined with the morphological results following the “Reverse Taxonomy” approach, and the species partition was consistent. To optimize the visualization and understanding of the results, the tree in Figure 2 was subdivided, highlighting the class of crinoids, in Figure 3, and echinoids, in Figure 4, with the available representative photos of selected specimens.
Table 2.
Main descriptors to distinguish crinoid species identified in this work.
Table 3.
Main descriptors to distinguish echinoid species identified in this work.
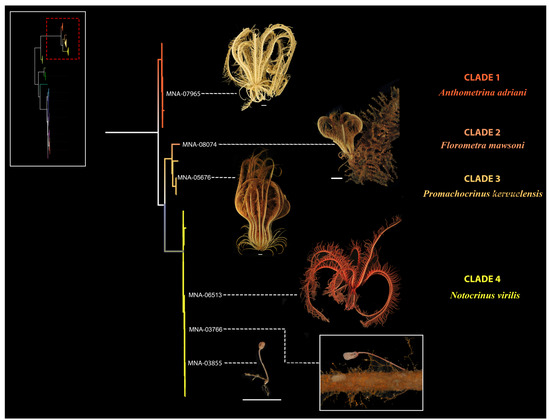
Figure 3.
Representative photos of selected specimens. In the tree, the different species identified are highlighted by different colours. The species present in the Terra Nova Bay area are listed on the right. Bottom left is the schematic view of the tree in Figure 2, the portion analysed in detail in the image is highlighted in red. Scale bar: 1 cm in grey.
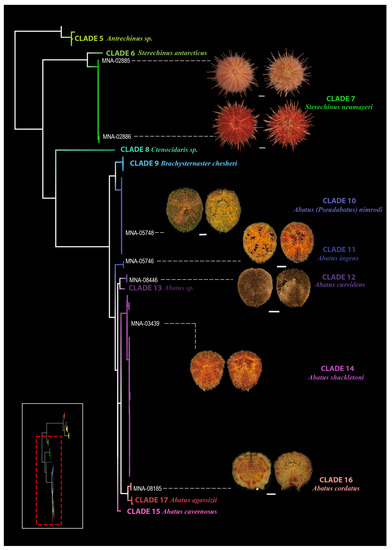
Figure 4.
Representative photos of selected specimens (left—aboral view, right—oral view) from Terra Nova Bay. In the tree, the different species identified are highlighted by different colours (only the species from TNB are figured). Bottom left is the schematic view of the tree in Figure 2, the portion analysed in detail in the image is highlighted in red. Scale bar: 1 cm in grey.
3.3. Faunistic Inventory Revision
In our analysis no samples corresponding, morphologically or molecularly, to A. koehleri, a species identified with classical morphology by Chiantore et al., 2006 and reported in that publication with the old name of A. elongatus [38] were found.
This was unexpected and we thus cross-checked all the available materials present in the Italian National Antarctic Museum (MNA, Section of the Genoa) collections. Unfortunately, only a small amount of previously studied and published material has been later given to the museum, preventing a general in-depth re-evaluation. However, sample MNA-00573 was found to belong to the bulk of specimens published by Chiantore et al., 2006, and still reported an original identification label indicating it as A. elongatus. During our study, this same sample was successfully sequenced, morphologically reviewed bringing to an undoubted identification of A. shackletoni Koehler, 1911.
In the light of this result, we believe that the presence of A. koehleri, previously reported as A. elongates by Chiantore et al., 2006, in the Terra Nova Bay area has to be considered questionable. Hence this is the same for the published in the Southern Ocean Echinoid database (e.g., [33,34]) that are based on the same publication. This modifies the number of previous identified species from TNB area from four to three.
Overall, by combining molecular and morphological identifications, we found three more echinoids species, i.e., A. cordatus, A. curvidens and A. ingens, not previously reported in TNB, which bring the total number of echinoids present here to 6 species. The revised check list is given in Table 4, together with an updated depth range for the considered species (Figure 5).
Table 4.
Faunistic inventory for echinoids and crinoids of Terra Nova Bay with updated information based on the present study.
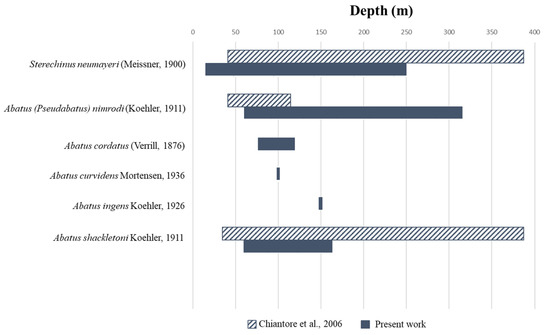
Figure 5.
List of echinoids species found in Terra Nova Bay and updated depth range [38].
4. Discussion
The identification of species in an ecosystem is the first step in any ecological and conservation study, but even to provide a list of species for a given area is not an easy task. In recent years, one of the main hurdles in this kind of activity has become the chronic lack of experienced taxonomists. This fact, coupled to the generally time-consuming nature of morphological investigation, had the general effect of a significant slowdown of the duration of a given study.
The possible presence of cryptic species complexes represents another challenging aspect of biodiversity studies. These organisms are remarkably similar in appearance to other closely related species, resulting in them being virtually indistinguishable from the latter based on traditional morphological characters alone. Consequently, cryptic species are often overlooked, thus introducing serious biases in species richness estimates and in conservation efforts. Moreover, it is always possible that some of the unrecognized species in a sample collected in a newly studied area are new to science. This is a not a remote risk if it is considered that only 25% out of the 0.7 to 1.0 million marine species seems to have been described to date [65]. In terms of conservation efforts, this means that species could face extinction before they can be described [66].
A solution proposed to overcome all of the above issues relies on the use of molecular tools, such as DNA barcoding [3,19,57]. This method gained more attention in the last decade due to the increase in the speed of laboratory procedures, the availability of ad hoc software to better define species hypotheses and the high reproducibility of all these analyses.
The efficiency of identification through barcoding, however, depends on the quality and completeness of a reference database of sequences [67,68]. To this aim, projects such as the “The Barcode of Life” (BOLD) [69] directly and indirectly encourage large-scale molecular studies with a higher focus on quality. One of the main foundations of BOLD is the attention to voucher specimens that intrinsically provide opportunities for morphological and molecular studies using the same specimens as well as for subsequent cross-checking of identifications whenever disagreement is found. Another key point of a good reference library is the geographical coverage. In fact, data from few locations may only lead to an incomplete understanding of intraspecific genetic diversity, and a comprehensive DNA barcode library should include a broad range of species from as many locations as possible.
However, neither molecular nor morphological methods are sufficient per se for accurate taxonomy, and only the combined use of several methods provides a robust way to obtain a more precise estimation of species boundaries.
An ideal approach is, thus, that of “reverse taxonomy”, where morphological analyses are performed after an initial molecular assessment [63,64].
In the case of echinoderm research, the application of “reverse taxonomy” has provided numerous benefits. Echinoderms, in fact, are known for their complex morphological features and challenging taxonomy, resulting in subjective and prone-to-misidentification species recognition [5]. This is especially true in cases where external morphology alone may not provide sufficient differentiation or when it is applied to large-scale sampling activities or to museum collections where thousands of samples have to be processed.
Application of this integrated approach also allows accurate identification of damaged specimens or larval stages, which can be challenging or simply impossible to determine at the specific level by using traditional taxonomy alone.
The Southern Ocean is not an exception to all these problems, and whenever this combined approach was applied, unexpected outcomes emerged and even apparently complicated taxonomical situations were resolved (e.g., [11,25]).
In this contribution, we applied a “classic” reverse taxonomy approach on two classes of echinoderms, i.e., echinoids and crinoids, in order to verify the number of species present in our samples and to test its usefulness in enhancing our understanding of echinoderm biodiversity.
Molecular data were fully resolved by current available algorithmic methods for species delineation applied to DNA barcodes. Although this test involved low sample sizes, it provided an estimate of the relative efficacies of OTU designation via DNA-based methods and external morphology, speeding up the process of species identification.
Since in this case limited or no previous knowledge was available for the considered group, if the initial phase of taxonomic work would have been based on a pre-sorting based on external morphological characters alone, this step would only have slowed down the whole process and several species would not have been recognized.
Overall, in this study, we contributed nearly 100 new sequences, including sequences from two species not yet available in public databases (i.e., A. curvidens and A. cordatus), enhancing our understanding of echinoid and crinoid biodiversity not only for the TNB area, but also for the Southern Ocean in general. This is a significant result when considering that echinoderms represent a considerable biomass in marine habitats and play a major role in the Antarctic marine ecosystems [35,70,71,72,73,74,75,76].
Species recognition was also possible for the six pentacrinoids larvae that were identified by comparing COI sequences against the reference sequences held in GenBank, confirming the importance of DNA barcodes in order to identify juvenile organisms and larval stages where morphological identification could be challenging.
Two putative new species (Antrechinus sp. and Ctenocidaris sp.), defined here based on COI sequences alone, need to be better characterized with integrated taxonomy to resolve their status. The sharing of this information may speed up comparisons with museum materials from other institutions, allowing, in the end, to formally assign a species name to these COI-based putative species.
The application of a reverse taxonomy approach has proven to be an efficient tool, even for checking the identity of old, already published, museum materials, highlighting the necessity of maintaining permanent repositories of scientific samples for future generations and comparisons.
This reinforces the pivotal role that museums play, not only as conservation centres for biological collections but also as hubs for information sharing. It is desirable that in the coming years, all available museum collections undergo molecular identifications to accurately assess species determinations and occurrences, and that all data are at the foundation of any monitoring activity.
Additionally, this work lays the foundations for future research on the diversity within the TNB area, now part of the Ross Sea Marine Protected Area, where a variety of monitoring activities are requested by the conservation measures of Annex 91-05/C [59].
Supplementary Materials
The following supporting information can be downloaded at: https://www.mdpi.com/article/10.3390/d15070875/s1. Supplementary Materials M1: COI sequence dataset produced in this study. Supplementary File S1: List of specimens analysed in this study and corresponding GenBank accession numbers for COI sequences; File S2: Species partition methods; File S3: Tree topology of the 92 samples analysed and species partition methods; File S4: Morphological description of identified species. The data presented in this study are openly available in GenBank (accession numbers: OR157781-OR157864).
Author Contributions
Data curation, A.G.; formal analysis, A.G.; funding acquisition, S.S.; investigation, A.G., M.C.A., M.C. and S.S.; resources, A.G., M.C.A., M.C. and S.S.; supervision, S.S.; validation, A.G.; visualization, A.G.; writing—original draft, A.G.; writing—review and editing, A.G., M.C.A., M.C. and S.S. All authors have read and agreed to the published version of the manuscript.
Funding
This research was funded by project “BAMBi” (Barcoding of Antarctic Marine Diversity; PNRA 2010/A1.10; PI Stefano Schiaparelli) and “TNB-CODE” (Terra Nova Bay barCODing and mEtabarcoding of Antarctic organisms from marine and limno-terrestrial environments; PNRA 16_00120; PI Stefano Schiaparelli). The Italian National Antarctic Museum (MNA), Genoa section, played an essential cooperation role with the projects funded for biological specimen repository and outreach activity. The authors are grateful to the Italian National Antarctic Museum (MNA) for the financial support.
Institutional Review Board Statement
All Italian sampling activities in Antarctica were authorized by the Italian National Antarctic Program (PNRA).
Data Availability Statement
In accordance with FAIR principles, the COI sequence dataset produced in this study (Supplementary Materials M1) can be found in the Supplementary Materials and is openly available in GenBank (https://www.ncbi.nlm.nih.gov/genbank/, accession numbers: OR157781-OR157864).
Acknowledgments
We are grateful to Julian Gutt (AWI) for the donation to MNA of the materials from the 2013 “Polarstern” ANT-XXIX/3 expedition. We also want to thank Santorio Mario and Paschini Elio who contributed to the collection of the material used for this study. This paper is an Italian contribution to the CCAMLR CONSERVATION MEASURE 91-05 (2016) for the Ross Sea region Marine Protected Area, specifically addressing the priorities of Annex 91-05/C. Many thanks are due to Josh Murray and Daniel Harvey who contributed to significant linguistic improvements. The authors are grateful to the two anonymous reviewers for their useful comments and suggestions on the manuscript.
Conflicts of Interest
The authors declare no conflict of interest. The funders had no role in the design of the study; in the collection, analyses, or interpretation of data; in the writing of the manuscript, or in the decision to publish the results.
References
- Wilkinson, M.D.; Dumontier, M.; Aalbersberg, I.J.; Appleton, G.; Axton, M.; Baak, A.; Blomberg, N.; Boiten, J.-W.; da Silva Santos, L.B.; Bourne, P.E. The FAIR Guiding Principles for Scientific Data Management and Stewardship. Sci. Data 2016, 3, 160018. [Google Scholar] [CrossRef] [PubMed]
- Rosenfeld, S.; Maturana, C.S.; Spencer, H.G.; Convey, P.; Saucède, T.; Brickle, P.; Bahamonde, F.; Jossart, Q.; Poulin, E.; Gonzalez-Wevar, C. Complete Distribution of the Genus Laevilitorina (Littorinimorpha: Littorinidae) in the Southern Hemisphere: Remarks and Natural History. ZooKeys 2022, 1127, 61–77. [Google Scholar] [CrossRef]
- Hebert, P.D.; Cywinska, A.; Ball, S.L.; DeWaard, J.R. Biological Identifications through DNA Barcodes. Proc. R. Soc. London. Ser. B Biol. Sci. 2003, 270, 313–321. [Google Scholar] [CrossRef] [PubMed]
- Carstens, B.C.; Pelletier, T.A.; Reid, N.M.; Satler, J.D. How to Fail at Species Delimitation. Mol. Ecol. 2013, 22, 4369–4383. [Google Scholar] [CrossRef] [PubMed]
- Layton, K.K.; Corstorphine, E.A.; Hebert, P.D. Exploring Canadian Echinoderm Diversity through DNA Barcodes. PLoS ONE 2016, 11, e0166118. [Google Scholar] [CrossRef] [PubMed]
- Wright, A.G.; Pérez-Portela, R.; Griffiths, C.L. Determining the Correct Identity of South African Marthasterias (Echinodermata: Asteroidea). Afr. J. Mar. Sci. 2016, 38, 443–455. [Google Scholar] [CrossRef]
- Knott, K.E.; Ringvold, H.; Blicher, M.E. Morphological and Molecular Analysis of Henricia Gray, 1840 (Asteroidea: Echinodermata) from the Northern Atlantic Ocean. Zool. J. Linn. Soc. 2018, 182, 791–807. [Google Scholar] [CrossRef]
- Peck, L.S.; Clark, M.S.; Dunn, N.I. Morphological Variation in Taxonomic Characters of the Antarctic Starfish Odontaster Validus. Polar Biol. 2018, 41, 2159–2165. [Google Scholar] [CrossRef]
- Ringvold, H.; Moum, T. On the Genus Crossaster (Echinodermata: Asteroidea) and Its Distribution. PLoS ONE 2020, 15, e0227223. [Google Scholar]
- Jossart, Q.; Kochzius, M.; Danis, B.; Saucède, T.; Moreau, C.V. Diversity of the Pterasteridae (Asteroidea) in the Southern Ocean: A Molecular and Morphological Approach. Zool. J. Linn. Soc. 2021, 192, 105–116. [Google Scholar] [CrossRef]
- Guzzi, A.; Alvaro, M.C.; Danis, B.; Moreau, C.; Schiaparelli, S. Not All That Glitters Is Gold: Barcoding Effort Reveals Taxonomic Incongruences in Iconic Ross Sea Sea Stars. Diversity 2022, 14, 457. [Google Scholar] [CrossRef]
- Jossart, Q.; Sands, C.J.; Sewell, M.A. Dwarf Brooder versus Giant Broadcaster: Combining Genetic and Reproductive Data to Unravel Cryptic Diversity in an Antarctic Brittle Star. Heredity 2019, 123, 622–633. [Google Scholar] [CrossRef] [PubMed]
- Uthicke, S.; Byrne, M.; Conand, C. Genetic Barcoding of Commercial Bêche-de-Mer Species (Echinodermata: Holothuroidea). Mol. Ecol. Resour. 2010, 10, 634–646. [Google Scholar] [CrossRef] [PubMed]
- Christiansen, H.; Dettai, A.; Heindler, F.M.; Collins, M.A.; Duhamel, G.; Hautecoeur, M.; Steinke, D.; Volckaert, F.A.; Van de Putte, A.P. Diversity of Mesopelagic Fishes in the Southern Ocean-A Phylogeographic Perspective Using DNA Barcoding. Front. Ecol. Evol. 2018, 6, 120. [Google Scholar] [CrossRef]
- Hopkins, G.W.; Freckleton, R.P. Declines in the Numbers of Amateur and Professional Taxonomists: Implications for Conservation. Anim. Conserv. Forum 2002, 5, 245–249. [Google Scholar] [CrossRef]
- Puillandre, N.; Lambert, A.; Brouillet, S.; Achaz, G. ABGD, Automatic Barcode Gap Discovery for Primary Species Delimitation. Mol. Ecol. 2012, 21, 1864–1877. [Google Scholar] [CrossRef]
- Puillandre, N.; Modica, M.V.; Zhang, Y.; Sirovich, L.; Boisselier, M.-C.; Cruaud, C.; Holford, M.; Samadi, S. Large-Scale Species Delimitation Method for Hyperdiverse Groups. Mol. Ecol. 2012, 21, 2671–2691. [Google Scholar] [CrossRef]
- Meiklejohn, K.A.; Wallman, J.F.; Dowton, M. DNA Barcoding Identifies All Immature Life Stages of a Forensically Important Flesh Fly (Diptera: Sarcophagidae). J. Forensic Sci. 2013, 58, 184–187. [Google Scholar] [CrossRef]
- Ward, R.D.; Holmes, B.H.; O’HARA, T.D. DNA Barcoding Discriminates Echinoderm Species. Mol. Ecol. Resour. 2008, 8, 1202–1211. [Google Scholar] [CrossRef]
- Bribiesca-Contreras, G.; Solís-Marín, F.A.; Laguarda-Figueras, A.; Zaldívar-Riverón, A. Identification of Echinoderms (Echinodermata) from an Anchialine Cave in C Ozumel I Sland, M Exico, Using DNA Barcodes. Mol. Ecol. Resour. 2013, 13, 1137–1145. [Google Scholar]
- Moreau, C.; Danis, B.; Jossart, Q.; Eléaume, M.; Sands, C.; Achaz, G.; Agüera, A.; Saucède, T. Is Reproductive Strategy a Key Factor in Understanding the Evolutionary History of Southern Ocean Asteroidea (Echinodermata)? Ecol. Evol. 2019, 9, 8465–8478. [Google Scholar] [CrossRef]
- Arbizu, P.M.; Khodami, S.; Stöhr, S.; Laakmann, S. Molecular Species Delimitation of Icelandic Brittle Stars (Ophiuroidea). Pol. Polar Res. 2014, 35, 243–260. [Google Scholar]
- Boissin, E.; Hoareau, T.B.; Paulay, G.; Bruggemann, J.H. DNA Barcoding of Reef Brittle Stars (Ophiuroidea, Echinodermata) from the Southwestern Indian Ocean Evolutionary Hot Spot of Biodiversity. Ecol. Evol. 2017, 7, 11197–11203. [Google Scholar] [CrossRef] [PubMed]
- Christodoulou, M.; O’Hara, T.; Hugall, A.F.; Khodami, S.; Rodrigues, C.F.; Hilario, A.; Vink, A.; Martinez Arbizu, P. Unexpected High Abyssal Ophiuroid Diversity in Polymetallic Nodule Fields of the Northeast Pacific Ocean and Implications for Conservation. Biogeosciences 2020, 17, 1845–1876. [Google Scholar] [CrossRef]
- Janosik, A.M.; Mahon, A.R.; Halanych, K.M. Evolutionary History of Southern Ocean Odontaster Sea Star Species (Odontasteridae; Asteroidea). Polar Biol. 2011, 34, 575–586. [Google Scholar] [CrossRef]
- Janosik, A.M.; Halanych, K.M. Unrecognized Antarctic Biodiversity: A Case Study of the Genus Odontaster (Odontasteridae; Asteroidea). Integr. Comp. Biol. 2010, 50, 981–992. [Google Scholar] [CrossRef]
- Meyer, D.L.; Macurda, D.B. Adaptive Radiation of the Comatulid Crinoids. Paleobiology 1977, 3, 74–82. [Google Scholar] [CrossRef]
- Smith, A.B.; Gale, A.S.; Monks, N.E. Sea-Level Change and Rock-Record Bias in the Cretaceous: A Problem for Extinction and Biodiversity Studies. Paleobiology 2001, 27, 241–253. [Google Scholar] [CrossRef]
- Linse, K.; Walker, L.J.; Barnes, D.K. Biodiversity of Echinoids and Their Epibionts around the Scotia Arc, Antarctica. Antarct. Sci. 2008, 20, 227–244. [Google Scholar] [CrossRef]
- Kier, P.M.; Grant, R.E. Echinoid Distribution and Habits, Key Largo Coral Reef Preserve, Florida. Smithson. Misc. Collect. 1965, 149, 1–68. [Google Scholar]
- Nebelsick, J.H. Biodiversity of Shallow-Water Red Sea Echinoids: Implications for the Fossil Record. J. Mar. Biol. Assoc. United Kingd. 1996, 76, 185–194. [Google Scholar] [CrossRef]
- Barnes, D.K.; Brockington, S. Zoobenthic Biodiversity, Biomass and Abundance at Adelaide Island, Antarctica. Mar. Ecol. Prog. Ser. 2003, 249, 145–155. [Google Scholar] [CrossRef]
- David, B.; Choné, T.; Festeau, A.; Mooi, R.; De Ridder, C. Biodiversity of Antarctic Echinoids: A Comprehensive and Interactive Database. Sci. Mar. 2005, 69, 201–203. [Google Scholar] [CrossRef][Green Version]
- David, B.; Choné, T.; Mooi, R.; de Ridder, C. Antarctic Echinoidea. In Synopsis of the Antarctic Benthos, Volume 10. Theses Zoologicae; Wägele, J.W., Sieg, J., Eds.; Koeltz Scientific Books: Königstein, Germany, 2005; Volume 35, pp. 1–275. [Google Scholar]
- Cerrano, C.; Bavestrello, G.; Calcinai, B.; Cattaneo-Vietti, R.; Sarà, A. Asteroids Eating Sponges from Tethys Bay, East Antarctica. Antarct. Sci. 2000, 12, 425–426. [Google Scholar] [CrossRef]
- Chiantore, M.; Cattaneo-Vietti, R.; Elia, L.; Guidetti, M.; Antonini, M. Reproduction and Condition of the Scallop Adamussium Colbecki (Smith 1902), the Sea-Urchin Sterechinus Neumayeri (Meissner 1900) and the Sea-Star Odontaster Validus Koehler 1911 at Terra Nova Bay (Ross Sea): Different Strategies Related to Inter-Annual Variations in Food Availability. Polar Biol. 2002, 25, 251–255. [Google Scholar]
- C-CAMLR-XXXV, Report of the Thirty-Fifth Meeting of the Scientific Committee, Hobart, Australia, 17–21 October, Annex 6, 3.2, 3.7-3.9. 2016. CCAMLR CONSERVATION MEASURE 91-05 (2016) for the Ross Sea Region Marine Protected Area, Specifically, Addressing the Priorities of Annex 91-05/C. 2016. Available online: Https://Www.Ccamlr.Org/En/System/Files/e-Sc-Xxxv.Pdf (accessed on 30 May 2023).
- Chiantore, M.; Guidetti, M.; Cavallero, M.; De Domenico, F.; Albertelli, G.; Cattaneo-Vietti, R. Sea Urchins, Sea Stars and Brittle Stars from Terra Nova Bay (Ross Sea, Antarctica). Polar Biol. 2006, 29, 467–475. [Google Scholar] [CrossRef]
- Eléaume, M.; Hemery, L.G.; Améziane, N.; Roux, M. Southern Ocean Crinoids. In Biogeographic Atlas of the Southern Ocean; The Scientific Committee on Antarctic Research: Cambridge, UK, 2014. [Google Scholar]
- Ghiglione, C.; Alvaro, M.C.; Griffiths, H.J.; Linse, K.; Schiaparelli, S. Ross Sea Mollusca from the Latitudinal Gradient Program: R/V Italica 2004 Rauschert Dredge Samples. ZooKeys 2013, 37–48. [Google Scholar]
- Ghiglione, C.; Alvaro, M.C.; Cecchetto, M.; Canese, S.; Downey, R.; Guzzi, A.; Mazzoli, C.; Piazza, P.; Rapp, H.T.; Sarà, A. Porifera Collection of the Italian National Antarctic Museum (MNA), with an Updated Checklist from Terra Nova Bay (Ross Sea). ZooKeys 2018, 137–156. [Google Scholar] [CrossRef]
- Piazza, P.; Blażewicz-Paszkowycz, M.; Ghiglione, C.; Alvaro, M.C.; Schnabel, K.; Schiaparelli, S. Distributional Records of Ross Sea (Antarctica) Tanaidacea from Museum Samples Stored in the Collections of the Italian National Antarctic Museum (MNA) and the New Zealand National Institute of Water and Atmospheric Research (NIWA). ZooKeys 2014, 49–60. [Google Scholar]
- Selbmann, L.; Onofri, S.; Zucconi, L.; Isola, D.; Rottigni, M.; Ghiglione, C.; Piazza, P.; Alvaro, M.C.; Schiaparelli, S. Distributional Records of Antarctic Fungi Based on Strains Preserved in the Culture Collection of Fungi from Extreme Environments (CCFEE) Mycological Section Associated with the Italian National Antarctic Museum (MNA). MycoKeys 2015, 10, 57. [Google Scholar]
- Cecchetto, M.; Alvaro, M.C.; Ghiglione, C.; Guzzi, A.; Mazzoli, C.; Piazza, P.; Schiaparelli, S. Distributional Records of Antarctic and Sub-Antarctic Ophiuroidea from Samples Curated at the Italian National Antarctic Museum (MNA): Check-List Update of the Group in the Terra Nova Bay Area (Ross Sea) and Launch of the MNA 3D Model ‘Virtual Gallery’. ZooKeys 2017, 61–79. [Google Scholar] [CrossRef] [PubMed]
- Cecchetto, M.; Lombardi, C.; Canese, S.; Cocito, S.; Kuklinski, P.; Mazzoli, C.; Schiaparelli, S. The Bryozoa Collection of the Italian National Antarctic Museum, with an Updated Checklist from Terra Nova Bay, Ross Sea. ZooKeys 2019, 1–22. [Google Scholar] [CrossRef]
- Garlasché, G.; Karimullah, K.; Iakovenko, N.; Velasco-Castrillón, A.; Janko, K.; Guidetti, R.; Rebecchi, L.; Cecchetto, M.; Schiaparelli, S.; Jersabek, C.D. A Data Set on the Distribution of Rotifera in Antarctica. Biogeogr./Ital. Biogeogr. Soc. 2020, 35, 17–25. [Google Scholar] [CrossRef]
- Bonello, G.; Grillo, M.; Cecchetto, M.; Giallain, M.; Granata, A.; Guglielmo, L.; Pane, L.; Schiaparelli, S. Distributional Records of Ross Sea (Antarctica) Planktic Copepoda from Bibliographic Data and Samples Curated at the Italian National Antarctic Museum (MNA): Checklist of Species Collected in the Ross Sea Sector from 1987 to 1995. ZooKeys 2020, 969, 1–22. [Google Scholar] [CrossRef] [PubMed]
- Grillo, M.; Huettmann, F.; Guglielmo, L.; Schiaparelli, S. Three-Dimensional Quantification of Copepods Predictive Distributions in the Ross Sea: First Data Based on a Machine Learning Model Approach and Open Access (FAIR) Data. Diversity 2022, 14, 355. [Google Scholar] [CrossRef]
- Koehler, R. Echinodemata Echinoidea Australasian Antarctic Expedition 1911–1914. Sci. Rep. Ser. C Zool. Bot. 1926, 3, 1–134. [Google Scholar]
- Clark, A.H. A Monograph of the Existing Crinoids; US Government Printing Office: Washington, DC, USA, 1967. [Google Scholar]
- Moore, R.C. Treatise on Invertebrate Paleontology,(T) Echinodermata 2 (1-3),(T) Echinodermata; Paleontological Institute, University of Kansas: Lawrence, KS, USA, 1978. [Google Scholar]
- Speel, J.A.; Dearborn, J.H. Comatulid Crinoids from R/V Eltanin Cruises in the Southern Ocean. Biol. Antarct. Seas XIII 1983, 38, 1–60. [Google Scholar]
- Leray, M.; Knowlton, N. Censusing Marine Eukaryotic Diversity in the Twenty-First Century. Philos. Trans. R. Soc. B Biol. Sci. 2016, 371, 20150331. [Google Scholar] [CrossRef] [PubMed]
- Ronquist, F.; Huelsenbeck, J.P. MrBayes 3: Bayesian Phylogenetic Inference under Mixed Models. Bioinformatics 2003, 19, 1572–1574. [Google Scholar] [CrossRef] [PubMed]
- Huelsenbeck, J.P.; Ronquist, F. MRBAYES: Bayesian Inference of Phylogenetic Trees. Bioinformatics 2001, 17, 754–755. [Google Scholar] [CrossRef] [PubMed]
- Meyer, C.P.; Paulay, G. DNA Barcoding: Error Rates Based on Comprehensive Sampling. PLoS Biol. 2005, 3, e422. [Google Scholar] [CrossRef] [PubMed]
- Hebert, P.D.; Ratnasingham, S.; De Waard, J.R. Barcoding Animal Life: Cytochrome c Oxidase Subunit 1 Divergences among Closely Related Species. Proc. R. Soc. London. Ser. B Biol. Sci. 2003, 270, S96–S99. [Google Scholar] [CrossRef] [PubMed]
- Ratnasingham, S.; Hebert, P.D. A DNA-Based Registry for All Animal Species: The Barcode Index Number (BIN) System. PLoS ONE 2013, 8, e66213. [Google Scholar] [CrossRef] [PubMed]
- Fujisawa, T.; Barraclough, T.G. Delimiting Species Using Single-Locus Data and the Generalized Mixed Yule Coalescent Approach: A Revised Method and Evaluation on Simulated Data Sets. Syst. Biol. 2013, 62, 707–724. [Google Scholar] [CrossRef] [PubMed]
- Fujita, M.K.; Leaché, A.D.; Burbrink, F.T.; McGuire, J.A.; Moritz, C. Coalescent-Based Species Delimitation in an Integrative Taxonomy. Trends Ecol. Evol. 2012, 27, 480–488. [Google Scholar] [CrossRef] [PubMed]
- Leavitt, S.D.; Moreau, C.S.; Thorsten Lumbsch, H. The Dynamic Discipline of Species Delimitation: Progress toward Effectively Recognizing Species Boundaries in Natural Populations. In Recent Advances in Lichenology; Springer: Berlin/Heidelberg, Germany, 2015; pp. 11–44. [Google Scholar]
- Zhang, J.; Kapli, P.; Pavlidis, P.; Stamatakis, A. A General Species Delimitation Method with Applications to Phylogenetic Placements. Bioinformatics 2013, 29, 2869–2876. [Google Scholar] [CrossRef]
- Markmann, M.; Tautz, D. Reverse Taxonomy: An Approach towards Determining the Diversity of Meiobenthic Organisms Based on Ribosomal RNA Signature Sequences. Philos. Trans. R. Soc. B Biol. Sci. 2005, 360, 1917–1924. [Google Scholar] [CrossRef]
- Michaloudi, E.; Papakostas, S.; Stamou, G.; Neděla, V.; Tihlaříková, E.; Zhang, W.; Declerck, S.A. Reverse Taxonomy Applied to the Brachionus Calyciflorus Cryptic Species Complex: Morphometric Analysis Confirms Species Delimitations Revealed by Molecular Phylogenetic Analysis and Allows the (Re) Description of Four Species. PLoS ONE 2018, 13, e0203168. [Google Scholar] [CrossRef]
- Appeltans, W.; Ahyong, S.T.; Anderson, G.; Angel, M.V.; Artois, T.; Bailly, N.; Bamber, R.; Barber, A.; Bartsch, I.; Berta, A. The Magnitude of Global Marine Species Diversity. Curr. Biol. 2012, 22, 2189–2202. [Google Scholar] [CrossRef]
- Scheffers, B.R.; Joppa, L.N.; Pimm, S.L.; Laurance, W.F. What We Know and Don’t Know about Earth’s Missing Biodiversity. Trends Ecol. Evol. 2012, 27, 501–510. [Google Scholar] [CrossRef]
- Ekrem, T.; Willassen, E.; Stur, E. A Comprehensive DNA Sequence Library Is Essential for Identification with DNA Barcodes. Mol. Phylogenetics Evol. 2007, 43, 530–542. [Google Scholar] [CrossRef]
- Puillandre, N.; Strong, E.E.; Bouchet, P.; Boisselier, M.C.; Couloux, A.; Samadi, S. Identifying Gastropod Spawn from DNA Barcodes: Possible but Not yet Practicable. Mol. Ecol. Resour. 2009, 9, 1311–1321. [Google Scholar] [CrossRef]
- Hajibabaei, M.; deWaard, J.R.; Ivanova, N.V.; Ratnasingham, S.; Dooh, R.T.; Kirk, S.L.; Mackie, P.M.; Hebert, P.D. Critical Factors for Assembling a High Volume of DNA Barcodes. Philos. Trans. R. Soc. B Biol. Sci. 2005, 360, 1959–1967. [Google Scholar] [CrossRef]
- Dayton, P.K. Toward an Understanding of Community Resilience and the Potential Effects of Enrichments to the Benthos at McMurdo Sound, Antarctica. In Proceedings of the Colloquium on Conservation Problems in Antarctica, Blacksberg, VA, USA, 10–12 September 1971; pp. 81–96. [Google Scholar]
- Dayton, P.K. Observations of growth, dispersal and population dynamics of some sponges in mcmurds sound, antarctica. Colloq. Int. Du CNRS 1979, 291, 271–282. [Google Scholar]
- Dayton, P.K. Interdecadal Variation in an Antarctic Sponge and Its Predators from Oceanographic Climate Shifts. Science 1989, 245, 1484–1486. [Google Scholar] [CrossRef]
- Dayton, P.K.; Robilliard, G.A.; Paine, R.T.; Dayton, L.B. Biological Accommodation in the Benthic Community at McMurdo Sound, Antarctica. Ecol. Monogr. 1974, 44, 105–128. [Google Scholar] [CrossRef]
- Dearborn, J.H. Foods and Feeding Characteristics of Antarctic Asteroids and Ophiuroids. Adapt. Within Antarct. Ecosyst. 1977, 293–326. [Google Scholar]
- Dearborn, J.H.; Edwards, K.C. Analysis of Data on the Feeding Biology of Antarctic Sea Stars and Brittle Stars. Antarct. J. United States 1985, 19, 138–139. [Google Scholar]
- McClintock, J.B. Investigation of the Relationship between Invertebrate Predation and Biochemical Composition, Energy Content, Spicule Armament and Toxicity of Benthic Sponges at McMurdo Sound, Antarctica. Mar. Biol. 1987, 94, 479–487. [Google Scholar] [CrossRef]


Disclaimer/Publisher’s Note: The statements, opinions and data contained in all publications are solely those of the individual author(s) and contributor(s) and not of MDPI and/or the editor(s). MDPI and/or the editor(s) disclaim responsibility for any injury to people or property resulting from any ideas, methods, instructions or products referred to in the content. |
© 2023 by the authors. Licensee MDPI, Basel, Switzerland. This article is an open access article distributed under the terms and conditions of the Creative Commons Attribution (CC BY) license (https://creativecommons.org/licenses/by/4.0/).