Article

Wild Plant Diversity and Soil Characteristics of Desert Roadside Vegetation in the Eastern Desert

1
Botany and Microbiology Department, Faculty of Science, South Valley University, Qena 83523, Egypt
2
Department of Biology, College of Sciences, Princess Nourah bint Abdulrahman University, P.O. Box 84428, Riyadh 11671, Saudi Arabia
3
Biology Department, Faculty of Science, King Abdulaziz University, P.O. Box 80200, Jeddah 21589, Saudi Arabia
*
Author to whom correspondence should be addressed.
Diversity 2023, 15(7), 874; https://doi.org/10.3390/d15070874
Submission received: 3 June 2023 / Revised: 16 July 2023 / Accepted: 18 July 2023 / Published: 20 July 2023
(This article belongs to the Special Issue Weed Ecology and Diversity)

Abstract

:
The wild vegetation of the Eastern Desert is characterized by openness and comprises perennials and ephemerals. The current study investigated the relationship between the edaphic factors of the natural vegetation along El Sheikh Fadl–Ras Gharib Road, Southwest Suez Gulf, in the northern sector of the Eastern Desert. The vegetation structure of the study area is relatively simple. The surveyed plants included 93 species from 22 families (51 perennials and 42 annuals). Asteraceae, Brassicaceae, Amaranthaceae, and Fabaceae were the richest families, constituting the majority of plant species (53.76%). Therophytes were the most frequent life forms. About 83.87% of the total flora were pluriregional elements of different affinities. Most of the recorded taxa occupied the Irano-Turanian/Mediterranean/Saharo-Sindian/Sudano-Zambezian chorotypes. The application of TWINSPAN classification resulted in grouping the vegetation into three main vegetation groups (A, B, and C), representing distinct microhabitats. The CCA ordination indicates diversity in vegetation group A. Group B was highly associated with Na, Mg, CaCO3, silt, clay, and C/N. Group C showed a high correlation with sand, K, and N. The differences in wild plant life forms, richness, and diversity along the studied desert roadsides, in association with the soil differences, provide a good indication of plant biodiversity.

1. Introduction

The desert ecosystem occupies approximately 95% of Egypt’s total area. The Eastern Desert of Egypt occupies the area extending from the Nile Valley eastward to the Gulf of Suez and the Red Sea, which is about 223,000 km2, i.e., 22.3% of the total area of Egypt. It is traversed by numerous canyonlike depressions (wadis) running to the Red Sea or the Nile Valley. It has a high backbone of high, rugged mountains running parallel to and a relatively short distance from the coast [1]. The inland part of the Eastern Desert of Egypt is divided into four main geomorphological and ecological regions, from north to south, and the Limestone Desert is the second region [2]. From the phytogeographical point of view, El Hadidi [3] divided the Eastern Desert of Egypt into two main sub-territories: the Galalah Desert, which includes Cairo–Suez, and the northern limestone plateau.
The desert vegetation is characterized by openness and is composed of a permanent framework of perennials, the interspaces of which may be occupied by ephemerals. Their duration depends on irregular rainfall and soil thickness [2]. The vegetation composition and plant distribution covering the northern inland part of the Egyptian Eastern Desert have been studied [4,5,6].
This ecosystem has unique and characteristic xerophytic vegetation that sustains the human population with essential goods and services. Despite these benefits, recent threats to its species and habitats have been recorded [7]. Anthropogenic activities are the cause of all the threats, in addition to the aridity of the climate. Desert degradation and fragmentation caused by human misuse and severe environmental changes are the major causes of the decline in global biodiversity and have become a critical environmental problem [8,9]. Therefore, restoring disturbed ecosystems in many areas is prioritized for biodiversity conservation and maintaining landscape productivity [10].
Egyptian deserts’ natural vegetation faces two categories of threats: The first includes the natural processes of drought, floods, storms, diseases, natural enemies (rodents and insects), and invasion of exotic species [11,12]. The second category includes man-mediated threats such as road construction. Seeds can adhere to car tires along roads, leading to the spread of exotic species and colonizing new areas [11,13]. All of these threats result in changes in habitat conditions with the subsequent alteration of vegetation structure, loss of natural habitats, and decline in floristic composition [14,15]. The construction of roads is one type of human impact on the deserts of the Middle East [16]. Therefore, these areas are severely subjected to human disturbance. Despite the wealth of studies on aspects of vegetation along roads in temperate regions, little is known about arid regions [17,18]. Likewise, some studies have dealt, to some extent, with roadside vegetation in deserts in Egypt [19,20,21].
We hypothesize that the harsh environmental conditions affect plant diversity and vegetation structure in El Sheikh Fadl–Ras Gharib Desert Road. Therefore, this study aimed to (1) survey the roadside wild plant diversity along El Sheikh Fadl–Ras Gharib road as a part of the Egyptian Eastern desert, (2) assess the soil factors that control the roadside vegetation, and (3) identify the regional plant communities and the reasons for the vegetation changes along this desert road.

2. Materials and Methods

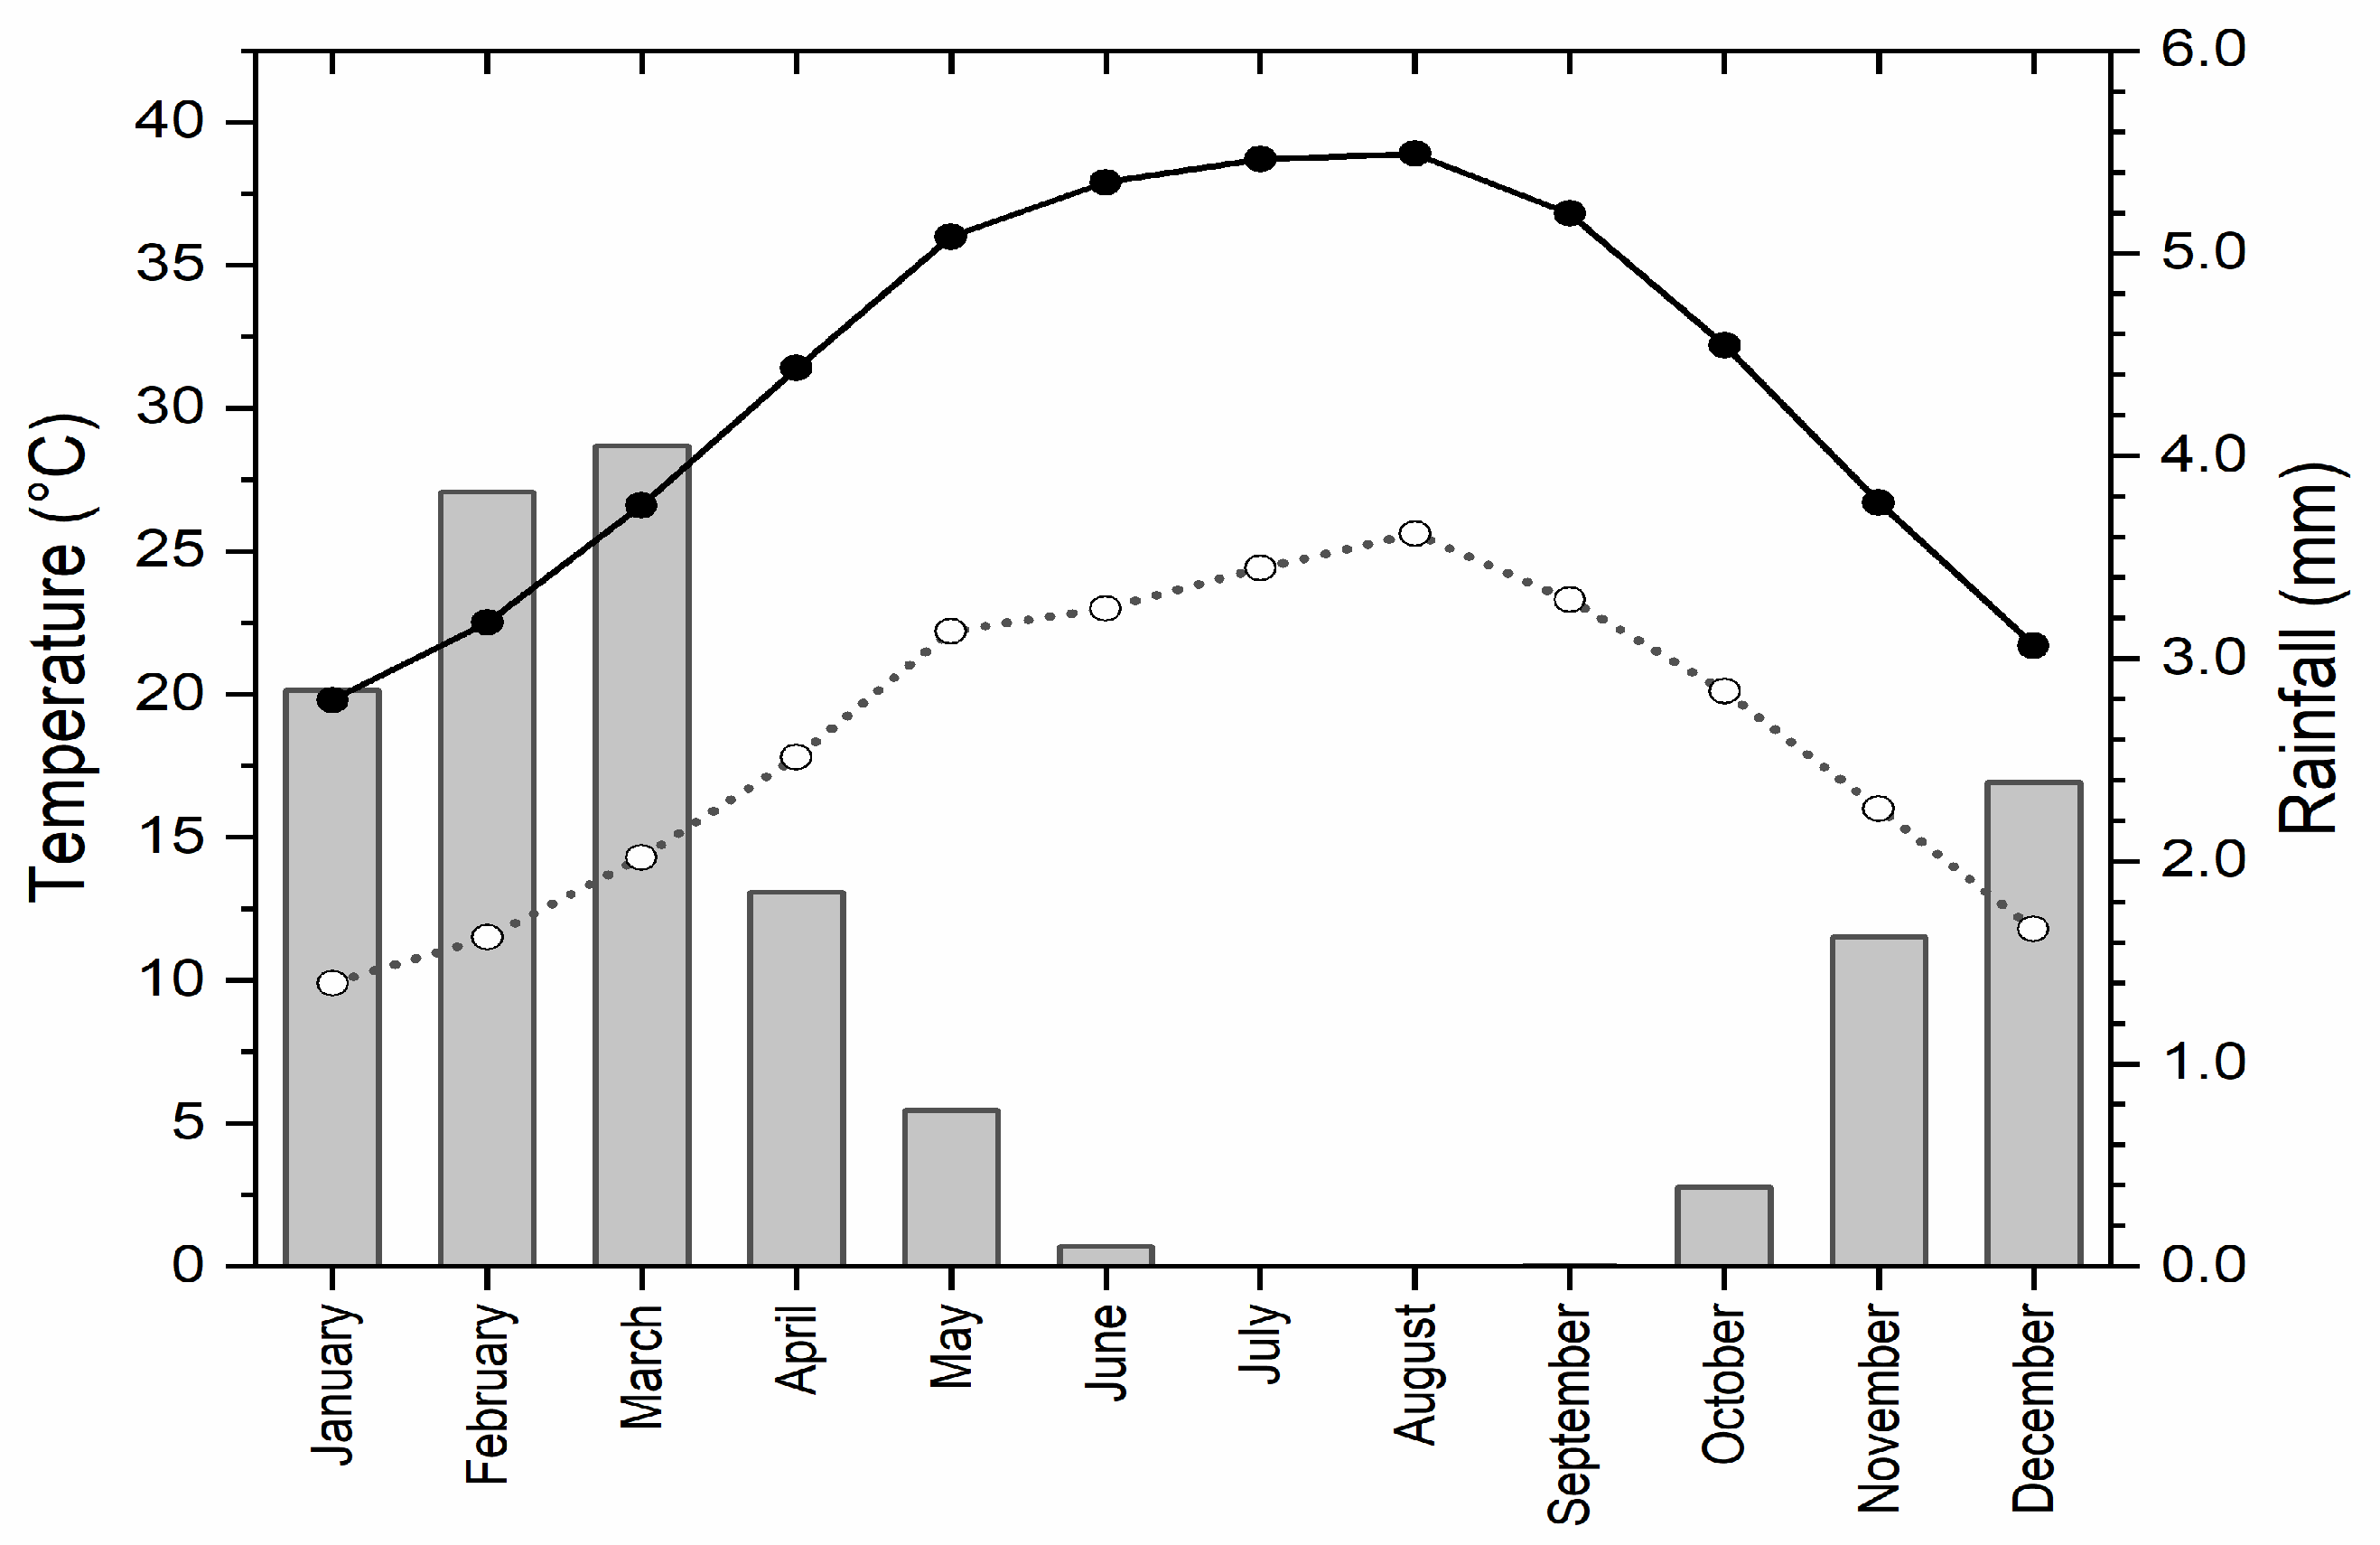
2.1. Site Description

This study was conducted on El Sheikh Fadl–Ras Gharib Road, Southwest Suez Gulf, in the northern sector of the Eastern Desert. The study area extends between 28°14′08.50″ and 28°26′08.40″ N and 32°41′24.30″ and 31°07′14.40″ E, with about a 224.45 km length (Figure 1).
The road crosses wadi El-Tarfa from the Red Sea coast in the east through the Eastern Desert in Egypt to the Nile Valley in the west. One of the most distinctive features of this road is the gravel desert, which represents a natural xeric habitat inhabited mainly by xerophytic vegetation.
Climatically, El Sheikh Fadl–Ras Gharib Road lies within a hyper-arid zone characterized by a mild winter and high daily temperature and evaporation rate [22]. The temperature is regular in seasonality, with a 26.37 °C average annual air temperature of ten years from 2013 to 2022. Winter months are cold, with a 9.90 °C minimum average air temperature in January, whereas the summer months are hot, with a 38.90 °C maximum average air temperature in August. The rainfall is scarce and sporadic and usually cascades during the winter and is due to random cloudbursts, a general feature in arid deserts [19], with an average annual precipitation of 1.69 mm/year, with a ten-year monthly mean fluctuating between 2.70 mm in December and 3.83 mm in March. However, the area may be subjected to occasional heavy rainstorms that cause dangerous flash flooding, resulting in enriching the vegetation of some dry sites on this road. The wind velocity ranges between 9.30 km·h−1 to 22.70 km·h−1 (Umm El Sas Meteorological Station; 28°30′09.00″ N, 30°44′10.0″ E) (Figure 2).

2.2. Vegetation Sampling and Species Identification

The fieldwork was conducted in March 2021 after a rainy season, where the precipitation was 6.90 mm, 0.30 mm, and 5.80 mm in November 2020, December 2020, and February 2021, respectively. We sampled 17 geo-referenced vegetation stands (relevés), which were found to be reasonable to represent the vegetation of the area. A total of 110 plots (each of 10 × 10 m) were randomly chosen in the selected stands (Figure 1), whenever much vegetation cover was encountered, according to the relevé method [23].
Plant taxa were collected and identified by the fifth and sixth authors (M. O. Badry and A. K. Osman) and named according to the available literature [24,25,26,27,28]. The taxonomic names were updated according to Plants Of The World Online [29] provided by the Royal Botanic Gardens, Kew. Growth forms of the surveyed taxa and life-form categories and their life spans were identified [30,31]. Phytogeographical affinities of the surveyed plant taxa were defined [32]. Specimens were dried, and vouchers were deposited in the herbarium of the Botany and Microbiology Department, Faculty of Science, South Valley University, Egypt.

2.3. Soil Sampling and Analyses

Two soil samples were collected at different profiles (0–25 and 25–50 cm) from randomly selected points of each relevé. The collected samples from the same site were mixed into one composite piece to analyze a given profile. Soil samples were air-dried at 105 °C in a forced-air oven for 24 to 72 h, homogenized, and passed through a 2 mm sieve to remove gravel. Soil texture was determined using the pipette method, providing quantitative data on the percentage of clay, sand, and silt [33]. The organic matter content was estimated by computing the weight loss after igniting at 600 °C for 3 h [34]. The determination of electric conductivity and pH was conducted in soil–water (1:5) extracts by the method adopted by Jackson [35]. Soil cation elements were determined. Sodium and potassium were determined by the flame emission photometry technique [36]. Calcium and magnesium were determined volumetrically by the versine titration method [37]. The analyses of soil anions included the determination of total carbonates (CO3) and bicarbonates (HCO3) by titration using 0.01N HCl [38], chlorides (Cl) determined volumetrically by precipitation as AgCl [35], sulfates (SO4) estimated by turbidimetry as BaSO4 using a colorimeter [39], and nitrates (NO3) determined spectrophotometrically by sodium salicylate [40]. Total nitrogen was determined according to Bremner [41].

2.4. Data Analysis

Classification and ordination methods were applied as multivariate analysis techniques to evaluate El Sheikh Fadl–Ras Gharib Road vegetation using presence/absence data matrices. Two-Way Indicator Species Analysis (TWINSPAN) was used to classify the floristic data matrix into vegetation groups with similar species abundance patterns using the computer program CAP for Windows (community analysis package, version 1.2) [42]. The cut-off level of ‘pseudo-species’ followed the software’s default state (one cut level set at 0). The radio box was set to Pres/Abs as the working data were presence–absence, comprising 1 s and 0 s. The maximum number of indicators was 5 per division. The maximum level of divisions was 6. The minimum group size was set to 5 per division. The relative weighting given to each pseudo-species cut level was 1 s. The indicator levels were set to all cut levels. With the minimum variance as an algorithm, a dendrogram was elaborated. The species were clustered based on the classification of the samples, following a divisive hierarchical clustering of sites. The species richness (alpha-diversity) within each TWINSPAN vegetation group was calculated as the average number of species per site, and species turnover (beta-diversity) as the ratio between the total species recorded in a certain vegetation cluster and its alpha-diversity [43]. Detrended correspondence analysis (DCA), an indirect ordination technique, was used to describe changes in the vegetation along the environmental gradients, such as altitude, water zone proximity, and soil variables [44]. Canonical correspondence analysis (CCA) was performed to depict the correlations between vegetation groups and environmental data by the CANOCO program version 4.5, using species cover, stands, and soil as variables [45]. Pearson’s linear correlation coefficient (r) was used to assess the relationship of the measured edaphic variables among the vegetation assemblages using the IBM SPSS Statistics Version-20 (IBM Corp. in Armonk, NY, USA) [46].

3. Results

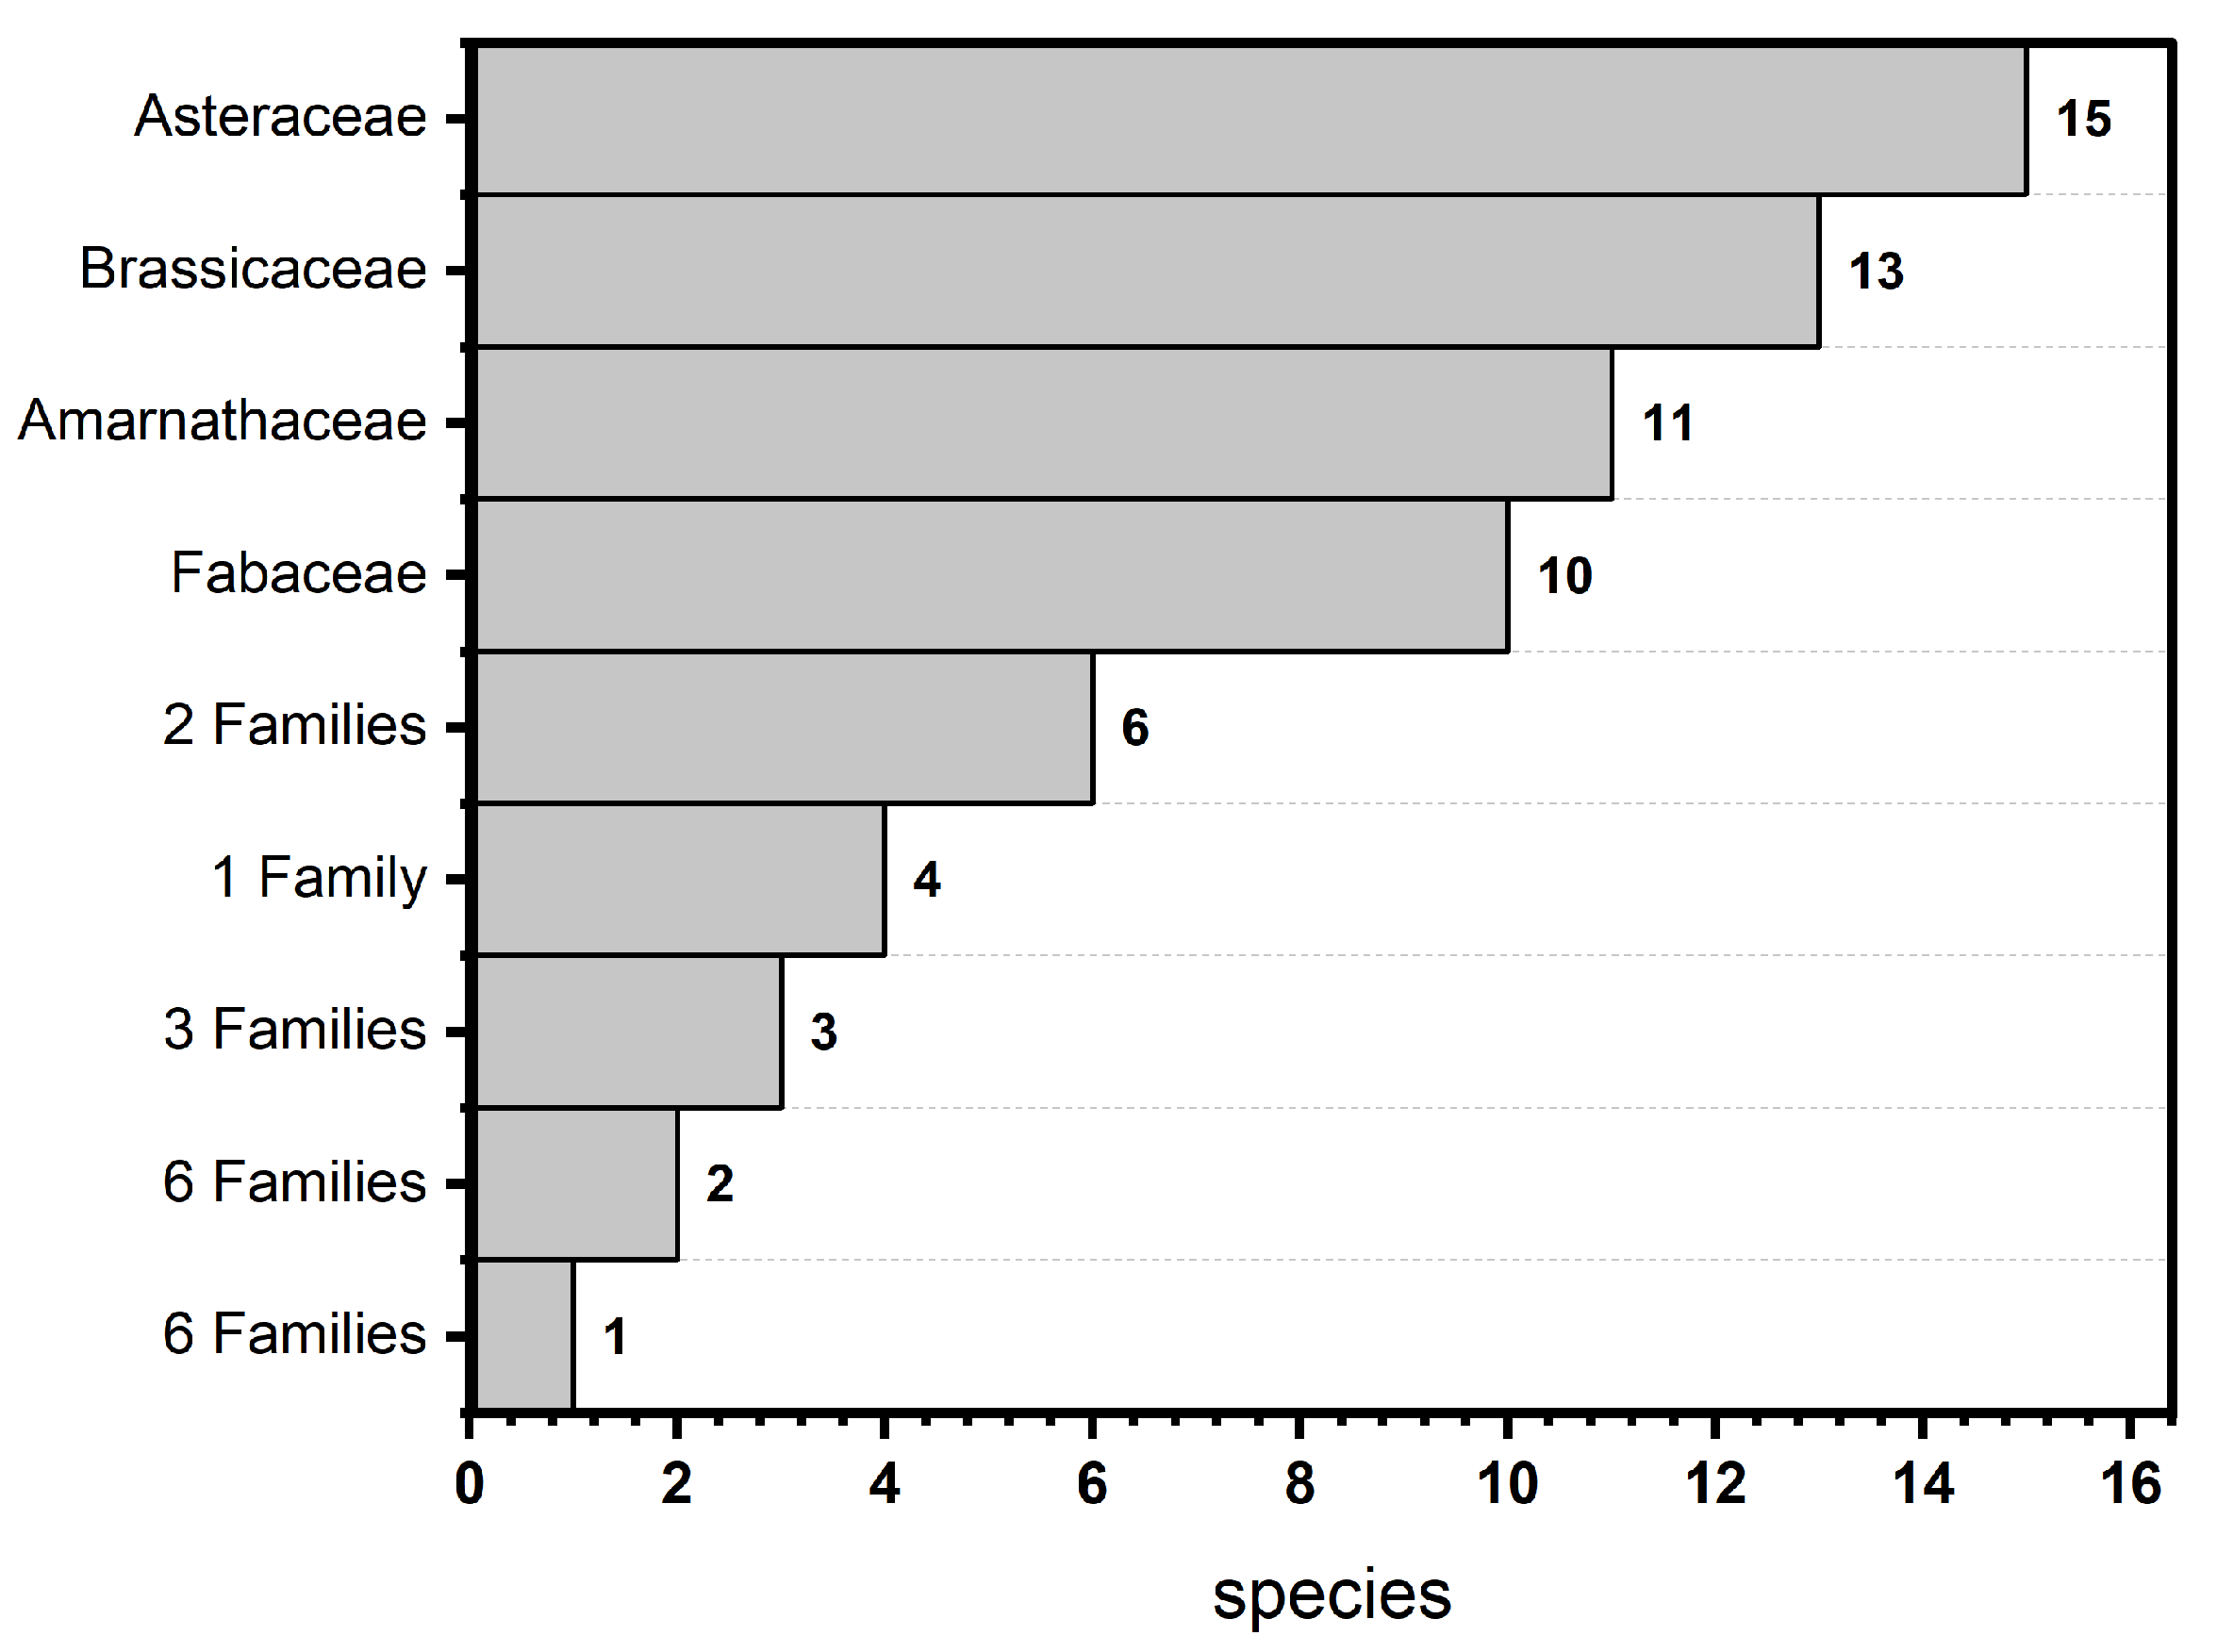
3.1. Floristic Composition

A total of 93 taxa of flowering plants were recorded from the study area, belonging to 63 genera in 22 families. Dicots were represented by 21 families and 87 taxa (93.55%), while monocots were represented by 1 family and by 6 taxa, representing 6.45% of the survey.
Asteraceae (17.20%), Brassicaceae (13.98), Amaranthaceae (11.83%), and Fabaceae (10.75%) were the most species-rich families (Figure 3, Appendix A).
Poaceae and Zygophyllaceae were represented by six taxa each (6.45%), while Resedaceae was represented by four species (4.30%). Three families were represented by three species each (3.23%). Meanwhile, six families were represented by two species (2.15%). On the other hand, six families were poorly represented, having one species each (1.08%). The largest families in terms of the number of genera were Asteraceae (11 genera), Brassicaceae (10 genera), and Amaranthaceae (8 genera). The most common genera with a larger number of species were Astragalus L. and Zygophyllum L., with five species each (5.38%), and Launaea Cass., Diplotaxis DC., Lotus L., Reseda Tourn. ex L., and Tamarix L. with three species each (3.23%). At the same time, 11 genera were represented by 2 species (2.15%). On the other hand, 45 genera were monotypic, having 1 species each (1.08%).
The surveyed plants along El Sheikh Fadl–Ras Gharib Road included 51 perennials (54.84%) and 42 annuals (45.16%), classified into 6 types of growth forms and represented by 2 trees (2.15%), 9 shrubs (9.68%), 26 subshrubs (27.96%), 1 liana (1.08%), 1 reed (1.08%) and 54 herbaceous (58.06%) species of plants (Appendix A).

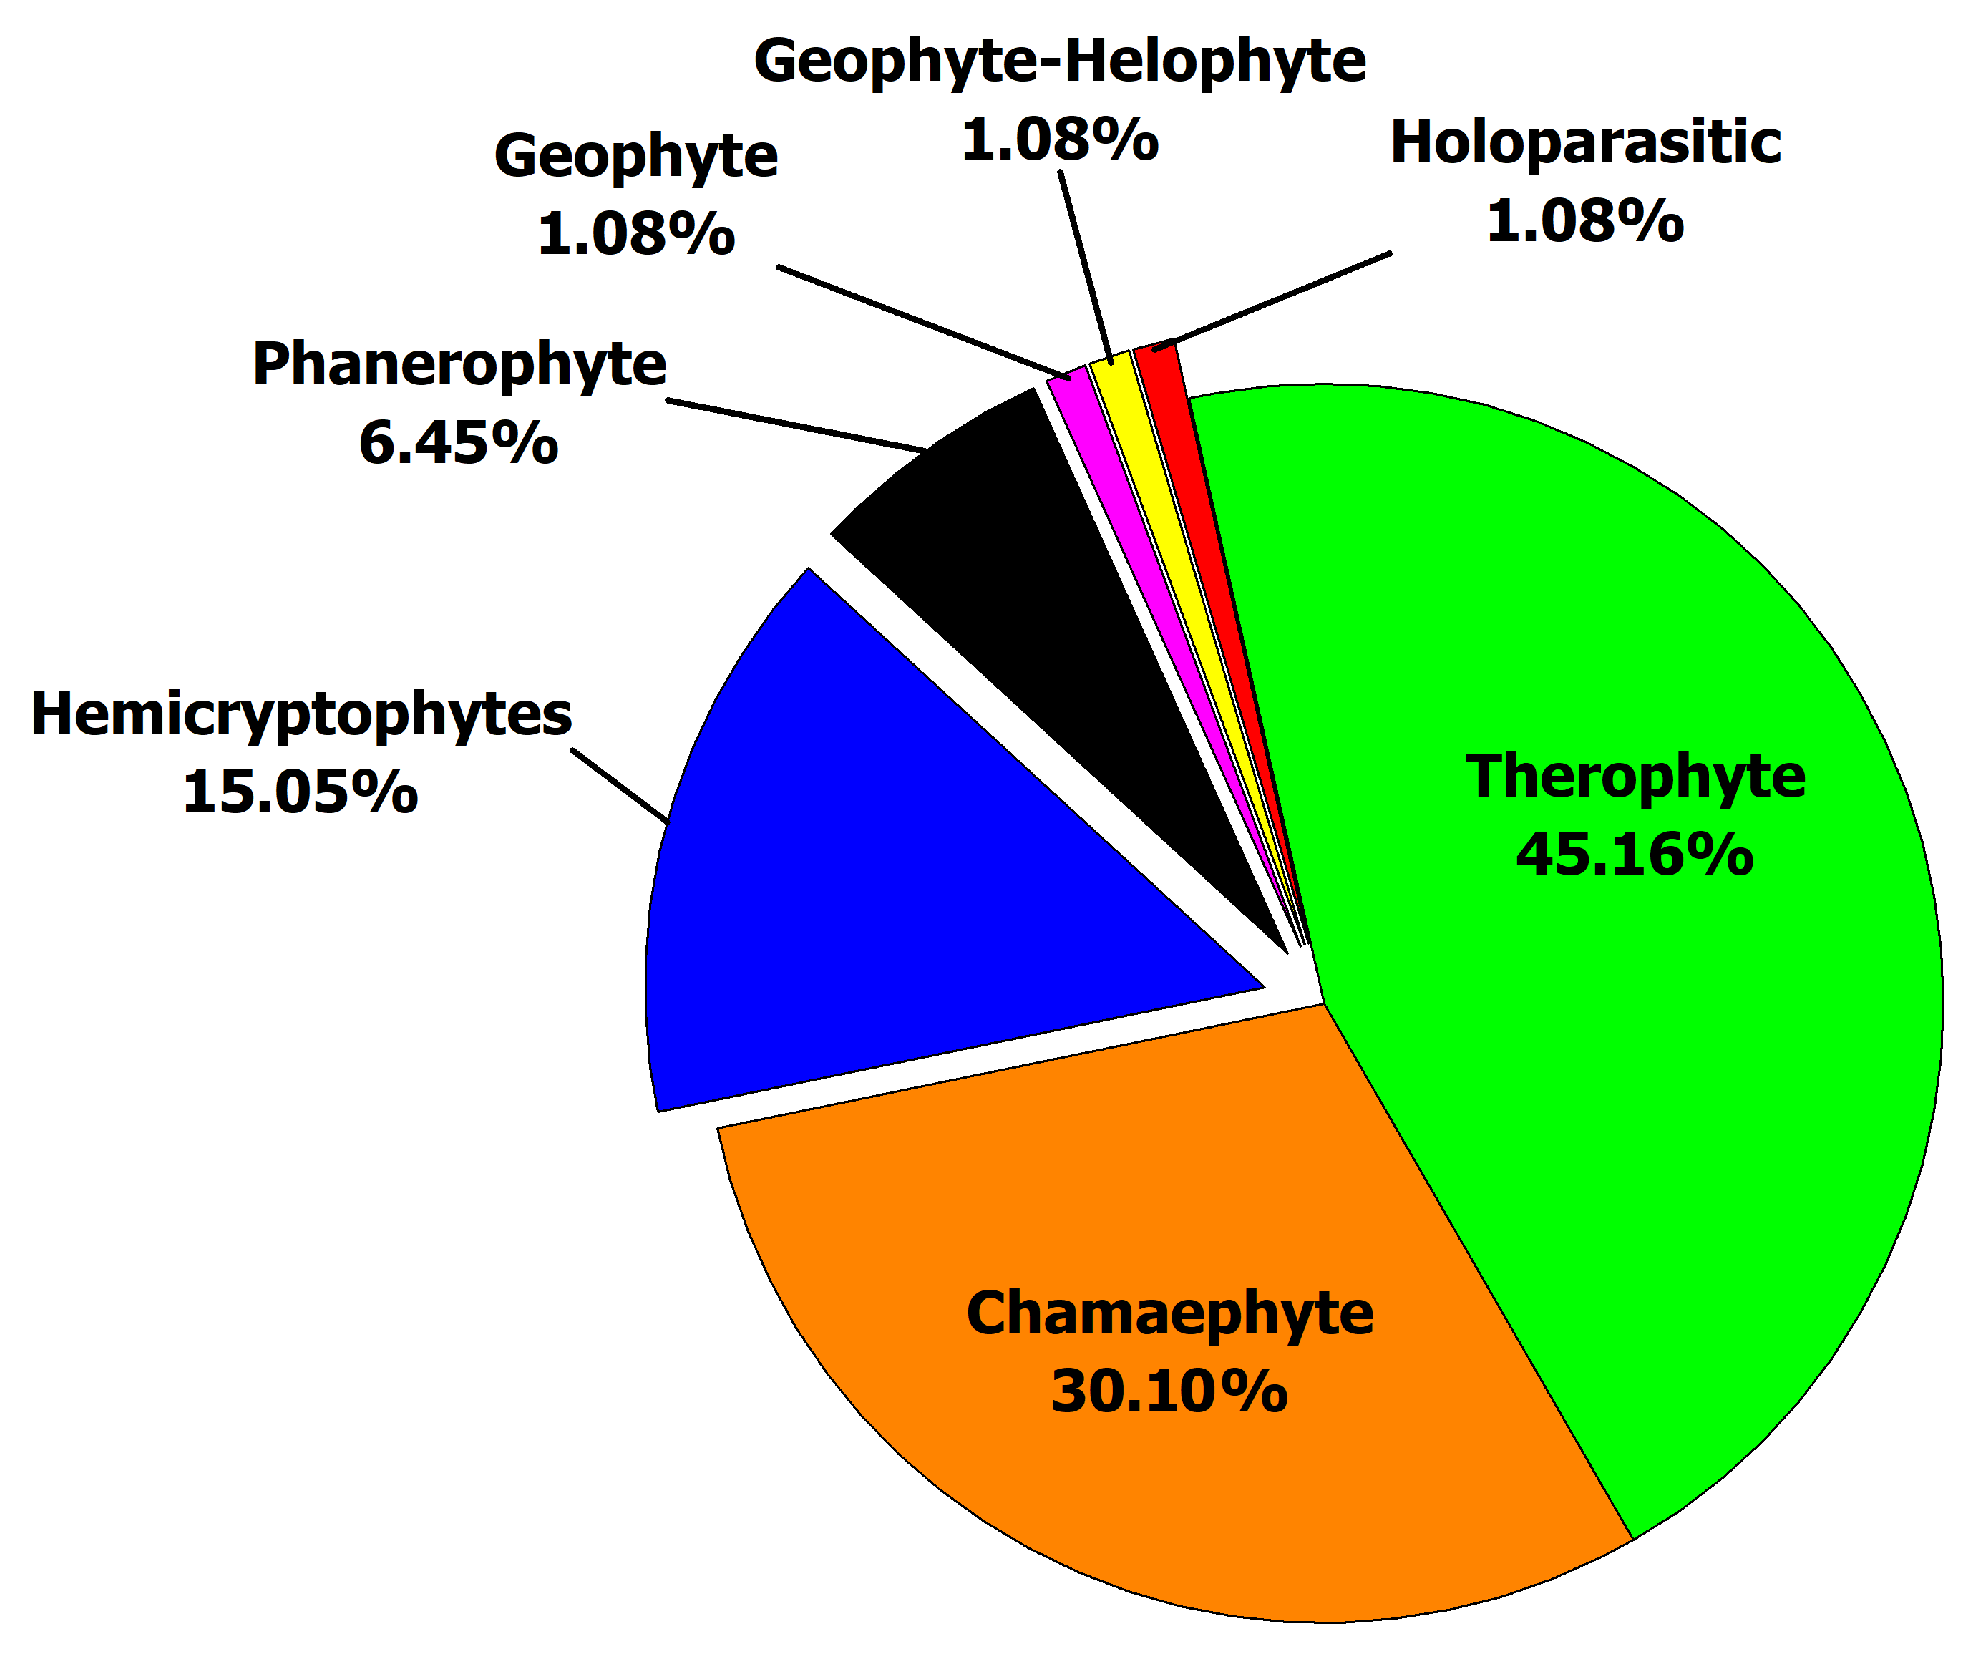
3.2. Life-Form Spectra

Seven life-form classes were recorded in the present study. Therophytes were the most frequent life-form (42 taxa), followed by Chamaephytes (28 taxa), Hemicryptophytes (14 taxa), and Phanerophytes (6 taxa), while three life-forms were represented by single species each: Holoparasitic, (Cistanche phelypaea (L.) Cout.), Geophytes (Cynodon dactylon (L.) Pers.), and Geophytes–Helophytes (Phragmites australis (Cav.) Trin. ex Steud.) (Figure 4, Table S1).

3.3. Chorological Affinities

The chorological analysis of the surveyed flora classified the 93 plant taxa recoded into three major phytogeographical groups: monoregional, biregional, and pluriregional. Seventy-eight taxa (83.87% of the total flora) were pluriregional elements of different affinities. These pluriregional taxa fell under 14 main chorotypes, of which 46 taxa represented the Irano-Turanian/Mediterranean/Saharo-Sindian/Sudano-Zambezian chorotypes (49.46% of the total flora), and 13 taxa represented the Irano-Turanian/Mediterranean/Saharo-Sindian chorotypes (13.97% of the total flora). The biregional elements fell under 3 main chorotypes, represented by 11 taxa (11.83% of the total flora). In contrast, the monoregional chorotype (pure Saharo-Sindian) was rarely represented in the study area, with only one species (Matthiola arabica Boiss.) forming 1.08% of the total number of plant species surveyed. On the other hand, the Cosmopolitan and Palaeotropical chorotypes were represented by three species (3.22%) (Figure 5, Table S2).

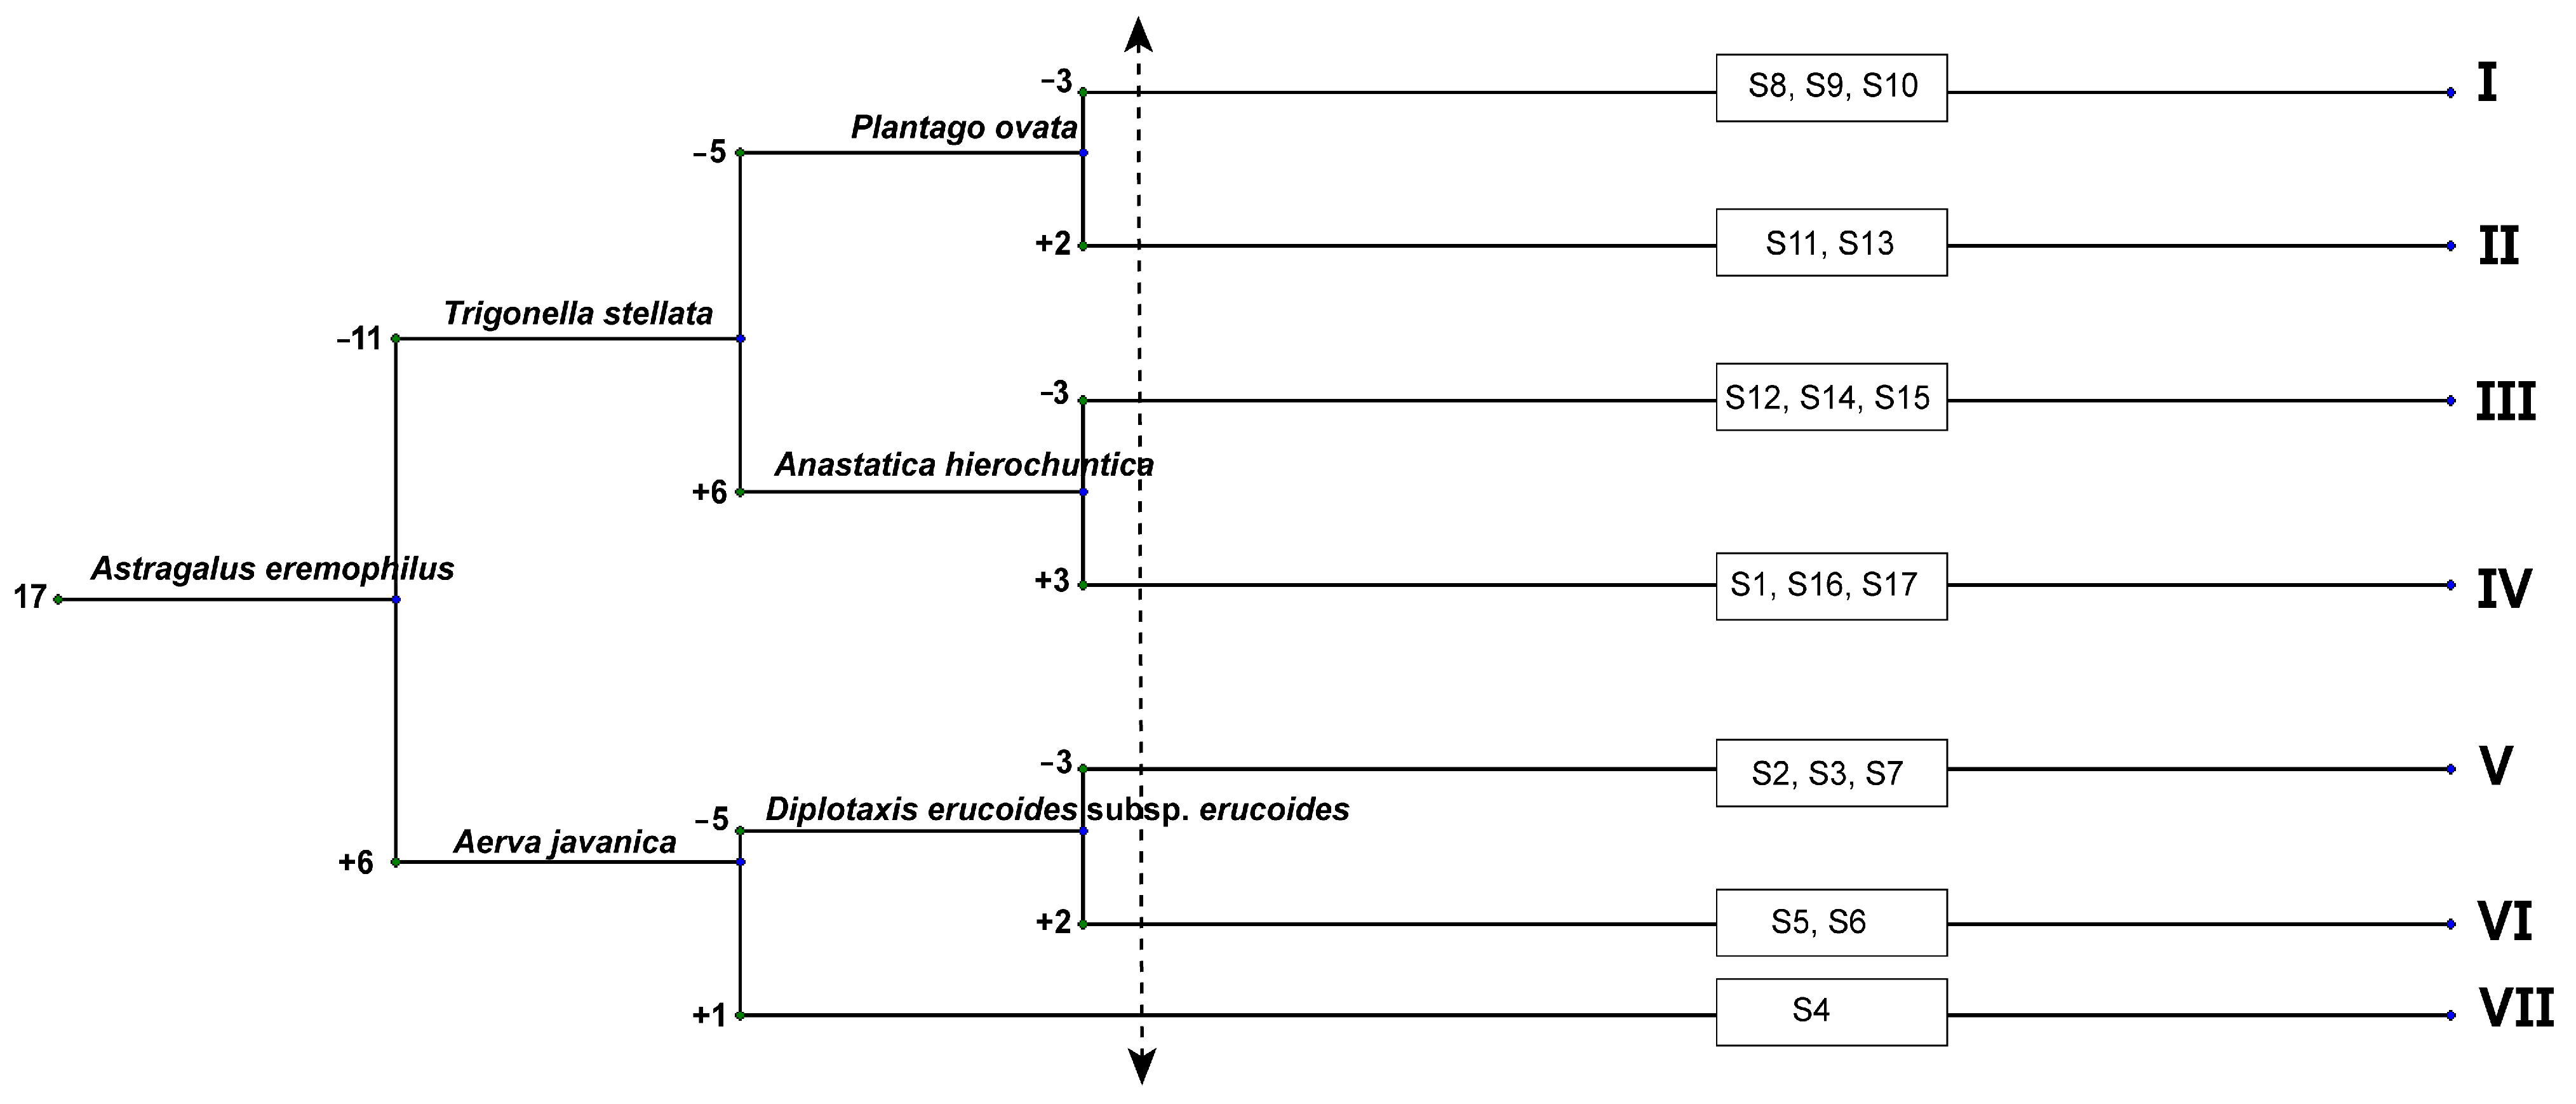
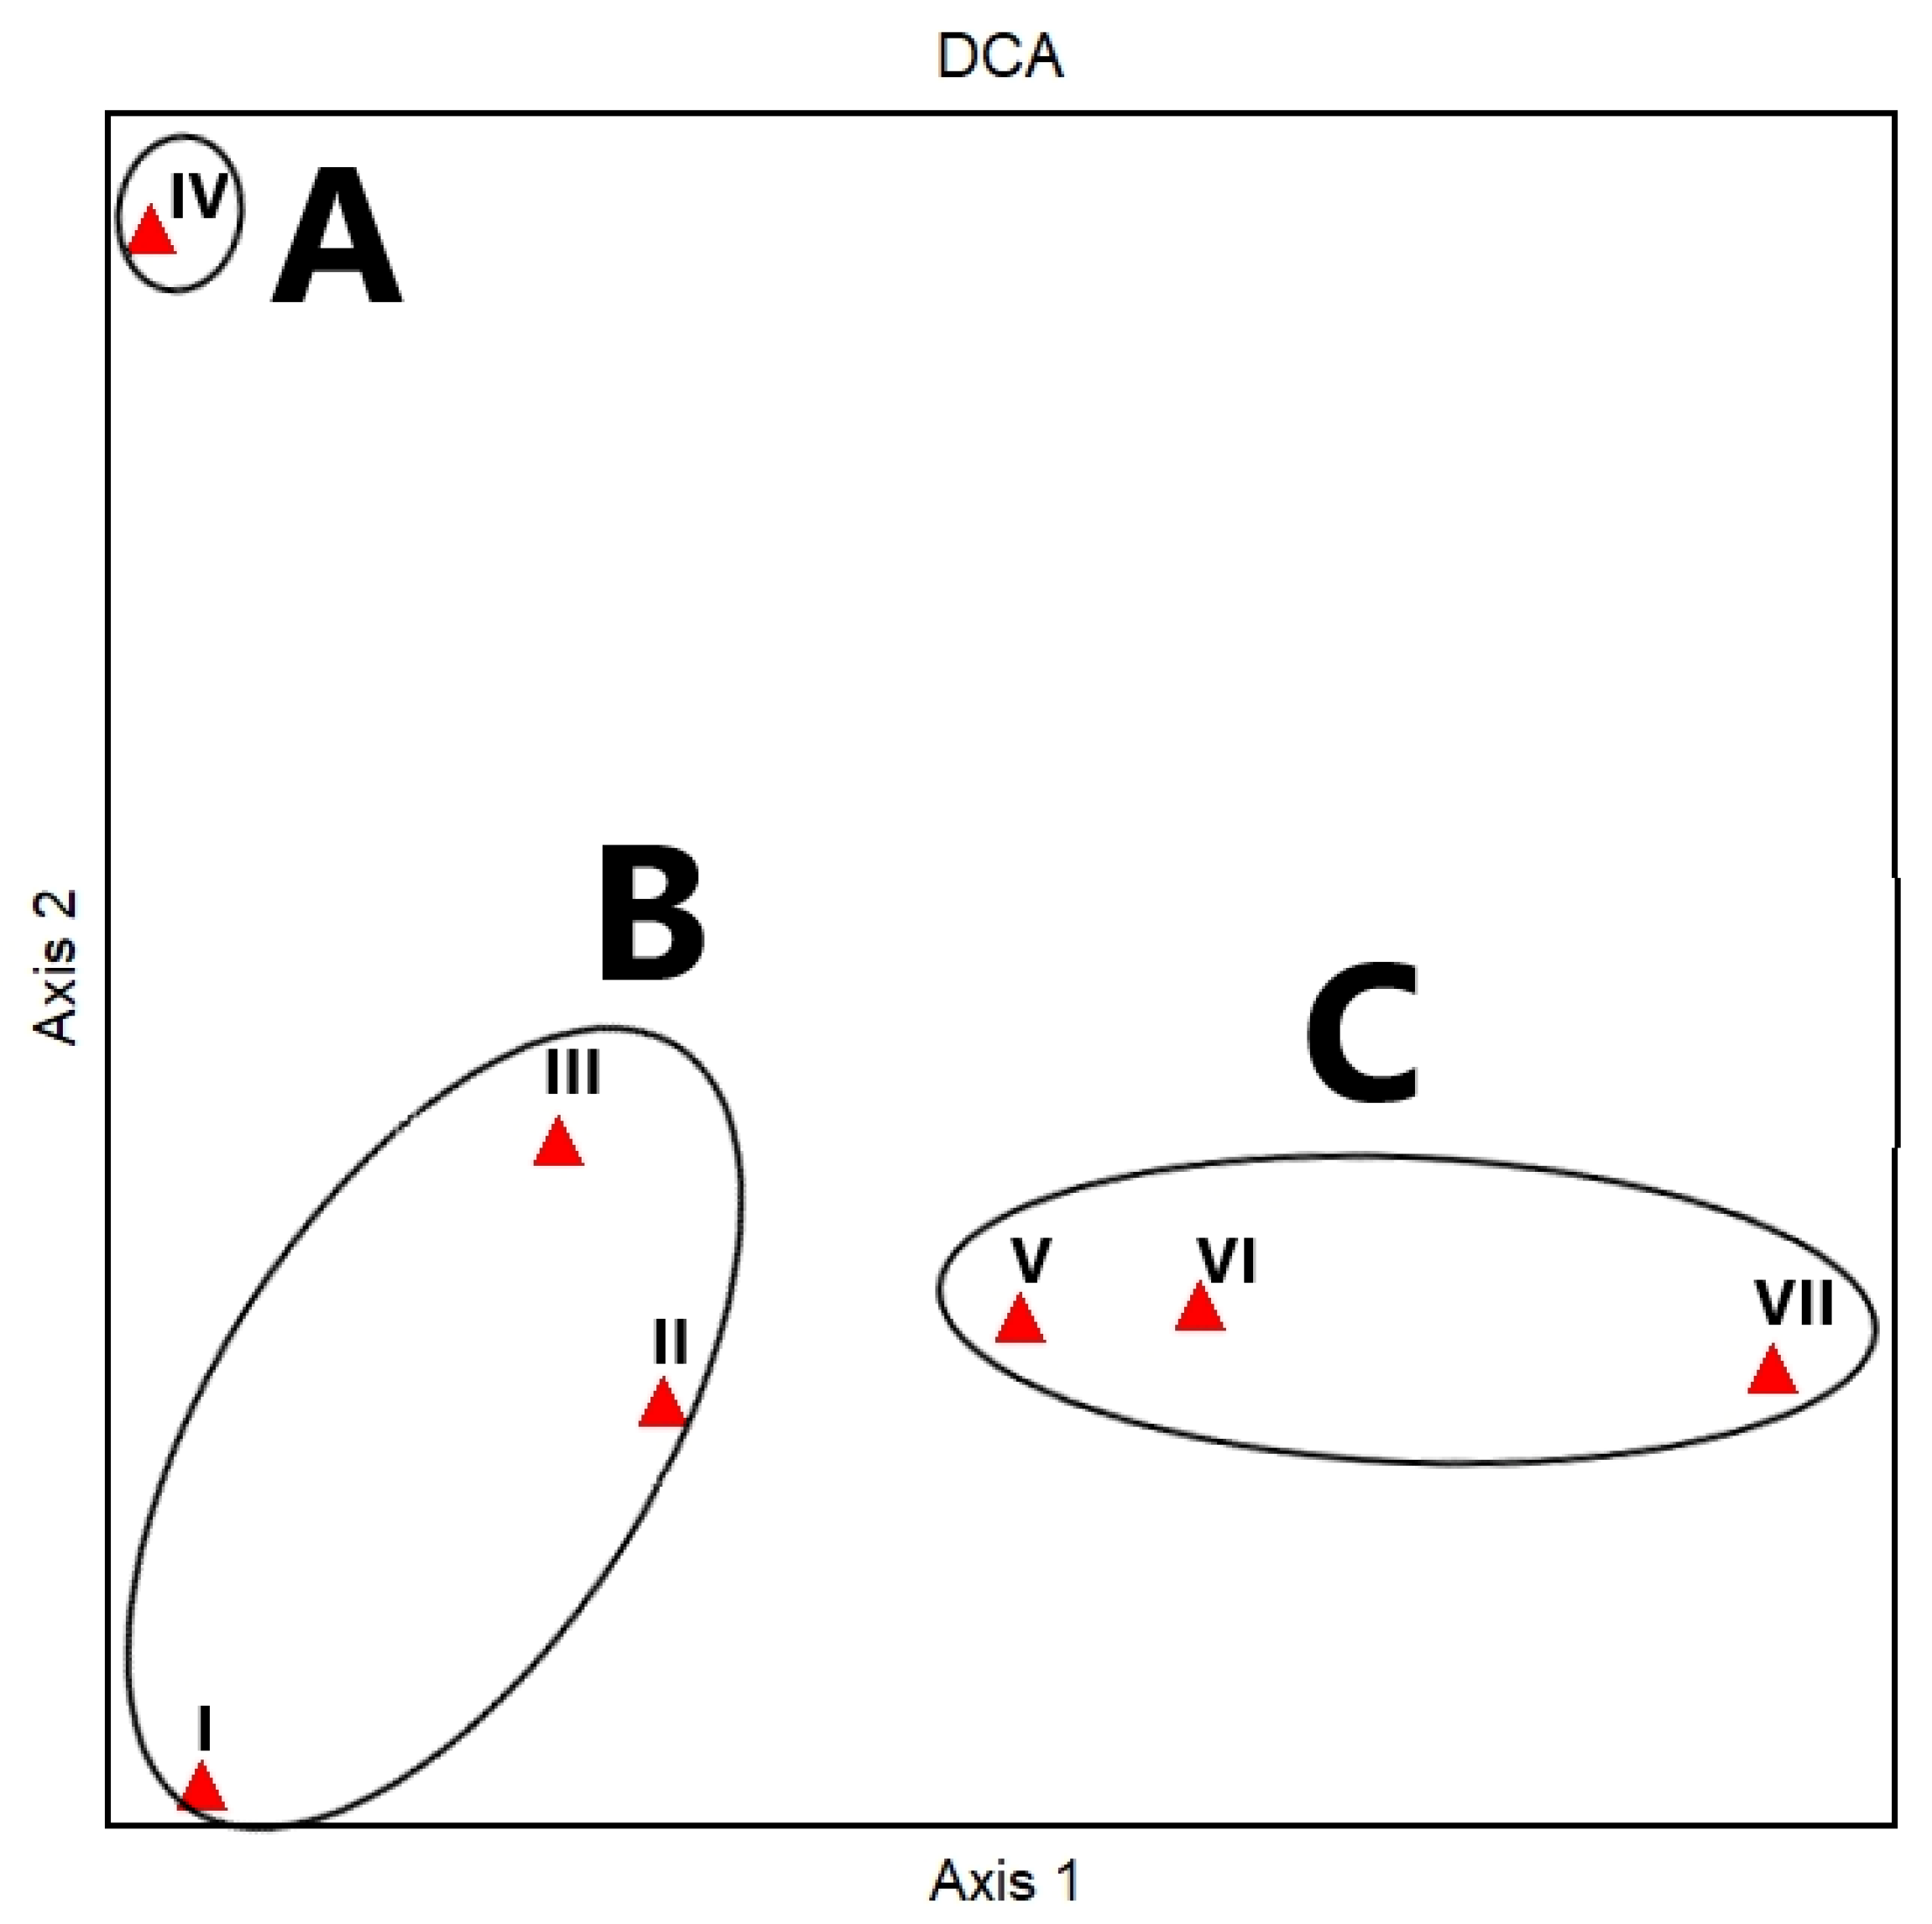
3.4. Vegetation Analysis

The application of the TWINSPAN classification to the 93 species recorded in the 17 stands representing the study area of El Sheikh Fadl–Ras Gharib Road resulted in grouping the vegetation into 7 clusters at level three of the hierarchical classification (Figure 6). The vegetation clusters were characterized and named after the dominant and subdominant species as follows: (I) Halocnemum strobilaceum–Zilla spinosa; (II) Diplotaxis acris–Diplotaxis harra–Centaurea aegyptiaca; (III) Anastatica hierochuntica–Ochradenus baccatus–Rumex vesicarius; (IV) Caroxylon imbricatum–Ochradenus baccatus; (V) Artemisia judaica–Astragalus eremophilus–Atriplex turcomanica; (VI) Matthiola longipetala–Reseda pruinosa–Tamarix aphylla; (VII) Taverniera aegyptiaca–Trichodesma africanum. These clusters were aggregated into three main groups (GA, GB, and GC).
Group A was the smallest among the separated vegetation groups. It comprised one cluster IV with three stands at the study area’s beginning and end (S1, S16, and S17). It included 21 recorded species and was characterized by the lowest species richness (10 species/stands) and highest species turnover (2.10). The soils of this group were rich in Ca, K, total N, and SO4, and recorded the highest TDS and EC (Table 1). The dominant species included Caroxylon imbricatum, Ochradenus baccatus (P% = 100), Tamarix nilotica, Zygophyllum indicum, Z. coccineum, Zilla spinosa and Diplotaxis acris (P% = 66.67).
Group B comprised three clusters (I, II, and III) including eight stands. Cluster I consisted of 3 stands and 44 species with a species richness of 27 and species turnover of 1.63. Cluster II consisted of 2 stands with 32 species (species richness 24.50 and turnover 1.31). Cluster III consisted of 3 stands recording 28 species; the species richness was 18.33 and species turnover was 1.53.
In this group, the soil recorded the highest Na, Mg, OM, C/N, CaCO3, pH, clay, and silt (Table 1). The dominant species were Rumex vesicarius, Z. spinosa (P% = 100), T. nilotica, and Z. coccineum (P% = 87.50).
Group C was located near Ras Gharib and comprised three clusters (V, VI, VII) and six stands. Cluster V included 3 stands recording 41 species (sp. richness = 26; sp. turnover = 1.58), while cluster VI comprised 2 stands with 32 recorded species (sp. richness = 24.00 and turnover = 1.33). Cluster VII had only 1 stand with 33 species (sp. richness = 33.00 and turnover = 1.00) and high values in the sand; Cl characterized this group’s soil. The dominant species were Z. coccineum, Z. simplex, Trichodesma africanum, Tamarix aphylla, Astragalus eremophilus, and Artemisia judaica (P% = 100).
The application of a DCA analysis supported the separation among the vegetation clusters (Figure 7). A distinct pattern along the gradient of DCA axes 1 and 2 (eigenvalues = 0.38 and 0.19 and cumulative percentage variance of species data = 19.30 and 29 for axes 1 and 2, respectively) indicated the relationships between the environmental gradients (proximity from water) and topographic aspects of El Sheikh Fadl–Ras Gharib Road. The TWINSPAN clusters were aggregated into three main vegetation groups, which depicted a distinct microhabitat. Group A was located at the top left part of the DCA diagram and consisted of cluster IV. Group B was segregated at the lower left part and comprised three clusters—I, II, and III—while group C included three clusters—V, VI, and VII—ordered along the gradient of DCA axis 1.
Likewise, the CCA scatter plot aggregated the seven TWINSPAN clusters into three main floristic groups (Figure 8). The length and the direction of an arrow representing a given environmental variable indicate the importance and direction of the gradient of environmental change for that variable within the set of samples measured. The cumulative percentage variance of species–environment relations for the four axes amounted to 21.5, 36.2, 46.8, and 56.2%, which suggests a strong association between vegetation and the measured parameters presented in the biplot [47]. The separation of these groups along CCA axis 1 was strongly positively affected by Na, K, Mg, PO4, SO3, and CO3, and negatively by Ca, HCO3, Cl, OM, pH, EC, and salinity. On the other hand, the separation of floristic groups along CCA axis 2 was positively correlated with Ca, Na, SO3, PO4, HCO3, OM, pH, and EC, and negatively with K, Mg, Cl, CO3, and salinity. The stands of group A were highly associated with Ca, EC, and SO4. In comparison, the stands of group B were highly associated with Na, Mg, CaCO3, silt, clay, and C/N. The stands of group C showed a high correlation with sand, K, and N.
The correlation coefficient (r) between the different soil variables in the sampled stands is shown in Table 2. CaCO3 showed a significant negative correlation with axis 1, while Ca ions were significantly positively correlated with axis 2. It was found that some soil variables were significantly positively correlated with other soil variables, such as OM with Na and Cl, and negatively with sand. In contrast, the TDS fraction was significantly correlated with Ca and SO4 ions.

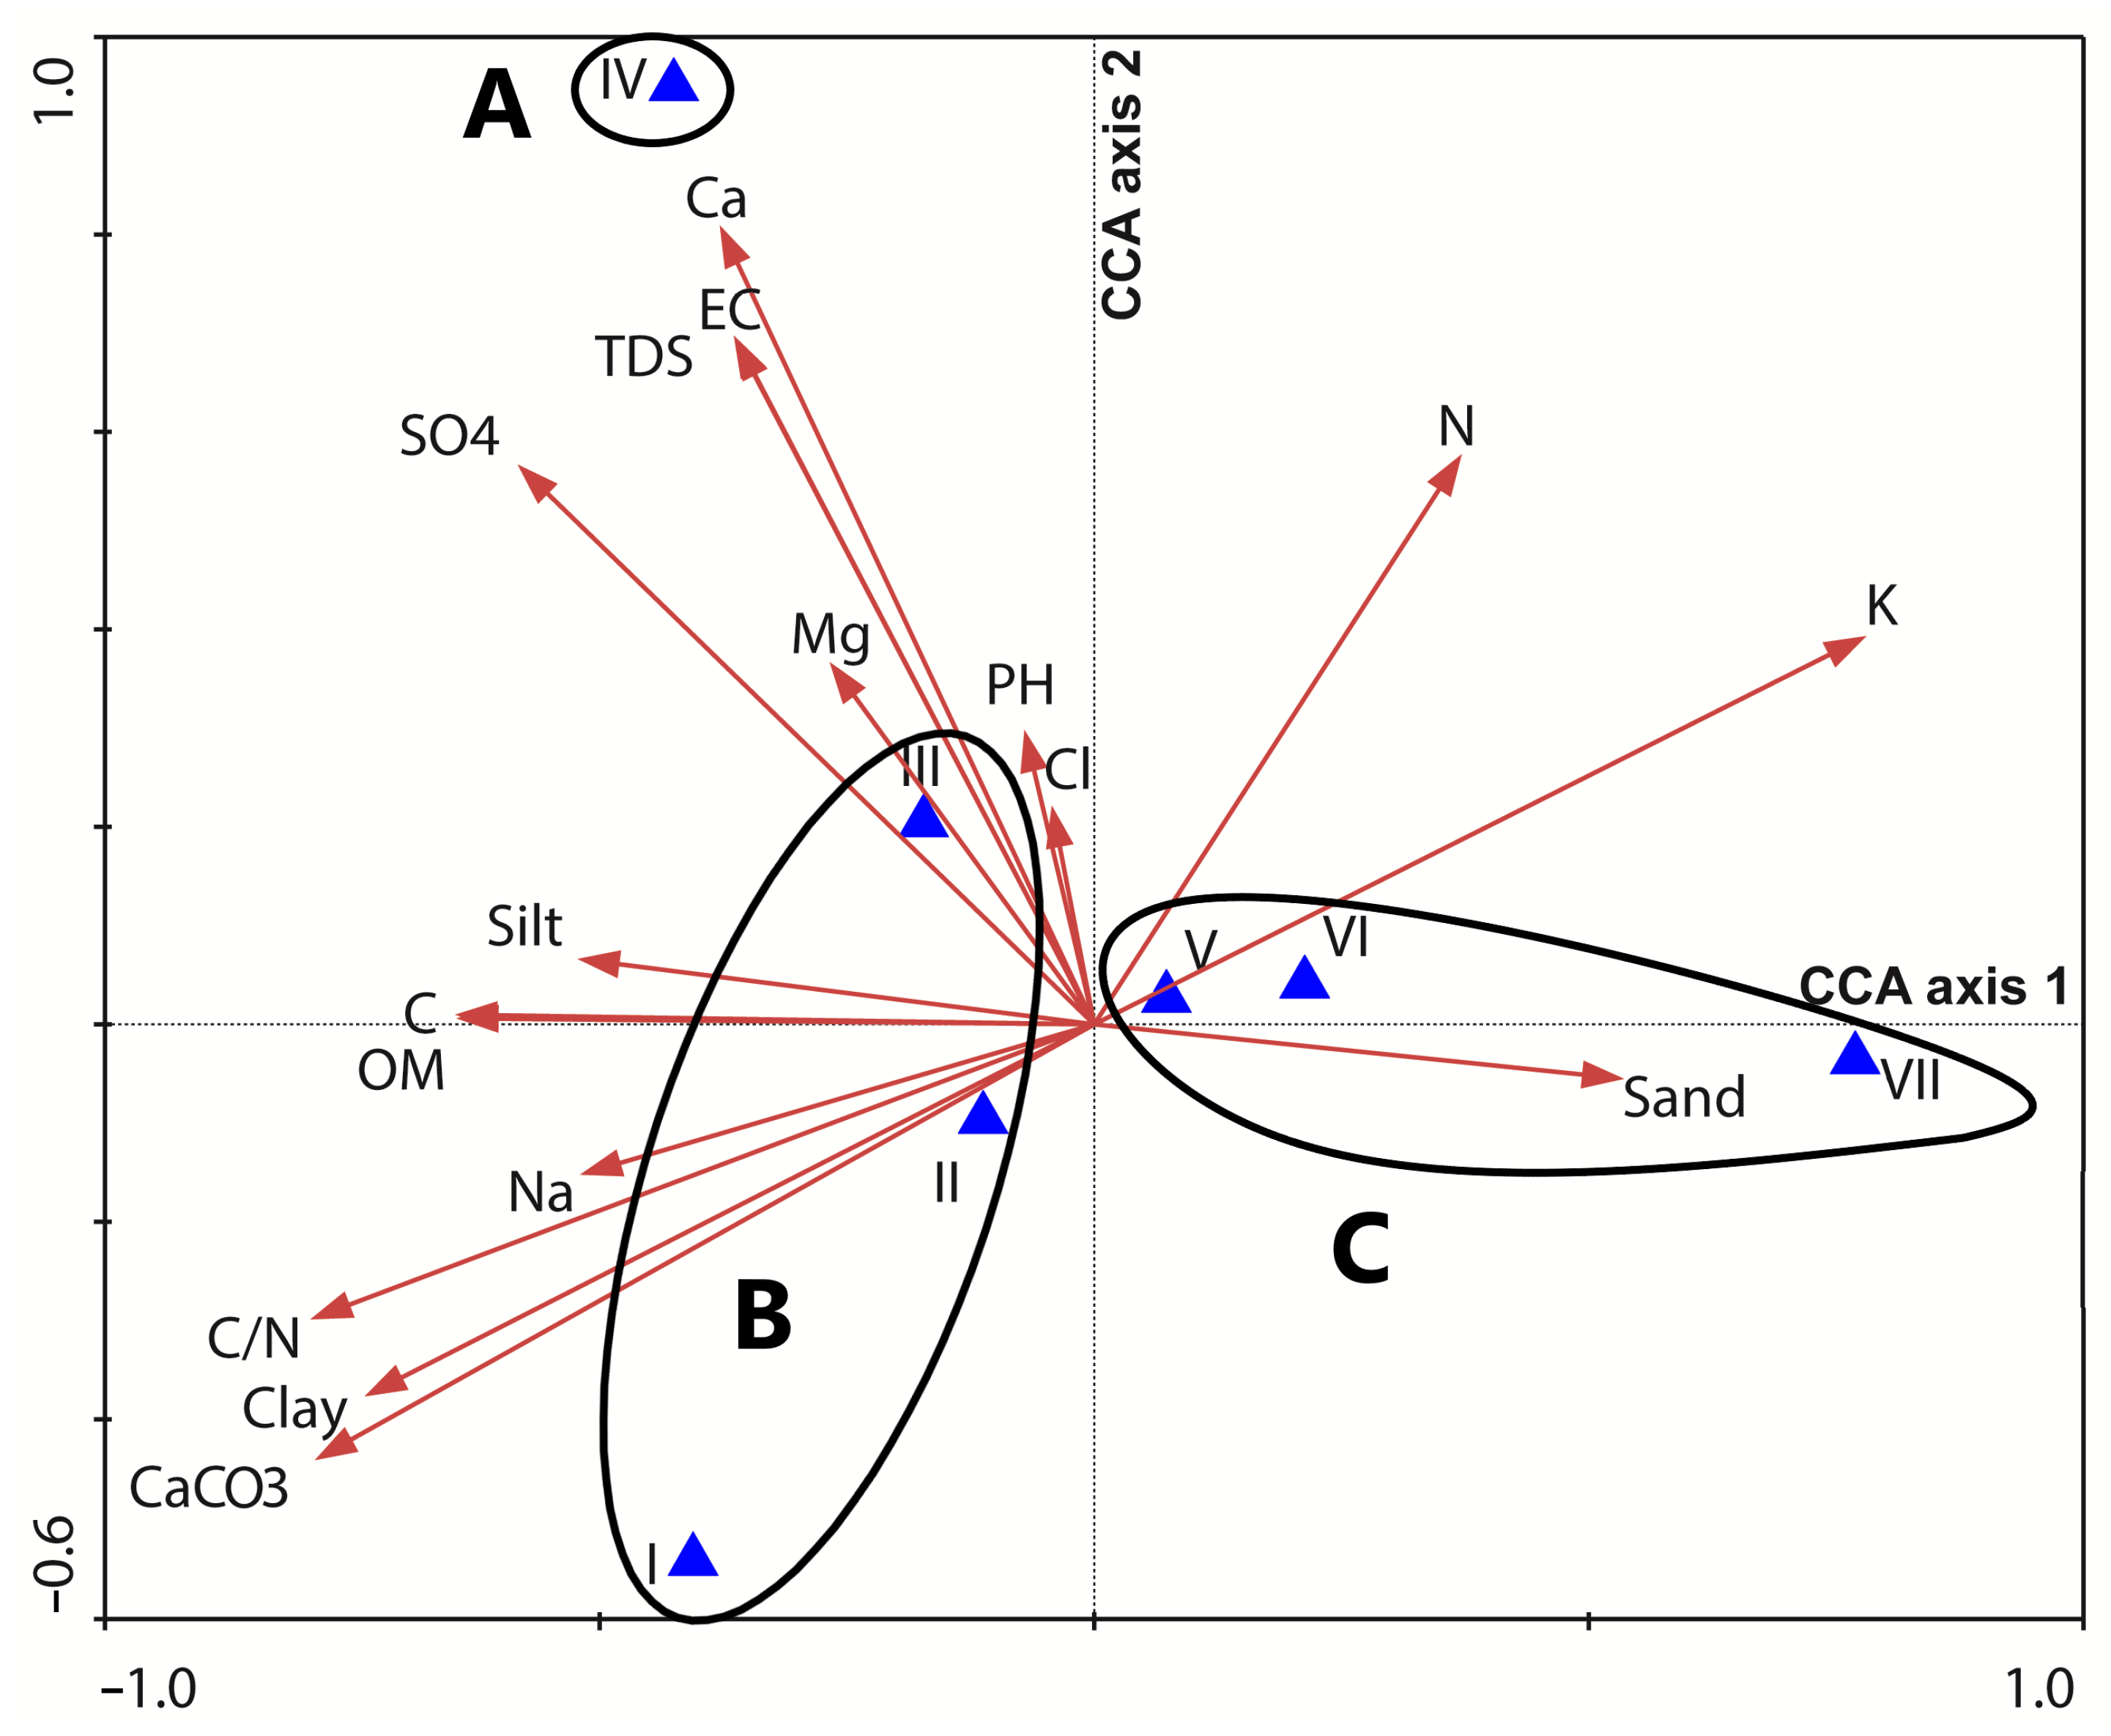
3.5. Plant Community and Soil Correlation

The Taverniera aegyptiacaTrichodesma africanum (cluster VII) demonstrated the highest levels of species richness (33) and the lowest species turnover (1). Stands of cluster IV (Caroxylon imbricatumOchradenus baccatus community) represented the lowest species richness (10) with the highest species turnover (2.10).
In the study area, four species (Z. indicum, Z. coccineum, Z. spinosa, and D. acris) had a broad ecological amplitude and were recorded in all seven clusters. Moreover, nine species were represented in six clusters. Of them, four species did not appear in cluster IV (Reseda pruinose, Farsetia aegyptia, D. harra, and Brocchia cinerea); additionally, four species were not recorded in cluster VII (R. vesicarius, Erodium oxyrhinchum, C. imbricatum, Atriplex turcomanica). On the other hand, T. africanum appeared in all clusters except cluster III.
Seven species appeared in five clusters. They were all well-represented in cluster I but varied in the other clusters. Cluster IV was represented by only two species (T. nilotica and O. baccatus, as they both disappeared from cluster VII).
Four species were well-represented in four clusters. On the other hand, eight species were recorded in three clusters. Cluster IV was represented by only one species (Launaea nudicaulis).
Thirteen species appeared in only two clusters. Forty-eight species were recorded in only one cluster of this group; 14 appeared in cluster I, 11 in cluster VII, 10 in cluster V, and 1 species (C. phelypaea) was recorded in cluster II.
The habitats of the studied stands were composed of different soil fractions. Sand represented the greatest contributor compared to the other soil fractions. It ranged from 72.5% in cluster II to 97.1% in cluster VII. The silt ranged between 1.90% in cluster VII and 26.30% in cluster II. Clay had the lowest ratio among the other soil particles. The highest value was 1.60 in cluster I. The organic matter content in these stands was relatively constant in all clusters. The highest percentage was determined in cluster II (2.93%), while the lowest value was recorded in cluster VII (1.38%).
The total nitrogen showed very low values, not exceeding 0.037 mg/g soil (cluster V). The total dissolved salts and electric conductivity were positively correlated. The highest values were recorded in clusters III and IV, respectively, while the lowest values were attained in cluster VI. Calcium carbonate showed high percentages in the first two clusters (30.26 and 28.67% for clusters I and II, respectively).
The concentrations of soil cations varied among the different clusters. For example, Na attained high values in clusters II and V, while potassium recorded the highest concentration in cluster VII. Calcium showed the highest concentration in cluster IV (3.71 mg/g soil), but Mg was highly recorded in cluster III (0.85 mg/g soil). On the other hand, soil anions (Cl and SO4) appeared in high concentrations in cluster V for Cl (1.47 mg/g) and cluster III for SO4 (0.97 mg/g).

4. Discussion

The desert vegetation in arid zones is relatively homogeneous but heterogeneous on a small spatial scale. Therefore, the studies on vegetation–soil relationships in these areas were usually conducted on a small spatial scale [48,49]. In the present study area, plant life is restricted to microenvironments where runoff water collects and provides sufficient moisture for plant growth [16,50].
As in most hyper-arid desert environments, the vegetation in the study area is restricted to wadis, runnels, and depressions with deep, fine sediments that receive an adequate water supply [19]. Minimal precipitation and frequent droughts characterize the vegetation in arid regions; therefore, water availability is one of the primary factors controlling species distribution [51].
The vegetation structure in the studied area along El Sheikh Fadl–Ras Gharib Road is relatively simple, in which the species have to withstand harsh environmental conditions. The surveyed plants included 93 species from 22 different families. Asteraceae, Brassicaceae, Amaranthaceae, and Fabaceae were the richest families, constituting the most plant species (50 species; 53.76%). A study by [6] covering the Eastern Desert recorded 52 species in the same area (El Sheikh Fadl–Ras Gharib Road) and that Asteraceae was the most dominant family. The same findings were reported by [7,20,52,53,54].
The surveyed plants included 51 perennials and 42 annuals. The dominance of perennials (54.84% of total recorded species) may be related to the nature of the habitat types in the present study, in which reproductive capacity, ecological, morphological, and genetic plasticity are the limiting factors [55]. The high contribution of annuals (45.16% of total recorded species) can be attributed to the rain season and short life cycle that enables them to resist the instability of the agroecosystem [56].
Life-form spectra provide information that may help assess vegetation’s response to variations in environmental factors. Seven life-form classes were recorded in the present study. Therophytes were the most frequent life forms (45.16%), followed by Chamaephytes (30.10%), Hemicryptophytes (15.05%), and Phanerophytes (6.45%), while three life forms were represented by a single species each (1.08%): Holoparasitic, Geophytes, and Geophytes–Helophytes. The above results agree with other studies [6,7,57]. The dominance of Therophytes over the other life forms seems to be a response to the Mediterranean climate, topography variation, and biotic influence [58]. Additionally, plant life forms showed a characteristic distribution in the different vegetation patterns. True annuals (e.g., Astragalus vogelii, Asphodelus tenuifolius, Cotula cinerea) occur directly after rainfall. Most other species proceed through therophytic, short-lived perennial (Morettia philaeana, Pulicaria incisa, Z. simplex) or even long-lived perennial life cycles (Crotalaria aegyptiaca, Fagonia spp., P. incisa, Z. spinosa) depending on the soil moisture content [59]. The highest values of Chamaephytes and Hemicryptophytes may be attributed to the ability of these species to resist drought, salinity, sand accumulation, and grazing [60].
The phytogeographical distribution of the surveyed flora classified the recorded taxa into three major phytogeographical groups: monoregional, biregional, and pluriregional. Seventy-eight taxa (83.87% of the total flora) were pluriregional elements of different affinities. Most of the recorded taxa occupied the Irano-Turanian/Mediterranean/Saharo-Sindian/Sudano-Zambezian chorotypes. These results agree with the obtained data of [6,14,20,57].
In most arid regions, multivariate analysis techniques have investigated the correlation between soil and vegetation in various habitats [51,61]. These investigations included large areas, and therefore they reported striking gradients referring to soil conditions and vegetation. Regarding vegetation and floristic composition, three main vegetation groups (plant communities) were identified and represented the plant communities that characterized the studied stands. According to [51], Zilla spinosaZygophyllum coccineum and Haloxylon salicornicum were the most species-rich vegetation associates occupying the Eastern Desert’s northern roads. On Cairo-Desert Road, [62,63] recorded a vegetation community with a similar floristic composition, including Acacia tortilis, Calotropis procera, Lycium shawii, Retama raetam, Tamarix nilotica, Arthrocnemum macrostachyum, Atriplex halimus, Capparis spinosa, Cornulaca monacantha, Ephedra alata, Ochradenus baccatus, and Pergularia tomentosa. Most of the identified vegetation groups have very much in common with those recorded in some wadis vegetation of the Egyptian desert and the neighboring countries [64].
The first and second DCA ordination axes 1 and 2 depicted the environmental gradient expressed by the cluster analysis (Figure 7). The TWINSPAN clusters were aggregated into three main vegetation groups (A, B, and C), representing distinct microhabitats.
The CCA ordination indicated that species diversity in vegetation group A was highly associated with Ca, EC, and SO4. At the same time, the stands of group B were highly associated with Na, Mg, CaCO3, silt, clay, and C/N. The stands of group C showed a high correlation with sand, K, and N. The findings by [7] also agree with the results obtained from this study, as they reported that soil texture, salinity, and organic carbon could affect the phytodiversity of wild communities.

5. Conclusions

This study investigated the plant diversity and edaphic factors that affect the vegetation structure along the El Sheikh Fadl–Ras Gharib Road in the northeastern desert of Egypt, which has been under harsh environmental conditions, scarce and unpredictable rainfall, and anthropogenic activities that may affect their floristic and vegetation diversity. Multivariate analyses such as TWINSPAN, DCA, and CCA showed that soil variables were useful in separating three ecological species groups representing distinct microhabitats. Because of the sensitivity of desert habitats to disturbance and their slow rate of natural recovery, this study emphasized the need for incorporating plant community composition, seasonality, and different sampling methods into future studies aimed at assessing the impact of desert roads on natural desert vegetation. Moreover, our findings could be useful to detect the changes in floristic composition and improve efforts for conserving natural desert vegetation.

Supplementary Materials

The following supporting information can be downloaded at: https://www.mdpi.com/article/10.3390/d15070874/s1, Table S1: Life form spectrum of plant species recorded in El Sheikh Fadl–Ras Gharib Road; Table S2: Numbers of plant species belonging to the main floristic chorotypes and their relevant percent (%) recorded in El Sheikh Fadl–Ras Gharib Road.

Author Contributions

Conceptualization, H.S., A.K.O. and M.O.B.; methodology, H.S. and M.O.B.; formal analysis, M.N.A., A.O.A., N.L. and M.O.B.; writing—Original draft preparation, H.S., S.A.H. and M.O.B.; writing—Review and editing M.O.B.; funding acquisition, M.N.A. All authors have read and agreed to the published version of the manuscript.

Funding

This study was funded by the Princess Nourah bint Abdulrahman University Researchers Supporting Project (Grant No. PNURSP2023R103), Princess Nourah bint Abdulrahman University, Riyadh, Saudi Arabia.

Institutional Review Board Statement

Not applicable.

Data Availability Statement

Not applicable.

Acknowledgments

The authors appreciate Princess Nourah bint Abdulrahman University Researchers Supporting Project number (Grant No. PNURSP2023R103), Princess Nourah bint Abdulrahman University, Riyadh, Saudi Arabia.

Conflicts of Interest

The authors declare no conflict of interest.

Appendix A

Table A1. List of plant species recorded on El Sheikh Fadl–Ras Gharib Road along with their families, growth form, life span, life form, and chorotypes. Chorotype abbreviations: CAP: Capensis; COSM: Cosmopolitan; ES: Euro-Siberian; GC: Guino-Congo; ME: Mediterranean; PAL: Palaeotropical; PAN: Pantropical; IT: Irano-Turanian; SS: Saharo-Sindian; SJ: Sino-Japonic; SZ: Sudano-Zambezian. Life forms: Cham.: Chamaephyte; Geo.: Geophyte; Geo.–Hel.: Geophyte–Helophyte; Hemicr.: Hemicryptophyte; Holopar.: Holoparasite. Life spans: Ph.: Phanerophyte; Th.: Therophyte.
FamilyTaxa Growth FormLife SpanLife FormChorotype
AcanthaceaeBlepharis ciliaris (L.) B.L.BurttSubshrubPer.Cham.IT + SS + SZ
AmaranthaceaeAerva javanica (Burm.f.) Juss. ex Schult.SubshrubPer.Cham.PAL
Anabasis setifera Moq.SubshrubPer.Cham.IT + SS + SZ
Atriplex turcomanica (Moq.) Boiss.SubshrubPer.Cham.IT + ME+ SS + SZ
Bassia eriophora (Schrad.) AsCham.Herb Ann.Ther.IT + SS
Caroxylon imbricatum (Forssk.) Moq.ShrubPer.Cham.IT + ME + SS + SZ
Caroxylon volkensii (Schweinf. & AsCham.) Akhani & RoalsonHerb Ann.Ther.IT + SS
Cornulaca aucheri Moq.Herb Ann.Ther.IT + ME + SS + SZ
Cornulaca monacantha DelileSubshrubPer.Cham.IT + ME + SS + SZ
Halocnemum strobilaceum (Pall.) M.Bieb.SubshrubPer.Cham.ES + IT + ME + SS + SZ
Suaeda pruinosa LangeShrubPer.Cham.IT + ME + SS
Suaeda vera Forssk. ex J.F.Gmel.ShrubPer.Cham.ES + ME + SS
Aerva javanica (Burm.f.) Juss. ex Schult.SubshrubPer.Cham.PAL
ApocynaceaeCynanchum acutum L.Climbing subshrubPer.Cham.ES + IT + ME + SS + SJ
AsteraceaeArtemisia judaica L.ShrubPer.Cham.IT + ME + SS + SZ
Brocchia cinerea (Delile) Vis.Herb Ann.Ther.IT + ME + SS
Centaurea aegyptiaca L.SubshrubPer.Cham.SS + SZ
Centaurea scoparia Sieber ex Spreng.SubshrubPer.Cham.ME + SS
Ifloga spicata (Forssk.) SCham.Bip.Herb Ann.Ther.IT + ME + SS + SZ
Launaea capitata (Spreng.) DandyHerb Ann.Ther.IT + ME + SS + SZ
Launaea mucronata subsp. cassiniana (Jaub. & Spach) N.KilianSubshrubPer.Hemicr.IT + ME + SS + SZ
Launaea mucronata (Forssk.) Muschl. subsp. mucronataSubshrubPer.Hemicr.IT + ME + SS + SZ
Launaea nudicaulis (L.) Hook.f.SubshrubPer.Hemicr.IT + ME + SS + SZ
Pluchea dioscoridis (L.) DC.ShrubPer.Phan.IT + ME + SS + SZ
Pulicaria incisa (Lam.) DC.Herb Per.Hemicr.SS + SZ
Pulicaria undulata (L.) C.A.Mey.Herb Per.Cham.IT + ME + SS + SZ
Reichardia tingitana (L.) RothHerb Ann.Ther.IT + ME + SS + SZ
Senecio glaucus subsp. coronopifolius (Maire) C.AlexanderHerb Ann.Ther.IT + ME + SS + SZ
Sonchus oleraceus L.Herb Ann.Ther.ES + IT + ME + SS + SZ
Zoegea purpurea Fresen.Herb Ann.Ther.IT + ME + SS
BoraginaceaeGastrocotyle hispida (Forssk.) BungeHerb Ann.Ther.IT + ME + SS + SZ
Trichodesma africanum (L.) Sm.Herb Per.Cham.CAP + GC + IT + ME + SS + SZ
BrassicaceaeAnastatica hierochuntica L.Herb Ann.Ther.IT + ME + SS + SZ
Diplotaxis acris (Forssk.) Boiss.Herb Ann.Ther.IT + ME + SS + SZ
Diplotaxis erucoides subsp. erucoidesHerb Ann.Ther.IT + ME + SS + SZ
Diplotaxis harra (Forssk.) Boiss.Herb Per.Hemicr.IT + ME + SS + SZ
Eremobium aegyptiacum (Spreng.) AsCham. ex Boiss.Herb Ann.Ther.IT + ME + SS + SZ
Farsetia aegyptia TurraHerb Per.Cham.IT + ME + SS + SZ
Matthiola arabica Boiss.Herb Per.Hemicr.SS
Matthiola longipetala (Vent.) DC.Herb Ann.Ther.IT + ME + SS
Morettia philaeana (Delile) DC.SubshrubPer.Hemicr.SS + SZ
Savignya parviflora (Delile) WebbHerb Ann.Ther.IT + ME + SS
Schouwia purpurea (Forssk.) Schweinf.Herb Ann.Ther.IT + ME + SS + SZ
Sisymbrium irio L.Herb Ann.Ther.ES + IT + ME + SJ + SS + SZ
Zilla spinosa (L.) PrantlSubshrubPer.Cham.IT + ME + SS + SZ
CaryophyllaceaePolycarpaea repens (Forssk.) AsCham. & Schweinf.SubshrubPer.Hemicr.IT + ME + SS + SZ
Pteranthus dichotomus Forssk.Herb Ann.Ther.IT + ME + SS
Spergularia diandra (Guss.) Heldr.Herb Ann.Ther.ES + IT + ME + SJ + SS + SZ
CleomaceaeCleome africana BotsCham.Herb Ann.Ther.IT + ME + SS
Cleome amblyocarpa Barratte & Murb. Barratte & Murb.Herb Ann.Ther.IT + ME + SS + SZ
ConvolvulaceaeConvolvulus hystrix VahlShrubPer.Cham.SS + SZ
Convolvulus pilosellifolius Desr.SubshrubPer.Cham.IT + ME + SS + SZ
EuphorbiaceaeEuphorbia retusa Forssk.Herb Ann.Ther.IT + ME + SS
FabaceaeAstragalus arpilobus subsp. hauarensis (Boiss.) PodlechHerb Ann.Ther.IT + ME + SS + SZ
Astragalus eremophilus Boiss.Herb Ann.Ther.IT + ME + SS + SZ
Astragalus spinosus (Forssk.) Muschl.SubshrubPer.Cham.IT + ME + SS
Astragalus trigonus DC.SubshrubPer.Cham.IT + ME + SS
Astragalus vogelii (Webb) Bornm.Herb Ann.Ther.IT + ME + SS + SZ
Lotus arabicus Sol. ex L.Herb Ann.Ther. GC + SS + SZ
Lotus halophilus Boiss. & SprunerHerb Ann.Ther.IT + ME + SS + SZ
Lotus hebranicus Hochst. ex BrandSubshrubPer.Hemicr.SS + SZ
Taverniera aegyptiaca Boiss.SubshrubPer.Cham.SS + SZ
Trigonella stellata Forssk.Herb Ann.Ther.IT + ME + SS + SZ
GeraniaceaeErodium arborescens (Desf.) Willd.SubshrubPer.Hemicr.ME + SS
Erodium oxyrhinchum subsp. bryoniifolium (Boiss.) Schönb.-Tem.Herb Per.Hemicr.IT + ME + SS
Monsonia nivea (Decne.) WebbHerb Per.Hemicr.IT + ME + SS + SZ
MalvaceaeMalva parviflora L.Herb Ann.Ther.ES + IT + ME + SS + SZ
OrobanchaceaeCistanche phelypaea (L.) Cout.Herb Per.Holopar.IT + ME + SS + SZ
PlantaginaceaePlantago ciliata Desf.Herb Ann.Ther.IT + ME + SS + SZ
Plantago ovata Forssk.Herb Ann.Ther.IT + ME + SS + SZ
PoaceaeCynodon dactylon (L.) Pers.Herb Per.Geo.COSM
Polypogon monspeliensis (L.) Desf.Herb Ann.Ther.ES + IT + ME + SJ + SS + SZ
Rostraria cristata (L.) TzvelevHerb Ann.Ther.ES + IT + ME + SS + SZ
Schismus barbatus (L.) Thell.Herb Ann.Ther.CAP + ES + IT + ME + SJ + SS + SZ
Stipagrostis ciliata (Desf.) De WinterHerb Per.Hemicr.CAP + IT + ME + SS + SZ
Phragmites australis (Cav.) Trin. ex Steud.ReedPer.Geo.–Hel.COSM
PolygonaceaeCalligonum comosum L’Hér.ShrubPer.Phan.IT + ME + SS + SZ
Rumex vesicarius L.Herb Ann.Ther.IT + ME + SJ + SS + SZ
ResedaceaeOchradenus baccatus DelileShrubPer.Phan.IT + ME + SS + SZ
Reseda muricata C.PreslSubshrub Per.Cham.ME + SS + SZ
Reseda pruinosa DelileHerb Ann.Ther.ME + SS + SZ
Reseda urnigera WebbHerb Ann.Ther.ME + SS
SolanaceaeHyoscyamus desertorum (AsCham. ex Boiss.) Täckh.Herb Ann.Ther.IT + ME + SS
Hyoscyamus muticus L. Subshrub Per.Cham.IT + ME + SS + SZ
TamaricaceaeTamarix aphylla (L.) H.Karst.Tree Per.Phan.IT + ME + SS + SZ
Tamarix nilotica (Ehrenb.) BungeTree Per.Phan.IT + ME + SS + SZ
Tamarix passerinoides Delile ex Decne.ShrubPer.Phan.IT + ME + SS + SZ
UrticaceaeForsskaolea tenacissima L.Herb Per.Hemicr.IT + ME + SS + SZ
ZygophyllaceaeTribulus macropterus Boiss.Herb Ann.Ther.IT + ME + SS + SZ
Zygophyllum arabicum (L.) Christenh. & ByngSubshrub Per.Cham.IT + ME + SS + SZ
Zygophyllum coccineum L.Subshrub Per.Cham.IT + ME + SS + SZ
Zygophyllum indicum (Burm.f.) Christenh. & ByngSubshrub Per.Cham.IT + ME + SS + SZ
Zygophyllum molle (Delile) Christenh. & ByngSubshrub Per.Cham.IT + ME + SS
Zygophyllum simplex L.Herb Ann.Ther.CAP + GC + IT + ME + SS + SZ

References

  1. Said, R. The Geology of Egypt; Routledge: Abingdon, UK, 2017. [Google Scholar]
  2. Zahran, M.A.; Willis, A.J. The Vegetation of Egypt; Springer: Berlin/Heidelberg, Germany, 2009; Volume 2. [Google Scholar]
  3. El Hadidi, M.N. Vegetation of the Nubian Desert (Nabta Region). In Prehistory of the Eastern Sahara; Wendorf, F., Schild, R., Eds.; Academic Press: London, UK, 1980; pp. 345–351. [Google Scholar]
  4. Abd El-Ghani, M.M. Environmental Correlates of Species Distribution in Arid Desert Ecosystems of Eastern Egypt. J. Arid Environ. 1998, 38, 297–313. [Google Scholar] [CrossRef]
  5. Fossati, J.; Pautou, G.; Peltier, J.P. Wadi Vegetation of the North-Eastern Desert of Egypt. Feddes Repert. 1998, 109, 313–327. [Google Scholar] [CrossRef]
  6. El-Ghani, M.A.; Salama, F.; Salem, B.; El-Hadidy, A.; Abdel-Aleem, M. Biogeographical Relations of a Hyperarid Desert Flora in Eastern Egypt. Afr. J. Ecol. 2014, 52, 173–191. [Google Scholar] [CrossRef]
  7. Abdelaal, M. Current Status of the Floristic Composition in Wadi Hagul, Northwest Suez Gulf, Egypt. Rend. Lincei 2017, 28, 81–92. [Google Scholar] [CrossRef]
  8. Ward, D. The Biology of Deserts; Oxford University Press: Oxford, UK, 2016. [Google Scholar]
  9. Abd El-Wahab, R.H. Plant Assemblage and Diversity Variation with Human Disturbances in Coastal Habitats of the Western Arabian Gulf. J. Arid Land 2016, 8, 787–798. [Google Scholar] [CrossRef] [Green Version]
  10. Solbrig, O.T. The Origin and Function of Biodiversity. Environment 1991, 33, 16–38. [Google Scholar] [CrossRef]
  11. Moustafa, A.A.; Abd El-Wahab, R.H.; Zaghloul, M.S. Conservation and Sustainable Use of Medicinal Plants in Arid and Semi-Arid Ecosystems of Egypt; Final Report; 1999. Available online: https://www.researchgate.net/publication/281438983_Conservation_and_Sustainable_use_of_Medicinal_Plants_in_Arid_and_Semi-arid_Ecosystems_of_Sinai_Egypt (accessed on 17 July 2023).
  12. Adla, K.; Dejan, K.; Neira, D.; Dragana, Š. Degradation of Ecosystems and Loss of Ecosystem Services. In One Health: Integrated Approach to 21st Century Challenges to Health; Academic Press: Cambridge, MA, USA, 2022; pp. 281–327. [Google Scholar]
  13. Gazoulis, I.; Antonopoulos, N.; Kanatas, P.; Karavas, N.; Bertoncelj, I.; Travlos, I. Invasive Alien Plant Species—Raising Awareness of a Threat to Biodiversity and Ecological Connectivity (EC) in the Adriatic-Ionian Region. Diversity 2022, 14, 387. [Google Scholar] [CrossRef]
  14. Salama, F.M.; Ahmed, M.K.; El-Tayeh, N.A.; Hammad, S.A. Vegetation Analysis, Phenological Patterns and Chorological Affinities in Wadi Qena, Eastern Desert, Egypt. Afr. J. Ecol. 2012, 50, 193–204. [Google Scholar] [CrossRef]
  15. Nakahama, N.; Hirasawa, Y.; Minato, T.; Hasegawa, M.; Isagi, Y.; Shiga, T. Recovery of Genetic Diversity in Threatened Plants through Use of Germinated Seeds from Herbarium Specimens. Plant Ecol. 2015, 216, 1635–1647. [Google Scholar] [CrossRef] [Green Version]
  16. Zohary, M. Man and Vegetation in the Middle East. In Man’s Impact on Vegetation; Holzner, W., Werger, M., Ikusima, I., Eds.; Junk: The Hague, The Netherlands, 1983; pp. 287–295. [Google Scholar]
  17. Holzapfel, C.; Schmidt, W. Roadside Vegetation along Transects in the Judean Desert. Isr. J. Bot. 1990, 39, 263–270. [Google Scholar]
  18. El-Ghani, M.M.A. Vegetation along a Transect in the Hijaz Mountains (Saudi Arabia). Feddes Repert. 1994, 105, 517–530. [Google Scholar] [CrossRef]
  19. Abd El-Ghani, M.; Salama, F.; Salem, B.; El-Hadidy, A.; Abdel-Aleem, M. Phytogeography of the Eastern Desert Flora of Egypt. Wulfenia 2017, 24, 97–120. [Google Scholar]
  20. El-Amier, Y.A.; Abdulkader, O.M. Vegetation and Species Diversity in the Northern Sector of Eastern Desert, Egypt. West African J. Appl. Ecol. 2015, 23, 75–95. [Google Scholar]
  21. Shaltout, K.H.; El-Din, A.S. Habitat Types and Plant Communities along a Transect in the Nile Delta Region. Feddes Repert. 1988, 99, 153–162. [Google Scholar] [CrossRef]
  22. Ayyad, M.A.; Ghabbour, S.I.; Goodall, D.W. Hot Deserts of Egypt and the Sudan. Ecosyst. World 1986, 12, 149–202. [Google Scholar]
  23. Mueller-Dombois, D.; Ellenberg, H. Aims and Methods of Vegetation Ecology; John Wiley and Sons: New York, NY, USA, 1974. [Google Scholar]
  24. Boulos, L. Flora of Egypt, Volume 1: Azollaceae—Oxalidaceae; Al Hadara Publishing: Cairo, Egypt, 1999. [Google Scholar]
  25. Boulos, L. Flora of Egypt, Volume 2: Geraniaceae–Boraginaceae; Al Hadara Publishing: Cairo, Egypt, 2000. [Google Scholar]
  26. Boulos, L. Flora of Egypt, Volume 3: Verbenaceae-Compositae; Al Hadara Publishing: Cairo, Egypt, 2002. [Google Scholar]
  27. Boulos, L. Flora of Egypt. Monocotyledons (Alimataceae-Orchidaceae); Al Hadara: Cairo, Egypt, 2005; Volume 4. [Google Scholar]
  28. Täckholm, V. Students’ Flora of Egypt, 2nd ed.; Cairo University: Cairo, Egypt, 1974. [Google Scholar]
  29. POWO. Plants of the World Online. Facilitated by the Royal Botanic Gardens, Kew. Published on the Internet. Available online: http://powo.science.kew.org/ (accessed on 30 April 2023).
  30. Hassib, M. Distribution of Plant Communities in Egypt. Bull. Fac. Sci. Univ. Fouad 1 1951, 29, 59–261. [Google Scholar]
  31. Raunkiaer, C. The Life Forms of Plants and Statistical Plant Geography; Clarendon Press: Oxford, UK, 1934. [Google Scholar]
  32. White, F.; Leonard, J.; Léonard, J. Phytogeographical Links between Africa and Southwest Asia. Flora Veg. Mundi 1991, IX, 229–246. [Google Scholar]
  33. Kilmer, V.J.; Alexander, L.T. Methods of Making Mechanical Analyses of Soils. Soil Sci. 1949, 68, 15–24. [Google Scholar] [CrossRef]
  34. Sparks, D.L.; Helmke, P.A.; Page, A.L. Methods of Soil Analysis: Chemical Methods; SSSA. 1996. Available online: https://www.waterboards.ca.gov/waterrights/water_issues/programs/bay_delta/california_waterfix/exhibits/docs/Islands/II_41.pdf (accessed on 17 July 2023).
  35. Jackson ML Soil Chemical Analysis-Advanced Course, 2nd ed.; Department of Soil Science, University of Madison: Madison, WI, USA, 1969.
  36. Williams, V.; Twine, S. Flame Photometric Method for Sodium, Potassium and Calcium. Mod. Methods Plant Anal. 1960, 5, 3–5. [Google Scholar]
  37. Johnson, C.M.; Ulrich, A. 2. Analytical Methods for Use in Plant Analysis. Bull. Calif. Agric. Exp. Stn. 1959, 766, 27–78. [Google Scholar]
  38. Allen, S.E. Chemical Analysis. In Methods in Plant Ecology; Moore, P.D., Chapman, S.B., Eds.; Blackwell: Oxford, UK, 1986; pp. 285–344. [Google Scholar]
  39. Black, C.A.; Evans, D.D.; Dinauer, R.C. Methods of Soil Analysis; American Society of Agronomy: Madison, WI, USA, 1965; Volume 9. [Google Scholar]
  40. APHA, A.-W. Standard Methods for the Examination of Water; Ignatius Press: San Francisco, CA, USA, 1998; Volume 21, pp. 3–37. [Google Scholar]
  41. Bremner, J.M. Nitrogen-Total. In Methods of Soil Analysis, Part 3: Chemical Methods; Sparks, D.L., Page, A.L., Helmke, P.A., Loeppert, R.H., Eds.; John Wiley & Sons, Ltd.: Hoboken, NJ, USA, 2018; pp. 1085–1121. [Google Scholar]
  42. Henderson, P.A.; Seaby, R.M.H. Community Analysis Package (CAP), Version 1.2; Pisces Conservation Ltd. IRC House: Lymington, UK, 1999.
  43. Frosini, B.V. Descriptive Measures of Ecological Diversity; Università Cattolica del Sacro Cuore, Istituto di Statistica: Milan, Italy, 2003. [Google Scholar]
  44. Eilertsen, O.; Okland, R.H.; Okland, T.; Pedersen, O. Data Manipulation and Gradient Length Estimation in DCA Ordination. J. Veg. Sci. 1990, 1, 261–270. [Google Scholar] [CrossRef]
  45. ter Braak, C.J.F.; Smilauer, P. CANOCO Reference Manual and CanoDraw for Windows User’s Guide: Software for Canonical Community Ordination (Version 4.5); Microcomputer Power: Ithaca, NY, USA, 2002; Available online: www.canoco.com (accessed on 11 April 2023).
  46. Coura, R.D.S.; Nardi, N.B. The State of the Art of Adeno-Associated Virus-Based Vectors in Gene Therapy. Virol. J. 2007, 4, 1–299. [Google Scholar] [CrossRef] [Green Version]
  47. Jongman, R.H.G.; Ter Braak, C.J.F.; Van Tongeren, O.F.R. Data Analysis in Community and Landscape Ecology; Cambridge University Press: Cambridge, UK, 1995. [Google Scholar]
  48. Xu, L.; Liu, H.; Chu, X.; Su, K. Desert Vegetation Patterns at the Northern Foot of Tianshan Mountains: The Role of Soil Conditions. Flora Morphol. Distrib. Funct. Ecol. Plants 2006, 201, 44–50. [Google Scholar] [CrossRef]
  49. Rietkerk, M.; Ouedraogo, T.; Kumar, L.; Sanou, S.; Van Langevelde, F.; Kiema, A.; Van De Koppel, J.; Van Andel, J.; Hearne, J.; Skidmore, A.K.; et al. Fine-Scale Spatial Distribution of Plants and Resources on a Sandy Soil in the Sahel. Plant Soil 2002, 239, 69–77. [Google Scholar] [CrossRef]
  50. Walter, H. The Water Supply of Desert Plants. In The Water Relations of Plants; Rutter, A.J., Whitehead, F.H., Eds.; John Wiley & Sons: New York, NY, USA, 1963; pp. 199–205. [Google Scholar]
  51. Salama, F.; El-Ghani, M.A.; Gadallah, M.; EL NAGGAR, S.; Amro, A. Characteristics of Desert Vegetation along Four Transects in the Aridenvironment of Southern Egypt. Turk. J. Bot. 2016, 40, 59–73. [Google Scholar] [CrossRef]
  52. Salama, F.; El-Ghani, M.A.; Gadallah, M.; El-Naggar, S.; Amro, A. Variations in Vegetation Structure, Species Dominance and Plant Communities in South of the Eastern Desert-Egypt. Not. Sci. Biol. 2014, 6, 41–58. [Google Scholar] [CrossRef] [Green Version]
  53. Abd El-Ghani, M.M. Floristics and Environmental Relations in Two Extreme Desertzones of Western Egypt. Glob. Ecol. Biogeogr. 2000, 9, 499–516. [Google Scholar] [CrossRef]
  54. El-Amier, Y.A.; El-Halawany, E.F.; Abdullah, T.J. Composition and Diversity of Plant Communities in Sand Formations along the Northern Coast of the Nile Delta in Egypt. Res. J. Pharm. Biol. Chem. Sci. 2014, 5, 826–847. [Google Scholar]
  55. Grime, J. Plant Strategies, Vegetation Processes, and Ecosystem Properties, 2nd ed.; John Wiley & Sons: New York, NY, USA, 2006. [Google Scholar]
  56. Alatar, A.; El-Sheikh, M.A.; Thomas, J. Vegetation Analysis of Wadi Al-Jufair, a Hyper-Arid Region in Najd, Saudi Arabia. Saudi J. Biol. Sci. 2012, 19, 357–368. [Google Scholar] [CrossRef] [Green Version]
  57. Salama, F.; Abd El-Ghani, M.; El-Tayeh, N. Vegetation and Soil Relationships in the Inland Wadi Ecosystem of Central Eastern Desert, Egypt. Turk. J. Bot. 2013, 37, 489–498. [Google Scholar] [CrossRef]
  58. Shaltout, K.H.; Al-Sodany, Y.M. Vegetation Analysis of Burullus Wetland: A RAMSAR Site in Egypt. Wetl. Ecol. Manag. 2008, 16, 421–439. [Google Scholar] [CrossRef]
  59. Springuel, I.; Sheded, M.; Darius, F.; Bornkamm, R. Vegetation Dynamics in an Extreme Desert Wadi under the Influence of Episodic Rainfall. Polish Bot. Stud. 2006, 22, 459–472. [Google Scholar]
  60. Danin, A. Plants of Desert Dunes; Springer Science & Business Media: Berlin/Heidelberg, Germany, 1996. [Google Scholar]
  61. van Etten, E.J.B.; Fox, J.E.D. Vegetation—Environment Relationships of the Hamersley Ranges, a Mountainous Desert of North-West Australia. Folia Geobot. 2017, 52, 161–173. [Google Scholar] [CrossRef]
  62. Kassas, M.; El-Abyad, M.S. On the Phytosociology of the Desert Vegetation of Egypt. Ann. Arid Zone 1962, 1, 54–83. [Google Scholar]
  63. Kassas, M.; Imam, M. Habitat and Plant Communities in the Egyptian Desert: IV. The Gravel Desert. J. Ecol. 1959, 47, 289. [Google Scholar] [CrossRef]
  64. Sheded, M.G.; Hamed, S.T.; Badry, M.O. Vegetation Analysis of Six Riverian Islands in Hyper-Arid Environments at Qena Governorate (Upper Egypt). Acta Bot. Hung. 2014, 56, 409–431. [Google Scholar] [CrossRef]
Figure 1. Location map of El Sheikh Fadl–Ras Gharib Road study area in the Eastern desert in Egypt (red rectangle) showing the sampling sites (S1–S17, in red).
Diversity 15 00874 g001
Figure 2. Gaussian diagram showing the averages of maximum (black circles) and minimum (open circles) monthly air temperature (°C) and monthly rainfall (mm; bars) at Umm El Sas city nearby El Sheikh Fadl–Ras Gharib Road (Eastern Desert) since January to December through the last ten years (2013–2022).
Diversity 15 00874 g002
Figure 3. Histogram of the floristic composition of the 22 families surveyed in El Sheikh Fadl–Ras Gharib Road.
Diversity 15 00874 g003
Figure 4. Life-form spectrum of plant species recorded in El Sheikh Fadl–Ras Gharib Road.
Diversity 15 00874 g004
Figure 5. Phytogeographical analysis of the recorded species in El Sheikh Fadl–Ras Gharib Road. For the abbreviations, see Appendix A.
Diversity 15 00874 g005
Figure 6. The dendrogram resulted from applying TWINSPAN to the 17 sampled vegetation plots (S1–S17) depicting the resulted vegetation clusters (I–VII).
Diversity 15 00874 g006
Figure 7. DCA ordination diagram on the first two axes (axes 1 and 2) of the seven vegetation clusters (I–VII, red triangles) was identified after applying TWINSPAN to the 17 sampled plots on El Sheikh Fadl–Ras Gharib Road. Black circles show DCA groups A, B, and C.
Diversity 15 00874 g007
Figure 8. CCA biplot ordination of the environmental variables (arrows) and the TWINSPAN vegetation clusters (blue triangles). Floristic groups A–C. C: total carbon; N: total nitrogen; C/N: carbon–nitrogen ratio; TDS: total dissolved salts; EC: electrical conductivity; OM: organic matter; Ca: calcium; Mg: magnesium; K: potassium; Na: sodium; CaCO3: calcium carbonate; Cl: chloride; SO4: sulfate.
Diversity 15 00874 g008
Table 1. Mean values, standard deviations (SDs), and ANOVA values of the soil variables in the study area’s TWINSPAN vegetation clusters (I–VII).
Edaphic FactorsIIIIIIIVVVIVIIF Valuep
Organic matter %2.19 ± 0.622.93 ± 0.822.36 ± 1.082.25 ± 1.392.52 ± 2.061.59 ± 0.351.38 ± 0.00.4340.858
C1.27 ± 0.361.70 ± 0.471.37 ± 0.631.30 ± 0.811.46 ± 1.200.92 ± 0.200.80 ± 0.00.4340.858
N0.027 ± 0.0040.032 ± 0.0050.031 ± 0.00530.036 ± 0.0150.037 ± 0.010.028 ± 0.00.035 ± 0.00.4330.859
CaCO3 (mg/g)30.62 ± 3.2628.67 ± 1.2923.00 ± 2.1819.78 ± 6.4817.75 ± 3.4112.09 ± 1.5312.50 ± 0.06.559 *0.006
PH8.44 ± 0.068.60 ± 0.118.61 ± 0.0438.49 ± 0.198.47 ± 0.238.53 ± 0.218.47 ± 0.00.3440.913
TDS (mg/L)218.09 ± 32.08563.00 ± 425.68762.33 ± 525.65867.74 ± 677.17616.36 ± 633.17137.77 ± 35.35258.67 ± 0.00.6470.711
EC (µs/cm)363 ± 53.56937 ± 708.521263 ± 861.911435 ± 1113.941025.67 ± 1053.68228.50 ± 57.27432 ± 0.00.6480.710
Na+ (mg/g)1.51 ± 1.772.42 ± 1.171.70 ± 0.251.05 ± 1.122.24 ± 3.140.34 ± 0.200.36 ± 0.00.3510.910
K+ (mg/g)1.12 ± 0.291.56 ± 0.421.62 ± 0.511.66 ± 0.911.55 ± 0.681.35 ± 0.472.27 ± 0.00.4580.842
Ca2+ (mg/g)0.46 ± 0.170.74 ± 0.532.87 ± 3.133.71 ± 3.561.34 ± 1.180.22 ± 0.00.62 ± 0.00.8530.573
Mg2+ (mg/g)0.12 ± 0.030.18 ± 0.140.85 ± 1.210.28 ± 0.220.21 ± 0.130.13 ± 0.560.10 ± 0.00.9550.513
Cl (mg/g)0.56 ± 0.121.40 ± 1.191.00 ± 0.070.91 ± 0.491.47 ± 1.870.38 ± 0.00.77 ± 0.00.3410.915
SO42− (mg/g)0.49 ± 0.050.67 ± 0.150.97 ± 0.350.91 ± 0.620.60 ± 0.260.34 ± 0.420.35 ± 0.00.9660.507
Clay1.60 ± 0.461.20 ± 0.281.53 ± 0.851.20 ± 0.431.37 ± 0.151 ± 0.01 ± 0.02.8570.073
Silt10.53 ± 7.6226.30 ± 8.3424.40 ± 30.5011.10 ± 14.8214.13 ± 18.604.25 ± 2.751.90 ± 0.02.7920.077
Sand 87.87 ± 7.6872.50 ± 8.0674.07 ± 31.3587.70 ± 15.2584.50 ± 18.6394.75 ± 2.7597.10 ± 0.02.8590.072
* indicates p < 0.01.
Table 2. Pearson correlation between soil variables and the first two CCA axes.
AX1AX2OMNCaCO3pHTDSECNaKCaMgClSO4ClaySiltSand
AX1 −0.300−0.6150.227−0.755 *−0.091−0.499−0.497−0.4510.644−0.522−0.303−0.074−0.666−0.668−0.4940.504
AX2−0.300 0.0520.544−0.2630.1000.7160.713−0.1690.2590.848 *0.2610.1100.617−0.2460.011−0.004
OM.−0.6150.052 0.1380.7330.4230.6170.6190.952 **−0.3830.2850.2770.770 *0.6160.5270.886 **−0.888 **
N0.2270.5440.138 −0.354−0.1540.5900.5920.1600.6520.461−0.0060.6460.285−0.2540.0010.005
CaCO3−0.755 *−0.2630.733−0.354 0.1880.2180.2190.697−0.5370.0580.1640.2660.3950.7310.672−0.682
pH−0.0910.1000.423−0.1540.188 0.3710.3710.3260.0100.2160.6300.3050.486−0.0070.742−0.732
T.D.S.−0.4990.7160.6170.5900.2180.371 1.000 **0.5000.1360.899 **0.6110.6420.936 **0.2930.617−0.617
EC.−0.4970.7130.6190.5920.2190.3711.000 ** 0.5030.1370.897 **0.6100.6460.935 **0.2930.619−0.618
Na−0.451−0.1690.952 **0.1600.6970.3260.5000.503 −0.3300.1300.2540.824 *0.4790.6020.844 *−0.848 *
K0.6440.259−0.3830.652−0.5370.0100.1360.137−0.33010.1480.0210.189−0.047−0.539−0.2300.240
Ca−0.5220.848 *0.2850.4610.0580.2160.899 **0.897 **0.1300.14810.6470.2560.898 **0.2490.331−0.333
Mg−0.3030.2610.277−0.0060.1640.6300.6110.6100.2540.0210.64710.1950.772 *0.4880.599−0.603
Cl−0.0740.1100.770 *0.6460.2660.3050.6420.6460.824 *0.1890.2560.19510.4540.1900.674−0.670
SO4−0.6660.6170.6160.2850.3950.4860.936 **0.935 **0.479−0.0470.898 **0.772 *0.45410.4750.705−0.708
Clay−0.668−0.2460.527−0.2540.731−0.0070.2930.2930.602−0.5390.2490.4880.1900.47510.513−0.531
Silt−0.4940.0110.886 **0.0010.6720.7420.6170.6190.844 *−0.2300.3310.5990.6740.7050.513 −1.000 **
Sand0.504−0.004−0.888 **0.005−0.682−0.732−0.617−0.618−0.848 *0.240−0.333−0.603−0.670−0.708−0.531−1.000 **
* indicates p < 0.05; ** indicates p < 0.01.
Disclaimer/Publisher’s Note: The statements, opinions and data contained in all publications are solely those of the individual author(s) and contributor(s) and not of MDPI and/or the editor(s). MDPI and/or the editor(s) disclaim responsibility for any injury to people or property resulting from any ideas, methods, instructions or products referred to in the content.

