Article

From Source to Tap: Tracking Microbial Diversity in a Riverbank Filtration-Based Drinking Water Supply System under Changing Hydrological Regimes

1
Department of Public Health Laboratories, National Public Health Center, 1097 Budapest, Hungary
2
Centre for Ecological Research, Eötvös Loránd Research Network, 1113 Budapest, Hungary
3
Budapest Waterworks, 1138 Budapest, Hungary
4
Institute of Plant Biology, Biological Research Centre, Eötvös Loránd Research Network, 6726 Szeged, Hungary
5
Department of Biotechnology, Faculty of Science and Informatics, Szeged University, 6726 Szeged, Hungary
*
Author to whom correspondence should be addressed.
Diversity 2023, 15(5), 621; https://doi.org/10.3390/d15050621
Submission received: 21 March 2023 / Revised: 28 April 2023 / Accepted: 29 April 2023 / Published: 2 May 2023
(This article belongs to the Special Issue Occurrence and Molecular Biology of Water Bacteria and Protozoa)

Abstract

:
In drinking water supply, riverbank filtration (RBF) is an efficient and cost-effective way of eliminating pathogens and micropollutants using a combination of biotic and abiotic processes. Microbial communities in the hyporheic zone both contribute to and are shaped by these processes. Microbial water quality at the point of consumption is in turn influenced by the source water microbiome, water treatment and distribution system. Understanding microbial community shifts from source to tap and the factors behind them is instrumental in maintaining safe drinking water delivery. To this end, microbial communities of an RBF-based drinking water supply system were investigated by metabarcoding in a one-year sampling campaign. Samples were collected from the river, RBF wells, treated water, and a consumer’s tap. Metabarcoding data were analysed in the context of physicochemical and hydrological parameters. Microbial diversity as well as cell count decreased consistently from the surface water to the tap. While Proteobacteria were dominant throughout the water supply system, typical river water microbiome phyla Bacteroidota, Actinobacteria, and Verrucomicrobiota were replaced by Nitrospira, Patescibacteria, Chloroflexi, Acidobacteriota, Methylomicrobilota, and the archaeal phylum Nanoarcheota in well water. Well water communities were differentiated by water chemistry, in wells with high concentration groundwater derived iron, manganese, and sulphate, taxa related to iron and sulphur biogeochemical cycle were predominant, while methane oxidisers characterised the more oxic wells. Chlorine-resistant and filtration-associated taxa (Acidobacteria, Firmicutes, and Bdellovibrionota) emerged after water treatment, and no potentially pathogenic taxa were identified at the point of consumption. River discharge had a distinct impact on well water microbiome indicative of vulnerability to climate change. Low flow conditions were characterised by anaerobic heterotrophic taxa (Woesarchaeales, Aenigmarchaeales, and uncultured bacterial phyla MBNT15 and WOR-1), implying reduced efficiency in the degradation of organic substances. High flow was associated the emergence of typical surface water taxa. Better understanding of microbial diversity in RBF water supply systems contributes to preserving drinking water safety in the future changing environment.

1. Introduction

The natural process of riverbank filtration (RBF) is a cost-efficient and effective way of improving source water quality and reducing the need for additional water treatment in a drinking water supply. RBF wells are established in the proximity of the riverbank and abstract both surface water filtered through the gravel bed of the river and groundwater. RBF reduces dissolved organic matter content, removes pathogens, including bacteria, protozoa, and viruses, and eliminates organic and inorganic micropollutants, such as pharmaceuticals or heavy metals [1,2,3]. Recognising these advantages, RBF is increasingly used to produce drinking water in Europe and worldwide [1,4,5,6].
RBF is a combination of biotic and abiotic natural processes, including filtration, sorption, precipitation, redox reactions, and biodegradation [7]. Concentration of pollutants is also affected by the mixing of surface water and groundwater derived water [2].
Microbial communities of the hyporheic zone both contribute to these processes and are also influenced by them. Intrusion of surface water introduces readily available carbon sources and therefore enhances microbial respiration [2]. Community composition also reacts swiftly to surface water mixing, but it is more likely to be associated with changing physicochemical characteristics than the intrusion of river bacteria [8].
Chemical composition of the water is one of the primary determinants of microbial community structure in surface water and groundwater. Electrical conductivity, pH, ions (e.g., ammonium, chloride, sulphate, sodium, iron, and manganese) and organic matter content were all found to influence the abundance of different microbial taxa [9,10].
The ratio of surface water to groundwater in the hyporheic zone depends on the intensity of water abstraction and surface water level. Both were shown to alter microbial community composition and also affect the efficiency of RBF [3,11,12].
One of the main advantages of RBF in drinking water supply is that the natural filtration process reduces the need for further water treatment. Subsequent treatment technology depends on the quality of water produced in RBF. Most water treatment plants use at least disinfection (chlorination), which has a well-documented impact on microbial communities, giving rise to chlorine-resistant taxa while eliminating sensitive microorganisms [13,14]. However, during distribution, regrowth may also occur, depending on the physicochemical characteristics of the finished water (e.g., temperature; total organic carbon (TOC) concentration; residual chlorine, ammonium, iron, or manganese concentration) and the distribution system (such as age, corrosion, scaling, or other deposit formation) [15].
The above factors and processes all contribute to the microbial water quality and abundance of various prokaryotic taxa at the consumer’s tap, but most studies only address limited parts of this complex interplay. Research on RBF, including previous metagenomic studies, usually focused on surface water and well water comparison or community diversity of wells in different locations [9,16]. Microbial diversity in drinking water supply systems is usually investigated in snapshots, i.e., single sampling events at multiple locations [17]. In a recent study, microbial community dynamics was tracked for a year in a full-scale drinking water treatment plant using surface water abstraction and complex treatment technology [13], but to the best of our knowledge no such study has been conducted yet in RBF-based drinking water supply systems. Source water quality is an important aspect, since its microbiome was shown to contribute on average 49% (ranging 0–93%) to the microbial community at the tap, depending on source water type and between 25–62% in RBF [8,18].
Many countries are making use of RBF for drinking water supply, including Finland, France, Germany, Hungary, the Netherlands, Poland, Slovakia, and Switzerland [6]. In Hungary, 36% of drinking water is derived from RBF, and future drinking water supply is expected to rely even more heavily on RBF, comprising 2/3 of prospective water sources. RBF, however, is vulnerable to hydrological extremes: inundation or high water levels reduce transport time, can decrease filtration efficiency and may lead to breakthrough of surface-water-derived pathogens or contaminants [7,12]. Low flow, on the other hand, can lead to anoxic conditions and incomplete degradation of organic compounds [19]. Recurrence of extreme hydrological and meteorological events such as floods, draughts, and torrential rains is expected to increase in the near future. To maintain safe drinking water delivery, it is imperative to have a better understanding of microbial communities, as key contributors to the natural filtration process, and their response to changing environmental conditions.
In the present study, we aim to answer the following research questions based on a year-round field study in an RBF-based drinking water supply system: (i) What is the impact of key treatment steps (RBF, oxidation/disinfection, and distribution) on the diversity of the microbial community? (ii) How do physicochemical parameters or hydrological conditions contribute to community shifts? (iii) What are the implications for safe water delivery under future climate scenarios?

2. Materials and Methods

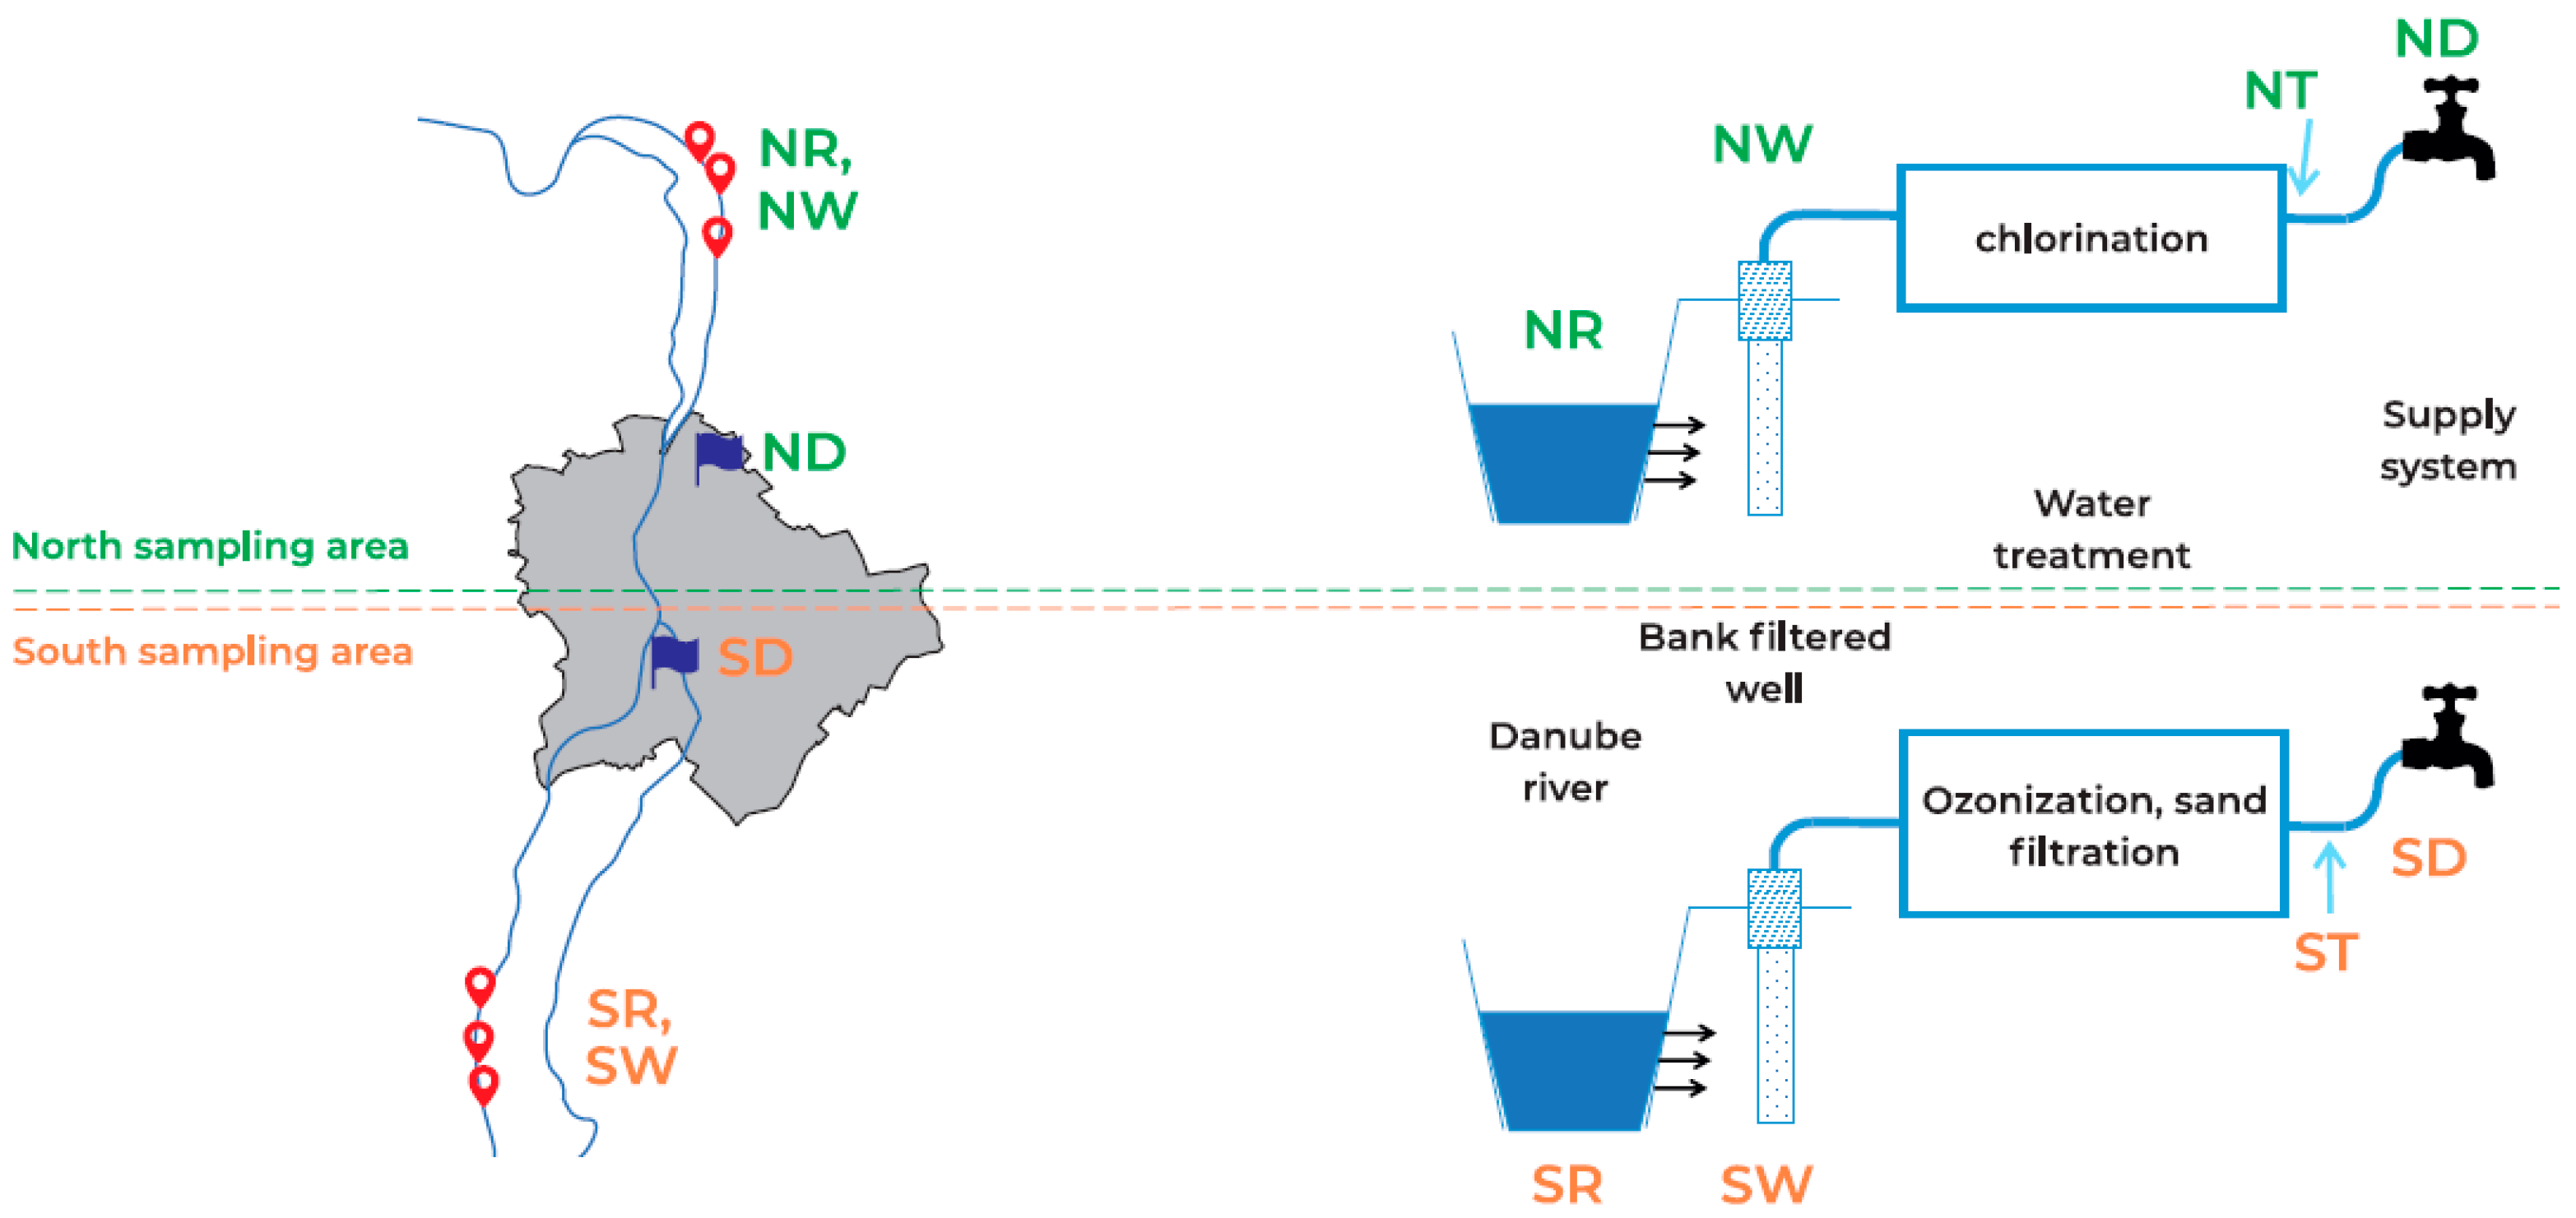
2.1. Study Site and Sampling

A year-round field study was carried out on the Budapest drinking water supply system. The water supply of Budapest relies on two RBF areas located upstream (north) and downstream from the capital (south) on river Danube (Figure 1). Of the 765 abstraction wells operated by the Budapest Waterworks, three wells were selected in the north and three in the south. In the north, water abstracted from different wells is merged and chlorinated by chlorine gas immediately on site. It requires no further treatment except for safety chlorination before leaving the water treatment plant. Southern wells are characterised by higher iron and manganese concentration, which are removed by ozonation and sand filtration, followed by chlorination [5]. Samples were collected every two weeks between February 2019 and February 2020 in the northern and southern study area from Danube water at three locations near the abstraction area (NR1-3 and SR1-3, respectively), selected RBF wells (NW1-3 and SW1-3), mixed well water (NWM, SWM), treated water (NT, ST), and after distribution at a consumer’s point (ND, SD). Consumer’s points were selected based on the following criteria: sufficiently close to one of the study sites so it can be presumed to be serviced exclusively by water from the northern or southern water abstraction (though the distribution systems are connected), but far enough to see the impact of the distribution system. Buildings of health relevance (healthcare or long-term care facilities) were selected.
Surface water samples for chemical and microbiological analysis were collected using immersion, from a depth of approximately 50 cm. Samples were drawn from the wells, mixed well water, and onsite treated water using designated sampling taps and from a consumer’s tap after 1 min of flushing. The following physicochemical parameters were measured on site: water temperature, pH and electrical conductivity were recorded using a Combo pH/EC/TDS/Temperature tester (HI 98129), redox potential, and turbidity using a pH/Ion meter (WTW ProfiLine pH/ION 3310) and a turbidity meter (Lovibond TB210), respectively. Water samples were transported to the laboratory in a cooled container and stored at 4 °C. For microbial community analysis, samples were processed within 24 h.

2.2. Chemical and Classic Microbiological Analysis

All chemical parameters were measured according to standard drinking water methods. Ammonium, free chlorine, and combined chlorine were measured using photometric methods on a Shimadzu UV-1800 spectrophotometer (ISO 7150-1:1984). Nitrite, nitrate, sulphate, and chloride were detected using ion chromatography (Dionex ICS-5000, ISO 10304-1:2007), iron and manganese using atom absorption spectroscopy (Agilent 280Z AA, MSZ 1484-3:2006), TOC and DOC using an Elementar Vario TOC Cube instrument (EN 1484).
Microbiological indicators E. coli, faecal enterococci, and colony count were enumerated using standard methods, EN ISO 9308-2, EN ISO 7899-2, and EN ISO 6222, respectively. Briefly, 100 mL of water filtered through mixed cellulose ester membranes (pore size: 0.45 μm, Merck KGaA, Darmstadt, Germany), and filters were placed on Chromogenic coliform agar (Condalab, Madrid, Spain), or Slanetz-Bartley agar (Neogen Corporation, Lansing, MI, USA) for the detection of E. coli and faecal enterococci, respectively. After incubation at 36 °C for 24 h (E. coli) or 48 h (fecal enterococci), typical colonies were counted. The pour plate method was used for the estimation of colony count at 22 °C, using 1 mL water aliquots mixed with 30 mL melted heterotrophic plate count agar (Neogen Corporation, Lansing, MI, USA), and incubated at 22 °C for 72 h.

2.3. Direct Cell Count Detection

Two hundred millilitres of water was filtered through a polycarbonate membrane (0.2 μm GTTP, Millipore, Burlington, MA, USA) filtered and fixed using 2% paraformaldehyde (VWR International, Atlanta, GA, USA) followed by washing in 0.1 M phosphate buffer (NaH2PO4 3.2 g, Na2HPO4 10.9 g in 1000 mL distilled water, pH 7.2). Until further processing, filters were stored at −20 °C. The membrane filters were then overlayed with 1 μg mL−1 DAPI (4′, 6-diamidino-2-phenylindole, Sigma-Aldrich, Taufkirchen, Germany) solution for 2 min at room temperature. Filters were washed with sterile distilled water and 80% ethanol to remove the residual stain. Filters were dried at room temperature in a sterile plastic Petri dish. Filters were stored at 4 °C until examination with epifluorescent microscopy (Olympus BX43, Olympus, Tokyo, Japan). Photographs were analysed using NIS-Elements AR software 5.21.02.

2.4. Concentration, DNA Extraction, and Illumina Sequencing

Two litres of water samples were concentrated by filtration through 0.22-μm pore sized polycarbonate filters (Millipore, Billerica, MA, USA). Filters were stored at −20 °C until DNA extraction.
DNA was extracted from the filtered samples using DNeasy Power Kit (QIAGEN, Hilden, Germany) and the concentration was assessed using Qubit4 fluorimeter (Thermo Fisher, Waltham, MA, USA) with a Qubit 1XdsDNA HS Assay Kit. The v3–v4 regions of the 16S rRNA was amplified using 20 ng purified DNA as template and the Pro341F and Pro805R primers [20]. The quality and quantity of the amplicons were assessed using Agilent 2100 Bioanalyzer System (Agilent Technologies, Santa Clara, CA, USA) and 2 × 300 bp PE sequencing was carried out on Illumina (San Diego, CA, USA) MiSeq platform using MiSeq Reagent Kit v3. The sequencing reads were analysed using Qiime2 2022.2 software suite [21]. The 500 bp long amplicon sequences were reconstituted by joining the read pairs using the vsearch module. Quality filtering by limiting to 3 consecutive bases with Phred score less than 20 using the quality-filter plugin. For dereplication and de novo OTU picking, 97% identity threshold was carried using vsearch [22]. OTUs with less than 0.005% read coverages were filtered out [23]. Taxonomical classification of the OTUs was carried out via classify_consensus_vsearch module using SILVA SSU v.138 database.

2.5. Statistical Analyses

Relative OTU abundances were calculated as a percent of the number of reads in each sample. The alfa rarefaction pipeline in Qiime2 was used to calculate the numbers of observed OTUs within each habitat.
Beta diversity of the samples was assessed by creating a rooted tree of the MAFFT aligned sequences and calculating the weighted unifrac distance matrix. A principal coordinates analysis (PCoA) was carried out from the weighted unifrac distances of the relative abundances using the beta diversity module and it was visualized using the Emperor plugin of Qiime2.
Differences in the microbiota and the correlations between environmental variables and the composition of bacterial communities were evaluated using standardized principal component analysis (PCA) and redundancy analysis (RDA) using the SYN-TAX 2000 computer program package [24]. Significant differences were tested using Kruskal–Wallis and post hoc Dunn’s tests with Bonferroni correction. Physicochemical parameters of samples were compared using the unpaired Mann–Whitney-U test and Wilcoxon matched paired probe. Differences with p values under 0.05 were considered significant.
Microbial community diversity was compared (1) between surface water, well water, and treated water (i.e., water immediately after treatment and distribution); (2) between northern and southern study sites; and (3) in detail along the drinking water production path.

3. Results

3.1. Physicochemical Characteristics and Microbiological Indicators

Danube water quality upstream and downstream (i.e., north and south) from Budapest was highly similar, based on the yearly averages (Table 1). In the south, the concentrations of nitrate, chloride, and sulphate, as well as iron and manganese were higher, but differences were slight. RBF significantly reduced TOC, DOC, and turbidity of the water, while EC and the concentration of anions (chloride, sulphate, and in the north, nitrate) increased in the wells as a consequence of groundwater mixing. Redox potential was significantly higher in the north than the south (mean 222 and 134 mV, respectively) (Mann–Whitney-U test, p < 0.001, Tables S1–S3). Iron and manganese concentrations were an order of magnitude higher in the southern than in the northern wells (mean 362 and 297 μg/L vs. 20 and 9 μg/L, respectively) (Table 1). Initial treatment applied in the former area reduced the concentration of both ions below the parametric value for drinking water (200 and 50 μg/L for iron and manganese, respectively) [25]. Free chlorine concentration was 0.3 mg/L immediately after chlorination, while at the consumer point around 0.1 mg/L residual chlorine was measured in both areas. (Due to the size of the distribution system, there are additional chlorination points in between).
Microbial quality improved considerably during RBF: the colony count at 22 °C was reduced by 97% on average, and faecal indicator bacteria were completely eliminated (except for a single enterococci occurrence in one northern well, Table 1). Water treatment did not lead to significant further removal of heterotrophic plate count bacteria, and bacterial regrowth during distribution was also minimal, based on the results of traditional water quality indicators.
DAPI counts have shown a slightly different picture. The bacterial cell count was 2.2 ± 1.2 × 10⁶/mL and 2.1 ± 0.9 × 10⁶/mL in the Danube upstream and downstream, respectively. RBF resulted in almost two orders of magnitude reduction: mean cell count was 2.5 ± 1.8 × 10⁴/mL and 6.0 ± 5.0 × 10⁴/mL in well water in the north and south study area, respectively. The efficiency of water treatment on the bacterial counts differed by site; chlorination resulted in significantly lower counts in the north, but the impact of the more complex technology in the south was minimal (mean cell counts 430 and 1.1 × 10⁴/mL, respectively). Consumer tap cell counts were similar on average, though variation was high. All samples from the consumer’s tap were fully compliant with the relevant European regulation [25].

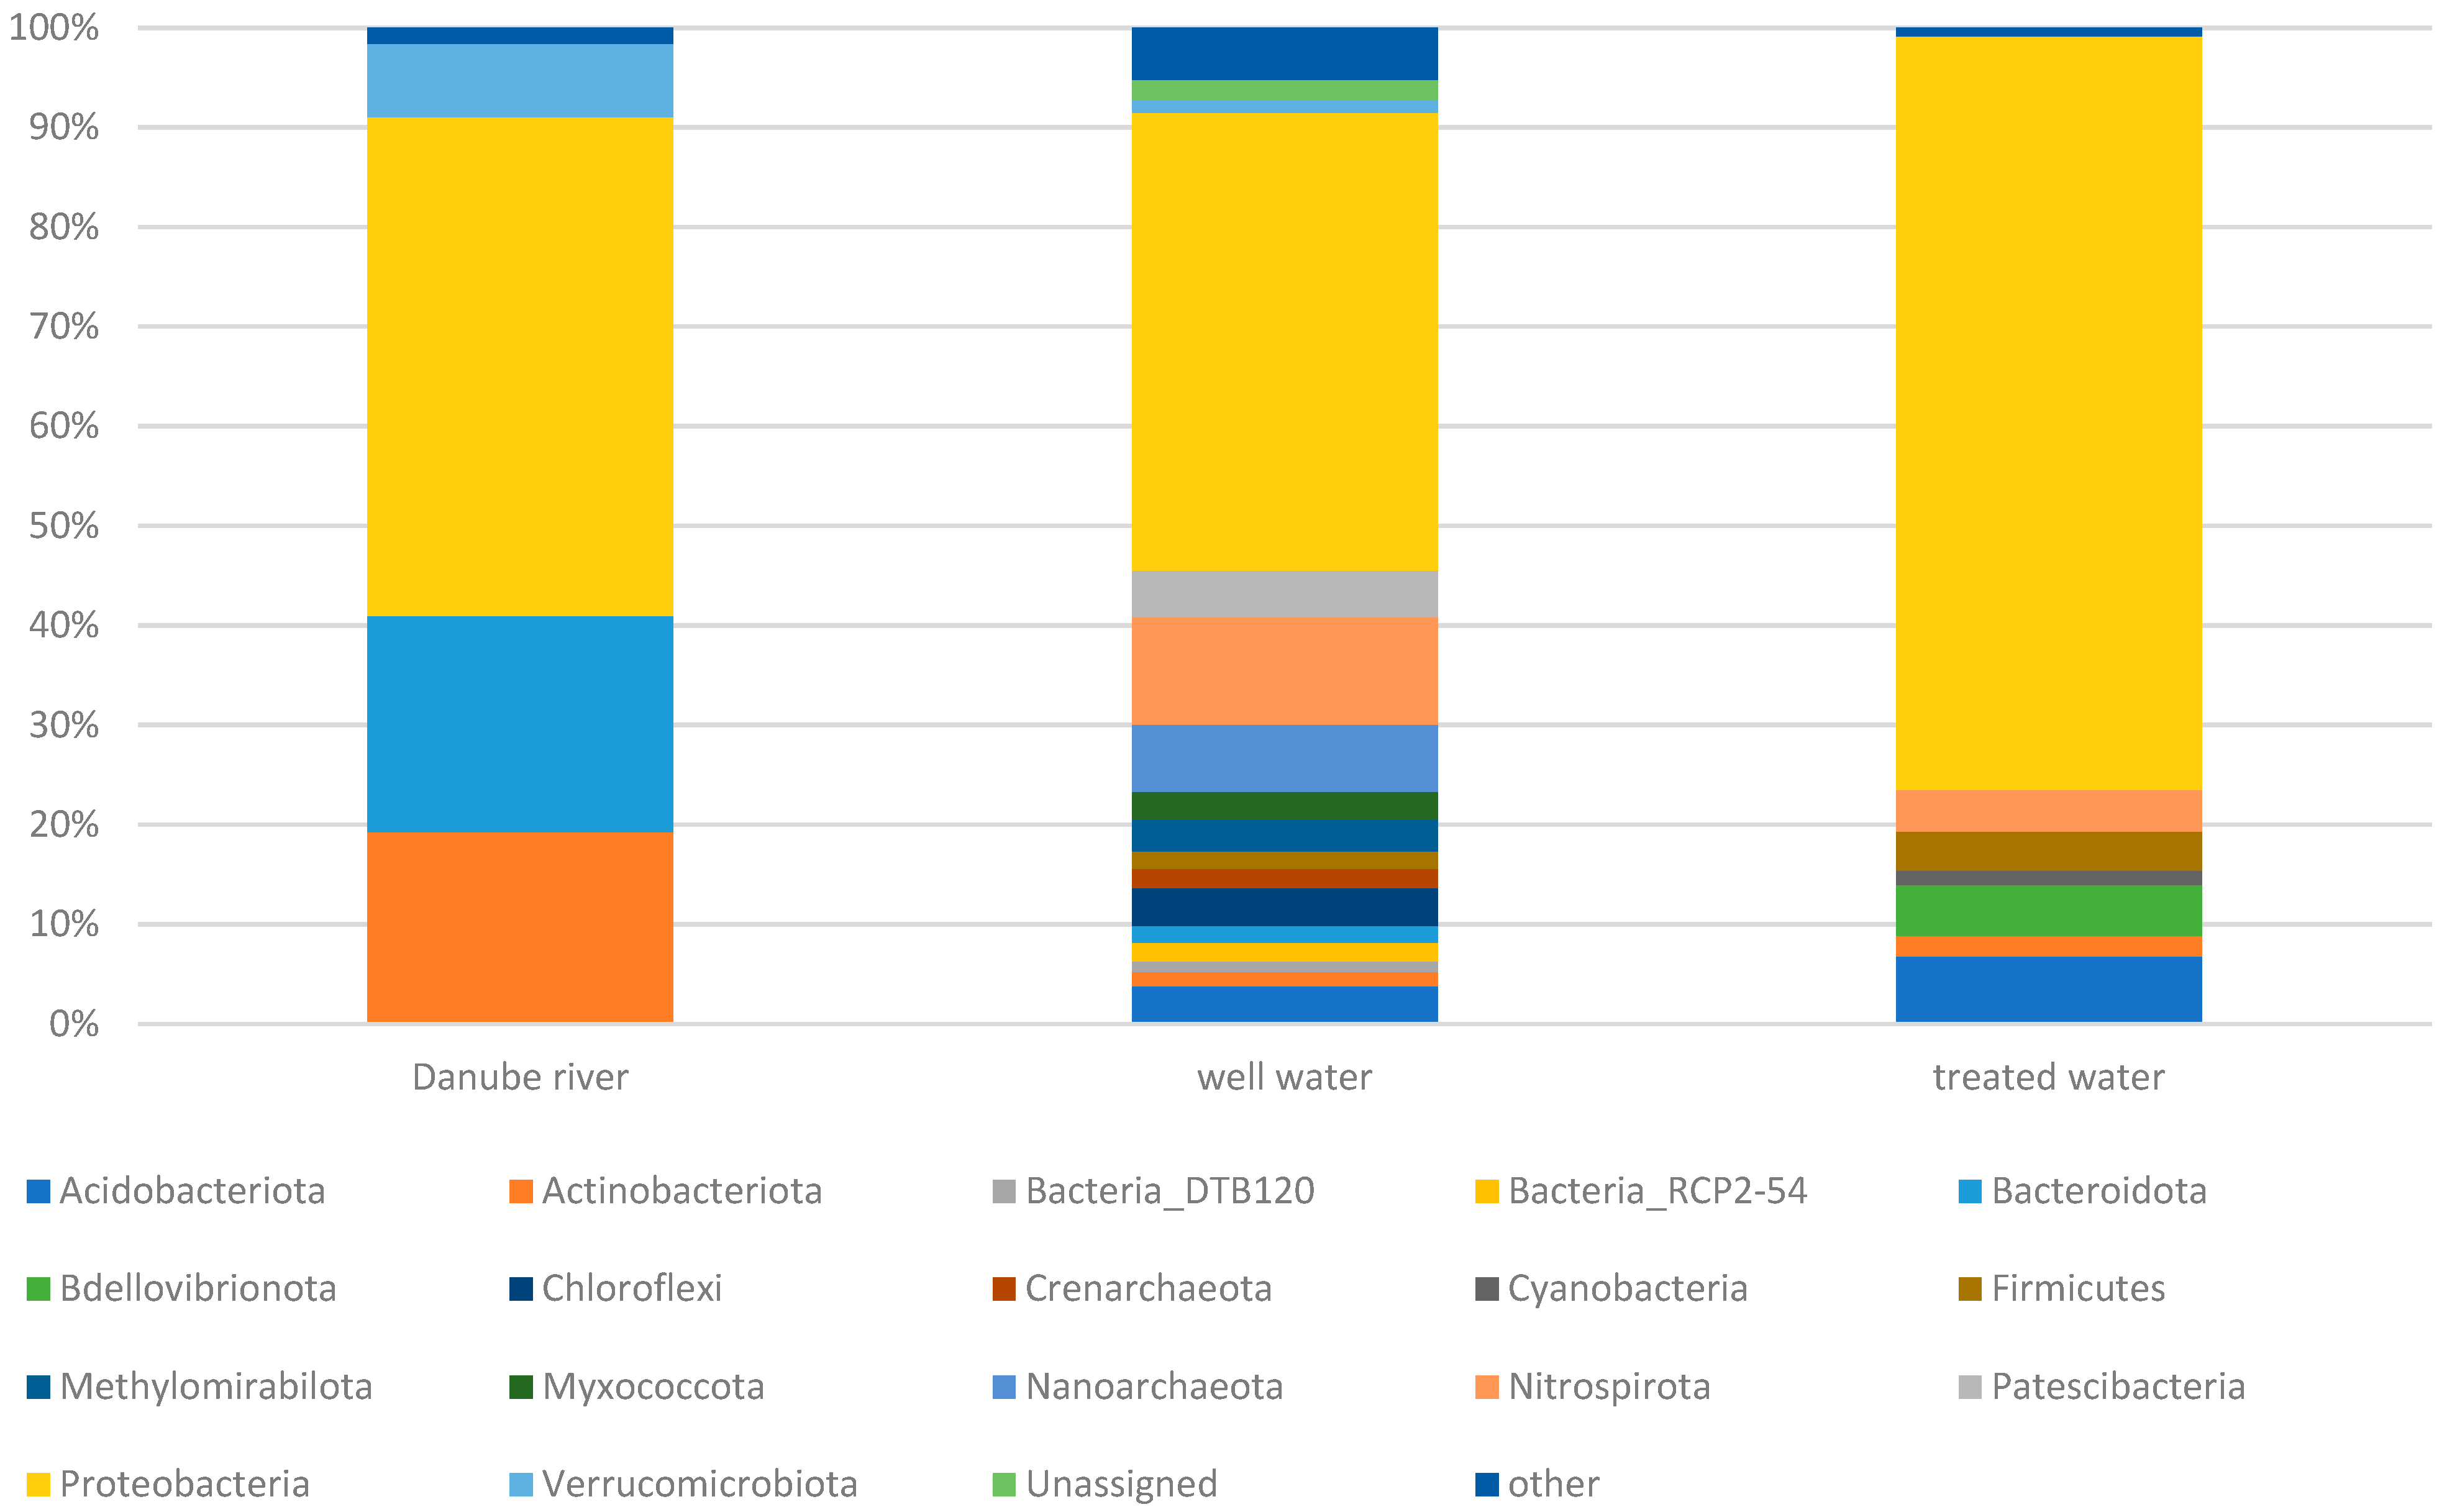
3.2. Microbial Community Diversity

DNA concentrations extracted from concentrated water samples decreased from source to tap (mean concentrations 14.004, 0.084, 0.02, 0.002 ng/μL in river, well, treated water, and tap water, respectively). Concentrations obtained from water and treated water samples from the northern study site were considerably lower than from the southern area. As a consequence, sequencing was less successful. Altogether, 22 and 74 well water samples were sequenced from the north and the south, respectively. The number of treated water samples was lower (2 and 25, respectively). After the 0.005% filtering, 1,301,896 reads were assigned to 141 and 87 OTUs at six and four taxonomic (i.e., genus and order) levels, respectively. Alpha diversity decreased consistently from surface water to well water to treated water (Figure S1). Diversity of water samples collected immediately after treatment and after distribution was similar.
Four, sixteen, and seven phyla were detected in mean relative abundance above 1% in Danube water, well water, and treated water (onsite disinfected samples and consumer’s point samples combined) (Figure 2).
Proteobacteria was the most abundant phylum in all sample types, accounting for approximately half of the sequences in surface water and well water and more than 75% in disinfected samples. Bacteroidota and Actinobacteria comprised approximately 22 and −19% of sequences, respectively, in Danube samples, and 7% belonged to phylum Verrucomicrobiota. Of the latter phyla, only Actinobacteria were also present in both well water and treated water and Bacteroidota in well water, all in low abundance (<2%). In well water, Nitrospirota and the archaeal phylum Nanoarcheota were significant community members based on their abundance (10.6 and 6.7%, respectively), followed by Patescibacteria (4.4%), Chloroflexi (3.9%), Acidobacteriota (3.9%), and Methylomirabilota (3.3%). Mean relative abundance of other phyla was <3%. In treated and disinfected water, mean relative abundance of Acidobacteriota (6.8%) and Firmicutes (3.9%) increased, and Nitrospirota (4.1%) decreased compared to untreated well water. Phyla Bdellovibrionota (5.1%) and Cyanobacteria (1.4%) were unique to disinfected water samples.
On order level, 13, 22, and 15 taxa had mean relative abundance > 1% in surface water, well water and treated water, respectively. Burkholderiales accounted for most sequences in all water types (37.9, 27.4, and 32.2% respectively) (Table S6). Further orders common to all three were Sphingomonadales and Pseudomonadales. Sphingobacteriales was detected both in surface and well water (4.0 and 1.1%), while Rhizobiales, Nitrospirales, and Staphylococcales were detected both in well water and treated water. All other orders were only present in one sample type in mean relative abundance over 1%.
In surface water, Frankiales (15.5%), Flavobacteriales (6.7%), Cytophagales (6.0%), and Chitinophagales (4.8%) were the most abundant taxa. In the wells, Acidiferrobacterales (6.7%), Woesearcheales (6.5%), Rhizobiales (3.8%), and sequences belonging to an uncultured Thermodesulfovibrionia (3.8%) were detected in highest numbers. In the treated water, more orders were present in relatively high abundance, namely Sphingomonadales (10.7%), Rhizobiales (10.7%), Blastocatellales (6.7%), Bdellovibrionales (5.1%), and an uncultured Alphaproteobacteria (5.5%).

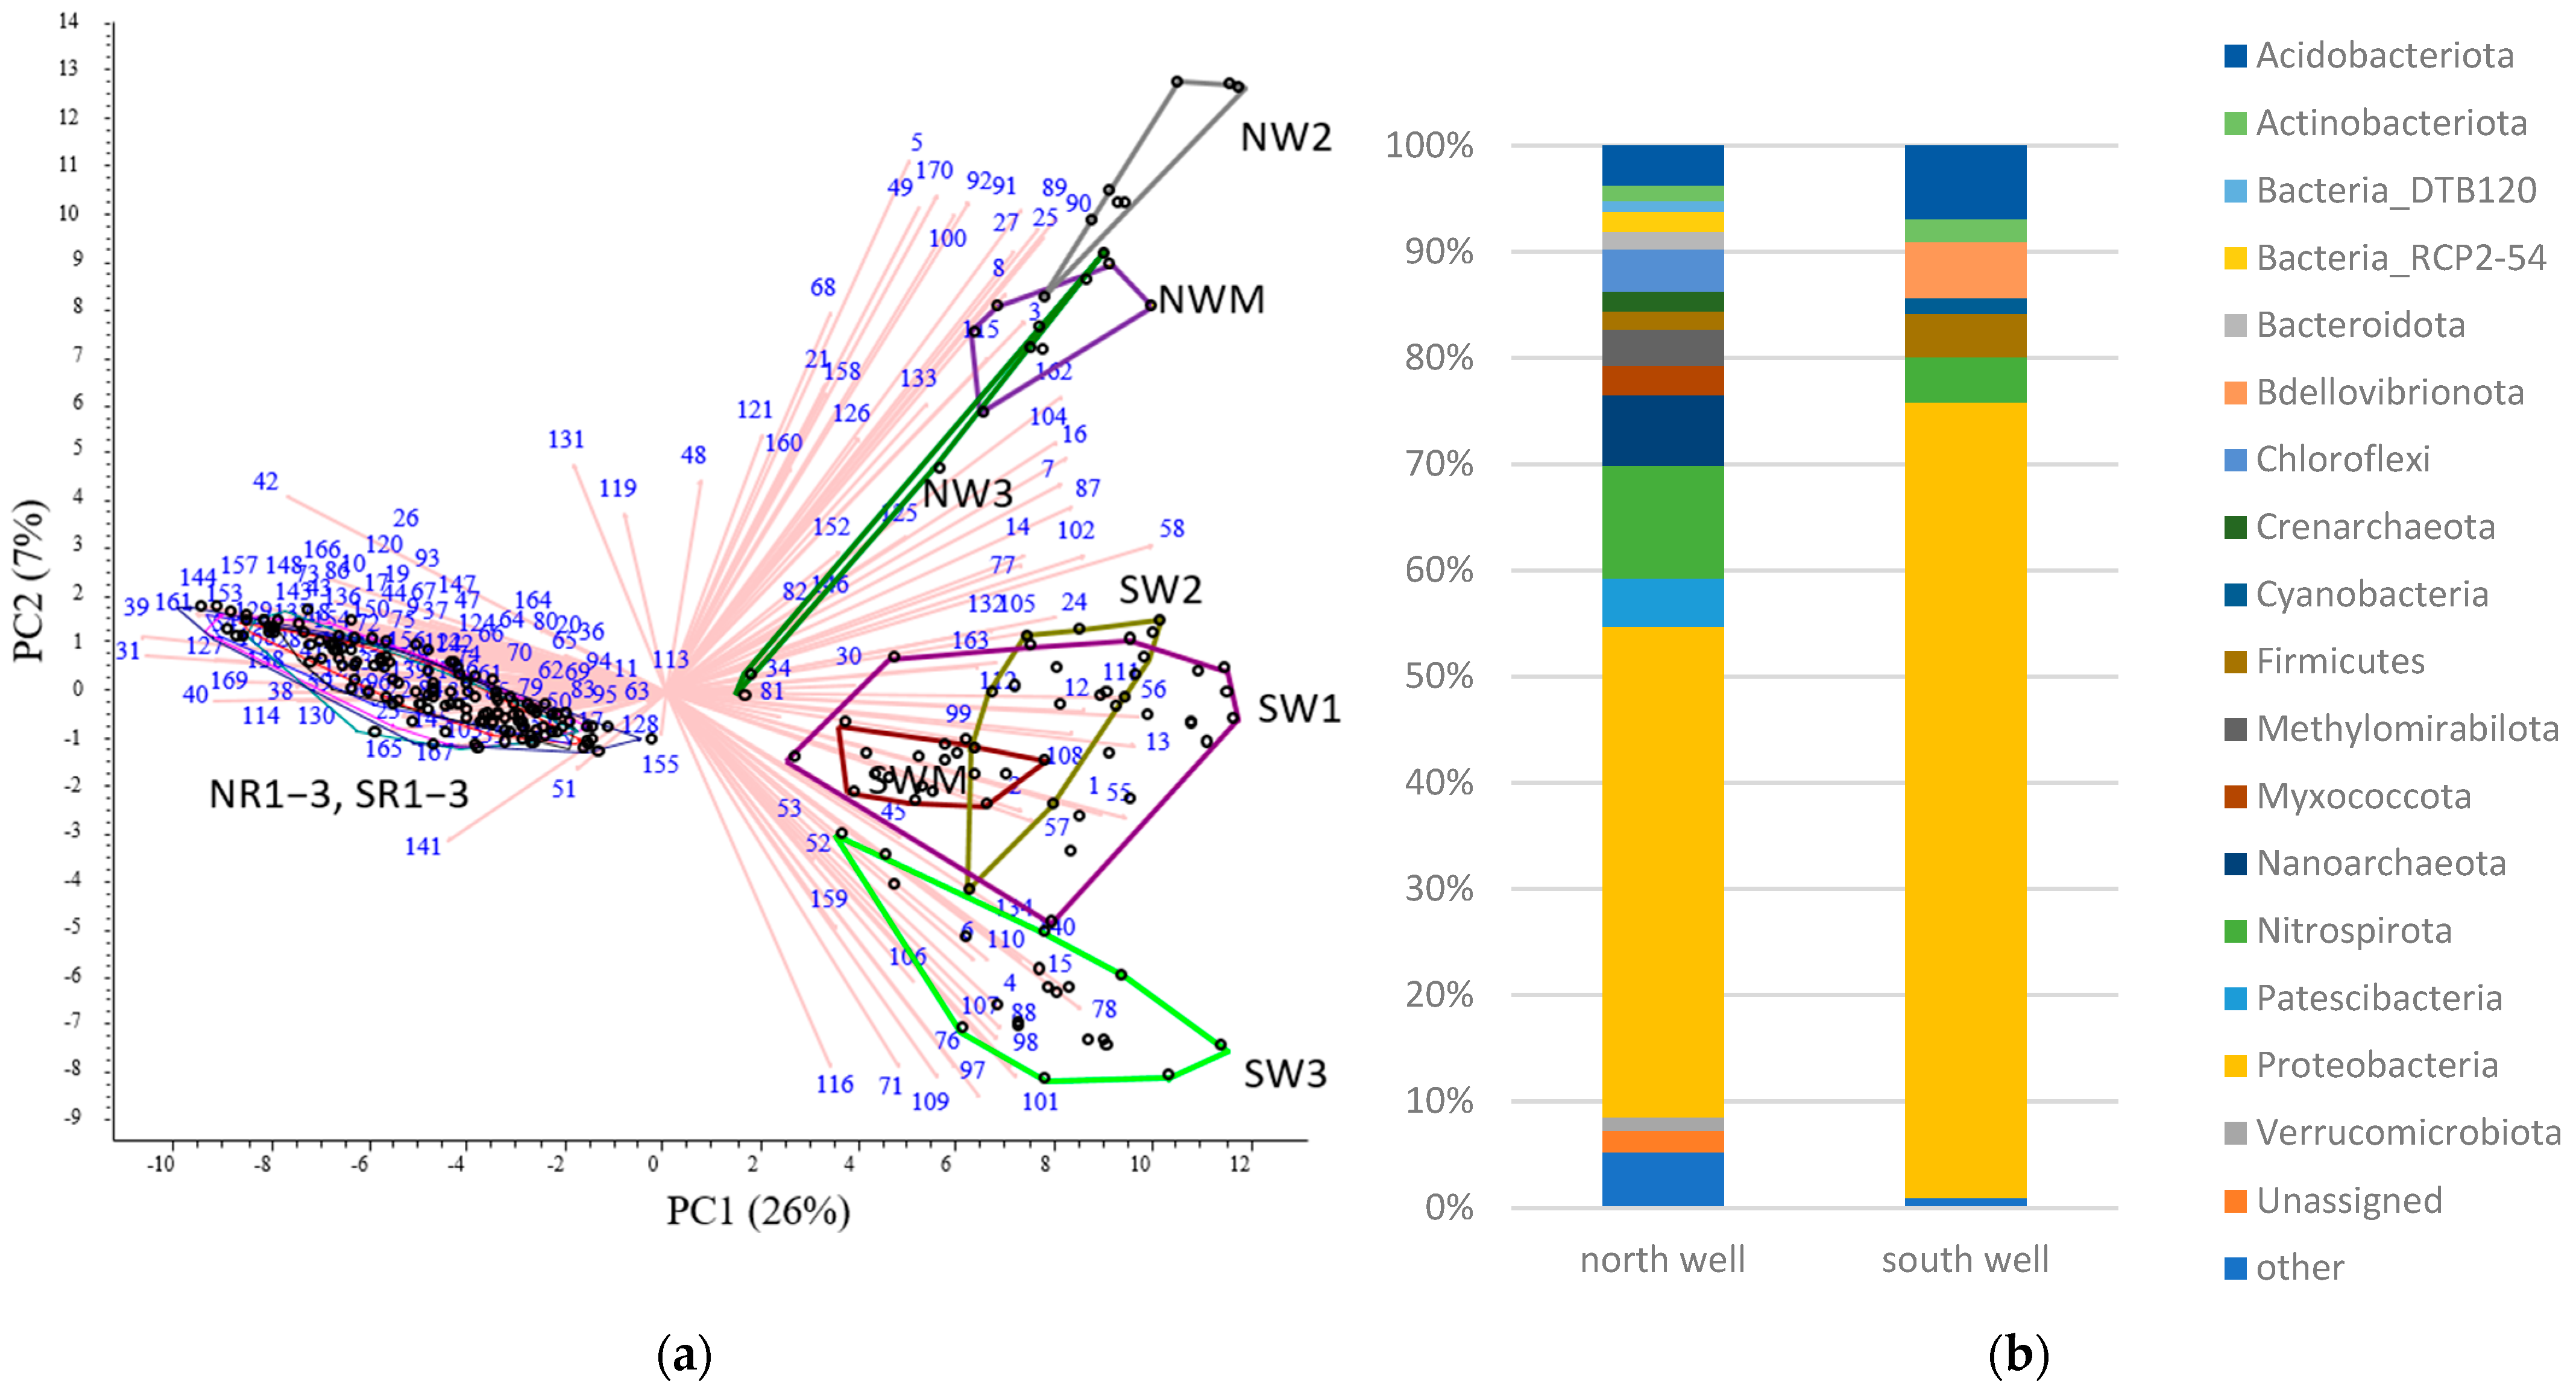
3.3. Impact of Riverbank Filtration on Microbial Communities in the Upstream and Downstream Sites

Wells in the upstream and downstream study area clearly separated both from each other and from surface water samples, regardless of the time or location of sample collection (Figure 3a). Samples from SW3 formed a relatively distinct group from the overlapping SW1, SW2, and SWM. Northern wells (NW2, NW3, and NWM) appeared more similar. Surface water samples of both study sites grouped closely together.
Looking at the relative abundances, the differences between the northern and southern wells were also apparent: phyla Proteobacteria, Nitrospira, Patescibacteria, and Chloroflexi were more abundant in southern wells, while Myxococcata, Methylomirabilota, Bacteroidota, and Acidobacteriota were in the northern wells (Figure 3b). Orders Rokubacterales, Nitrospirales, Rhizobiales, Blastocatellales, and Bdellovibrionales were characteristic of the northern wells, while Kryptoniales, Saccharimonadales, Thiotrichales, and Anaerolineales and several archaeal taxa (Aenigmarcheales, Woesearcheales, Bathyarchaeia) were of the southern wells (Figure 3a and Tables S8 and S9). Several orders grouped with surface water samples, including various Alpha- and Gammaproteobacteria (e.g., Xanthomonadales, Cellovibrionales, Burkholderiales, Pseudomonadales, Rhodobacterales), Actinobacteriota (Frankiales, Microtrichales), and Verrucomicrobiota (Pedosphaerales, Methylacidiphiales) (for the full list, see Table S4). The most abundant order was Burkholderiales in the wells both in the north and the south (17.6 and 30.2%, respectively) (Tables S8 and S9). In the former site, it was followed by Rhizobiales (9.8%), Nitrospirales (6.2%), Sphingomonadales (5.8%), and sequences related to an unclassified Myxococcata (6.2%). In the latter, only sequences belonging to Acidiferrobacterales (8.3%) and an uncultured Thermosulfovibrionia (5.0%) reached 5% relative abundance. On the genus level, Fluviicola, Rhizorhapis, Shingopyxis, Sphingorhabdus, and Methylobacter and the candidatus genera Obscuribacter and Methylomirabilis differentiated the northern wells, while Sulfurifustis, Gallionella, Sideroxydans, Leeia, and Sulfuricella different unidentified Patescibacteria SW3, and Herminiimonas, Dechloromonas, Ferribacterium, Acinetobacter, Enhydrobacter, Perlucidibaca, and the candidatus genus Omnitrophus the other southern wells (Figure S1, Table S5).

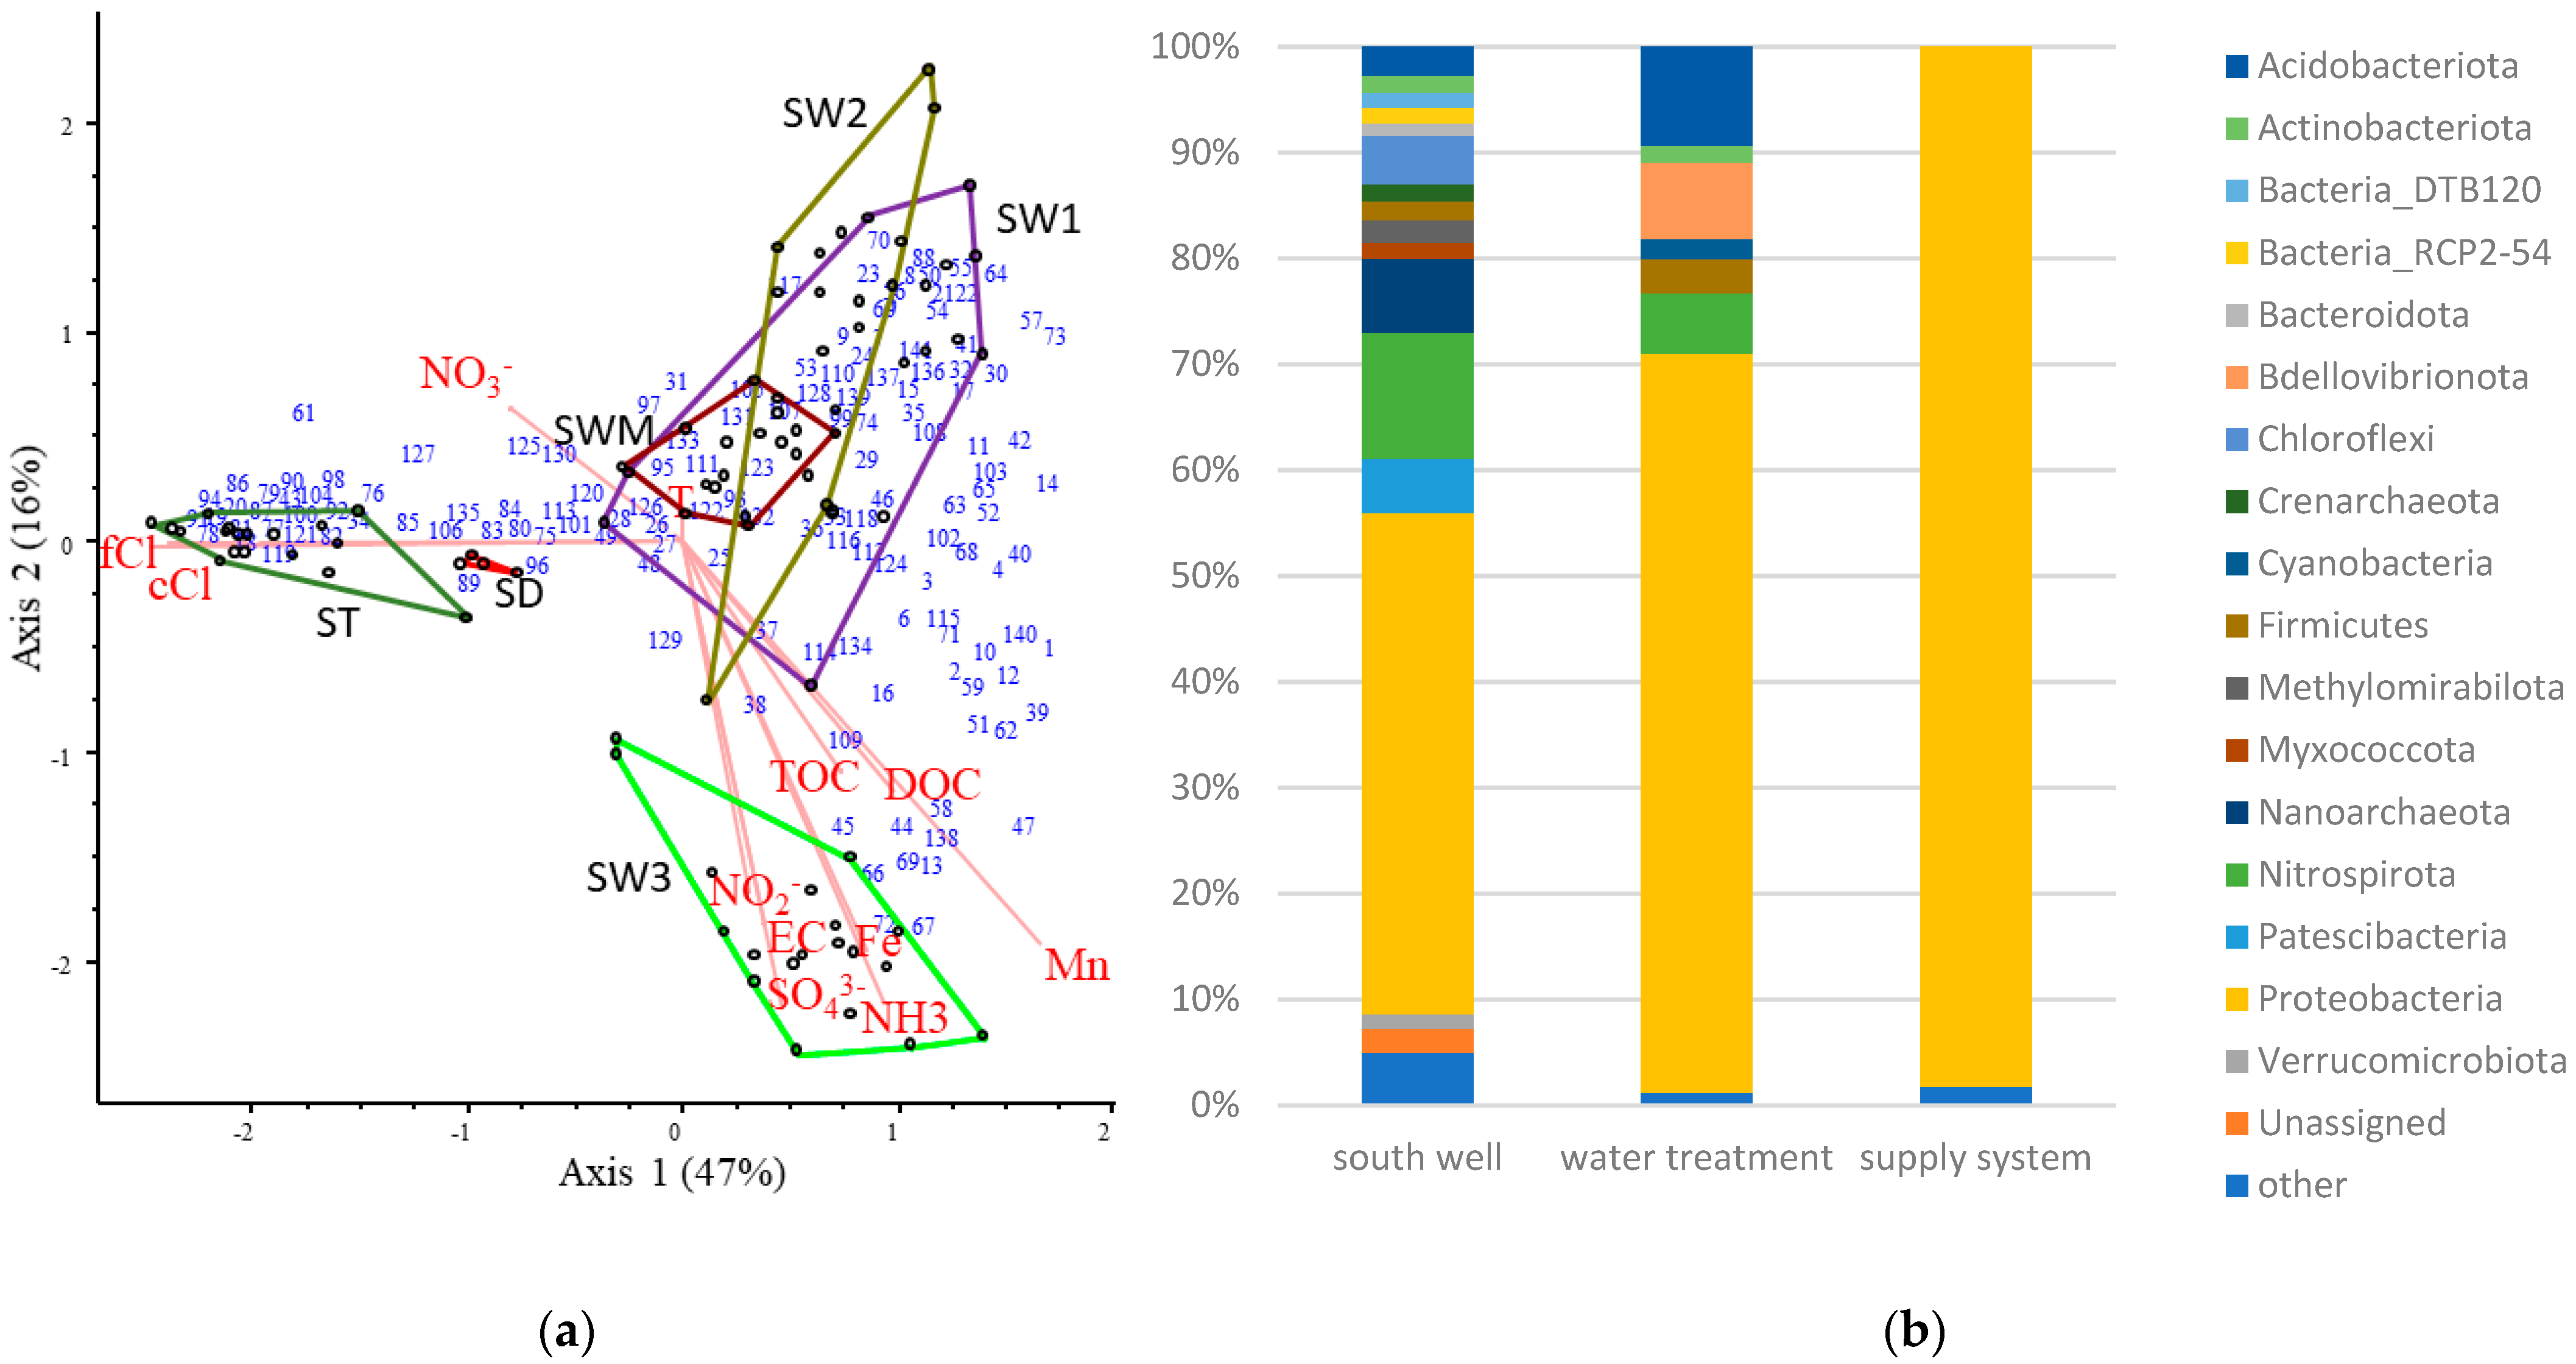
3.4. Impact of Water Treatment and Distribution

Samples collected after water treatment (ozonation, sand filtration, and chlorination) and at the consumer’s tap (after several kms of distribution) formed distinct groups, separated from well water samples (Figure 4a). Chlorination reduced the number of taxa present in relative abundance above 1%: 16 phyla were present in the southern wells, only 8 in the disinfected samples (Figure 4b). Dominance of Proteobacteriaceae increased from 47% relative abundance in the wells to 70% in disinfected water and became exclusive (98%) at the consumer’s tap. Abundance of Acidobacteriota (9%) and Bdellovibrionota (7%) also increased after disinfection. The orders Burkholderiales (22%), Sphingomonadales (14%), Rhizobiales (11%), Blastocellales (7%), and Bdellovibrionales (7%) had the highest relative abundance in the water immediately after disinfection, while samples taken at the consumer’s tap were dominated by Burkholderiales (80%) and Rhizobiales (11%).
Characteristic genera in treated water were mainly Alpha- and Gammaproteobacteria (Nitrospira, Rhizorhapis, Undibacterium, and an uncultured Comamonadaceae) and sequences related to Blastocatellaceae and Bdellovibrio (Figure 4a, Table S5). The genus Phreatobacter was unique to tap water samples, while dominant genera were Gallionella, Sideroxydans, and Burkholderiales TRA3-20 (Figure 4a, Table S5). Not surprisingly, when correlations between chemical characteristics and bacterial community composition were evaluated, free chlorine was the key determinant separating well water and treated water samples (Figure 4a). Other chemical parameters, EC, ammonium, nitrite, sulphate, iron, and manganese TOC and DOC were higher in wells, especially SW3.

3.5. Hydrological Conditions and Seasonality

Danube river discharge varied between 1000 and 5000 m3/s during the year of sampling (Figure 5a). Comparing well water samples collected in southern wells during different hydrological conditions of the river, samples above and below 2000 m3/s separated (data for SW3 is shown in Figure 5b).
Archaeal sequences (mainly related to the orders Woeasarcheales and Aenigmarchaeales) were characteristic of low flow samples. Of the bacterial taxa, phylum Patescibacteria (canditatus taxa Peribacteria and Azambacteria) and the uncultured phyla MBNT15 and WOR-1 were more frequently associated with low flow, while high flow samples were characterised by sequences belonging to Actinobacteriota (Corynebacteriales), Alpha- and Gammaproteobacteria, and Verrucomicrobiota (Figure 5b, Table S5).
No clear seasonal trends were identified in well water samples, though minor shifts in the relative abundance of taxa were observed (Figure S2).

4. Discussion

Research on microbial communities in drinking water supply systems combines two disciplinary interests. From an ecological perspective, it can be considered an ecological continuum, where water treatment steps present as disturbances, reshaping communities [26]. From a public health perspective, the key question is the stability of drinking water quality and the absence of potential pathogens. Understanding community shifts at different stages of water treatment and distribution contribute to safe drinking water supply.
Microbial communities of the hyporheic zones are formed by interactions between surface water and groundwater [8]. The relative impact of the source water depends on hydrological and operational variables, such as distance from the river, water flow, and the intensity of water abstraction. Groundwater is usually characterised by higher EC and often contaminated by ammonium, iron, and manganese. Low TOC and anoxic conditions lead to formation of communities of diverse chemolitotrophic metabolism, contributing to biogeochemical nutrient cycles [27]. Intrusion of surface water is usually reported to reduce microbial diversity and restructure communities. This is, however, more likely to relate to altered environmental conditions resulting from the introduction of water high in oxygen and readily assimilable carbon than surface water microorganisms superseding groundwater communities [2].
In the present study, cell counts were reduced by 1.5–2 orders of magnitude from surface water to well water, indicating high filtration efficiency. Previous studies on rivers Danube and Main found similar cell counts (in the order of magnitude of 106 cells/mL) in river water, but higher counts in well water, indicating good filtration efficiency of the currently investigated wells [8,28]. In agreement with previous studies, cell counts were more stable in river water than in the wells [8]. In the Budapest study area, microbial diversity decreased to approximately one third during RBF. Fillinger et al. [8] observed an opposite trend in a more upstream section of the Danube, but in other systems, microbial communities of the wells became less diverse with increasing distance from the surface water [28,29].
Both the number of phyla and the number of orders with a relative abundance >1% increased in the wells compared to the river. Phylum Proteobacteria, and within that, orders Burkholderiales, Pseudomonadales, and Sphingomonadales, remained abundant during RBF, while the proportion of sequences related to Bacteroidota and Actinobacteria decreased considerably. The reduction in Bacteroidota was previously observed, but Actinobacteria are generally important members of well water communities in metagenomic studies [8,9]. Taxa emerging in the wells (e.g., orders Acidoferrobacterales, Nitrospirales, and other sequences related to phyla Nitrospira and Thermodesulfovibrionia) mainly related to biogeochemical cycles of nitrogen and sulphur [30,31], or the degradation of organic pollutants such as the orders Rhizobiales and the archaeal Woesearcheales [32,33].
Water chemistry of RBF wells differed considerably in the water abstraction sites upstream and downstream from the metropolitan area, in line with the long-term monitoring data. Upstream wells had higher redox potential but lower EC, TOC, ammonium, iron, and manganese concentration. Microbial communities reflect these differences: downstream wells, especially SW3, were characterised by iron oxidising/reducing and sulphur oxidising taxa (e.g., genera Gallionella, Ferribacterium, Sideroxydans, Sulfurifustis, and Sulfuricella). In the upstream wells, methane oxidiser bacteria (Methylobacter, Methylomirabilis) were present. It was also confirmed that the chemical composition of the well water was the key determinant of the observed differences in microbial community structure, similar to other RFB sites [9].
Seasonal trends in well water microbial diversity were not observed in the present study. This finding, at first sight, contradicts previous research on seasonal dynamics of RBF sites, including those conducted further upstream on the Danube, which revealed temporal differences [10,16]. Upon closer inspection, however, the reported shifts were not related to the change in seasons, but to the variations in water level. Increased river water level increases the proportion of surface water in the hyporheic zone, leading to changes in the water chemistry and in turn, microbial diversity. Most taxa characteristic of well water samples collected under low flow conditions were microorganisms known or stipulated to be involved in anaerobic degradation of organic compounds. Woesarcheales is a presumptive anaerobic heterotrophic archaeal order, widespread in inland anoxic environments, which may also contribute to sulphur cycling [32]. Aenigmarchaeales is likely to have similar metabolic traits [34]. Uncultured bacterial phylum MBNT15 was first described from a wetland environment and stipulated to anaerobically degrade a variety of low weight organic substances based on whole genome analysis [35]. There is also indication that some members of the phylum may be involved in dissimilatory iron, nitrogen, and sulphur reduction. The other uncultured bacterial phylum, WOR-1, was detected in anoxic sediments, where it is most likely to contribute to organic carbon degradation and fermentation [36]. Superphylum Patescibacteria harbours ultrasmall bacteria with reduced genome size, which are preferentially adapted to groundwater environments [37]. Microbial communities in the wells during high flow were more similar to surface water, characterised by Proteobacteria, Actinobacteria, and Verrucomicrobiota. Similar shifts were induced by increased water abstraction in other RBF sites along the Danube [16]. The distinct response of microbial community structure in RBF wells indicates vulnerability to projected climate change scenarios [7]. The present study does not imply risk of pathogen breakthrough under the investigated circumstances, but implications for filtration efficiency can only be assessed using a wider evaluation, including the fate of pollutants. The emergence of microorganisms associated with anaerobic carbon degradation stipulate reduced efficiency in the removal of organic substances [19]. Climate vulnerability must be addressed in the operation of the water supply system to maintain safe delivery of drinking water [38].
Water treatment, consisting of ozone oxidation, sand filtration, and chlorination further reduced both cell count and microbial diversity, in line with previous observations [27,39]. Of the above treatment processes, chlorination was shown to have the most significant impact in a water supply system using surface water abstraction [13,40]. Chlorine concentration is the main driver of separation of treated and untreated samples. Increasing dominance of Proteobacteria was observed after chlorination, similarly to other studies [41]. Either sand or granular active carbon filters can even act as a seeding source for colonisation of downstream parts of the water system [41]. Most of the sequences identified after treatment were related to taxa known to proliferate on filters, such as the orders Rhizobiales, Sphingomonadales, Blastocatellales, and Nitrospirales [33,42]. These organisms presumably utilise the C and N sources absorbed on the surface of the filters and can become dominant due to their versatile metabolic profile. Several of the abundant sequence types belonged to chlorine-resistant genera, e.g., the Sphingomonas, Undibacter, or the predatory Bdellovibrio [43,44]. Many of them have also been associated with antimicrobial resistance, e.g., Sphingomonas, Reynella, and Methylobacterium [45,46]. We have also identified genera that may include opportunistic pathogens (e.g., Brevundimonas, Massilia), but at low relative abundance (<3%).
Samples collected from the tap were quite unique in comparison to previous studies on drinking water distribution systems. Though the dominance of Proteobacteria is a relatively common finding in chlorinated systems [41], we observed an unprecedented abundance of sequences related to iron oxidising taxa (genera Gallionella, Sideroxydans and unclassified Gallionaceae and Acidiferrobacteraceae), comprising almost 70% of the sequences. This is probably a highly localised phenomenon, since these taxa are mainly associated with iron pipe corrosion [14,47]. Over 10% of the sequences belonged to an unclassified Burkholderiales group, and several genera were detected in lower abundance (Phreatobacter, Hyphomicrobium, Methylobacterium, Massilia), which have previously been associated with drinking water biofilms [43,45]. However, none of the commonly found bacteria of health concern, such as Legionella or Mycobacterium were detected in relative abundance above 1%. Neither culturable colony counts, cell counts, or bacterial diversity, which could also be indicative of regrowth, increased significantly compared to primary disinfected water.
Growing chemical contamination of surface waters, combined with increasing water demand, generate further interest in natural cleaning processes such as RBF that can reduce pollution without the addition of chemicals. Identification of key community members is indicative of the biochemical processes and pollutant removal potential and mechanism. Functional metagenomic analysis of RBF communities can provide further insight in metabolic pathways. Better understanding of the natural filtration processes and the role of the microbial communities in water purification is a key factor to maintain safe and sustainable drinking water production in the future under changing climate and hydrological regime.

Supplementary Materials

The following supporting information can be downloaded at: https://www.mdpi.com/article/10.3390/d15050621/s1, Figure S1 Diversity indexes; Figure S2: Seasonal variation of microbial community in the southern wells’ indexes; Tables S1–S3: Statistical tables; Table S4: List of OTUs corresponding to the numbering in Figure 2a; Table S5: List of OTUs corresponding to the numbering in Figure 3a, Figure 4a and Figure 5b; Tables S6 and S7: Microbial community structure comparison of river water (NR1-3 and SR1-3) well waters and treated water samples; Tables S8 and S9: Microbial community structure comparison of northern wells (NW2, NW3, NWM) and southern wells (SW1, SW2, SW3, SWM); Tables S10 and S11: Microbial community structure comparison of southern wells, during water treatment and in the supply system.

Author Contributions

Conceptualization, M.V. and A.I.E.; methodology, M.V., A.I.E., P.B.K. and Z.N.-K.; formal analysis, A.I.E., P.B.K. and N.E.; investigation, A.I.E., K.N., E.R. and N.E.; data curation, A.I.E. and P.B.K.; writing—original draft preparation, M.V., A.I.E., E.R. and N.E.; writing—review and editing, Z.N.-K.; visualization, E.R. and A.I.E.; funding acquisition, A.I.E. and M.V. All authors have read and agreed to the published version of the manuscript.

Funding

This research was funded by the National Research, Development and Innovation Fund of Hungary, grant number 2018-1.2.1-NKP-2018-00011.

Institutional Review Board Statement

Not applicable.

Data Availability Statement

The raw sequence data in fastq format were deposited in NCBI as BioProject PRJNA838445 and will be publicly released upon publication of the manuscript.

Acknowledgments

The authors would like to acknowledge all project partners: Centre for Ecological Research, Eötvös Loránd Research Network, National Public Health Centre, Budapest University of Technology and Economics, Miskolc University, and Budapest Waterworks.

Conflicts of Interest

The authors declare no conflict of interest.

References

  1. Hoppe-Jones, C.; Oldham, G.; Drewes, J.E. Attenuation of Total Organic Carbon and Unregulated Trace Organic Chemicals in U.S. Riverbank Filtration Systems. Water Res. 2010, 44, 4643–4659. [Google Scholar] [CrossRef]
  2. Stegen, J.C.; Fredrickson, J.K.; Wilkins, M.J.; Konopka, A.E.; Nelson, W.C.; Arntzen, E.V.; Chrisler, W.B.; Chu, R.K.; Danczak, R.E.; Fansler, S.J.; et al. Groundwater–Surface Water Mixing Shifts Ecological Assembly Processes and Stimulates Organic Carbon Turnover. Nat. Commun. 2016, 7, 11237. [Google Scholar] [CrossRef]
  3. Wang, H.; Knabe, D.; Engelhardt, I.; Droste, B.; Rohns, H.-P.; Stumpp, C.; Ho, J.; Griebler, C. Dynamics of Pathogens and Fecal Indicators during Riverbank Filtration in Times of High and Low River Levels. Water Res. 2022, 209, 117961. [Google Scholar] [CrossRef]
  4. Bartak, R.; Page, D.; Sandhu, C.; Grischek, T.; Saini, B.; Mehrotra, I.; Jain, C.K.; Ghosh, N.C. Application of Risk-Based Assessment and Management to Riverbank Filtration Sites in India. J. Water Health 2015, 13, 174–189. [Google Scholar] [CrossRef] [PubMed]
  5. Nagy-Kovács, Z.; Davidesz, J.; Czihat-Mártonné, K.; Till, G.; Fleit, E.; Grischek, T. Water Quality Changes during Riverbank Filtration in Budapest, Hungary. Water 2019, 11, 302. [Google Scholar] [CrossRef]
  6. Sprenger, C.; Hartog, N.; Hernández, M.; Vilanova, E.; Grützmacher, G.; Scheibler, F.; Hannappel, S. Inventory of Managed Aquifer Recharge Sites in Europe: Historical Development, Current Situation and Perspectives. Hydrogeol. J. 2017, 25, 1909–1922. [Google Scholar] [CrossRef]
  7. Sprenger, C.; Lorenzen, G.; Hülshoff, I.; Grützmacher, G.; Ronghang, M.; Pekdeger, A. Vulnerability of Bank Filtration Systems to Climate Change. Sci. Total Environ. 2011, 409, 655–663. [Google Scholar] [CrossRef] [PubMed]
  8. Fillinger, L.; Hug, K.; Griebler, C. Aquifer Recharge Viewed through the Lens of Microbial Community Ecology: Initial Disturbance Response, and Impacts of Species Sorting versus Mass Effects on Microbial Community Assembly in Groundwater during Riverbank Filtration. Water Res. 2021, 189, 116631. [Google Scholar] [CrossRef]
  9. Meng, L.; Zuo, R.; Wang, J.; Yang, J.; Li, Q.; Chen, M. The Spatial Variations of Correlation between Microbial Diversity and Groundwater Quality Derived from a Riverbank Filtration Site, Northeast China. Sci. Total Environ. 2020, 706, 135855. [Google Scholar] [CrossRef]
  10. Zuo, R.; Xue, Z.; Wang, J.; Meng, L.; Zhao, X.; Pan, M.; Cai, W. Spatiotemporal Variations of Redox Conditions and Microbial Responses in a Typical River Bank Filtration System with High Fe2+ and Mn2+ Contents. J. Hydrol. 2022, 609, 127777. [Google Scholar] [CrossRef]
  11. Lee, J.-H.; Lee, B.-J.; Unno, T. Bacterial Communities in Ground-and Surface Water Mixing Zone Induced by Seasonal Heavy Extraction of Groundwater. Geomicrobiol. J. 2018, 35, 768–774. [Google Scholar] [CrossRef]
  12. Yang, F.; Yue, S.; Wu, X.; Zhang, C.; Li, D.; Zhu, R. Effects of Flood Inundation on Biogeochemical Processes in Groundwater during Riverbank Filtration. J. Hydrol. 2023, 617, 129101. [Google Scholar] [CrossRef]
  13. Pinar-Méndez, A.; Wangensteen, O.S.; Præbel, K.; Galofré, B.; Méndez, J.; Blanch, A.R.; García-Aljaro, C. Monitoring Bacterial Community Dynamics in a Drinking Water Treatment Plant: An Integrative Approach Using Metabarcoding and Microbial Indicators in Large Water Volumes. Water 2022, 14, 1435. [Google Scholar] [CrossRef]
  14. Waak, M.B.; Hozalski, R.M.; Hallé, C.; LaPara, T.M. Comparison of the Microbiomes of Two Drinking Water Distribution Systems—With and without Residual Chloramine Disinfection. Microbiome 2019, 7, 87. [Google Scholar] [CrossRef] [PubMed]
  15. Liu, G.; Verberk, J.Q.J.C.; Van Dijk, J.C. Bacteriology of Drinking Water Distribution Systems: An Integral and Multidimensional Review. Appl. Microbiol. Biotechnol. 2013, 97, 9265–9276. [Google Scholar] [CrossRef] [PubMed]
  16. Fiedler, C.J.; Schönher, C.; Proksch, P.; Kerschbaumer, D.J.; Mayr, E.; Zunabovic-Pichler, M.; Domig, K.J.; Perfler, R. Assessment of Microbial Community Dynamics in River Bank Filtrate Using High-Throughput Sequencing and Flow Cytometry. Front. Microbiol. 2018, 9, 2887. [Google Scholar] [CrossRef]
  17. Gomez-Alvarez, V.; Siponen, S.; Kauppinen, A.; Hokajärvi, A.-M.; Tiwari, A.; Sarekoski, A.; Miettinen, I.T.; Torvinen, E.; Pitkänen, T. A Comparative Analysis Employing a Gene- and Genome-Centric Metagenomic Approach Reveals Changes in Composition, Function, and Activity in Waterworks with Different Treatment Processes and Source Water in Finland. Water Res. 2023, 229, 119495. [Google Scholar] [CrossRef]
  18. Han, Z.; An, W.; Yang, M.; Zhang, Y. Assessing the Impact of Source Water on Tap Water Bacterial Communities in 46 Drinking Water Supply Systems in China. Water Res. 2020, 172, 115469. [Google Scholar] [CrossRef]
  19. Rudolf von Rohr, M.; Hering, J.G.; Kohler, H.-P.E.; von Gunten, U. Column Studies to Assess the Effects of Climate Variables on Redox Processes during Riverbank Filtration. Water Res. 2014, 61, 263–275. [Google Scholar] [CrossRef]
  20. Takahashi, S.; Tomita, J.; Nishioka, K.; Hisada, T.; Nishijima, M. Development of a Prokaryotic Universal Primer for Simultaneous Analysis of Bacteria and Archaea Using Next-Generation Sequencing. PLoS ONE 2014, 9, e105592. [Google Scholar] [CrossRef]
  21. Bolyen, E.; Rideout, J.R.; Dillon, M.R.; Bokulich, N.A.; Abnet, C.C.; Al-Ghalith, G.A.; Alexander, H.; Alm, E.J.; Arumugam, M.; Asnicar, F.; et al. Reproducible, Interactive, Scalable and Extensible Microbiome Data Science Using QIIME 2. Nat. Biotechnol. 2019, 37, 852–857. [Google Scholar] [CrossRef] [PubMed]
  22. Rognes, T.; Flouri, T.; Nichols, B.; Quince, C.; Mahé, F. VSEARCH: A Versatile Open Source Tool for Metagenomics. PeerJ 2016, 4, e2584. [Google Scholar] [CrossRef]
  23. Bokulich, N.A.; Subramanian, S.; Faith, J.J.; Gevers, D.; Gordon, J.I.; Knight, R.; Mills, D.A.; Caporaso, J.G. Quality-Filtering Vastly Improves Diversity Estimates from Illumina Amplicon Sequencing. Nat. Methods 2013, 10, 57–59. [Google Scholar] [CrossRef]
  24. Podani, J. SYN-TAX Computer Programs for Data Analysis in Ecology and Systematics. User’s Manual; Scientia: Budapest, Hungary, 2001. [Google Scholar]
  25. European Council Directive 98/83/EC of 3 November 1998 on the Quality of Water Intended for Human Consumption. Off. J. Eur. Union 1998, L330, 32–54. Available online: https://eur-lex.europa.eu/legal-content/EN/TXT/?uri=CELEX:31998L0083 (accessed on 20 March 2023).
  26. Zhang, Y.; Oh, S.; Liu, W. Impact of Drinking Water Treatment and Distribution on the Microbiome Continuum: An Ecological Disturbance’s Perspective. Environ. Microbiol. 2017, 19, 3163–3174. [Google Scholar] [CrossRef]
  27. Bruno, A.; Agostinetto, G.; Fumagalli, S.; Ghisleni, G.; Sandionigi, A. It’s a Long Way to the Tap: Microbiome and DNA-Based Omics at the Core of Drinking Water Quality. Int. J. Environ. Res. Public Health 2022, 19, 7940. [Google Scholar] [CrossRef]
  28. van Driezum, I.H.; Chik, A.H.S.; Jakwerth, S.; Lindner, G.; Farnleitner, A.H.; Sommer, R.; Blaschke, A.P.; Kirschner, A.K.T. Spatiotemporal Analysis of Bacterial Biomass and Activity to Understand Surface and Groundwater Interactions in a Highly Dynamic Riverbank Filtration System. Sci. Total Environ. 2018, 627, 450–461. [Google Scholar] [CrossRef] [PubMed]
  29. Xia, X.; Zhai, Y.; Teng, Y. Microbial Response to Biogeochemical Profile in a Perpendicular Riverbank Filtration Site. Ecotoxicol. Environ. Saf. 2022, 244, 114070. [Google Scholar] [CrossRef]
  30. Kojima, H.; Shinohara, A.; Fukui, M. Sulfurifustis Variabilis Gen. Nov., Sp. Nov., a Sulfur Oxidizer Isolated from a Lake, and Proposal of Acidiferrobacteraceae Fam. Nov. and Acidiferrobacterales Ord. Nov. Int. J. Syst. Evol. Microbiol. 2015, 65, 3709–3713. [Google Scholar] [CrossRef] [PubMed]
  31. Yan, L.; Herrmann, M.; Kampe, B.; Lehmann, R.; Totsche, K.U.; Küsel, K. Environmental Selection Shapes the Formation of Near-Surface Groundwater Microbiomes. Water Res. 2020, 170, 115341. [Google Scholar] [CrossRef]
  32. Liu, X.; Li, M.; Castelle, C.J.; Probst, A.J.; Zhou, Z.; Pan, J.; Liu, Y.; Banfield, J.F.; Gu, J.-D. Insights into the Ecology, Evolution, and Metabolism of the Widespread Woesearchaeotal Lineages. Microbiome 2018, 6, 102. [Google Scholar] [CrossRef]
  33. Oh, S.; Hammes, F.; Liu, W.-T. Metagenomic Characterization of Biofilter Microbial Communities in a Full-Scale Drinking Water Treatment Plant. Water Res. 2018, 128, 278–285. [Google Scholar] [CrossRef]
  34. Vigneron, A.; Cruaud, P.; Lovejoy, C.; Vincent, W.F. Genomic Evidence of Functional Diversity in DPANN Archaea, from Oxic Species to Anoxic Vampiristic Consortia. ISME Commun. 2022, 2, 4. [Google Scholar] [CrossRef]
  35. Begmatov, S.; Beletsky, A.V.; Dedysh, S.N.; Mardanov, A.V.; Ravin, N.V. Genome Analysis of the Candidate Phylum MBNT15 Bacterium from a Boreal Peatland Predicted Its Respiratory Versatility and Dissimilatory Iron Metabolism. Front. Microbiol. 2022, 13, 951761. [Google Scholar] [CrossRef]
  36. Baker, B.J.; Lazar, C.S.; Teske, A.P.; Dick, G.J. Genomic Resolution of Linkages in Carbon, Nitrogen, and Sulfur Cycling among Widespread Estuary Sediment Bacteria. Microbiome 2015, 3, 14. [Google Scholar] [CrossRef] [PubMed]
  37. Tian, R.; Ning, D.; He, Z.; Zhang, P.; Spencer, S.J.; Gao, S.; Shi, W.; Wu, L.; Zhang, Y.; Yang, Y.; et al. Small and Mighty: Adaptation of Superphylum Patescibacteria to Groundwater Environment Drives Their Genome Simplicity. Microbiome 2020, 8, 51. [Google Scholar] [CrossRef] [PubMed]
  38. Nagy-Kovács, Z.; László, B.; Simon, E.; Fleit, E. Operational Strategies and Adaptation of RBF Well Construction to Cope with Climate Change Effects at Budapest, Hungary. Water 2018, 10, 1751. [Google Scholar] [CrossRef]
  39. Tiwari, A.; Hokajärvi, A.-M.; Domingo, J.S.; Elk, M.; Jayaprakash, B.; Ryu, H.; Siponen, S.; Vepsäläinen, A.; Kauppinen, A.; Puurunen, O.; et al. Bacterial Diversity and Predicted Enzymatic Function in a Multipurpose Surface Water System—From Wastewater Effluent Discharges to Drinking Water Production. Environ. Microbiome 2021, 16, 11. [Google Scholar] [CrossRef]
  40. Inkinen, J.; Siponen, S.; Jayaprakash, B.; Tiwari, A.; Hokajärvi, A.-M.; Pursiainen, A.; Ikonen, J.; Kauppinen, A.; Miettinen, I.T.; Paananen, J.; et al. Diverse and Active Archaea Communities Occur in Non-Disinfected Drinking Water Systems–Less Activity Revealed in Disinfected and Hot Water Systems. Water Res. X 2021, 12, 100101. [Google Scholar] [CrossRef]
  41. Zhou, W.; Li, W.; Chen, J.; Zhou, Y.; Wei, Z.; Gong, L. Microbial Diversity in Full-Scale Water Supply Systems through Sequencing Technology: A Review. RSC Adv. 2021, 11, 25484–25496. [Google Scholar] [CrossRef]
  42. Choi, Y.; Cha, Y.; Kim, B. Characteristics of Bacterial Communities in Biological Filters of Full-Scale Drinking Water Treatment Plants. J. Microbiol. Biotechnol. 2019, 29, 91–104. [Google Scholar] [CrossRef] [PubMed]
  43. Fish, K.E.; Boxall, J.B. Biofilm Microbiome (Re)Growth Dynamics in Drinking Water Distribution Systems Are Impacted by Chlorine Concentration. Front. Microbiol. 2018, 9, 2519. [Google Scholar] [CrossRef] [PubMed]
  44. Miao, X.; Han, X.; Liu, C.; Bai, X. Intrinsic Chlorine Resistance of Bacteria Modulated by Glutaminyl-TRNA Biosynthesis in Drinking Water Supply Systems. Chemosphere 2022, 308, 136322. [Google Scholar] [CrossRef] [PubMed]
  45. Chen, J.; Li, W.; Zhang, J.; Qi, W.; Li, Y.; Chen, S.; Zhou, W. Prevalence of Antibiotic Resistance Genes in Drinking Water and Biofilms: The Correlation with the Microbial Community and Opportunistic Pathogens. Chemosphere 2020, 259, 127483. [Google Scholar] [CrossRef] [PubMed]
  46. Ullmann, I.F.; Tunsjø, H.S.; Andreassen, M.; Nielsen, K.M.; Lund, V.; Charnock, C. Detection of Aminoglycoside Resistant Bacteria in Sludge Samples From Norwegian Drinking Water Treatment Plants. Front. Microbiol. 2019, 10, 487. [Google Scholar] [CrossRef]
  47. Issotta, F.; Moya-Beltrán, A.; Mena, C.; Covarrubias, P.C.; Thyssen, C.; Bellenberg, S.; Sand, W.; Quatrini, R.; Vera, M. Insights into the Biology of Acidophilic Members of the Acidiferrobacteraceae Family Derived from Comparative Genomic Analyses. Res. Microbiol. 2018, 169, 608–617. [Google Scholar] [CrossRef] [PubMed]
Figure 1. Study area and sampling location. The two RBF areas are located upstream (north sampling area) and downstream (south sampling area) from Budapest on the Danube River. Red signals indicate sampling locations of Danube River water near the abstraction sites (NR1-3, SR1-3). Three bank filtered wells (NW1-3, SW1-3), water treatment (NT, ST), and a consumer’s tap (ND, SD; indicated by blue flags) were sampled in each study area. Abbreviations: N—north; S—south; R—river; W—well; T—treatment; D—distribution system.
Diversity 15 00621 g001
Figure 2. Microbial community structure comparison of river water (NR1-3 and SR1-3) well waters and treated water samples. Visualization of relative abundance of sequences at phylum level. Phyla with abundance below 1% are indicated as “other”. Relative abundances at phylum and order level are presented in Tables S6 and S7a,b, respectively.
Diversity 15 00621 g002
Figure 3. (a) Principal component analysis of the microbial community structure of Danube water samples (NR1−3, SR1−3), northern wells (NW2, NW3, NWM) and southern wells (SW1, SW2, SW3, SWM). NWM/SWM: mixed water of several individual wells. Polygons enclose samples belonging to the same sampling location. Numbers indicate OTUs; for a full list, see Table S4. (b) Visualization of relative abundance of sequences at phylum level. Phyla with abundance below 1% are indicated as “other”. Relative abundances at phylum and order level are presented in Tables S8 and S9 respectively.
Diversity 15 00621 g003
Figure 4. (a) Redundancy analysis of environmental variables and relative abundance values. Southern well (SW1, SW2, SW3, SWM), treated water (ST), and consumer’s tap (SD) samples are compared. Polygons enclose samples belonging to the same sampling location. Numbers indicate OTUs; for the full list, see Table S5. Physicochemical variables: T−temperature; EC−electric conductivity; cCl−combined chlorine; fCl−free chlorine. Other parameters are labelled by their chemical name. (b) Visualization of relative abundance of sequences at phylum level. Phyla with abundance below 1% are indicated as “other”. Relative abundances at phylum and order level are presented in Tables S6 and S7, respectively.
Diversity 15 00621 g004
Figure 5. (a) Danube river water discharge during the sampling period. (b) Principal component analysis of relative abundance values in southern wells. Polygons enclose samples belonging to high (≥2000 m3/s) and low (<2000 m3/s) flow. Numbers indicate OTUs; for the full list, see Table S5.
Diversity 15 00621 g005
Table 1. Physicochemical and microbiological characteristics of the water samples collected in the one-year sampling campaign. NR: average of the samples of three north river sampling locations (NR1-3); NW: average of the samples of three northern wells (NW1-3); NT: north treated sample; ND: north consumer’s tap; SR: average of the samples of three south river sampling locations (SR1-3); SW: average of the samples of three southern wells (SW1-3); ST: south treated sample; SD: south consumer’s tap.
NRNWNTNDSRSWSTSD
ParameterMean
(Min–Max)
Mean
(Min–Max)
Mean
(Min–Max)
Mean
(Min–Max)
Mean
(Min–Max)
Mean
(Min–Max)
Mean
(Min–Max)
Mean
(Min–Max)
T (°C)11.5
(1.6–23.8)
11.7
(7.2–14.9)
12.3
(10.1–15)
15.4
(7.3–23.6)
11.5
(1–22.9)
11.8
(7.2–16.2)
11.9
(8.6–15.7)
16.4
(14.6–20)
pH7.6
(6.5–8.4)
7.6
(7.3–7.9)
7.7
(7.4–7.8)
7.5
(7–7.8)
7.8
(7.1–8.4)
7.7
(6.7–7.9)
7.6
(6.8–7.9)
7.6
(7.3–7.9)
Electric conductivity (µS/cm)340
(250–430)
561
(439–728)
516
(440–562)
540
(462–774)
350
(260–440)
580
(448–783)
554
(481–632)
620
(505–712)
Redox potential (mV)97
(5–270)
222
(151–294)
591
(315–656)
489
(258–580)
93
(3.8–218)
134
(4.5–245)
178
(128–275)
222
(157–317)
NH3 (mg/L)0.1
(<LOD–0.2)
<LOD<LOD<LOD0.1
(<LOD–0.3)
<LOD
(<LOD–0.1)
<LOD
(<LOD–0.1)
<LOD
(<LOD–0.1)
NO2 (mg/L)<LOD
(<LOD–0.1)
<LOD<LOD<LOD<LOD
(<LOD–0.1)
<LOD
(<LOD–0.1)
<LOD<LOD
NO3 (mg/L)6.9
(3.4–12)
13
(3–29)
11.1
(4.7–16)
7.8
(5–12)
7.0
(3.8–12)
3.5
(0.6–16)
4.0
(1.8–7.7)
9.5
(3.7–16)
Cl (mg/L)18
(10–35)
25
(15–38)
23
(16–28)
21
(15–31)
19
(11–36)
23
(15–32)
22
(16–29)
28
(19–35)
SO42− (mg/L)28
(17–38)
48
(23–91)
39
(25–49)
35
(24–46)
29
(18–39)
61
(30–150)
51
(31–68)
68
(37–89)
Turbidity (NTU)27.7
(3.5–170)
0.1
(0.1–1.3)
0.3
(0.1–3.4)
0.1
(0.1–0.8)
27.6
(4–230)
2.3
(0.1–12)
0.2
(0.1–1)
0.4
(0.1–3.4)
TOC (mg/L)2.6
(1.3–4.1)
1.1
(0.6–2)
1.3
(0.8–2.8)
1.4
(0.9–2.3)
2.7
(1.5–4.5)
1.6
(1–2.6)
1.4
(1.1–2.4)
1.3
(1–2.2)
DOC (mg/L)2.4
(1.4–3.7)
1.1
(0.6–1.9)
1.2
(0.8–1.9)
1.3
(0.9–1.8)
2.5
(1.5–3.9)
1.5
(1–2.2)
1.3
(1–1.7)
1.2
(0.9–1.6)
Fe (µg/L)347
(29–3347)
20
(7.1–190)
19
(7.1–110)
15
(7.1–27)
363
(12–2900)
362
(14.1–2200)
27
(4.6–140)
108
(47–750)
Mn (µg/L)28
(3.5–234)
9.1
(0.1–79)
13.5
(0.1–180)
4.8
(0.1–15)
34.5
(3.5–210)
297
(20–650)
6.1
(3.5–22)
21
(3.5–110)
Combined chlorine (mg/L)NANA0.1
(<LOD–0.6)
0.1
(<LOD–0.2)
NANA<LOD
(<LOD–0.1)
0.1
(0.1–0.2)
Free chlorine (mg/L)NANA0.3
(0.1–0.5)
0.2
(<LOD–0.6)
NANA<LOD
(<LOD–0.1)
0.1
(<LOD–0.2)
Colony count 22 °C3700
(100–28,000)
120
(0–3800)
160
(0–4300)
36
(0–450)
6600
(375–67,000)
220
(0–4500)
170
(0–2900)
160
(0–2800)
E. coli149
(5–1720)
0
(0–0)
0
(0–0)
0
(0–0)
420
(5–1920)
0
(0–0)
0
(0–0)
0
(0–0)
Enterococci43
(0–400)
0
(0–1) 1
0
(0–0)
0
(0–0)
95
(1–500)
0
(0–0)
0
(0–1) 1
0
(0–1) 1
1 single incident; NA: not applicable.
Disclaimer/Publisher’s Note: The statements, opinions and data contained in all publications are solely those of the individual author(s) and contributor(s) and not of MDPI and/or the editor(s). MDPI and/or the editor(s) disclaim responsibility for any injury to people or property resulting from any ideas, methods, instructions or products referred to in the content.

