Abstract
The Eastern Arc Mountains of Tanzania and Kenya, a montane archipelago of 13 uplifted fault blocks (sky islands) isolated by lowland arid savanna, are a center of exceptional biological endemism. Under the influence of humid winds from the Indian Ocean, forests and associated species may have persisted in this region since the final uplift of these blocks in the late Miocene. Today, these mountains are inhabited by a remarkable diversity of bird species. To better understand the evolutionary processes behind this diversity, we combined molecular phylogenetic studies of East African montane birds with paleoclimate modeling of its montane forests. Across its largest lowland barrier, the 125 km between the Usambara and Nguru/Nguu Mountains, 10 of the 14 bird lineages exhibited a phylogeographic break. Using Bayesian methods, we established that at least three periods of forest contraction and expansion affected the diversification of Eastern Arc birds. Habitat distribution models suggest that lower-elevation hills may have acted as stepping-stones connecting isolated highlands to allow for the dispersal of montane forest-dependent species across them. Periods of vicariance during paleoclimatic cycles extending back through the Last Glacial Maximum would have then isolated these populations within the highlands they had reached. The broad distribution of neoendemic species across the mountains of East Africa provides evidence of climate cycling as a driver of lineage diversification. The high incidence of narrow-range endemism of paleoendemic species on the Usambara, Uluguru, and Udzungwa Mountains of this region is harder to explain. Our paleoclimate models retrodicted the persistence of montane forest during climate cycles on several Eastern Arc sky islands but not on the Southern Tanzania Volcanic Highlands. Consistent with recent theoretical work, different rates of local extinction rather than increased rates of lineage diversification may explain the pattern of excessive narrow-range endemism on some sky islands over others. Thus, a regional filtering effect is generated, with paleoendemics maintaining populations through time only in areas where habitat persisted, providing a credible explanation for the dramatic variance in levels of endemism among different East African sky islands.
1. Introduction
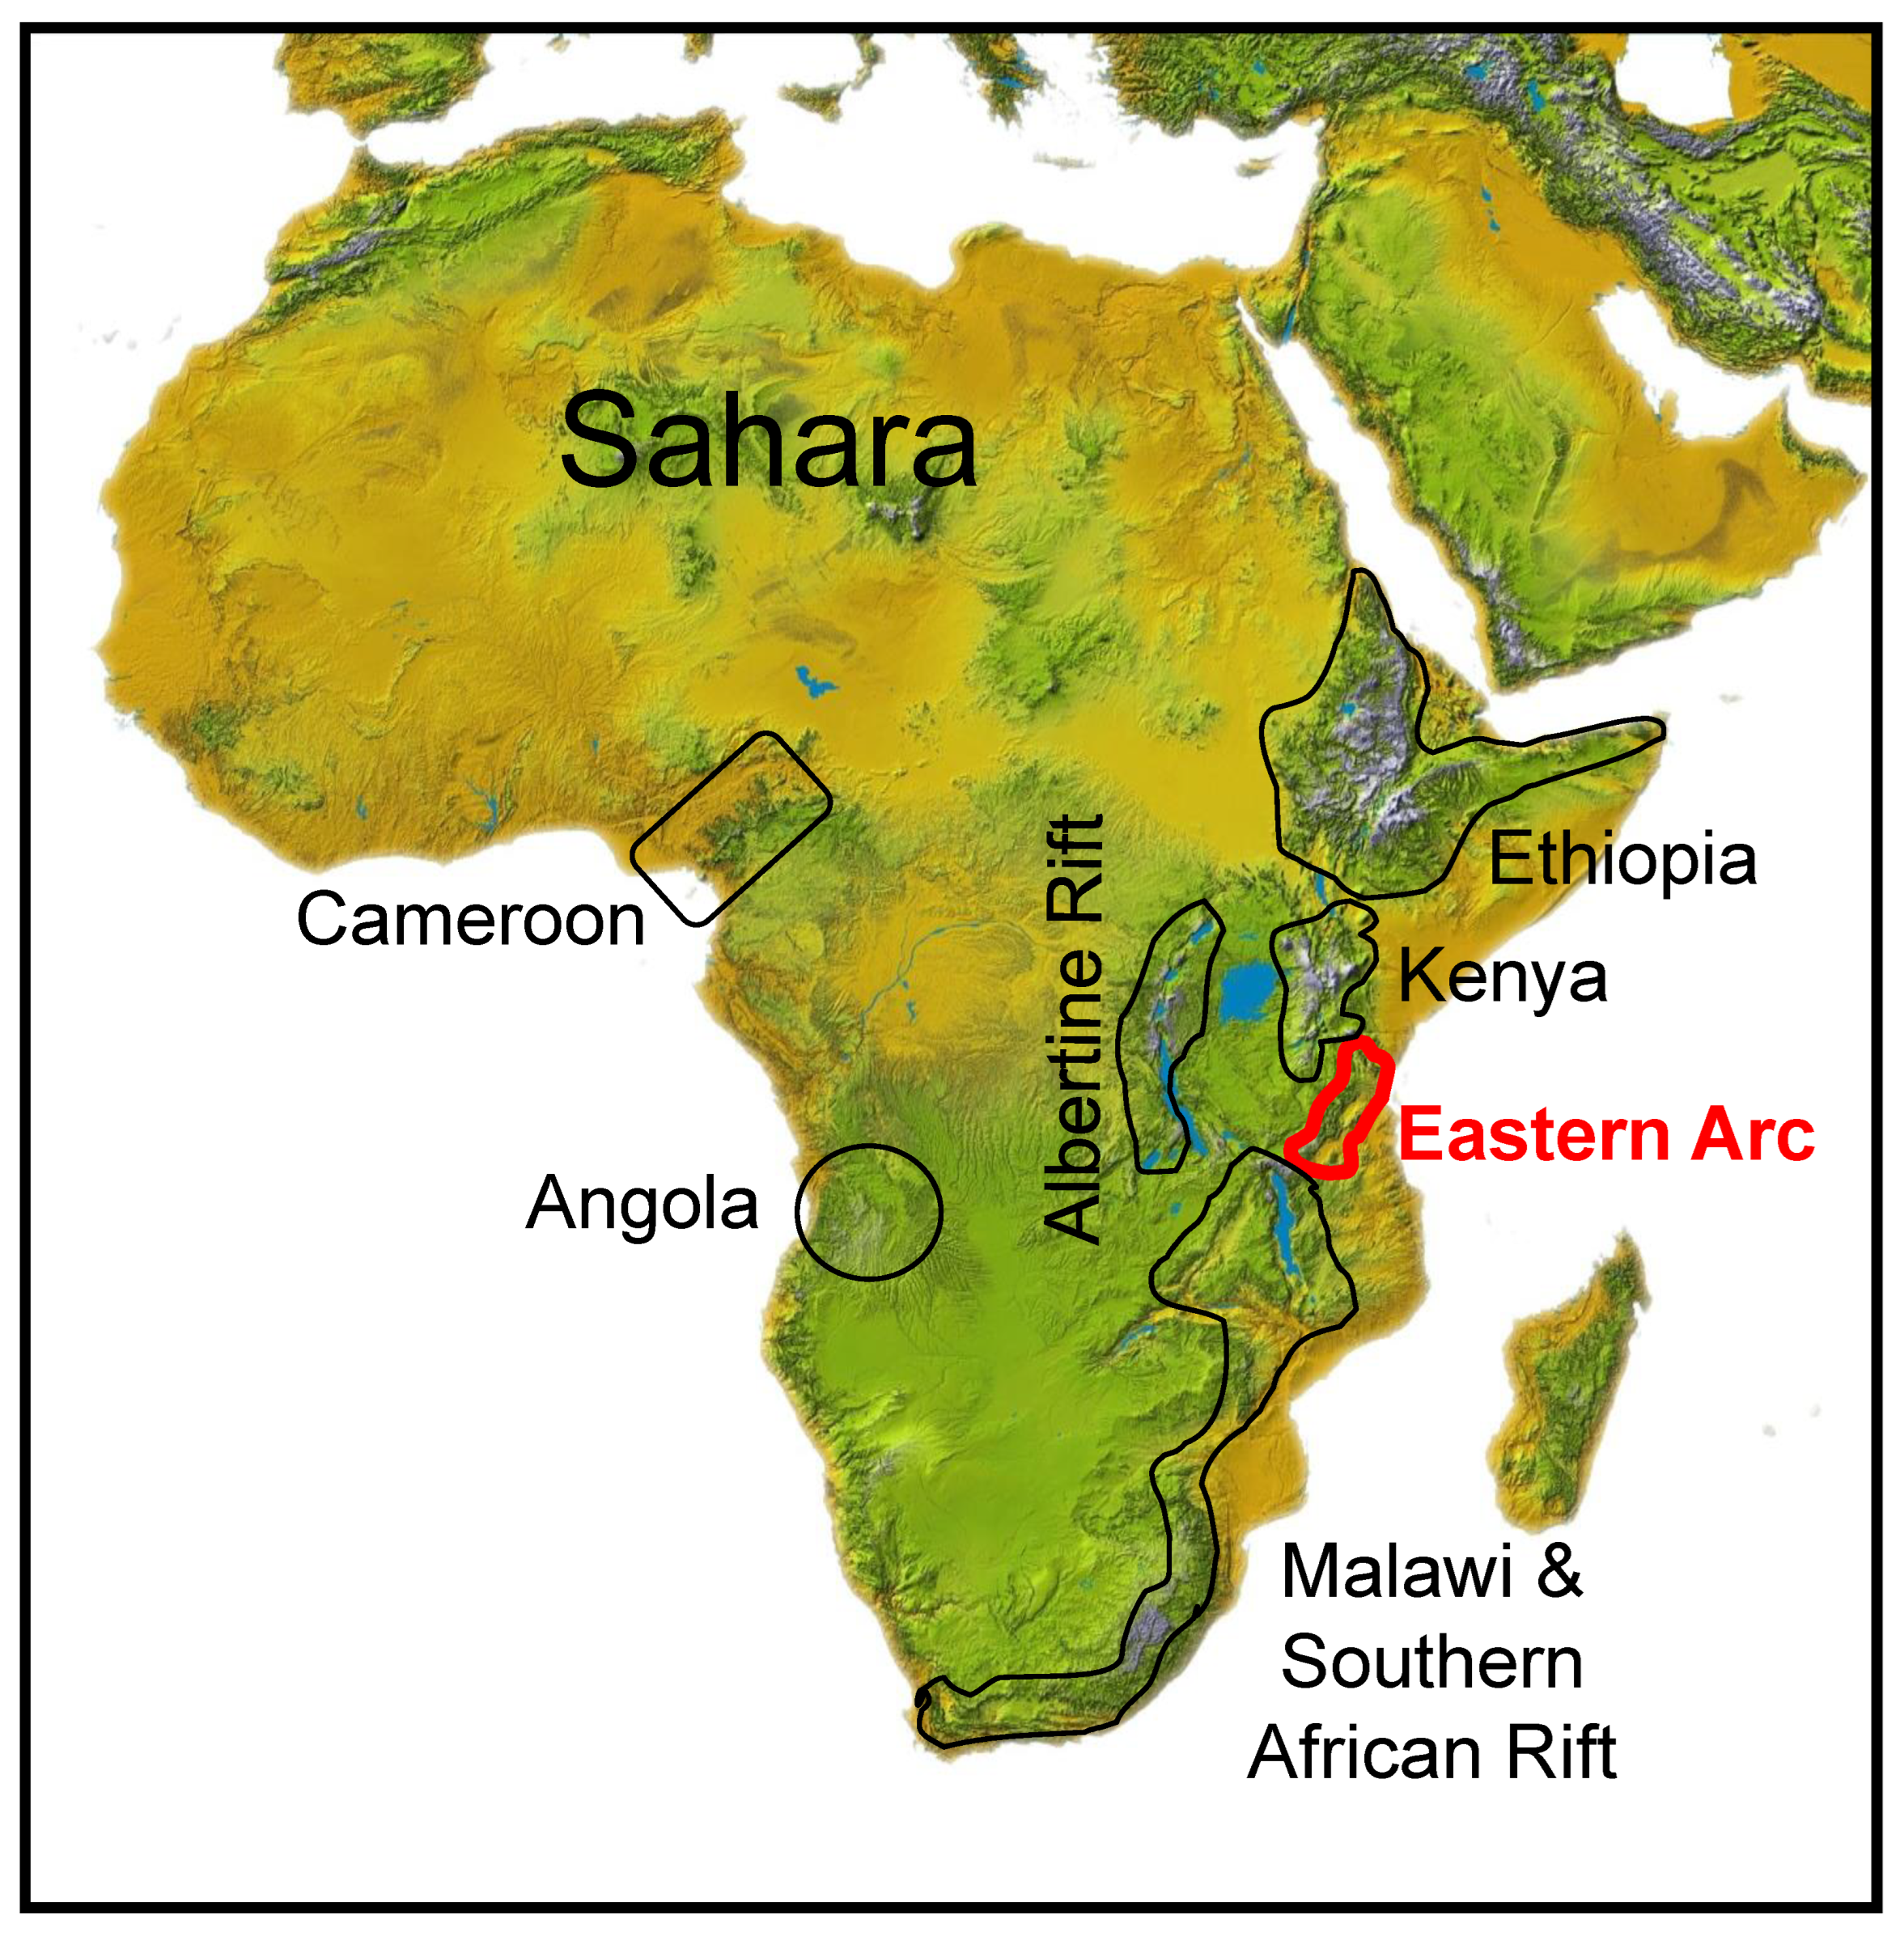
Africa’s montane forests are scattered discontinuously along a 5000-km series of mountains running from the Ethiopian Plateau in the north to the South African coast. Two isolated montane highlands occur to the west: the Angolan Highlands and the Cameroon Highlands [1,2,3] (Figure 1). The fragmentary distribution of montane forest across these regions is primarily a consequence of relief; only a few isolated areas are high enough (>1800 m) for the development of a montane climate, which also requires the low temperature and high precipitation often created by orographic rainfall [4,5]. Some of the forest sky islands are within sight of each other, whereas others are separated by hundreds of kilometers. The intervening dry lowland plant communities appear to serve as a barrier to the dispersal of montane species whose breeding ranges are presently confined to these mountainous highlands [1,2,6,7,8]. The montane habitats of Africa are thus, in effect, ecological islands, analogous to other continental sky island systems around the globe (e.g., the Western Ghats of India [9]; the Madrean Sky Islands of the Southwestern United States of America [10].
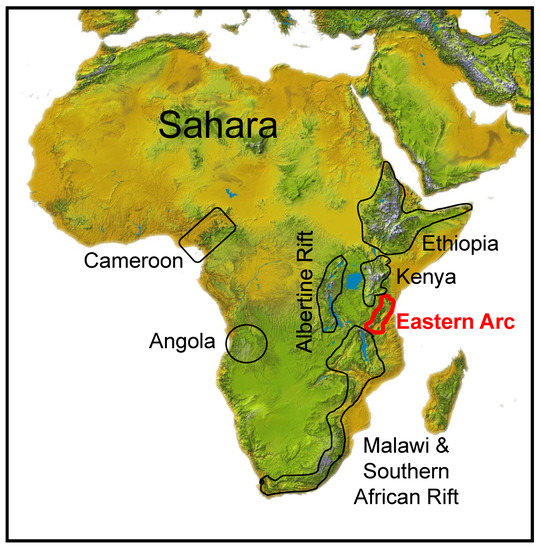
Figure 1.
Geographical location of the seven traditionally defined areas of montane endemism in Africa [1,2,3]. North to South: (1) Ethiopian Highlands; (2) Kenyan Highlands; (3) Albertine Rift; (4) Eastern Arc Mountains; (5) Malawi Rift and Southern Africa; and, to the West, the (6) Angolan and (7) Cameroon Highlands. The Eastern Arc Mountains, outlined in red, are the focus of this study.
A puzzling feature of African montane biogeography is that, despite the large distances and unfavorable habitats often separating montane highlands, many ecologically restricted montane bird species are geographically widespread, reaching even the most isolated mountaintops [2]. Some lineages form superspecies, where populations with an assumed common ancestry replace each other in different but often adjacent montane regions [11,12] and in adjacent lowland forests, especially along Africa’s east coast [8]. These distribution patterns are one of the great paradoxes of African biogeography since most species, especially those of the forest understorey, appear to be highly sedentary e.g., [13,14].
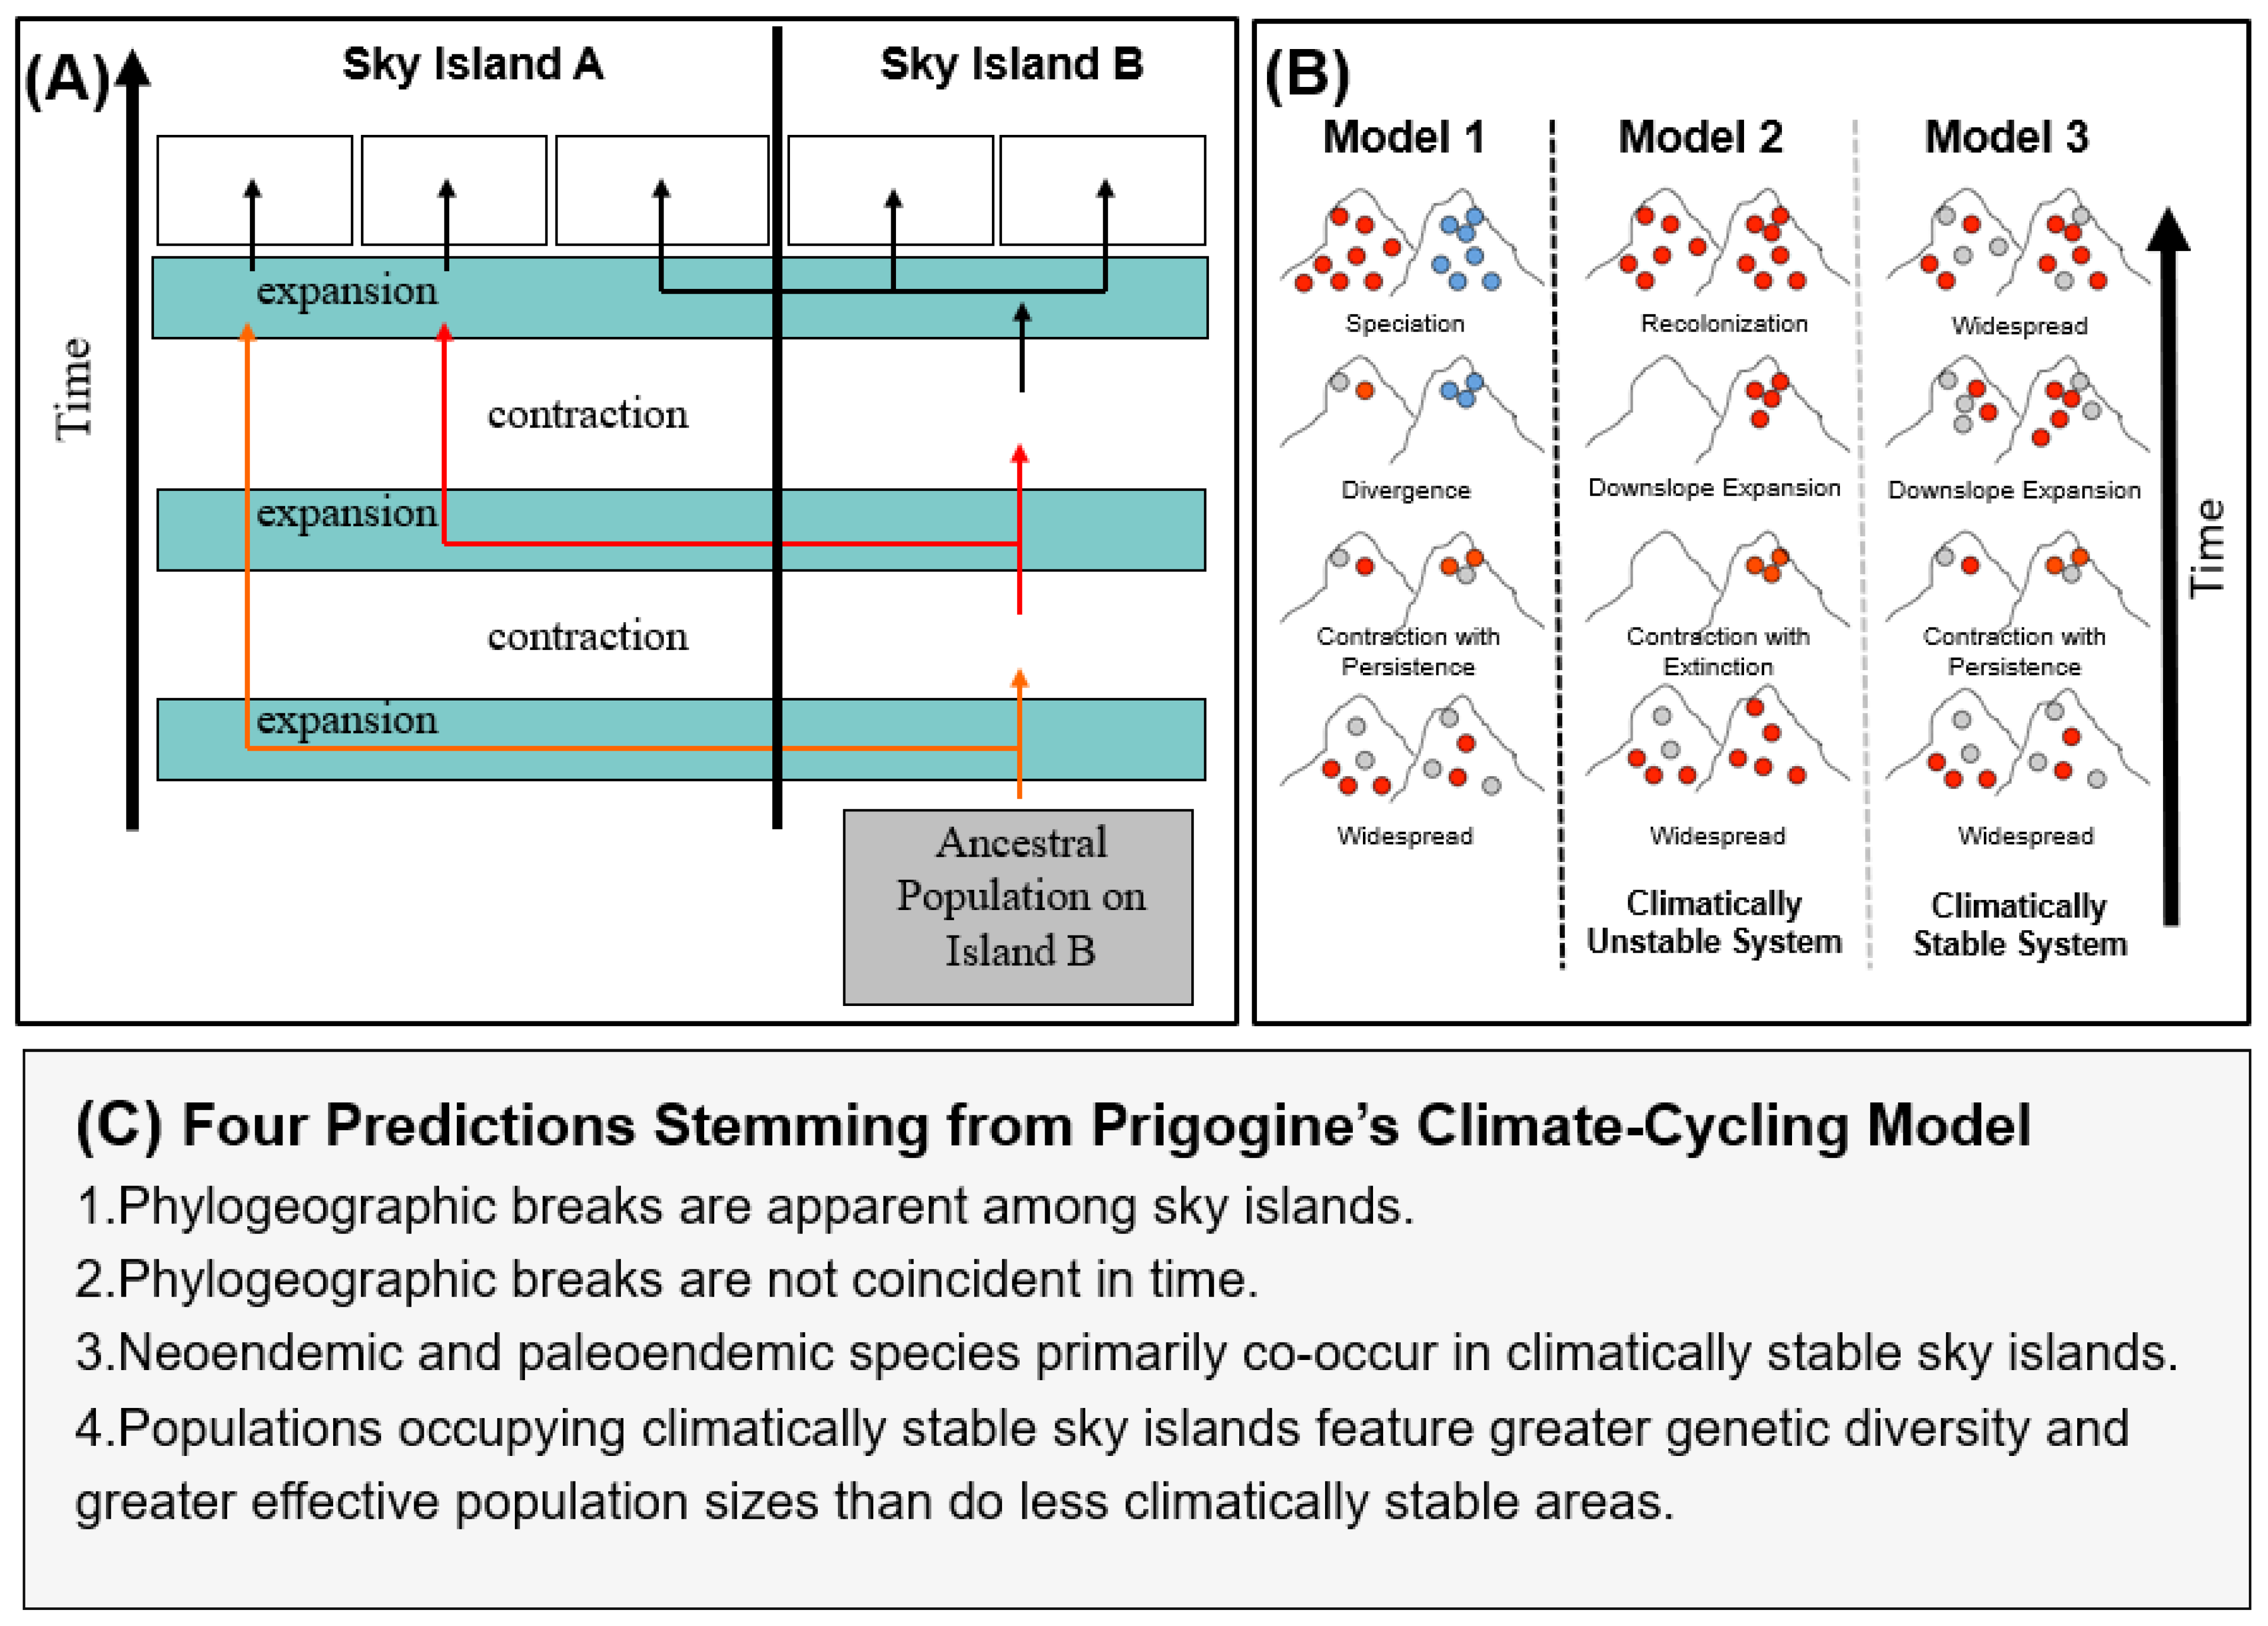
Diamond and Hamilton [15] postulated that the disjunct distribution patterns of African montane bird species may have resulted from species either having flown from one montane highland to another, or that montane species had prior distributional ranges that spanned the intervening lowland forests, with species subsequently becoming restricted to montane habitats. Such explanations imply that either montane birds are more mobile than they appear today, or that they previously tolerated broad altitudinal ranges and then became elevationally restricted with the disappearance of lowland forest during aridification throughout the Pliocene-Pleistocene [16,17]. Prigogine [6] posited an alternative hypothesis: during cool/wet interglacial periods in Africa, stunted-cloud forest may have gradually expanded downslope to cover the tops of ancient fault lines or uplifted escarpments of low-lying hills (600 to 900 m above sea level), thereby connecting some previously isolated montane regions. The elevational and geographic expansion of montane forest may have led to the step-wise dispersal of characteristic montane species, which later, with the onset of higher-latitude glacial aridification (cool/dry climate) or Holocene warming (warm/wet climate), became isolated within the different montane highlands they had reached (Figure 2). Vrba [18] extended this model and articulated the importance of species interactions (such as competition) in facilitating speciation when repeated secondary contact of lineages occurred over time due to the cyclic expansion and contraction of habitats.
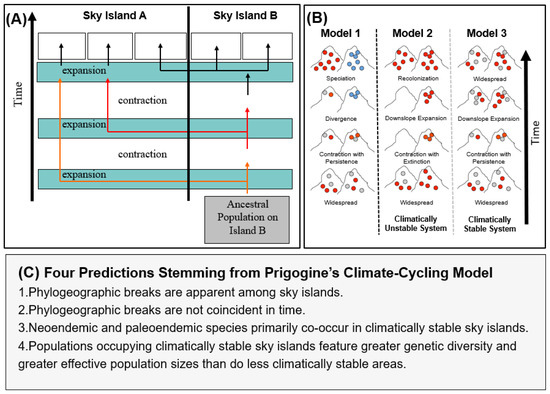
Figure 2.
(A) Climatic cycling model of forest expansion and contraction proposed by Prigogine [6] and extended by Vrba [18]. Under this model, both dispersal and vicariance have played important roles in shaping montane bird communities. (B) Model 1: A graphical depiction of speciation, resulting from climate cycles, driving the expansion and contraction of forests in accordance with Priogone’s model. During forest contraction, sky island populations are isolated, and then, through drift or selection, different genotypes are selected for in each highland, resulting in the blue genotype no longer being reproductively compatible with the red or gray genotypes. Models 2 and 3: the influence of local extinction on species richness and genetic diversity. In Model 2, forest is lost from the left sky island during a climate cycle, resulting in the local extinction of forest-associated lineages. Upon expansion of forest during climatically favorable conditions, the left sky island is recolonized, but genetic diversity (the gray genotype) is lost. Using the nomenclature in this paper, the left sky island would be unstable and the right stable, where stability refers to the persistence of a suitable habitat through time. In Model 3, both the left and right sky islands retain suitable habitat through climate cycles, resulting in the retention of greater genetic diversity and larger effective population sizes, but in contrast to Model 1, speciation does not occur due to the lack of reproductive isolation upon secondary contact when the forest expands once more during climatically favorable conditions. (C) Predictions stemming from Prigogine’s model tested in this paper.
Phylogenetic analyses of vertebrate species occupying tropical mountains on large continents (Africa and South America) reveal that relictual endemic forms with no close relatives co-occur within areas that feature many recently diverged taxa [19,20,21,22,23]. Detailed analyses suggest that bird species of recent origin occur disproportionally at higher elevations, with older species (i.e., relict lineages) occurring primarily at mid- to low-elevations where habitats are more connected [21,24,25,26,27]. These results are consistent with more rapid downslope recruitment of montane species [28], but it remains unclear in Africa whether the diversification in highland and lowland regions is near equal.
The co-occurrence of paleo- and neo-endemics in the montane tropics suggests that these areas of endemism act both as centers of lineage persistence and as generators of diversity [7,8,20,21]. Fjeldså and Lovett [20] hypothesize that the “piling-up” of endemic taxa in specific locations in East Africa is governed by a complex interplay among geology, climate history, and ecology (i.e., macroecological phenomena are shaped by a history of climatic variation). These authors further hypothesized that the long-term persistence of montane forest species assemblages coincided with high rates of speciation within montane regions that share a suite of interrelated features: topographical complexity; precipitation tied to orographic rain or mist formation; and, most importantly, long-term localized climatic constancy (i.e., stability) throughout periods of otherwise high-amplitude global climate fluctuations [29,30,31].
The African continent is an ideal model system for exploring the hypothesis that localized stability (habitat persistence through time) promotes lineage diversification and persistence. No large glacial ice sheets led to habitats being extirpated from large areas, so patterns of lineage diversification through time are likely to be complex and well preserved. Additionally, as Africa’s geological history is less dynamic than those of South America, Europe, and North America [21,32], its biological history may be somewhat simpler, although there is a need to better understand how the biosphere and lithosphere interact through orogeny and subsequent erosion [33]. Several studies have described the regional variation in biodiversity across Africa e.g., [34,35], revealing remarkably different patterns of diversity in richness peaks of widespread avian species than of species with more restricted distributions (local endemics). Jetz et al. [36] argue convincingly that, whereas the richness pattern of widespread African bird species is well accounted for by current ecology (e.g., temperature, precipitation, net primary productivity, surface area), that of range-restricted taxa is not, although topography and habitat diversity clearly play a significant role. Despite the absence of a historical component in their study, these authors conclude, based on the distribution of residuals from their null model clustering primarily in montane areas, that centers of endemism in the African montane tropics may constitute areas of special evolutionary history, probably acting as foci of lineage diversification.
The African montane avifauna has traditionally been divided into seven areas of endemism [1,2,11] (Figure 1). We focus on the Eastern Arc Mountains, primarily in Tanzania, for several reasons: (1) the Eastern Arc Mountains feature an extensive range of sky islands whose fauna are well documented [37]; (2) East Africa is characterized by a dramatically different pattern of species richness than seen in narrow-range endemism (Figure 3); several montane sky islands (e.g., Usambara, Uluguru, and Udzungwa Mountains); harbor more vertebrate endemics than would be expected within the available habitat; (3) a large body of literature accumulated over the past 20 years is available for hypothesis testing.
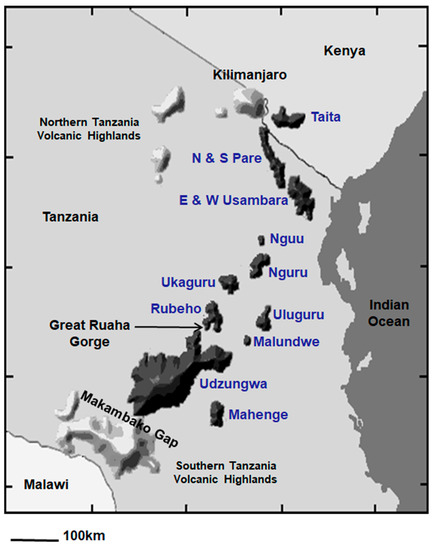
Figure 3.
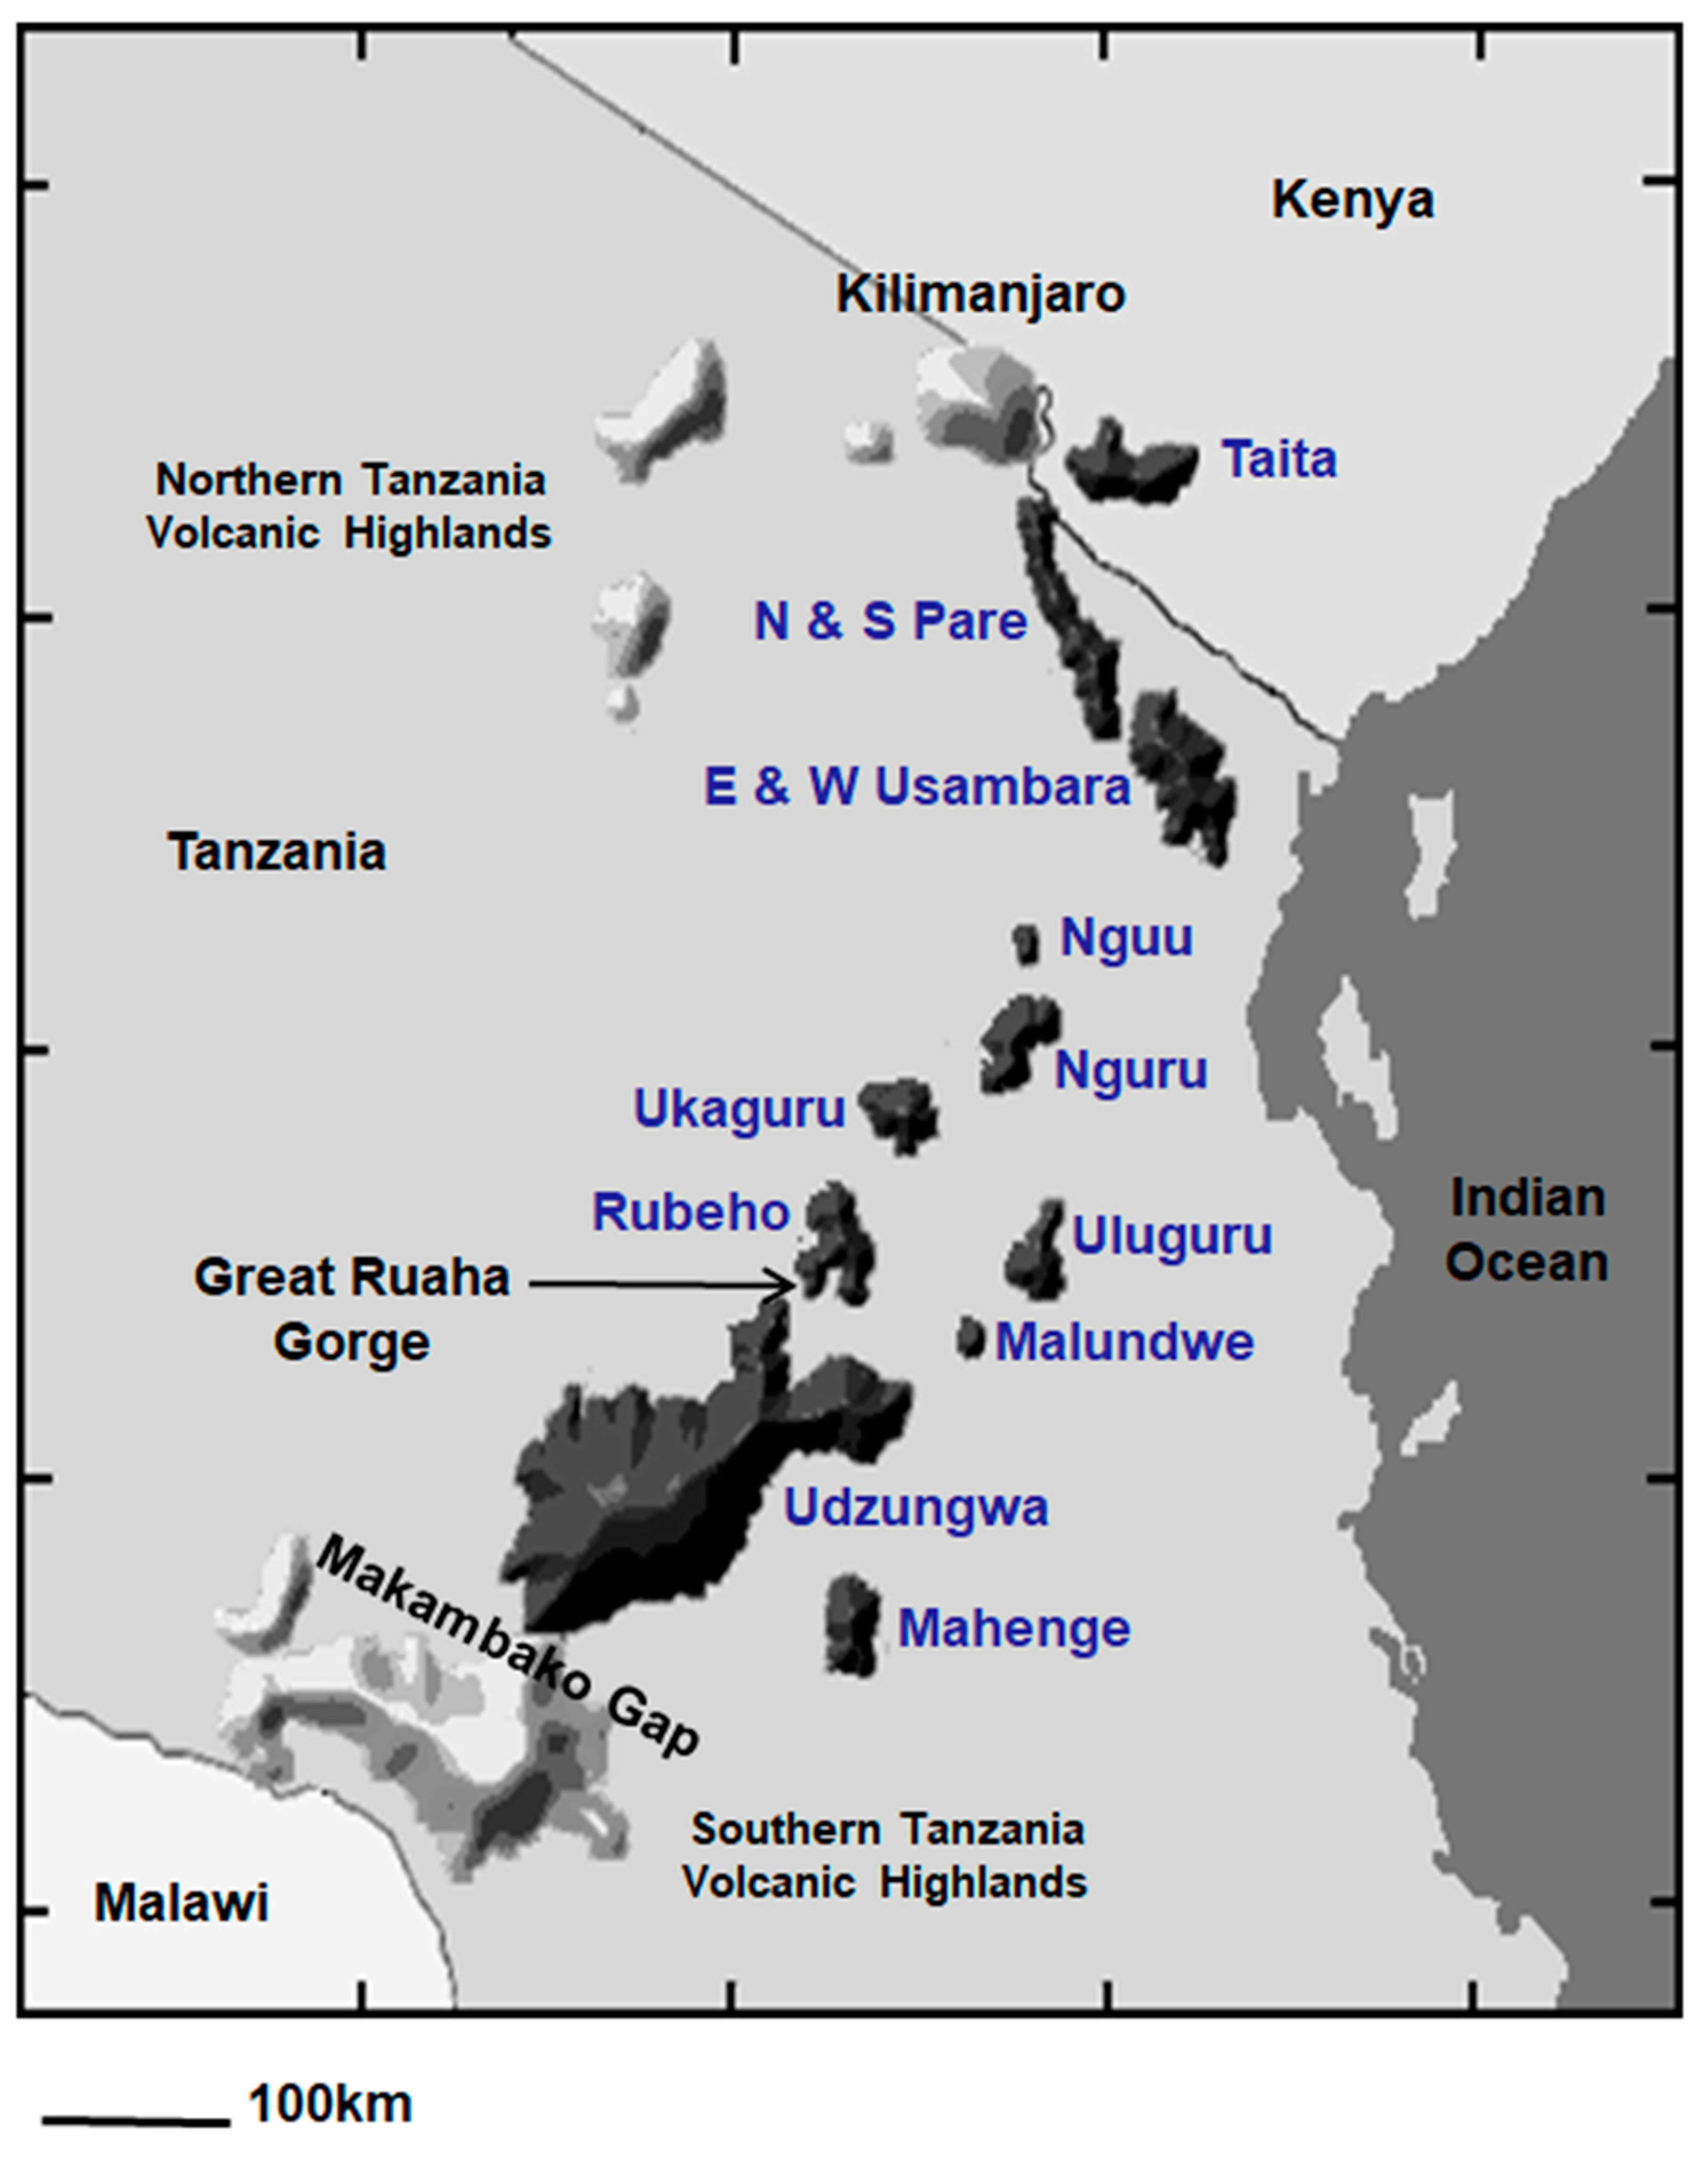
Map depicting the 13 sky islands that comprise the Eastern Arc Mountains in dark gray and blue text, and the geologically younger Northern and Southern Tanzania Volcanic Highlands in light gray.
In this paper, we consider the hypothesis posed by Prigogine ([6], Figure 2; also Vrba [18]) that climate cycles have driven the diversification of Africa’s montane bird fauna. We use the 13 sky islands of the Eastern Arc Mountain biodiversity hotspot [37,38] as an exemplar system. We evaluate four specific predictions that arise from Prigogine’s [6] hypothesis: (1) that phylogeographic breaks are apparent between montane highlands that have remained climatically stable (i.e., where habitat persisted through the Pliocene and Pleistocene); (2) that these breaks are not coincident in time; (3) that neo- and paleoendemics co-occur in climatically stable sky islands; and (4) that areas of high habitat stability feature more genetic diversity and larger effective population sizes than less climatically stable areas. We tested these hypotheses using distributional records of Eastern Africa breeding birds and DNA sequence data from a synthesis of studies conducted on 14 bird lineages comprising 1999 individuals (Table 1).

Table 1.
Details of the 14 co-distributed bird lineages that form the basis of the synthesis presented in this study.
2. Materials and Methods
Field surveys and biodiversity maps. The Eastern Arc Mountains of Tanzania are crystalline fault blocks that differ in geological origin from the surrounding volcanic highlands [32]. To the north of the Eastern Arc lie the volcanic highlands of northern Tanzania and the Kenyan Highlands; to the west, the Albertine Rift; and to the southwest, the Malawi Rift (Figure 1).
The map of East Africa reveals the fragmented nature of the 13 sky islands that constitute the Eastern Arc Biodiversity hotspot (Figure 3; [37]). The widest gap separating two highland blocks is a 125-km expanse of dry lowland plains between the Usambara Mountains in northern Tanzania and the Nguu/Nguru Mountains in central Tanzania. The Uluguru Mountains, located closer to the Indian Ocean, are separated by 100 km from the interior Udzungwa/Rubeho Mountains, although a series of forested hills across the Malundwe Plateau may represent a dispersal corridor for forest birds between these highlands. The third widest gap is a 50-km expanse of savanna separating the Nguru from the Ukaguru Mountains. The deep and narrow Ruaha Gorge separates the Rubeho from the Udzungwa Mountains. The Makambako Gap, a 90-km section of grassland, separates the Eastern Arc Mountains from the highlands around the northern rim of Lake Malawi. The southern highlands are a collection of primarily volcanic massifs that comprise the Poroto, Kipengere, and Livingstone Ranges; we refer to these massifs collectively as the Southern Tanzania Volcanic Highlands.
Scientific understanding of bird species ‘distribution across Africa, and in particular East and Central Africa, has improved markedly over the past two decades. The publication of species-level atlases for the Malawi Rift [53] and neighboring Zambia [54], as well as the ongoing Tanzania bird atlas project (http://tanzaniabirdatlas.net (accessed on 15 June 2020)), has contributed to this progress. In addition, dedicated surveys of highlands (e.g., Rubeho Mountains, [55,56]) and the expansion of citizen science databases (e.g., eBird, [57]) have further refined our understanding of bird species ranges. These efforts have revealed unexpected species range extensions (e.g., for sunbirds, [43,55,58]) and led to the discovery of new bird lineages in East Africa [41,47,59,60]. Jon Fjeldså and Louis Hansen have led efforts at the University of Copenhagen to compile the data on the distribution of bird species from the above sources, as well as from eBird and GBIF [61], into a grid corresponding to 15 geographical minute squares for East Africa and a grid of 1 degree squares for all of Africa ([62]; http://www.daim.snm.ku.dk/The-Copenhagen-databases-of-African-vertebrates(accessed on 15 June 2020)). We made use of the 15 geographical minute squares for East Africa, with the maps of East African bird species richness and rare-quartile endemism (25% most range-restricted species) presented in Figure 4 being provided to us by Louis Hansen. We follow the nomenclature used in the IOC checklist 12.1 [63]. Point locality data was used for the analysis of molecular data.
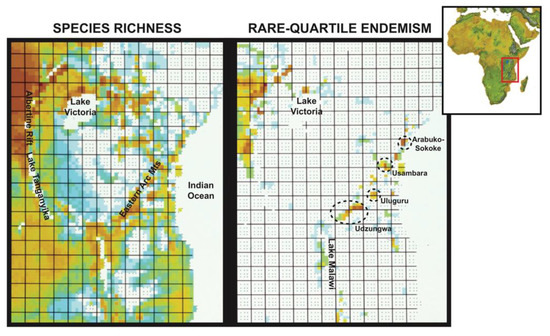
Figure 4.
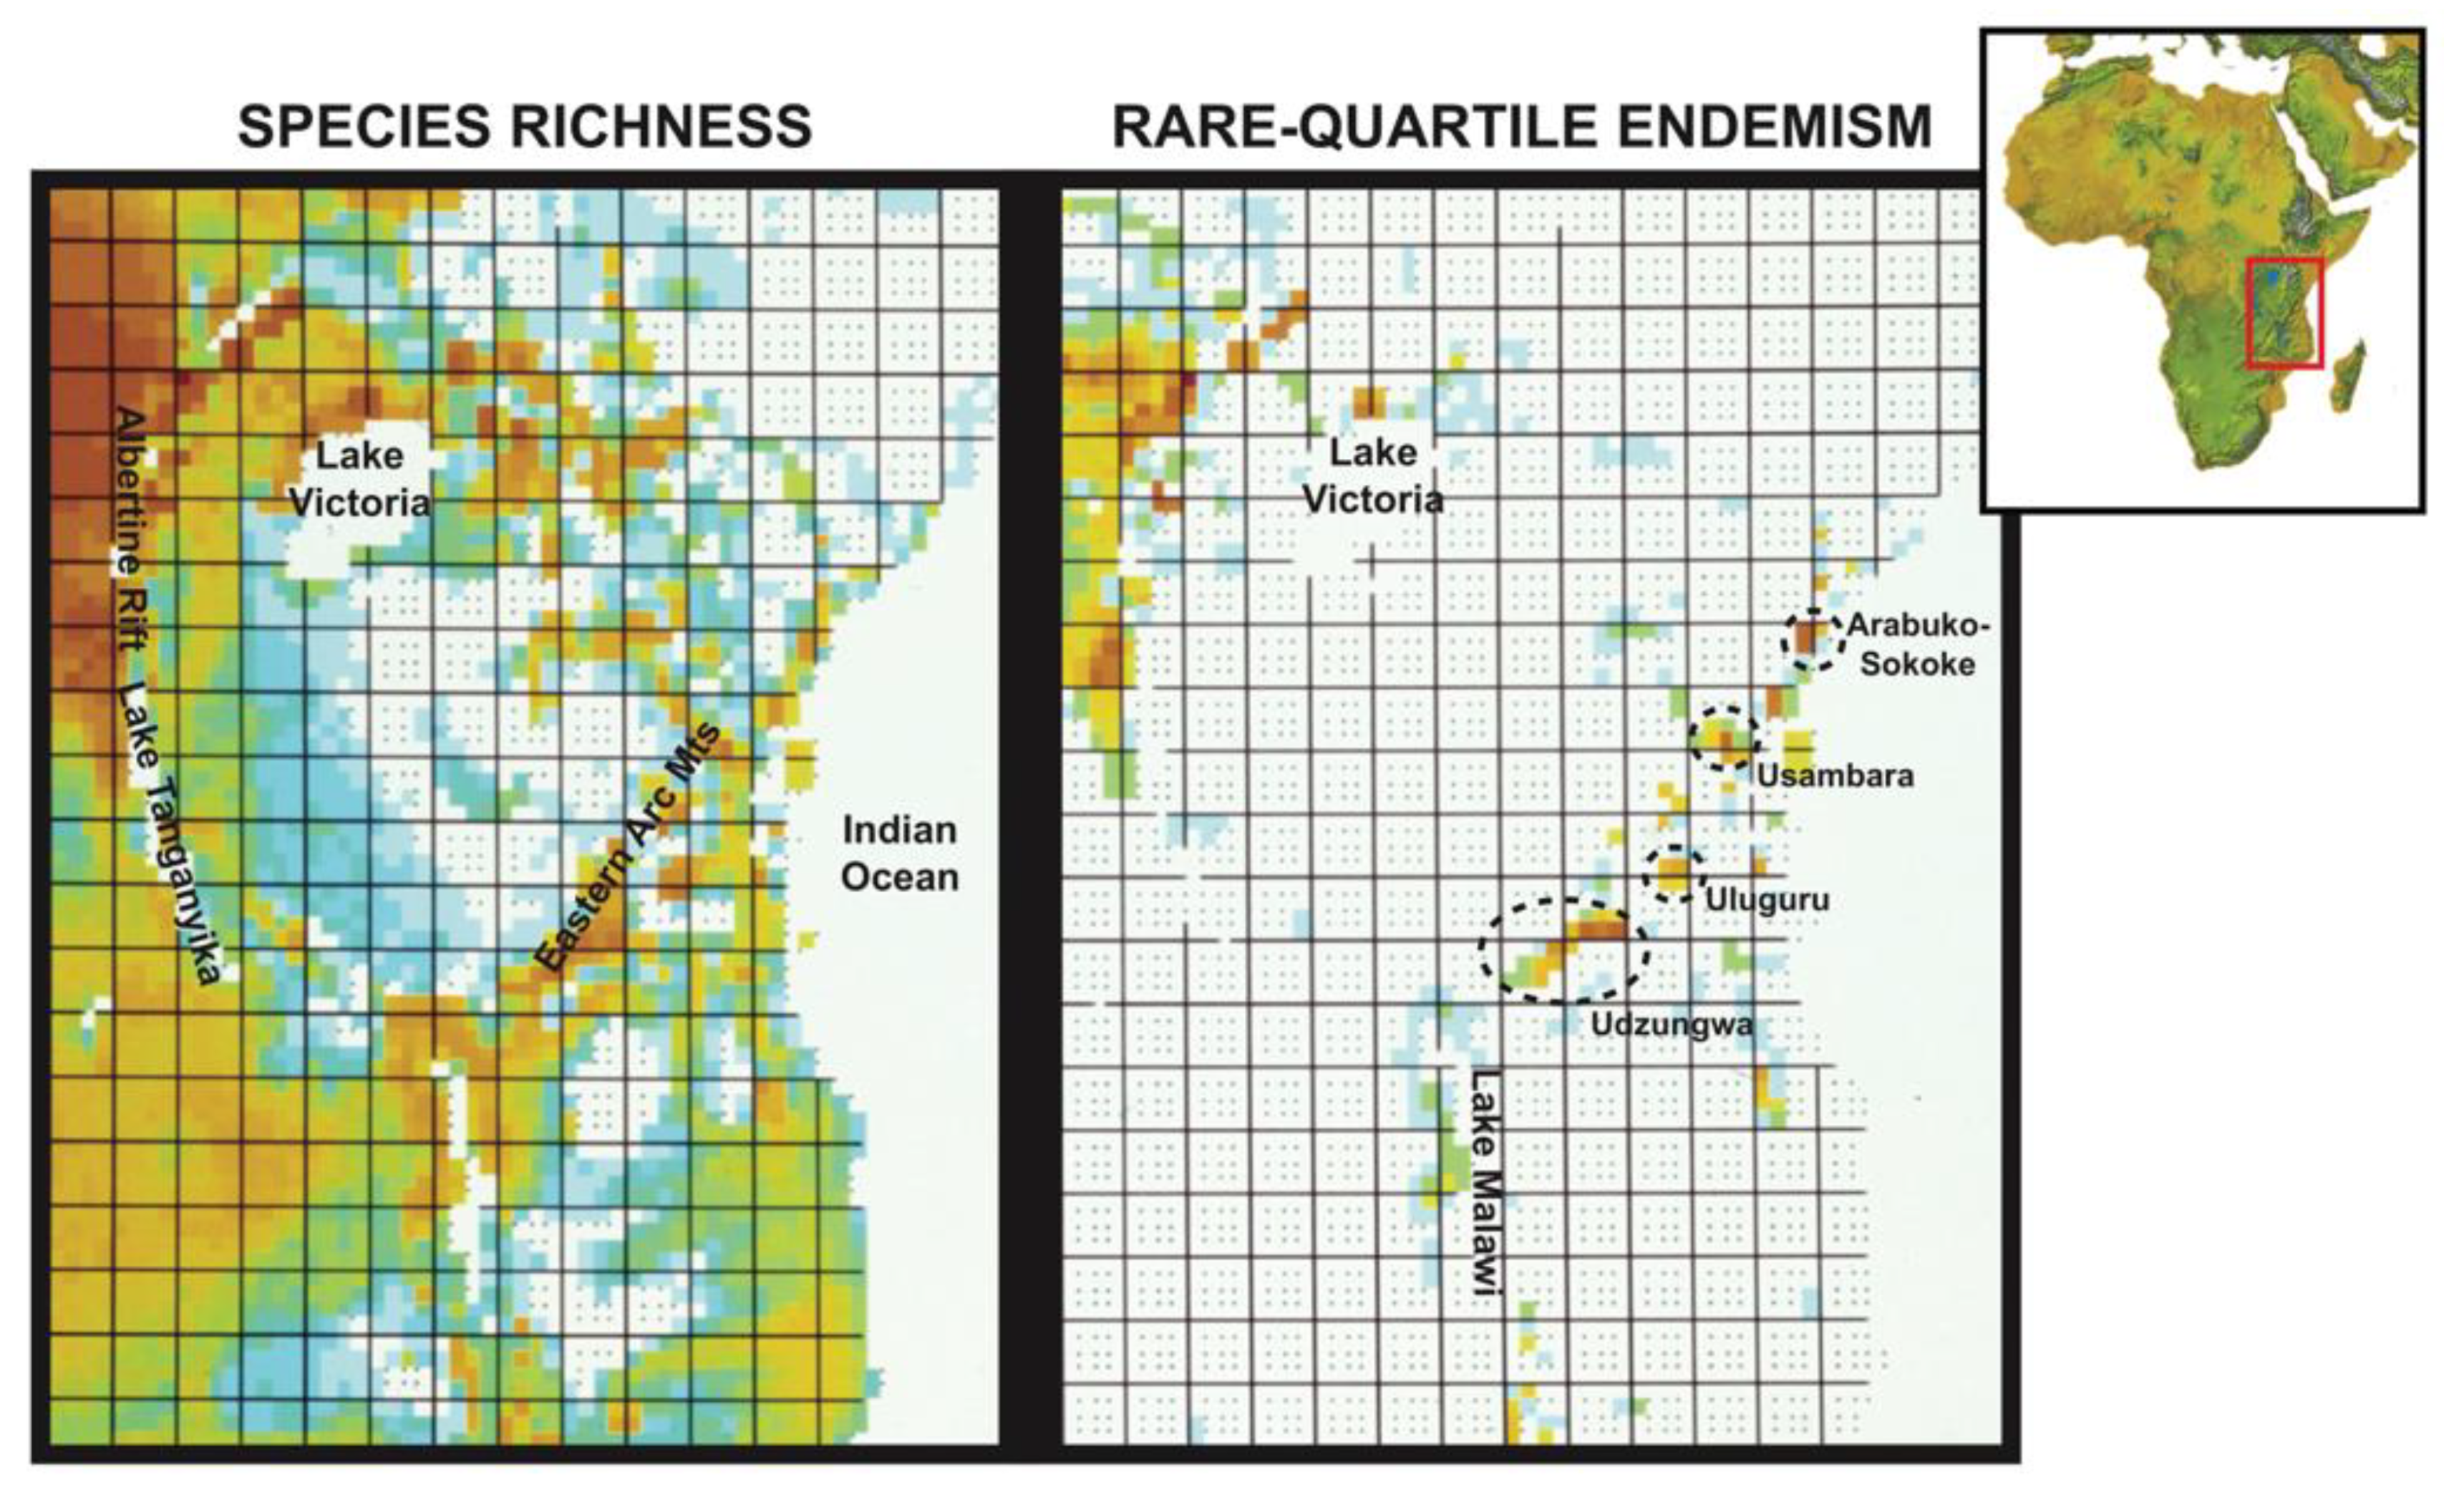
Contrast between species richness and rare-quartile endemism (25% most range-restricted species) of forest-dependent birds across East Africa. The richness scales are the same for both maps, with warmer (i.e., redder) shades indicating a greater number of species. The montane highlands indicated by ovals feature exceptionally high numbers of endemic species relative to the area occupied (see Burgess et al., 2007).
Comparative phylogeography. We focused our analyses on 14 co-distributed East African bird species/species complexes that encompass nine bird families (Table 1). We include multiple lineages of greenbuls (Pycnonotidae), muscicapids (Muscicapidae), and sunbirds (Nectariniidae), because they are the dominant members of montane forest bird communities in East Africa [64]. They are also broadly distributed across the montane highlands of East Africa and are taxa for which population level sequence data are available. Table 1 presents details of the members of each species complex, sample size, and life history traits (habitat, foraging stratum, and diet; data from Birds of Africa, [65]).
For 13 of the 14 species, we synthesized results reported in the literature (Table 1) for the presence/absence of phylogeographic breaks among the montane sky islands of East Africa. We did not perform new analyses for these species/species complexes.
For the Spot-throat (Modulatrix stictigula), we analyzed a dataset of 106 individuals to determine where phylogeographic breaks occur among East African sky islands. Two mitochondrial genes (NADH2, NADH3) and two autosomal introns (FGB5, GAPDH11) were Sanger sequenced using standard methods [39,66,67,68]. Loci were aligned using MAFFT [69] and then concatenated. We then constructed a phylogenetic hypothesis of relationships among individuals from several sky islands using maximum likelihood (ML) via RAXML v8.2.12 [70] under a General-Time-Reversible Model (GTR) of nucleotide substitution. Each codon position of the mtDNA loci formed a separate partition, and each intron formed a separate partition. ML analyses were implemented through the CIPRES supercomputing portal [71], with support for nodes evaluated using 1000 bootstrapping pseudoreplicates. The phylogenetic analysis was rooted on the Dapple-throat (Arcanator orostruthus), the sister-taxon to the Spot-throat [72,73].
Hierarchical Approximate Bayesian Computation. To test whether Prigogene’s [6] climate cycling hypothesis could explain the diversification of East African montane bird lineages, we sought to test the null hypothesis that the observed variation in uncorrected sequence divergence for species pairs with reciprocally monophyletic lineages could be attributed to a single simultaneous divergence event (temporal congruence) that isolated these lineages. Simultaneous divergence would suggest that differences in effective population size drove more rapid haplotype fixation (i.e., higher pairwise sequence divergence) in some bird lineages than others, thereby explaining the observed variance in mtDNA sequence divergence across species pairs.
We used Hickerson et al.’s [74,75] hierarchical approximate Bayesian computation (ABC) method, implemented in MSBayes and MTML-msBayes [76,77], to test for temporal concordance in vicariance events (i.e., simultaneous divergence) among 10 pairs of lineages that form monophyletic mitochondrial clades on either side of the Usambara–Nguu/Nguru phylogeographic break. This approach can estimate hyper-parameters across a multi-species dataset while explicitly incorporating uncertainty and variation in the subparameters that describe the demographic history (e.g., differences in population size) of each taxon pair across a geographic break, as well as inter-gene variability in coalescent times (i.e., mitochondrial, Z-linked, and autosomal DNA) and heterogeneity of DNA mutation rates. Our analyses estimated each set of hyper-posteriors (possible divergence times per Y taxon pairs {Ψ}, the mean divergence time across the Y taxon-pairs {E(τ)}, and the ratio of the variance of τ to the mean of τ {Ω = var(τ)/E(τ)}; see [74]) from K = 5 million draws from the joint hyper-prior and 10,000 accepted draws from the joint posterior (tolerance level = 0.002), using the acceptance/rejection with local regression algorithm [78]. This allowed us to model all possible multi-taxa models of divergence by exploring the full hyper-prior range of the hyper-parameter Ψ, the number of different divergence times across a total of Y species pairs under the most likely model, whereby Ψ is drawn from a discrete uniform hyper-prior ranging from 1 (simultaneous vicariance) to 10 (complete incongruent vicariance).
Paleoclimate. We quantified the climatic stability of Eastern Arc montane forest habitats in Tanzania during the late Quaternary (mid-Holocene and Last Glacial Maximum [LGM]). Such climate cycles have repeated themselves at roughly 90,000-year intervals over at least the past million years [16]. We used these models to evaluate the paleo-climatic niche or envelope of montane forests and locations where the topographically driven climate domain has tended to persist since the LGM. We did not attempt to account for recent or modern human changes in land use, nor did we attempt to separately model different forest types or habitats. We developed our empirical distribution models using a Random Forest machine learning algorithm [79] in R 4.0.2 ([80]; package ’randomForest’ 4.6–14, [81]; dependent package ‘raster’ 3.3–7, [82]), along with contemporary (1979–2013) estimates of climate (CHELSA 1.2; [83,84]) extracted from areas where montane forest would have been present (minus human land use conversion) or absent in Tanzania, using GIS shapefiles from the Eastern Arc Mountains Conservation Endowment Fund [85]. We used Random Forest in classification mode to predict the probability of montane forest occurrence based on observed contemporary climatic conditions in which present-day montane forest habitats are either present or absent. The biologically relevant climatic variables (i.e., bioclimatic variables) included annual mean temperature (bio1), temperature seasonality (bio4), annual precipitation (bio12), and precipitation seasonality (bio15), as these variables were the least correlated with one another (the highest Pearson’s product-moment correlation coefficient was 0.4) and provided the fewest variables that accounted for both annual and seasonal patterns. The spatial resolution of the gridded climate data for all time periods or epochs was 30 arc seconds (about 1 km2 at the Equator), which helped us discern patterns of climatic heterogeneity resulting from topographic complexity within the ranges containing montane forest habitat. Training points were generated at random both within the montane forest polygons (n = 1000 presence points) and outside of them in surrounding areas encompassing other non-montane forest habitats (n = 10,000 absence points, within a 650 × 800 km area encompassing the EAMCEF delineations). We then projected the contemporary models onto corresponding recent, historical, and paleoclimatic surfaces obtained from CHELSA-TraCE21k [86], by century, for 0 to 22,000 ypb. In total, we ran 220 model projections in 100-year increments.
Deep History: Centers of paleo- and neo-endemism. We used the data from [21] on passerine bird divergence times and cross-validated this with a recently published phylogeny for the major clades of songbirds [87], together with that of [88] for non-passerines, to classify 128 East African forest birds as neoendemics or paleoendemics. We then combined these data with distribution data for East Africa’s range-restricted (lower quartile, <200 15’ grid-cells) forest birds (provided by the Center for Macroecology, Evolution, and Climate at the Globe Institute, University of Copenhagen, Denmark) to construct richness maps for 31 bird species whose branch-lengths date back to the Pliocene (paleoendemics) or earlier and for 97 lineages (allospecies) that diverged during the Pleistocene (neoendemics).
Shallow History: Population Genetics and Demography. To provide an independent assessment relative to our paleoclimate models of the montane highlands, which may have maintained stable population sizes of forest birds, we used population genetic data from two of our 14 species/species complexes. For the Spot-throat, we used the mtDNA and data from two autosomal introns, and for the Yellow-streaked Greenbul (Phyllastrephus flavostriatus), we sourced data from the mtDNA, four autosomal, and two Z-linked introns from [50]. Since we were interested in how many alleles were present in each sky island sampled, we used PHASE 2.1.1 [89] under standard parameters to resolve the heterozygous nucleotide bases of each intron.
Using the mtDNA haplotypes and phased nuclear locus alleles, unbiased estimates of haplotype/allelic diversity (h) for each dataset (Spot-throat; Yellow-streaked Greenbul) and nuclear locus were obtained using Arlequin [90]. Nucleotide diversity (π), Fu’s Fs [91], and theta (θ) [92] were also estimated for each dataset and locus using Arlequin. Significance values for Fu’s Fs were estimated using 10,000 bootstrap pseudoreplicates. Based on the effective population size and mutation rate of mtDNA relative to nDNA, we expect populations characterized by high haplotype but low nucleotide diversity to have undergone recent population expansion either as a consequence of the re-colonization of montane highlands where forest is thought to have disappeared or in mountains where forest has been greatly reduced. Further, we compared haplotype and nucleotide diversity indices to test whether the sequence data conformed to the expectations of neutrality. Significant negative values of Fs indicate an excess of low-frequency mutations arising from rapid population growth.
3. Results
Species richness. Mapping the species richness of forest-dependent birds at the quarter-degree scale indicates that most of these birds are associated with montane regions, but many are also widespread in the surrounding broad-leafed woodland savannas, especially near the Indian Ocean, wherever there are patches of semi-evergreen vegetation (e.g., riparian thickets), groundwater forests on the floodplains, and remnant patches of a once much more contiguous coastal lowland forest (Figure 4; [93]). Mapping the quartile of species with the smallest geographical distributions (Figure 4, right panel) reveals that these range-restricted species are patchily distributed, with peak concentrations in the geographically peripheral Albertine Rift montane system to the northwest and in some parts of the Eastern Arc Mountains and coastal forest zone, but with few species in the Kenya Highlands and along the Malawi Rift.
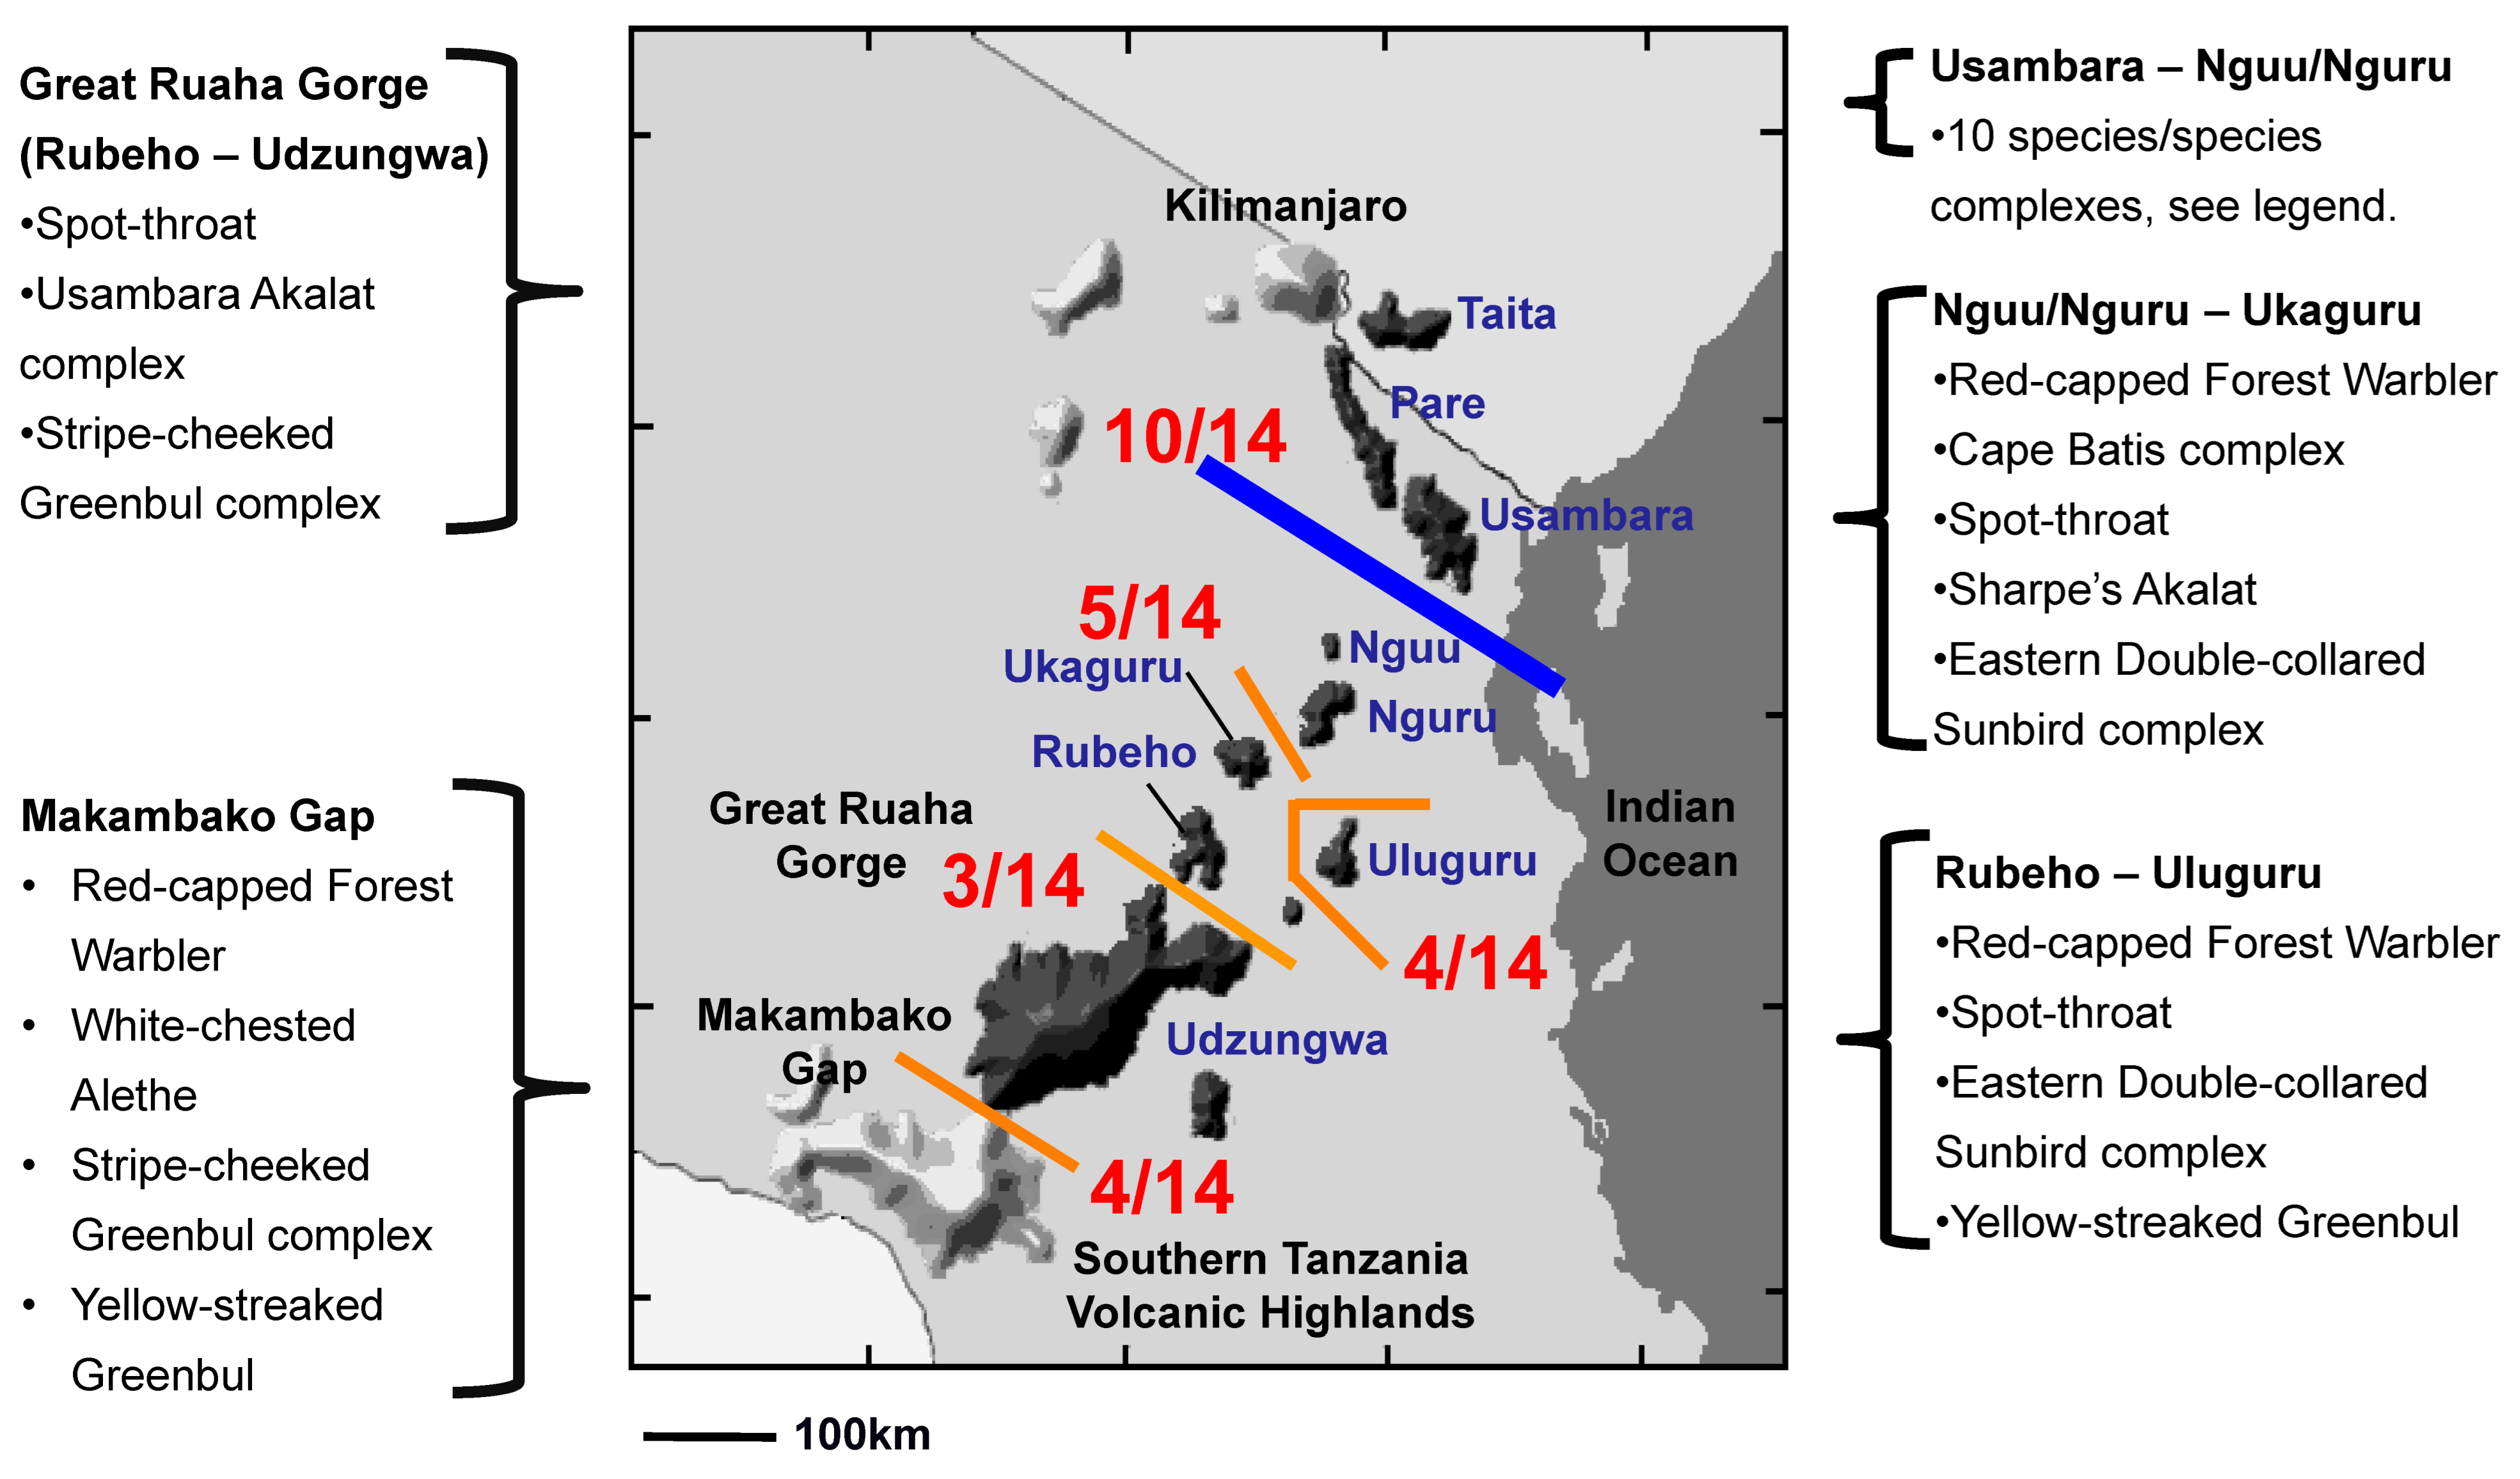
Comparative Phylogeography. Phylogenetic analyses of the Spot-throat revealed five reciprocally monophyletic lineages spread across Tanzania’s Eastern Arc Mountains (Figure S1). Placing the results of the phylogenetic analysis for the Spot-Throat with those from a literature synthesis of 13 additional species complexes (Table 1) indicated that East African birds do not share a unified history of spatial or temporal concordance in phylogeographic breaks, though there are some shared themes (Figure 5). We recovered a phylogeographic break between the Usambara and Nguu/Nguru Mountains, the largest lowland geographic barrier between neighboring montane highlands, for 10 species complexes (Figure 5 and Figure 6; Table S1). Four species complexes exhibited a phylogeographic break between the Uluguru Mountains and the central Eastern Arc Mountains (Rubeho, Udzungwa), the second largest lowland geographic barrier; and for five species complexes, a phylogeographic break was recovered between the Nguu/Nguru and Ukaguru Mountains, the third largest lowland geographic barrier among the Eastern Arc Mountain blocks. In contrast, we detected few breaks among species distributed across the narrow Great Ruaha Gorge separating the Rubeho and Udzungwa Mountains (3 lineages), or between populations of species occupying the crystalline fault blocks of the Udzungwa Mountains and the neighboring Southern Tanzania Volcanic Highlands (3 lineages; Figure 5; Table S1). In general, the larger the extent of the lowland habitat barrier, the more montane species or species complexes that exhibit a phylogeographic break across it (125 km between Usambara and Nguu/Nguru = 10/14; 50 km between Nguu/Nguru and Ukaguru = 5/14).
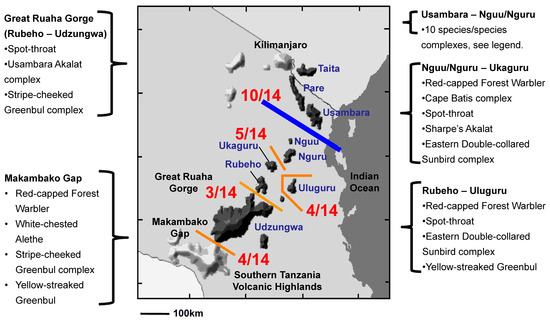
Figure 5.
Comparative phylogeography of 14 co-distributed forest-dependent bird lineages distributed across the Eastern Arc Mountains of Africa. Members of 10 of the 14 species complexes exhibit a phylogeographic break between the Usambara and Nguu/Nguru Mountains (detailed in Figure 6). This is the largest lowland habitat barrier (125 km) between sky islands in the Eastern Arc.
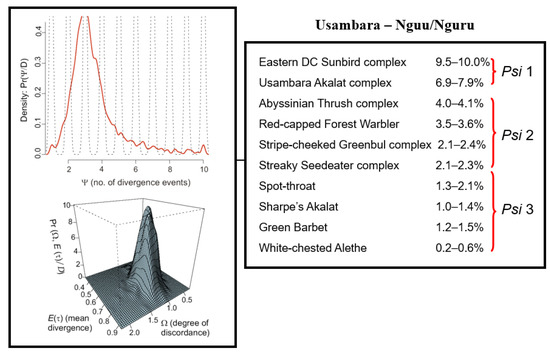
Figure 6.
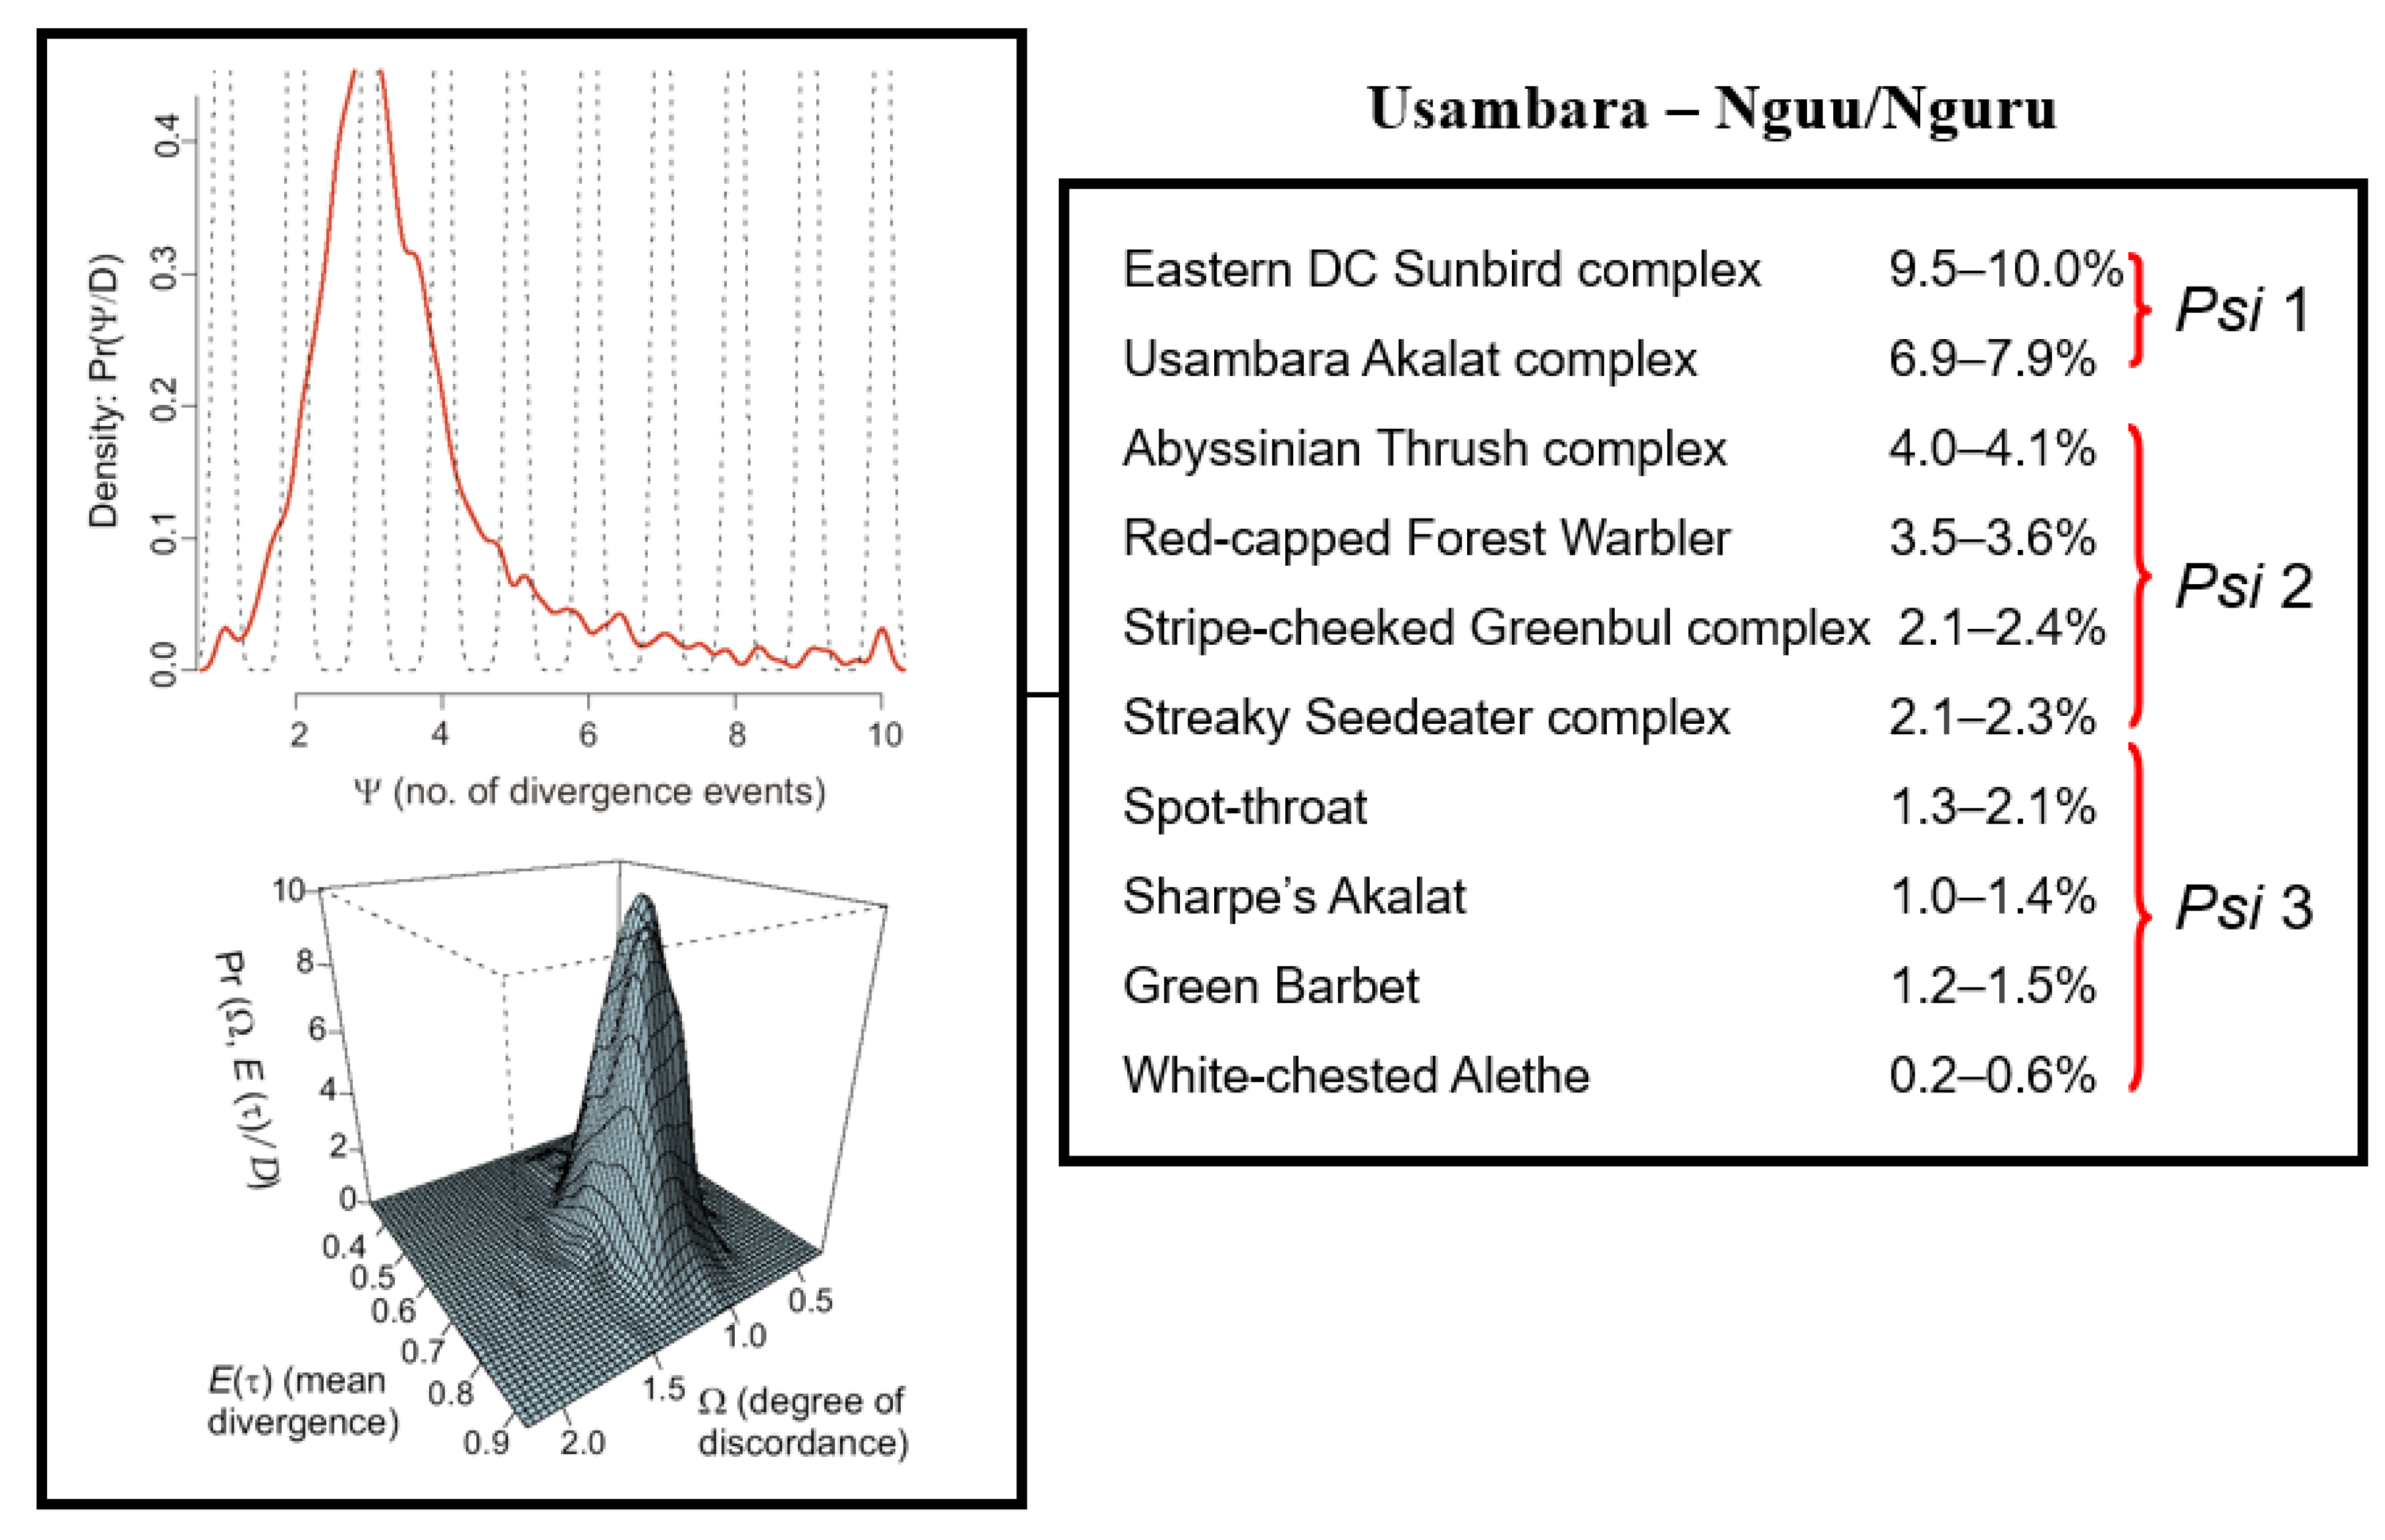
(Right): Estimates of mitochondrial sequence divergence (uncorrected distances) for 10 co-distributed lineages of birds across the 125 km lowland gap separating the Usambara from the Nguu/Nguru Mountains. (Left): Graphic presentation of the model of the posterior distribution of Psi (Ψ = 3.1; Omega = 1.29) indicating that the 0.2 to 10% variation in mtDNA sequence divergence cannot be explained by a null model of simultaneous divergence (i.e., H2 Ω ≥ 0.5), but rather represents three discrete vicariance events, indicated by Psi 1 to 3.
Temporal concordance in vicariance events. For the ten taxon-pairs where a phylogeographic break between the Usambara and Nguu/Nguru Mountains was apparent (10–0.2% in mtDNA; Figure 6), the estimate of Psi (Ψ = 3.1) indicates that most of the posterior distribution is centered on three divergence events. Thus, the vicariance of the ten lineages across this break did not occur simultaneously. Post-hoc testing with Ψ = 3 divergence events reveals that members of the Eastern Double-collared Sunbird species complex (Cinnyris mediocris complex) and the Usambara Akalat species complex (Sheppardia montana complex) diverged first (6.9–10% mtDNA div); the Abyssinian Thrush complex (Turdus abyssinicus complex), Red-capped Forest Warbler (Artisornis metopias), Streaky Seedeater complex (Crithagra striolata complex), and Stripe-cheeked Greenbul complex (Arizelocichla milanjensis complex), second (2.1–4.1%); and the remaining four species: Spot-throat, Sharpe’s Akalat (Sheppardia sharpei), Green Barbet (Stactolaema olivacea), and White-chested Alethe (Chamaetylas fuelleborni)), more recently (0.2–2.1%; Figure 6).
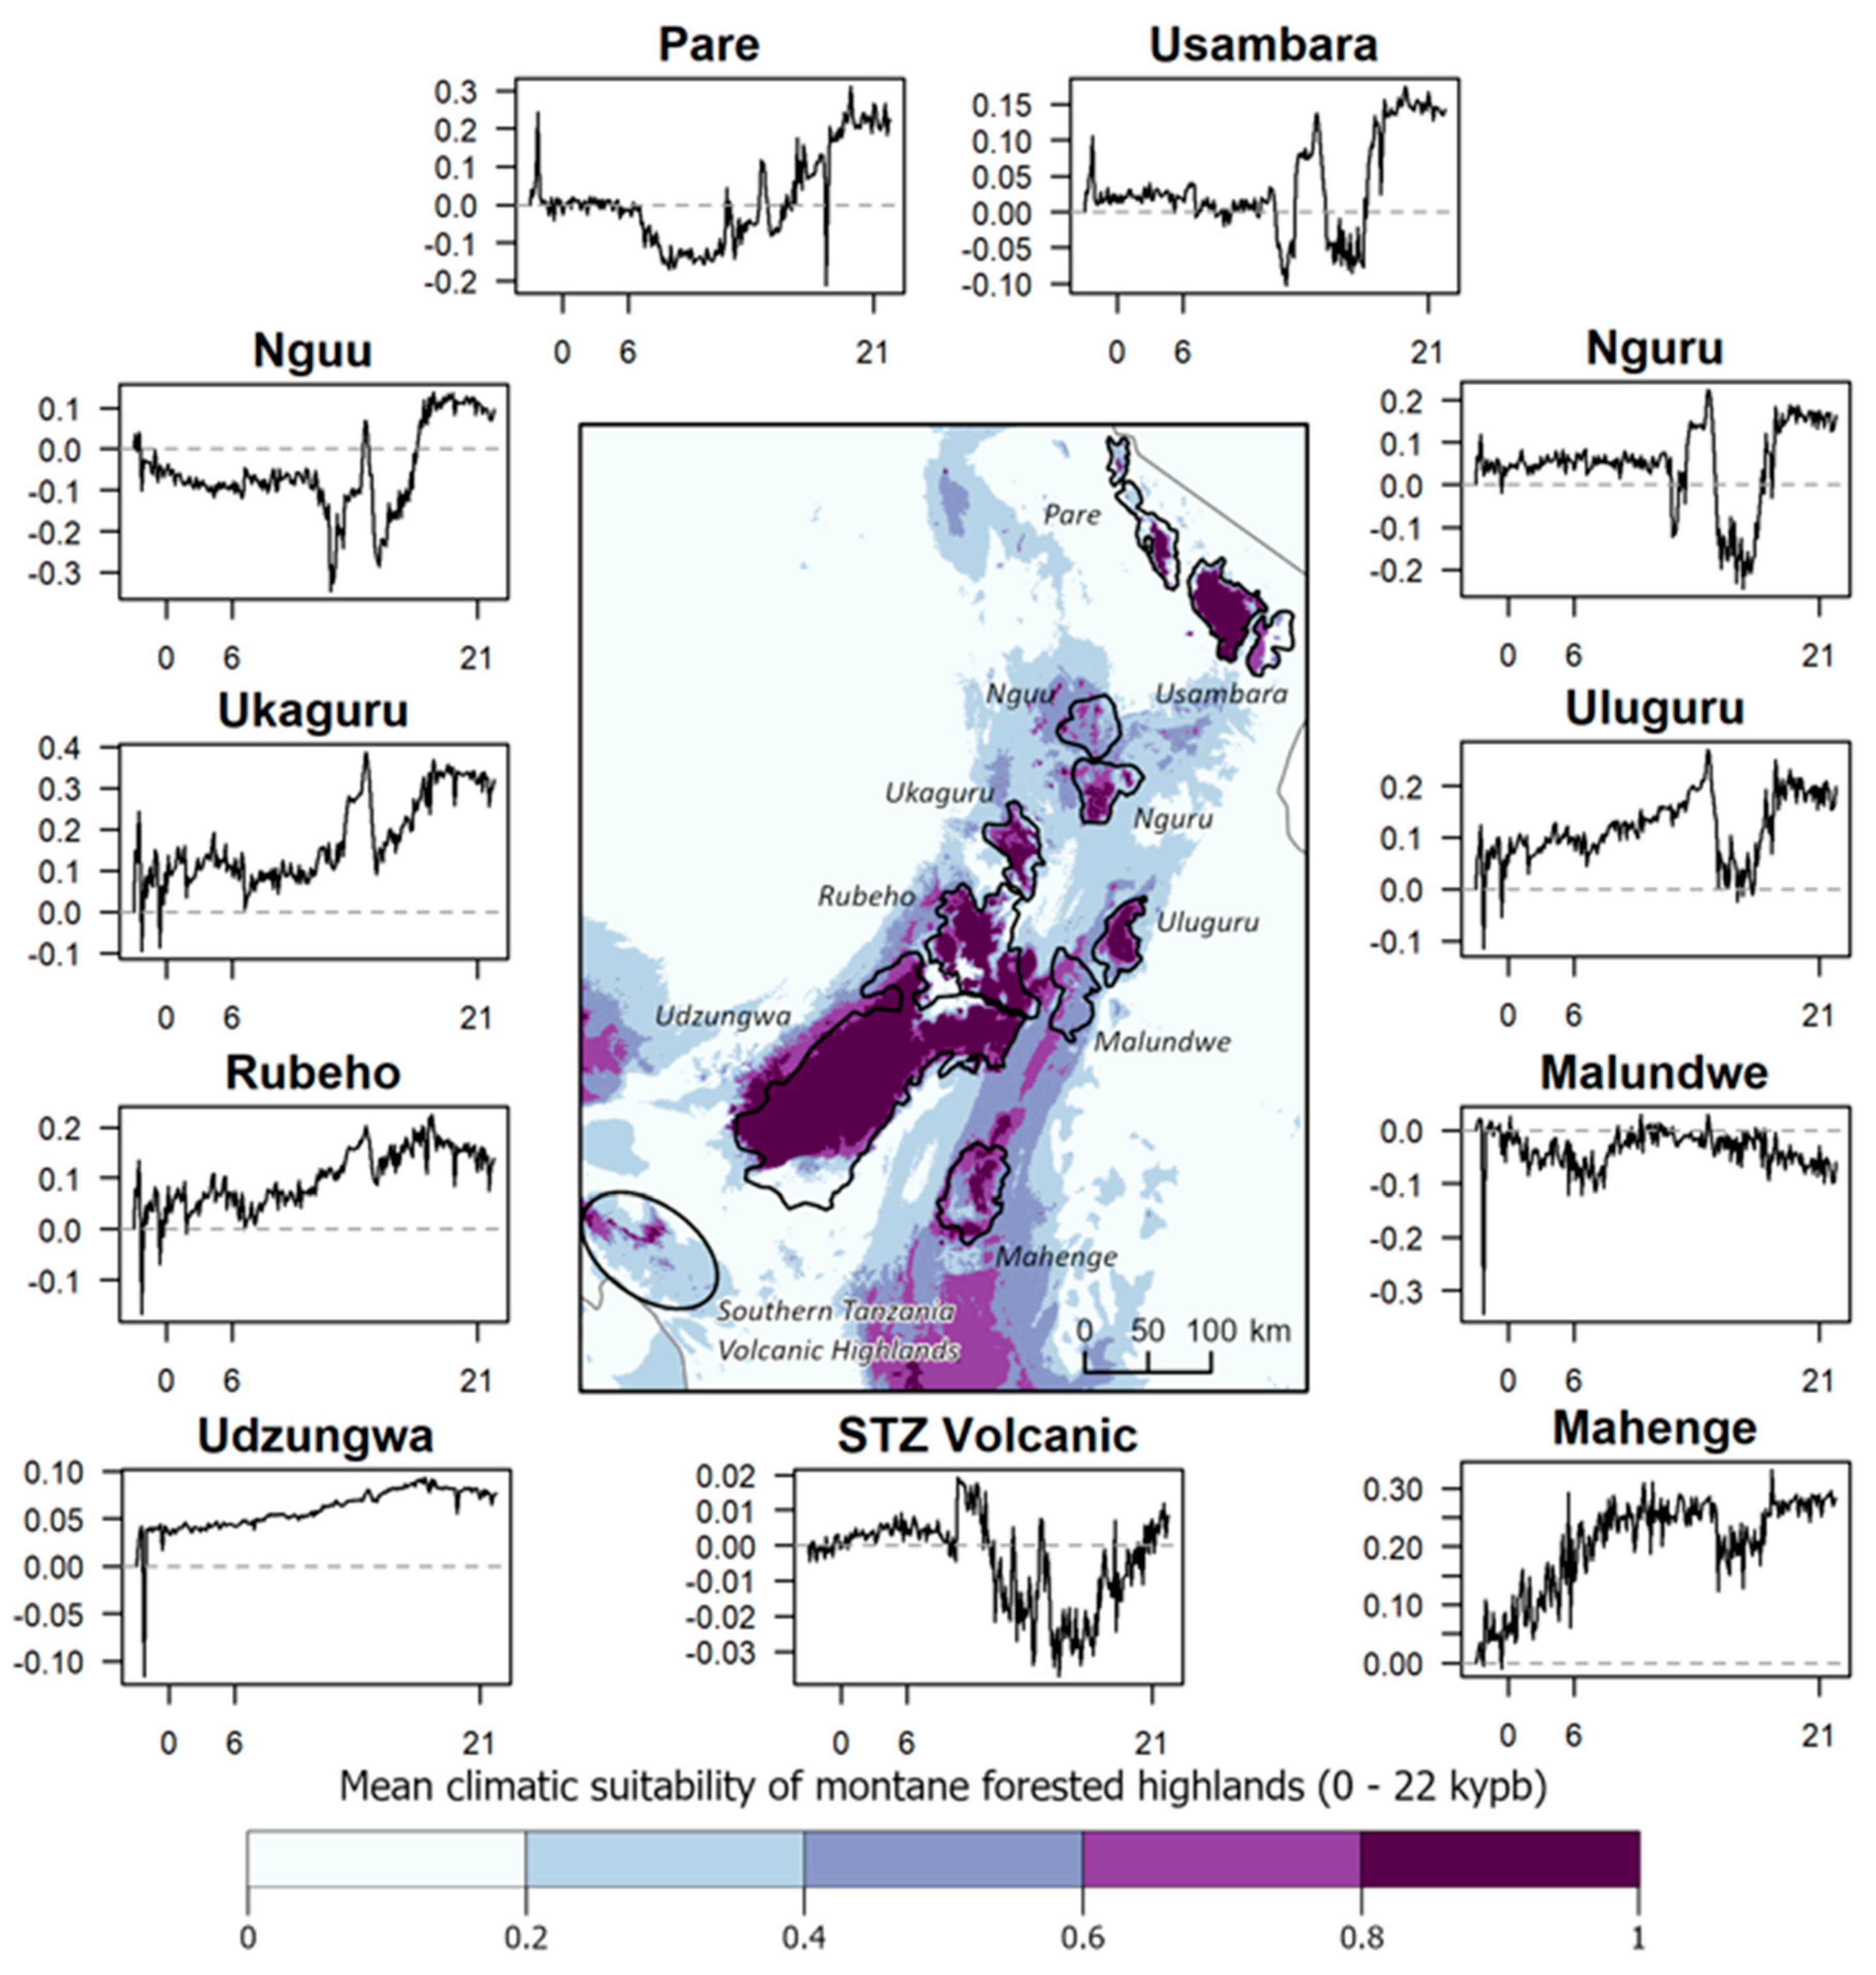
Paleoclimate. Results from our climate models suggest that the Usambara, Nguru, Uluguru, Ukaguru, Rubeho, Mahenge, and Udzungwa Mountains generally maintained the climatic conditions associated with forest habitat throughout climatic cycles extending back through the LGM (Figure 7). These patterns are consistent with pollen core data from the Udzungwa [29,30] and Uluguru Mountains [31], which show remarkably little change in vegetation through time. In contrast, montane forests in the Pare, Nguu, Malundwe, and the Southern Tanzania Volcanic Highlands, appear to have been in a greater state of flux during the late Quaternary (Figure 7). More recent periods of forest expansion may have been possible over the past 22,000 years, as indicated by the moderate levels of climate suitability extending beyond the mountain ranges to lower elevations predicted by our models (Figure 7).
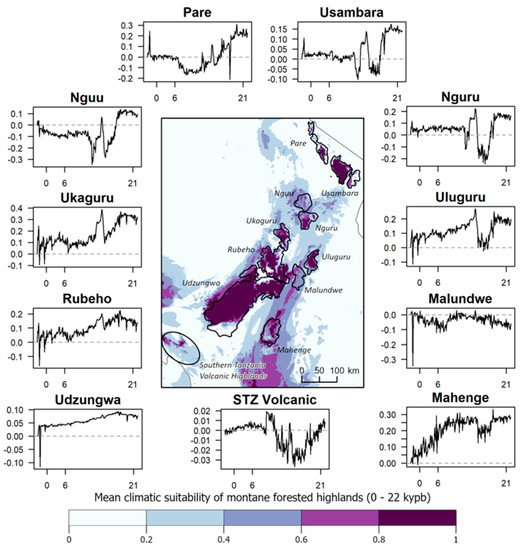
Figure 7.
Predicted climatic suitability of montane forested highlands in the Eastern Arc Mountains of Tanzania (excl. the small montane area in the Taita Hills in SE Kenya). The map reports the mean climatic suitability over the past 22,000 years, by century. Time series plots for each mountain range or highland depict the anomalies in mean climatic suitability (y axes) in the defined polygons over the same time period (x axes) in thousands of years before present (kybp), with values 0, 6 (roughly mid-Holocene), and 21 (roughly Last Glacial Maximum) provided as references. The dashed gray line in each plot reflects no change relative to the 20th century. Positive values represent increasing climatic suitability, while negative values represent decreasing suitability compared to the 20th-century baseline. The plot labeled “STZ Volcanic” corresponds to the Southern Tanzania Volcanic Highlands on the map.
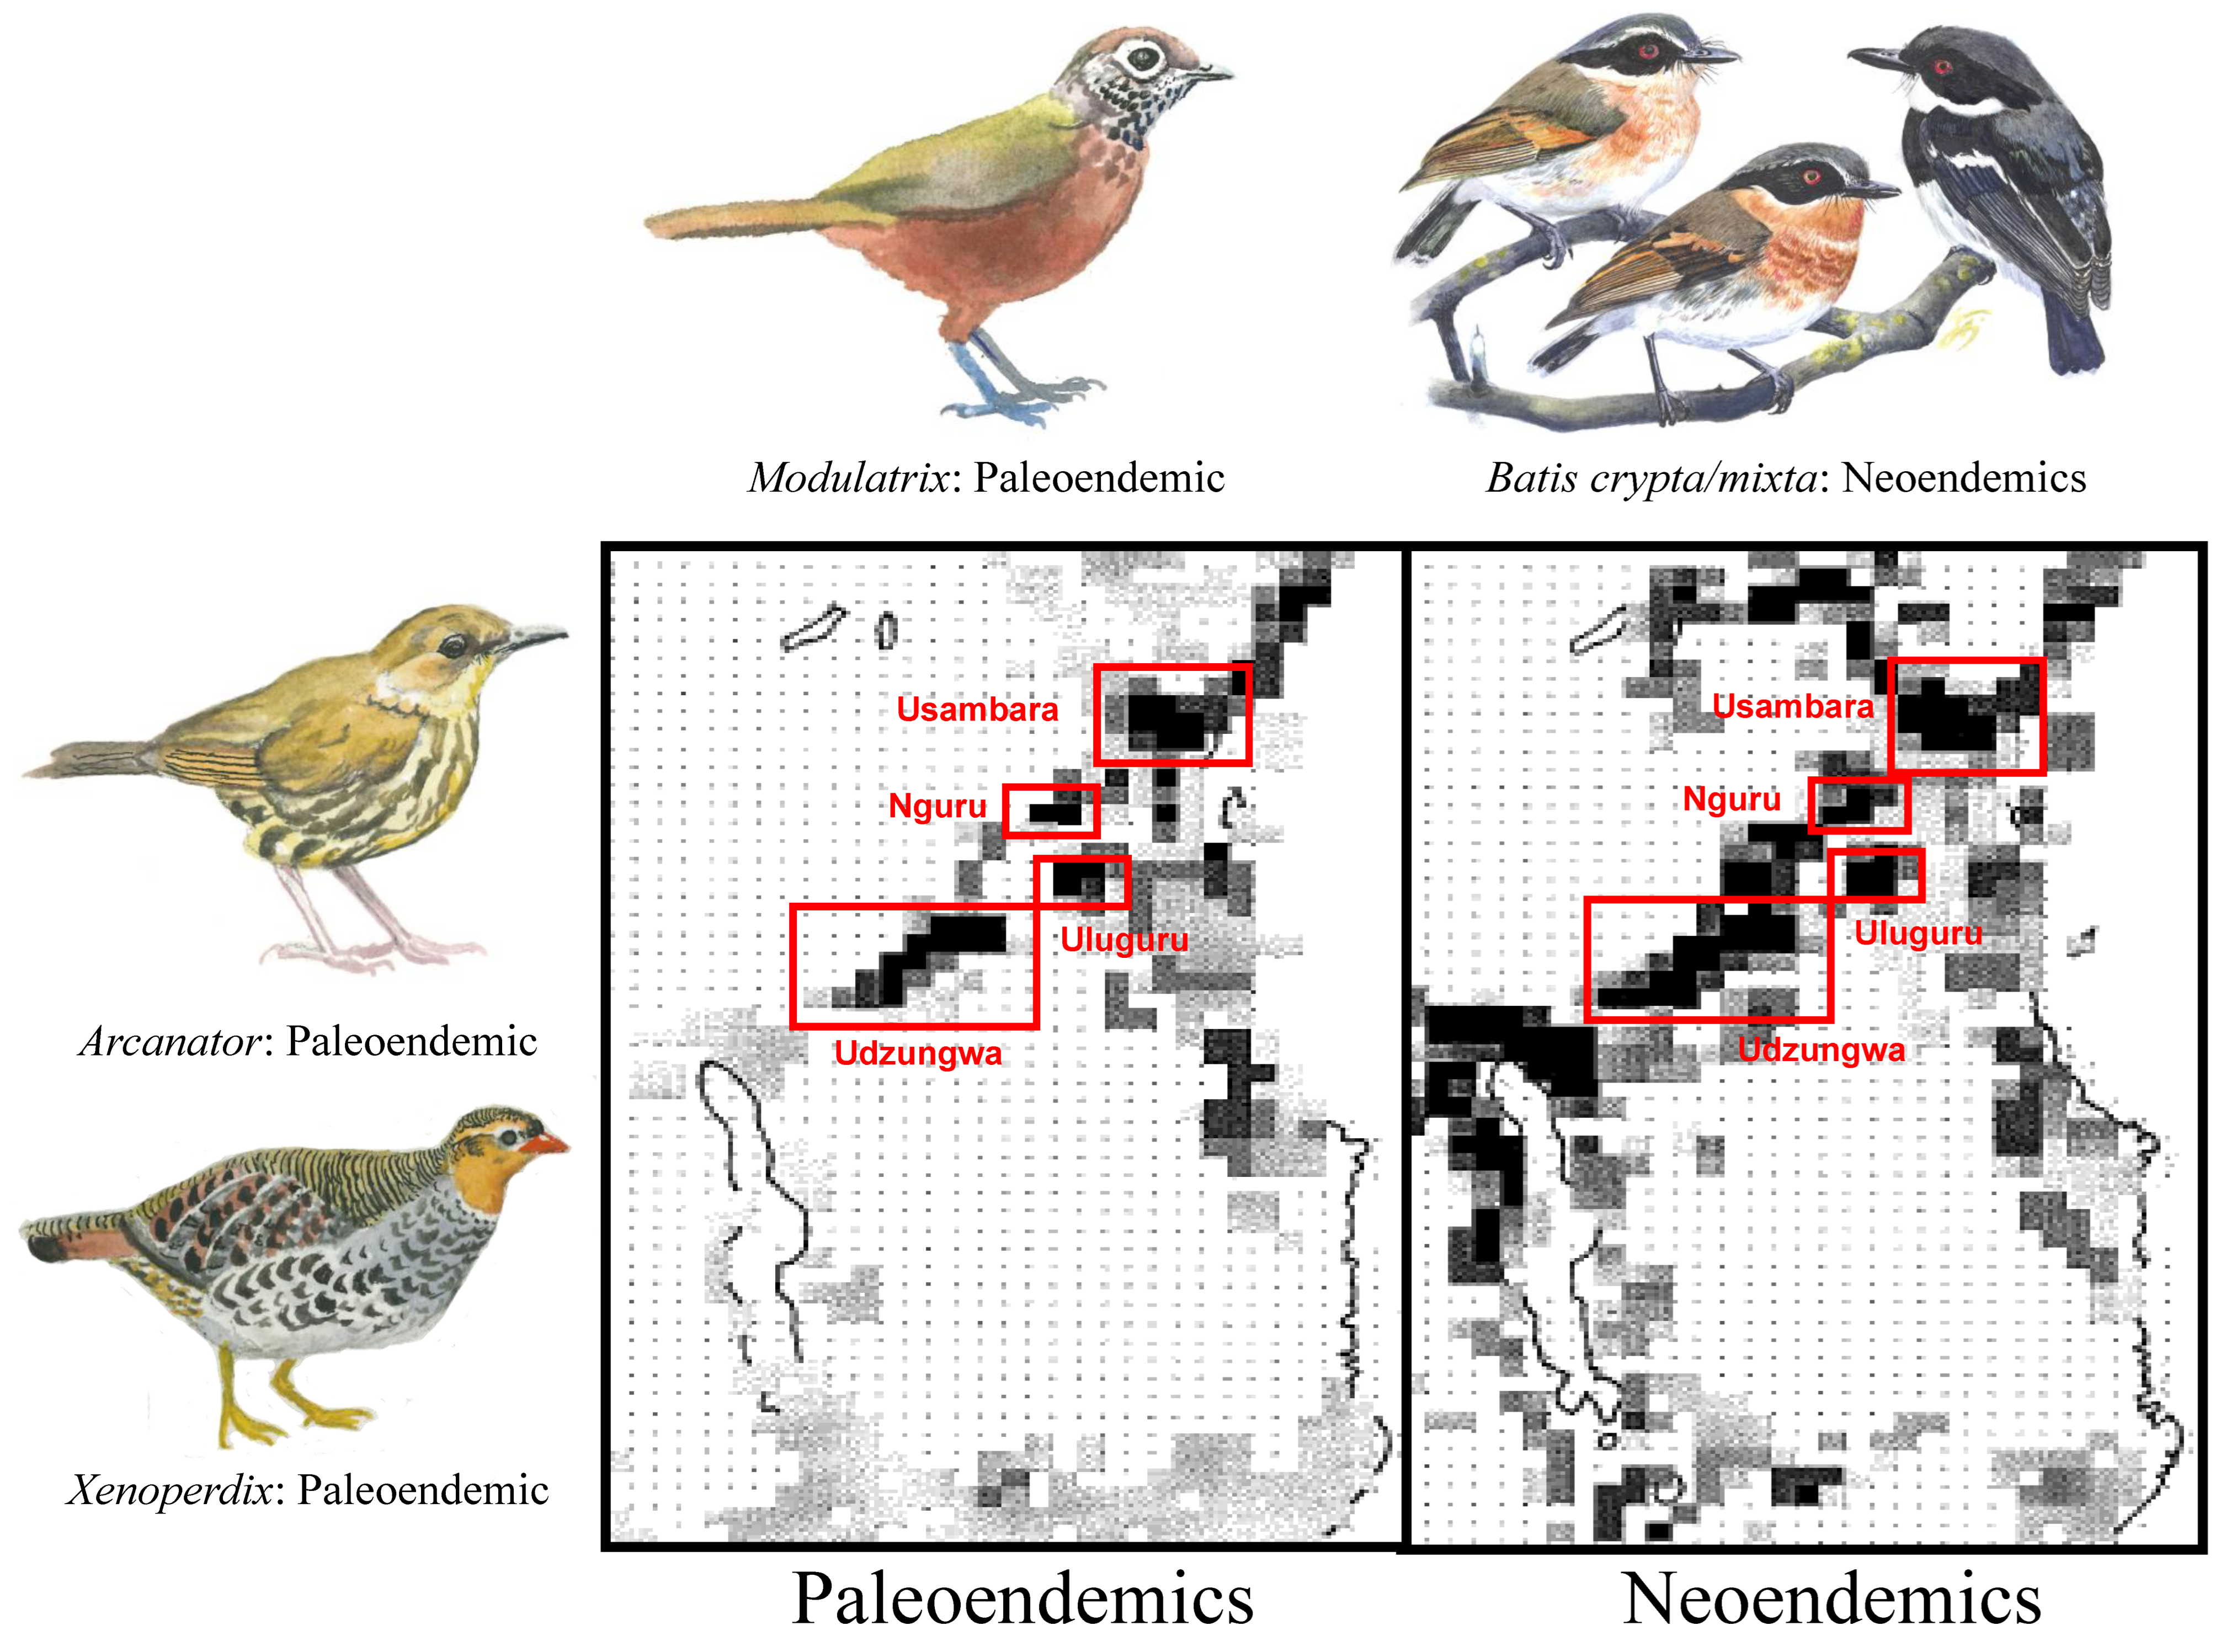
Deep History: Centers of paleo- and neoendemism. The ranges of paleo- and neoendemics overlap in areas where forest has persisted through glacial and interglacial periods (i.e., high stability: Usambara, Nguru, Uluguru, and Udzungwa Mountains). In contrast, paleoendemics are absent from climatically less stable areas, such as the Pare and Nguu Mountains, the Southern Tanzania Volcanic Highlands, and generally along the Malawi Rift (Figure 8).
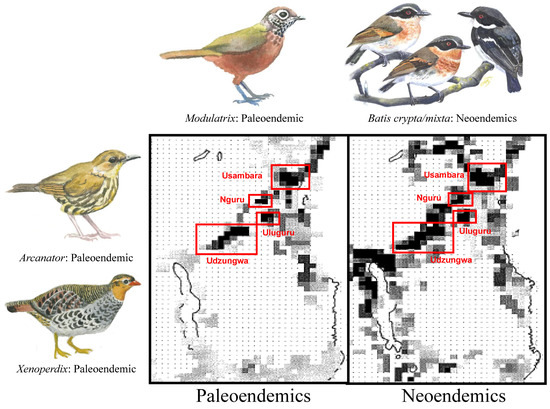
Figure 8.
Richness maps for 31 bird species whose branch-lengths date back to the Pliocene (paleoendemics) or earlier and for 97 lineages (allospecies) that diverged during the Pleistocene (neoendemics). Darker pixels indicate greater richness. Three paleoendemic lineages of the Eastern Arc Mountains are illustrated: the Udzungwa Forest Partridge (Xenoperdix udzungwensis); the Dapple-throat (Arcanator orthostruthus); and the Spot-throat (Modulatrix stictigula). The single neoendemic lineage is a newly described bird species from East Africa [47], the Dark Batis (Batis depicted crypta), and its sister-taxon, the Forest Batis (B. mixta), both of which have traditionally formed part of the Cape Batis (B. capensis) species complex. The paintings are by Jon Fjeldså.
Shallow History: Population demography. Autosomal, sex-linked, and mtDNA loci of the Yellow-streaked Greenbul reflect the habitat stability predictions, with the highest haplotype and nucleotide diversity and the largest estimates for effective population size occurring in the more stable Usambara and Udzungwa Mountains (Table 2). Yellow-streaked Greenbuls in the Usambara Mountains show no evidence of population expansion (e.g., mtDNA Fs = −1.58, p = 0.223). In contrast, populations in mountains where forest persisted but was reduced, either more recently (Udzungwa) or more extensively (Nguru), showed signs of expansion (Nguru Fs = −7.37, p < 0.001; Udzungwa Fs = −10.1, p < 0.001). The Southern Tanzania Volcanic Highlands are thought to have lost nearly all forest cover during glacial periods (Figure 7; see [94]); our low population genetic summary statistic estimates for these highlands are consistent with this expectation (Table 2). Autosomal and mtDNA data from the Spot-throat also accord with our models of forest cover (Figure 7); nearly all the highlands where forest is predicted to have persisted have relatively high genetic diversity estimates (Table 2). Interestingly, the Uluguru Mountains, a putatively stable highland (Figure 7), have the lowest genetic diversity estimates for the Spot-throat. This finding suggests that local phenomena and/or species traits (e.g., population size, foraging stratum, and diet) are important to take into account when comparing diversity estimates among species.

Table 2.
Summary statistics of diversity: sample size (n), haplotype/allelic diversity (h), nucleotide diversity (π), and theta (θ from S) estimated from DNA sequence data. * The categorization of forest persistence in each highland over the past 22,000 ybp (Figure 7).
4. Discussion
Several montane forest birds of the Eastern Arc Mountains represent remarkably old lineages (>15 mya; e.g., Forest Partridges (Xenoperdix spp.), Dapple-throat, and Spot-throat; [72,87,95]). In these species, vicariance from the nearest extant lineages dates back to the time of mountain uplift and rifting across East Africa in the Miocene [32,96], or even earlier as in the case of Xenoperdix [97]. However, the phylogeographic structure among the 14 co-distributed lineages of forest birds (Figure 5; Table S1) reflects biogeographic events that occurred from the Pliocene through the Pleistocene, postdating the uplift of the African interior plateau that severed the once-continuous super-rainforest of the continent [7,68].
Since the late Miocene, the African climate has been inherently unstable, with the geological uplift of Central Africa leading to the general drying of the continent [16]. In the Pleistocene, changes to the periodicity of orbitally induced glacial-interglacial cycles resulted in dramatic changes in rainfall over variable time scales, from millennia to decades [16,17,98,99]. These changes particularly impacted the amount of forest coverage in the Mozambique and Malawi Rifts, both in Madagascar’s rain shadow. A recent reconstruction of the 1.3-million-year-old hydroclimate of Lake Malawi, based on a core drilled from the bottom of that lake, provides evidence of at least 24 lake level drops in excess of 200 m during this period, including 15 lowstands with shorelevels >400 m below the current maximum depth [99]. These lowstands are indicative of a significant reduction in runoff that points to severe drought [99]. In contrast, the location of the Eastern Arc Mountains of Tanzania and southeastern Kenya would have permitted these sky islands to capture humidity from the continuously warm Indian Ocean throughout glacial cycles, as they have likely been doing since the late Miocene [100]. Our climate modeling, which retrodicted high climate stability in several Eastern Arc sky islands whose forests are inferred to have persisted through glacial and interglacial cycles (Figure 7), is consistent with the results from pollen core analyses [29,30].
Prediction 1: Phylogeographic breaks are apparent among East African sky islands. The occurrence of geographical breaks across the 14 co-distributed forest bird lineages reveals that 10 of the 14 species/species complexes have monophyletic lineages on either side of the lowland gap separating the Usambara from the Nguu/Nguru Mountains (Figure 5 and Figure 6; Table S1). If we extend the geographic position of a north-to-south phylogeographic break to include the Nguu/Nguru, two additional lineages, Batis (Batis mixta) and the Yellow-streaked Greenbul, exhibit a break in gene flow between the Nguu/Nguru and Ukaguru. Five of the 14 bird species/species complexes have monophyletic lineages on either side of the lowland gap separating the Nguu/Nguru from the Ukaguru Mountains, and four species/species complexes have lineages restricted to the Uluguru (Figure 5). These findings suggest that the woodland on the Malundwe Plateau between the Uluguru and Rubeho/Udzungwa may have acted as a dispersal corridor under climate conditions that favored downslope movement of sub-montane forest. Three species/species complexes are separated by the Ruaha Gorge (Figure 5), suggesting that this gorge is a relatively weak biogeographic barrier for birds, a finding consistent with community-level surveys of the Rubeho and Udzungwa Mountains [55]. Three of the 14 species/species complexes exhibit a phylogeographic break across the Makambako Gap, the grassland barrier between the western terminus of the Eastern Arc Mountains in the Udzungwa Highlands and the slightly geologically younger Southern Tanzania Volcanic Highlands encircling the northern rim of Lake Malawi (Figure 5), suggesting that the Makambako Gap is a weak phylogeographic barrier for birds. The strong phylogeographic structure recovered for birds among the montane sky islands of the Eastern Arc supports our first prediction stemming from Prigogine’s [6] hypothesis, that climate cycling is indeed an important driver of lineage diversification among African forest birds (Figure 1; see [2,7,8,18,23,68]).
Some bird species exhibit phylogeographic structure across the Eastern Arc Mountains, while others do not. One possible explanation lies in life history trait differences. Burney and Brumfield’s [101] synthesis of correlations between phylogeographic structure and life-history traits in Amazonian birds concluded that the most genetically structured species are those that forage predominantly in the forest understorey. Across the Eastern Arc Mountains and the highlands around the northern tip of Lake Malawi, the following species that feed in the understorey and consume insects––the Spot-throat (5 lineages), the Red-capped Forest Warbler (4 lineages), and the Eastern Double-collared Sunbird complex (5 lineages)––exhibit the most reciprocally monophyletic lineages (Figure 5; Table S1); the sunbirds also forage mid-stratum to supplement their diet with nectar [65]. Members of the Usambara Akalat and Abyssinian Thrush species complexes that also forage in the understorey each have three lineages that replace each other across the Eastern Arc Mountains [41,51]. Our data indicate that understorey foraging birds are phylogeographically structured to a greater extent than mid-stratum or canopy foraging species. However, data also revealed that some mid-stratum to canopy feeding species in East Africa (e.g., Yellow-streaked and Striped-cheeked Greenbul) have three discreet lineages that replace one another across the Eastern Arc sky islands and the montane highlands of the northern Malawi Rift. As these data make clear, it is not easy to explain why some species exhibit greater phylogeographic structure than others; a difficulty further compounded by the intersection of colonization history and individual species ecology. A larger sample of East African forest-dependent bird phylogeographic studies could allow for the relative roles of history and ecology in shaping population genetic structure across the landscape to be teased apart. Ten species of interest for phylogeographic study include: Lemon Dove (Columba larvata); Usambara Eagle-Owl (Ketupa poensis vosseleri); Southern Yellow White-eye (Zosterops anderssoni); Shelley’s Greenbul (Arizelocichla masukuensis); Mountain Greenbul species complex (Arizelocichla nigriceps); Swynnerton’s Robin (Swynnertonia swynnertoni); Olive-flanked Ground Robin (Cossypha anomala); Bar-throated Apalis complex (Apalis thoracica); Dapple-throat; and Red-faced Crimsonwing (Cryptospiza reichenovii).
In contrast to the species discussed above, the Olive Sunbird and the White-starred Robin are the only species to have no mtDNA lineages restricted to individual montane highlands in the Eastern Arc Mountains or the Malawi Rift (Table S1). Rather, these two species feature an admixture of predominately northern and southern haplotypes in the central Eastern Arc Mountains, with a sharper transition in haplogroups among montane sky islands for the White-starred Robin [42] than for the Olive Sunbird [46]. The latter, one of Africa’s most widespread songbirds, occupies both montane and lowland forest throughout its range; the former, also a widespread Afromontane bird, is an altitudinal migrant that moves seasonally between dry foothill and montane forests, with a range that extends from montane highlands across East Africa to the forests of South Africa. The White-starred Robin and the Olive Sunbird from the northern Eastern Arc Mountains (exclusive of the interior Eastern Arc Mountains), both share some of the same haplotype clusters with birds from southern Malawi and northern Mozambique. This distribution suggests that lowland coastal forests along Africa’s east coast have served as a corridor linking coastal forests in the north with those in extreme southeastern Tanzania and northern Mozambique, a phenomenon also observed in several other forest bird lineages [8,39]. The propensity of the White-starred Robin and the Olive Sunbird to readily enter lowland forest appears to have facilitated greater gene flow across the fragmented montane habitats of the Eastern Arc Mountains. The use of lowland habitats as corridors to reach montane highlands likely explains the sharing of haplotypes among sky islands in East Africa [8,42].
Prediction 2: Phylogeographic breaks are not coincident in time. Although 10 of the 14 lineages on which we synthesized data exhibit a phylogeographic break between the Usambara and Nguu/Nguru Mountains, the variation in sequence divergence (0.2–10%) in mitochondrial DNA separating lineages is remarkable. Generally, larger degrees of sequence divergence correspond to vicariance occurring in the more distant past. However, it has been well established that the smaller the population size, the faster haplotypes will drift to fixation. Hence, any comparison of the divergence of co-distributed species should account for differences in population size. We accounted for this by using hierarchical Bayesian simulations [74] and demonstrated that at least three temporally-independent divergence events must be inferred to explain the observed variation in sequence divergence of lineages across the Usambara-Nguu/Nguru lowland habitat barrier (Figure 6), the oldest inferred for the Eastern Double-collared Sunbird and Usambara Akalat species complexes, and the youngest for the Spot-throat, Sharpe’s Akalat, Green Barbet, and White-breasted Alethe (Figure 6). These results are consistent with Priogine’s [6] model and with Vrba’s [18] extension of that model, which postulate that multiple cyclic expansions and contractions of montane forests over time account for the high species richness of montane forests in the East African biodiversity hotspot.
Cyclic expansion and contraction of forests as a mechanism for the creation of lineage divergence may also have played an important role in generating diversity across the Pàramos of the Northern Andes [102]; the Australian Wet Tropics [103]; the Brazilian Atlantic Forest [104]; the semi-arid mesic zones of Australia [105]; the Peninsular Desert of Baja California [106]; and possibly the Western Ghats of India, whose configuration resembles that of the Eastern Arc, with many lineages sharing spatially concordant phylogeographic breaks [9].
Prediction 3: Neoendemic and Paleoendemic species co-occur primarily in climatically stable sky islands. Mapping of the 97 montane forest-associated bird species that diverged from their congeners during the Pleistocene (neoendemics) reveals an even distribution of lineages throughout the Eastern Arc Mountains and the northern and southern Malawi Rift (Figure 8). This result indicates that the cyclical expansion and contraction of montane forests (Figure 2 and Figure 7) facilitated the dispersal of species across East Africa’s montane highlands when forests expanded and subsequently isolated lineages when forests contracted, leading to the formation of new lineages through vicariance and allopatric speciation (Figure 2). This mechanism, however, fails to explain the disproportionately high richness of narrow-range endemic species in the sky islands of Usambara, Uluguru, and Udzungwa within the Eastern Arc Mountains (Figure 4; [37]).
Alternatively, different rates of in situ diversification might explain the presence of more narrow-range endemic species on some Eastern Arc Mountains than on others. Were this the case, we would expect to recover sister-species in the same highlands as a consequence of temporary allopatry or parapatry caused by climate cycles and/or competition [18], resource allopatry via ecological divergence among overlapping populations [107,108], or sympatric speciation via mechanisms such as mismatch in song learning and imprinting [109]. Such a result has not been found for vertebrates (e.g., birds: [39,51,68]; mammals: [110,111,112]; amphibians: [113,114]; reptiles: [115]); nor for the few invertebrate groups studied to date (e.g., crickets: [116]). The only exceptions are some plant groups such as African Violets (Saintpaulina spp.), with sister-species co-occurring in the Usambara Mountains [117,118]. A similar situation is found in the Andes, where speciation involves isolation among different mountain slopes while sympatry with segregation on the same slope is a secondary phenomenon (e.g., [119,120,121]). Thus, allopatric rather than parapatric or sympatric speciation is the norm among terrestrial vertebrates [122,123].
Members of the Eastern Double-collared Sunbird complex provide one of the few examples of closely related (although not sister) bird taxa within the same montane highlands. In the northern forests of the Udzungwa Mountains, Moreau’s Double-collared Sunbird (Cinnyris moreaui) and Forest Double-collared Sunbird (C. fuelleborni) form a narrow contact zone [43,44,45], which is thought to have resulted from secondary contact after expansion of the Forest Double-collared Sunbird from the highlands around the Malawi Rift across the grassland expanse of the Makobako Gap and into the Udzungwa [44,45].
Why do some Eastern Arc Mountains––in particular the Usambara, Uluguru and Udzungwa––have narrow-range endemics in larger numbers than expected relative to their area ([37]; Figure 4)? The distribution of neoendemics throughout the Eastern Arc suggests that lineage diversification through vicariance-induced allopatric speciation can occur anywhere among the 13 sky islands. Thus, putatively high rates of speciation in some sky islands than others are insufficient to explain the disparity in the distribution of narrow-range endemic species across the Eastern Arc Mountains. The distribution of paleoendemic taxa across the Eastern Arc Mountains reveals a remarkable coincidence between mountains with high probabilities of habitat persistence (i.e., stability; Figure 7) and the richness of paleoendemic species (Figure 8), thus supporting that neoendemic and paleoendemic species primarily co-occur in climatically stable sky islands (Figure 2, Prediction 3). This coincidence suggests that a few mountains with a highly stable climate and limited forest reduction across climate cycles have accumulated a disproportionate number of range-restricted East African endemic species. Hence, differential rates of extinction among the 13 montane sky islands of the Eastern Arc, rather than differences in the rate of speciation, may be the mechanism underlying the observed differences in bird richness versus endemism across East Africa (Figure 4).
Invoking differential rates of extinction to explain disparities in narrow-range endemism among East African sky islands raises the question of why paleoendemic species have not recolonized sky islands where local populations went extinct during climate cycles. Previous research has demonstrated that, although rare, such recolonizations do occur. For example, Forest Partridges (Xenoperdix spp.) are an ancient lineage most closely related to Southeast Asian phasianids [97], but the Udzungwa (X. udzungwensis) and Rubeho Forest Partridges (X. obscuratus) diverged during the Pleistocene [95]. Another paleoendemic species, the Spot-throat [72], now occupies most of the Eastern Arc sky islands but has relatively shallow sequence divergence (<3.5%) among sky island lineages, suggesting expansion from a refugium across the Eastern Arc in the Pleistocene. In general, the lack of evidence for the expansion of paleoendemic lineages out of refugia in the Eastern Arc may suggest that competition [18,124] makes recolonization of sky island bird communities in East Africa difficult. This biotic aspect of climate cycling warrants further attention.
Future work using whole genome sequences will make it possible to detect historical introgression events, as has been performed with other lineages of birds (e.g., [125]). This approach should prove particularly useful with Eastern Arc forest birds, as past introgression is difficult to detect from their morphological traits, given the morphological conservation of these species (e.g., [45]. As such, we expect that detailed studies of introgression will detect additional cryptic instances of recolonization among sky island populations.
Prediction 4: Climatically stable sky islands feature greater genetic diversity and larger effective population sizes than do less climatically stable areas. It is challenging to test the hypothesis that different rates of extinction, rather than speciation, are the causal mechanism underlying the differences in species richness and narrow-range endemism observed across East Africa (Figure 4). The use of population genetics summary statistics offers one potential means to do so. We can expect that populations of birds occupying climatically stable mountains should harbor greater genetic diversity and larger effective population sizes than populations occupying less climatically stable mountains. In support of Prediction 4 (Figure 2), the summary statistics from our analyses of multi-locus data from the Yellow-streaked Greenbul reveal a marked reduction in genetic diversity and effective population size in populations that occupy the Southern Tanzania Volcanic Highlands in contrast with those occupying many of the sky islands of the Eastern Arc; this difference would be expected given the low stability retrodicted by our climate models for the Southern Tanzania Volcanic Highlands (Figure 7; Table 2). The Spot-throat occupies sky islands where our retrodicted climate models suggest forest cover persisted throughout the most recent glacial cycles (Figure 7; Table 2). Our population genetics summary statistics recover values consistent with stable population dynamics, except in the Uluguru Mountains, where the results are consistent with population decline. The low nucleotide diversity and population size estimates for populations in the Uluguru Mountains could result either from habitat dynamics that predated the periods retrodicted by our climate models or, more likely, from very rapid and almost complete loss of forest over the past 50 years [37]. The application of demographic methods that project into the deep past (over 100,000 years; e.g., [126]) will make it possible to determine which of the scenarios outlined in these hypotheses is more likely to have occurred.
Both neoendemic and paleoendemic species are found in highlands with high precipitation, a large elevation range of forest [56], and high habitat persistence (stability; Figure 7 and Figure 8). The effects of putatively differential extinction are apparent through comparisons of bird faunas of the Udzungwa and Rubeho Mountains [55]. Despite separation by a deep, narrow gorge created by the erosion of the Ruaha River, the Udzungwa and Rubeho Mountains share much of their upper montane bird fauna, suggesting a significant exchange of seemingly sedentary birds. In contrast, many species that occupy the lower montane zone of the Udzungwa Mountains are not found in the adjacent Rubeho Mountains. Our retrodicted climate models suggest that both the Udzungwa and Rubeho maintained a similar extent of forest through the LGM (Figure 7). It seems likely that each mountain experienced different degrees of habitat persistence in the more distant past due to the dynamic nature of the East Africa climate [16,17,99], with more forest reduction in the Rubeho than the Udzungwa Mountains due to the rainshadow cast by the Uluguru.
Population genetic summary statistics offer a potentially efficacious approach for exploring the significance of the local extinction and recolonization of unstable sky islands (i.e., those in which forest did not persist through climate cycling), phenomena leading to the accumulation of paleoendemics in some sky islands but not others (Figure 2 and Figure 7). Recent theoretical and empirical work on the community assembly of African birds and mammals [23] provides another approach to investigating the role of local extinction in driving the pattern of observed species richness and narrow-range endemism. Using simulations, these authors demonstrated that reduced extinction is sufficient to create underdispersion in communities. Thus, we should expect climatically stable sky islands in the Eastern Arc to harbor underdispersed communities and unstable sky islands to harbor overdispersed communities. We are presently collecting phylogenomic data to test this expectation.
5. Conclusions
The research reported here supports all four predictions stemming from climate cycling ([6,18]; Figure 2) and is thus consistent with pulsed speciation in the context of cyclic expansions and contractions of montane forest through time driving lineage diversification among East African montane bird communities. This process is evidenced by the broad distribution of neoendemic species across the Eastern Arc Mountains. Harder to explain is the high incidence of narrow-range endemism––particularly of paleoendemic species––on some but not all East African Mountains (Usambara, Uluguru, and Udzungwa). Consistent with recent models [23], we argue that different rates of local extinction, rather than increased rates of lineage diversification, explain the observed pattern of “excessive” narrow-range endemism among the sky islands of the Eastern Arc Mountains. Thus, while the isolation of lineages on various montane highlands provides important opportunities for allopatric speciation, it also provides a mechanism by which populations in unstable highlands may have experienced higher rates of extinction than their more stable counterparts across climate cycles. Such a regional filtering effect, wherein paleoendemics maintained populations through time only in areas of habitat stability, provides a credible explanation for the dramatic variance in levels of endemism observed among different East African sky islands.
Supplementary Materials
The following supporting information can be downloaded at: https://www.mdpi.com/article/10.3390/d15030394/s1. Figure S1: Phylogenetic hypothesis of relationships among the Spot-throat (Modulatrix stictigula) populations occupying different Eastern Arc sky islands generated using maximum-likelihood as the optimality criterion. Support values are bootstrap percentages. Table S1: Summary of the presence/absence of phylogeographic breaks for each of the 14 co-distributed forest-dependent bird lineages across the sky islands of the East Africa Mountains of Tanzania. STZ Volcanic corresponds to the Southern Tanzania Volcanic Highlands.
Author Contributions
R.C.K.B. designed the project, collected the data, performed most of the analyses, made the figures, and wrote the paper. W.B.M. performed the climate modeling analyses, helped with the interpretation of the data, and edited the manuscript. J.F. helped design the project, made all the paintings of birds included on the figures, identified the paleo- and neo-endemic lineages, wrote parts of the paper, and edited the manuscript. All authors have read and agreed to the published version of the manuscript.
Funding
Funding for this work was provided by: the Center of Macroecology, Evolution, and Climate at the University of Copenhagen, Denmark; the Villum Foundation, Denmark (Grant #25925); the Hellman Foundation through the University of California; the DST-NRF Centre of Excellence at the FitzPatrick Institute, South Africa; and the Skye Foundation, South Africa.
Institutional Review Board Statement
All procedures for this study complied with the animal ethics guidelines of the University of California, Berkeley (IACUC numbers R317, 2014-10-6780, 2016-04-8665).
Data Availability Statement
This study synthesizes previously published research with the sources listed in Table 1.
Acknowledgments
We thank the many people who have participated with us in the field, as well as those who have contributed data to databases and deposited samples for molecular analyses in museums. We acknowledge and thank the local people for their help and generous access to their lands. We thank Louis Hansen for his long-term contributions to building the species distribution database of East African birds and for his help in the field, and Barbara Ustanko and four reviewers for providing extensive feedback that significantly improved the manuscript.
Conflicts of Interest
The authors declare no conflict of interest.
References
- Dowsett, R.J. Origins of the high-altitude avifaunas of Tropical Africa. In High Altitude Tropical Biogeography; Vuilleumier, F.F., Monasterio, M., Eds.; Oxford University Press: Oxford, UK, 1986; pp. 557–585. [Google Scholar]
- Bowie, R.C.K. Birds, Molecules and Evolutionary Processes among Africa’s Islands in the Sky. Ph.D. Thesis, University of Cape Town, Cape Town, South Africa, 2003. [Google Scholar]
- Cooper, J.C. Hierarchical analyses of community biogeography in the Afromontane highlands. Front. Biogeogr. 2021, 13, e51310. [Google Scholar] [CrossRef]
- White, F. The Vegetation of Africa; UNESCO: Paris, France, 1983. [Google Scholar]
- Hedberg, O. Origins of Afroalpine flora. In High Altitude Tropical Biogeography; Vuilleumier, F.F., Monasterio, M., Eds.; Oxford University Press: Oxford, UK, 1986; pp. 443–465. [Google Scholar]
- Prigogine, A. Disjunctions of montane birds in the Afrotropical region. Bonn. Zool. Beitr. 1987, 38, S195–S207. [Google Scholar]
- Fjeldså, J.; Bowie, R.C.K. New perspectives on Africa’s ancient forest avifauna. Afr. J. Ecol. 2008, 46, 235–247. [Google Scholar] [CrossRef]
- Fjeldså, J.; Bowie, R.C.K. Evolutionary and ecological explanations for the elevational flexibility of several East African bird species complexes. Front. Ecol. Evol. 2021, 9, 768062. [Google Scholar] [CrossRef]
- Biswas, A.; Karanth, K.P. Role of geographical gaps in the Western Ghats in shaping intra- and interspecific genetic diversity. J. Indian Inst. Sci. 2021, 101, 151–164. [Google Scholar] [CrossRef]
- Manthey, J.D.; Moyle, R.G. Isolation by environment in White-breasted Nuthatches (Sitta carolinensis) of the Madrean Archipelago sky islands: A landscape genomics approach. Mol. Ecol. 2015, 24, 3628–3638. [Google Scholar] [CrossRef]
- Moreau, R.E. The Bird Faunas of Africa and Its Islands; Academic Press: New York, NY, USA, 1966. [Google Scholar]
- Hall, B.P.; Moreau, R.E. An Atlas of Speciation in African Passerine Birds; British Museum: London, UK, 1970; (Natural History). [Google Scholar]
- Dowsett, R.J. Site-fidelity and survival rates of some montane forest birds in Malawi, south-central Africa. Biotropica. 1985, 17, 145–154. [Google Scholar] [CrossRef]
- Callens, T.; Galbusera, P.; Matthysens, E.; Durand, E.Y.; Githiru, M.; Huyghe, J.R.; Lens, L.U.C. Genetic signature of population fragmentation variers with mobility in seven bird species of a fragmented Kenyan Cloud Forest. Mol. Ecol. 2011, 20, 1829–1844. [Google Scholar] [CrossRef]
- Diamond, A.W.; Hamilton, A.C. The distribution of forest passerine birds and Quaternary climatic change in tropical Africa. J. Zool. 1981, 191, 379–402. [Google Scholar] [CrossRef]
- deMenocal, P.B. African climate change and faunal evolution during the Pliocene-Pleistocene. Earth Planet. Sci. Lett. 2004, 220, 3–24. [Google Scholar] [CrossRef]
- Trauth, M.H.; Maslin, M.A.; Deino, A.; Strecker, M.R. Late Cenozoic moisture history of East Africa. Science 2005, 309, 2051–2053. [Google Scholar] [CrossRef]
- Vrba, E.S. Turnover-pulses, the Red Queen, and related topics. Am. J. Sci. 1993, 293, 418–452. [Google Scholar] [CrossRef]
- Fjeldså, J. Geographical patterns of relict and young species of birds in Africa and South America and implications for conservation priorities. Biodiv. Conserv. 1994, 3, 107–126. [Google Scholar] [CrossRef]
- Fjeldså, J.; Lovett, J.C. Geographical patterns of old and young species in African forest biota: The significance of specific montane areas as evolutionary centres. Biodiv. Conserv. 1997, 6, 325–346. [Google Scholar] [CrossRef]
- Fjeldså, J.; Bowie, R.C.K.; Rahbek, R. The role of mountain ranges in the diversification of birds. Annu. Rev. Ecol. Evol. Syst. 2012, 43, 249–265. [Google Scholar] [CrossRef]
- Azevedo, J.A.R.; Guedes, T.B.; Nogueira, C.D.C.; Passos, P.; Sawaya, R.J.; Prudente, A.L.C. Museums and cradles of diversity are geographically coincident for narrowly distributed Neotropical snakes. Ecography 2020, 43, 328–339. [Google Scholar] [CrossRef]
- Cooper, J.C.; Crouch, N.M.A.; Ferguson, A.W.; Bates, J.M. Climate refugia and reduced extinction correlate with underdispersion in mammals and birds in Africa. Ecol. Evol. 2022, 12, e8752. [Google Scholar]
- Päckert, M.; Martens, J.; Sun, Y.-H.; Severinghaus, I.I.; Nazarenko, A.A.; Ting, J.; Töpfer, T.; Tietze, D.T. Horizontal and elevational phylogenographic patterns of Himalayan and Southeast Asian forest passerines (Aves: Passeriformes). J. Biogeogr. 2012, 39, 556–573. [Google Scholar] [CrossRef]
- Rahbek, C.; Borregaard, M.K.; Antonelli, A.; Colwell, R.K.; Holt, B.G.; Nogues-Bravo, D.; Rasmussen, C.M.; Richardson, K.; Rosing, M.T.; Whittaker, R.J.; et al. Building mountain biodiversity: Geological and evolutionary processes. Science 2019, 365, 1114–1119. [Google Scholar] [CrossRef]
- Päckert, M.; Favre, A.; Schnitzler, J.; Martens, J.; Sun, Y.-H.; Tietze, D.T.; Hailer, F.; Michalak, I.; Strutzenberger, P. Into and out of the Quinghai-Tibet Plateau and the Himalayas: Centers of origin and diversification across five clades of Eurasian montane and alpine passerine birds. Ecol. Evol. 2020, 10, 9283–9300. [Google Scholar] [CrossRef]
- Sonne, J.; Dalsgaard, B.; Borregaard, M.K.; Kennedy, J.; Fjeldså, J.; Rahbek, C. Biodiversity cradles and museums segregating within hotspots of endemism. Proc. R. Soc. B 2022, 289, 20221102. [Google Scholar]
- van Els, P.; Herrera-Alsine, L.; Pigot, A.L.; Etienne, R. Dynamical analysis of the global diversity gradient in passerine birds reveals a prominent role for highlands as species pumps. Nat. Ecol. Evol. 2021, 5, 1259–1265. [Google Scholar] [CrossRef]
- Marchant, R.; Mumbi, C.; Behera, S.; Yamagata, T. The Indian Ocean dipole—The unsung driver of climatic variability in East Africa. Afr. J. Evol. 2007, 45, 4–16. [Google Scholar] [CrossRef]
- Mumbi, C.T.; Marchant, R.; Hooghiemstra, H.; Woeller, M.J. Late Quaternary vegetation reconstruction from the Eastern Arc Mountains, Tanzania. Quat. Res. 2008, 69, 326–341. [Google Scholar] [CrossRef]
- Finch, J.; Leng, M.J.; Marchant, R.A. Late Quaternary vegetation dynamics in a biodiversity hotspot, the Uluguru Mountains of Tanzania. Quat. Res. 2009, 72, 111–122. [Google Scholar] [CrossRef]
- Macgregor, D. History of the development of the East African Rift System: A series of interpreted maps through time. J. Afr. Earth Sci. 2015, 101, 232–252. [Google Scholar] [CrossRef]
- Antonelli, A.; Kissling, W.D.; Flantua, S.G.A.; Bermúdez, M.A.; Mulch, A.; Muellner-Riehl, A.N.; Kreft, H.; Linder, H.P.; Badgley, C.; Fjeldså, J.; et al. Geological and climatic influences on mountain diversity. Nat. Geosci. 2018, 11, 718–725. [Google Scholar] [CrossRef]
- Jetz, W.; Rahbek, C. Geographic range size and determinants of avian species richness. Science 2002, 297, 1548–1551. [Google Scholar] [CrossRef]
- Linder, P.; de Klerk, H.; Born, J.; Burgess, N.; Fjeldså, J.; Rahbek, C. The partitioning of Africa: Statistically defined biochorological zones in sub-Saharan Africa. J. Biogeogr. 2012, 39, 1189–1205. [Google Scholar] [CrossRef]
- Jetz, W.; Rahbek, C.; Colwell, R.K. The coincidence of rarity and richness and the potential signature of history in centers of endemism. Ecol. Lett. 2004, 7, 1180–1191. [Google Scholar] [CrossRef]
- Burgess, N.D.; Butynski, T.M.; Cordeiro, N.J.; Doggart, N.H.; Fjeldså, J.; Howell, K.M.; Kilahama, F.B.; Loader, S.P.; Lovett, J.C.; Mbilinyi, B.; et al. The biological importance of the Eastern Arc Mountains of Tanzania and Kenya. Biol. Conserv. 2007, 134, 209–231. [Google Scholar] [CrossRef]
- Mittermeier, R.A.; Robles-Gill, P.; Hoffmann, M.; Pilgrim, J.D.; Brooks, T.B.; Mittermeier, C.G. Hotspots Revisited. Earth’s Biologically Richest and Most Endangered Ecoregions; CEMEX: Mexico City, Mexico, 2004. [Google Scholar]
- Bowie, R.C.K.; Pasquet, E.; McEntee, J.P.; Njilima, F.; Fjeldså, J. The systematics and biogeography of African Tailorbirds (Cisticolidae: Artisornis) with comments on the choice of Bayesian branch-length prior when analyzing heterogeneous data. Mol. Phylogenet. Evol. 2018, 118, 172–183. [Google Scholar] [CrossRef]
- Mostert, M.E. Unravelling species boundaries and high altitude phylogeography of the Streaky Canary of east and central Africa (Serinus striolatus). M.Sc. Thesis, Stellenbosch University, Stellenbosch, South Africa, 2005. [Google Scholar]
- Beresford, P.; Fjeldså, J.; Kiure, J. A new species of akalat (Sheppardia) narrowly endemic in the Eastern Arc of Tanzania. Auk 2004, 121, 23–34. [Google Scholar] [CrossRef]
- Bowie, R.C.K.; Fjeldså, J.; Hackett, S.J.; Bates, J.M.; Crowe, R.M. Coalescent models reveal the relative roles of dispersal, vicariance and ancestral polymorphism in shaping phylogeographical structure of an African montane forest robin. Mol. Phylogenet. Evol. 2006, 38, 171–188. [Google Scholar] [CrossRef]
- Bowie, R.C.K.; Fjeldså, J.; Hackett, S.J.; Crowe, T.M. Systematics and biogeography of the double-collared sunbirds (Nectariniidae) of the Eastern Arc Mountains of Tanzania. Auk 2004, 121, 660–681. [Google Scholar] [CrossRef]
- McEntee, J.P.; Peñalba, J.V.; Werema, C.; Mulungi, E.; Mbilinyi, M.; Moyer, D.; Hansen, L.; Fjeldså, J.; Bowie, R.C.K. Social selection parapatry in Afrotropical sunbirds. Evolution 2016, 70, 1307–1321. [Google Scholar] [CrossRef]
- McEntee, J.P.; Zhelezov, G.; Werema, C.; Najar, N.; Peñalba, J.V.; Mulungi, E.; Mbilinyi, M.; Karimi, S.; Chumakova, L.; Burleigh, J.G.; et al. Inferring punctuated evolution in the learned songs of African sunbirds. Proc. R. Soc. B Biol. Sci. 2021, 288, 20212062. [Google Scholar] [CrossRef]
- Bowie, R.C.K.; Fjeldså, J.; Hackett, S.J.; Crowe, T.M. Molecular evolution in space and though time: mtDNA phylogeography of the Olive Sunbird (Nectarinia olivacea/obscura) throughout continental Africa. Mol. Phylogenet. Evol. 2004, 33, 56–76. [Google Scholar] [CrossRef]
- Fjeldså, J.; Bowie, R.C.K.; Kiure, J. The Forest Batis Batis mixta is two species: Description of a new, narrowly distributed Batis species in the Eastern Arc biodiversity hotspot. J. Ornithol. 2006, 147, 578–590. [Google Scholar] [CrossRef]
- Kaliba, P.M. Faunal turnover between east and southern African terrestrial vertebrates: Is Malawi the geographical break? Ph.D. Thesis, University of Cape Town, Cape Town, South Africa, 2014. [Google Scholar]
- Johansson, U.S.; Fjeldså, J.; Lokugalappatti, L.G.S.; Bowie, R.C.K. A nuclear DNA phylogeny and proposed taxonomic revision of African greenbuls (Aves, Passeriformes, Pycnonotidae). Zool. Scripta 2007, 36, 417–427. [Google Scholar] [CrossRef]
- Lokugalappatti, L.G.S. Climatic Perturbations and Speciation of Southern and Eastern African Greenbuls (Passeriformes, Pycnonotidae). Ph.D. Thesis, Stellenbosch University, Stellenbosch, South Africa, 2011. [Google Scholar]
- Bowie, R.C.K.; Voelker, G.; Fjeldså, J.; Lens, L.; Hackett, S.J.; Crowe, T.M. Systematics of the Olive Thrush Turdus olivaceus species complex with reference to the taxonomic status of the endangered Taita Thrush, T. helleri. J. Avian Biol. 2005, 36, 391–404. [Google Scholar] [CrossRef]
- Voelker, G.; Rohwer, S.; Bowie, R.C.K.; Outlaw, D. Molecular systematics of a speciose, cosmopolitan songbird genus: Defining the limits of, and relationships among, the Turdus thrushes. Mol. Phylogenet. Evol 2007, 42, 422–434. [Google Scholar] [CrossRef]
- Dowsett-Lemaire, F.; Dowsett, R.J. The Birds of Malawi; Tauraco Press: Liege, Belgium, 2006. [Google Scholar]
- Dowsett, R.J.; Aspinwall, D.R.; Dowsett-Lemaire, F. The Birds of Zambia: An Atlas and Handbook; Tauraco Press: Liege, Belgium, 2008. [Google Scholar]
- Fjeldså, J.; Kiure, J.; Doggart, N.; Hansen, L.A.; Perkin, A. Distribution of highland forest birds across a potential dispersal barrier in the Eastern Arc Mountains of Tanzania. Steenstrupia 2010, 32, 1–43. [Google Scholar]
- Rovero, F.; Menegon, M.; Fjeldså, J.; Collett, L.; Doggart, N.; Leonard, C.; Norton, G.; Owen, N.; Perkin, A.; Spitale, D.; et al. Targetted vertebrate surveys enhance the faunal importance and improve explanatory models within the Eastern Arc Mountains of Kenya and Tanzania. Divers. Distrib. 2014, 20, 1438–1449. [Google Scholar] [CrossRef]
- Sullivan, B.L.; Wood, C.L.; Iliff, M.J.; Bonney, R.E.; Fink, D.; Kelling, S. eBird: A citizen-based bird observation network in the biological sciences. Biol. Conserv. 2009, 142, 2282–2292. [Google Scholar] [CrossRef]
- Bowie, R.C.K.; Fjeldså, J.; Kiure, J.; Kristensen, J. A new member of the greater double-collared sunbird complex (Passeriformes: Nectariniidae) from the Eastern Arc Mountains of Africa. Zootaxa 2016, 4175, 23–43. [Google Scholar] [CrossRef] [PubMed]
- Voelker, G.; Outlaw, R.K.; Reddy, S.; Tobler, M.; Bates, J.M.; Hackett, S.J.; Kahindo, C.; Marks, B.D.; Kerbis Peterhans, J.C.; Gnoske, T.P. A new species of boubou (Malaconotidae: Laniarius) from the Albertine Rift. Auk 2010, 127, 678–689. [Google Scholar] [CrossRef]
- Fjeldså, J.; Dinesen, L.; Davies, O.R.; Irestedt, M.; Krabbe, N.K.; Hansen, L.A.; Bowie, R.C.K. Description of two new Cisticola species endemic to the marshes of the Kilombero floodplain of southwestern Tanzania. Ibis 2021, 163, 1330–1354. [Google Scholar] [CrossRef]
- Lane, M.A.; Edwards, J.L. The Global Biodiversity Information Facility (GBIF). Biodivers. Databases 2007, 73, 1. [Google Scholar]
- Hansen, L.A.; Fjeldså, J.; Burgess, N.D.; Rahbek, C. One degree resolution databases of the distribution of 1789 resident birds in Sub-Saharan Africa. Online Data Source-Version 1.00; Zoological Museum, University of Copenhagen: Copenhagen, Denmark, 2007. [Google Scholar]
- Gill, F.; Donsker, D.; Rasmussen, P. IOC World Bird List (v12.1). 2022. Available online: https://www.worldbirdnames.org/ioc-lists/crossref/ (accessed on 1 July 2022).
- Dowsett-Lemaire, F. Ecological and territorial requirements of montane forest birds on the Nyika Plateau, south-central Africa. Gerfaut 1983, 73, 345–378. [Google Scholar]
- Fry, C.H.; Urban, E.K.; Keith, S.; Safford, R.; Hawkins, F. The Birds of Africa; Christopher Helm: London, UK, 1986–2004. [Google Scholar]
- Fuchs, J.; Bowie, R.C.K.; Fjeldså, J.; Pasquet, E. Phylogenetic relationships of the African bush-shrikes and helmet-shrikes (Passeriformes: Malaconotidae). Mol. Phylogenet. Evol. 2004, 33, 428–439. [Google Scholar] [CrossRef]
- Kimball, R.T.; Braun, E.L.; Barker, F.K.; Bowie, R.C.K.; Braun, M.J.; Chojnowski, J.L.; Hackett, S.J.; Han, K.-L.; Harshman, J.; Heimer-Torres, V.; et al. A well-tested set of primers to amplify regions spread across the avian genome. Mol. Phylogenet. Evol. 2009, 50, 654–660. [Google Scholar] [CrossRef]
- Voelker, G.; Outlaw, R.K.; Bowie, R.C.K. Pliocene forest dynamics as a primary driver of African bird speciation. Glob. Ecol. Biogeogr. 2010, 19, 111–121. [Google Scholar] [CrossRef]
- Katoh, K.; Standley, D.M. MAFFT Multiple sequence alignment software version 7: Improvements in performance and usability. Mol. Biol. Evol. 2013, 30, 772–780. [Google Scholar] [CrossRef] [PubMed]
- Stamatakis, A. RAxML version 8: A tool for phylogenetic analysis and post-analysis of large phylogenies. Bioinformatics 2014, 30, 1312–1313. [Google Scholar] [CrossRef] [PubMed]
- Miller, M.A.; Pfeiffer, W.; Schwartz, T. Creating the CIPRES science gateway for inference of large phylogenetic trees. In 2010 Gatewway Computing Environments Workshop (GCE); IEEE: New Orleans, LA, USA, 2010. [Google Scholar] [CrossRef]
- Oliveros, C.H.; Field, D.J.; Ksepka, D.T.; Barker, F.K.; Aleixo, A.; Anderson, M.J.; Hosner, P.A.; Joseph, L.; Mack, A.L.; Robbins, M.B. Earth history and the passerine superradiation. Proc. Nat. Acad. Sci. USA. 2019, 116, 7916–7925. [Google Scholar] [CrossRef]
- Bowie, R.C.K.; Fjeldså, J. Superfamily Passeroidea. In troduction and the early lineages. In The Largest Avian Radiation. The Evolution of Perching Birds, or the Order Passeriformes; Fjeldså, J., Christidis, L., Ericson, P.G.P., Eds.; Lynx: Barcelona, Spain, 2020; pp. 263–275. [Google Scholar]
- Hickerson, M.J.; Stahl, E.; Lessios, H.A. Test for simultaneous divergence using approximate Bayesian computation. Evolution 2006, 60, 2435–2453. [Google Scholar] [CrossRef]
- Hickerson, M.J.; Meyer, C.P. Testing comparative phylogeographic models of marine vicariance and dispersal using a hierarchical Bayesian approach. BMC Evol. Biol. 2008, 8, 322. [Google Scholar] [CrossRef]
- Hickerson, M.J.; Stahl, E.; Takebayashi, N. MSBAYES: Pipeline for testing comparative phylogeo-graphic histories using hierarchical approximate Bayesiancomputation. BMC Bioinform. 2007, 8, 268. [Google Scholar] [CrossRef]
- Huang, W.; Takebayashi, N.; Hickerson, M.J. MTML-msBayes: Approximate Bayesian comparative phylogeographic inference from multiple taxa and multiple loci with rate heterogeneity. BMC Bioinform. 2011, 12, 1. [Google Scholar] [CrossRef]
- Beaumont, M.A.; Zhang, W.; Blading, D.J. Approximate Bayesian computation in population genetics. Genetics 2002, 16, 2025–2035. [Google Scholar] [CrossRef]
- Breiman, L. Random Forests. Mach. Learn. 2001, 45, 5–32. [Google Scholar] [CrossRef]
- R Core Team. R: A Language and Environment for Statistical Computing. R Foundation for Statistical Computing: Vienna, Austria. Available online: https://www.R-project.org/ (accessed on 1 March 2022).
- Liaw, A.; Wiener, M. Classification and Regression by randomForest. R News 2002, 2, 18–22. [Google Scholar]
- Hijmans, R.J. Raster: Geographic Data Analysis and Modeling. R Package Version 3.3-7. 2020. Available online: https://CRAN.R-project.org/package=raster (accessed on 11 March 2022).
- Karger, D.N.; Conrad, O.; Böhner, J.; Kawohl, T.; Kreft, H.; Soria-Auza, R.W.; Zimmermann, N.E.; Linder, H.P.; Kessler, M. Climatologies at high resolution for the Earth land surface areas. Sci. Data. 2017, 4, 170122. [Google Scholar] [CrossRef] [PubMed]
- Karger, D.N.; Conrad, O.; Böhner, J.; Kawohl, T.; Kreft, H.; Soria-Auza, R.W.; Zimmermann, N.E.; Linder, H.P.; Kessler, M. Data from: Climatologies at High Resolution for the Earth’s Land Surface Areas, Dryad, Dataset; Dryad: Lewis, WA, USA, 2018. [Google Scholar] [CrossRef]
- EAMCEF. Eastern Arc Mountains GIS Data. 2020. Available online: http://www.easternarc.or.tz/downloads/ (accessed on 1 March 2022).
- Karger, D.N.; Nobis, M.P.; Normand, S.; Graham, C.H.; Zimmermann, N.E. CHELSA-TraCE21k v1. 0. Downscaled transient temperature and precipitation data since the last glacial maximum. Clim. Past Discuss. 2021, 19, 439–456. [Google Scholar] [CrossRef]
- Fjeldså, J.; Christidis, L.; Ericson, P.G.P. The Largest Avian Radiation. In The Evolution of Perching Birds, or the Order Passeriformes; Lynx: Barcelona, Spain, 2020. [Google Scholar]
- Jetz, W.; Thomas, G.H.; Joy, J.B.; Hartmann, K.; Mooers, A.O. The global diversity of birds in space and time. Nature 2012, 491, 444–448. [Google Scholar] [CrossRef]
- Stephens, M.; Smith, N.J.; Donnelly, P. A new statistical method for haplotype reconstruction from population data. Am. J. Hum. Genet. 2001, 68, 978–989. [Google Scholar] [CrossRef]
- Excoffier, L.; Laval, G.; Schneider, S. Arlequin (version 3.0): An integrated software package for population genetics data analysis. Evol. Bioinform. 2005, 1, 47–50. [Google Scholar] [CrossRef]
- Fu, Y.-X. Statistical tests of neutrality of mutations against population growth, hitchhicking, and background selection. Genetics 1997, 147, 915–925. [Google Scholar] [CrossRef]
- Watterson, G.A. On the number of segregating sites in genetical models without recombination. Theor. Popul. Biol. 1975, 7, 256–276. [Google Scholar] [CrossRef]
- Burgess, N.D.; Clarke, G.P. Coastal Forests of Eastern Africa; IUCN The World Conservation Union: Gland, Switzerland, 2000. [Google Scholar]
- Lovett, J.C. Climatic history and forest distribution in eastern Africa. In Biogeography & Ecology of the Rain Forests of Eastern Africa; Lovett, J.C., Wasser, S.K., Eds.; Cambridge Univ. Press: Cambridge, UK, 1993; pp. 23–29. [Google Scholar]
- Bowie, R.C.K.; Fjeldså, J. Genetic and morphological evidence for two species in the Udzungwa Forest Partridge Xenoperdix udzungwensis. J. East Afr. Nat. Hist. 2005, 94, 191–201. [Google Scholar] [CrossRef]
- Sepulchre, P.; Ramstein, G.; Fluteau, F.; Schuster, M.; Tiercelin, J.-J.; Brunet, M. Tectonic uplift and eastern Africa aridification. Science 2006, 313, 1419–1423. [Google Scholar] [CrossRef]
- Crowe, T.M.; Bowie, R.C.K.; Bloomer, P.; Mandiwana, T.; Hedderson, T.; Randi, E.; Pereira, S.L.; Wakeling, J. Phylogenetics and biogeography of, and character evolution in gamebirds (Aves: Galliformes): Effects of character exclusion, partitioning and missing data. Cladistics 2006, 22, 495–532. [Google Scholar] [CrossRef]
- Nicholson, S.E. The nature of rainfall variability over Africa on time scales of decades to millennia. Glob. Planet. Chang. 2000, 26, 137–158. [Google Scholar] [CrossRef]
- Lyons, R.P.; Scholz, C.A.; Cohen, A.S.; King, J.W.; Brown, E.T.; Ivory, S.J.; Johnson, T.C.; Deino, A.L.; Reinthal, P.N.; McGlue, M.M.; et al. Continuous 1.3-million-year record of East African hydroclimate, and implications for patterns of evolution and biodiversity. Proc. Natl. Acad. Sci. USA 2015, 112, 15568–15573. [Google Scholar] [CrossRef] [PubMed]
- Prell, W.I.; Hutson, W.H.; Williams, D.F.; Bé, A.W.H.; Geitzenauer, K.; Molfino, B. Surface circulation of the Indian Ocean during the Last Glacial Maximum, approximately 18.000 yr BP. Quat. Res. 1980, 14, 309–336. [Google Scholar] [CrossRef]
- Burney, C.W.; Brumfield, R.T. Ecology predicts levels of genetic differentiation in Neotropical birds. Am. Nat. 2009, 174, 358–368. [Google Scholar] [CrossRef] [PubMed]
- Flantua, S.G.A.; O’Dea, A.; Onstein, R.E.; Giraldo, C.; Hooghiemstra, H. The flickering connectivity system of the northern Andean páramos. J. Biogeogr. 2018, 46, 1808–1825. [Google Scholar] [CrossRef]
- Bell, R.C.; MacKenzie, J.B.; Hickerson, M.J.; Chavarría, K.L.; Cunningham, M.; Williams, S.; Moritz, C. Comparative multi-locus phylogeography confirms multiple vicariance events in co-distributed rainforest frogs. Proc. R. Soc. B Biol. Sci. 2012, 279, 991–999. [Google Scholar] [CrossRef] [PubMed]
- Carnaval, A.C.; Hickerson, M.J.; Haddad, C.F.B.; Rodrigues, M.T.; Moritz, C. Stability predicts genetic diversity in the Brazilian Atlantic forest hotspot. Science 2009, 323, 785–789. [Google Scholar] [CrossRef]
- Dolman, G.; Joseph, L. A species assemblage approach to comparative phylogeography of birds in southern Australia. Ecol. Evol. 2012, 2, 354–369. [Google Scholar] [CrossRef]
- Leaché, A.D.; Crews, S.C.; Hickerson, M.J. Two waves of diversification in mammals and reptiles of Baja California revealed by hierarchical Bayesian analysis. Biol. Lett. 2007, 3, 646–650. [Google Scholar] [CrossRef]
- Benkman, C.W.; Smith, J.W.; Keenan, P.C.; Parchman, T.L.; Santisteban, L. A new species of the Red Crossbill (Fringillidae: Loxia) from Idaho. Condor 2019, 111, 169–176. [Google Scholar] [CrossRef]
- Cheek, R.G.; Forester, B.R.; Salerno, P.E.; Trumbo, D.R.; Langin, K.M.; Chen, N.; Sillett, T.S.; Morrison, S.A.; Ghalambor, C.K.; Funk, W.C. Habitat-linked genetic variation supports microgeographic adaptive divergence in an islands-endemic bird species. Mol. Ecol. 2022, 31, 2830–2846. [Google Scholar] [CrossRef] [PubMed]
- Sorenson, M.D.; Sefc, K.M.; Payne, R.B. Speciation by host switch in brood parasitic indigobirds. Nature 2003, 424, 928–931. [Google Scholar] [CrossRef]
- Stanley, W.T.; Olson, E. Phylogeny, Phylogeography, and geographic variation of Sylvisorex howelli (Soricidae), an endemic shrew of the Eastern Arc Mountains, Tanzania. J. Zool. 2005, 266, 341–354. [Google Scholar] [CrossRef]
- Taylor, P.J.; Maree, S.; Van Sandwyk, J.; Kerbis Peterhans, J.C.; Stanley, W.T.; Verheyen, E.; Kaliba, P.; Verheyen, W.; Kaleme, P.; Nigel, C. Speciation mirrors geomorphology and palaeoclimatic history in African laminate-toothed rats (Muridae: Otomyini) of the Otomys denti and Otomys lacustris species-complexes in the ‘Montane Circle’ of East Africa. Biol. J. Linn. Soc. 2009, 96, 913–941. [Google Scholar] [CrossRef]
- Voelker, G.; Huntley, J.W.; Bryja, J.; Deny, C.; Ŝumbera, R.; Demos, T.; Lavrenchenko, L.; Nicolas, V.; Gnoske, T.; Peterhans, J.K. Molecular systematics and biogeographic history of the African climbing-mouse complex (Dendromus). Mol. Phylogenet. Syst. 2021, 161, 107166. [Google Scholar] [CrossRef]
- Blackburn, D.C.; Measey, G.J. Dispersal to or from an African biodiversity hotspot. Mol. Ecol. 2009, 9, 1904–1915. [Google Scholar] [CrossRef]
- Lawson, L.P. The discordance of diversification: Evolution in the tropical-montane frogs of the Eastern Arc Mountains of Tanzania. Mol. Ecol. 2010, 19, 4046–4060. [Google Scholar] [CrossRef]
- Tolley, K.A.; Tilbury, C.R.; Measey, G.J.; Menegon, M.; Branch, W.R.; Matthee, C.A. Ancient forest fragmentation or recent radiation? Testing refugial speciation models in chameleons within an African biodiversity hotspot. J. Biogeogr. 2011, 38, 1748–1760. [Google Scholar] [CrossRef]
- Voje, K.L.; Hemp, C.; Flagstad, Ø.; Sætre, G.-P.; Stenseth, N.C. Climate change as an engine for speciation in flightless Orthoptera inhabiting African mountains. Mol. Ecol. 2009, 18, 93–108. [Google Scholar]
- Moeller, M.; Cronk, Q. Phylogeny and disjunct distribution: Evolution of Saintpaulia (Gesneriaceae). Proc. R. Soc. B Biol. Sci. 1998, 264, 1827–1836. [Google Scholar] [CrossRef] [PubMed]
- Dimitrov, D.; Nogués-Bravo, D.; Scharff, N. Why do tropical mountains support exceptionally high biodiversity? The Eastern Arc Mountains and the drivers of Saintpaulina diversity. PLoS ONE 2012, 7, e48908. [Google Scholar] [CrossRef] [PubMed]
- Patton, J.L.; Smith, M.F. MTDNA phylogeny of Andean mice: A test of diversification across ecological gradients. Evolution 1992, 46, 174–183. [Google Scholar] [CrossRef]
- Caro, L.M.; Caycedo-Rosales, P.C.; Bowie, R.C.K.; Slabbekoorn, H.; Cadena, C.D. Ecological speciation along an elevational gradient in a tropical passerine bird? J. Evol. Biol. 2013, 26, 357–374. [Google Scholar] [CrossRef] [PubMed]
- Cadena, C.K.; Cespedes, L.N. Origin of elevational replacements in a clade of nearly flighless birds: Most diversity in tropical mountains accumulates via secondary contact following allopatric speciation. In Neotropical Speciation; Rull, V., Carnaval, A.C., Eds.; Springer: Berlin, Germany, 2020; pp. 635–639. [Google Scholar]
- Cadena, C.D.; Kozak, K.H.; Gómez, J.P.; Parra, J.L.; McCain, C.M.; Bowie, R.; Carnaval, A.; Moritz, C.; Rahbek, C.; Roberts, T.E.; et al. Latitude, elevational climatic zonation and speciation in New World vertebrates. Proc. R. Soc. B Biol. Sci. 2012, 279, 194–201. [Google Scholar] [CrossRef] [PubMed]
- Fjeldså, J.; Alström, P.; Bowie, R.C.K. How new species evolve. In The Evolution of Perching Birds, or the Order Passeriformes; Fjeldså, J., Christidis, L., Ericson, P.G.P., Eds.; Lynx: Barcelona, Spain, 2020. [Google Scholar]
- Freeman, B.G. Lower elevation animal species do not tend to be better competitors than their higher elevation relatives. Glob. Ecol. Biogeogr. 2020, 29, 171–181. [Google Scholar] [CrossRef]
- Vianna, J.A.; Fernandes, F.A.N.; Frugone, M.J.; Figueiró, H.; Pertierra, L.R.; Noll, D.; Bi, K.; Lowther, A.; Parker, P.; Wienecke, B.; et al. Genome-wide analyses reveal drivers of penguin diversification. Proc. Nat. Acad. Sci. USA 2020, 117, 22303–22310. [Google Scholar] [CrossRef]
- Robinson, J.A.; Bowie, R.C.K.; Dudchenko, O.; Lieberman, A.E.; Hendrickson, S.L.; Steiner, C.C.; Ryder, O.A.; Mindell, D.P.; Wall, J.D. Genome-wide diversity of the California Condor tracks its prehistoric abundance and decline. Curr. Biol. 2021, 31, 2939–2946. [Google Scholar] [CrossRef]
Disclaimer/Publisher’s Note: The statements, opinions and data contained in all publications are solely those of the individual author(s) and contributor(s) and not of MDPI and/or the editor(s). MDPI and/or the editor(s) disclaim responsibility for any injury to people or property resulting from any ideas, methods, instructions or products referred to in the content. |
© 2023 by the authors. Licensee MDPI, Basel, Switzerland. This article is an open access article distributed under the terms and conditions of the Creative Commons Attribution (CC BY) license (https://creativecommons.org/licenses/by/4.0/).

