Article

Assessment of the Diversity, Distinctiveness and Conservation of Australia’s Central Queensland Coastal Rainforests Using DNA Barcoding

1
School of Science, Technology and Engineering, University of the Sunshine Coast, Sippy Downs 4556, Australia
2
Queensland Herbarium, Mount Coot-Tha Rd., Toowong 4066, Australia
*
Authors to whom correspondence should be addressed.
Diversity 2023, 15(3), 378; https://doi.org/10.3390/d15030378
Submission received: 19 January 2023 / Revised: 20 February 2023 / Accepted: 21 February 2023 / Published: 6 March 2023
(This article belongs to the Special Issue Diversity in 2022)

Abstract

:
Globally threatened dry rainforests are poorly studied and conserved when compared to mesic rainforests. Investigations of dry rainforest communities within Australia are no exception. We assessed the community diversity, distinctiveness and level of conservation in Central Queensland coastal dry rainforest communities. Our three-marker DNA barcode-based phylogeny, based on rainforest species from the Central Queensland Coast, was combined with the phylogeny from Southeast Queensland. The phylogenetic tree and Central Queensland Coast (CQC) community species lists were used to evaluate phylogenetic diversity (PD) estimates and species composition to pinpoint regions of significant rainforest biodiversity. We evaluated the patterns and relationships between rainforest communities of the biogeographical areas of Central Queensland Coast and Southeast Queensland, and within and between Subregions. Subsequently, we identified areas of the highest distinctiveness and diversity in phylogenetically even rainforest communities, consistent with refugia, and areas significantly more related than random, consistent with expansion into disturbed or harsher areas. We found clear patterns of phylogenetic clustering that suggest that selection pressures for moisture and geology were strong drivers of rainforest distribution and species diversity. These results showed that smaller dry rainforests in Central Queensland Coast (CQC) represented areas of regional plant migration but were inadequately protected. To sustain species diversity and distribution under intense selection pressures of moisture availability and substrate type throughout this dry and geologically complex region, the future conservation of smaller patches is essential.

1. Introduction

Rainforests worldwide are considered to differ considerably in composition along latitudinal and altitudinal gradients, with floristic composition and structure becoming simpler with increasing latitude and altitude [1,2,3]. Seasonality also has been correlated with the distribution of drier rainforest habitats in the mid-latitudes [4,5]. Dry rainforest types are poorly studied, fragmented and threatened by anthropogenic and environmental pressures worldwide [2,6]. They experience low mean annual rainfall and typically contain deciduous species [7,8]. Examples from Costa Rica, New Caledonia, and islands throughout the Pacific retain less than 2% of their preclearing habitat, and in Madagascar, only 10% of the littoral forests remain, with limited or no conserved extent within protected areas [9,10,11,12]. Predicted increases in global temperatures, rainfall variability, fire and the frequency of severe weather events could lead to a decline in rainforest habitats [11,13,14]. Threats to rainforest communities worldwide include fire, invasive species, environmental degradation, fragmentation and climate change [15,16,17]. Environmental degradation and fragmentation threaten biodiversity through edge effects, loss of genetic diversity and isolation of habitat patches, resulting in less resilience to climatic and environmental changes [18,19,20]. The migration of species sensitive to dispersal limitations can be affected by a deficit of nearby suitable habitats, which can lead to the extinction of species [14,19,21]. Rapid increases in temperature, fluctuation in precipitation patterns and increased occurrence of severe weather events associated with climate change have the potential to further contract and shift climatically suitable habitats of currently highly fragmented tropical and subtropical rainforest communities in Australia [13,14,22,23,24].
Australian rainforests contain a high proportion of the continent’s terrestrial biodiversity and are thought to have been reduced from a continental scale to occupy less than 1% of the continent’s total surface area along the east coast, due to increasing aridification during the Miocene and climatic oscillations from ~2.6 ma to the Last Glacial Maximum (LGM) in the late Quaternary (24–18 ka) [25,26,27,28]. Australian flora are considered to have developed in isolation from ca. 32 ma, following the separation from the Gondwanan supercontinent until the Australian plate (Sahul shelf) collided with the Southeast Asian region (Sunda shelf) in the Miocene ca. 20 ma [4,29,30]. However, studies indicate Australia shares many plant families, including Araucariaceae, Nothofagaceae and Proteaceae, with other major regions of Gondwana; New Zealand, Patagonia and Antarctica [31,32]. Crayn et al. [30] found evidence of an asymmetrical floristic exchange between the Australasian continental landmasses of Sahul and Sunda, with eastward migration into Sahul. Within Queensland, phylogenetically distinct tropical migratory taxa have been found in subtropical rainforest types [33,34]. In the Queensland coastal region, dry and littoral rainforest (beach scrub) types are found situated between tropical and subtropical rainforest regions, but little is known about community species distributions in these ecosystems. We hypothesise that the Central Queensland Coast rainforests may be a region of overlap between tropical and southern rainforests and contain taxa of varying lineages. We expect to discover evidence of plant movement through the region.
The distribution of rainforest types has been found to be highly complex and considered to be dependent on multiple factors [5,15]. Geology [16], topography, habitat loss [17] and climate change [18,19,20] have been linked to biodiversity levels and distribution within landscapes. The heterogeneity of forest patches created by moisture and topography, together with plant life strategies and dispersal modes, determine the species present [21,22,23,24]. The Australian landscape has been classified into broad-scale biogeographical bioregions and further refined into Subregions based on finer-scale commonalities of geology and landform and broad vegetation types [35,36]. Queensland Subregions have been subdivided into Regional Ecosystems (RE), which are vegetation communities within a Subregion consistently associated with a particular geology, landform and soil type [36]. The highly complex geological history of Central Queensland Coast, shaped during multiple periods of the formation of eastern Australia dating as far back as 590 mya, combined with a broad climatic variation, provides the foundation for a highly diverse landscape [37,38]. However, the location of phylogenetically diverse and distinctive rainforests regarding the geological substrate in the Central Queensland Coast region has yet to be determined.
Australia has exceeded the target of the protection 17% of its terrestrial biodiversity in the National Reserve System as part of its obligations under the United Nations Convention on Biological Diversity, but it is not evenly distributed across all habitat types [39]. A recent study by Shapcott et al. [40] found that the distinctive rainforest Regional Ecosystem (RE) types in Southeast Queensland were not well conserved. Protected area management strategies of fragmented landscapes have been informed by hypotheses such as Island Biogeography Theory, which proposes that low species richness is related to isolation [41]. To combat patch isolation, the Australian government has initiated the “Connectivity Conservation of Australian landscapes” strategy focused on the uplands of the “Great Eastern Ranges” from Atherton in Far North Queensland to the Victorian Alps [42,43]. Additionally, state governments have introduced connectivity frameworks to connect inland, uplands and coastal landscapes [42,44]. However, the degree of isolation or connectivity of Central Queensland coastal rainforest patches is largely unknown.
Due to threats to rainforests and loss of habitat, an extensive decline in evolutionary phylogenetic diversity of plant lineages has been predicted [45,46,47]. Phylogenetic diversity (PD) is a measure of biodiversity that incorporates evolutionary relationships among taxa as well as species richness [48]. The phylogenetic diversity (PD) quantitative measure has been defined as the sum of all phylogenetic branch lengths separating a given set of taxa in a community [48], and together with related metrics, has become a standard method for quantifying biodiversity that incorporates phylogenetic distinctiveness. DNA barcoding allows for the rapid estimation of species richness and the construction of highly resolved phylogenies to inform community dynamics [33,49]. The use of plant DNA barcode libraries has been shown to enable standardised methods of estimating phylogenetic diversity (PD) within a community in the rainforests of Puerto Rico and more recently, Fraser Island, Queensland [34,50]. This approach allows for the maximum conservation of greater evolutionary potential and biological variation [33,51,52,53]. The most recent CBD Strategic Plan proposed that parties support the development of DNA barcode reference libraries and promote their application for conservation (https://www.cbd.int/sp, accessed on 9 September 2021).
Community phylogenetic diversity (PD) studies on rainforests have found patterns of both phylogenetic evenness and clustering [33,34,54,55]. Phylogenetic clustering, taxa that are more related than random, is thought to result from dispersal limitations or habitat specialisation [54,56,57], while patterns of phylogenetic evenness have been found in older more stable habitats of distantly related species, which may indicate refugia [34,40,54,55]. Glacial and interglacial climatic refugia have been documented to contain rare taxa or genotypes, or endemic species, and are critically important for the recolonisation of surrounding landscapes [34,55,58,59]. It is predicted that climatic refugia may be threatened by rapid increases in temperature due to climate change [60]. Therefore, detecting climatic refugia in the highly fragmented Central Queensland Coast (CQC) region is critical for the long-term conservation of rainforest taxa.
The Central Queensland Coast (CQC) rainforest estate is a highly fragmented mosaic of mixed rainforest types interspersed by agricultural and developed land. It is threatened by urban development, grazing, agriculture and climate change, with less than 30% of remnant vegetation remaining [15,16]. The study region extends 630 km from Rockhampton to Paluma Range and up to 85 km inland, spanning four Bioregions; southern Wet Tropics (WT), Central Mackay Coast (CMC) and the coastal sections of Brigalow Belt North (BBN) and Brigalow Belt South (BBS), and includes the Whitsunday Islands and continental islands of the Great Barrier Reef [38]. Studies on the dry rainforests of the Central Queensland Coast (CQC) region have typically been limited to government reports or have been the focus of faunal studies [61,62,63], and yet plant species play an important role in determining the distribution of animals [64]. Rainforest types of the Central Queensland Coast are highly variable and include moist tropical and subtropical and dry tropical and subtropical deciduous and semi-evergreen microphyll vine thickets and may represent an interface between tropical and subtropical rainforest types [5]. These ecosystems are likely to be significantly impacted by climate change, as species’ suitable habitats contract and shift due to predicted increased temperatures, rainfall variability and frequency of severe weather events such as cyclones [65]. The location of the most diverse and distinctive of these vulnerable communities has been poorly studied and will be essential to set conservation priorities for future land management initiatives.
Therefore, this research will investigate the diversity of rainforest plants (excluding epiphytic orchids and ferns) found in coastal areas of Central Queensland to assess species relatedness and make a significant contribution to the documentation and assessment of rainforest plant biodiversity in this important part of the Australian rainforest estate by answering the following questions:
  • How does the Central Queensland Coast (CQC) rainforest estate compare in terms of composition, diversity and uniqueness to other rainforest communities?
  • What is the distribution of rainforest phylogenetic diversity and distinctiveness within the Central Queensland Coast (CQC) rainforest estate?
  • What factors are driving differences or similarities between rainforest communities within the study area?
  • Is there evidence of an overlap region or coastal corridor that may facilitate species movement in a changing climate?
  • How well protected are phylogenetically diverse Central Queensland Coast (CQC) rainforests?

2. Materials and Methods

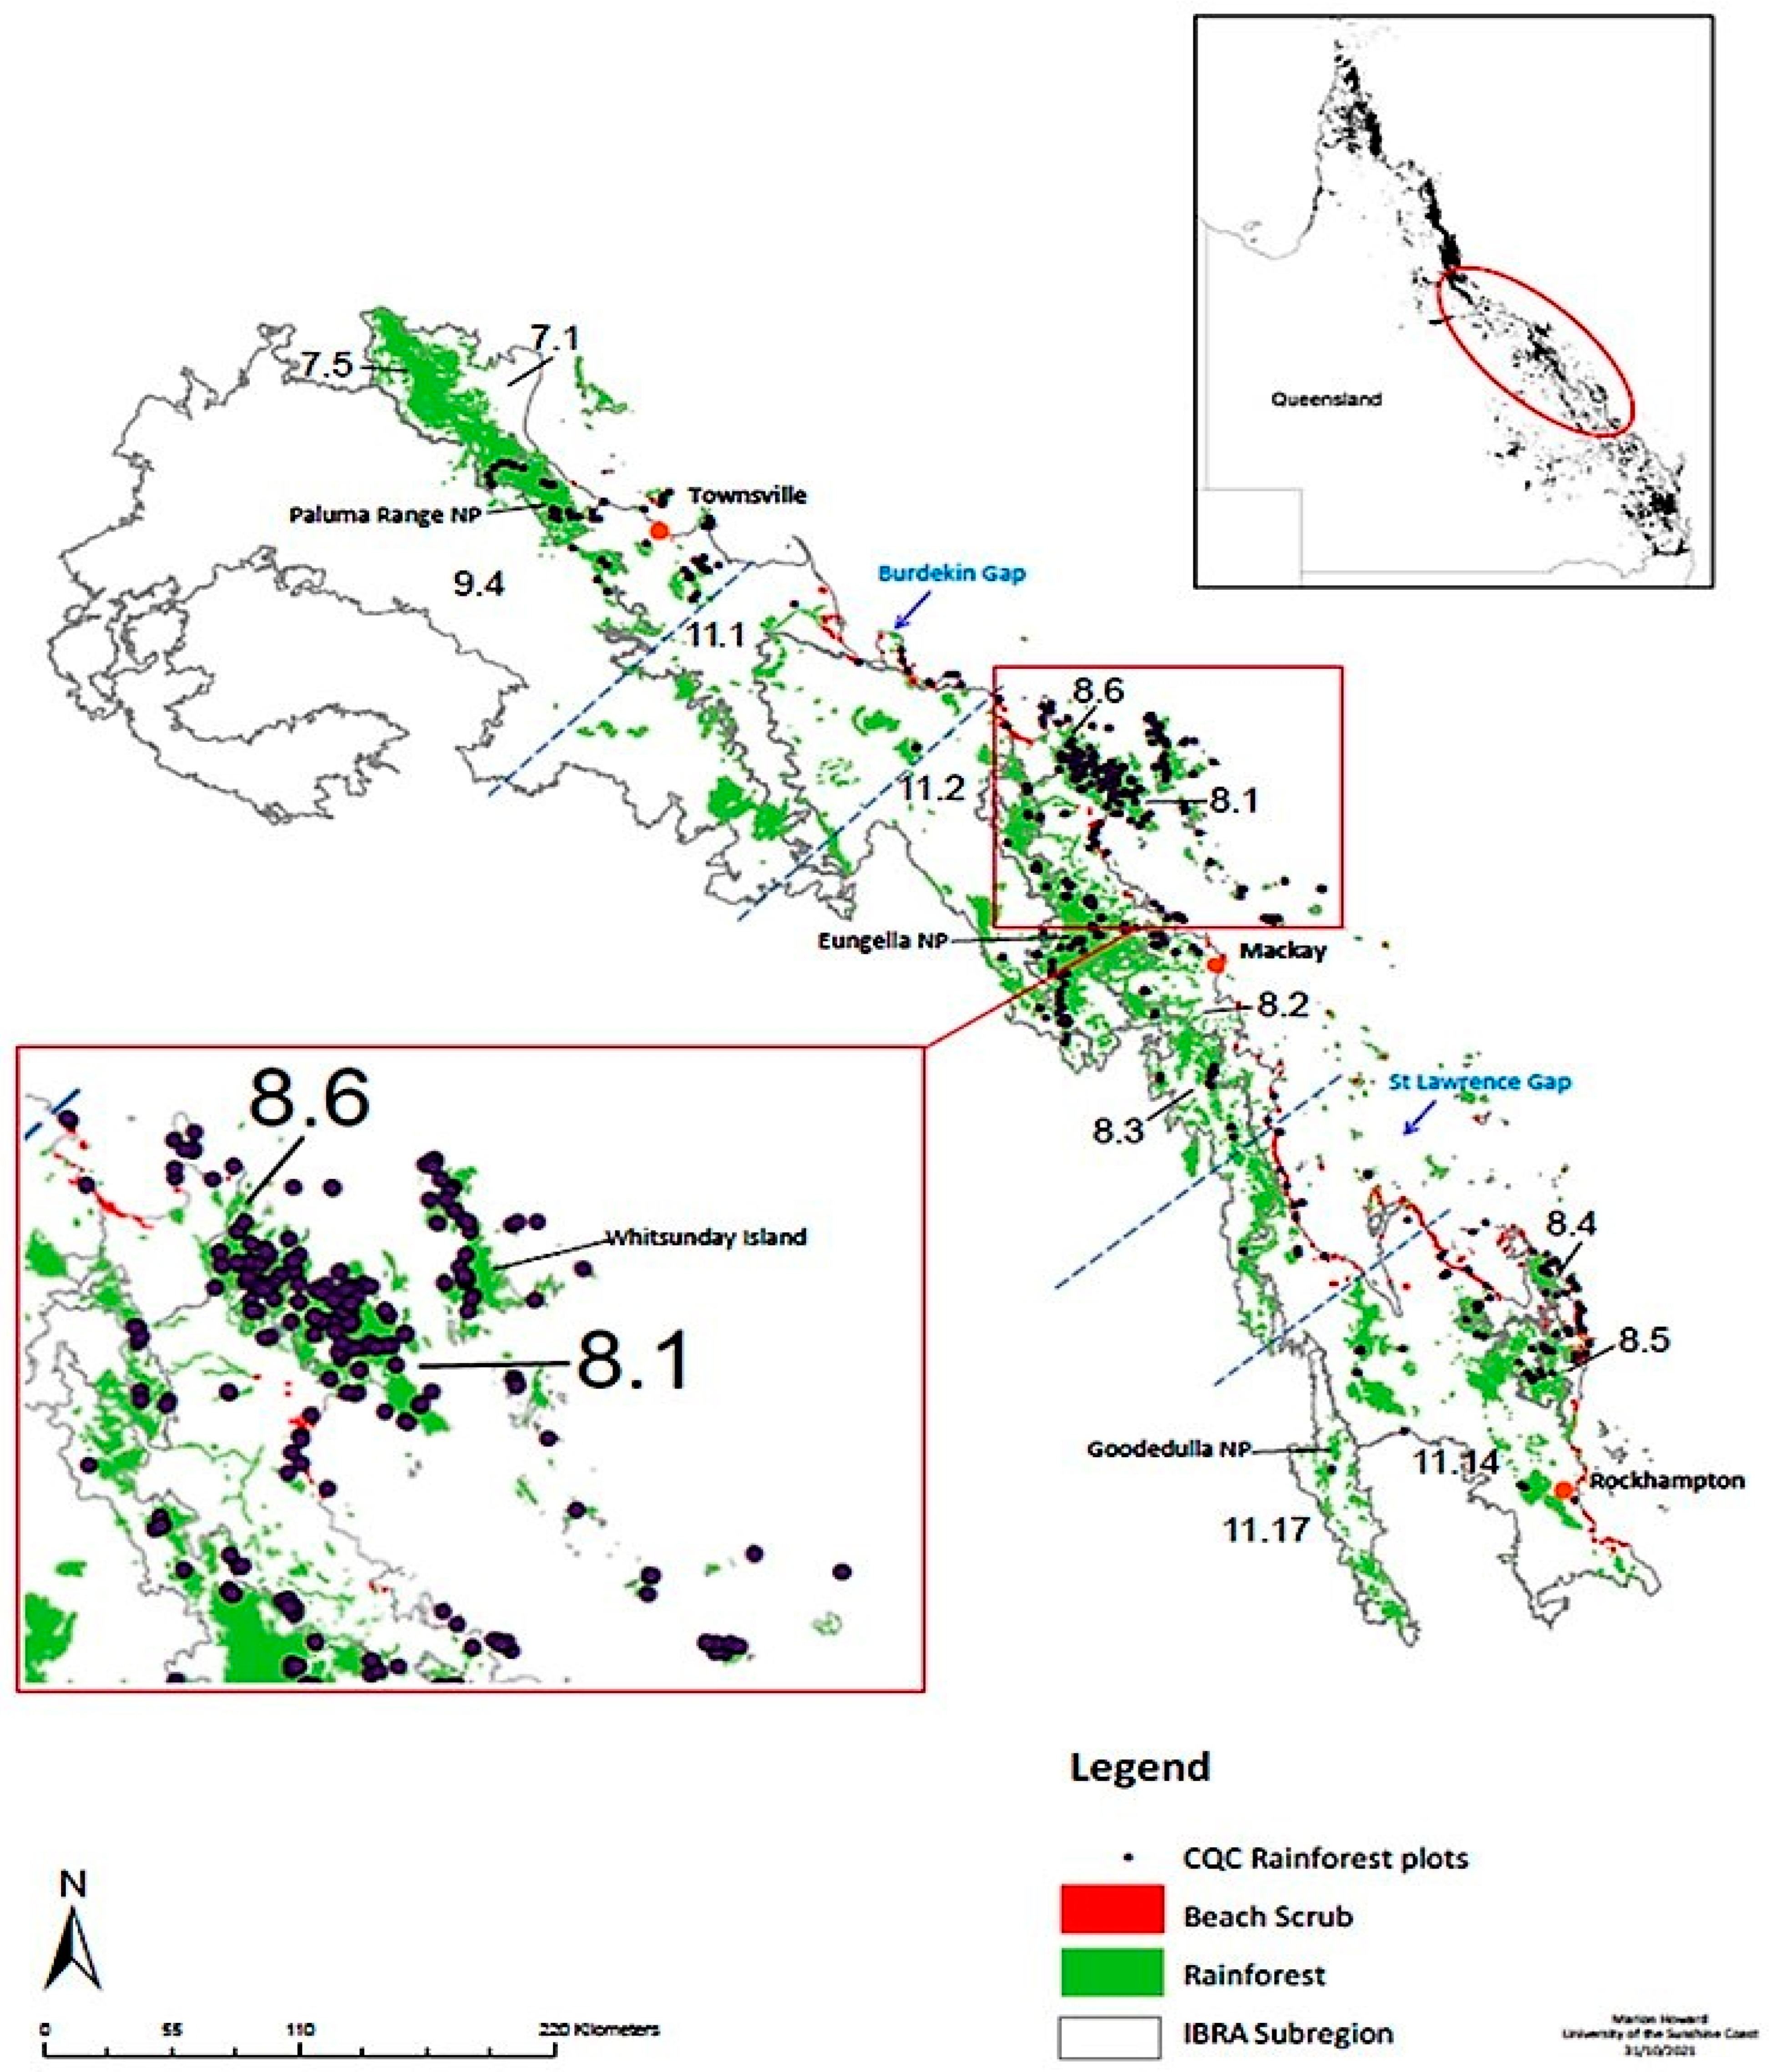
2.1. Sample Collection

We used Herbarium databases to compile a list of 982 rainforest plants from the Central Queensland Coast (CQC) that were georeferenced and targeted from known areas of diversity and distinctiveness. We aimed to comprehensively sample rainforest plant species across all rainforest Regional Ecosystem (RE) types and include broad landscape groupings across the study area to expand the existing DNA barcode library in order to create the DNA barcode reference library used to make phylogenetic diversity (PD) estimates. Of these, 463 species had previously been DNA barcoded by Shapcott et al. [33] and Howard et al. [34]; however, possible duplicate collections were made in an endeavour to achieve the most complete reference library achievable. Botanists from Queensland Herbarium (BRI), Australian Tropical Herbarium (CNS), James Cook University and the Gladstone and Mackay Botanic Gardens assisted with the collection, particularly of rare or difficult-to-collect species and provided plant ID confirmation. Some samples were collected in Southeast and North Queensland of species known from the Central Queensland Coast (CQC). Field permits (PTC18-001101, PTU18-001099) were issued by the Queensland Government Department of Environment and Heritage Protection.

2.2. Construction of the Extended DNA Barcode Library and CQC Barcoded Library

Samples of at least one herbarium voucher specimen and one DNA voucher preserved in silica gel [66] were collected from more than 160 sites and submitted to the Queensland Herbarium (BRI) following the methods of our previous studies [33,34]. Duplicate DNA vouchers were lodged at the University of the Sunshine Coast (UniSC). DNA was extracted from dried leaf tissue for each specimen using the methods of Shapcott et al. [33]. In order to build on our existing DNA barcode reference library, we used the same three recognised DNA barcode plastid markers, matK, rbcL and trnH-psbA, for each sample, using laboratory methods consistent with our previous studies [33,34]. PCR products were purified to remove unused primers (Table A1) and nucleotides using ExoSAP-IT® (USB®). For each sample, forward and reverse cycle sequencing reactions were performed using BigDye® (Applied Biosystems, Thermo Fisher Scientific Inc, Tullamarine, Australia 2010), and the final product was purified by spinning through a Sephadex column and then completely dehydrating it. Sanger sequencing was performed on an ABI 3500 Genetic Analyser. A total of 3456 sequences, including repeats for some samples, were generated for 576 samples.
We DNA barcoded 192 newly collected species from the Central Queensland Coast (CQC) region, 53 of which were new georeferenced locations for Queensland rainforest plants. The new species data were added to the Queensland Herbarium occurrence dataset (Herbrecs; https://www.gbif.org/, accessed on 22 February 2018). We added 507 species with at least one marker barcoded at the UniSC laboratories [34] for the Central Queensland barcoded phylogeny. These were combined with the updated Southeast Queensland species [33] for a total of 1062 barcoded species, to obtain the best phylogenetic relationships. To obtain the most complete phylogeny possible for Central Queensland coastal rainforest plants, our barcoded sequences were supplemented with 146 species entirely sourced from GenBank (https://www.ncbi.nlm.nih.gov/genbank/, accessed on 1 March 2018) and BOLD (https://www.boldsystems.org/, accessed on 7 August 2019), and some provided by the Australian Tropical Herbarium laboratories. The final dated tree comprised of 1208 species found in Central and Southeast Queensland rainforest communities (CSEQ, Table 1, Table S1).

2.3. Queensland Rainforest Phylogeny

Sequence outputs were edited in Geneious v7.1.9 (Biomatters, Auckland, New Zealand) (https://www.geneious.com, accessed on 3 September 2014), and contigs made from forward and reverse sequences and were edited for quality and accuracy, consistent with work previously undertaken at UniSC [33,34]. Only the highest-quality sequences of at least 300 bp with a HQ% of 60% or above were included in the final set of sequences for each of the three markers. Central Queensland Coast (CQC) contigs consisting of 325 rbcL, 201 matK and 212 psbA-trnH were added to the set of Southeast Queensland (SEQ) sequences and realigned to correct, re-analyse or remove incompatible samples to form an updated and revised combined dataset to facilitate the comparisons between these regions. Consensus alignments were performed for rbcL with the ClustalW program [67] and the MUSCLE [68] program for matK. Consensus alignment for trnH-psbA was created using the SATé [69] program, which uses the external tools MAFFT aligner [70], MUSCLE [68] and tree estimator FASTTREE programs [71]. Preliminary phylogenetic trees were generated in Geneious v 10.2.6 (https://www.geneious.com) using the Geneious Tree Builder option, for the nucleotide sequences of all species for each marker to check for obvious errors and sequence quality. Erroneous samples were corrected, re-analysed or removed from the analysis. The sequences for each marker for each species were then concatenated to form the 3-gene barcode alignment, which was created for most species. Where gaps existed, verified sequences of at least 300 bp were sourced from GenBank (https://www.ncbi.nlm.nih.gov/genbank/) and BOLD (https://www.boldsystems.org/) public databases. The final tree was then constructed from one representative per species, each with 2–3 barcode markers, of a total of 866 species out of 982 (88%) from the original list.
A constraint tree for phylogenetic analysis was generated using the updated list of rainforest taxa successfully barcoded from the CQC in the Phylomatic (v3) program [72], which applies the Angiosperm Phylogeny Group III base tree [73] and the R20120829 phylomatic tree for plants (http://phylodiversity.net/phylomatic/, accessed on 3 July 2020). The terminal branches of the output tree generated were then collapsed to the level of family to form a polytomy using the program Mesquite [74] (http://www.mesquiteproject.org, accessed on 20 October 2020). This constraint tree implemented taxonomic relationships at the level of order and family and allowed for inference of relationships based on the aligned nucleotide sequences below the family level.
The constraint tree, 3-gene alignment and rbcL, matK and trnH-psbA data partition file was then uploaded to the CIPRES Science Gateway V.3.3 [75] (http://www.phylo.org) to generate a phylogenetic tree using RAxML-HP2 on XSEDE, which included branch lengths [76]. The final best tree output was uploaded to the PATHd8 program [77], which dated the tree by assigning the age of major branch nodes representing major angiosperm evolution derived from fossil data [78]. Phylogenetic reconstruction was consistent with methods outlined by Shapcott et al. [33] and Howard et al. [34]. The final dated tree was used for phylogenetic diversity (PD) estimations.

2.4. Rainforest Subregion and Regional Ecosystem (RE) Designation

The Queensland Herbarium databases and Regional Ecosystem (RE) mapping [79] were used to identify the set of rainforest ecosystem Regional Ecosystems (RE) within the Central Queensland study area for analysis. For each Regional Ecosystem (RE) type, two forms of species datasets were collated. The first were the plot-based species list data collected from 297 fixed-area plots (0.1 ha; W.J.F. McDonald, personal data) and 201 plot-based lists from the Herbarium CORVEG database, for which Subregion and RE type had been assigned. These plots contained 870 Central Queensland Coast (CQC) and an updated dataset of 759 Southeast Queensland (SEQ) rainforest plant species (excluding epiphytic orchids and ferns). Secondly, to create the most comprehensive dataset of Central Queensland coastal rainforest plants, a supplementary species list was compiled from the Queensland Herbarium (BRI) occurrence dataset (Herbrecs; https://www.gbif.org/, accessed on 22 February 2018) of rainforest plants following the methods of Shapcott et al. [40]. Only most recent records with GPS coordinates, sampled and registered by Queensland Herbarium (BRI) botanists, were used.
Species lists were compiled from the Herbrecs database (https://www.gbif.org/, accessed on 22 February 2018) for collection sites from 30 islands of the Whitsunday Subregion and continental islands. These were treated as plots due to their small size (Figure 1). Subregion and Regional Ecosystem (RE) data were assigned to a the Herbrecs pooled species lists by an overlay with Regional Ecosystem (RE) mapping data [79] in ArcGIS v10.7.1 [80]. If more than one type of rainforest Regional Ecosystem (RE) type was present in a polygon, our list of species for that polygon was compared to the Regional Ecosystem Description Database (REDD) v11.1 (https://www.qld.gov.au/environment/plants-animals/plants/ecosystems/descriptions, accessed on 6 July 2020) [81] species community descriptions to assign Regional Ecosystem (RE) type for those records.

2.5. Abiotic Data

To investigate differences between rainforest communities, climate data were obtained from the WorldClim v2 database at a spatial resolution of 30 s [82] (~1 km2; https://www.worldclim.org/data/bioclim.html, accessed on 16 March 2021) and were used to calculate the average annual rainfall (mm) for each of the Subregions of the Central Queensland Coast (CQC) study area. Elevation data were compiled from Herbarium databases [81] and the WorldClim database [82] (https://www.worldclim.org/data/bioclim.html, accessed on 16 March 2021), and georeferenced location data were used to supplement estimates in Google Earth Pro (2021) where needed. Detailed surface geological data were sourced from Queensland Spatial Catalogue—Qspatial (2018; https://www.business.qld.gov.au/industries/mining-energy-water/resources/geoscience-information/gsq, accessed on 7 August 2021).

2.6. Phylogenetic Analysis

The dated phylogenetic tree and both pooled and plot-based rainforest community files were used to calculate phylogenetic diversity (PD) [48], species richness (SR), the mean pairwise distance (MPD) and mean nearest taxon distance (MNTD) [56] using PICANTE v1.8.2 package in RStudio [83]. PICANTE calculates standardised effect size (SES) values by generating z values and probabilities. The SES values were transformed (multiplying by −1) to determine the net relatedness index (NRI) and the nearest taxon index (NTI) [56,83], allowing comparison with other studies. The NRI/NTI (SES) scores that deviated significantly from random (p < 0.05) were identified. Significant positive NRI scores indicate phylogenetic clustering, whereas negative NRI scores indicate phylogenetic evenness of the taxa within a community, whereas significant nearest taxon index (NTI) scores are indicative of the distinctiveness of taxa within a community [56].
To investigate patterns and relatedness of species composition dissimilarity among the plot-based communities, pairwise dissimilarity matrices were calculated based on species presence/absence data. An unweighted Unifrac dissimilarity matrix among plots was calculated based on phylogenetic diversity (PD) [84]. Bray–Curtis rank order matrices were used to create nonmetric multidimensional scaling (NMDS) and dendrograms in the Vegan package v2.5-7 [85] (https://cran.r-project.org/src/contrib/Archive/vegan/, accessed on 20 July 2020), to explore patterns of distinctiveness in species composition between IBRA Subregions.
Multivariate correlations between pairwise dissimilarity matrices of plot data were tested with Mantel test in the Ape package v5.5 [86]. A one-way ANOVA or nonparametric Kruskal–Wallis test with the Dunn–Bonferroni post hoc method was used to determine if there were statistically significant differences among plots based on geology, dominant rock types and phylogenetic diversity (PD), phylogenetic diversity (PD) metrics, species richness (SR) and family richness (FR) in the statistical package (https://www.r-project.org/) and PMCNR packages (http://CRAN.R-project.org/package=PMCMR, accessed on 20 July 2020) [87] in RStudio [83]. To visualise patterns of phylogenetic evenness and clustering (NRI), Central Queensland Coast (CQC) plots were mapped in ArcGIS v10.7.1 [80] relative to rainforest patch. Rainforest distribution layers of Queensland were obtained from Qspatial (https://qldspatial.information.qld.gov.au/, accessed on 29 August 2021). The Interactive Tree of Life online tool [88] (iTOL v5; https://itol.embl.de/) was used to plot the final dated RAxML tree to illustrate phylogenetic patterns within and between communities.

2.7. Investigation of a Corridor or Region of Overlap

The pooled rainforest species data were grouped according to presence/absence within five groups of the Burdekin Gap, St. Lawrence Gap and regions north, central and south of the dry barriers to examine the latitudinal distribution and diversity of rainforest plant taxa to investigate potential movement of species along the Central Queensland Coast (CQC) region (Figure 1). Phylogenetic diversity (PD), phylogenetic diversity (PD) metrics, species richness (SR), genus richness (GR) and family richness (FR) were calculated for each geographical grouping. Phylogenetic patterns were analysed using a Bray–Curtis dissimilarity matrix of pooled species presence/absence to create nonmetric multidimensional scaling (NMDS) and cluster dendrogram based on species composition of the groupings. The species of individual geographic groupings were visualised in the iTOL, v5 [88].

2.8. Central Queensland Coast (CQC) Rainforest Protected Area Estate

To assess the level of protection of the Central Queensland Coast (CQC) rainforest estate, we used the publicly available Queensland government’s analysis of Regional Ecosystems (RE) by Subregion data (https://www.publications.qld.gov.au/dataset/, accessed on 16 July 2021), which contains estimates of preclearing, remnant vegetation and land tenure for each Regional Ecosystem (RE) type in Queensland. We calculated the area of extent and percent of preclearing and remnant rainforest for each Subregion, based on pooled species location data and Regional Ecosystem based on plot species data. A z-test was applied to each of the preclearing and remnant rainforest vegetation categories to determine if the level of protection was significantly higher or lower than the average within the whole region.

3. Results

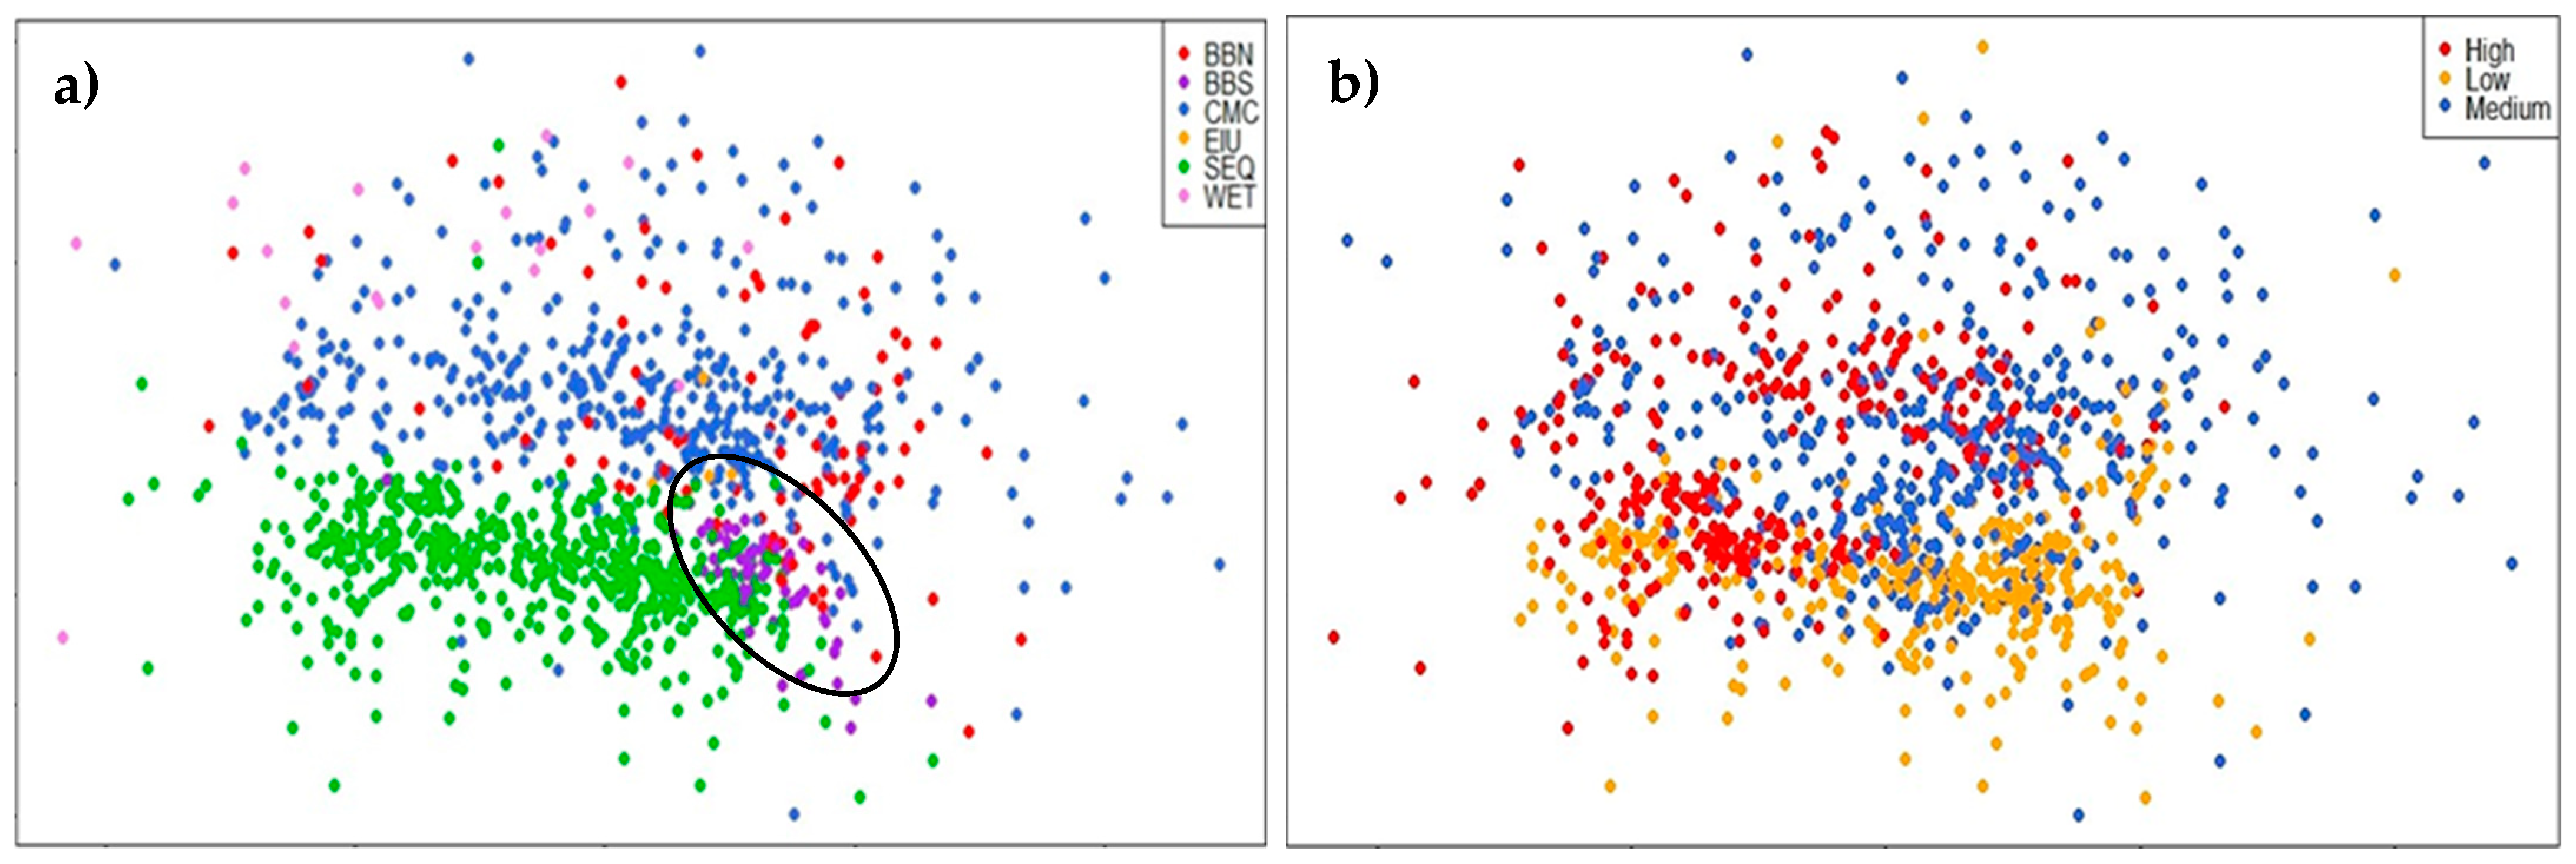
3.1. Comparison of Central and Southeast Queensland (CSEQ) Rainforest Communities

The comparison of Central and Southeast Queensland (CSEQ) plot-based rainforest communities was made possible by the combined total 1117 plots from both regions, which contained 870 Central Queensland Coast (CQC) and an updated dataset of 759 Southeast Queensland (SEQ) rainforest plant species (excluding epiphytic orchids and ferns). Broad comparisons of Subregions in terms of composition, phylogenetic diversity (PD) and uniqueness were made using the Central and Southeast Queensland (CSEQ) phylogeny. Of the 140 families represented in this study, 103 were common to both regions (Table 1). The phylogenetic diversity (PD) for the total CQC community was higher than expected (p < 0.05) while for the Southeast Queensland (SEQ) community, PD was lower than expected due to chance (p < 0.05; Table 1). The Central Queensland Coast (CQC) region was more family-rich than the Southeast Queensland (SEQ) community, but six families were distinctive to each region (Table 1). Central Queensland Coast (CQC) taxa from families distinctive to the region were found in the north of Australia and in New Guinea, Malesia and Melanesia, such as the family Maesaceae (Table 1). In comparison, those families distinctive to Southeast Queensland (SEQ) and southern Australia included the Gondwanan relictual family of Nothofagaceae. These results suggest more tropical families from the Sunda region are present in the Central Queensland Coast (CQC) region, whereas some Southeast Queensland (SEQ) families are of more southern or Gondwanan lineages.
Species of the order Poales have been recorded in both regions, but as many grass species tend be less shade-tolerant, the results indicate they were more abundant in open dry rainforests of Central Queensland Coast (CQC) than the more mesic Southeast Queensland rainforests (SEQ; Figure 2). Relationships among plots, when categorised by Bioregion, show distinct groupings of species from the Southeast Queensland (SEQ) and Central Mackay Coast (CMC), but indicate they are more closely related to each other compared to the WET or BBN and BBS Bioregions (Figure 3a). Southeast Queensland (SEQ) and Brigalow Belt South (BBS) Bioregion taxa group more closely, while the Brigalow Belt North (BBN) taxa are more closely associated with the CMC Bioregion (Figure 3a). The species composition of coastal vine thickets (beach scrubs) from Central Queensland Coast (CQC) and Southeast Queensland (SEQ) were distinct from each other (Figure 3e).
The analysis of Subregions found that Herbert (7.1), Byfield (8.4) and Manifold (8.5) of the Central Queensland Coast (CQC) region, and Sunshine Coast–Gold Coast Lowlands (12.4) and Great Sandy (12.9) of the Southeast Queensland (SEQ) region contained taxa that were significantly more evenly dispersed at higher taxonomic levels than random (NRI; p < 0.05; Table 2). Subregions of the Brigalow Belt South (BBS) Bioregion were significantly more closely related (clustered) than random (NRI, p < 0.05; Table 2).

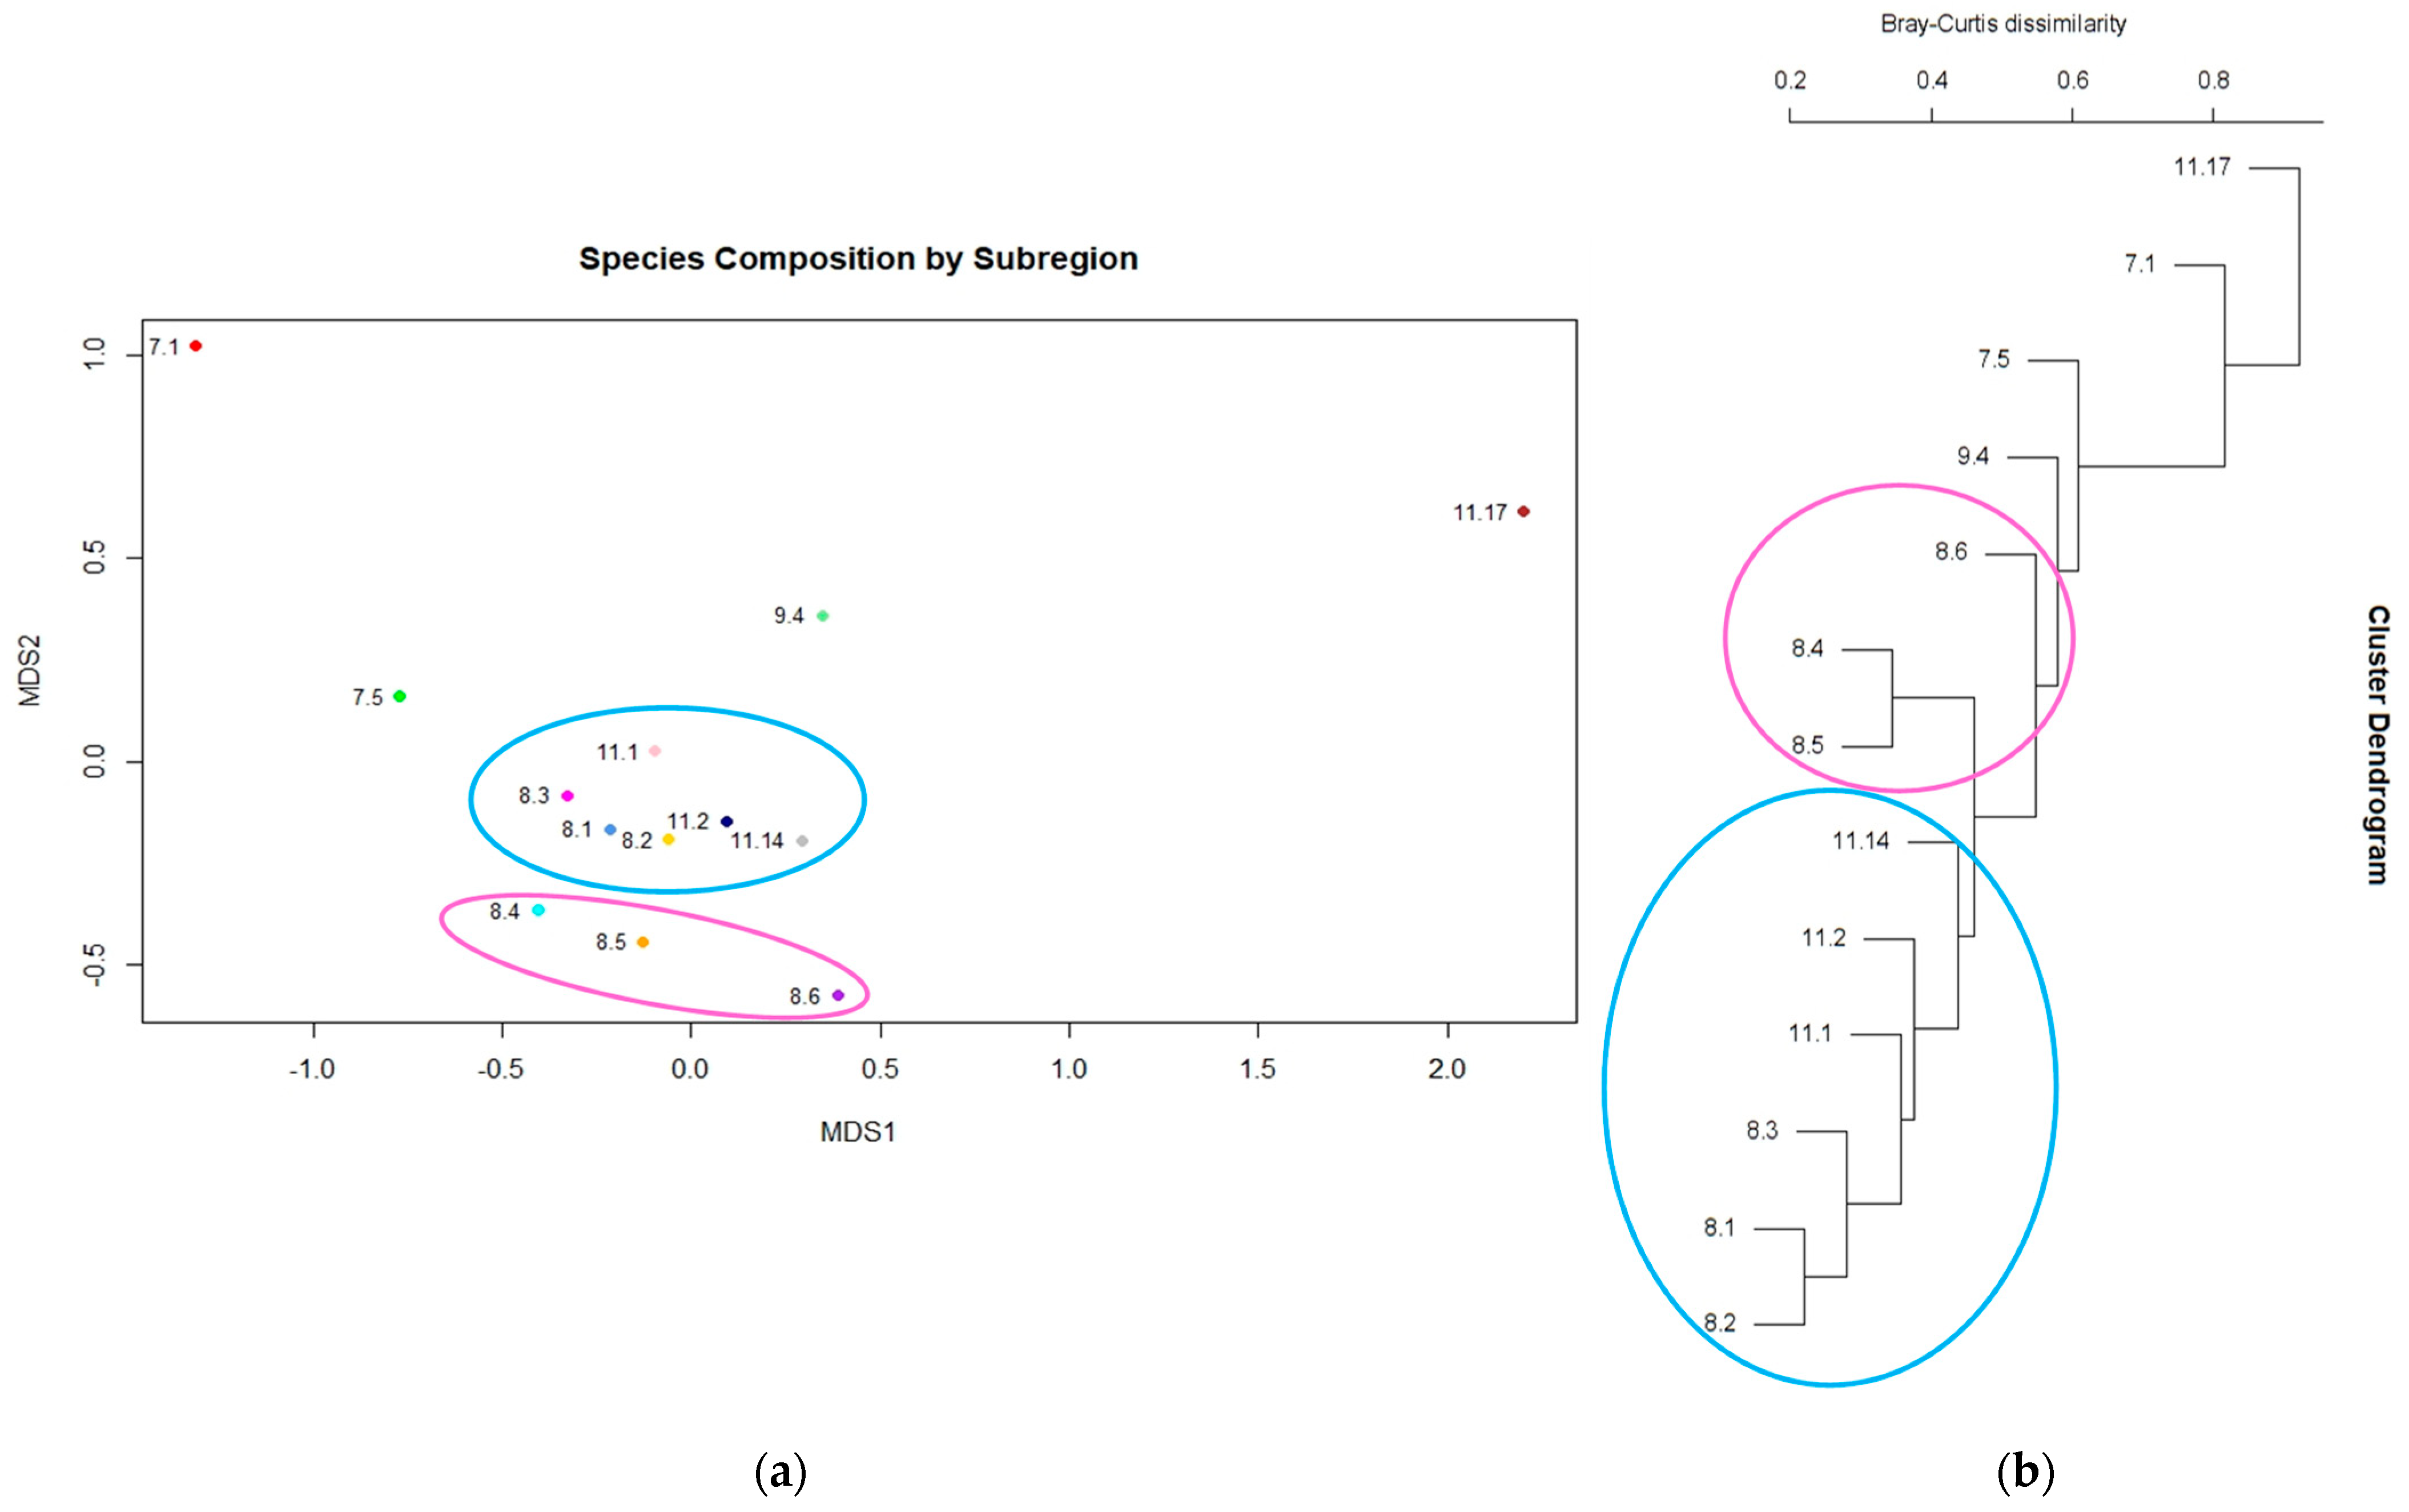
3.2. Diversity and Distinctiveness of Central Queensland Coast (CQC) Rainforest Estate

A total of 12,529 georeferenced species records were collated, and 13 IBRA Subregions and 65 Regional Ecosystem (RE) types containing rainforest or rainforest elements, such as vine thicket understory, were represented. Our study included 22% of the total number of islands in the Central Queensland Coast (CQC) region. Forty-two species endemic to east Central Queensland were represented in our phylogeny, including a number of range-restricted species. Threatened species included 34 species listed in the Census of Queensland Flora (https://www.data.qld.gov.au/dataset/census-of-the-queensland-flora-2021, accessed on 11 February 2022) as endangered or vulnerable species under the Nature Conservation Act (1992), and 11 also listed as endangered or vulnerable under the EPBC Act (1999) (http://www.environment.gov.au/cgi-bin/sprat/public/publicthreatenedlist.pl?wanted=flora, accessed on 10 February 2022), such as the endangered Solanum graniticum and vulnerable Samadera bidwillii.
Phylogenetic analysis based on pooled CQld coastal species data revealed the Whitsunday (8.1) Subregion had the highest phylogenetic diversity (PD; 15,310), genus richness (GR; 370) and species richness (SR; 616; Table 3). The Paluma–Seaview (7.5) Subregion was the most family-rich (FR; Table 3: Figure S1). NMDS and cluster analysis based on community similarity showed that the taxa of the Whitsunday (8.1) and Proserpine–Sarina Lowlands (8.2) Subregions were grouped more closely with the Subregions of the Brigalow Belt North Bioregion (such as Townsville Plains (11.1) and Marlborough Plains (11.14)) than with taxa of Paluma–Seaview (7.5) or Broken River (9.4) (Figure 4). The Subregions Herbert (7.1) and Boomer Range (11.17) were shown to be markedly different in species composition when compared to all other Subregions (Figure 4).
The Subregions Paluma–Seaview (7.5), Byfield (8.4) and Manifold (8.5) were found to contain taxa that were less related to each other (even) than random (p < 0.05; NRI), whereas species of Subregions Marlborough Plains (11.14), Boomer Range (11.17) and Bogie River Hills (11.2) were found to be significantly more related to each other (clustered) than random (p < 0.05; NRI; Table 3; Figure S2). These clustered Subregions have also recorded the lowest mean annual precipitation and correspond to the dry barriers of St. Lawrence and Burdekin Gaps. Weak but significant correlations were found between phylogenetic diversity (PD) and geographical distance (r = 0.1984, p < 0.001) and species composition (r = 0.2925, p < 0.001).
The Clarke–Connors Ranges Subregion (8.3) on volcanic/sedimentary (272–299 Ma) dominant rock type had the highest mean phylogenetic diversity (PD; 5017.27), which differed significantly (H = 50.86, p < 0.05) from communities on granitoid and felsite rock types in the Paluma–Seaview, Debella, Proserpine–Sarina Lowlands and Townsville Plains Subregions (Table 4; Figure 5). The communities of the Marlborough Plains (11.14) Subregion, found on the oldest dominant rock type (ultramafic rock, 485–1000 Ma), were significantly more closely related than expected by chance (NRI, p < 0.05; Table 4), which may indicate habitat specialisation. The rainforest communities on granitoid dominant rock types of the Carboniferous–Cretaceous period (101–232 Ma) were found to be significantly different (p < 0.05) from a range of different dominant rock types within the same Subregions of Paluma–Seaview and Whitsunday, across all diversity measures (Table 4). Significant differences were also found between mean species diversity (NTI) of the Carboniferous–Cretaceous period (F = 3.399, p ≤ 0.001) and Early to Late Permian periods, within the same Subregions. These results reflect the heterogeneity of geological substrates within the Central Queensland coastal region.
Phylogenetic diversity (PD) dissimilarity among plot species data within the Central Queensland Coast (CQC) region shows few distinct groupings but suggests that species on coastal sand with low rainfall are phylogenetically similar to each other (Figure 6b,f). The Regional Ecosystem (RE) types within these communities are listed as endangered and are also associated with the dry regions of the Burdekin and St. Lawrence Gaps of Brigalow Belt North (Table A2). As expected, these communities were found to be phylogenetically clustered (p < 0.05; Figure 7).

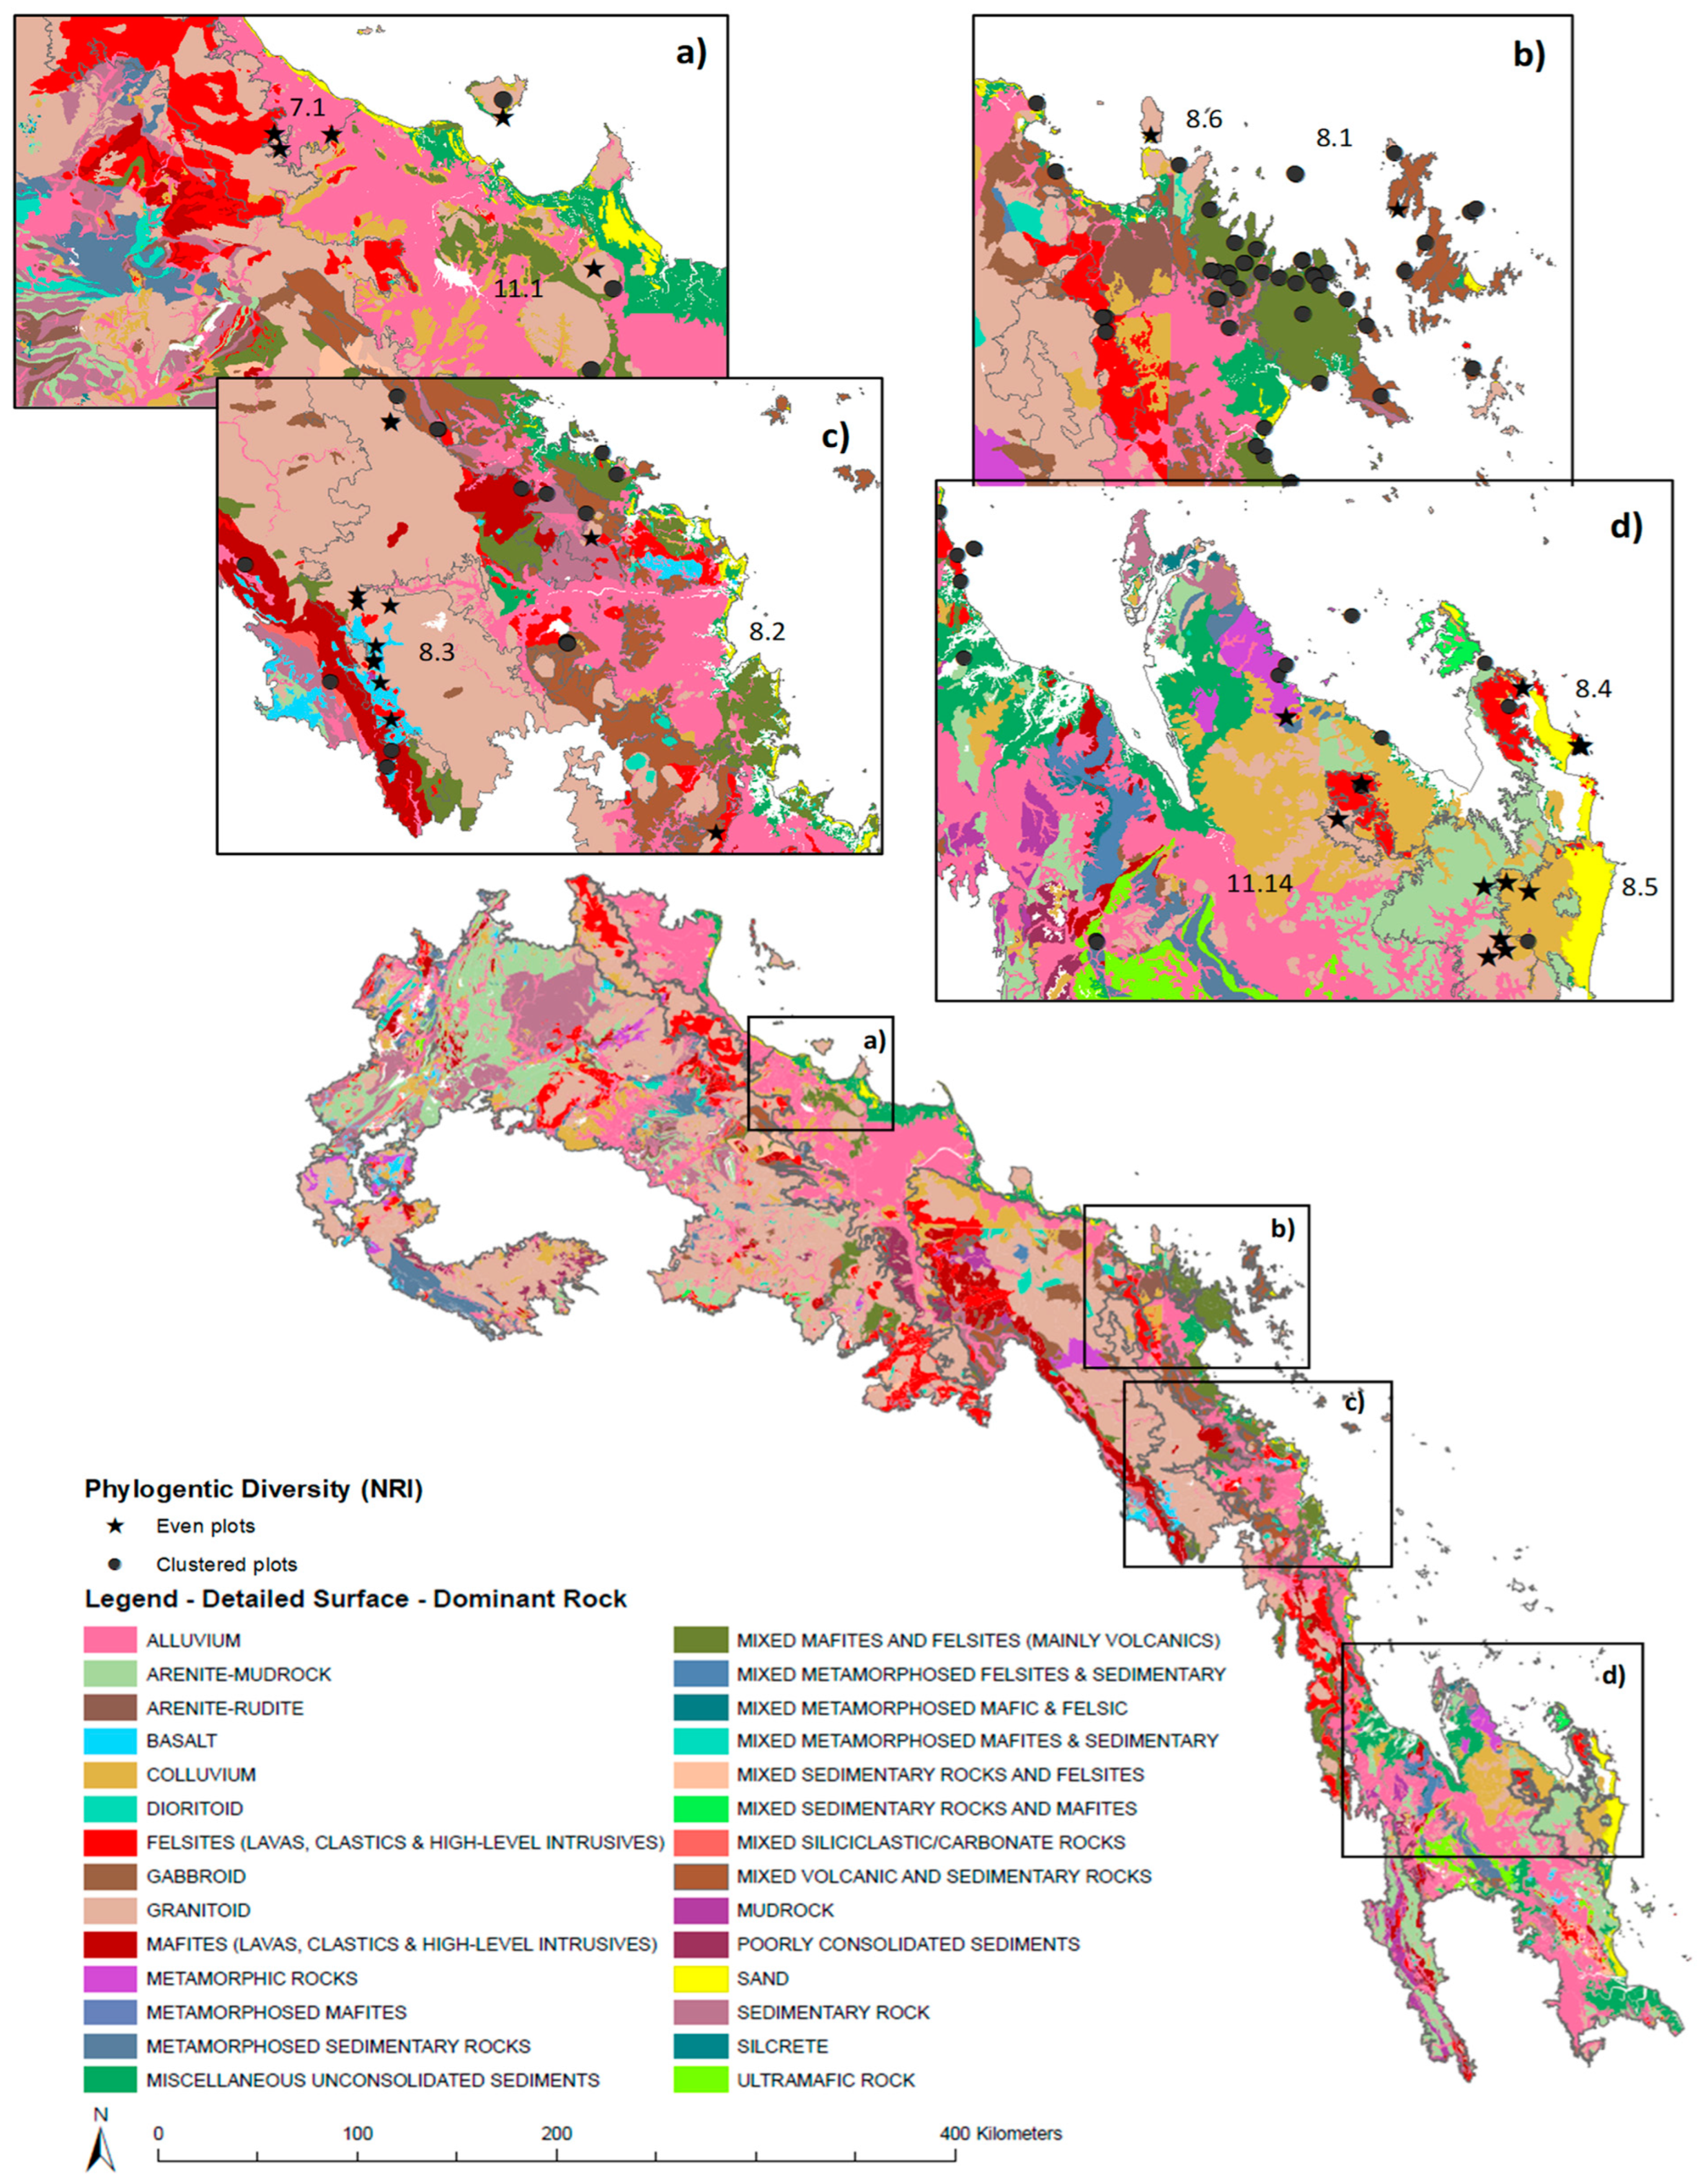
3.3. Evidence of a Corridor or Region of Overlap

The diversity and distinctiveness within the Central Queensland Coast (CQC) area suggests a region of a mixed distribution of taxa. The analysis of the study area in relation to these accepted dry barriers of the Burdekin and St. Lawrence Gaps, based on pooled species composition of Regional Ecosystem (RE) types, indicates that northern and central regions are more closely related with each other than with the southern Central Queensland Coast (CQC) regions (Figure 8). The central coast (Central) had the highest phylogenetic diversity (PD) and species richness (SR), with 40 rainforest Regional Ecosystem (RE) types represented (Table 5). South of the St. Lawrence Gap (South of SLGap) was significantly less related than expected (NRI, p < 0.05), with 20 rainforest Regional Ecosystem (RE) types (Table 5). The region within the St. Lawrence Gap (SLGap) was significantly more related than expected (NRI, p < 0.05) and was less phylogenetically diverse than the other regions (Table 5).

3.4. Central Queensland Rainforest Protected Area Estate

The Subregion with highest area of preclearing remnant rainforest was Clarke–Connors Ranges (8.3), of which 91% remains, with 64% within PAs. The Whitsunday (8.1) Subregion was found to have 97.6% area of remnant rainforest remaining, with 86% within PAs (Table 6). However, the more phylogenetically distinct Subregions of Byfield (8.4) and Manifold (8.5; NRI, p < 0.05) have only 20% and 12%, respectively, of remnant rainforest protected within PAs (Table 6). The Byfield (8.4) Subregion contains endangered rainforest communities including Regional Ecosystem (RE) types such as 8.2.2 (semi-evergreen microphyll vine thicket to vine forest, on coastal dunes) and 11.3.11 (semi-evergreen vine thicket on alluvial plains; Table A2). Only 9.7% and 14.8%, respectively, of these Regional Ecosystem types are protected in the Central Queensland Coast (CQC) research area. Byfield (8.4) and Manifold (8.5) also contain rainforest communities of Corymbia tessellaris open forest to woodland well-developed rainforest species on parallel dunes with only 3.1% within the protected area estate, but surprisingly, are only listed as Of Concern (Table A2). Rainforest communities that were less phylogenetically related than expected by chance (NRI, p < 0.05) were found in protected areas such as Paluma Range NP of Subregions of Paluma–Seaview (7.5), Herbert (7.1), Eungella NP in the Clarke–Connors Ranges (8.3) and in Byfield NP and Shoalwater Bay Military Training area of the southern Subregions Byfield (8.4) and Manifold (8.5).

4. Discussion

4.1. Comparison of Central Queensland Coast (CQC) Rainforests with Other Communities

Typically, global rainforest diversity is related to latitudinal gradients, or temperature gradients, with a decrease in floristic composition and structure from lower to higher latitudes [53,89,90]. Ashton and Zhu [91] found that vegetation gradients in the Himalayas and east Asia could be partly ascribed to the migration of plant taxa between temperate, tropical and subtropical forests of Gondwanan and Laurasian ancestries. In Australia, floristic latitudinal gradients have, to some extent, been attributed to a floristic exchange between the Australian plate (Sahul) and the Asian plate (Sunda) [30,92]. Kooyman et al. [93] found that the drier rainforests of Central Queensland had similar richness values to the moist subtropical region further south. In contrast, this study found flora of mixed ancestries with more tropical species within the Central Queensland Coast (CQC) region, and endemic species in multiple rainforest types which contributed to higher species diversity when compared with the generally wetter rainforests of Southeast Queensland. These results are consistent with a floristic exchange between the Central and tropical regions of Queensland.
Moisture gradients and seasonality have also been documented to impact plant species richness and phylogenetic diversity patterns [26,94]. Low levels of species diversity have been found within dry plant communities when compared to more mesic plant distributions [95]. A study by Echeverría-Londoño et al. [96], investigating the biomes of North and South America, found that widespread species tended to be functionally similar and patterns of dissimilarity between regions reflected variations in climate where distinctive species were range-restricted. Strong selection pressures associated with harsh and dry environments have led to phylogenetically clustered plant communities in Tibet [97] and China [98]. Within the Southeast Queensland region, phylogenetically clustered taxa were detected in seasonally dry habitats [33]. In this study, we found that dry rainforest communities of the Brigalow Belt North and South Bioregions with low levels of mean annual rainfall were phylogenetically clustered, consistent with patterns of environmental filtering with increased environmental stress found elsewhere [97,98].

4.2. Diversity within Central Queensland Coast (CQC) Rainforest Estate

Rainforest species diversity has been shown to differ between different rainforest types within the same region, such as in Southeast Queensland and Victoria, mostly due to climate and moisture [40,99]. As expected, we found similar results in Central Queensland Coast (CQC) rainforests. Phylogenetic analysis revealed that the most diverse areas were found within mesic rainforests of the Whitsunday (8.1) and Paluma–Seaview (7.5) Subregions. Drier rainforest communities of coastal lowlands such as Herbert (7.1), within dry barriers such as Boomer Range (11.17), were shown to be markedly different in species composition when compared to all other Subregions and each other.
Given that the patterns of rainforest plant species and phylogenetic diversity are predicted to vary according to a number of abiotic variables [26,94], we predicted that similar patterns would be evident within the Central Queensland coastal region. Cali [100] reported that when compared to the littoral rainforest (beach scrub) communities of the Central Queensland Coast (CQC) Bioregion, the drier coastal areas of the Brigalow Belt North Bioregion were less diverse. Our results were consistent with these findings, and additionally showed that the diversity was greater at genus and family levels. This suggests that filtering due to harsh environmental conditions and the Brigalow Belt North Bioregion may be impacted by restricted geographic distributions, for which it is listed as Endangered under the EPBC Act (1999).

4.3. Distinctiveness within Central Queensland Coast (CQC) Rainforest Types

Community phylogenetic diversity (PD) studies on rainforest plants have found patterns of phylogenetic clustering in harsh or isolated environments [33,34,53,54]. This study found consistent patterns of significant phylogenetic clustering (p < 0.05) in the drier Subregions of Marlborough Plains (11.14), Boomer Range (11.17) and Bogie River Hills (11.2). Plant communities located on ultramafic or serpentine substrates are known to exhibit distinct features associated with the unique soil chemical composition and frequent occurrence of endemic plant taxa, and therefore are of special significance [101,102,103]. Batianoff, Neldner and Singh [101] hypothesised that while these communities contain endemic species (a pattern typically associated with potential refugia), selective pressures would result in more closely related species. Our results support this theory, as communities in the Marlborough Plains (11.14) Subregion found on ultramafic (serpentine) rock and containing endemic species were significantly phylogenetically clustered (p < 0.05). These clustered Subregions have high species-to-genus ratios and are situated in regions of lowest mean annual precipitation, consistent with regions of speciation and strong selection pressures for moisture.
Plant community patterns indicative of climatic refugia are thought to include local dispersal limitations of range-restricted endemic species [55]. Patterns of phylogenetic distinctiveness within Southeast Queensland have been found to be consistent with the concept of refugia [33,34,55]. Similarly, we found phylogenetic patterns within the Central Queensland Coast (CQC) region that may indicate potential climatic refugia in the Subregions of Paluma–Seaview (7.5), Byfield (8.4) and Manifold (8.5) which contained taxa that were less related to each other (even) than random. Additionally, several range-restricted species were represented in our study at various locations that also contained patterns of phylogenetic evenness, such as Eungella National Park and Mt. Dryander.
Rainforest plant communities on the islands of the Central Queensland Coast (CQC) might be expected to exhibit low species diversity, as predicted by the island biogeography theories of MacArthur and Wilson [41]. Additionally, Kim and Lee [104] found that distance and island area significantly affected plant community structure, phylogenetic diversity and distinctiveness. However, islands such as K’gari (Fraser Island), Magnetic and Whitsunday Islands were once part of mainland Australia and were formed as a result of sea level rise following the last glacial period and may be indicative of older, more stable habitats, and representative of refugia [34,38,105,106]. This study included rainforest communities from 22% of the islands of the Central Queensland Coast (CQC) region. Our results were consistent with these theories. We showed that 1% of the island plots surveyed, such as those on Magnetic and Whitsunday Islands, were phylogenetically even, consistent with older, more stable habitats and refugia; however, we found that 40% of the island communities of the Central Mackay Coast Bioregion, including continental islands of the Whitsunday group, were phylogenetically clustered, consistent with younger, more recent dispersal events, or the result of substantial selection pressures of harsher environments.

4.4. Evidence of a Region of Overlap or Coastal Corridor

Various patterns in plant communities have been recognised along latitudinal and altitudinal gradients in response to climatic and geological variation, and shared evolutionary histories [1,54]. Kooyman, Rossetto, Allen and Cornwell [26] found that latitude accounted for more variation in plant species assemblages than elevation when comparing community phylogenetic structures of tropical and subtropical rainforests. In South American dry forests, Mayle [8] hypothesised that current biogeographic patterns were more likely due to population migration since the Last Glacial Maximum (LGM), rather than other processes such as vicariance. It has similarly been hypothesised that corridors likely exist for plant species movement between coastal and inland regions [107,108]. Within Central Queensland, research by Fensham [108] on dry rainforests west of the Cardwell and Clark Connors Ranges found that 87% of trees, shrubs and vines had also been recorded within 1 km of the Queensland coast. Our study found that 75% of the species in the Central Queensland Coast (CQC) rainforest had been listed by Fensham [108] as being found further inland, supporting this theory.
The distribution of plant species has been found to be affected by biogeographic barriers such as climatic dry barriers of the Burdekin and St. Lawrence Gaps of Central Queensland Coast [93,109,110]. Costion et al. [110] suggested that the Burdekin Gap in North Queensland was a barrier to connectivity between tropical and subtropical rainforest species. In contrast, we found that while the plant species assemblages of IBRA Bioregions Southeast Queensland (SEQ) and Central Mackay Coast (CMC) formed distinct groupings, the Central Queensland Coast (CQC) region is more closely related to and interspersed with those of the Wet Tropics (WET) and Brigalow Belt North (BBN) Bioregions. The communities of the Brigalow Belt South (BBS) Bioregion were more closely related to those of Southeast Queensland (SEQ). These results are contrary to our prediction of a corridor between northern tropical and southern subtropical rainforests. Our results indicate that while the composition of the Central Queensland Coast (CQC) region is a mixture of tropical and subtropical species, the dry barrier of the St. Lawrence Gap, more so than the Burdekin Gap, poses a substantial barrier to species migration along the east coast of Queensland.
Evidence for the significance of the St. Lawrence Gap has been demonstrated by Yap et al. [92] with a noticeable decline in the proportion of Indo-Malesian rainforest plant species (Sunda) southward from the Central to Southeast Queensland regions. The majority of families sampled in this study are found in both the Central and Southeast Queensland regions. Families found to be distinctive when compared to each region suggest tropical families such as Maesaceae and Opiliaceae in the northern Subregions of the Central Queensland Coast (CQC) region and more subtropical to Gondwanan families such as Petermanniaceae and Nothofagaceae within the Subregions of Southeast Queensland. While we acknowledge that species of Nothofagus are known to occur to the north, in New Guinea and New Caledonia, they have been found to be distinct from the other species found in the temperate forests of the southern hemisphere [111].

4.5. Conservation of Central Queensland Coast (CQC) Rainforests

Although Australia has achieved the protection of 17.9% of its biodiversity in protected areas as part of its obligations under the United Nations Convention on Biological Diversity, it is not evenly distributed across all habitat types [39]. A recent study by Shapcott et al. [40] found that the distinctive rainforest Regional Ecosystem (RE) types in Southeast Queensland (SEQ) were not well conserved. Fensham [108] notes that, mostly, more mesic rainforest types in Central Queensland are well protected, but dry rainforests in inland areas are poorly represented in national park estates. The critically endangered littoral rainforest (EPBC Act, 1999) is known to provide significant habitat for a number of endemic and threatened flora such as Acronychia littoralis and Neisosperma kilneri. The littoral rainforest and dry coastal vine thickets of eastern Australia have been listed as Critically Endangered under the Environment Protection and Conservation Act (1999). Studies have found that dry forest species are tolerant of arid conditions, are resilient and have the capacity to recolonise and expand into harsh environments [107,112]. This study found that these rainforest types in Central Queensland Coast (CQC) had very little to no protection within the National Reserve System (NRS), whereas the most distinctive areas of disjunct moist rainforests were well protected in Paluma, Eungella and Byfield National Parks.
The protection of littoral and coastal dry rainforests may be problematic due to size, because many of the remaining patches of littoral rainforest vegetation have been considered too small to meet the condition thresholds for the ecological community [113]. The species–area relationship (SAR) has been a cornerstone for conservation management [57]. Fragmentation and metapopulation theories predict that greater connectivity will maintain higher diversity within habitat patches but lead to lower diversity between patches [114]. However, it has been recognised that the maintenance of connected patches is considered the key management requirement to support ecosystem adaptation, and the movement of species and may be more important for the conservation of phylogenetically distinct communities than larger geographic areas that may consist of more closely related taxa [40]. We found that, even though littoral rainforest (beach scrub) communities contained endemic species, they were generally a subset of taxa commonly found in other semi-evergreen microphyll vine thicket to vine forest communities and did not contain distinctive assemblages. This may indicate that littoral rainforest communities facilitate the movement of some taxa within the Central Queensland Coast (CQC). We also found Central Queensland Coast (CQC) dry rainforest reflect areas of species movement throughout the entire region and, therefore, the conservation of smaller patches is imperative to maintain species diversity and distribution under strong selection pressures in this dry region.

5. Conclusions

In this study, we comprehensively sampled rainforest plant species of the Central Queensland coastal region, revealed new locations for some species and greatly expanded our understanding of previously understudied plant assemblages. Hence, we have made a significant contribution to the DNA barcoded library for Australian rainforest plant taxa. We found flora of both Gondwanan and Indo-Malesian heritage and endemic species in multiple environments. We showed that strong selection pressures for moisture and harsh abiotic conditions were the main drivers of species diversity and distinctiveness within the Central Queensland Coast (CQC), comparable to dry rainforest types worldwide. We also found rainforest plant communities consistent with the concept of refugia (phylogenetically even), and areas of speciation (phylogenetically clustered). This is significant for the evaluation of ecosystems when considering inclusion in the National Reserve System to ensure the most distinctive and diverse areas are protected. We also found evidence of species migration within the region, but the barrier to species movement between Bioregions of coastal Queensland was found to be more negatively influenced by selection pressures presented by the dry St. Lawrence Gap than the northern Burdekin Gap. The protection of small fragmented dry rainforests of the Central Queensland Coast (CQC) was very poor to non-existent within the National Reserve System (NRS) of Australia. For the future protection of rainforests in Australia, it is imperative that we protect the distinctive dry rainforest types of Central Queensland with species adapted to harsh and dry conditions and provide corridors for the movement of taxa within the landscape, particularly in relation to areas of intense anthropogenic disturbance, to larger, more stable regions to allow species to track predicted climatic changes and large-scale disturbance.

Supplementary Materials

The following supporting information can be downloaded at: https://www.mdpi.com/article/10.3390/d15030378/s1, Figure S1: Central Queensland Coast (CQC) phylogeny based on pooled data created with iTOL, v5 [88]. Coloured bars represent species collected within the respective Subregions. Major orders are named. Figure S2: Central Queensland Coast (CQC) phylogeny based on pooled data created with iTOL, v5 [88] showing distinctive Subregions. Green coloured bars represent Subregion communities that were phylogenetically even. Orange bars represent Subregion communities that were phylogenetically clustered. Different shades represent individual Subregions. Major orders are named. Table S1: A list of 1208 Queensland rainforest species used to create the CSEQ and CQC phylogenies, showing the available GenBank Accession numbers for the 3 standard sequence markers matK, rbcL or psbA-trnH. All sequences with Accession numbers are publicly available from the open access sequence database, GenBank (https://www.ncbi.nlm.nih.gov/genbank/). (*) Indicates DNA barcode sequences produced at the University of the Sunshine Coast (UniSC) that have been submitted to the BOLD database and awaiting publication. (**) Indicates unpublished DNA barcode sequences produce in the laboratories of the National Museum of Natural History, Smithsonian Institution, Washington D.C., U.S.A. (#) Indicates sequences produced at the Australian Tropical Herbarium (ATH) Cairns, Queensland, Australia, available from the Public Data Portal of the BOLDSYSTEMS database (https://www.boldsystems.org/).

Author Contributions

Conceptualisation, M.H. and A.S.; Data curation, M.H., H.P. and A.S.; Formal analysis, M.H. and A.S.; Funding acquisition, A.S.; Investigation, M.H. and H.P.; Methodology, M.H., H.P., Y.S. and A.S.; Project administration, M.H. and A.S.; Resources, M.H., W.J.F.M. and A.S.; Software, M.H., H.P., Y.S., S.K.S. and A.S.; Supervision, W.J.F.M., Y.S., S.K.S. and A.S.; Writing—original draft, M.H.; Writing—review and editing, M.H., H.P. and A.S. All authors have read and agreed to the published version of the manuscript.

Funding

This research was funded by The Australian Flora Foundation (ABN: 14758725506) and The University of the Sunshine Coast, Queensland, Australia.

Institutional Review Board Statement

Not applicable.

Data Availability Statement

Specimen data of species collected for this study are publicly available in the Queensland Herbarium (BRI) Occurrence dataset (https://www.gbif.org/, accessed on 22 February 2022). Voucher specimens are stored at the Queensland Herbarium and the University of the Sunshine Coast herbarium. Successful sequence data are lodged with the open access sequence database, BOLD available at (https://www.boldsystems.org/) and DNA barcode repository, GenBank available at (https://www.ncbi.nlm.nih.gov/genbank/). All other data are stored in the University of the Sunshine Coast research repository and will become available following the completion of the Ph.D. thesis of the first author (M.H.).

Acknowledgments

We thank the following for their contribution to the collection and identification of voucher specimens: Gordon Guymer, Paul Forster, David Halford and the Queensland Herbarium (BRI) technical staff; Darren Crayn, Melissa Harrison and Frank Zich from the Australian Tropical Herbarium (CNS); Betsy Jackes and Stuart Worboys of James Cook University; Brent Braddick, curator of Gladstone Botanic Gardens; Irene Champion, Donna Jackson and Aaron Bean Mackay of the Regional Botanic Gardens and QPWS, Airlie Beach; Laura Simmons. We thank Tim Ryan for data acquisition. Rachel Wilson, Brittany Elliot and the University of the Sunshine Coast laboratory, field, safety and technical staff are thanked for training and support. We thank the reviewers for the for their comments and the opportunity to enhance our manuscript.

Conflicts of Interest

The authors declare no conflict of interest. The funders had no role in the design of the study; in the collection, analyses, or interpretation of data; in the writing of the manuscript or in the decision to publish the results.

Appendix A

Table A1. A list of standard primers used for three marker genes: matK; psbA-trnH and rbcL [51].
MarkerRead DirectionPCR PrimersSequence (5′→3′)
matKForwardmatK_xFTAATTTACGATCAATTCATTC
ReversematK_5rGTTCTAGCACAAGAAAGTCG
psbA-trnHForwardpsbA3_fGTTATGCATGAACGTAATGCTC
ReversetrnHf_05CGCGCATGGTGGATTCACAATCC
rbcLForwardrbcLa-FATGTCACCACAAACAGAGACTAAAGC
ReverserbcLa-RGTAAAATCAAGTCCACCYCG
Table A2. Summary of rainforest RE area of extent and protection based on plot species data.
REPDPreclear (Ha)Remnant (Ha)Preclear% RfPARemnant %RfPAEPBC Act (1999)IBRA SubregionIBRA Bioregion
11.11.2151091894152213.216.2 11.14BBN
11.11.5474737,33914,1657.820.0 11.1; 11.2; 11.14; 11.17; 8.4; 8.4BBN; BBS; CMC
11.11.5a21842448234171.174.3 11.14BBN
11.12.16203098810.00.0CR11.2BBN
11.12.4815737,85430,66630.236.7 11.1; 11.2; 11.14; 11.17; 9.4 BBN; BBS; EIU
11.12.4a737441338518.419.7 11.1; 11.14BBN
11.12.93643*H 111,558*H 95,7797.48.6 11.1; 11.2; 11.14; 7.1; 7.5; 8.6; 9.4BBN; WET; CMC; EIU
11.2.369882915245611.613.4EN11.1; 11.2; 11.14; 7.1BBN; WET
11.3.11555318093092.514.8EN11.1; 11.14; 11.17; 8.4BBN; BBS; CMC
11.3.11x12655770.00.0 11.1BBN
11.3.4020825061961.95.0 11.1BBN
11.5.153377511949770.00.0EN11.14; 9.4BBN; EIU
11.8.322645103941.62.1EN11.2BBN
7.12.10a36251719171769.970.0 11.1; 7.1; 7.5BBN; WET
7.12.11a425912,88212,87692.192.2EN11.1; 7.1; 7.5; 9.4BBN; WET
7.12.11b611322422494.494.6EN11.1BBN
7.12.16a472732,10331,66593.794.3 7.5WET
7.12.21b22265137511284.484.7 11.1; 7.5BBN; WET
7.12.22b19113448338994.595.8 7.5WET
7.12.26b315829529599.699.6 7.5WET
7.3.16b310811,839441019.234.0 7.1; 7.5WET
7.3.26a22212154193623.325.9 11.1; 7.5; 7.1BBN; WET
7.3.50b2848636383.283.2EN11.1; 7.5; 7.1BBN; WET
8.10.1221315614842.945.2 8.4CMC
8.11.272072839255617.919.0 11.14; 8.2; 8.4; 8.5BBN; CMC
8.12.11735811611698.498.4CR8.4CMC
8.12.11a673014,74014,66590.791.5CR11.2; 8.1; 8.2; 8.4; 8.6BBN; CMC
8.12.11c61101520150916.817.0CR11.14; 8.4; 8.5BBN; CMC
8.12.14b13108612857093.694.1 8.1CMC
8.12.1635624126412327.127.1CR11.2; 8.3BBN; CMC
8.12.17a36313655353091.394.0 8.3CMC
8.12.17b382856455870.069.8 8.3; 8.4CMC
8.12.17c2205707707100.0100.0 8.1CMC
8.12.18*H 10,84826,73225,98880.482.7 8.1; 8.2; 8.6CMC
8.12.19953413,72813,03877.481.1 8.1; 8.2; 8.3CMC
8.12.1a706121,85018,42972.685.0 8.3CMC
8.12.1b65031392139299.999.9 8.1CMC
8.12.2887634,03931,23461.466.4 8.2; 8.3CMC
8.12.2631934525311224.338.0 8.1; 8.2; 8.4; 8.6CMC
8.12.2861641320129858.559.4 8.1CMC
8.12.29573121721686.887.0 8.4CMC
8.12.302361487487100.0100.0 8.1CMC
8.12.3a*H 11,518*H 61,830*H 57,42844.848.0 11.14; 11.2; 8.2; 8.3; 8.4; 8.6BBN; CMC
8.12.3b19461894189288.088.0 8.3CMC
8.12.3c81662127193511.112.1 11.14; 8.4; 8.5BBN; CMC
8.2.2*H 10,341230519818.39.7CR11.14; 8.1; 8.2; 8.3; 8.4; 8.5; 8.6BBN; CMC
8.2.545012152158.98.9 8.5CMC
8.2.6b271512559302.33.1 11.14; 8.5; 8.4BBN; CMC
8.3.1010,1762042166450.661.9 8.1; 8.2; 8.3; 8.4; 8.6CMC
8.3.1a839211,83558911.22.6 11.14; 8.1; 8.2; 8.3; 8.6BBN; CMC
8.3.1b84782313178124.616.6 11.14; 8.4; 8.5BBN; CMC
8.3.9759412771277100.0100.0 8.1CMC
8.8.1a45072340122229.956.5 8.3CMC
8.8.1b663294694686.086.0 8.3CMC
9.12.34510312,16112,1518.08.0 11.1; 11.2; 7.5; 9.4BBN; WET; EIU
Mean 5179 9385 7926 49.0 52.0
(Stdv)(2679)(18,537)(16,031)(37.5)(37.0)
Total18,422516,195435,95637.748.9 135
(H) Indicates higher than the mean. (*) indicates significant values (p < 0.05). EN is Endangered and CR is Critically Endangered, listed under the EPBC Act (1999). IBRA Bioregions: Brigalow Belt North (BBN), Brigalow Belt South (BBS), Central Mackay Coast (CMC), Einasleigh Uplands (EIU) and Wet Tropics (WET).

References

  1. Webb, L.J.; Tracey, J.G. Australian Rainforest: Pattern and change. In Ecological Biogeography of Australia, 1st ed.; Keast, A., Ed.; Dr. W. Junk: The Hague, The Netherlands, 1981; pp. 605–694. [Google Scholar]
  2. Fajardo, L.; González, V.; Nassar, J.M.; Lacabana, P.; Portillo Q., C.A.; Carrasquel, F.; Rodríguez, J.P. Tropical Dry Forests of Venezuela: Characterization and Current Conservation Status. Biotropica 2005, 37, 531–546. [Google Scholar] [CrossRef]
  3. Koenen, E.J.; Clarkson, J.J.; Pennington, T.D.; Chatrou, L.W. Recently evolved diversity and convergent radiations of rainforest mahoganies (Meliaceae) shed new light on the origins of rainforest hyperdiversity. New Phytol. 2015, 207, 327–339. [Google Scholar] [CrossRef]
  4. Beard, J.S. The Classification of Tropical American Vegetation-Types. Ecology 1995, 36, 89–100. [Google Scholar] [CrossRef]
  5. Webb, L.J.; Tracey, J.G. The rainforests of northern Australia. In Australian Vegetation; Groves, R.H., Ed.; University Press: Cambridge, UK, 1994. [Google Scholar]
  6. Gillespie, T.W.; O’Neill, K.; Keppel, G.; Pau, S.; Meyer, J.-Y.; Price, J.P.; Jaffré, T. Prioritizing conservation of tropical dry forests in the Pacific. Oryx 2014, 48, 337–344. [Google Scholar] [CrossRef]
  7. Janzen, D.H. Management of habitat fragments in a tropical dry forest: Growth. Ann. Missouri. Bot. Garden. 1988, 75, 105–116. [Google Scholar] [CrossRef]
  8. Mayle, F.E. Assessment of the Neotropical dry forest refugia hypothesis in the light of palaeoecological data and vegetation model simulations. J. Quat. Sci. 2004, 19, 713–720. [Google Scholar] [CrossRef]
  9. Consiglio, T.; Schatz, G.E.; McPherson, G.; Lowry, P.P., 2nd; Rabenantoandro, J.; Rogers, Z.S.; Rabevohitra, R.; Rabehevitra, D. Deforestation and plant diversity of Madagascar’s littoral forests. Conserv. Biol. 2006, 20, 1799–1803. [Google Scholar] [CrossRef]
  10. Gillespie, L.J.; Grijalva, A.; Farris, C.N. Diversity, Composition and structure of tropical dry forest in Central america. Plant Ecol. 2000, 147, 37–47. [Google Scholar] [CrossRef]
  11. Tng, D. Australia’s Seasonally Dry Tropical Forests need attention. Austral. Ecol. 2019, 44, 552–554. [Google Scholar] [CrossRef]
  12. Blanchard, G.; Birnbaum, P.; Munoz, F. Extinction–immigration dynamics lag behind environmental filtering in shaping the composition of tropical dry forests within a changing landscape. Ecography 2020, 43, 869–881. [Google Scholar] [CrossRef]
  13. Laidlaw, M.J.; McDonald, W.J.F.; Hunter, R.J.; Putland, D.A.; Kitching, R.L. The potential impacts of climate change on Australian subtropical rainforest. Aust. J. Bot. 2011, 59, 440–449. [Google Scholar] [CrossRef]
  14. Shimizu-Kimura, Y.; Accad, A.; Shapcott, A. The relationship between climate change and the endangered rainforest shrub Triunia robusta (Proteaceae) endemic to southeast Queensland, Australia. Sci. Rep. 2017, 7, 46399. [Google Scholar] [CrossRef]
  15. Wilson, B.A.; Nelder, V.J.; Accad, A. The extent and status of remnant vegetation in Queensland and its implications for statewide vegetation management and legislation. Rangel. J. 2002, 24, 6–35. [Google Scholar] [CrossRef]
  16. Hilbert, D.W.; Graham, A.; Hopkins, M.S. Glacial and interglacial refugia within a long-term rainforest refugium: The Wet Tropics Bioregion of NE Queensland, Australia. Palaeogeogr. Palaeoclimatol. Palaeoecol. 2007, 251, 104–118. [Google Scholar] [CrossRef]
  17. Kahler, C.P. NQDT Report Beach Scrub BioCondition Assessments November 2016; Ecological Interpretation: Townsville, Australia, 2016. [Google Scholar]
  18. Attiwill, P.M. The disturbance of forest ecosystems: The ecological basis for conservative management. For. Ecol. Manag. 1994, 63, 247–300. [Google Scholar] [CrossRef]
  19. Noss, R.F. Beyond Kyoto: Forest Management in a time of rapid climate change. Conserv. Biol. 2001, 15, 578–590. [Google Scholar] [CrossRef]
  20. Natural Resource Management Ministerial Council. Australia’s Biodiversity Conservation Strategy 2010–2030; Natural Resource Management Ministerial Council: Sydney, Australia, 2010.
  21. Byrne, M.; Steane, D.A.; Joseph, L.; Yeates, D.K.; Jordan, G.J.; Crayn, D.; Aplin, K.; Cantrill, D.J.; Cook, L.G.; Crisp, M.D.; et al. Decline of a biome: Evolution, contraction, fragmentation, extinction and invasion of the Australian mesic zone biota. J. Biogeogr. 2011, 38, 1635–1656. [Google Scholar] [CrossRef]
  22. Powell, M.; Accad, A.; Shapcott, A. Where they are, why they are there, and where they are going: Using niche models to assess impacts of disturbance on the distribution of three endemic rare subtropical rainforest trees of Macadamia (Proteaceae) species. Aust. J. Bot. 2014, 62, 322–334. [Google Scholar] [CrossRef]
  23. Metcalfe, D.J.; Lawson, T.J. An International Union for Conservation of Nature risk assessment of coastal lowland rainforests of the Wet Tropics Bioregion, Queensland, Australia. Austral. Ecol. 2015, 40, 373–385. [Google Scholar] [CrossRef]
  24. Weber, E.T.; Catterall, C.P.; Locke, J.; Ota, L.S.; Prideaux, B.; Shirreffs, L.; Talbot, L.; Gordon, I.J. Managing a World Heritage Site in the Face of Climate Change: A Case Study of the Wet Tropics in Northern Queensland. Earth 2021, 2, 248–271. [Google Scholar] [CrossRef]
  25. Colhoun, E.A.; Barrows, T.T. The Glaciation of Australia. In Quaternary Glaciations—Extent and Chronology—A Closer Look; Developments in Quaternary Sciences; Elsevier: Amsterdam, The Netherlands, 2011; pp. 1037–1045. [Google Scholar]
  26. Kooyman, R.M.; Rossetto, M.; Allen, C.; Cornwell, W. Australian Tropical and Subtropical Rain Forest Community Assembly: Phylogeny, Functional Biogeography, and Environmental Gradients. Biotropica 2012, 44, 668–679. [Google Scholar] [CrossRef]
  27. De Deckker, P.; Moros, M.; Perner, K.; Blanz, T.; Wacker, L.; Schneider, R.; Barrows, T.T.; O’Loingsigh, T.; Jansen, E. Climatic evolution in the Australian region over the last 94 ka—Spanning human occupancy -, and unveiling the Last Glacial Maximum. Quat. Sci. Rev. 2020, 249, 106593. [Google Scholar] [CrossRef]
  28. Adam, P. Australian Rainforests; Clarendon Press: Oxford, UK, 1992. [Google Scholar]
  29. Bowman, D.M.J.S.; Prior, L.D. TURNER REVIEW No. 10. Why do evergreen trees dominate the Australian seasonal tropics? Aust. J. Bot. 2005, 53, 379–399. [Google Scholar] [CrossRef]
  30. Crayn, D.M.; Costion, C.; Harrington, M.G.; Richardson, J. The Sahul-Sunda floristic exchange: Dated molecular phylogenies document Cenozoic intercontinental dispersal dynamics. J. Biogeogr. 2015, 42, 11–24. [Google Scholar] [CrossRef]
  31. Keast, A. Ecological Biogeography of Australia, 1st ed.; Keast, A., Ed.; W. Junk: The Hague, The Netherlands, 1981. [Google Scholar]
  32. Barlow, B.A. Phytogeography of the Australian region. In Australian Vegetation, 2nd ed.; Groves, R.H., Ed.; Univesity Press: Cambridge, UK, 1994; pp. 3–35. [Google Scholar]
  33. Shapcott, A.; Forster, P.I.; Guymer, G.P.; McDonald, W.J.F.; Faith, D.P.; Erickson, D.; Kress, W.J. Mapping Biodiversity and Setting Conservation Priorities for SE Queensland’s Rainforests Using DNA Barcoding. PLoS ONE 2015, 10, e0122164. [Google Scholar] [CrossRef] [PubMed]
  34. Howard, M.G.; McDonald, W.J.; Forster, P.I.; Kress, W.J.; Erickson, D.; Faith, D.P.; Shapcott, A. Patterns of Phylogenetic Diversity of Subtropical Rainforest of the Great Sandy Region, Australia Indicate Long Term Climatic Refugia. PLoS ONE 2016, 11, e0153565. [Google Scholar] [CrossRef]
  35. IBRA. Revision of the Interim Biogeographic Regionalisation of Australia (IBRA) and the Development of Version 5.1.—Summary Report; Department of Climate Change, Energy, the Environment and Water: Canberra, Australia, 2000.
  36. Neldner, V.J.; Butler, D.W.; Guymer, G.P. Queensland’s Regional Ecosystems: Building a Maintaining a Biodiversity Inventory, Planning Framework and Information System for Queensland, Version 2.0; The State of Queensland (Department of Environment and Science): Manly, Australia, 2019; p. 55.
  37. Bryan, S.E.; Ewart, A.; Stephens, C.J.; Parianos, J.; Downes, P.J. The Whitsunday Volcanic Province, Central Queensland, Australia: Lithological and stratigraphic investigations of a silicic-dominated large igneous province. J. Volcanol. Geotherm. Res. 2000, 99, 55–78. [Google Scholar] [CrossRef]
  38. Willmott, W.F. Rock and Landscapes of the National Parks Central Queensland; Geological Society of Australia Incorporated: Brisbane, Australia, 2006. [Google Scholar]
  39. Cresswell, I.D.; Janke, T.; Johnston, E.L. Australia State of the Environment 2021: Overview, Independent Report to the Australian; Government Minister for the Environment: Wellington, Australia, 2021; p. 274. [CrossRef]
  40. Shapcott, A.; Liu, Y.; Howard, M.; Forster, P.I.; Kress, W.J.; Erickson, D.L.; Faith, D.P.; Shimizu, Y.; McDonald, W.J.F. Comparing Floristic Diversity and Conservation Priorities across South East Queensland Regional Rain Forest Ecosystems Using Phylodiversity Indexes. Int. J. Plant Sci. 2017, 178, 211–229. [Google Scholar] [CrossRef]
  41. MacArthur, R.H.; Wilson, E.O. An Equilibrium Theory of Insular Zoogeography. Evolution 1963, 17, 373–387. [Google Scholar] [CrossRef]
  42. Worboys, G.L.; Pulsford, I. Connectivity Conservation in Australian Landscapes; Department of Sustainability, Environment, Water, Populations and Communities: Canberra, Australia, 2011.
  43. Pulsford, I.; Lindenmayer, D.; Wyborn, C.; Lausche, B.; Vasilijević, M.; Worboys, G.L.; Lefroy, T. Connectivity Conservation Management. In Protected Area Governance and Management; Worboys, G.L., Lockwood, M., Kothari, A., Feary, S., Pulsford, I., Eds.; ANU Press: Canberra, Australia, 2015; pp. 851–888. [Google Scholar]
  44. DEE. National Recovery Plan for the Littoral Rainforest and Coastal Vine Thickets of Eastern Australia Ecological Community; Department of the Environment and Energy: Canberra, Australia, 2019.
  45. Li, D.; Olden, J.D.; Lockwood, J.L.; Record, S.; McKinney, M.L.; Baiser, B. Changes in taxonomic and phylogenetic diversity in the Anthropocene. Proc. Biol. Sci. 2020, 287, 20200777. [Google Scholar] [CrossRef]
  46. Park, D.S.; Willis, C.G.; Xi, Z.; Kartesz, J.T.; Davis, C.C.; Worthington, S. Machine learning predicts large scale declines in native plant phylogenetic diversity. New Phytol. 2020, 227, 1544–1556. [Google Scholar] [CrossRef] [PubMed]
  47. Faith, D.P. Threatened species and the potential loss of phylogenetic diversity: Conservation scenarios based on estimated extinction probabilities and phylogenetic risk analysis. Conserv. Biol. 2008, 22, 1461–1470. [Google Scholar] [CrossRef]
  48. Faith, D.P. Conservation evaluation and phylogenetic diversity. Biol. Conserv. 1992, 61, 1–10. [Google Scholar] [CrossRef]
  49. Costion, C.; Ford, A.; Cross, H.; Crayn, D.; Harrington, M.; Lowe, A. Plant DNA barcodes can accurately estimate species richness in poorly known floras. PLoS ONE 2011, 6, e26841. [Google Scholar] [CrossRef] [PubMed]
  50. Kress, W.J.; Erickson, D.L.; Swenson, N.G.; Thompson, J.; Uriarte, M.; Zimmerman, J.K. Advances in the use of DNA barcodes to build a community phylogeny for tropical trees in a Puerto Rican forest dynamics plot. PLoS ONE 2010, 5, e15409. [Google Scholar] [CrossRef] [PubMed]
  51. Kress, W.J.; Erickson, D.L.; Jones, F.A.; Swenson, N.G.; Perez, R.; Sanjur, O.; Bermingham, E. Plant DNA barcodes and a community phylogeny of a tropical forest dynamics plot in Panama. Proc. Natl. Acad. Sci. USA 2009, 106, 18621–18626. [Google Scholar] [CrossRef] [PubMed]
  52. de Vere, N.; Rich, T.C.; Ford, C.R.; Trinder, S.A.; Long, C.; Moore, C.W.; Satterthwaite, D.; Davies, H.; Allainguillaume, J.; Ronca, S.; et al. DNA barcoding the native flowering plants and conifers of Wales. PLoS ONE 2012, 7, e37945. [Google Scholar] [CrossRef]
  53. Erickson, D.L.; Jones, F.A.; Swenson, N.G.; Pei, N.; Bourg, N.A.; Chen, W.; Davies, S.J.; Ge, X.J.; Hao, Z.; Howe, R.W.; et al. Comparative evolutionary diversity and phylogenetic structure across multiple forest dynamics plots: A mega-phylogeny approach. Front. Genet. 2014, 5, 358. [Google Scholar] [CrossRef]
  54. Kooyman, R.; Rossetto, M.; Cornwell, W.; Westoby, M. Phylogenetic tests of community assembly across regional to continental scales in tropical and subtropical rain forests. Glob. Ecol. Biogeogr. 2011, 20, 707–716. [Google Scholar] [CrossRef]
  55. Weber, L.C.; VanDerWal, J.; Schmidt, S.; McDonald, W.J.F.; Shoo, L.P.; Ladiges, P. Patterns of rain forest plant endemism in subtropical Australia relate to stable mesic refugia and species dispersal limitations. J. Biogeogr. 2014, 41, 222–238. [Google Scholar] [CrossRef]
  56. Webb, C.O. Exploring the Phylogenetic Structure of Ecological Communities: An Example for Rain Forest Trees. Am. Nat. 2000, 156, 145–155. [Google Scholar] [CrossRef] [PubMed]
  57. Vamosi, S.M.; Heard, S.B.; Vamosi, J.C.; Webb, C.O. Emerging patterns in the comparative analysis of phylogenetic community structure. Mol. Ecol. 2009, 18, 572–592. [Google Scholar] [CrossRef] [PubMed]
  58. Hampe, A.; Jump, A.S. Climate Relicts: Past, Present, Future. Annu. Rev. Ecol. Evol. Syst. 2011, 42, 313–333. [Google Scholar] [CrossRef]
  59. Barthe, S.; Binelli, G.; Herault, B.; Scotti-Saintagne, C.; Sabatier, D.; Scotti, I. Tropical rainforests that persisted: Inferences from the Quaternary demographic history of eight tree species in the Guiana shield. Mol. Ecol. 2017, 26, 1161–1174. [Google Scholar] [CrossRef]
  60. Gallagher, R.V.; Hughes, L.; Leishman, M.R. Species loss and gain in communities under future climate change: Consequences for functional diversity. Ecography 2013, 36, 531–540. [Google Scholar] [CrossRef]
  61. McDonald, K.; Alford, R. A Review of Declining Frogs in Northern Queensland; Environment Australia: Canberra, Australia, 1999; pp. 14–22. [Google Scholar]
  62. Chapple, D.G.; Hoskin, C.J.; Chapple, S.N.J.; Thompson, M.B. Phylogeographic divergence in the widespread delicate skink (Lampropholis delicata) corresponds to dry habitat barriers in eastern Australia. BMC Evol. Biol. 2011, 11, 18. [Google Scholar] [CrossRef] [PubMed]
  63. Melzer, A.; Cristescu, R.; Ellis, W.; FitzGibbon, S.; Manno, G. The habitat and diet of koalas (Phascolarctos cinereus) in Queensland. Aust. Mammal. 2014, 36, 189–199. [Google Scholar] [CrossRef]
  64. Kier, G.; Mutke, J.; Dinerstein, E.; Ricketts, T.H.; Küper, W.; Kreft, H.; Barthlott, W. Global patterns of plant diversity and floristic knowledge. J. Biogeogr. 2005, 32, 1107–1116. [Google Scholar] [CrossRef]
  65. Lavorel, S.; Colloff, M.J.; McIntyre, S.; Doherty, M.D.; Murphy, H.T.; Metcalfe, D.J.; Dunlop, M.; Williams, R.J.; Wise, R.M.; Williams, K.J. Ecological mechanisms underpinning climate adaptation services. Glob. Chang. Biol. 2015, 21, 12–31. [Google Scholar] [CrossRef] [PubMed]
  66. Bean, T. Collection and Preserving Plant Specimens: A Manual; Department of Science, Information Technology, Innovation and the Arts: Brisbane, Australia, 2013.
  67. Larkin, M.A.; Blackshields, G.; Brown, N.P.; Chenna, R.; McGettigan, P.A.; McWilliam, H.; Valentin, F.; Wallace, I.M.; Wilm, A.; Lopez, R.; et al. Clustal W and Clustal X version 2.0. Bioinformatics 2007, 23, 2947–2948. [Google Scholar] [CrossRef]
  68. Edgar, R.C. MUSCLE: Multiple sequence alignment with high accuracy and high throughput. Nucleic Acids Res. 2004, 32, 1792–1797. [Google Scholar] [CrossRef]
  69. Yu, J.; Holder, M.T.; Sukumaran, J.; Mirarab, S.; Oaks, J. SATé Version 2.2.7. 2013. Available online: http://phylo.bio.ku.edu/software/sate/sate.html (accessed on 23 April 2020).
  70. Katoh, K.; Toh, H. Parallelization of the MAFFT multiple sequence alignment program. Bioinformatics 2010, 26, 1899–1900. [Google Scholar] [CrossRef]
  71. Price, M.N.; Dehal, P.S.; Arkin, A.P. FastTree 2--approximately maximum-likelihood trees for large alignments. PLoS ONE 2010, 5, e9490. [Google Scholar] [CrossRef] [PubMed]
  72. Webb, C.O.; Donoghue, M.J. Phylomatic: Tree assembly for applied phylogenetics. Mol. Ecol. Notes 2005, 5, 181–183. [Google Scholar] [CrossRef]
  73. APG. An update of the Angiosperm Phylogeny Group classification for the orders and families of flowering plants: APG III. Bot. J. Linn. Soc. 2009, 161, 105–121. [Google Scholar] [CrossRef]
  74. Maddison, W.P.; Maddison, D.R. Mesquite: A Modular System for Evolutionary Analysis. Version 3.61. 2019. Available online: http://www.mesquiteproject.org (accessed on 1 May 2020).
  75. Miller, M.A.; Pfeiffer, W.; Schwartz, T. Creating the CIPRES Science Gateway for the Inference of Large Phylogenetic Trees. In Proceedings of the 2010 Gateway Computing Environments Workshop (GCE), New Orleans, LA, USA, 14 November 2010. [Google Scholar]
  76. Stamatakis, A. RAxML version 8: A tool for phylogenetic analysis and post-analysis of large phylogenies. Bioinformatics 2014, 30, 1312–1313. [Google Scholar] [CrossRef]
  77. Britton, T.; Anderson, C.L.; Jacquet, D.; Lundqvist, S.; Bremer, K. Estimating divergence times in large phylogenetic trees. Syst. Biol. 2007, 56, 741–752. [Google Scholar] [CrossRef]
  78. Kress, W.J.; Garcia-Robledo, C.; Uriarte, M.; Erickson, D.L. DNA barcodes for ecology, evolution, and conservation. Trends Ecol. Evol. 2015, 30, 25–35. [Google Scholar] [CrossRef] [PubMed]
  79. Accad, A.; Nelder, V.J.; Kelley, J.; Li, J.; Richter, D. Remnant Regional Ecosystem Vegetation in Queensland, Analyses 1997–2017. 2019. Available online: https://www.researchgate.net/publication/330725687_Remnant_regional_ecosystem_vegetation_in_Queensland_Analyses_1997-2017 (accessed on 15 August 2019).
  80. ESRI. ArcGIS; Version 10.7.1; ESRI Inc.: Redlands, CA, USA, 2019. [Google Scholar]
  81. Queensland Herbarium. Regional Ecosystem Description Database (REDD). Version 11.1 (April 2019); 2019. Available online: https://www.qld.gov.au/environment/plants-animals/plants/ecosystems/descriptions (accessed on 6 July 2020).
  82. Fick, S.E.; Hijmans, R.J. WorldClim 2: New 1-km spatial resolution climate surfaces for global land areas. Int. J. Climatol. 2017, 37, 4302–4315. [Google Scholar] [CrossRef]
  83. Kembel, S.W.; Cowan, P.D.; Helmus, M.R.; Cornwell, W.K.; Morlon, H.; Ackerly, D.D.; Blomberg, S.P.; Webb, C.O. Picante: R tools for integrating phylogenies and ecology. Bioinformatics 2010, 26, 1463–1464. [Google Scholar] [CrossRef] [PubMed]
  84. Hamady, M.; Lozupone, C.; Knight, R. Fast UniFrac: Facilitating high-throughput phylogenetic analyses of microbial communities including analysis of pyrosequencing and PhyloChip data. ISME J. 2010, 4, 17–27. [Google Scholar] [CrossRef]
  85. Oksanen, J.; Blanchet, F.G.; Friendly, M.; Kindt, R.; Legendre, P.; McGlinn, D.; Minchin, P.R.; O’Hara, R.B.; Simpson, G.L.; Solymos, P.; et al. vegan: Community Ecology Package, R Package Version 2.5-7. 2020. Available online: https://www.researchgate.net/publication/346579465_vegan_community_ecology_package_version_25-7_November_2020 (accessed on 20 February 2023).
  86. Paradis, E.; Schliep, K. ape 5.0: An environment for modern phylogenetics and evolutionary analyses in R. Bioinformatics 2019, 35, 526–528. [Google Scholar] [CrossRef]
  87. Pohlert, T. The Pairwise Multiple Comparison of Mean Ranks Package (PMCMR). R Package 2014. Available online: http://CRAN.R-project.org/package=PMCMR (accessed on 15 May 2021).
  88. Letunic, I.; Bork, P. Interactive Tree Of Life (iTOL) v5: An online tool for phylogenetic tree display and annotation. Nucleic Acids Res. 2021, 49, W293–W296. [Google Scholar] [CrossRef] [PubMed]
  89. Kooyman, R.M.; Wilf, P.; Barreda, V.D.; Carpenter, R.J.; Jordan, G.J.; Sniderman, J.M.; Allen, A.; Brodribb, T.J.; Crayn, D.; Feild, T.S.; et al. Paleo-Antarctic rainforest into the modern Old World tropics: The rich past and threatened future of the “southern wet forest survivors”. Am. J. Bot. 2014, 101, 2121–2135. [Google Scholar] [CrossRef]
  90. Slik, J.W.; Arroyo-Rodriguez, V.; Aiba, S.; Alvarez-Loayza, P.; Alves, L.F.; Ashton, P.; Balvanera, P.; Bastian, M.L.; Bellingham, P.J.; van den Berg, E.; et al. An estimate of the number of tropical tree species. Proc. Natl. Acad. Sci. USA 2015, 112, 7472–7477. [Google Scholar] [CrossRef]
  91. Ashton, P.; Zhu, H. The tropical-subtropical evergreen forest transition in East Asia: An exploration. Plant Divers 2020, 42, 255–280. [Google Scholar] [CrossRef] [PubMed]
  92. Yap, J.-Y.S.; Rossetto, M.; Costion, C.; Crayn, D.; Kooyman, R.M.; Richardson, J.; Henry, R. Filters of floristic exchange: How traits and climate shape the rain forest invasion of Sahul from Sunda. J. Biogeogr. 2018. [Google Scholar] [CrossRef]
  93. Kooyman, R.M.; Rossetto, M.; Sauquet, H.; Laffan, S.W. Landscape patterns in rainforest phylogenetic signal: Isolated islands of refugia or structured continental distributions? PLoS ONE 2013, 8, e80685. [Google Scholar] [CrossRef] [PubMed]
  94. Gastauer, M.; Thiele, J.; Porembski, S.; Neri, A.V. How do altitude and soil properties influence the taxonomic and phylogenetic structure and diversity of Brazilian páramo vegetation? J. Mt. Sci. 2020, 17, 1045–1057. [Google Scholar] [CrossRef]
  95. Specht, A. Biodiversity and Conservation. In Australian Vegetation; Groves, R.H., Ed.; University Press: Cambridge, UK, 1994. [Google Scholar]
  96. Echeverría-Londoño, S.; Enquist, B.J.; Neves, D.M.; Violle, C.; Boyle, B.; Kraft, N.J.B.; Maitner, B.S.; McGill, B.; Peet, R.K.; Sandel, B.; et al. Plant Functional Diversity and the Biogeography of Biomes in North and South America. Front. Ecol. Evol. 2018, 6, 219. [Google Scholar] [CrossRef]
  97. Xiao, Y.-m.; Yang, L.-c.; Nie, X.-q.; Li, C.-b.; Xiong, F.; Zhou, G.-y. Phylogenetic patterns of shrub communities along the longitudinal and latitudinal gradients on the northeastern Qinghai–Tibetan Plateau. J. Mt. Sci. 2020, 17, 1106–1114. [Google Scholar] [CrossRef]
  98. Lv, T.; Wang, N.; Xie, L.; Chen, S.; Zhao, R.; Feng, Y.; Li, Y.; Ding, H.; Fang, Y. Environmental Heterogeneity Affecting Community Assembly Patterns and Phylogenetic Diversity of Three Forest Communities at Mt. Huangshan, China. Forests 2022, 13, 133. [Google Scholar] [CrossRef]
  99. Melick, D.R.; Ashton, D.H. The Effects of Natural Disturbances on Warm Temperate Rainforests in South-eastern Australia. Aust. J. Bot. 1991, 39, 1–30. [Google Scholar] [CrossRef]
  100. Cali, M. BioCondition Methodology and Fine Scale Mapping of the Remnant Beach Scrubs of Central Queensland; Department of Environment and Science, Queensland Government: Brisbane, Australia, 2008; p. 14.
  101. Batianoff, G.N.; Nelder, V.J.; Singh, S. Vascular Plant Census and Floristic Analysis of Serpentine Landscapes in Central Queensland. Proc. R. Soc. Qld. 2000, 109, 11–30. [Google Scholar]
  102. Webb, C.O.; Ackerly, D.D.; McPeek, M.A.; Donoghue, M.J. Phylogenies and community ecology. Annu. Rev. Ecol. Syst. 2002, 33, 475–505. [Google Scholar] [CrossRef]
  103. Jaffré, T. Plant formations on ultramafic rocks in New Caledonia. Bot. Lett. 2022, 1–11. [Google Scholar] [CrossRef]
  104. Kim, H.; Lee, C.-B. On the relative importance of landscape variables to plant diversity and phylogenetic community structure on uninhabited islands, South Korea. Landsc. Ecol. 2020, 36, 209–221. [Google Scholar] [CrossRef]
  105. Willmott, W.F. Rocks and Landscapes of the National Parks of North Queensland; Geological Society of Australia Incorporated: Brisbane, Australia, 2009. [Google Scholar]
  106. Willmott, W.F. Rocks and Landscapes of the National Parks of Southern Queensland, 2nd ed.; Geological Society of Australia Incorporated: Brisbane, Australia, 2014. [Google Scholar]
  107. Gillison, A.N. The ‘Dry’ Rainforests of Terra Australis; Australian Public Service Commission: Canberra, Australia, 1987; pp. 305–321.
  108. Fensham, R.J. Floristics and Environmental Relations of inland Dry Rainforest in North Queensland. J. Biogeogr. 1995, 22, 1047–1063. [Google Scholar] [CrossRef]
  109. Edwards, R.D.; Crisp, M.D.; Cook, D.H.; Cook, L.G. Congruent biogeographical disjunctions at a continent-wide scale: Quantifying and clarifying the role of biogeographic barriers in the Australian tropics. PLoS ONE 2017, 12, e0174812. [Google Scholar] [CrossRef]
  110. Costion, C.M.; Kress, W.J.; Crayn, D.M. DNA Barcodes Confirm the Taxonomic and Conservation Status of a Species of Tree on the Brink of Extinction in the Pacific. PLoS ONE 2016, 11, e0155118. [Google Scholar] [CrossRef]
  111. Read, J.; Hope, G.; Hill, R. The Dynamics of Some Nothofagus-Dominated Rain Forests in Papua New Guinea. J. Biogeogr. 1990, 17, 185. [Google Scholar] [CrossRef]
  112. Apgaua, D.M.G.; Tng, D.Y.P.; Laurance, S.G.W. Tropical wet and dry forest tree species exhibit contrasting hydraulic architecture. Flora 2022, 291, 152072. [Google Scholar] [CrossRef]
  113. DES. Queensland State of the Environment 2020, Summary; Department of Environment and Science: Manly, Australia, 2021; p. 96.
  114. Sattler, P.S.; Williams, R. The Conservation Status of Queensland’s Bioregional Ecosystems; Environmental Protection Agency, Queensland Government: Brisbane, Australia, 1999.
Figure 1. Map of the study area extent displaying the location of 538 plots within 13 IBRA Subregions: Herbert (7.1); Paluma–Seaview (7.5); Broken River (9.4); Townsville Plains (11.1); Bogie River Hills (11.2); Debella (8.6); Whitsunday (8.1); Proserpine–Sarina Lowlands (8.2); Clark–Connors Ranges (8.3); Manifold (8.4); Byfield (8.5); Marlborough Plains (11.14); Boomer Range (11.17). Dry barriers of the Burdekin and St Lawrence Gaps are indicated by broken lines. Inset: distribution of the Queensland rainforest estate [33].
Diversity 15 00378 g001
Figure 2. Combined Central Queensland Coast (CQC) and Southeast Queensland phylogeny created with the online tool, iTOL, v5 [88]. Coloured bars represent species collected within the respective regions. Coloured circles indicate examples of difference in species to family ratios between Central Queensland Coast (CQC) and Southeast Queensland (SEQ) phylogenies. Coloured branches indicate orders.
Diversity 15 00378 g002
Figure 3. Nonmetric multidimensional scaling (NMDS) analysis comparing relationships among the study plots of Central Queensland Coast (CQC) and Southeast Queensland (SEQ) rainforest taxa. Species Composition by: (a) IBRA Bioregion; (b) Rainfall; (c) Coastal proximity; (d) Geographical zone; (e) Beach scrubs, where N is northern, C is central and S is southern; (f) Elevation class: Sea Level = 0 m; Low = 1 m–10 m; Low–Mid = 11 m–50 m; Mid = 51 m–150 m; Mid–High = 151 m–750 m; High = 751 m–1160 m. Some patterns of interest are indicated by ellipses.
Diversity 15 00378 g003aDiversity 15 00378 g003b
Figure 4. (a) Nonmetric multidimensional scaling (NMDS) and (b) hierarchical clustering of similar communities based on IBRA Subregion species composition using Bray–Curtis distance matrix of species presence/absence for the complete Central Queensland Coast (CQC) pooled species data set Two main groupings are shown; pink and blue ellipses correspond to (a) NMDS and (b) cluster dendrogram. Subregion codes are: Herbert (7.1); Paluma–Seaview (7.5); Whitsunday (8.1); Proserpine–Sarina Lowlands (8.2); Clark–Connors Ranges (8.3); Byfield (8.4); Manifold (8.5); Debella (8.6); Broken River (9.4); Townsville Plains (11.1); Bogie River Hills (11.2); Marlborough Plains (11.14); Boomer Range (11.17).
Diversity 15 00378 g004
Figure 5. Map of the surface geology of the Central Queensland Coast (CQC) region showing the dominant rock formations [80]. (a) Townsville Plains (11.1) and Herbert (7.5); (b) Whitsunday (8.1); (c) Proserpine–Sarina Lowlands (8.2) and Clarke–Connors Ranges (8.3); (d) Byfield (8.4) and Manifold (8.5) Subregions. Stars indicate phylogenetically even plots and circles represent phylogenetically clustered plots.
Diversity 15 00378 g005
Figure 6. Nonmetric multidimensional scaling (NMDS) analysis comparing phylogenetic diversity (PD), using the Unifrac dissimilarity matrix, among the study plots for Central Queensland Coast (CQC) species composition in relation to abiotic factors: (a) EPBC Act (1999) listed threatened ecosystems; (b) ‘Land zone’ (https://www.qld.gov.au/environment/plants-animals/plants/ecosystems/descriptions/land-zones, accessed on 2 February 2018); (c) Phylogenetic distinctiveness (NRI), where clustered NRI and even NRI are statistically phylogenetically significant (p < 0.05); (d) Beach scrubs; (e) IBRA Bioregion; (f) Rainfall category, where mean annual rainfall records are categorised: 1—Very Low is 600–800 mm; 2—Low is 801–1000 mm; 3—Low-Medium is 1001–1200 mm; 4—Medium is 1201–1400 mm; 5—Medium-High is 1401–1600 mm; 6—High is 1601–2000 mm; 7—Very High is 2001–3060 mm. Some patterns of interest are emphasised by ellipses.
Diversity 15 00378 g006
Figure 7. Map of study area showing Central Queensland Coast (CQC) rainforest distribution; distribution of phylogenetically even and clustered study plots [81]. The dry barriers of the Burdekin and St. Lawrence Gaps; Subregions of Herbert (7.1); Paluma–Seaview (7.5); Whitsunday (8.1); Proserpine–Sarina Lowlands (8.2); Clark–Connors Ranges (8.3); Byfield (8.4); Manifold (8.5); Debella (8.6); Broken River (9.4); Townsville Plains (11.1); Bogie River Hills (11.2); Marlborough Plains (11.14) and Boomer Range (11.17) are indicated. Inset: Map of distribution of Queensland rainforest estate, study area circled [33].
Diversity 15 00378 g007
Figure 8. Central Queensland Coast (CQC) rainforest phylogeny based on DNA barcode sequences from 996 species, created with the online tool, iTOL, v5 [88]. (a) Pooled species composition of REs within the study area grouped into geographical locations that correspond to accepted dry barriers: REs north of Burdekin Gap (North of BGap); REs within the Burdekin Gap (BGap); REs between the Burdekin and St. Lawrence Gaps (Central); REs within the St. Lawrence Gap (SLGap); REs south of the St. Lawrence Gap (South of SLGap). Groups are indicated by coloured bars at the species tips. (b) Cluster analysis of groupings corresponding to dry barriers by species composition using Bray–Curtis distance matrix of pooled species presence/absence.
Diversity 15 00378 g008
Table 1. Summary of phylogenetic diversity (PD) and families present in the phylogeny recorded from the rainforest communities of Central Queensland Coast (CQC) or Southeast Queensland (SEQ).
RegionPDSRGRFRDistinctive FamiliesFamily Distribution
CQC*H 18,118870467127Balanopaceae CQC, Northern QLD
CochlospermaceaeNorthern Australia, NG
ConnaraceaeCQC; FNQ
MaesaceaeCQC, FNQ, NG, Malesia, Melanesia
OpiliaceaeNorthern Australia, NG, Malesia
SphenostemonaceaeCQC, FNQ
SEQ*L 15,228759388117AkaniaceaeSEQ, NSW
AphanopetalaceaeSEQ, NSW
BerberidopsidaceaeSEQ, NSW
LuzuriagaceaeSEQ, NSW
NothofagaceaeSEQ, NSW, VIC, TAS
PetermanniaceaeSEQ, NSW
For each region, phylogenetic diversity (PD); species richness (SR); genus richness (GR) and family richness (FR) are shown. Significantly different to random values are indicated (* p < 0.05). H Indicates higher than expected. L Indicates lower than expected. Regions of family distribution are given: Central Queensland Coast (CQC); Southeast Queensland (SEQ); Queensland (QLD); Far North Queensland (FNQ); New South Wales (NSW); Victoria (VIC); Tasmania (TAS) and New Guinea (NG).
Table 2. Summary of CQC and SEQ Subregion diversity based on plot species data.
Subregion
ID
IBRA SubregionIBRA
Bioregion
SRPDMPDNRIMNTDNTINo.
Plots
No.
REs
8.1WhitsundayCMC53514,018206.50.8531.4*E −2.2316716
8.3Clarke–Connors RangesCMC55513,544208.6−0.0627.70.1911016
8.2Proserpine–Sarina LowlandsCMC42211,965205.21.1934.4−1.346710
11.14Marlborough PlainsBBN39511,571208.6−0.0133.10.064912
11.1Townsville PlainsBBN36710,970208.20.0536.7−1.194110
8.5ManifoldCMC2599437218.5*E −2.4842.8−0.76357
8.4ByfieldCMC2729353217.3*E −2.2239.40.12238
11.2Bogie River HillsCMC2628624203.01.3739.30.43157
7.5Paluma–SeaviewWET2528477213.9−1.2939.10.81168
8.6DebellaCMC1105393215.4−1.0366.2−0.9282
9.4Broken RiverEIU1025018203.80.6960.80.3141
7.1HerbertWET944561223.3*E −2.0760.30.6533
11.17Boomer RangeBBS904648184.7*C 3.3869.3−0.5432
11.12Nebo–Connors RangesBBN643496181.5*C 3.1673.40.3211
12.3Burringbar–Conondale RangesSEQ46011,756206.60.6929.01.0813517
12.1Scenic RimSEQ47811,572205.80.9926.5*C 2.445512
12.4Sunshine Coast–Gold Coast LowlandsSEQ44111,442213.0*E −1.7129.01.434616
12.1Burnett–Curtis Hills and RangesSEQ43610,906208.30.0526.9*C 2.817521
12.7Gympie BlockSEQ40210,318207.70.2528.4*C 2.415814
11.18Mount Morgan RangesBBS2888859199.2*C 2.5434.61.653912
12.5Brisbane–Barambah VolcanicsSEQ2998472200.2*C 2.3230.8*C 3.053312
11.22Banana–Auburn RangesBBS1846506189.5*C 3.8844.90.77127
12.8Burnett–Curtis Coastal LowlandsSEQ2557798203.71.1435.5*C 2.07137
12.6South BurnettSEQ2397526197.6*C 2.7034.4*C 2.93449
12.9Great SandySEQ2097266223.5*E −3.2537.8*C 2.204710
12.2Moreton BasinSEQ1225234190.9*C 2.8255.10.5532
11.19Callide Creek DownsBBS1134836190.6*C 2.8454.50.8382
11.27BarakulaBBS1064547185.3*C 3.5152.31.4921
11.31Eastern Darling DownsBBS933946186.3*C 3.1146.2*C 2.8222
Mean 8347203.7 42.0
(Stdv) (3033)(11.3) (13.5)
CSEQTotal 122721,244
E indicates significant taxonomic evenness (less closely related than random); C indicates significant taxonomic clustering (more closely related than random). Significant values are indicated (* p < 0.05). Phylogenetic diversity (PD); genus richness (GR); family richness (FR); species richness (SR); mean pairwise distance (MPD); mean nearest taxon distance (MNTD); net relatedness index (NRI); nearest taxon index (NTI); number of plots (No. Plots); number of REs within the geographical group (No. REs). IBRA Bioregions: Brigalow Belt North (BBN); Brigalow Belt South (BBS); Central Mackay Coast (CMC); Einasleigh Uplands (EIU); Southeast Queensland (SEQ); Wet Tropics (WET). CSEQ is the combined Central and Southeast Queensland rainforest community. The number of REs containing “rainforest” or rainforest elements is shown.
Table 3. Summary of the CQC rainforest Subregion diversity based on pooled species data.
Subregion IDIBRA SubregionPDGRFRSRMPDNRIMNTDNTIRainfall (mm)
7.1Herbert4574754288220.3−1.7371.1−0.371224 (184)
7.5Paluma–Seaview10,973250130389214.9*E −2.2531.6*C 2.071600 (354)
8.1Whitsunday15,310370114616207.30.6929.8−1.391707 (305)
8.2Proserpine–Sarina Lowlands14,089351113527205.81.2733.2*E −2.041435 (258)
8.3Clark–Connors Ranges14,891368117617209.1−0.3227.90.331506 (277)
8.4Byfield10,52923086330214.5*E −1.9136.90.531201 (117)
8.5Manifold11,34025698363214.1*E −1.9236.6−0.141161 (157)
8.6Debella824017569228205.70.7444.50.251260 (97)
9.4Broken River763016770199202.81.4448.1−0.011594 (199)
11.1Townsville Plains13,250314107468206.70.8234.6−1.541223 (231)
11.14Marlborough Plains10,23923681336199.9*C 2.8438.3−0.261049 (197)
11.17Boomer Range1870281932173.8*C 2.8369.8*C 2.35839 (24)
11.2Bogie River Hills12,05228497422202.8*C 2.2334.2−0.22972 (100)
TotalCQC19,916525146996
E indicates significant taxonomic evenness (less closely related than random); C indicates significant taxonomic clustering (more closely related than random). Phylogenetic diversity (PD); genus richness (GR); family richness (FR); species richness (SR); mean pairwise distance (MPD); mean nearest taxon distance (MNTD); net relatedness index (NRI); nearest taxon index (NTI). Significant values are indicated (* p < 0.05). Rainfall (mm) is annual rainfall.
Table 4. Summary of the mean values of significantly different (p < 0.05) Central Queensland coastal rainforest diversity and geological characteristics of Subregions, based on plot species data and grouped by dominant rock type.
Subregion IDDominant RockGeological Period~MaSR Mean (STDv)FR Mean (STDv)PD Mean (STDv)NRI Mean (STDv)NTI Mean (STDv)
8.3* Volcanic/Sedimentary (VS)Early Permian (EP)273–299104 (8)FC;GT;GP50 (5)GR;GP5017 (193)FC;GT;GR;GP−0.18 (1.16)−0.28 (0.14)
8.3* Mafites (MC)Early Carboniferous (EA)323–35963 (19)39 (10)GR3497 (774)−0.57 (0.45)0.64 (0.28)
8.3* Volcanics (VP)GREarly Permian (EP)273–29960 (18)GR37 (8)GR3425 (744)GR0.46 (0.99)0.12 (0.61)
8.1; 8.2* Mafites/Felsites (MF)Early Permian (EP)273–29961 (19)FM;FC;GR;GL;GT35 (7)FM;FC;GR;GL3366 (757)FM;FC;GR;GL;GT0.83 (1.06)GC0.52 (0.88)
8.4; 11.14* Granitoid (GL)Late Permian (LP)252–25955 (14)FC35 (7)FC3295 (659)FC−0.94 (1.38)−0.14 (1.10)
8.1; 8.3* Sedimentary (SQ)Quaternary (Q)0–2.656 (20)GR33 (8)GL3174 (790)GR;GC0.82 (1.11)0.30 (0.96)
8.2; 8.3; 11.14Felsites (FE)Late Permian (LP)273–29951 (16)33 (9)3107 (755)0.06 (0.96)−0.19 (0.92)
8.3; 11.2Basalt (BT)Tertiary (T)2.6–6651 (16)31 (10)2994 (720)−0.41 (1.25)0.45 (0.71)
8.2; 8.3; 11.1; 11.2; 7.5* Granitoid (GC)* Carboniferous–Cretaceous (CC)101–32354 (19)FM;FC33 (9)FC2946 (753)−1.19 (0.67)CQ;EQ;G1.04 (1.25)EP;Q;EC;LP;MP;P
11.14* Ultramafic Rock (UN)Neoproterozoic–Early Palaeozoic (NP)485–100048 (8)29 (6)2850 (489)*C 2.33 (0.34) GC0.41 (0.37)
7.1; 8.1; 8.2; 8.4; 8.5; 11.1; 11.14Alluvium (AQ)Quaternary (Q)0–2.644 (19)28 (8)2735 (756)−0.23 (1.26)0.34 (0.74)
8.1; 8.2; 8.3; 8.6* Volcanic/Sedimentary (VR)Early Cretaceous (EC)66–10145 (22)GR;GP;MF28 (11)GR2693 (972)GR;GP0.18 (1.06)GC;SL0.43 (0.99)
8.1; 8.2; 8.4; 8.5; 11.14Colluvium (CQ)Quaternary (Q)0–2.643 (12)29 (7)2658 (564)0.36 (1.04)0.54 (0.55)
8.1* Volcanic/Sedimentary (VA)Early Carboniferous (CA)323–35947 (9)26 (4)2646 (368)1.02 (0.88)GC1.35 (0.67)
8.2Gabbroid (G)Early Cretaceous (EC)66–10143 (5)27 (4)2633 (311)*C 2.05 (0.32)0.48 (0.76)
11.1; 11.2; 11.14; 8.3Granitoid (GE)Early Permian (EP)273–29942 (25)27 (13)2626 (114)−0.27 (1.59)0.09 (1.11)
8.1; 8.2; 11.1; 11.2; 11.14* Sand (SL) Late Quaternary (LQ)0–0.0142 (18)27 (9)2556 (816)1.45 (0.86)AQ;BT;GC;FM;GE0.63 (0.84)
8.2; 11.14Estuarine (EQ)Late Quaternary (LQ)0–0.0143 (4)26 (2)2528 (206)*C 2.21 (0.79)0.93 (0.52)
8.5; 11.14* Sand (SE)Early Quaternary (LQ)0.01–2.630 (7)MC24 (6)2200 (408)MF−0.58 (0.68)SL−0.01 (0.95)
8.5; 11.14Felsites (FM)Early Mid Permian (MP)259–29934 (27)23 (13)2198 (118)−0.34 (1.29)0.16 (0.86)
8.2* Volcanic/Sedimentary (VT)Mid-Tertiary (MT)23–5628 (21)GC;MF19 (12)GC;MF1879 (107)MF0.44 (0.74)MF0.59 (0.74)
11.1; 8.3* Granitoid (GP)Permian (P)252–29924 (5)GC;GL;FE19 (3)GC;GL;FE1834 (275)GC;GL;FE0.22 (1.29)GC−0.07 (0.86)
8.6Granitoid (GT)Mid-Triassic (MR)237–24719 (5)18 (6)1554 (262)−0.09 (1.27)0.49 (0.57)
7.5Felsites (FC)Carboniferous (CA)229–35918 (4)15 (3)1512 (232)−0.33 (0.55)0.34 (0.84)
8.2; 8.3* Granitoid (GR)Early Cretaceous (EC)66–10113 (9)BT;FE;GC;GL11 (7)GL;GC;FE1171 (514)BT;FE;GC−0.01 (0.78)0.06 (0.51)
F 2.922 **
~Ma, million years; SR, species richness; FR, family richness; PD, phylogenetic diversity; NRI, net relatedness index; NTI, nearest taxon index. (*) indicates Kruskal–Wallis significant difference in mean values between dominant rock type and SR; FR; PD; NRI (p < 0.05). Codes of dominant rock types and geological period are given in parentheses. Subregion IDs: 7.1 is Herbert; 7.5 is Paluma–Seaview; 8.1 is Whitsunday; 8.2 is Proserpine–Sarina Lowlands; 8.3 is Clark–Connors Ranges; 8.4 is Byfield; 8.5 is Manifold; 8.6 is Debella; 11.1 is Townsville Plains; 11.14 is Marlborough Plains; 11.2 is Bogie River Hills. The results of Dunn–Bonferroni post hoc tests between dominant rock types and diversity measures indicated by superscript equivalent to codes in parentheses: AQ; BT; CQ; EQ; FC; FE; FM; G; GC; GE; GL; GP; GR; MC; MF; SE; SL; SQ; UN; VA; VR; VS; VT; VP. F values of one-way ANOVA are given (**, p < 0.001). The results of Tukey HSD post hoc test between geological period and NTI are indicated by superscript: EP; Q; EC; LP; MP; P. (*C) indicates taxa are more related than expected by chance (NRI; p < 0.05; clustered).
Table 5. Summary of the diversity for the pooled species composition of REs within the study area grouped into geographical location that corresponds to accepted dry barriers.
GroupPDSRGRFRMPDNRIMNTDNTINo. REs
Central Coast (Central)18,254833471133207.90.0724.9−1.5940
Burdekin Gap (BGap)15,302607376118205.51.3631.03*E −2.0613
North of BGap13,276519326114208.5−1.5327.31.1723
South of SLGap13,199466313108205.4*E −1.7229.10.0720
St Lawrence Gap (SLGap)10,27133823781208.3*C 2.8228.7−0.328
E indicates significant taxonomic evenness (less closely related than random); C indicates significant taxonomic clustering (more closely related than random); phylogenetic diversity (PD); genus richness (GR); family richness (FR); species richness (SR); mean pairwise distance (MPD); mean nearest taxon distance (MNTD); net relatedness index (NRI); nearest taxon index (NTI); number of REs within the geographical group (No. REs). Significant values are indicated (* p < 0.05).
Table 6. Summary of Subregion area of extent and protection according to rainforest RE pooled species data.
Subregion IDIBRA SubregionPreclear Area (Ha)Remnant Area (Ha)Preclear Rf Res (Ha)Remnant Rf Res (Ha)Preclear Rf PA (Ha)Remnant Rf PA (Ha)% Remnant Rf PA
9.4Broken River*H 3,309,590*H 3,222,74430,03629,127107510754
11.14Marlborough Plains1,179,472632,74934,15317,9536686655136
11.2Bogie River Hills1,054,241840,69522,60617,5513448338919
11.1Townsville Plains760,555525,99411,40210,7555668566853
8.3Clarke–Connors Ranges631,881542,056*H 134,461*H 122,310*H 78,396*H 77,82764
8.2Proserpine–Sarina Lowlands463,733156,34719,08812,2582593257821
7.5Paluma–Seaview233,751230,21556,32056,01552,21350,054*H 89
11.17Boomer Range220,54195,18735,48710,9193561350732
7.1Herbert219,426104,99512,60860331464145624
8.4Byfield127,034118,630796874861661146320
8.1Whitsunday88,50382,43050,73749,50942,35742,41186
8.6Debella80,85353,66499998916617418
8.5Manifold67,85063,2982585240736728112
Mean649,033513,00032,18826,40915,35815,11032
(Stdv)(848,487)(821,246)(33,878)(32,160)(24,360)(24,026)(23)
TotalCQC8,437,4306,669,006533,856442,232216,668214,440
Shown are Subregion predicted preclearing areas of extent (Preclear Area (Ha)), where Rf is rainforest; PA is protected area; REs are Regional Ecosystems; remnant area of extent as in 2017 (Remnant Area (Ha)); predicted preclearing area of extent of rainforest RE types (Ha); remnant area of extent of rainforest RE types as in 2017 (Ha); extent of predicted preclearing rainforest RE types within the PA estate (Ha); extent of remnant rainforest RE types within the PA estate (Ha); percent of remnant rainforest RE types within the PA estate (%Remnant Rf PA). (*H) indicates significantly higher than the mean (p < 0.05).
Disclaimer/Publisher’s Note: The statements, opinions and data contained in all publications are solely those of the individual author(s) and contributor(s) and not of MDPI and/or the editor(s). MDPI and/or the editor(s) disclaim responsibility for any injury to people or property resulting from any ideas, methods, instructions or products referred to in the content.

