Article

Integrative Phylogeography Reveals Conservation Priorities for the Giant Anteater Myrmecophaga tridactyla in Brazil

by
Raphael T. F. Coimbra
1,2,*,
Rafael F. Magalhães
3,4,
Priscila Lemes
5,
Flávia R. Miranda
4,6 and
Fabrício R. Santos
1,4,*
1
Programa de Pós-Graduação em Genética, Departamento de Genética, Ecologia e Evolução, Instituto de Ciências Biológicas, Universidade Federal de Minas Gerais, Belo Horizonte 31270-901, MG, Brazil
2
Institute for Ecology, Evolution and Diversity, Goethe University, 60439 Frankfurt am Main, Germany
3
Departamento de Ciências Naturais, Campus Dom Bosco, Universidade Federal de São João del-Rei, São João del-Rei 36301-160, MG, Brazil
4
Programa de Pós-Graduação em Zoologia, Departamento de Zoologia, Instituto de Ciências Biológicas, Universidade Federal de Minas Gerais, Belo Horizonte 31270-901, MG, Brazil
5
Laboratório de Ecologia e Biogeografia da Conservação, Departamento de Botânica e Ecologia, Instituto de Biociências, Universidade Federal do Mato Grosso, Cuiabá 78068-600, MT, Brazil
6
Departamento de Ciências Agrárias e Ambientais, Universidade Estadual de Santa Cruz, Ilhéus 45662-900, BA, Brazil
*
Authors to whom correspondence should be addressed.
Diversity 2022, 14(7), 542; https://doi.org/10.3390/d14070542
Submission received: 16 May 2022 / Revised: 24 June 2022 / Accepted: 1 July 2022 / Published: 5 July 2022
(This article belongs to the Special Issue Molecular Evolution and Conservation of Tropical Biodiversity)

Abstract

:
The giant anteater (Myrmecophaga tridactyla) is a strictly myrmecophagous xenarthran species that ranges from Honduras to northern Argentina, occupying various habitats, from grassland and floodplains to forests. According to the IUCN, it is a vulnerable species mainly threatened by poaching, habitat loss and fragmentation, and road kills. Here, we investigate the phylogeography, distribution, ecology, and historical demography of Brazilian populations of the giant anteater. We analysed two mitochondrial (mtDNA) and three nuclear (nDNA) markers in 106 individuals from the Cerrado, Pantanal, Atlantic Forest, and Amazon Forest biomes through analyses of population structure and demography, phylogeography, and ecological niche modelling. Two divergent mtDNA clusters were found, one in the Amazon (AM) and another in the Cerrado, Pantanal, and Atlantic Forest biomes (CEPTAF). At the population level, CEPTAF presented higher mtDNA haplotype richness than AM and a unidirectional mtDNA gene flow was identified from AM to CEPTAF, which could be linked to more favourable habitat conditions for the species in Cerrado and Pantanal. Paleodemographic reconstructions with mtDNA and nDNA data indicate a large population expansion of the species starting at the end of the Pleistocene. Finally, the integrative phylogeographic analyses of giant anteater populations reinforce the importance of the Brazilian Cerrado as a priority biome for the species’ conservation.

1. Introduction

Genetic-based information can be used to define priorities for conservation and management [1]. In this context, phylogeographic methods can be used to evaluate the response of species to past environmental changes, helping to foresee the conservation impact of future events [2,3]. In recent years, the integration of phylogeographic analyses and ecological niche modelling has increased the predictive power of these inferences and their usage in biodiversity conservation [4]. However, few conservation biology studies have evaluated the phylogeographic history of threatened species in Latin America so far [1]. This also holds true for many species of the Xenarthra, an ancient lineage of placental mammals that includes armadillos (Cingulata), anteaters (Vermilingua), and sloths (Folivora)—all quintessential species of the neotropical fauna [5].
Among the Xenarthra, the anteaters are highly specialized for myrmecophagy (i.e., feeding on ants or termites), with morphological adaptations reflecting this feeding habit, such as the complete absence of teeth and the presence of an elongated protractile tongue [6,7]. The giant anteater (Myrmecophaga tridactyla) is the largest anteater species and currently ranges from Honduras southwards to northern Argentina [8,9], occupying various habitats, such as grasslands, floodplains, and forests [10,11]. Foraging anteaters are usually observed in grasslands or shrub savannahs, whereas covered habitats, such as forest patches and shrubs, are used for resting, temperature buffering, and protection against predators [12,13]. The abundance of food resources accessible at the ground level is higher in dry open biomes, such as the Chaco and the Cerrado, compared to moist forests; thus, dry open biomes should potentially support a higher abundance of giant anteaters [14]. Moreover, M. tridactyla seems to benefit from heterogeneous landscapes, as observed in the Cerrado and Pantanal of Brazil, or the Llanos of Venezuela and Colombia [13,14,15].
There is a limited number of studies on the phylogeography and population genetics of anteaters in the Neotropics, and only half-a-dozen such studies have been reported for the giant anteater [5,16,17,18,19,20]. According to Clozato et al. [18], the species shows a high overall genetic diversity and signs of population expansion in the Brazilian Cerrado, but some studies have found evidence of moderate diversity, local inbreeding, and demographic reduction in certain populations [17,20]. This indicates the need for a better picture of the species’ population dynamics. Clozato et al. [18] suggested that the genetic structure of M. tridactyla may be related to the vegetative landscape, with populations differentiated according to their habitats—i.e., forests or savannahs/grasslands. This raises questions regarding the level of isolation between those populations and the extent to which the current species’ distribution and population structure are influenced by either the vegetative landscape or past climatic history.
Concerning its conservation, M. tridactyla seems to tolerate a certain level of human impact, such as cattle ranching and moderate fires [21]. Likewise, habitat fragmentation does not seem to affect the abundance and probability of occupancy of giant anteaters in the Cerrado of central Brazil [22]. However, the species tends to avoid heavily disturbed areas in which the presence of humans, cattle, and dogs is high, and benefits from conserved forest vegetation in non-preferred areas [23,24]. Poaching [25,26,27], habitat loss [28,29,30], wildfires [31], and road kills [32,33,34] pose a constant threat to M. tridactyla over much of its range and are thought to be the main causes of its recent population decline [8]. Furthermore, the species has likely become extinct in Belize, El Salvador, Guatemala, Uruguay, and the Brazilian states of Espírito Santo, Rio de Janeiro, Rio Grande do Sul, and Santa Catarina [8]. For these reasons, the giant anteater is considered ‘vulnerable’ by the International Union for Conservation of Nature (IUCN) [8] and appears in Appendix II of the Convention on International Trade in Endangered Species of Wild Fauna and Flora (CITES) (http://www.cites.org (accessed on 15 May 2022)).
Predictions of species’ niche distributions are frequently derived from Ecological Niche Modelling (ENM) [35]. In general, species spatial distribution records are associated with environmental data to characterize the conditions experienced by species and to predict their potential geographic distribution during the baseline period [36]. By assuming niche conservatism within the current climate conditions, areas of climatic stability for species may play a fundamental role in protecting species diversity in the future [37,38]. Identifying such areas helps to protect the current biodiversity from possible shifts in species distributions that are to be expected due to global warming [39].
To understand how the evolutionary history of giant anteater populations in Brazil is linked to their current distribution and to identify priority areas for conservation, we used an integrative framework of phylogeographic analyses and ecological niche modelling [4]. Our initial hypothesis was that the geographic distribution and demographic history of M. tridactyla were shaped by the environment and influenced by the Quaternary climatic oscillations. If this hypothesis is correct, the spatial genetic structure and diversity of populations can be explained by environmental factors, such as vegetation cover and local climate [18], being additionally affected by periods of isolation in climatic refugia during the Quaternary [40]. Additionally, biased dispersal and/or limited gene flow between populations in distinct environments are also expected [41]. Testing this hypothesis will provide valuable information on both the evolutionary history and conservation of the giant anteater—a vulnerable and still poorly known species.

2. Materials and Methods

2.1. Biological Samples, DNA Data Obtention and Processing

We used DNA samples from 69 individuals of M. tridactyla also used by Clozato et al. [18] and added 28 new tissue samples. These were mainly muscle, blood, skin, or hair samples from road-killed animals and museum specimens, but a few were originally derived from wild and captive individuals of known origin, all previously deposited in the tissue collection of the Centro de Coleções Taxonômicas of the Universidade Federal de Minas Gerais (UFMG) in Belo Horizonte, Brazil. Samples of road-killed animals were collected under SISBIO permits #13381 and #53798-4. In total, we analysed genetic data for 106 individuals representing the Brazilian biomes of Cerrado (CE; n = 78), Pantanal (PT; n = 11), Atlantic Forest (AF; n = 8), and Amazon Forest (AM; n = 9). The AM data comprised only mtDNA sequences published in Clozato et al. [18] and an additional French Guiana specimen retrieved from GenBank (accession KT818549). Details on sampling localities are presented in Figure 1 and Supplementary Table S1.
DNA was isolated from tissue samples preserved in 70% ethanol by standard phenol-chloroform extraction and concentrations were measured in a NanoDrop 2000 (Thermo Fisher Scientific, Waltham, MA, USA). For data compatibility with Clozato et al. [18], we sequenced the same set of DNA loci, namely, the hypervariable region I (HVI; which also included both tRNAThr and tRNAPro) and Cytochrome b (Cytb) mtDNA markers and the recombination-activating 2 (RAG2) gene. Cytb and RAG2 sequences published in Clozato et al. [18] were included in our dataset. We also added two new nuclear (nDNA) markers: exon 28 of the von Willebrand factor (VWF) gene and the brain-derived neurotrophic factor (BDNF) gene. Primers used for amplification and sequencing are presented in Supplementary Table S2. PCR conditions varied between samples as follows: a final volume of 15 or 25 μL containing 20–100 ng of template DNA, 1× reaction buffer, 1.5 or 3.0 mM MgCl2, 100 μM dNTPs, 0.2 μM of each primer, 0.5 mg/mL of BSA adjuvant, and 0.2 or 0.3 U of Platinum® Taq DNA Polymerase. Thermocycler programs started with 3 min at 95 °C; followed by 35 cycles of 30 s at 95 °C for denaturation, 45 s at 52 °C (HVI and Cytb), 57 °C (RAG2 and VWF) or 49 °C (BDNF) for annealing; 1 min at 72 °C for extension; and 5 min at 72 °C. Adjustments to the primer annealing temperatures were necessary in some cases. PCR products were visualized in 1% agarose gel, purified through polyethylene glycol 20% precipitation and sequenced in an ABI 3130xl Genetic Analyzer (Applied Biosystems, Waltham, MA, USA).
Electropherograms were interpreted, assembled, and pre-aligned in SeqScape v2.6 (Applied Biosystems, Waltham, MA, USA). Consensus sequence alignments were constructed with ClustalW [42] implemented in MEGA7 [43], and haplotype phasing of nuclear markers in heterozygous individuals was accomplished with Seqphase [44] and Phase v2.1.1 [45,46]. To check for phasing consistency, we performed three independent runs for 1000 iterations for each marker with a phase threshold of 0.9.

2.2. Assessing Spatial Genetic Patterns and Gene Flow

Inference of genetic clusters was performed with Geneland v4.0.6 [47,48,49] using the concatenated mtDNA alignments (HVI + CytB). We used the spatially explicit uncorrelated allele frequencies model to detect the more pronounced population structure. We ran 20 independent MCMCs for 10,000,000 iterations, thinning each 1000, from which we chose the one with the highest value of average log posterior probability (PP). Uncertainty of coordinates was set to 0.36 (~40 km) to accommodate the largest estimates of the species’ home range [15,50] and the approximations of some geographic coordinates. The number of simulated populations varied from 1 to 10, the maximum rate of the Poisson process was set equal to the number of individuals, and the maximum number of nuclei was set to the triple of that [47].
Patterns of concatenated mtDNA diversity were assessed in Arlequin v3.5 [51] through an analysis of molecular variance (AMOVA) [52] and estimations of both haplotype (h) and nucleotide (π) diversities. Calculations were performed with the Kimura-2P distance method [53]. Integrated rarefaction and extrapolation (R/E) accumulation curves for haplotype richness were computed and plotted with iNEXT v2.0.12 [54,55] to compensate for the bias introduced by discrepant sample sizes between clusters in the results of genetic diversity analyses. Three types of curves—a sample size-based, a coverage-based, and a sample completeness curve—were constructed for a reference sample size equal to the number of individuals of the largest genetic cluster. We chose the largest cluster size as the reference to visualize possible trends in estimates of genetic diversity for the smaller cluster with increasing sample sizes. The 95% confidence interval (CI) for each asymptote was assessed through 1000 bootstrap replicates.
Haplotype networks of concatenated mtDNA and each nDNA marker were constructed in PopART v1.7 [56] using the median-joining algorithm [57]. Furthermore, a multiple regression on distance matrices (MRM) [58] was performed with ecodist v2.0.1 [59] to assess the relative roles of both geographic distance and environment (i.e., the same climatic variables used to construct the ecological niche models; see below) on the genetic structure of M. tridactyla. The dissimilarity matrices for genetic, geographic, and ecological data were generated using ape v5.1 [60] and vegan v2.4-6 [61]. Manhattan distances were used for both spatial and environmental explanatory data, whereas the Kimura-2P distance was used for the genetic data. Significance was assessed through 10,000 permutations.
We follow the rationale proposed by Magalhães et al. [62] of using phylogeographic model selection to validate the delimitation of populations by testing between scenarios of split populations versus a single cohesive population. Historical patterns of mtDNA gene flow for different migration models were estimated under a Bayesian coalescent framework in Migrate-n v3.6.11 [63]. For these analyses, we focused on the mtDNA due to the absence of nDNA sequences for AM individuals. Our models consisted of (1) a null hypothesis of a single panmictic population, (2) all possible migration scenarios between populations identified by Geneland, and (3) a model in which these populations were isolated (Table 1). We set an empirical transition/transversion ratio (RmtDNA = 2.44) calculated in MEGA7 with the GTR substitution model [64] and estimated the migration parameters in terms of mutation-scaled effective immigration rate M (m/μ) and mutation-scaled effective population sizes θ (Neμ). Initial runs with a full migration matrix model allowed us to set adequate parameter bounds. For the final runs, we assumed a uniform prior for θ (min. = 0, max. = 0.015, delta = 0.0015) and an exponential prior for M (min. = 0, mean = 1500, max. = 3500). All other parameters were left as default. Three parallel replicates were run for each model using a static heating scheme with 20 heated chains in which “temperatures” increased according to the program’s suggested range of values. For each run, we discarded 15,000 steps and recorded 150,000 with a sampling increment of 1000. Convergence was checked by unimodality of parameters’ posterior distributions and by assessing both effective sample sizes (ESS) and acceptance ratio values. Model selection was performed by comparing the marginal likelihood of each model, calculated through thermodynamic integration with cubic Bézier-spline approximation, by means of Bayes factors (BF) [65]. Analyses were run on the CIPRES Science Gateway v3.3 [66].

2.3. Historical Demography Reconstruction

To include a time scale in our demographic inference, we first conducted a molecular dating analysis using BEAST v2.4.5 [67] to estimate a reference clock rate for the partial Cytb sequences. For this, we included only unique Cytb haplotypes of M. tridactyla and the two Tamandua species (GenBank accession KT818551 and KT818552) as outgroups. We used the transition/transversion split option of the bModelTest package [68], a strict clock with a birth–death tree prior and a lognormal prior on the calibration (mean in real space = true, offset = 7.0, mean = 6.35, and standard deviation = 0.398). Hard minimum and soft maximum age constraints for the Myrmecophagidae node were based on the 95% CI (7.0–19.8 Ma) from Gibb et al. [69]. We ran three independent MCMCs for 50,000,000 generations, sampling each 5000, and checked trace files on Tracer v1.7 [70] to ensure chain convergence and good ESS values. Log files from all runs were combined with a 50% burn-in using LogCombiner from BEAST2 and the mean value of the “clockRate” parameter was recovered with Tracer. A maximum clade credibility (MCC) tree was summarized in TreeAnnotator from BEAST2 with a 33% burn-in. The MCC tree was visualized with FigTree v1.4.4 [71] and is shown in Supplementary Figure S1.
We proceeded with the historical demography reconstruction for M. tridactyla using the extended Bayesian skyline plot (EBSP) [72] and our complete dataset (mtDNA + nDNA) in BEAST2. Site and clock models were left unlinked, and trees were linked only for the mtDNA. The transition/transversion split option of bModelTest was used in combination with strict clocks for all loci. Time calibration was included as the Cytb clock rate estimated previously, whereas clock rates of other loci were estimated relative to that. The weights of the operators affecting the population function were increased by a factor of four to even out their frequency of proposals to that of the operators changing the trees during the MCMCs. Three independent MCMCs were run for 1,000,000,000 generations, sampling each 100,000, on CIPRES Science Gateway. We checked both convergence and ESS values on Tracer. EBSPs were plotted in R v3.4-patched [73] with a 10% burn-in.

2.4. Ecological Niche Models (ENMs)

We built ENMs for each observed genetic cluster separately [2,3]. Climate data were taken at 5 min spatial resolution from Hijmans et al. [74]. Following Terribile et al. [38], we used the same five bioclimatic variables (i.e., annual mean temperature, temperature annual range, precipitation of wettest month, precipitation of driest month, and precipitation of warmest quarter) to build our models in order to minimize collinearity problems among bioclimatic variables. We calibrated our models on current climate conditions (~1960–1990) and then projected on Last Glacial Maximum (LGM; 22 ka ago), Mid-Holocene (6 ka ago), and future (2070) climatic layers derived from two coupled General Circulation Models (GCMs): CCSM4 and MIROC-ESM. For future conditions, we used the intermediate representative concentration pathway (RCP4.5) simulated for the Fifth Assessment Report (AR5) of the International Panel on Climate Change (IPCC) [75], which corresponds to radiative forcing levels stabilizing at 4.5 W/m2 before 2100 by the employment of a range of technologies and strategies for reducing greenhouse gas emissions [76].
For each discriminate cluster of M. tridactyla, we combined the aspects of climate with occurrence records to define spatially explicit predictions about their environmental and geographical space [36]. We modelled the species distribution under an ensemble forecasting approach, which generates more accurate, or at least more conservative, projections [77]. Four modelling methods implemented in dismo v1.1-4 [78] were used to build the ENMs, including two distance methods based on presence records: Bioclim [79] and Gower distance [80]; and two machine-learning methods based on presence–background records: Support Vector Machines (SVM) [81] and Maximum Entropy (Maxent) [82]. All models were first generated for current climate conditions and then projected onto the LGM, the Mid-Holocene, and the future to predict the potential species geographical distributions in all climate periods.
We randomly divided all species occurrence records into 10 training–testing subsets (75:25 of the occurrence, respectively). Model performance was assessed by the area under the receiver-operating curve (AUC) and only models with AUC > 0.7 were used in the ensemble procedure [83]. For the population with few occurrence records, we used the leave-one-out method described as a variation of the k-fold partitioning method, on which jackknife sampling is imposed by excluding one record every time [84,85,86]. In summary, we applied the lowest presence threshold to test the ability to predict the deleted occurrences (k−1) for each prediction. If an ENM successfully predicts both a small area and the deleted occurrence record, it is better than a random model (p < 0.05). However, if the model predicts a large area and fails to predict the deleted occurrence record, it is not considered a good model (p > 0.05). Therefore, the p-value is calculated from the success and failure ratio of the prediction [84]. Only good models were used in the ensemble procedure. This threshold-dependent metric accounts for omission rates with a 10% calibration omission rate. The low omission rate informs a high proportion of test localities successfully predicted [84].
Our consensus model resulted in 80 binary maps (4 ENM algorithms × 2 GCMs × 10 cross-validations) for each period. For ENMs assessed by the jackknife method, the number of resultant suitability maps depended on population occurrence records (k). Here, we combined outputs weighted by their AUC scores (or p-values) [78]. To disentangle and map the uncertainties in hindcast/forecast ensembles, we performed a two-way ANOVA for each grid cell using suitability maps as response (ENM, GCM, and their interaction) [38]. The predictive maps combining ENMs and GCMs expressed the uncertainty about species geographical ranges.

3. Results

3.1. Sequencing and Haplotype Phasing

We sequenced both HVI (450 bp) and Cytb (534 bp) for all 28 new samples. However, nDNA loci exhibited lower amplification efficiency. RAG2 sequences were obtained for 21 specimens, but only 12 spanned the maximum length of the external primers (745 bp), while the other 9 were only amplified and sequenced with nested primers (481 bp). VWF (546 bp) was sequenced for 60 individuals, whereas BDNF (579 bp) was sequenced for 65 individuals. For AM specimens, only mtDNA sequences were available from Clozato et al. [18] and GenBank.
Phasing of nDNA haplotypes was consistent and only in the following cases were our initial standards not matched. RAG2 genotypes of four individuals (LabBMC0122, M0696, M1678, and SCMT04) could not be resolved at 0.9 phase threshold; therefore, we kept the allele combinations with the highest probability. The BDNF genotype of one individual (TBC013) could not be determined by any means due to two allele combinations with equal probabilities. In this case, we retained the ambiguous base symbol. Short RAG2 sequences and the ambiguous BDNF genotype were removed from the haplotype networks.

3.2. Spatial Patterns, Genetic Diversity Characterization, and Evidence for Unidirectional Gene Flow

The mtDNA network exhibited 33 closely related haplotypes (Figure 2A), mostly differing by a single mutation step, with total h = 0.7623 and π = 0.0021 (Table 2). We observed a largely predominant haplotype occurring mainly in the CE and some level of haplotype sharing between individuals from all biomes (Figure 2A). Moreover, AM haplotypes were clustered in the network, except for the one from French Guiana that was retrieved from GenBank, suggesting some degree of genetic structure. On the other hand, nDNA networks, which lacked AM representatives, did not show any geographic correlation, and many haplotypes were shared among the sampled biomes (Figure 2B–D). RAG2 presented 9 haplotypes, while VWF exhibited 10, and BDNF showed 5 haplotypes. Due to the high number of missing data and the absence of AM specimens among nDNA sequences, the remaining spatial analyses focused on mtDNA data.
Geneland results (Figure 3) agreed with the mtDNA network patterns and consistently indicated two clusters with the highest probability (Supplementary Figure S2), grouping AM individuals in one cluster, hereafter AM, and the remaining CE, PT, and AF individuals in another cluster, named CEPTAF. Consequently, we have genetic clusters with largely discrepant sample sizes: 9 for AM and 97 for CEPTAF. PP values for cluster membership were >0.7 for CEPTAF and mostly >0.9 for AM, with only one AM individual (M0705), geographically intermediate between the two clusters, showing PP = 0.56 for the latter group. The AMOVA showed a ΦST = 0.3275 and we follow Meirmans [87] in not reporting its p-value, since it would be meaningless due to the non-independence of data. Furthermore, CEPTAF presented h = 0.7204 and π = 0.0019, whereas AM had h = 0.8889 and π = 0.0027 (Table 2).
The sample size-based R/E curve (Figure 4A) showed that, for estimated sample sizes <20 individuals, the haplotype richness is expected to be higher for AM. However, after that point, the AM curve starts to plateau, while it continues to grow for CEPTAF. Hence, we expect that, for larger sample sizes, the haplotype richness will be higher for CEPTAF. Nonetheless, the extrapolated asymptote for AM presented a large 95% CI, illustrating the difficulties imposed by its small sample size. The sample completeness R/E curve (Figure 4B) indicated that our estimated current sample coverage for AM haplotypes was ~58%, whereas for CEPTAF it was ~83%. Although the 95% CI was also large, the expected number of samples needed for AM to achieve the same level of coverage of CEPTAF would be around 25, which contrasted with our current sampling. The coverage-based R/E curve (Figure 4C), which integrates the two previous curves, evidenced that increasing sample coverage beyond 50% greatly increased haplotype richness for CEPTAF. Despite that, a continued increase in sample coverage for AM would result in a much less pronounced gain in that index. Moreover, considering the 95% CI, significant differences in haplotype richness between the two clusters are expected to arise for sample coverages >65%, with CEPTAF showcasing higher values than AM, in contrast with the observed diversity metrics.
Finally, the MRM revealed a slight positive correlation between genetic and both geographic (1.098 × 10⁻⁴, p = 0.001) and environmental distances (2.798 × 10⁻⁶, p = 0.008), with R2 = 0.0907 (p = 0.001) and F = 277.507 (p = 0.001). In short, although the null hypothesis of genetic distances explained by chance was discarded, both isolation by distance and isolation by environment explained little of the observed genetic structure.
Parameter estimates generally overlapped in alternative migration models (Supplementary Table S3). The exception was θAM for the isolated populations model, which explored values closer to zero possibly due to an uninformative amount of data imposed by the small sample size of that population. In the scenarios that considered migration, mtDNA gene flow was higher from AM to CEPTAF. Assuming an equal a priori probability of 20% for each of the five models tested in Migrate-n and considering that probability as a threshold for rejecting competing hypotheses through Bayes factors comparison, we could discard four scenarios (Table 1). The best-fit migration model was the one that considered two separate populations with mtDNA gene flow from AM to CEPTAF (PP = 0.8476; Table 1). For this model, we had mode values of θAM = 0.00086, θCEPTAF = 0.00345, and MAMCEPTAF = 1368.5 (Supplementary Table S3), which translated into an effective number of migrants per generation (Nm) of 1.177 from AM to CEPTAF, through the equation Nm = θM.

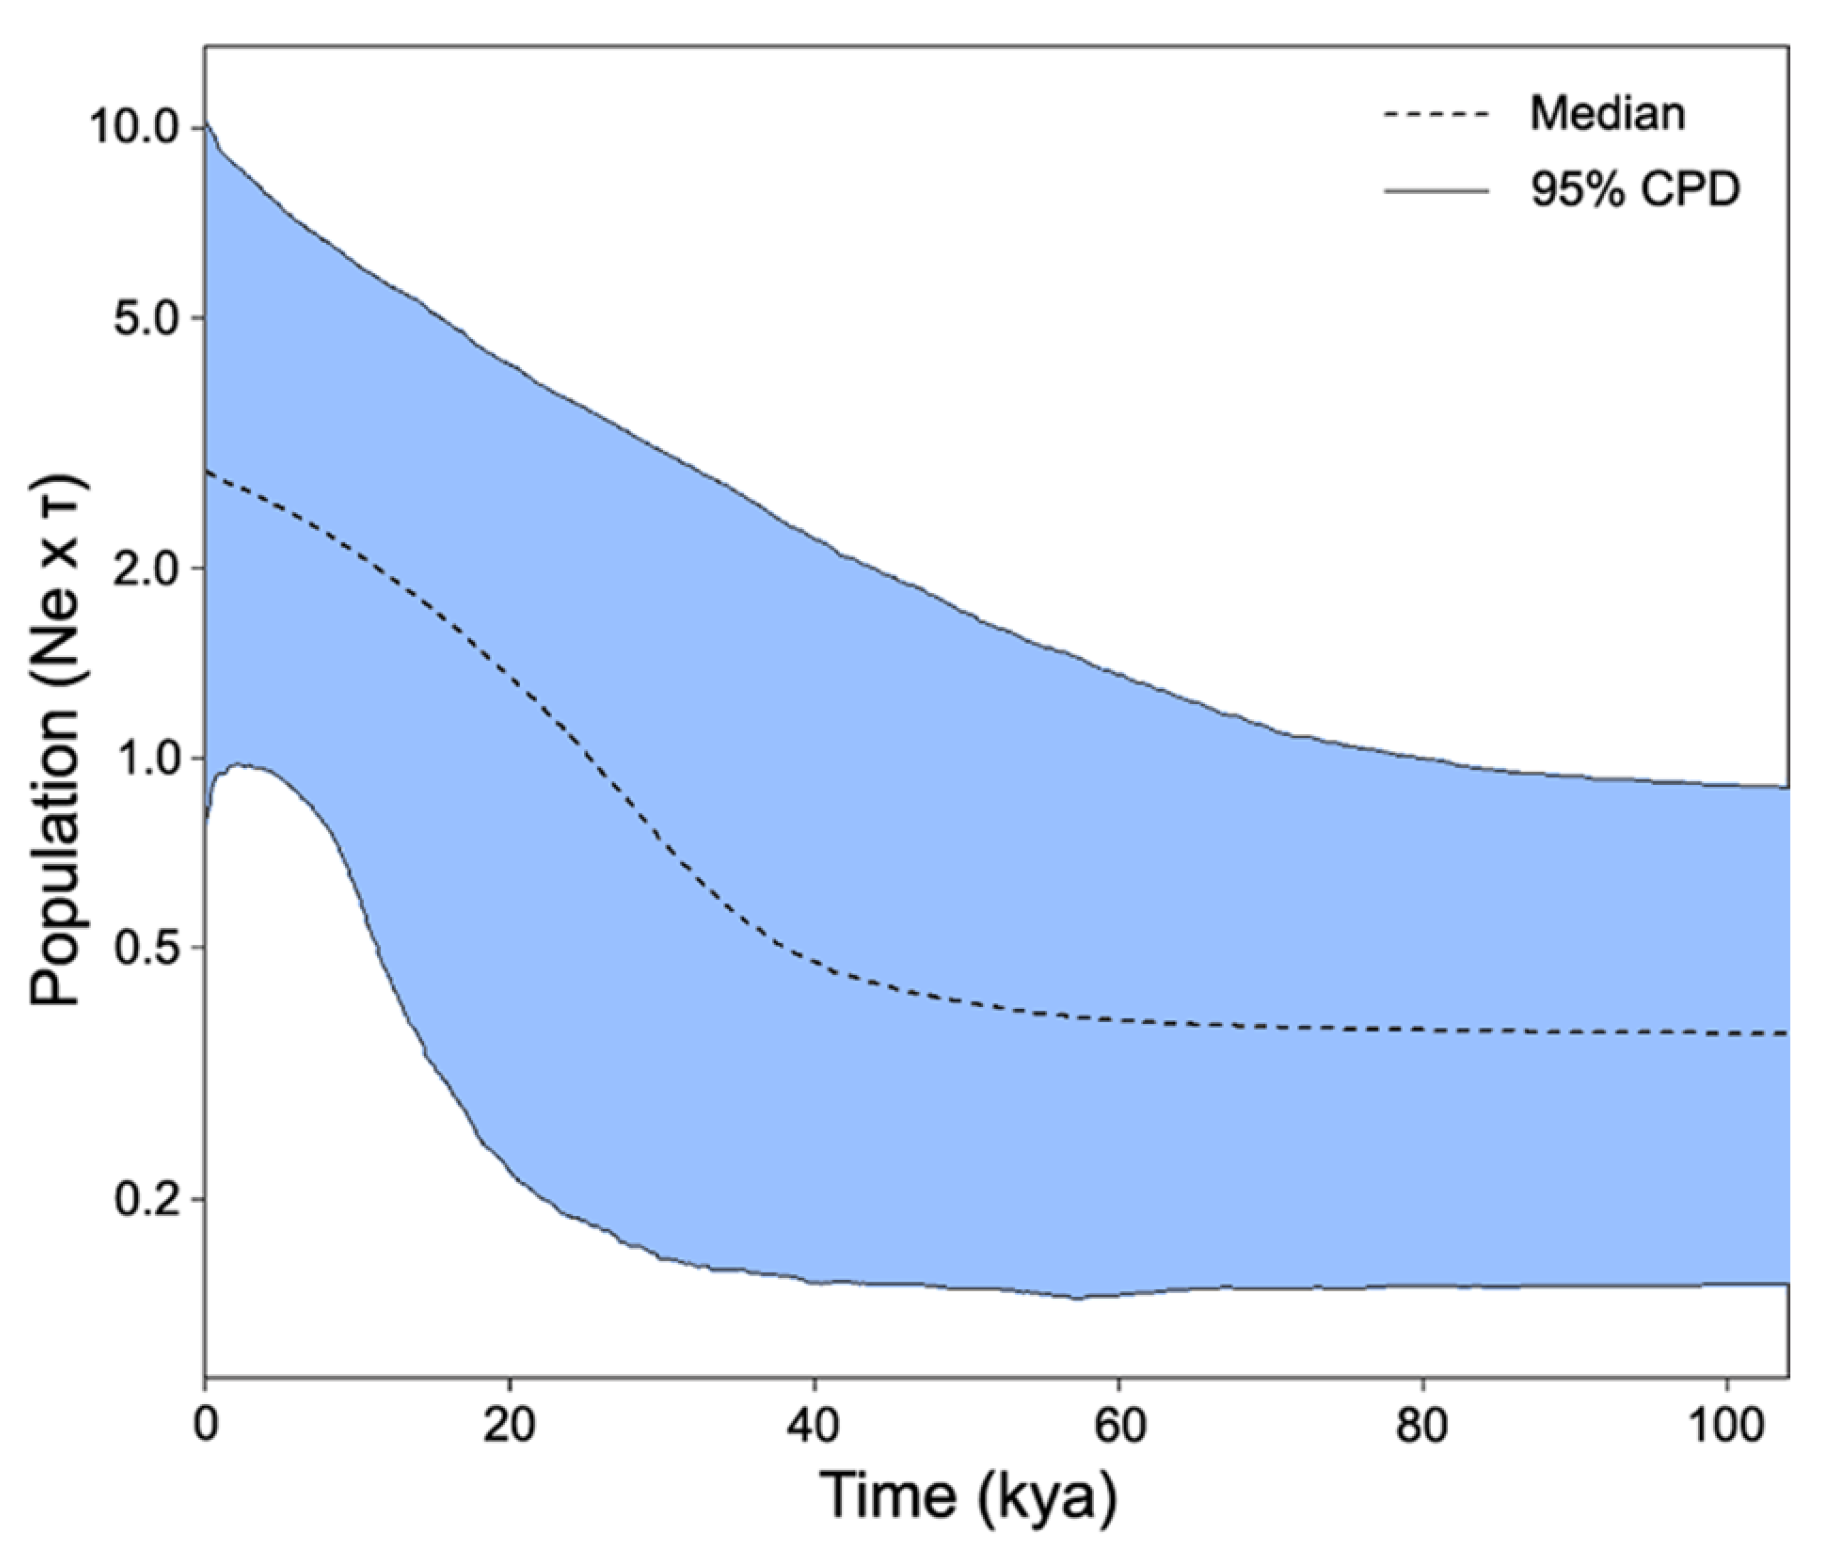
3.3. Historical Population Expansion
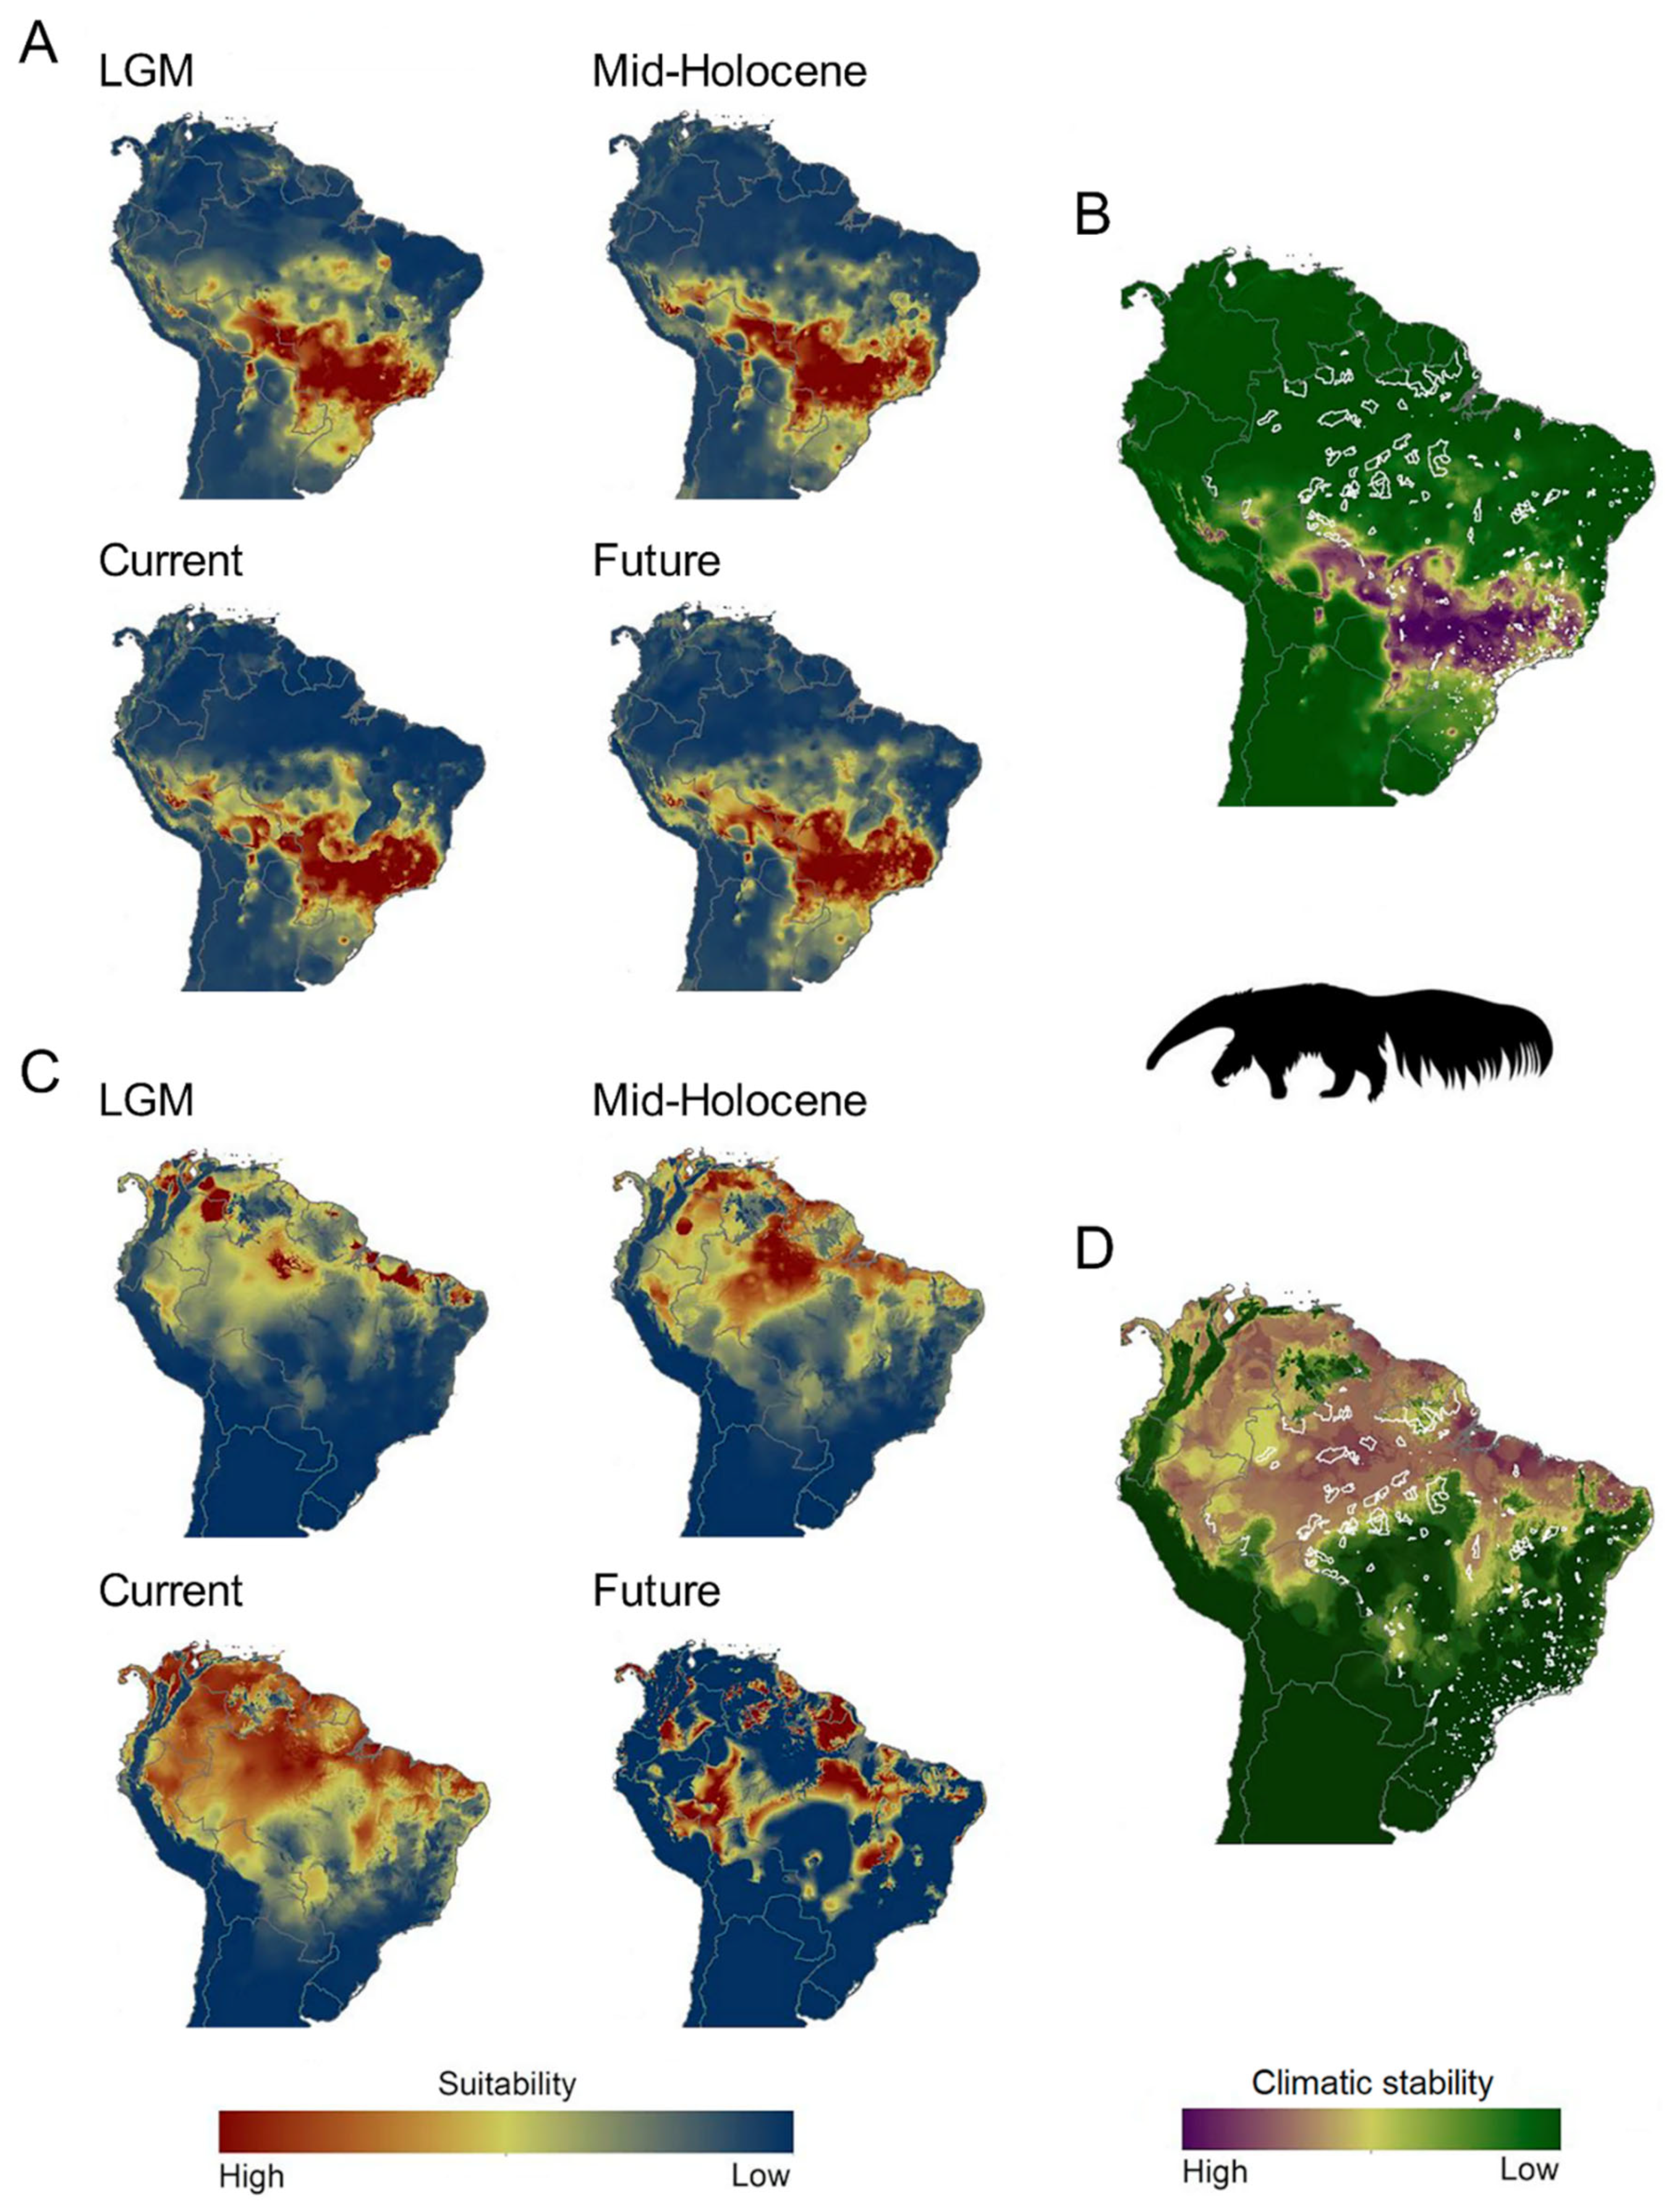
Both the mtDNA (Figure 2A) and RAG2 (Figure 2D) phylogeographic networks displayed a star-shaped pattern, with a common haplotype originating various low-frequency and closely related haplotypes, suggesting recent population expansion. Furthermore, the molecular dating of unique Cytb haplotypes resulted in a clock rate of 7.4513 × 10⁻³ substitutions/site/million years, which was used to produce a time-scaled EBSP with all markers for the whole species (Figure 5). The plot revealed a population growth that started slowly ca. 60 ka ago and largely increased since ca. 40 ka ago, reaching a present effective population size (Neτ) much larger than the size of the original population when considering the graph’s median. As population structure can affect the outputs of demographic inferences [88,89], we repeated the analysis without the samples from AM; however, the result did not change (Supplementary Figure S3).

3.4. ENMs

Mapping the species distribution across time has shown climatic stability differences between AM and CEPTAF. Consensus models for CEPTAF performed moderately well (AUCmean = 0.894; Supplementary Table S4), probably due to the large number of presence points used [90]. The ANOVA indicated that the ENM component had the highest median proportion (84.3%; Supplementary Table S5) and amplitude (14.1–99.8%) of the total sum of squares (SS), in comparison with other components (i.e., GCMs, ENM × GCM interaction, and time). These uncertainties are geographically distributed (Supplementary Figure S4).
Since AM had few occurrence records, we built a consensus result from good models (p < 0.05; Supplementary Table S6). Modest local changes were identified in the distribution of CEPTAF since the LGM (Figure 6A). While CEPTAF appears more stable over time (Figure 6B), AM has expanded since the LGM until current climate conditions (Figure 6C) and some connectivity is apparent in northeastern Brazil through all time periods (Figure 6D). The projection of the consensus model to future conditions results in a considerable contraction and fragmentation of AM, with high climatic suitability in the border areas of dry forests and savannahs (Figure 6C). However, the network of protected areas (PAs) fails due to the lack of coverage in the most climatically stable areas or because they are very small in such areas (Figure 6B,D).

4. Discussion

We assessed the geographic patterns of genetic diversity, gene flow dynamics, and ancestral demography of the giant anteater and modelled the distributional changes of its populations across time, shedding some light on the species’ natural history and the status of its populations. The clustering analysis indicated two main genetically distinct clusters in M. tridactyla: one corresponding to individuals from the AM biome, AM; and another equivalent to individuals from the CE, PT, and AF biomes, CEPTAF. Such spatial configuration could be misleading if it were a consequence of the large sampling gap between the north of AM and CE/PT. In that case, we would have captured two extremes of a cline of allele frequencies in a scenario of isolation by distance. However, besides the weak correlation between geographic and genetic distances demonstrated in the MRM, the mtDNA phylogeographic network has also displayed a clustering of AM haplotypes, supporting the AM–CEPTAF spatial structure. Additionally, the scenario of a single panmictic population was discarded as one of the less likely models in the Migrate-n model selection. Taken together, these mtDNA results reinforce the presence of population structure in M. tridactyla, which seem to reflect environmental differences between the occurrence areas of each genetic cluster: AM inhabits a forested biome and CEPTAF occurs in mostly open vegetation biomes. However, because environmental (i.e., climate) and genetic distances presented a weak correlation, landscape elements and evolutionary history could both be responsible for the observed pattern of differentiation.
The observed ΦST for such population structuring was slightly smaller than that obtained by Clozato et al. [18], but still moderate when compared to other phylogenetically or ecologically related species. For instance, the giant anteater showed a ΦST higher than that reported for the screaming hairy armadillo [92]; however, it was much lower than those presented by arboreal xenarthran species, such as the maned sloth [93,94] and the silky anteater [95], the latter having been recently split into seven distinct species [96]. Similar ΦST estimates were also found for incompletely isolated phylogeographic partitions of the jaguar [97]. This finding is not surprising, as we expect M. tridactyla to have great dispersal abilities because its home range can be quite large (up to 32.50 ± 7.64 km2 [15]; see also [13,21,50,98]). Furthermore, the giant anteater’s overall h and π for the mtDNA were lower than those observed for non-threatened species, such as the nine-banded armadillo [99] and the jaguar [97]. Nevertheless, the obtained h was higher than that found for the similarly vulnerable maned sloth, whereas π was slightly lower [93,94]. In this case, the widespread distribution and the ecological versatility of the giant anteater may still be enough to secure moderate levels of diversity (h), even given the decreasing population numbers—a situation that does not hold for the maned sloth, which has a highly fragmented and restricted range in the AF [93,94].
When comparing the two genetic clusters of M. tridactyla, AM showed higher h and π values than those estimated for CEPTAF and for the overall species. This result may be likely overestimated, since the R/E curves of haplotype richness for AM suggest that, although our sampling for this cluster was small, increasing the sample coverage would result in only a limited gain in richness. On the other hand, CEPTAF exhibited h and π values close to the overall obtained for the species and could be even more diverse according to its R/E curves, which still showed signs of haplotype richness increase with larger sample coverage. One possible explanation for this observation would be that AM may have a population size much smaller than CEPTAF—a hypothesis that is also supported by the ϴ values estimated for each cluster in Migrate-n.
Clozato et al. [18] suggested a past connection between giant anteater populations from AM and AF due to haplotype sharing. Accordingly, we also observed a certain level of haplotype sharing between CE, AM, and AF in the mtDNA network. Furthermore, our migration model selection indicated mtDNA gene flow from AM to CEPTAF. Therefore, the Migrate-n results may also reflect the species’ ecological characteristics, considering M. tridactyla’s preference for heterogeneous landscapes, such as the savannahs of the CE [13,14,15], which can also be associated with food availability and/or accessibility discrepancies between open environments and moist forests [14]. Accordingly, Quiroga et al. [14] found that M. tridactyla is more frequently recorded in dry forests and grassland savannahs than in moist forests. The giant anteater was suggested to achieve its highest densities in the CE [100], but detailed population density studies are only available for a small number of sites [21,31,101], all of which have predominantly savannah-like vegetation containing a few forest fragments, which hinders fair comparisons.
Although current giant anteater numbers are thought to be declining [8], the species seems to have experienced a large population expansion in the recent past, beginning ca. 40–60 ka ago. Additionally, both mtDNA and RAG2 networks show signs of recent expansion, with various singletons and rare haplotypes derived from a much more frequent haplotype—a feature mostly observed in the population of CE. This agrees with the findings of Clozato et al. [18], which suggested a scenario of recent population expansion for the giant anteater based on a star-shaped mtDNA network, a negative Tajima’s D value, and a unimodal mismatch distribution plot. It is important to note, though, that our sampling unintentionally favoured the CE when compared to other biomes. Nevertheless, these results led us to think about a possible correlation between the giant anteater’s population increase and the past expansion of open vegetation areas during the last glacial period, including AM (ca. 12–110 ka ago) [102]. Recent modelling studies, however, indicate that the CE achieved its maximum extent during the last interglacial period (ca. 115–130 ka ago), which was then followed by a retraction during the last glacial period, possibly related to both decreased precipitation and temperature [103,104].
A second hypothesis would be an increase in food availability (i.e., ants and termites) in some periods in the Pleistocene. Indeed, genetic studies of termite species in North America [105] and Southeast Asia [106] and of ant species in Europe [107] and Mexico [108] have all shown signs of contraction (glacial periods) and subsequent population expansion (interglacial) during the Pleistocene. The latter species is a neotropical ant that also inhabits the Brazilian CE and shows a sign of large population expansion in the last 30 ka [108].
Finally, giant anteaters may have benefited from other species’ declines associated with Late Pleistocene megafaunal extinction, occurring globally ca. 7–50 ka ago [109]. The population expansion in M. tridactyla could be associated with the extirpation of contemporary predators and competitors. However, although the timing of extinction is still poorly established in South America, growing evidence suggests that its pace only accelerated between 11.2–13.5 ka ago, with some taxa lasting until ca. 7 ka ago [110,111,112]. These estimates largely post-date our obtained timing for the giant anteater’s population expansion, but a local extinction (death event) of a gomphothere population in the Águas de Araxá of the CE biome occurred about 55 ka ago [113].
Our ENMs revealed that the areas of predicted suitability for the CEPTAF population have had historically more stable climatic conditions than areas of predicted suitability for the AM population. Assuming an optimistic carbon emission scenario, similar climate conditions should persist at least until 2070 in areas occupied by CEPTAF. In turn, the ENMs of the AM population showed an increase in suitable areas from the LGM until the present and fragmentation of potential occurrence areas in the future. Arruda et al. [114] also found that biome changes in Brazil occurred mostly in ecotonal areas, except for the AM region, which displayed remarkable vegetation dynamics greatly influenced by climatic instability during the LGM and Mid-Holocene. The predicted increase in suitable areas for AM despite genetic data suggesting a smaller effective size for that population may reflect lower population densities throughout the AM biome. Although this is only speculative, it would fit the expectations of higher giant anteater densities occurring in the CE.
From a conservation standpoint, Brazilian Reserves for Integral Protection (IPs) cover less than 10% of the giant anteater’s suitable areas modelled for both the present and the future under climate change [115]. The species can only be considered adequately protected when Reserves for Sustainable Use (SUs) and Indigenous Reserves (IRs) are also considered, but these are mostly located in the AM [115]. The AM cluster identified here is also located in the AM and this population is more likely to suffer from loss of genetic diversity due to stochastic processes as a result of its apparent small population size [116]. Despite the existing PAs in AM, our limited sampling and the lack of information about the species in that region prevents us to assume adequate maintenance of the genetic diversity for AM. On the other hand, besides the apparently larger population size for CEPTAF, the number of PAs within its occurrence area is much smaller [115]. Françoso et al. [117] showed that PAs represent only 6.5% of the native CE remnants and that SUs are ineffective in protecting the biodiversity. In addition, Diniz and Brito [118] demonstrated that, of the 18 federal PAs in the CE where the giant anteater occurs, only 11 can maintain viable populations for the next 100 years under an optimistic population density scenario, whereas only 3 accomplish this in a pessimistic one. Beyond that, both CE and AF have been massively devastated with only about 45% of the original CE [26] and 11.7% of the original AF [30] vegetation remaining. Zimbres et al. [115] stressed the ecological importance of CE for the conservation of xenarthran species, particularly M. tridactyla, and suggested both PT and northern CE as priority areas for future conservation. Our findings highlight the urgency of increasing the number and extent of IPs in these regions, so that the maintenance of the genetic diversity of CEPTAF can be ensured.
Our results and interpretations are not free of caveats. One must bear in mind that extrapolations of richness measures can only be made reliably up to double the size of a population due to increasing bias towards underestimation with larger sample sizes [54,55]. Therefore, the early plateauing of the AM haplotype richness asymptote may be an artifact of the method, which is reflected in its large 95% CI. Furthermore, the apparent isolation-by-environment pattern observed for the population structure could be due to the biased dispersal and gene flow [41], which are influenced by the giant anteater’s ecology. It is important to note, however, that Migrate-n assumes that “population sizes are constant through time or are randomly fluctuating around an average population size” [119]. Our dataset violates this assumption. With growing populations, as the EBSP showed to be the case for M. tridactyla, Migrate-n tends to underestimate effective population size [119]. This, together with the hugely different sample sizes of AM and CEPTAF, may have exerted some influence on the results. Finally, the ENMs for the AM population were based on only a few occurrence points, which could lead to a lack of accuracy and predictive power. Thus, these results should be interpreted with caution.
Obtaining a representative sampling of a widespread animal species is an arduous task, even more so when such species present low population densities in most of their range. Concerning the current sampling, we cannot discard the possibility that our AF samples were from wandering CE individuals because they were collected from individuals within the original distribution of the AF biome, though sampling localities were closer to CE spots in the Paraná state. In addition, native forested areas in the AF were drastically transformed by human activity and its remnants are largely fragmented [30]. Furthermore, the large difference in sample sizes imposed by the sparse sampling of AM individuals conducted here may have biased some of the analyses. Although we tried to alleviate the problem using R/E techniques and demographic models, these approaches are not infallible; for this reason, our results should be interpreted carefully. Thus, new studies with increased sampling efforts are needed, mainly in the AM and other neotropical countries, to paint a more complete picture of the species’ evolutionary history.

5. Conclusions

Our study presented, for the first time, a question-driven analysis of the geographic structure of the giant anteater allied to ecological niche modelling. Despite our sampling limitations, especially regarding the limited number of individuals and the lack of nuclear genes in the AM cluster, several results converged on the importance of the CE and adjacent areas in the conservation of M. tridactyla. Estimates of θ and haplotype richness point to greater genetic diversity in the CE, PT, and transition areas with the AF than in the AM. Allied to this, these populations have experienced greater climatic stability over the last 21 ka and they are unlikely to suffer the consequences of future climate change scenarios. On the other hand, the network of PAs in the CE is not enough to safeguard the integrity of the species’ populations either in the present or in the future [115]. For these reasons, adopting a precautionary attitude, we point to CE, PT, and transition areas with the AF as priorities to guarantee the maintenance of genetic diversity of the giant anteater. We do not rule out the AM and other areas of the Neotropics as important strongholds of genetic diversity for the species. For this reason, we emphasize the need for greater geographic sampling in northern South America and Central America, in addition to the use of genomic markers, to refine the delimitation of management units, test the connectivity between them, and assess the levels of genetic diversity and adaptative potential of the species.

Supplementary Materials

The following supporting information can be downloaded at: https://www.mdpi.com/article/10.3390/d14070542/s1, Figure S1: Dated phylogenetic tree of Cytb haplotypes; Figure S2: Plot of probability densities for each number of clusters assessed in Geneland; Figure S3: Time-scaled extended Bayesian skyline plot for the CEPTAF cluster; Figure S4: Maps of variance component (relative sum of squares) for the CEPTAF cluster; Table S1: List of samples and sampling localities; Table S2: List of primers used for each marker and their references; Table S3: Summary of parameter estimates for each model tested in Migrate-n; Table S4: AUC values for ecological niche models and general circulation models used to perform the ensemble forecasting for the CEPTAF cluster; Table S5: Methodological uncertainties of the modelling components from the ecological niche modelling predictions for the CEPTAF cluster; Table S6: Ecological niche models and general circulation models used to perform the ensemble forecasting for the AM cluster. Reference [69] is cited in the Supplementary Materials.

Author Contributions

Conceptualization, R.T.F.C., R.F.M., and F.R.S.; methodology, R.T.F.C., R.F.M., and P.L.; software, R.T.F.C., R.F.M., and P.L.; validation, R.T.F.C., R.F.M., and P.L.; formal analysis, R.T.F.C., R.F.M., and P.L.; investigation, R.T.F.C.; resources, F.R.M. and F.R.S.; data curation, R.T.F.C.; writing—original draft preparation, R.T.F.C., R.F.M., P.L., and F.R.S.; writing—review and editing, R.T.F.C., R.F.M., P.L., F.R.M., and F.R.S.; visualization, R.T.F.C. and P.L.; supervision, F.R.S.; project administration, F.R.S.; funding acquisition, F.R.S. All authors have read and agreed to the published version of the manuscript.

Funding

This study was funded by Fundação de Amparo à Pesquisa do Estado de Minas Gerais (FAPEMIG), Conselho Nacional de Desenvolvimento Científico e Tecnológico (CNPq), and Fundação Grupo O Boticário. R.T.F.C. received a M.Sc. scholarship from the Coordenação de Aperfeiçoamento de Pessoal de Nível Superior (CAPES); R.F.M. holds a PNPD/CAPES post-doctoral fellowship; P.L. holds a post-doctoral fellowship from the Fundação de Amparo à Pesquisa do Estado de São Paulo (FAPESP; grant #2014/22344-6); F.R.M. received a FAPEMIG Ph.D. scholarship; and F.R.S. holds a CNPq research fellowship.

Institutional Review Board Statement

Not applicable.

Informed Consent Statement

Not applicable.

Data Availability Statement

All sequences generated in this study were deposited in GenBank under accession numbers MH708668–MH708869. The datasets generated and/or analyzed during the current study are available from the corresponding author on reasonable request.

Acknowledgments

We are grateful to José Eustáquio dos Santos Júnior, Arnaud Desbiez, Carmen Ruiz, Pedro Galetti, Ana Luiza Queiroz, Evanguedes Kalapothakis, Flávio H. G. Rodrigues, Fernanda Braga, and the Capão da Imbuia Museum of Natural History for providing some samples. We also thank Gustavo Kuhn and Ubirajara Oliveira for helpful comments on an earlier version of the manuscript.

Conflicts of Interest

The authors declare no conflict of interest.

References

  1. Torres-Florez, J.P.; Johnson, W.E.; Nery, M.F.; Eizirik, E.; Oliveira-Miranda, M.A.; Galetti, P.M. The Coming of Age of Conservation Genetics in Latin America: What Has Been Achieved and What Needs to Be Done. Conserv. Genet. 2018, 19, 1–15. [Google Scholar] [CrossRef]
  2. Gutiérrez-Tapia, P.; Palma, R.E. Integrating Phylogeography and Species Distribution Models: Cryptic Distributional Responses to Past Climate Change in an Endemic Rodent from the Central Chile Hotspot. Divers. Distrib. 2016, 22, 638–650. [Google Scholar] [CrossRef] [PubMed] [Green Version]
  3. Lecocq, T.; Harpke, A.; Rasmont, P.; Schweiger, O. Integrating Intraspecific Differentiation in Species Distribution Models: Consequences on Projections of Current and Future Climatically Suitable Areas of Species. Divers. Distrib. 2019, 25, 1088–1100. [Google Scholar] [CrossRef]
  4. Forester, B.R.; DeChaine, E.G.; Bunn, A.G. Integrating Ensemble Species Distribution Modelling and Statistical Phylogeography to Inform Projections of Climate Change Impacts on Species Distributions. Divers. Distrib. 2013, 19, 1480–1495. [Google Scholar] [CrossRef]
  5. Ruiz-García, M.; Pinilla-Beltrán, D.; Murillo-García, O.E.; Pinto, C.M.; Brito, J.; Shostell, J.M. Comparative Mitogenome Phylogeography of Two Anteater Genera (Tamandua and Myrmecophaga; Myrmecophagidae, Xenarthra): Evidence of Discrepant Evolutionary Traits. Zool. Res. 2021, 42, 525–547. [Google Scholar] [CrossRef] [PubMed]
  6. Naples, V.L. Morphology, Evolution and Function of Feeding in the Giant Anteater (Myrmecophaga tridactyla). J. Zool. 1999, 249, 19–41. [Google Scholar] [CrossRef]
  7. Casali, D.M.; Martins-Santos, E.; Santos, A.L.Q.; Miranda, F.R.; Mahecha, G.A.B.; Perini, F.A. Morphology of the Tongue of Vermilingua (Xenarthra: Pilosa) and Evolutionary Considerations. J. Morphol. 2017, 278, 1380–1399. [Google Scholar] [CrossRef]
  8. Miranda, F.; Bertassoni, A.; Abba, A.M. Myrmecophaga tridactyla. The IUCN Red List of Threatened Species 2014: E.T14224A47441961; International Union for Conservation of Nature and Natural Resources: Gland, Switzerland, 2014. [Google Scholar]
  9. Figel, J.J.; Botero-Cañola, S.; Sánchez-Londoño, J.D.; Quintero-Ángel, A. Unexpected Documentation and Inter-Andean Range Expansion of a Vulnerable Large Mammal (Mammalia, Pilosa, Myrmecophaga tridactyla) in Colombia. Mammalia 2016, 80, 449–452. [Google Scholar] [CrossRef]
  10. Wetzel, R.M. Systematics, Distribution, Ecology, and Conservation of South American Edentates. In The Pymatuning Symposia in Ecology—Mammalian Biology in South America, Vol. 6; Mares, M.A., Genoways, H.H., Eds.; Pymatuning Laboratory of Ecology, University of Pittsburgh: Linesville, PA, USA, 1982; pp. 345–375. [Google Scholar]
  11. Medri, Í.M.; Mourão, G.M.; Rodrigues, F.H.G. Ordem Pilosa. In Mamíferos do Brasil; Reis, N.R., Peracchi, A.L., Pedro, W.A., Lima, I.P., Eds.; Nelio R. Dos Reis: Londrina, Brazil, 2011; pp. 91–106. [Google Scholar]
  12. Mourão, G.; Medri, Í.M. Activity of a Specialized Insectivorous Mammal (Myrmecophaga tridactyla) in the Pantanal of Brazil. J. Zool. 2007, 271, 187–192. [Google Scholar] [CrossRef]
  13. Bertassoni, A.; Mourão, G.; Ribeiro, R.C.; Cesário, C.S.; Oliveira, J.P.; Bianchi, R.C. Movement Patterns and Space Use of the First Giant Anteater (Myrmecophaga tridactyla) Monitored in São Paulo State, Brazil. Stud. Neotrop. Fauna Environ. 2017, 52, 68–74. [Google Scholar] [CrossRef] [Green Version]
  14. Quiroga, V.A.; Noss, A.J.; Boaglio, G.I.; di Bitetti, M.S. Local and Continental Determinants of Giant Anteater (Myrmecophaga tridactyla) Abundance: Biome, Human and Jaguar Roles in Population Regulation. Mamm. Biol. 2016, 81, 274–280. [Google Scholar] [CrossRef]
  15. Di Blanco, Y.E.; Desbiez, A.L.J.; Jiménez-Pérez, I.; Kluyber, D.; Massocato, G.F.; di Bitetti, M.S. Habitat Selection and Home-Range Use by Resident and Reintroduced Giant Anteaters in 2 South American Wetlands. J. Mammal. 2017, 98, 1118–1128. [Google Scholar] [CrossRef] [Green Version]
  16. Garcia, J.E.; Vilas Boas, L.A.; Lemos, M.V.F.; Lemos, E.G.M.; Contel, E.P.B. Identification of Microsatellite DNA Markers for the Giant Anteater Myrmecophaga tridactyla. J. Hered. 2005, 96, 600–602. [Google Scholar] [CrossRef] [Green Version]
  17. Collevatti, R.G.; Leite, K.C.E.; Miranda, G.H.B.; Rodrigues, F.H.G. Evidence of High Inbreeding in a Population of the Endangered Giant Anteater, Myrmecophaga tridactyla (Myrmecophagidae), from Emas National Park, Brazil. Genet. Mol. Biol. 2007, 30, 112–120. [Google Scholar] [CrossRef]
  18. Clozato, C.L.; Miranda, F.R.; Lara-Ruiz, P.; Collevatti, R.G.; Santos, F.R. Population Structure and Genetic Diversity of the Giant Anteater (Myrmecophaga tridactyla: Myrmecophagidae, Pilosa) in Brazil. Genet. Mol. Biol. 2017, 40, 50–60. [Google Scholar] [CrossRef] [Green Version]
  19. Sartori, R.Q.; Lopes, A.G.; Aires, L.P.N.; Bianchi, R.D.C.; de Mattos, C.C.B.; Morales, A.C.; Castiglioni, L. Identifying Priority Giant Anteater (Myrmecophaga tridactyla) Populations for Conservation in São Paulo State, Brazil. Ecol. Evol. 2021, 11, 700–713. [Google Scholar] [CrossRef]
  20. Barragán-Ruiz, C.E.; Silva-Santos, R.; Saranholi, B.H.; Desbiez, A.L.J.; Galetti, P.M. Moderate Genetic Diversity and Demographic Reduction in the Threatened Giant Anteater, Myrmecophaga tridactyla. Front. Genet. 2021, 12, 669350. [Google Scholar] [CrossRef]
  21. Shaw, J.H.; Machado-Neto, J.; Carter, T.S. Behavior of Free-Living Giant Anteaters (Myrmecophaga tridactyla). Biotropica 1987, 19, 255–259. [Google Scholar] [CrossRef]
  22. Zimbres, B.; Furtado, M.M.; Jácomo, A.T.A.; Silveira, L.; Sollmann, R.; Tôrres, N.M.; Machado, R.B.; Marinho-Filho, J. The Impact of Habitat Fragmentation on the Ecology of Xenarthrans (Mammalia) in the Brazilian Cerrado. Landsc. Ecol. 2013, 28, 259–269. [Google Scholar] [CrossRef]
  23. Vynne, C.; Keim, J.L.; Machado, R.B.; Marinho-Filho, J.; Silveira, L.; Groom, M.J.; Wasser, S.K. Resource Selection and Its Implications for Wide-Ranging Mammals of the Brazilian Cerrado. PLoS ONE 2011, 6, e28939. [Google Scholar] [CrossRef]
  24. Di Blanco, Y.E.; Jiménez-Pérez, I.; di Bitetti, M.S. Habitat Selection in Reintroduced Giant Anteaters: The Critical Role of Conservation Areas. J. Mammal. 2015, 96, 1024–1035. [Google Scholar] [CrossRef]
  25. Leeuwenberg, F. Edentata as a Food Resource: Subsistence Hunting by Xavante Indians, Brazil. Edentata 1997, 3, 4–5. [Google Scholar]
  26. Merrit, D.A., Jr. Xenarthrans of the Paraguayan Chaco. In The Biology of the Xenarthra; Vizcaino, S.F., Loughry, W.J., Eds.; University Press of Florida: Gainesville, FL, USA, 2008; pp. 294–299. ISBN 978-0-8130-3718-9. [Google Scholar]
  27. Noss, A.J.; Cuéllar, R.L.; Cuéllar, E. Exploitation of Xenarthrans by the Guaraní-Isoseño Indigenous People of the Bolivian Chaco: Comparisons with Hunting by Other Indigenous Groups in Latin America, and Implications for Conservation. In The Biology of the Xenarthra; Vizcaino, S.F., Loughry, W.J., Eds.; University Press of Florida: Gainesville, FL, USA, 2008; pp. 244–254. ISBN 978-0-8130-3718-9. [Google Scholar]
  28. Harris, M.B.; Tomas, W.; Mourão, G.; Silva, C.J.; Guimarães, E.; Sonoda, F.; Fachim, E. Safeguarding the Pantanal Wetlands: Threats and Conservation Initiatives. Conserv. Biol. 2005, 19, 714–720. [Google Scholar] [CrossRef]
  29. Klink, C.A.; Machado, R.B. Conservation of the Brazilian Cerrado. Conserv. Biol. 2005, 19, 707–713. [Google Scholar] [CrossRef]
  30. Ribeiro, M.C.; Metzger, J.P.; Martensen, A.C.; Ponzoni, F.J.; Hirota, M.M. The Brazilian Atlantic Forest: How Much Is Left, and How Is the Remaining Forest Distributed? Implications for Conservation. Biol. Conserv. 2009, 142, 1141–1153. [Google Scholar] [CrossRef]
  31. Silveira, L.; Rodrigues, F.H.G.; Jácomo, A.T.A.; Diniz-Filho, J.A.F. Impact of Wildfires on the Megafauna of Emas National Park, Central Brazil. Oryx 1999, 33, 108–114. [Google Scholar] [CrossRef] [Green Version]
  32. Cáceres, N.C.; Hannibal, W.; Freitas, D.R.; Silva, E.L.; Roman, C.; Casella, J. Mammal Occurrence and Roadkill in Two Adjacent Ecoregions (Atlantic Forest and Cerrado) in South-Western Brazil. Zoologia 2010, 27, 709–717. [Google Scholar] [CrossRef] [Green Version]
  33. Cunha, H.F.; Moreira, F.G.A.; Silva, S.S. Roadkill of Wild Vertebrates along the GO-060 Road between Goiânia and Iporá, Goiás State, Brazil. Acta Sci. Biol. Sci. 2010, 32, 257–263. [Google Scholar] [CrossRef]
  34. Freitas, C.H.; Justino, C.S.; Setz, E.Z.F. Road-Kills of the Giant Anteater in South-Eastern Brazil: 10 Years Monitoring Spatial and Temporal Determinants. Wildl. Res. 2014, 41, 673–680. [Google Scholar] [CrossRef]
  35. Zurell, D.; Franklin, J.; König, C.; Bouchet, P.J.; Dormann, C.F.; Elith, J.; Fandos, G.; Feng, X.; Guillera-Arroita, G.; Guisan, A.; et al. A Standard Protocol for Reporting Species Distribution Models. Ecography 2020, 43, 1261–1277. [Google Scholar] [CrossRef]
  36. Peterson, A.T.; Soberón, J.; Pearson, R.G.; Anderson, R.P.; Martínez-Meyer, E.; Nakamura, M.; Araújo, M.B. Ecological Niches and Geographic Distributions—Monographs in Population Biology, No. 49; Princeton University Press: Princeton, NJ, USA, 2011; ISBN 9780691136868. [Google Scholar]
  37. Diniz-Filho, J.A.F.; Souza, K.S.; Bini, L.M.; Loyola, R.; Dobrovolski, R.; Rodrigues, J.F.M.; Lima-Ribeiro Matheus de, S.; Terribile, L.C.; Rangel, T.F.; Bione, I.; et al. A Macroecological Approach to Evolutionary Rescue and Adaptation to Climate Change. Ecography 2019, 42, 1124–1141. [Google Scholar] [CrossRef] [Green Version]
  38. Terribile, L.C.; Lima-Ribeiro, M.S.; Araújo, M.B.; Bizão, N.; Collevatti, R.G.; Dobrovolski, R.; Franco, A.A.; Guilhaumon, F.; Lima, J.S.; Murakami, D.M.; et al. Areas of Climate Stability of Species Ranges in the Brazilian Cerrado: Disentangling Uncertainties through Time. Nat. Conserv. 2012, 10, 152–159. [Google Scholar] [CrossRef]
  39. Ribeiro, B.R.; Sales, L.P.; Loyola, R. Strategies for Mammal Conservation under Climate Change in the Amazon. Biodivers. Conserv. 2018, 27, 1943–1959. [Google Scholar] [CrossRef]
  40. Hewitt, G. The Genetic Legacy of the Quaternary Ice Ages. Nature 2000, 405, 907–913. [Google Scholar] [CrossRef]
  41. Wang, I.J.; Bradburd, G.S. Isolation by Environment. Mol. Ecol. 2014, 23, 5649–5662. [Google Scholar] [CrossRef]
  42. Thompson, J.D.; Higgins, D.G.; Gibson, T.J. CLUSTAL W: Improving the Sensitivity of Progressive Multiple Sequence Alignment through Sequence Weighting, Position-Specific Gap Penalties and Weight Matrix Choice. Nucleic Acids Res. 1994, 22, 4673–4680. [Google Scholar] [CrossRef] [Green Version]
  43. Kumar, S.; Stecher, G.; Tamura, K. MEGA7: Molecular Evolutionary Genetics Analysis Version 7.0 for Bigger Datasets. Mol. Biol. Evol. 2016, 33, 1870–1874. [Google Scholar] [CrossRef] [Green Version]
  44. Flot, J.-F. SEQPHASE: A Web Tool for Interconverting PHASE Input/Output Files and FASTA Sequence Alignments. Mol. Ecol. Resour. 2010, 10, 162–166. [Google Scholar] [CrossRef]
  45. Stephens, M.; Scheet, P. Accounting for Decay of Linkage Disequilibrium in Haplotype Inference and Missing-Data Imputation. Am. J. Hum. Genet. 2005, 76, 449–462. [Google Scholar] [CrossRef] [Green Version]
  46. Stephens, M.; Smith, N.J.; Donnelly, P. A New Statistical Method for Haplotype Reconstruction from Population Data. Am. J. Hum. Genet. 2001, 68, 978–989. [Google Scholar] [CrossRef] [Green Version]
  47. Guillot, G.; Estoup, A.; Mortier, F.; Cosson, J.F. A Spatial Statistical Model for Landscape Genetics. Genetics 2005, 170, 1261–1280. [Google Scholar] [CrossRef] [Green Version]
  48. Guillot, G.; Mortier, F.; Estoup, A. Geneland: A Computer Package for Landscape Genetics. Mol. Ecol. Notes 2005, 5, 712–715. [Google Scholar] [CrossRef]
  49. Guillot, G. Inference of Structure in Subdivided Populations at Low Levels of Genetic Differentiation—The Correlated Allele Frequencies Model Revisited. Bioinformatics 2008, 24, 2222–2228. [Google Scholar] [CrossRef] [Green Version]
  50. Montgomery, G.G.; Lubin, Y.D. Prey Influences on Movements of Neotropical Anteaters. In Proceedings of the 1975 Predator Symposium; Phillips, R.L., Jonkel, C., Eds.; Montana Forest and Conservation Experiment Station, University of Montana: Missoula, MT, USA, 1977; pp. 103–131. [Google Scholar]
  51. Excoffier, L.; Lischer, H.E.L. Arlequin Suite Ver 3.5: A New Series of Programs to Perform Population Genetics Analyses under Linux and Windows. Mol. Ecol. Resour. 2010, 10, 564–567. [Google Scholar] [CrossRef]
  52. Excoffier, L.; Smouse, P.E.; Quattro, J.M. Analysis of Molecular Variance Inferred from Metric Distances among DNA Haplotypes: Application to Human Mitochondrial DNA Restriction Data. Genetics 1992, 131, 479–491. [Google Scholar] [CrossRef]
  53. Kimura, M. A Simple Method for Estimating Evolutionary Rates of Base Substitutions through Comparative Studies of Nucleotide Sequences. J. Mol. Evol. 1980, 16, 111–120. [Google Scholar] [CrossRef]
  54. Chao, A.; Gotelli, N.J.; Hsieh, T.C.; Sander, E.L.; Ma, K.H.; Colwell, R.K.; Ellison, A.M. Rarefaction and Extrapolation with Hill Numbers: A Framework for Sampling and Estimation in Species Diversity Studies. Ecol. Monogr. 2014, 84, 45–67. [Google Scholar] [CrossRef] [Green Version]
  55. Hsieh, T.C.; Ma, K.H.; Chao, A. INEXT: An R Package for Rarefaction and Extrapolation of Species Diversity (Hill Numbers). Methods Ecol. Evol. 2016, 7, 1451–1456. [Google Scholar] [CrossRef]
  56. Leigh, J.W.; Bryant, D. POPART: Full-feature Software for Haplotype Network Construction. Methods Ecol. Evol. 2015, 6, 1110–1116. [Google Scholar] [CrossRef]
  57. Bandelt, H.J.; Forster, P.; Rohl, A. Median-Joining Networks for Inferring Intraspecific Phylogenies. Mol. Biol. Evol. 1999, 16, 37–48. [Google Scholar] [CrossRef]
  58. Lichstein, J.W. Multiple Regression on Distance Matrices: A Multivariate Spatial Analysis Tool. Plant Ecol. 2007, 188, 117–131. [Google Scholar] [CrossRef]
  59. Goslee, S.C.; Urban, D.L. The Ecodist Package for Dissimilarity-Based Analysis of Ecological Data. J. Stat. Softw. 2007, 22, 1–19. [Google Scholar] [CrossRef]
  60. Paradis, E.; Schliep, K. Ape 5.0: An Environment for Modern Phylogenetics and Evolutionary Analyses in R. Bioinformatics 2019, 35, 526–528. [Google Scholar] [CrossRef]
  61. Oksanen, J.; Blanchet, F.G.; Friendly, M.; Kindt, R.; Legendre, P.; McGlinn, D.; Minchin, P.R.; O’Hara, R.B.; Simpson, G.L.; Solymos, P.; et al. Vegan: Community Ecology Package, R Package Version 2.4-6. Available online: https://cran.r-project.org/package=vegan (accessed on 24 January 2018).
  62. Magalhães, R.F.; Lemes, P.; Camargo, A.; Oliveira, U.; Brandão, R.A.; Thomassen, H.; Garcia, P.C.A.; Leite, F.S.F.; Santos, F.R. Evolutionarily Significant Units of the Critically Endangered Leaf Frog Pithecopus ayeaye (Anura, Phyllomedusidae) Are Not Effectively Preserved by the Brazilian Protected Areas Network. Ecol. Evol. 2017, 7, 8812–8828. [Google Scholar] [CrossRef] [Green Version]
  63. Beerli, P. Comparison of Bayesian and Maximum-Likelihood Inference of Population Genetic Parameters. Bioinformatics 2006, 22, 341–345. [Google Scholar] [CrossRef] [Green Version]
  64. Tavaré, S. Some Probabilistic and Statistical Problems in the Analysis of DNA Sequences. In Some Mathematical Questions in Biology: DNA Sequence Analysis—Lectures on Mathematics in the Life Sciences, Vol. 17; Miura, R.M., Ed.; American Mathematical Society: Providence, RI, USA, 1986; pp. 57–86. [Google Scholar]
  65. Beerli, P.; Palczewski, M. Unified Framework to Evaluate Panmixia and Migration Direction among Multiple Sampling Locations. Genetics 2010, 185, 313–326. [Google Scholar] [CrossRef] [Green Version]
  66. Miller, M.A.; Pfeiffer, W.; Schwartz, T. Creating the CIPRES Science Gateway for Inference of Large Phylogenetic Trees. In Proceedings of the 2010 Gateway Computing Environments Workshop (GCE), New Orleans, LA, USA, 14 November 2010; Institute of Electrical and Electronics Engineers (IEEE): Piscataway, NJ, USA, 2010; pp. 1–8. [Google Scholar] [CrossRef] [Green Version]
  67. Bouckaert, R.; Heled, J.; Kühnert, D.; Vaughan, T.; Wu, C.-H.; Xie, D.; Suchard, M.A.; Rambaut, A.; Drummond, A.J. BEAST 2: A Software Platform for Bayesian Evolutionary Analysis. PLoS Comput. Biol. 2014, 10, e1003537. [Google Scholar] [CrossRef] [PubMed] [Green Version]
  68. Bouckaert, R.R.; Drummond, A.J. bModelTest: Bayesian Phylogenetic Site Model Averaging and Model Comparison. BMC Evol. Biol. 2017, 17, 42. [Google Scholar] [CrossRef] [PubMed] [Green Version]
  69. Gibb, G.C.; Condamine, F.L.; Kuch, M.; Enk, J.; Moraes-Barros, N.; Superina, M.; Poinar, H.N.; Delsuc, F. Shotgun Mitogenomics Provides a Reference Phylogenetic Framework and Timescale for Living Xenarthrans. Mol. Biol. Evol. 2016, 33, 621–642. [Google Scholar] [CrossRef] [PubMed]
  70. Rambaut, A.; Drummond, A.J.; Xie, D.; Baele, G.; Suchard, M.A. Posterior Summarization in Bayesian Phylogenetics Using Tracer 1.7. Syst. Biol. 2018, 67, 901–904. [Google Scholar] [CrossRef] [PubMed] [Green Version]
  71. Rambaut, A. FigTree, v1.4.4. Available online: https://github.com/rambaut/figtree/releases/tag/v1.4.4 (accessed on 26 November 2018).
  72. Heled, J.; Drummond, A.J. Bayesian Inference of Population Size History from Multiple Loci. BMC Evol. Biol. 2008, 8, 289. [Google Scholar] [CrossRef] [Green Version]
  73. R Core Team R: A Language and Environment for Statistical Computing. Available online: https://www.r-project.org/ (accessed on 21 April 2017).
  74. Hijmans, R.J.; Cameron, S.E.; Parra, J.L.; Jones, P.G.; Jarvis, A. Very High Resolution Interpolated Climate Surfaces for Global Land Areas. Int. J. Climatol. 2005, 25, 1965–1978. [Google Scholar] [CrossRef]
  75. Intergovernmental Panel on Climate Change. Summary for Policymakers. In Climate change 2013—The Physical Science Basis: Working Group I Contribution to the Fifth Assessment Report of the Intergovernmental Panel on Climate Change; Stocker, T.F., Qin, D., Plattner, G.-K., Tignor, M., Allen, S.K., Boschung, J., Nauels, A., Xia, Y., Bex, V., Midgley, P.M., Eds.; Cambridge University Press: Cambridge, UK, 2014; pp. 1–30. ISBN 9781107057999. [Google Scholar]
  76. Thomson, A.M.; Calvin, K.V.; Smith, S.J.; Kyle, G.P.; Volke, A.; Patel, P.; Delgado-Arias, S.; Bond-Lamberty, B.; Wise, M.A.; Clarke, L.E.; et al. RCP4.5: A Pathway for Stabilization of Radiative Forcing by 2100. Clim. Chang. 2011, 109, 77–94. [Google Scholar] [CrossRef] [Green Version]
  77. Araújo, M.B.; New, M. Ensemble Forecasting of Species Distributions. Trends Ecol. Evol. 2007, 22, 42–47. [Google Scholar] [CrossRef]
  78. Hijmans, R.J.; Phillips, S.; Leathwick, J.; Elith, J. Dismo: Species Distribution Modeling, R Package Version 1.1-4. Available online: https://cran.r-project.org/package=dismo (accessed on 9 January 2017).
  79. Nix, H.A. A Biogeographic Analysis of Australian Elapid Snakes. In Atlas of Elapid Snakes of Australia—Australian Flora and Fauna Series, No. 7; Longmore, R., Ed.; Bureau of Flora and Fauna: Canberra, Australia, 1986; pp. 4–15. [Google Scholar]
  80. Carpenter, G.; Gillison, A.N.; Winter, J. DOMAIN: A Flexible Modelling Procedure for Mapping Potential Distributions of Plants and Animals. Biodivers. Conserv. 1993, 2, 667–680. [Google Scholar] [CrossRef]
  81. Tax, D.M.J.; Duin, R.P.W. Support Vector Data Description. Mach. Learn. 2004, 54, 45–66. [Google Scholar] [CrossRef] [Green Version]
  82. Phillips, S.J.; Dudík, M. Modeling of Species Distributions with Maxent: New Extensions and a Comprehensive Evaluation. Ecography 2008, 31, 161–175. [Google Scholar] [CrossRef]
  83. Fielding, A.H.; Bell, J.F. A Review of Methods for the Assessment of Prediction Errors in Conservation Presence/Absence Models. Environ. Conserv. 1997, 24, 38–49. [Google Scholar] [CrossRef]
  84. Pearson, R.G.; Raxworthy, C.J.; Nakamura, M.; Townsend Peterson, A. Predicting Species Distributions from Small Numbers of Occurrence Records: A Test Case Using Cryptic Geckos in Madagascar. J. Biogeogr. 2007, 34, 102–117. [Google Scholar] [CrossRef]
  85. Bean, W.T.; Stafford, R.; Brashares, J.S. The Effects of Small Sample Size and Sample Bias on Threshold Selection and Accuracy Assessment of Species Distribution Models. Ecography 2012, 35, 250–258. [Google Scholar] [CrossRef]
  86. Shcheglovitova, M.; Anderson, R.P. Estimating Optimal Complexity for Ecological Niche Models: A Jackknife Approach for Species with Small Sample Sizes. Ecol. Model. 2013, 269, 9–17. [Google Scholar] [CrossRef]
  87. Meirmans, P.G. Seven Common Mistakes in Population Genetics and How to Avoid Them. Mol. Ecol. 2015, 24, 3223–3231. [Google Scholar] [CrossRef] [Green Version]
  88. Chikhi, L.; Sousa, V.C.; Luisi, P.; Goossens, B.; Beaumont, M.A. The Confounding Effects of Population Structure, Genetic Diversity and the Sampling Scheme on the Detection and Quantification of Population Size Changes. Genetics 2010, 186, 983–995. [Google Scholar] [CrossRef] [Green Version]
  89. Heller, R.; Chikhi, L.; Siegismund, H.R. The Confounding Effect of Population Structure on Bayesian Skyline Plot Inferences of Demographic History. PLoS ONE 2013, 8, e62992. [Google Scholar] [CrossRef] [Green Version]
  90. Franklin, J.; Wejnert, K.E.; Hathaway, S.A.; Rochester, C.J.; Fisher, R.N. Effect of Species Rarity on the Accuracy of Species Distribution Models for Reptiles and Amphibians in Southern California. Divers. Distrib. 2009, 15, 167–177. [Google Scholar] [CrossRef]
  91. Ministério do Meio Ambiente. Unidades de Conservação—2018. Available online: https://dados.gov.br/dataset/unidadesdeconservacao/resource/3562d093-14ed-434b-9fa3-411b664d6836 (accessed on 10 May 2022).
  92. Nardelli, M.; Ibáñez, E.A.; Dobler, D.; Justy, F.; Delsuc, F.; Abba, A.M.; Cassini, M.H.; Túnez, J.I. Genetic Structuring in a Relictual Population of Screaming Hairy Armadillo (Chaetophractus vellerosus) in Argentina Revealed by a Set of Novel Microsatellite Loci. Genetica 2016, 144, 469–476. [Google Scholar] [CrossRef] [Green Version]
  93. Lara-Ruiz, P.; Chiarello, A.G.; Santos, F.R. Extreme Population Divergence and Conservation Implications for the Rare Endangered Atlantic Forest Sloth, Bradypus torquatus (Pilosa: Bradypodidae). Biol. Conserv. 2008, 141, 1332–1342. [Google Scholar] [CrossRef]
  94. Schetino, M.A.A.; Coimbra, R.T.F.; Santos, F.R. Time Scaled Phylogeography and Demography of Bradypus torquatus (Pilosa: Bradypodidae). Glob. Ecol. Conserv. 2017, 11, 224–235. [Google Scholar] [CrossRef]
  95. Coimbra, R.T.F.; Miranda, F.R.; Lara, C.C.; Schetino, M.A.A.; Santos, F.R. Phylogeographic History of South American Populations of the Silky Anteater Cyclopes didactylus (Pilosa: Cyclopedidae). Genet. Mol. Biol. 2017, 40, 40–49. [Google Scholar] [CrossRef] [Green Version]
  96. Miranda, F.R.; Casali, D.M.; Perini, F.A.; Machado, F.A.; Santos, F.R. Taxonomic Review of the Genus Cyclopes Gray, 1821 (Xenarthra: Pilosa), with the Revalidation and Description of New Species. Zool. J. Linn. Soc. 2018, 183, 687–721. [Google Scholar] [CrossRef]
  97. Eizirik, E.; Kim, J.-H.; Menotti-Raymond, M.; Crawshaw, P.G., Jr.; O’Brien, S.J.; Johnson, W.E. Phylogeography, Population History and Conservation Genetics of Jaguars (Panthera onca, Mammalia, Felidae). Mol. Ecol. 2001, 10, 65–79. [Google Scholar] [CrossRef] [PubMed]
  98. Medri, Í.M.; Mourão, G. Home Range of Giant Anteaters (Myrmecophaga tridactyla) in the Pantanal Wetland, Brazil. J. Zool. 2005, 266, 365–375. [Google Scholar] [CrossRef]
  99. Huchon, D.; Delsuc, F.; Catzeflis, F.M.; Douzery, E.J.P. Armadillos Exhibit Less Genetic Polymorphism in North America than in South America: Nuclear and Mitochondrial Data Confirm a Founder Effect in Dasypus novemcinctus (Xenarthra). Mol. Ecol. 1999, 8, 1743–1748. [Google Scholar] [CrossRef] [PubMed] [Green Version]
  100. Redford, K.H. The Edentates of the Cerrado. Edentata 1994, 1, 4–10. [Google Scholar]
  101. Desbiez, A.L.J.; Medri, Í.M. Density and Habitat Use by Giant Anteaters (Myrmecophaga tridactyla) and Southern Tamanduas (Tamandua tetradactyla) in the Pantanal Wetland, Brazil. Edentata 2010, 11, 4–10. [Google Scholar] [CrossRef] [Green Version]
  102. Haffer, J. Speciation in Amazonian Forest Birds. Science 1969, 165, 131–137. [Google Scholar] [CrossRef]
  103. Werneck, F.P.; Nogueira, C.; Colli, G.R.; Sites, J.W.; Costa, G.C. Climatic Stability in the Brazilian Cerrado: Implications for Biogeographical Connections of South American Savannas, Species Richness and Conservation in a Biodiversity Hotspot. J. Biogeogr. 2012, 39, 1695–1706. [Google Scholar] [CrossRef]
  104. Bueno, M.L.; Pennington, R.T.; Dexter, K.G.; Kamino, L.H.Y.; Pontara, V.; Neves, D.M.; Ratter, J.A.; de Oliveira-Filho, A.T. Effects of Quaternary Climatic Fluctuations on the Distribution of Neotropical Savanna Tree Species. Ecography 2017, 40, 403–414. [Google Scholar] [CrossRef] [Green Version]
  105. Hyseni, C.; Garrick, R.C. The Role of Glacial-interglacial Climate Change in Shaping the Genetic Structure of Eastern Subterranean Termites in the Southern Appalachian Mountains, USA. Ecol. Evol. 2019, 9, 4621–4636. [Google Scholar] [CrossRef] [Green Version]
  106. Veera Singham, G.; Othman, A.S.; Lee, C.-Y. Phylogeography of the Termite Macrotermes gilvus and Insight into Ancient Dispersal Corridors in Pleistocene Southeast Asia. PLoS ONE 2017, 12, e0186690. [Google Scholar] [CrossRef] [Green Version]
  107. Leppänen, J.; Vepsäläinen, K.; Savolainen, R. Phylogeography of the Ant Myrmica rubra and Its Inquiline Social Parasite. Ecol. Evol. 2011, 1, 46–62. [Google Scholar] [CrossRef] [Green Version]
  108. Mendoza-Ramírez, M.; Gutiérrez-Rodríguez, J.; Poteaux, C.; Ornelas-García, P.; Zaldívar-Riverón, A. Late Pleistocene Genetic Diversification and Demographic Expansion in the Widely Distributed Neotropical Ant Neoponera villosa (Ponerinae). Mitochondrial DNA Part A 2019, 30, 296–306. [Google Scholar] [CrossRef]
  109. Barnosky, A.D. Megafauna Biomass Tradeoff as a Driver of Quaternary and Future Extinctions. Proc. Natl. Acad. Sci. USA 2008, 105, 11543–11548. [Google Scholar] [CrossRef] [Green Version]
  110. Barnosky, A.D.; Lindsey, E.L. Timing of Quaternary Megafaunal Extinction in South America in Relation to Human Arrival and Climate Change. Quat. Int. 2010, 217, 10–29. [Google Scholar] [CrossRef]
  111. Prado, J.L.; Martinez-Maza, C.; Alberdi, M.T. Megafauna Extinction in South America: A New Chronology for the Argentine Pampas. Palaeogeogr. Palaeoclimatol. Palaeoecol. 2015, 425, 41–49. [Google Scholar] [CrossRef]
  112. Villavicencio, N.A.; Lindsey, E.L.; Martin, F.M.; Borrero, L.A.; Moreno, P.I.; Marshall, C.R.; Barnosky, A.D. Combination of Humans, Climate, and Vegetation Change Triggered Late Quaternary Megafauna Extinction in the Última Esperanza Region, Southern Patagonia, Chile. Ecography 2016, 39, 125–140. [Google Scholar] [CrossRef]
  113. Avilla, L.S.; Figueiredo, A.M.G.; Kinoshita, A.; Bertoni-Machado, C.; Mothé, D.; Asevedo, L.; Baffa, O.; Dominato, V.H. Extinction of a Gomphothere Population from Southeastern Brazil: Taphonomic, Paleoecological and Chronological Remarks. Quat. Int. 2013, 305, 85–90. [Google Scholar] [CrossRef]
  114. Arruda, D.M.; Schaefer, C.E.G.R.; Fonseca, R.S.; Solar, R.R.C.; Fernandes-Filho, E.I. Vegetation Cover of Brazil in the Last 21 Ka: New Insights into the Amazonian Refugia and Pleistocenic Arc Hypotheses. Glob. Ecol. Biogeogr. 2018, 27, 47–56. [Google Scholar] [CrossRef]
  115. Zimbres, B.Q.C.; Aquino, P.D.P.U.; Machado, R.B.; Silveira, L.; Jácomo, A.T.A.; Sollmann, R.; Tôrres, N.M.; Furtado, M.M.; Marinho-Filho, J. Range Shifts under Climate Change and the Role of Protected Areas for Armadillos and Anteaters. Biol. Conserv. 2012, 152, 53–61. [Google Scholar] [CrossRef]
  116. Frankham, R. Genetics and Extinction. Biol. Conserv. 2005, 126, 131–140. [Google Scholar] [CrossRef]
  117. Françoso, R.D.; Brandão, R.; Nogueira, C.C.; Salmona, Y.B.; Machado, R.B.; Colli, G.R. Habitat Loss and the Effectiveness of Protected Areas in the Cerrado Biodiversity Hotspot. Nat. Conserv. 2015, 13, 35–40. [Google Scholar] [CrossRef] [Green Version]
  118. Diniz, M.F.; Brito, D. Protected Areas Effectiveness in Maintaining Viable Giant Anteater (Myrmecophaga tridactyla) Populations in an Agricultural Frontier. Nat. Conserv. 2015, 13, 145–151. [Google Scholar] [CrossRef] [Green Version]
  119. Beerli, P. How to Use MIGRATE or Why Are Markov Chain Monte Carlo Programs Difficult to Use? In Population Genetics for Animal Conservation; Bertorelle, G., Bruford, M.W., Hauffe, H.C., Rizzoli, A., Vernesi, C., Eds.; Conservation Biology; Cambridge University Press: Cambridge, UK, 2009; pp. 42–79. ISBN 9780521866309. [Google Scholar]
Figure 1. Map of Brazilian biomes showing the sampling localities. Atlantic Forest (AF, triangles); Amazon (AM, diamonds); Cerrado (CE, circles); Pantanal (PT, squares).
Diversity 14 00542 g001
Figure 2. Median-joining haplotype networks of (A) concatenated mtDNA, (B) exon 28 of VWF, (C) BDNF, and (D) RAG2. Circles represent haplotypes, colours represent biomes, and hatch marks symbolize mutations.
Diversity 14 00542 g002
Figure 3. Map of posterior probabilities of membership for the two most likely clusters detected by Geneland using concatenated mtDNA data. AM: Amazon cluster; CEPTAF: Cerrado, Pantanal, and Atlantic Forest cluster.
Diversity 14 00542 g003
Figure 4. Rarefaction and extrapolation haplotype richness curves for the two clusters of giant anteaters. Three types of curves are shown: (A) a sample size-based, (B) a sample completeness, and (C) a coverage-based curve. Solid lines are a result of interpolation and dashed lines represent extrapolation. Lighter areas around the asymptote delimit the 95% confidence intervals. AM: Amazon cluster; CEPTAF: Cerrado, Pantanal, and Atlantic Forest cluster.
Diversity 14 00542 g004
Figure 5. Time-scaled extended Bayesian skyline plot (EBSP) with mtDNA and nDNA data for the giant anteater showing a population growth that started slowly ca. 60 ka ago and has largely increased since ca. 40 ka ago. The dashed line represents the median estimate and the shaded area around it correspond to the 95% central posterior density (CPD).
Diversity 14 00542 g005
Figure 6. Distribution models of (A) CEPTAF and (C) AM clusters of the giant anteater for Last Glacial Maximum (LGM), Mid-Holocene, current (~1960–1990), and future (2070) climate conditions. Higher values indicate pixels with higher potential for population occurrence. Climatic stability maps are based on distribution models for (B) CEPTAF and (D) AM clusters. Protected areas are delimited by white lines [91].
Diversity 14 00542 g006
Table 1. Migration model selection through Bayes factors (BF) comparison. BFs were calculated as exp[ln(P(D|Mi)) − ln(P(D|Mj))], where exp denotes the exponential function, ln(P(D|Mi)) is the marginal likelihood of the current model, and ln(P(D|Mj)) is the marginal likelihood of the model with the highest marginal likelihood. Model probability was calculated as, where BFi is the BF of the current model and is the sum of the BFs of all models.
ModelDescriptionMarginal
Likelihood
BFModel
Probability
IPanmixia−1901.6788<1 × 10⁻⁵<1 × 10⁻⁵
IIBidirectional migration−1892.31020.10510.0891
IIIMigration from AM to CEPTAF−1890.057510.8476
IVMigration from CEPTAF to AM−1892.65140.07470.0633
VIsolated populations−1927.6109<1 × 10⁻¹⁶<1 × 10⁻¹⁶
Table 2. Summary of concatenated mtDNA diversity parameters estimated for each cluster of Myrmecophaga tridactyla. n: number of samples; H: number of haplotypes; h: haplotype diversity; π: nucleotide diversity; SD: standard deviation.
ClusternHh ± SDπ ± SD
AM960.8889 ± 0.09100.0027 ± 0.0018
CEPTAF97290.7204 ± 0.05120.0019 ± 0.0012
Total106330.7623 ± 0.04450.0021 ± 0.0013
Publisher’s Note: MDPI stays neutral with regard to jurisdictional claims in published maps and institutional affiliations.

