Article

Avian Haemosporidian Diversity in South Texas: New Lineages and Variation in Prevalence between Sampling Sources and Sites

1
Department of Ecology and Conservation Biology, and Biodiversity Research and Teaching Collections, Texas A&M University, College Station, TX 77843, USA
2
East Foundation, 200 Concord Plaza Dr., #410, San Antonio, TX 78216, USA
*
Author to whom correspondence should be addressed.
Diversity 2022, 14(5), 378; https://doi.org/10.3390/d14050378
Submission received: 22 March 2022 / Revised: 25 April 2022 / Accepted: 27 April 2022 / Published: 11 May 2022
(This article belongs to the Special Issue Bird Parasites-2nd Edition)

Abstract

:
Avian haemosporidian parasites (Haemoproteus, Leucocytozoon, Plasmodium) in Texas are relatively understudied for such a large geographic area with diverse ecoregions. Our study sites in south Texas, located in two adjacent ecoregions, present the opportunity for investigating patterns and possible causes of infections between habitats, and characterizing the baseline makeup of the avian malaria community. We assessed the avian haemosporidian community using their mtDNA cytb gene in 576 birds, 25.69% of which were infected. The overall detection rate was much higher from blood samples than tissue samples, and the more arid ecoregion had a significantly lower overall prevalence. Findings also revealed significantly lower Plasmodium infections in the more arid ecoregion. We identified 25 novel lineages which included 16 Haemoproteus, 2 Leucocytozoon, and 7 Plasmodium lineages. This information establishes a baseline of prevalence for these ecoregions and provides insight to the disease ecology of resident and migrant birds of this area. We assert that baseline knowledge of this type is necessary for meaningful comparisons to areas of high anthropogenic change, and essential to aiding conservation efforts of birds in future.

1. Introduction

A great number of biotic and abiotic factors contribute to the complexity of community systems of avian haemosporidian disease ecology [1,2,3]. The prevalence of avian haemosporidian parasites (Haemoproteus, Leucocytozoon, and Plasmodium) in and among avian communities varies considerably, with some indication that parasite prevalence is reflective of avian host abundance [4]. However, in the appropriate geographic context (i.e., across the islands of an archipelago), patterns of infection by Plasmodium are shaped more by geography, whereas infections of Haemoproteus are shaped more by host associations [5]. In well-sampled studies, the arguments that dense vegetation supports increased diversity of Haemoproteus and increased infections by all three genera, but that minimum temperature is the primary determinant in Plasmodium infection rates, are robustly supported [6]. Elevation has also been shown to be a factor in the aggregation of haemosporidian parasites [7,8], as has latitude [6] and water availability [9,10]. Overall, synergies between climatic, landscape, and host ecological traits tend to drive regional-scale patterns of parasite transmissions when assessed at a global scale [3].
The growing influence of humans on ecosystems has created something of a quagmire with respect to determining the effects of anthropogenic change relative to “typical” factors, and how such changes may be influencing the distribution of birds, and especially, their parasites [11]. As anthropogenic change continues to alter landscapes, habitats of birds and their avian malaria parasites are also changed. Factors determining habitat type, such as elevation and rainfall, are amplified in their impact on microhabitats when landscape alteration due to urbanization or agriculture is present. Microhabitats suitable for the life cycle of a parasite vector can be created artificially where none existed before. Additionally, while resource abundance for some birds may increase generally in urban settings, other stressors in their human-based landscape mean their rural counterparts show the physiological signs of lower chronic stress [12].
Despite these examples, in many cases, more information cataloging the depth and breadth of haemosporidian parasites and their hosts must be gathered before reliable inferences about host–parasite associations within avian malaria communities can be made. It is therefore important to establish a baseline of malarial presence in adjacent areas which have been relatively untouched by humans. Without this important foundational knowledge, we have nothing to compare with future studies in areas of high anthropogenic change. Furthermore, for many regions, sampling is inadequate or completely lacking. This poses impediments not only to our ability to describe local haemosporidian communities and their dynamics, but also is problematic in terms of studies of regional comparisons, and studies where migratory and sedentary species overlap and may have different infection rates [7,13], and general drivers of community dynamics and distributions.
One such regional sampling gap is exemplified by the paucity of known haemosporidian parasite infection rates and host associations, in both resident and migrant birds occurring in Texas. Texas boasts a large suite of sedentary bird species, which are distributed across diverse ecoregions ranging from Gulf Coast prairies and marshes in the east, to isolated montane pine forests in the west. Texas is also host to numerous species of migratory birds, which breed across the U.S. and Canada, and travel through the central North American flyway (which includes Texas) to winter in Central and South America [14]. Being in the central flyway facilitates opportunities in Texas for research on many neotropical migrants, as well as the opportunity to compare these migrants with resident birds, with respect to host–parasite associations, and document prevalence of infections and infection rates by different haemosporidian genera. Avian haemosporidian studies previously conducted in, or that have included Texas, have thus far focused on specific species, to include Attwater’s Prairie Chickens and Wild Turkeys (Galliformes [15,16]); Sandhill Cranes and Whooping Cranes (Gruiformes [17]); Blue-winged Teals (Anseriformes [18]); Northern Cardinals (Passeriformes; [19]); and House Sparrows (Passeriformes [20]). We are aware of no studies focused in Texas that have attempted to capture the community-level haemosporidian diversity of wild populations of sedentary and migratory species.
In this study, we report on the presence and prevalence of haemosporidian infections in birds sampled from two differing habitats (primarily as a function of water availability) in southern Texas with relatively little anthropogenic change in the last century. We also investigate the relationship between detection of malarial parasites and the source of the sample material (blood versus organs), as there is evidence that this can bias interpretations of prevalence and diversity [21]. Our aims are to (1) characterize novel host–parasite relationships, (2) assess differences in infection between migrant and sedentary birds, (3) observe patterns of infection detection between blood and tissues, and (4) document novel parasite lineages for future reference.

2. Materials and Methods

Blood and tissue samples were obtained on two properties of East Foundation (eastfoundation.net, accessed on 8 April 2019) ranches located in south Texas (Figure 1). San Antonio Viejo (SAV) is an approximately 71,200 hectare property located in Jim Hogg and Starr Counties, while El Sauz (ES) is an approximately 10,900 hectare property located in Kenedy and Willacy Counties (Figure 1). SAV is located in the South Texas Plains ecoregion, a region of plains with thorny scrub and trees. This is a more arid environment than ES, which is located in the Gulf Prairies and Marshes ecoregion, defined by salt grass marshes and tallgrass prairies, with significant portions of the ranch covered with sand sheets. Birds were captured via mist nets across all seasons from 2013 to 2015, on both properties. Sampling across seasons was necessary to maximize avian diversity, a critical part of our work with East Foundation to document that diversity. Subsequent to removal from a net, selected birds were euthanized via thoracic compression [22] and prepared as voucher specimens for the Biodiversity Teaching and Research Collection at Texas A&M University (see Table S1 in Supplementary Materials). After euthanization, breast muscle tissue was collected for molecular work in this study. For non-vouchered birds, blood samples were drawn from the jugular vein of each individual using a sterile needle and syringe; these individuals were then released. Drawn blood was immediately transferred to lithium heparin microtubes (Terumo America Inc., Elkton, MD, USA) to prevent clotting while in field and later transferred to tubes filled with Queen’s lysis buffer [23] for permanent storage. Sampling was conducted under TAMU Animal Care and Use permits IACUC 2012-06 and 2015-0020, U.S. Fish and Wildlife Service permit MB205752, and Texas Parks and Wildlife Department permit SPR-0909-016, all to G.V.
Total DNA extraction of either blood or breast tissue was performed using the E.Z.N.A® Tissue DNA Kit (Omega Bio-Tek Inc., Norcross, GA, USA). Polymerase chain reaction (PCR) was performed on blood and tissue to amplify a 479 base-pair portion of the mitochondrial cytochrome-b (cytb) gene using primer pairs UNIVF: UNIR1 and UNIF: UNIR2 [24]. Amplification protocols were followed as described in Harvey and Voelker [21]; briefly, each PCR used both positive and negative controls, and primers are meant to capture a wide diversity of haemosporidian lineages. Amplified PCR products were electrophoresed with 2 µL of 100 bp Promega DNA ladder (Applied Biosystems) on an agarose gel to determine PCR success. Successfully amplified PCR products were purified using ExoSAP-IT (United States Biochemical Corporation, Cleveland, OH, USA). Cleaned PCR products were sent to DNA Analysis Facility on Science Hill at Yale University (New Haven, CT, USA) for sequencing in both forward and reverse direction using PCR primers (listed above). Forward and reverse sequences were combined and edited using Sequencher v.4.2.2 (Gene Codes Corporation, Ann Arbor, MI, USA). Samples that were identified as multiple infection (double peaks at multiple base pairs) via chromatogram were removed from the analyses.

2.1. Prevalence Analyses

Malaria detection rates were assessed based on location, genus, and sample material. For more in-depth analyses, data were compartmentalized into five datasets (A–E). Dataset A compared differences in detection rates between blood and tissue across all Haemosporidian genera combined; dataset B compared differences in detection rates between the two sampling sites; dataset C assessed differences in detection in blood or tissue between sample sites); dataset D compared differences in the detection of Plasmodium and Haemoproteus (Leucocytozoon excluded due to very low prevalence) between sample material (blood or tissue); dataset E compared differences in detection between sampling sites for Plasmodium and Haemoproteus (Leucocytozoon excluded due to very low prevalence). All statistical analyses were performed in R version 3.4.3 [25] using RStudio version 1.1.442 [26]. Tests of significance between contingencies were performed with Pearson’s chi-squared tests of association with Yates’ continuity correction as well as Fisher’s Exact Test for Count Data as one dataset (E) included an expected frequency lower than 5, and therefore can lead to erroneous conclusions drawn from the chi-square test. Additionally, we categorized avian host species into the following categories: as a year-round resident, or as a migratory species. We further categorized migratory species as those that only breed in, only winter in, or migrate through south Texas. The chi-squared test was employed to investigate potential differences between these categories.

2.2. Lineage Identification and Molecular Analysis of Selected Host Families

Each sequence was compared to published sequences located on GenBank (https://www.ncbi.nlm.nih.gov/genbank, accessed on 15 January 2019) using the NCBI Basic Local Alignment Search Tool (BLAST), and MalAvi (http://mbio-serv2.mbioekol.lu.se/Malavi/, accessed on 23 January 2019) [27]. Sequences which corresponded to known lineages (100% BLAST match) were labeled as that lineage. Following guidelines from Outlaw and Ricklefs [28], sequences with 99% similarity (1% dissimilar) or 1 fixed difference were assigned a new “tag” (i.e., lineage name).
We used jModelTest 2.1.6 [29,30] to select the appropriate model of evolution for this dataset using Akaike information criterion. Bayesian phylogenetic analyses were performed using MrBayes 3.2.6 [31] using the CIPRES Science Gateway [32]. Bayesian analysis consisted of 2 simultaneous runs for 10 million generations with four heated chains [33] and sampling occurred every 2000 generations with a 25% burn-in. Each independent run was assessed for convergence using Tracer v1.7 [34] and then a 50% majority rule consensus tree was constructed in FigTree v1.4.3 [35].

2.3. Precipitation Data

Because the insect vectors of the different haemosporidian parasite lineages have different ecological and breeding requirements related to water [36,37,38,39], we also assessed whether rainfall differences (if present) between El Sauz and San Antonio Viejo might explain any differences in prevalence results. Annual precipitation for ES and SAV were retrieved using PRISM (PRISM Climate Group, Oregon State University, http://prism.oregonstate.edu, created 4 February 2004, accessed on 18 November 2019). PRISM data were analyzed in ArcGIS [40] using zonal statistics to create average precipitation from property boundaries at each location. We used 30 year normals of precipitation as reference data for each ranch. Precipitation was evaluated for ES and SAV during the 2011–2015 timespan. We used US Drought Monitor (https://droughtmonitor.unl.edu/, accessed on 3 December 2019) to identify the start of the drought, duration, and severity.

3. Results

3.1. Prevalence

Overall detection rates across our 576 samples yielded 148 positives (25.69%) including 75 Haemoproteus (13.02%), 6 Leucocytozoon (1.04%), 63 Plasmodium (10.94%), as well as 4 multiple infections (0.69%) (Table 1). Of 281 blood samples, 103 were positive (36.7%), and of 295 tissue samples, 45 were positive (15.3%). Of 316 samples collected at ES, 110 were positive (34.8%), and of 260 samples collected at SAV, 38 were positive (14.6%) (Table 1).
Haemoproteus samples collected from blood only comprised 43.8% of the number of lineages recovered (Table 2). Plasmodium samples collected from blood only comprised 52.4% of lineages recovered. While in both of these genera, more lineages were recovered from blood only than tissue only, 34.4% of Haemoproteus lineages, 40% of Leucocytozoon lineages, and 28.6% of Plasmodium lineages were recovered from tissue only.
Dataset A included 281 blood samples (Haemoproteus, Leucocytozoon, Plasmodium, and multiple infections), of which 103 were positive (36.65%), and 295 tissue samples (Haemoproteus, Leucocytozoon, Plasmodium, and multiple infections), 45 of which were positive (15.25%) (Table 3). Both the chi-squared test of independence and Fisher’s Exact Test revealed a statistically significant difference in the ability to detect malaria infections between blood and tissue sampling materials, with detection being more likely in blood (Table 3).
In dataset B, of the 148 positive samples (Haemoproteus, Leucocytozoon, Plasmodium, and multiple infections), 110 were collected at ES (74.32%) and 38 were collected at SAV (25.68%) (Table 3). Negative samples from ES and SAV were 206 (48.13%) and 222, respectively (51.87%). Both the chi-squared test of independence and Fisher’s Exact Test revealed a statistically significant difference in the ability to detect malaria infections between our sampling sites, with detection being more likely at ES (Table 3).
Dataset C included positive Haemoproteus, Leucocytozoon, Plasmodium, and multiple infection samples (Table 3). The 110 positive samples collected at ES consisted of 89 isolated from blood (89.0%) and 21 isolated from tissue (21.0%). The 38 positive samples isolated at SAV consisted of 14 isolated from blood (36.84) and 24 isolated from tissue (63.16%). Both the chi-squared test of independence and Fisher’s Exact Test revealed a statistically significant difference in the ability to detect malaria infections between materials from sampling localities, with detection being more likely from blood samples at ES (Table 3).
Dataset D excluded the six Leucocytozoon positives and four multiple infections because of their very low detection rates (Table 2). Of the 75 positive Haemoproteus detections, 48 were from blood (64.0%) and 27 were from tissue (36.0%). Of the 63 positive Plasmodium detections, 48 were from blood (76.19%) and 15 were from tissue (23.81%). Neither the chi-squared test of independence nor the Fisher’s Exact Test revealed a significant difference in the ability to detect either Haemoproteus or Plasmodium based on sample material (blood or tissue) (Table 3).
Dataset E also excluded Leucocytozoon and multiple infections because of their low detection rates (Table 3). The 75 Haemoproteus infections included 49 from ES (65.33%) and 26 from SAV (34.67%). The 63 Plasmodium infections included 53 from ES (84.13%) and 10 from SAV (15.87%). Both the chi-squared test of independence and Fisher’s Exact Test revealed a statistically significant difference in the ability to detect Haemoproteus and Plasmodium infections between sampling localities, with detection of either genus being more likely in samples from ES (Table 3).
At El Sauz, the number of resident (present year-round) individuals infected by Haemoprotueus was 30, whereas 19 non-resident (breeding, migrant, or winter) individuals were infected (Table 4). Leucocytozoon infected only 4 non-resident birds, while Plasmodium infected 34 non-resident and 20 resident individuals (Table 4).
At San Antonio Viejo, the number of resident individuals infected with Haemoproteus was 33, whereas 6 non-resident individuals were infected (Table 4). Leucocytozoon infected just one resident and one non-resident bird (Table 4). Plasmodium infected 5 non-resident individuals, and three resident individuals (Table 4).
The chi-squared test resulted in a significant difference in our ability to detect Haemoproteus and Plasmodium between resident and non-resident birds (Table 5), with sedentary birds having significantly higher Haemoproteus infections. The chi-squared test also confirmed a significant difference in the number of infected resident and non-resident birds between the two sampling sites (Table 5) with non-resident birds having significantly less positive infections at SAV.

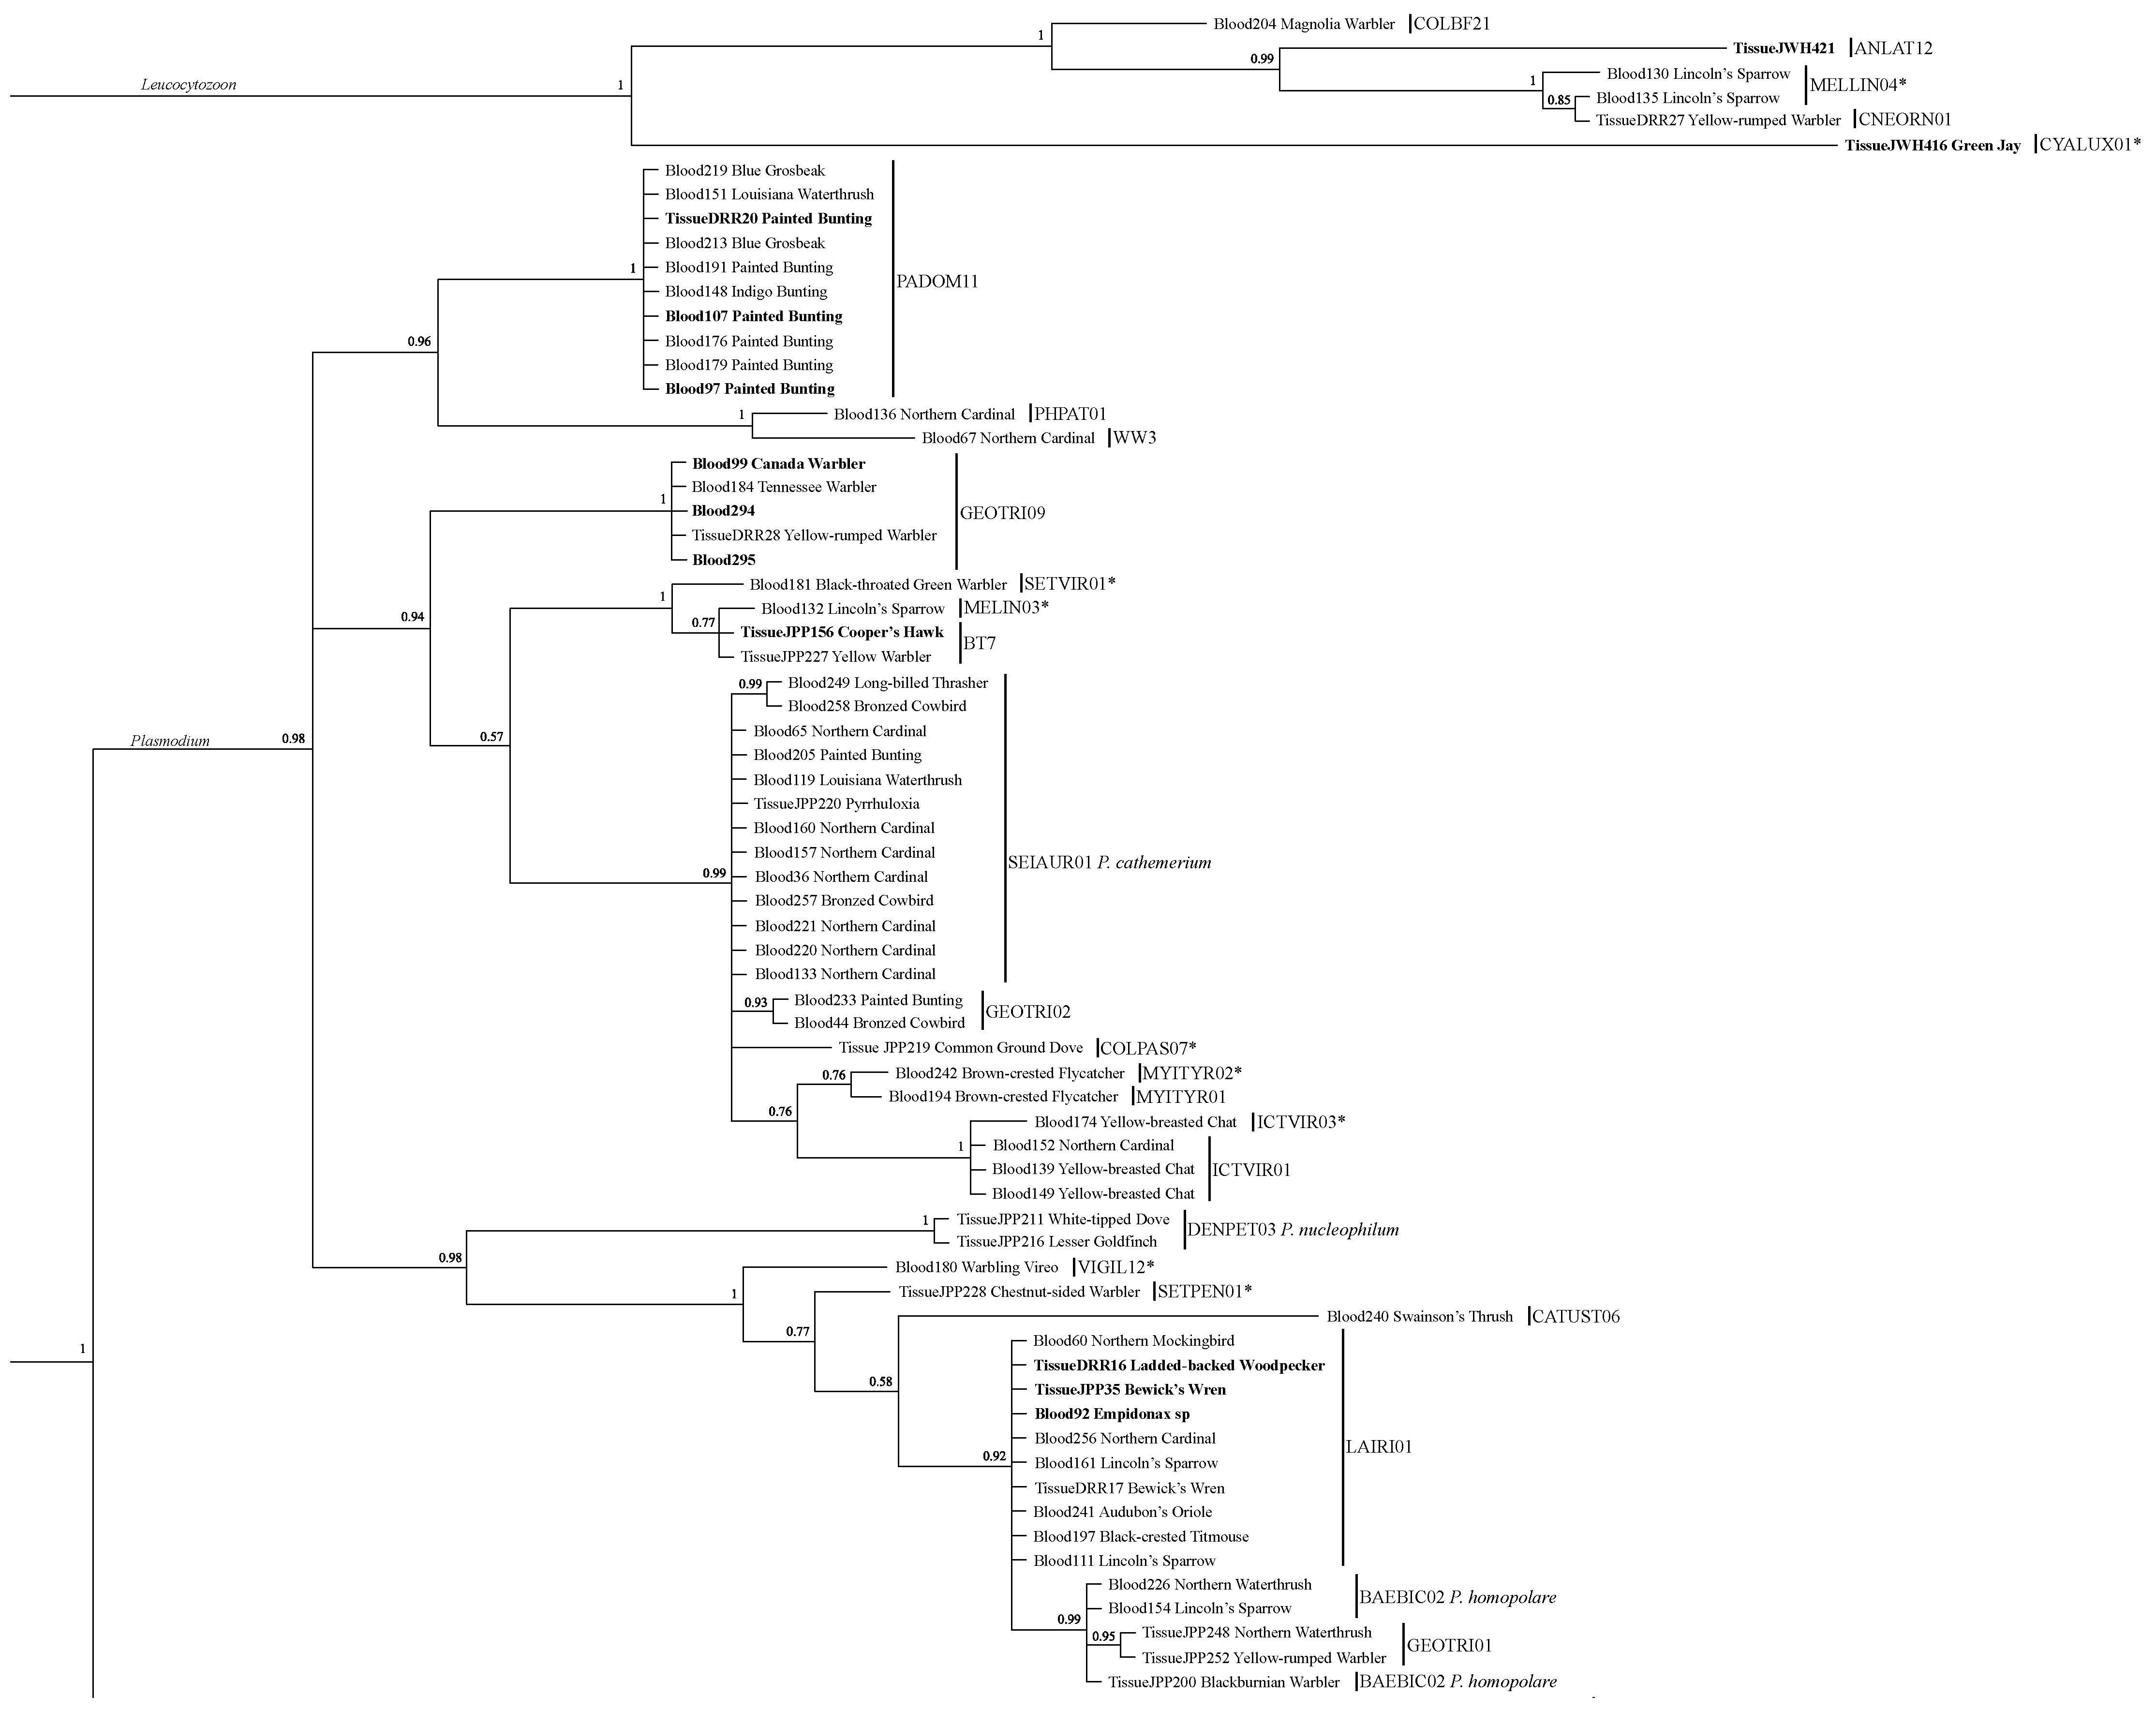
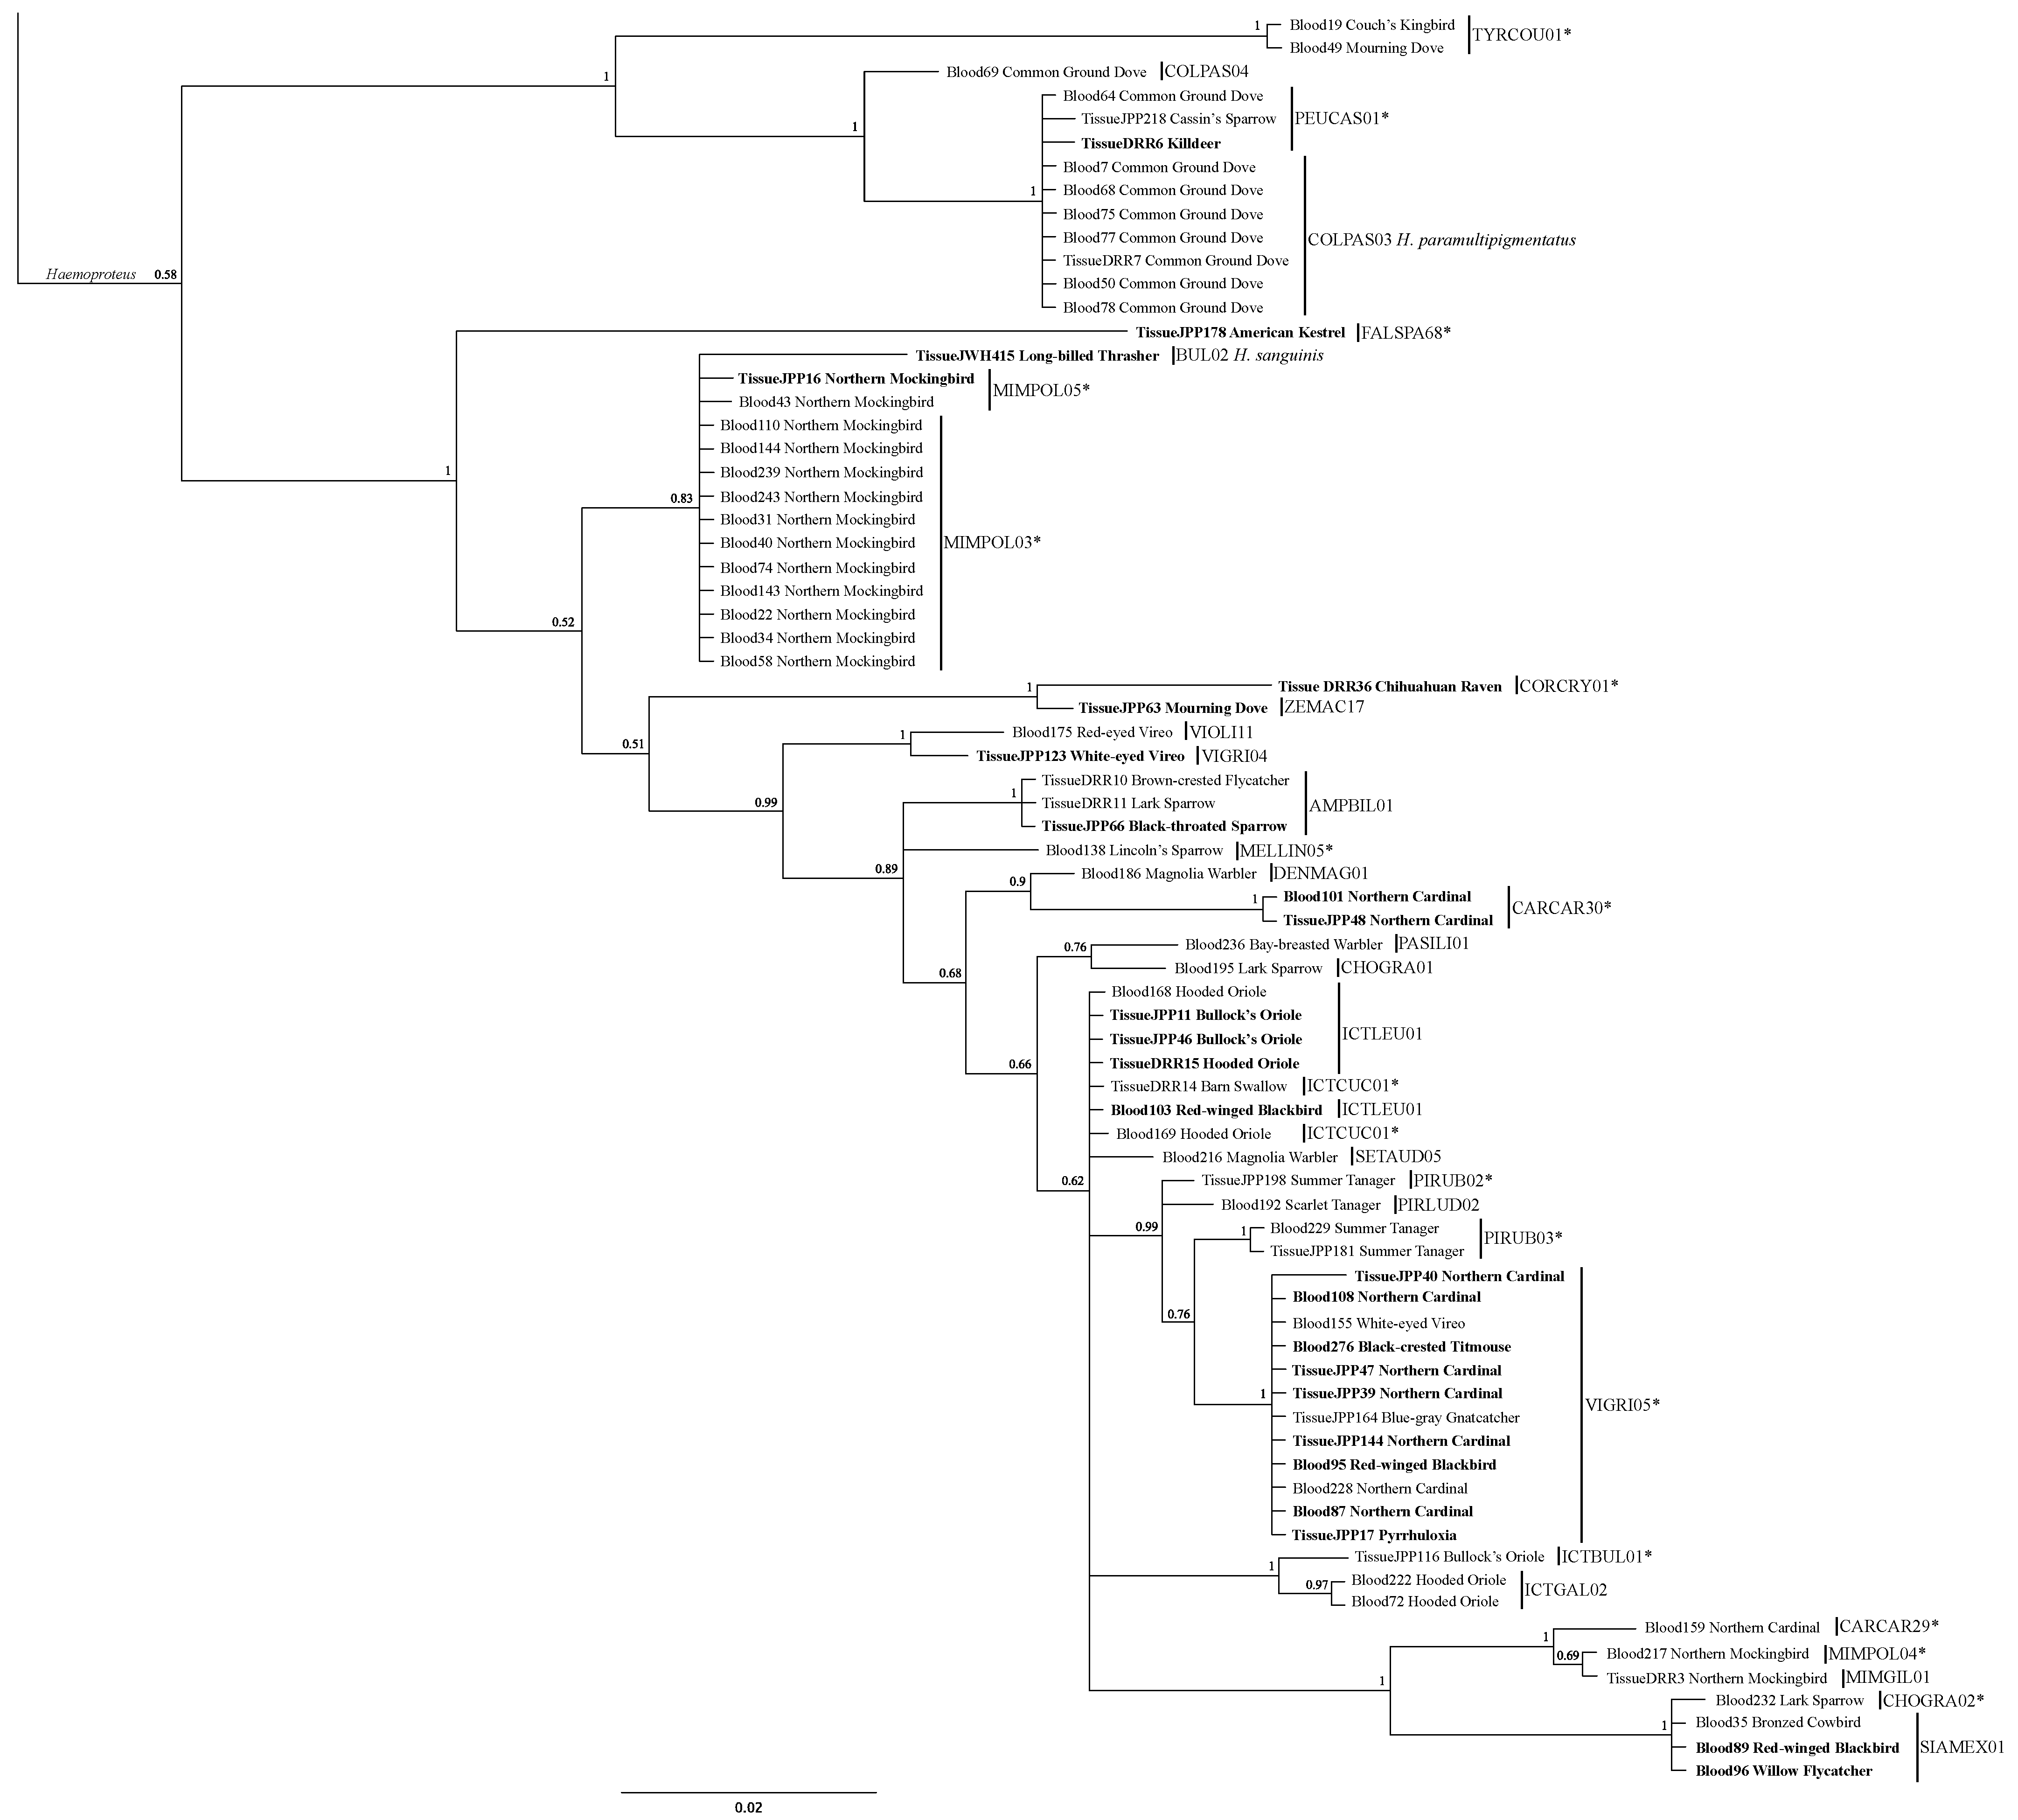
3.2. Lineage Analysis/Identification

Of 144 positive samples (excluding four multiple infections), we identified 92 of our sequences as representing 33 known malarial lineages from MalAvi (100% blast matches), of which 16 were Haemoproteus, 3 were Leucocytozoon, and 14 were Plasmodium lineages. These 33 lineages were distributed across 51 species of birds (Table 4), from six orders and 19 families. The remaining 52 sequences in our dataset were at least 1 fixed difference or 1% different from any lineage within the MalAvi database (Figure 2 and Figure 3, Table 4). These 52 sequences comprise 25 lineages that, following Ricklefs and Outlaw [28] are deemed to be novel. These novel lineages included 16 Haemoproteus, 2 Leucocytozoon, and 7 Plasmodium lineages (Table 3 and Table 4, Figure 2 and Figure 3). Overall, then, the number of lineages we recovered from SAV and ES from 2013 to 2015 was 58 (Figure 2 and Figure 3), and just 10 of these lineages were found at both sites (Table 3 and Table 4).
Table 6. Haemosporidian lineages recovered in our analyses, relative to avian host and sampling location; multiple individuals of a given host species are indicated in parentheses after the taxon name. Lineages were blasted to the MalAvi database. We provide in parentheses the nearest blasted lineage result in column 2 (MalAvi Blast). Lineages in this same column and without parentheses are 100% matches of those lineages to existing MalAvi lineages. If determined to be different via % match and base pair (BP) differences, we provide a novel lineage designation (column 6). Location refers to El Sauz (ES) and San Antonio Viejo (SAV) ranches, and numbers in parentheses (if present), indicate the number of individuals found on both ranches. Seasonality labels denote whether a species is present year-round, in winter, during breeding, or only along their migratory pathway.
MalAvi BLAST% MatchBP DifferenceNovel Lineage DesignationLocationSeasonality
Haemoproteus
American Kestrel (Falco sparverius)(BNOW03)995FALSPA68SAVwinter
Cassin’s Sparrow (Peucaea cassinii)(COLPAS03)991PEUCAS01ESyear-round
Killdeer (Charadrius vociferus)(COLPAS03)991PEUCAS01SAVyear-round
Chihuahuan Raven (Corvus cryptoleucus)(CYGNUS01)996CORCRY01SAVyear-round
Northern Cardinal (Cardinalis cardinalis) (2)(GRBRU02)9811CARCAR30SAV (2)year-round
Bullocks Oriole (Icterus bullockii)(ICTGAL02)995ICTBUL01SAVbreeding
Barn Swallow (Hirundo rustica)(ICTLEU01)991ICTCUC01ESbreeding
Hooded Oriole (Icterus cucullatus)(ICTLEU01)991ICTCUC01ESbreeding
Northern Mockingbird (Mimus polyglottos) (11)(MAFUS02)991MIMPOL03ES (11)year-round
Northern Mockingbird (Mimus polyglottos) (2)(MAFUS02)992MIMPOL05ES (1), SAV (1)year-round
Northern Cardinal (Cardinalis cardinalis)(MIMGIL01)994CARCAR29ESyear-round
Northern Mockingbird (Mimus polyglottos)(MIMGIL01)991MIMPOL04ESyear-round
Summer Tanager (Piranga rubra)(PACPEC02)991PIRUB02ESbreeding
Summer Tanager (Piranga rubra) (2)(PIRFLA01)991PIRUB03ES (2)breeding
Lincoln’s Sparrow (Melospiza lincolnii)(PIRLUD01)997MELLIN05ESwinter
Lark Sparrow (Chondestes grammacus)(SIAMEX01)991CHOGRA02ESwinter
Black-crested Titmouse (Baeolophus atricistatus)(WILPUS01)993VIGRI05SAVyear-round
Blue-gray Gnatcatcher (Polioptila caerulea)(WILPUS01)993VIGRI05ESyear-round
Northern Cardinal (Cardinalis cardinalis) (7)(WILPUS01)993VIGRI05ES (1), SAV (6)year-round
Pyrrhuloxia (Cardinalis sinuatus)(WILPUS01)993VIGRI05SAVyear-round
Red-winged Blackbird (Agelaius phoeniceus)(WILPUS01)993VIGRI05SAVyear-round
White-eyed Vireo (Vireo griseus)(WILPUS01)993VIGRI05ESyear-round
Couch’s Kingbird (Tyrannus couchii)(ZEAUR05)992TYRCOU01ESyear-round
Mourning Dove (Zenaida macroura)(ZEAUR05)992TYRCOU01ESyear-round
Black-throated Sparrow (Amphispiza bilineata)AMPBIL011000 SAVyear-round
Brown-crested Flycatcher (Myiarchus tyrannulus)AMPBIL011000 ESbreeding
Lark Sparrow (Chondestes grammacus)AMPBIL011000 ESwinter
Long-billed Thrasher (Toxostoma longirostre)BUL21000 SAVyear-round
Lark Sparrow (Chondestes grammacus)CHOGRA011000 ESwinter
Common Ground Dove (Columbina passerina) (8)COLPAS031000 ES (8)year-round
Common Ground Dove (Columbina passerina)COLPAS041000 ESyear-round
Magnolia Warbler (Setophaga magnolia)DENMAG011000 ESmigrant
Hooded Oriole (Icterus cucullatus) (2)ICTGAL021000 ES (2)breeding
Bullocks Oriole (Icterus bullockii) (2)ICTLEU011000 SAV (2)breeding
Hooded Oriole (Icterus cucullatus) (2)ICTLEU011000 ES (1), SAV (1)breeding
Red-winged Blackbird (Agelaius phoeniceus)ICTLEU011000 SAVyear-round
Northern Mockingbird (Mimus polyglottos)MIMGIL011000 ESyear-round
Bay-breasted Warbler (Setophaga castanea)PASILI011000 ESmigrant
Scarlet Tanager (Piranga olivacea)PIRLUD021000 ESmigrant
Magnolia Warbler (Setophaga magnolia)SETAUD051000 ESmigrant
Bronzed Cowbird (Molothrus aeneus)SIAMEX011000 ESbreeding
Red-winged Blackbird (Agelaius phoeniceus)SIAMEX011000 SAVyear-round
Willow Flycatcher (Empidonax traillii)SIAMEX011000 SAVmigrant
White-eyed Vireo (Vireo griseus)VIGRI041000 SAVyear-round
Red-eyed Vireo (Vireo olivaceus)VIOLI111000 ESmigrant
Mourning Dove (Zenaida macroura)ZEMAC171000 SAVyear-round
Leucocytozoon
Green Jay (Cyanocorax yncas)(BGR3)8952CYALUX01SAVyear-round
Lincoln’s Sparrow (Melospiza lincolnii)(CNEORN01)992MELLIN04ESwinter
Varied Bunting (Passerina versicolor)ANLAT121000 SAVbreeding
Lincoln’s Sparrow (Melospiza lincolnii)CNEORN011000 ESwinter
Yellow-rumped Warbler (Setophaga coronata)CNEORN011000 ESwinter
Magnolia Warbler (Setophaga magnolia)COLBF211000 ESmigrant
Plasmodium
Black-throated Green Warbler (Steophaga virens)(BT7)994SETVIR01ESmigrant
Chesnut-sided Warbler (Setophaga pensylvanica)(CXRES06)989SETPEN01ESmigrant
Warbling Vireo (Vireo gilvus)(CYCGUJ01)991VIGIL12ESmigrant
Yellow-breasted Chat (Icteria virens)(ICTVIR01)9811ICTVIR03ESmigrant
Lincoln’s Sparrow (Melospiza lincolnii)(ICTVIR01)991MELIN03ESwinter
Brown-crested Flycatcher (Myiarchus tyrannulus)(PADOM09)991MYITYR02ESbreeding
Common Ground Dove (Columbina passerina)(SEIAUR01)981COLPAS07ESyear-round
Blackburnian Warbler (Setophaga fusca)BAEBIC021000 ESmigrant
Lincoln’s Sparrow (Melospiza lincolnii)BAEBIC021000 ESwinter
Northern Waterthrush (Parkesia noveboracensis)BAEBIC021000 ESmigrant
Cooper’s Hawk (Accipiter cooperii)BT71000 SAVyear-round
Yellow Warbler (Setophaga petechia)BT71000 ESmigrant
Swainson’s Thrush (Catharus ustulatus)CATUST061000 ESmigrant
Lesser Goldfinch (Spinus psaltria)DENPET031000 ESyear-round
White-tipped Dove (Leptotila verreauxi)DENPET031000 ESyear-round
Northern Waterthrush (Parkesia noveboracensis)GEOTRI011000 ESmigrant
Yellow-rumped Warbler (Setophaga coronata)GEOTRI011000 ESwinter
Bronzed Cowbird (Molothrus aeneus)GEOTRI021000 ESbreeding
Painted Bunting (Passerina ciris)GEOTRI021000 ESbreeding
Blood294GEOTRI091000 SAV
Blood295GEOTRI091000 SAV
Canada Warbler (Cardellina canadensis)GEOTRI091000 SAVmigrant
Tennessee Warbler (Leiothlypis peregrina)GEOTRI091000 ESmigrant
Yellow-rumped Warbler (Setophaga coronata)GEOTRI091000 ESwinter
Northern Cardinal (Cardinalis cardinalis)ICTVIR011000 ESyear-round
Yellow-breasted Chat (Icteria virens) (2)ICTVIR011000 ES (2)migrant
Audubons Oriole (Icterus graduacauda)LAIRI011000 ESyear-round
Bewick’s Wren (Thyromanes bewickii) (2)LAIRI011000 ES (1) SAV (1)year-round
Black-crested Titmouse (Baeolophus atricistatus)LAIRI011000 ESyear-round
Empidonax_sp.LAIRI011000 SAVlikely migrant
Ladder-backed Woodpecker (Dryobates scalaris)LAIRI011000 SAVyear-round
Lincoln’s Sparrow (Melospiza lincolnii) (2)LAIRI011000 ES (2)winter
Northern Cardinal (Cardinalis cardinalis)LAIRI011000 ESyear-round
Northern Mockingbird (Mimus polyglottos)LAIRI011000 ESyear-round
Brown-crested Flycatcher (Myiarchus tyrannulus)MYITYR011000 ESbreeding
Blue Grosbeak (Passerina caerulea) (2)PADOM111000 ES (2)Breeding
Indigo Bunting (Passerina cyanea)PADOM111000 ESbreeding
Louisiana Watherthrush (Parkesia motacilla)PADOM111000 ESmigrant
Painted Bunting (Passerina ciris) (6)PADOM111000 ES (3), SAV (3)breeding
Northern Cardinal (Cardinalis cardinalis)PHPAT011000 ESyear-round
Bronzed Cowbird (Molothrus aeneus) (2)SEIAUR011000 ES (2)breeding
Long-billed Thrasher (Toxostoma longirostre)SEIAUR011000 ESyear-round
Louisiana Watherthrush (Parkesia motacilla)SEIAUR011000 ESmigrant
Northern Cardinal (Cardinalis cardinalis) (7)SEIAUR011000 ES (7)year-round
Painted Bunting (Passerina ciris)SEIAUR011000 ESbreeding
Pyrrhuloxia (Cardinalis sinuatus)SEIAUR011000 ESyear-round
Northern Cardinal (Cardinalis cardinalis)WW31000 ESyear-round
The most common Haemoproteus lineages in our overall dataset included MIMPOL3, which was found in 11 Northern Mockingbirds, VIGRI05 which was found in 12 individuals from six passerine species, and COLPAS03 which was found in eight Common Ground Doves (Figure 3, Table 4). The two most common Plasmodium lineages in our overall dataset were LAIRI01, which was found in 10 individuals from eight species (one woodpecker, and seven passerines), and SEIAUR01 which was found in 13 individuals from six passerine species (Figure 3, Table 4).
Our Bayesian analysis of the sequences from our dataset indicates that many of the novel lineages that we recovered are, as suggested from Blast searches, highly distinct from the next closest lineage we recovered (Figure 2 and Figure 3). Posterior probability values highly support the designations of the three genera, and while the value at the node separating the subgenera Parahaemoproteus and Haemoproteus is not highly resolved (0.58), nodes at the base of each subgenus are fully supported (Figure 3). Within each genus, many novel lineages are supported by high posterior probability values. Both novel Leucocytozoon lineages are fully supported, and four of seven novel lineages from Plasmodium have high support (>0.98) (Figure 2). Both novel lineages within subgenus Haemoproteus are fully resolved, and nine of fourteen lineages within Parahaemoproteus are strongly supported (>0.90) (Figure 3).

3.3. Precipitation

The 30 year normals of precipitation for ES and SAV were 63.21 cm and 53.73 cm, respectively. Precipitation levels at both locations were below these values for 2011 and 2012 (Table 7), the result of a severe drought period. In 2013, the annual precipitation averages for both locations returned to values similar to their respective 30 year normals. El Sauz received higher than 30 year normal values of precipitation in both 2014 and 2015. San Antonio Viejo saw higher than normal precipitation in 2015.

4. Discussion

4.1. Prevalence

Our overall detection rate was 25.69%, a rate somewhat lower than detection rates from other studies [21 (Benin), 41 (Mississippi, USA)] but on par with others [e.g., 13 (Dominican Republic)]. Investigating these comparisons has helped to elucidate possible reasons for seemingly low prevalence in south Texas. Bodden and Outlaw [41] were specifically focused on Northern Cardinals in human-developed areas, and noted in their prevalence of 57% that 47% were Plasmodium infections; Plasmodium transmission can increase in developed areas as more “habitat”, i.e., standing water sources, are available to them. Our Plasmodium infections are lower proportionally and came from rural lands largely unchanged for a century. However, with Harvey and Voelker [21], of their 52% prevalence, 34.2% were Plasmodium infections, a percentage lower than ours (42.57%). Their work established a baseline measurement of prevalence in mostly protected areas in Benin which have less anthropogenic change than is evident in our study areas (G.V. pers. obs.). While ES and SAV habitats are different in precipitation and ecoregion categorization, these cattle ranches are somewhat different in land use as well. SAV is home to the East Foundation headquarters resulting in comparatively higher levels of human activity, as compared to ES. SAV also has numerous oil-well pads, which while now inactive, are indicative of a more intensive human impact as compared to ES. Finally, the cattle operations at SAV are much more intensive than at ES. Overall then, SAV has experienced more anthropogenic effects than has ES.
In dataset A, the detection of infection was significantly different between blood and tissue overall. This corresponds with previous indications that source material can bias detection of malaria parasites [21]. However, unlike Harvey and Voelker [21], we found significantly lower prevalence of Plasmodium infected individuals in tissue samples than in blood samples (dataset D). In dataset D, we found less Plasmodium in tissue; however, this comparison is only approaching significance. When looking at lineages recovered in tissue only, it is important to note that had tissues been excluded, 34.4% of Haemoproteus lineages, 40% of Leucocytozoon, and 28.6% of Plasmodium lineages would have been missed (Table 2). Many studies of avian malaria parasites which are conducted in the field exclude tissue sampling altogether (either by preference or via permit restrictions). While tissue collection is not an option for all researchers or institutions, and is certainly not appropriate for all sampled individuals, the possibility for missing significant information relating to parasite diversity broadly is noteworthy. We should note, however, that we cannot exclude the possibility that we amplified parasite DNA from blood cells that would have remained in our tissue samples. We further note that the presence of a positive result does not necessarily indicate successful ongoing infection in the host bird.
In dataset B, we found that the rates of positive infections were significantly different between the two sampling sites. Specifically, positive infections were detected at a much lower rate in SAV. The coastal habitat at ES is a wetter habitat overall and harbors more opportunities for arthropod vectors of all types to find water that suits their life history. The arid environment of the SAV offers much less water in general. In dataset E, significantly fewer positive Plasmodium infections were found at SAV. This is consistent with the findings in dataset B, but further help to refine our understanding of that result. Higher aridity at SAV affected positive infections overall, but most significantly affected Plasmodium infections. It stands to reason that mosquito vectors are most highly affected by the dry climate as their larvae are opportunistic and thrive in standing water collected in small ponds, gutters, buckets, etc. These opportunities are more limited in the drier environment and general lack of anthropogenic change at SAV.
In dataset C, significantly less positive blood samples were found at SAV. This finding corresponds with results of our other datasets. Lower levels of infection were detected in the arid environment at SAV overall (confirmed by dataset B), and specifically at SAV, Plasmodium (confirmed by dataset E). While dataset D does not confirm significance of the relationship between Plasmodium detection and sample material, the results lack of positive blood samples from SAV is interesting, as blood was much more likely to reveal infection than tissue (confirmed by dataset A).
Haemoproteus infections were significantly higher in resident species of birds. This result illustrates the importance of understanding the disease ecology of birds, both residents and non-residents as they interact and coexist on breeding and wintering grounds and migratory pathways. That Haemoproteus infections were higher is not overly surprising given the arid environment in which our sampling localities are found; such habitats would be more conducive to the reproduction of the insect vectors (hippoboscid flies and biting midges) which transmit Haemoproteus, as compared to Plasmodium transmitting mosquitos which require different water resources to reproduce. This could suggest that non-resident birds were coming from areas and habitats less conducive to Haemoproteus infections.
Additionally, there were significantly less non-resident individuals found to be infected at SAV. This result could be due to some of the bird species we sampled being coastal migrants. Less non-resident individuals could also reflect the fact that infected migrants may suffer acute infections which could result in death; as such, only comparatively “healthy” birds would survive and have been sampled during our surveys.

4.2. Host Associations

In our analysis, two Haemoproteus lineages were found in 10 or more individuals (Table 4). The most prevalent lineage, MIMPOL03, displayed the highest host specificity, being found only in one species (Northern Mockingbirds (Mimus polyglottus) and one family, Mimidae. However, the second most prevalent lineage, VIGRI05, did not display similar host specificity, being found in six species across five families (Cardinalidae, Icteridae, Paridae, Polioptilidae, and Vireonidae). Three Plasmodium lineages were also found in 10 or more individuals (Table 4). The most prevalent lineage, SEIAUR01, was found in six host species across four host families (Cardinalidae, Icteridae, Mimidae, and Parulidae). All three lineages of Plasmodium appear to be host generalists, but PADOM11 appeared only in migrants (four species across two families: Cardinalidae and Parulidae), whereas LAIRI01 and SEIAUR01 were present in both residents and migrants.
Haemoproteus lineage MIMPOL03 is highly specialized, being one of the larger clades (sampled in 13 individuals) but infecting exclusively Northern Mockingbirds (Mimus polyglottus) (Figure 3). This extreme host specificity is and prevalence across many Northern Mockingbirds is very different from recent findings which showed no infection across 43 host individuals of the same species on the island of Hispanola [13]. This is also in stark contrast to the clade formed by Plasmodium lineage LAIRI01. The ten host individuals represented eight families across two orders (Passeriformes: Mimidae, Troglodytidae, Tyrannidae, Cardinalidae, Passerellidae, Icteridae, Paridae; Piciformes: Picidae). These clades exhibit the most extreme examples of our findings in host associations and seem to support the idea of Plasmodium being more of a host generalist and Haemoproteus potentially being very host specialized. This is congruent with the findings of previous studies that found similar relationships [42]. This relationship is still being documented and tested and is not yet fully understood as tropical environments see increased host specificity in both Haemoproteus and Plasmodium in regions with wetter dry seasons [43]. Furthermore, our results differ from a recent study that found Neotropical ecoregions with lower bird diversity contained more generalist parasites [44]. In our results, MIMPOL03 was highly specialized and found exclusively at ES, while LAIRI01, our extreme host generalist lineage was found at both ES and SAV. Perhaps the relationship between host distribution and parasite specificity in temperate migratory routes is not the same.
While the designation between the Haemoproteus subgenera (Haemoproteus and Parahaemoproteus) is described morphologically and phylogenetically, it was once attributed to exclusivity in hosts. We have recorded a Common Ground Dove parasitized by subgenus Parahaemoproteus, normally associated with parasitizing members of Passeriformes. Additionally, members of families Passerellidae, Tyrannidae, and Charadriiformes were found to be parasitized by subgenus Haemoproteus, normally associated with parasitizing members of Columbiformes. This both corresponds with and emphasizes the need for more research into the host associations, molecular phylogenetics, and morphological descriptions which help to untangle these subgenera [1,45,46].

4.3. Precipitaion

Beginning in March 2011, south Texas experienced severe drought conditions which persisted until September 2013. On the whole, however, in 2013, the annual precipitation averages for both locations returned to values similar to their respective 30 year normals (Table 1). Prevalence of positive infection in our study was significantly higher in ES than in SAV. The more arid environment of SAV is generally less conducive to the needs of each of the arthropod vectors of haemosporidian parasites.
Because rates of Plasmodium infection are significantly higher in ES than in SAV, we suggest that difference in precipitation between the two habitats leads to a much higher probability of standing water, a requirement in the reproductive cycle of mosquito vectors, at ES. The Hippoboscid flies and biting midges (Ceratopogonidae) which vector Haemoproteus can still find suitable microhabitats at SAV despite its higher aridity overall. This is perhaps related to the unique life cycle of the Hippoboscid fly [47], and the tolerance to intermittent desiccation of the eggs of biting midges [48].

5. Conclusions

While there is compelling evidence that representation of malaria-infected birds might be underrepresented when studies utilize mist-nets (a passive capture method) because of mortality and reduced locomotion in infected individuals (they are less likely to be caught) [49], it is a common, safe, and widely used method. Despite this caveat, we have developed a more robust picture of the avian malaria community and their host associations in two very different habitats in southern Texas. We found significant differences in the number of individual infections and diversity of lineages of Plasmodium in the more arid environment of SAV. We also found significant differences in our ability to detect infections between blood and tissue, and note that exclusion of tissue samples greatly changes the overall detection of infections.
The depth and breadth of information gathered in this study have helped to infer the relationships of malaria parasites with their avian hosts, the geographical context of their detection, and their detectability based on sample type; however, this hardly covers the scope of avian malaria parasites available for study in Texas. Because of its position in the central flyway, research in Texas can be a key link in the chain between North, Central, and South American birds and their parasites. Additionally, further research cataloging malaria strains, clarification in the system of naming lineages, and organization in the system of close matches of malaria strains is needed. For example, in the course of this study, determination of lineage names using the MalAvi system was problematic in that it appears that there are numerous examples where multiple named MalAvi lineages are in fact being related to a single sequence. If one sequence has multiple names, that might lead to artificially elevating the diversity of lineages present [50].

Supplementary Materials

The following supporting information can be downloaded at: https://www.mdpi.com/article/10.3390/d14050378/s1, Table S1: Table of voucher number, sample number, lineage, host, locality and GenBank accession numbers (ON455360-ON455503).

Author Contributions

J.P.P. and G.A.V. conceived of and designed this study. J.P.P. collected the samples in the field and performed the molecular analyses. J.P.P. and K.D.K. performed data analyses and K.D.K. performed statistical analyses. K.D.K. prepared the manuscript with contributions from all other authors. All authors have read and agreed to the published version of the manuscript.

Funding

This study was funded in part by the East Foundation.

Institutional Review Board Statement

This study was performed under permits and approvals to G.A.V., as listed in methods: Sampling was conducted under TAMU Animal Care and Use permits IACUC 2012-06 and 2015-0020, U.S. Fish and Wildlife Service permit MB205752, and Texas Parks and Wildlife Department permit SPR-0909-016, all to G.V.

Informed Consent Statement

Not applicable.

Data Availability Statement

Not applicable.

Acknowledgments

We would like to thank Neal Wilkins for providing us the opportunity to work on East Foundation properties. We thank anonymous reviewers for their comments and suggestions that improved the manuscript. This is publication number XXXX of the Biodiversity Research and Teaching Collections at Texas A&M, and publication number 082 of the East Foundation.

Conflicts of Interest

The authors declare no conflict of interest.

References

  1. Hernández-Lara, C.; Monteros, A.E.D.L.; Ibarra-Cerdeña, C.N.; García-Feria, L.; Santiago-Alarcon, D. Combining morphological and molecular data to reconstruct the phylogeny of avian Haemosporida. Int. J. Parasitol. 2018, 48, 1137–1148. [Google Scholar] [CrossRef] [PubMed]
  2. Lachish, S.; Knowles, S.C.L.; Alves, R.; Sepil, I.; Davies, A.; Lee, S.; Wood, M.; Sheldon, B.C. Spatial determinants of infection risk in a multi-species avian malaria system. Ecography 2013, 36, 587–598. [Google Scholar] [CrossRef]
  3. Fecchio, A.; Clark, N.J.; Bell, J.A.; Skeen, H.R.; Lutz, H.L.; De La Torre, G.M.; Vaughan, J.A.; Tkach, V.V.; Schunck, F.; Ferreira, F.C.; et al. Global drivers of avian haemosporidian infections vary across zoogeographical regions. Glob. Ecol. Biogeogr. 2021, 30, 2393–2406. [Google Scholar] [CrossRef]
  4. Ellis, V.A.; Medeiros, M.C.I.; Collins, M.D.; Sari, E.H.R.; Coffey, E.D.; Dickerson, R.C.; Lugarini, C.; Stratford, J.A.; Henry, D.R.; Merrill, L.; et al. Prevalence of avian haemosporidian parasites is positively related to the abundance of host species at multiple sites within a region. Parasitol. Res. 2017, 116, 73–80. [Google Scholar] [CrossRef]
  5. Olsson-Pons, S.; Clark, N.; Ishtiaq, F.; Clegg, S.M. Differences in host species relationships and biogeographic influences produce contrasting patterns of prevalence, community composition and genetic structure in two genera of avian malaria parasites in southern Melanesia. J. Anim. Ecol. 2015, 84, 985–998. [Google Scholar] [CrossRef]
  6. Clark, N.J.; Drovetski, S.V.; Voelker, G. Robust geographical determinants of infection prevalence and a contrasting latitudinal diversity gradient for haemosporidian parasites in Western Palearctic birds. Mol. Ecol. 2020, 29, 3131–3143. [Google Scholar] [CrossRef]
  7. Pellegrino, I.; Ilahiane, L.; Boano, G.; Cucco, M.; Pavia, M.; Prestridge, H.L.; Voelker, G. Avian Haemosporidian Diversity on Sardinia: A First General Assessment for the Insular Mediterranean. Diversity 2021, 13, 75. [Google Scholar] [CrossRef]
  8. Rodríguez-Hernández, K.; Álvarez-Mendizábal, P.; Chapa-Vargas, L.; Escobar, F.; González-García, F.; Santiago-Alarcon, D. Haemosporidian prevalence, parasitaemia and aggregation in relation to avian assemblage life history traits at different elevations. Int. J. Parasitol. 2021, 51, 365–378. [Google Scholar] [CrossRef]
  9. Krama, T.; Krams, R.; Cīrule, D.; Moore, F.R.; Rantala, M.J.; Krams, I.A. Intensity of haemosporidian infection of parids positively correlates with proximity to water bodies, but negatively with host survival. J. Ornithol. 2015, 156, 1075–1084. [Google Scholar] [CrossRef]
  10. Wood, M.J.; Cosgrove, C.L.; Wilkin, T.A.; Knowles, S.C.L.; Day, K.P.; Sheldon, B.C. Within-population variation in prevalence and lineage distribution of avian malaria in blue tits, Cyanistes caeruleus. Mol. Ecol. 2007, 16, 3263–3273. [Google Scholar] [CrossRef]
  11. Muriel, J.; Marzal, A.; Magallanes, S.; García-Longoria, L.; Suarez-Rubio, M.; Bates, P.J.J.; Lin, H.H.; Soe, A.N.; Oo, K.S.; Aye, A.A.; et al. Prevalence and Diversity of Avian Haemosporidians May Vary with Anthropogenic Disturbance in Tropical Habitats in Myanmar. Diversity 2021, 13, 111. [Google Scholar] [CrossRef]
  12. Reis, S.; Melo, M.; Covas, R.; Doutrelant, C.; Pereira, H.; de Lima, R.; Loiseau, C. Influence of land use and host species on parasite richness, prevalence and co-infection patterns. Int. J. Parasitol. 2021, 51, 83–94. [Google Scholar] [CrossRef] [PubMed]
  13. Soares, L.; Latta, S.C.; Ricklefs, R.E. Neotropical migratory and resident birds occurring in sympatry during winter have distinct haemosporidian parasite assemblages. J. Biogeogr. 2020, 47, 748–759. [Google Scholar] [CrossRef]
  14. Sibley, D. The Sibley Guide to Birds, 2nd ed.; Alfred A. Knopf: New York, NY, USA, 2014. [Google Scholar]
  15. Adler, P.H.; Roach, D.; Reeves, W.K.; Flanagan, J.P.; Morrow, M.E.; Toepfer, J.E. Attacks on the Endangered Attwater’s Prairie-Chicken (Tympanuchus Cupido Attwateri) by Black Flies (Diptera: Simuliidae) Infected with an Avian Blood Parasite. J. Vector Ecol. 2007, 32, 309. [Google Scholar] [CrossRef]
  16. Castle, M.D.; Christensen, B.M.; Rocke, T.E. Hematozoan parasites of rio grande wild turkeys from southern texas. J. Wildl. Dis. 1988, 24, 88–96. [Google Scholar] [CrossRef] [Green Version]
  17. Bertram, M.R.; Hamer, G.L.; Hartup, B.K.; Snowden, K.F.; Medeiros, M.C.; Hamer, S.A. Haemosporida prevalence and diversity are similar in endangered wild whooping cranes (Grus americana) and sympatric sandhill cranes (Grus canadensis). Parasitology 2016, 144, 629–640. [Google Scholar] [CrossRef] [Green Version]
  18. Ramey, A.M.; Reed, J.A.; Walther, P.; Link, P.; Schmutz, J.A.; Douglas, D.C.; Stallknecht, D.E.; Soos, C. Evidence for the exchange of blood parasites between North America and the Neotropics in blue-winged teal (Anas discors). Parasitol. Res. 2016, 115, 3923–3939. [Google Scholar] [CrossRef]
  19. Walstrom, V.W.; Outlaw, D.C. Distribution and Prevalence of Haemosporidian Parasites in the Northern Cardinal (Cardinalis cardinalis). J. Parasitol. 2017, 103, 63. [Google Scholar] [CrossRef]
  20. Box, E.D. Blood and Tissue Protozoa of the English Sparrow (Passer domesticus domesticus) in Galveston, Texas*. J. Protozool. 1966, 13, 204–208. [Google Scholar] [CrossRef]
  21. Harvey, J.A.; Voelker, G. Avian haemosporidian detection across source materials: Prevalence and genetic diversity. Parasitol. Res. 2017, 116, 3361–3371. [Google Scholar] [CrossRef]
  22. Paul-Murphy, J.; Engilis, A.; Pascoe, P.; Williams, C. Comparsion of pentobarbital and thoracic (cardiac) compression to euthanize anesthetized sparrows (Passer domesticus) and starlings (Sturnus vulgaris). In ExoticsCon Conference Proceedings; ExoticsCon: Atlanta, GA, USA, 2016. [Google Scholar]
  23. Seutin, G.; White, B.N.; Boag, P. Preservation of avian blood and tissue samples for DNA analyses. Can. J. Zool. 1991, 69, 82–90. [Google Scholar] [CrossRef]
  24. Drovetski, S.V.; Aghayan, S.A.; Mata, V.A.; Lopes, R.J.; Mode, N.A.; Harvey, J.A.; Voelker, G. Does the niche breadth or trade-off hypothesis explain the abundance-occupancy relationship in avian Haemosporidia? Mol. Ecol. 2014, 23, 3322–3329. [Google Scholar] [CrossRef] [PubMed]
  25. “Kite-Eating Tree” Copyright (C) 2017, R version 3.4.3; Platform: x86_64-apple-darwin15.6.0 (64-bit); The R Foundation for Statistical Computing: Vienna, Austria, 2017; Available online: https://www.R-project.org/ (accessed on 20 March 2022).
  26. RStudio Team. RStudio: Integrated Development Environment for R.; RStudio, Inc.: Boston, MA, USA, 2015; Available online: https://www.rstudio.com/ (accessed on 20 March 2022).
  27. Bensch, S.; Hellgren, O.; Pérez-Tris, J. MalAvi: A public database of malaria parasites and related haemosporidians in avian hosts based on mitochondrial cytochrome b lineages. Mol. Ecol. Resour. 2009, 9, 1353–1358. [Google Scholar] [CrossRef] [PubMed]
  28. Outlaw, D.C.; Ricklefs, R.E. Species limits in avian malaria parasites (Haemosporida): How to move forward in the molecular era. Parasitology 2014, 141, 1223–1232. [Google Scholar] [CrossRef]
  29. Darriba, D.; Taboada, G.L.; Doallo, R.; Posada, D. JModelTest 2: More models, new heuristics and parallel computing. Nat. Methods 2012, 9, 772. [Google Scholar] [CrossRef] [Green Version]
  30. Guindon, S.; Gascuel, O. A Simple, Fast, and Accurate Algorithm to Estimate Large Phylogenies by Maximum Likelihood. Syst. Biol. 2003, 52, 696–704. [Google Scholar] [CrossRef] [Green Version]
  31. Ronquist, F.; Teslenko, M.; van der Mark, P.; Ayres, D.L.; Darling, A.; Höhna, S.; Larget, B.; Liu, L.; Suchard, M.A.; Huelsenbeck, J.P. MrBayes 3.2: Efficient Bayesian Phylogenetic Inference and Model Choice across a Large Model Space. Syst. Biol. 2012, 61, 539–542. [Google Scholar] [CrossRef] [Green Version]
  32. Miller, M.A.; Pfeiffer, W.; Schwartz, T. Creating the CIPRES Science Gateway for Inference of Large Phylogenetic Trees. In 2010 Gateway Computing Environments Workshop (GCE); IEEE: New Orleans, LA, USA, 2010; pp. 1–8. [Google Scholar] [CrossRef] [Green Version]
  33. Ronquist, F.; Huelsenbeck, J.P. MrBayes 3: Bayesian phylogenetic inference under mixed models. Bioinformatics 2003, 19, 1572–1574. [Google Scholar] [CrossRef] [Green Version]
  34. Rambaut, A.; Suchard, M.A.; Xie, D.; Drummond, A.J. Tracer v1. 6. 2014. Available online: https://bioweb.pasteur.fr/packages/pack@[email protected] (accessed on 20 March 2022).
  35. Rambaut, A. FigTree v1. 4.; University of Edinburgh: Edinburgh, UK, 2014. [Google Scholar]
  36. Sutcliffe, J.F. Black fly host location: A review. Can. J. Zool. 1986, 64, 1041–1053. [Google Scholar] [CrossRef]
  37. Njabo, K.Y.; Cornel, A.J.; Sehgal, R.N.M.; Loiseau, C.; Buermann, W.; Harrigan, R.J.; Pollinger, J.; Valkiūnas, G.; Smith, T.B. Coquillettidia (Culicidae, Diptera) mosquitoes are natural vectors of avian malaria in Africa. Malar. J. 2009, 8, 193. [Google Scholar] [CrossRef] [Green Version]
  38. Lamerton, J.F. A Key to the Genera of Hippoboscidae (Diptera: Pupipara), and to the Species of Hippobosca, in Africa. East Afr. Agric. For. J. 1965, 31, 1–7. [Google Scholar] [CrossRef]
  39. Mellor, P.S.; Boorman, J.; Baylis, M. Culicoides Biting Midges: Their Role as Arbovirus Vectors. Annu. Rev. Entomol. 2000, 45, 307–340. [Google Scholar] [CrossRef] [PubMed]
  40. ArcGIS Release 10; Environmental Systems Research Institute (ESRI): Redlands, CA, USA, 2012.
  41. Bodden, H.N.; Outlaw, D.C. Diversity of Haemosporidian Parasites in Mississippi Songbirds. Southeast. Nat. 2019, 18, 314–320. [Google Scholar] [CrossRef]
  42. Mata, V.C.A. A Comparison of Avian Haemosporidian Parasite Communities across the Strait of Gibraltar. Masters Thesis, University of Porto, Lisbon, Portugal, 2012. [Google Scholar]
  43. Fecchio, A.; Wells, K.; Bell, J.A.; Tkach, V.V.; Lutz, H.L.; Weckstein, J.D.; Clegg, S.M.; Clark, N.J. Climate variation influences host specificity in avian malaria parasites. Ecol. Lett. 2019, 22, 547–557. [Google Scholar] [CrossRef] [PubMed] [Green Version]
  44. Garcia-Longoria, L.; Muriel, J.; Magallanes, S.; Villa-Galarce, Z.H.; Ricopa, L.; Inga-Díaz, W.G.; Fong, E.; Vecco, D.; Guerra-Saldaña, C.; Salas-Rengifo, T.; et al. Diversity and host assemblage of avian haemosporidians in different terrestrial ecoregions of Peru. Curr. Zool. 2022, 68, 27–40. [Google Scholar] [CrossRef]
  45. Levin, I.I.; Valkiūnas, G.; Santiago-Alarcon, D.; Cruz, L.L.; Iezhova, T.A.; O’Brien, S.L.; Hailer, F.; Dearborn, D.; Schreiber, E.A.; Fleischer, R.C.; et al. Hippoboscid-transmitted Haemoproteus parasites (Haemosporida) infect Galapagos Pelecaniform birds: Evidence from molecular and morphological studies, with a description of Haemoproteus iwa. Int. J. Parasitol. 2011, 41, 1019–1027. [Google Scholar] [CrossRef]
  46. Jaramillo, M.; Rohrer, S.; Parker, P.G. From Galapagos doves to passerines: Spillover of Haemoproteus multipigmentatus. Int. J. Parasitol. Parasites Wildl. 2017, 6, 155–161. [Google Scholar] [CrossRef]
  47. Baker, J.R. A Review of the Role Played by the Hippoboscidae (Diptera) as Vectors of Endoparasites. J. Parasitol. 1967, 53, 412. [Google Scholar] [CrossRef]
  48. McDermott, E.G.; Mullens, B.A. Desiccation Tolerance in the Eggs of the Primary North American Bluetongue Virus Vector, Culicoides sonorensis (Diptera: Ceratopogonidae), and Implications for Vector Persistence. J. Med. Entomol. 2014, 51, 1151–1158. [Google Scholar] [CrossRef] [Green Version]
  49. Mukhin, A.; Palinauskas, V.; Platonova, E.; Kobylkov, D.; Vakoliuk, I.; Valkiūnas, G. The Strategy to Survive Primary Malaria Infection: An Experimental Study on Behavioural Changes in Parasitized Birds. PLoS ONE 2016, 11, e0159216. [Google Scholar] [CrossRef] [Green Version]
  50. Keith, K.D.; Weesner, R.; Voelker, G. Malavi Meta. Texas A&M University, College Station, TX 77843, USA. 2022; Unpublished Manuscript. [Google Scholar]
Figure 1. Map of Texas showing locations of East Foundation Properties. El Sauz and San Antonio Viejo ranches were utilized in this study from 2013 to 2015. For further reference, the El Sauz headquarters is located at 26.537 latitude, −97.448 longitude. The San Antonio Viejo headquarters is located at 26.955 latitude, −98.834 longitude.
Diversity 14 00378 g001
Figure 2. Bayesian analysis of all Leucocytozoon and Plasmodium sequences collected from blood and tissue in this study. Bold text indicates samples from SAV, and regular weight text refers to ES samples. Asterisks indicate sequence greater than 1 bp and 99% or less similarity with MalAvi closest match, and which were given new lineage designations.
Diversity 14 00378 g002
Figure 3. Bayesian analysis of all Haemoproteus sequences collected from blood and tissue in this study. Bold text indicates samples from SAV, and regular weight text refers to ES samples. Asterisks indicate sequence greater than 1 bp and 99% or less similarity with MalAvi closest match, and which were given new lineage designations.
Diversity 14 00378 g003
Table 1. Prevalence and detection rates for data from El Sauz (ES) and San Antonio Viejo (SAV) from 2013 to 2015, as well as each broad category of analysis, including overall, sample material, and sample locality.
NumberDetection Rate
TotalPositiveNegativeOverallHaemoproteusLeucocytozoonPlasmodium
Overall57614842825.69%50.68%4.05%42.57%
Blood28110317836.65%46.60%2.91%46.60%
Tissue2954525015.25%60.00%6.67%33.33%
SAV2603822214.62%44.55%3.64%48.18%
ES31611020634.81%68.42%5.26%26.32%
Table 2. Number of lineages recovered by location (ES and SAV) and by sample type (# of previously known lineages/# of novel lineages), as well as lineages recovered from blood only, tissue only, or both.
LineageESSAVBothTotal
Haemoproteus13/126/73/316/16 (32)
Leucocytozoon2/11/10/03/2 (5)
Plasmodium14/74/04/014/7 (21)
LineageBlood OnlyTissue OnlyBothTotal
Haemoproteus(43.8%) 14(34.4%) 11732
Leucocytozoon(40.0%) 2(40.0%) 215
Plasmodium(52.4%) 11(28.6%) 6421
Table 3. Datasets A–E reporting statistical contingencies using the chi-squared test of independence and Fisher’s Exact Test (FET). (A) Test for significance of difference in detection between sample material types (blood and tissue). (B) Test for significance of difference in detection between sample sites (ES and SAV). (C) Test for significance of difference in detection by sample type between sample localities. (D) Test for significance in detection of genera between sample material. (E) Test for significance of difference in detection of genera between sample localities.
DatasetPositiveNegativedfX2p-ValueFET95% CIp-Value
ABlood103178133.41<0.0013.2082.121–4.910<0.001
Tissue45250
ES110206129.42<0.0013.1142.028–4.857<0.001
BSAV38222
ESSAV
Blood8914123.878<0.0017.1432.992–17.779<0.001
CTissue2124
HaemoproteusPlasmodium
Blood484811.8620.1720.5580.243–1.2440.140
DTissue2715
ES495313.3350.0212.7921.159–7.1880.019
ESAV2610
Table 4. Numbers of migratory and resident (present year-round) birds infected by Haemoproteus, Leucocytozoon or Plasmodium. Migratory birds include those that breed in south Texas (Breeding), those that migrate through south Texas (migrant) and those that winter in south Texas (Winter).
HaemoproteusBreedingMigrantWinterResident
El Sauz105430
San AV41133
total146563
Leucocytozoon
El Sauz0130
San AV1001
total1131
Plasmodium
El Sauz1314620
San AV3203
total1616623
Table 5. Chi-squared tests of independence between non-resident and resident birds by parasite genus and sampling site. See Table 6 for categorizations of each species by migratory or year-round status.
Non-ResidentResidentdfX2p-Value
Haemoproteus2563116.95<0.001
Plasmodium3823
ES5650110.93<0.001
SAV1237
Table 7. Annual precipitation levels (in centimeters) for the two sampling localities for a 5 year period including the years of this study (2013–2015).
Locality 20112012201320142015
El Sauz (coastal)38.4441.3260.0697.38100.4
San Antonio Viejo (inland)26.5140.3354.5747.574.16
Publisher’s Note: MDPI stays neutral with regard to jurisdictional claims in published maps and institutional affiliations.

