Article

Genetic and Population Structure of Croatian Local Donkey Breeds

1
Department of Animal Science and Technology, Faculty of Agriculture, University of Zagreb, Svetošimunska Cesta 25, 10000 Zagreb, Croatia
2
DAFNAE—Department of Agronomy, Food, Natural Resources, Animals, and Environment, University of Padova, Via dell’Università 16, 35020 Legnaro, PD, Italy
3
Agency for Rural Development of Istria, Ulica Tugomila Ujčića 1, 52000 Pazin, Croatia
4
Department of Livestock Production, Croatian Agency for Agriculture and Food, Vinkovačka Cesta 63c, 31000 Osijek, Croatia
*
Author to whom correspondence should be addressed.
Diversity 2022, 14(5), 322; https://doi.org/10.3390/d14050322
Submission received: 25 March 2022 / Revised: 20 April 2022 / Accepted: 20 April 2022 / Published: 21 April 2022

Abstract

:
The two native Croatian donkey breeds (Littoral-Dinaric donkey and Istrian donkey) were marginalized in the second half of the 20th century and were on the verge of biological extinction. The aim of this study was to analyze the demographic and genetic status of two donkey breeds, two decades after the start of protection by analyzing their pedigrees and genetic structure. The average generation interval was higher for the Istrian donkey (7.73) than for the Littoral-Dinaric donkey (7.27). The rate of the effective number of founders compared with the effective number of ancestors in the Littoral-Dinaric donkey (1.03; 325/316) and in the Istrian donkey (1.08; 70/65) revealed no evidence of a genetic bottleneck. The inbreeding coefficient (F) and the average relatedness coefficient (AR) was lower in the Littoral-Dinaric donkey population (0.99%; 0.13%) than in the Istrian donkey population (1.77%; 1.10%). Genetic microsatellite analysis showed relatively high genetic diversity in Littoral-Dinaric donkey and Istrian donkey breeds, expressed by mean allele number (5.92; 5.85) and expected heterozygosity (0.650; 0.653). Genetic differentiation between the Littoral-Dinaric donkey and the Istrian donkey has not significantly increased in the last two decades (FST = 0.028). Genetic analysis also showed no evidence of high inbreeding or genetic bottleneck in both breeds. A total of 11 haplotypes including 28 polymorphic sites were found in 30 samples. Analysis of mtDNA has shown that the Littoral-Dinaric donkey and Istrian donkey breeds belong to the Equus asinus africanus group. The study confirms the need to use different analytical approaches to get a regular and complete insight into the situation and trends within and between breeds, so that the existing diversity can be fully preserved.

Graphical Abstract

1. Introduction

Donkey breeds, similarly to other domestic animal species, are an important part of national, regional, and global genetic resources. The total number of donkey breeds in the world is a relatively small proportion (178; 2.8%) of the world’s mammalian breeds [1]. In the 19th and 20th centuries, local donkey breeds came under extinction pressure as they lost their function as working animals in the community, especially as pack animals and riding animals. The number of extinct donkey breeds in relation to the total number of donkey breeds is relatively low (4; 2.2%), a large number of breeds are “at risk” (22.5%), and for most donkey breeds, their endangered status is unknown (128; 71.9%) [1]. The donkey is an animal of arid areas, whose importance may be significant if climate change and global warming occurs.
In Croatia, especially in the Mediterranean region, donkeys have lived for thousands of years and are mainly used as transport and riding animals, as well as for lighter work in agriculture. Their adaptability, hardiness, and working endurance to work under modest feeding and housing conditions are particularly appreciated. Donkey milk was occasionally used in the past in traditional medicine to treat bronchitis (whooping cough) or to feed young children. Donkey meat is not consumed in most parts of Croatia, except in Istria, where it is traditionally consumed. In the mid-20th century, the donkey population in Croatia was over 50,000 [2]. During a period of adaptation to the ecological niche, natural and human selection, two donkey breeds were profiled. The Littoral-Dinaric donkey (LDD) of a smaller body size (height at withers ≈ 97 cm) was kept in Dalmatia and the Istrian donkey (ID), a larger and stronger donkey with an average height at withers of about 124 cm, was bred in Istria [3]. In addition to size, these two breeds also differ in coat color. The dominant color of the Littoral-Dinaric donkey is gray with a pronounced cross (black thick line along the back and over the shoulder blades) and dark “zebras” (stripes along the legs), whereas the Istrian donkey is predominantly black, without the pronounced “cross” and “zebras”. More information about the donkey breeds phenotype is attached (see File S1). By the end of the 20th century, only a few hundred donkeys remained, and both breeds were “critically endangered”. Two decades ago, a program was initiated to protect and conserve them, which, together with the popularization of the breeds, led to a recovery of the population of these breeds. Local donkey breeds are part of the identity and traditions of the Mediterranean region of Croatia, and they help preserve rural vitality, traditions, ecosystem services, and landscape conservation.
The conservation of breeds is a prerequisite for the preservation of genetic diversity and relationships within and between populations [4]. Genealogical data are the basis for selection, especially for monitoring the conservation strategy and the genetic diversity of endangered donkey breeds. The usefulness of pedigree analysis has been observed in numerous studies, such as the Catalonian donkey [5], Amiata donkey [6], Martina Franca donkey [7], Asinina de Miranda [8], Pêga donkey [9], and Andalusian donkey [10]. Pedigree analyses allow for the evaluation of the degree of inbreeding and population structuring [11]. Previous studies on the Littoral-Dinaric donkey and Istrian donkey populations included phenotype analysis [3] and genetic analysis [12,13]. Pedigree analysis has not yet been performed because the breed was published (closed) in Studbooks only decades ago.
Over the last 20 years, microsatellite genotyping was used for evaluating genetic diversity, population structure, and the level of relatedness of numerous donkey populations: Spanish donkey [14], Italian donkey [15,16,17], American donkey [18], Balkan donkey [19], Turkey donkey [20] populations, and others. The genetic diversity of the Croatian donkey population has been studied previously [13], but the number of markers was limited to eight, and continuing to use microsatellites, with a larger number of markers, allows a direct and homogeneous comparison with the previous studies.
Mitochondrial DNA (mtDNA) is a recognized tool for resolving phylogenetic relationships because of its special properties such as: more copies than nuclear DNA, well-known gene structure, lack of introns, high-mutation rate, and absence of recombination events [21]. Moreover, mtDNA follows a rigid maternal inheritance that has provided significant insights into the maternal history of many modern livestock species, complementing the paternal legacy of the Y chromosome [22], and has been used to study domestication history. MtDNA contains a non-coding control region, also called the displacement-loop region (D-loop) [23]. Previous studies of donkey mtDNA D-loop (control region) sequences depicted the genetic relationships and origin of worldwide modern donkey breeds well [19,24,25,26,27,28,29,30,31].
Therefore, the main objective of this study was to assess the status and structure of the two local donkey breeds, the trends and risks—with particular emphasis on pedigree and genetic diversity—and to place them in the context of maintaining the breeds’ genetic profile. The second aim of this study was to determine the relationship between two Croatian donkey breeds and donkey breeds from other countries using mtDNA analysis.

2. Materials and Methods

2.1. Pedigree Analysis

The Studbook data of the Istrian donkey and Littoral-Dinaric donkey up to 2020 were analyzed. The genealogical information was traced back to the founder animals, the oldest of which was born in 1972. The created database consists of the pedigree information for 1233 Istrian donkeys and 5030 Littoral-Dinaric donkeys. For each animal in the database, information such as the UELN (Universal Equine Life Number), name of the individual, date of birth, sex, and pedigree information were collected. The reference populations consist of those animals that are potentially contributing to the next generation. In this study, animals with two known parents were chosen as the first reference population (REF 01), and active (living) donkeys of both sexes were selected as the second reference population (REF 02).
Pedigree analysis was conducted using the ENDOG v4.8 software [11]. Several analyses were carried out to evaluate the pedigree and population parameters. Pedigree completeness was observed through the mean number of complete generations, the mean number of maximum generations, and the mean number of equivalent generations [32].
Parameters related to inbreeding (mean inbreeding coefficient (F), mean average relatedness coefficient (AR), effective population size (Ne)), probability of gene origin (effective number of founders (fe), effective number of ancestors (fa), effective number of founder herds (fh)), genetic contributions of the founders and ancestors (genetic conservation index (GCI), and generation interval (GI)) were assessed. The average relatedness coefficients and individual inbreeding coefficients were calculated based on Gutiérrez and Goyache [11]. Boichard et al. [32] define fe as the number of equally contributing founders that will produce the same genetic diversity as in the assessed population, and fa as the minimal number of ancestors necessary to explain the genetic diversity in the reference population. The effective number of founders (fe) was computed by the formula fe = 1/∑ (pi2), where pi is the proportion of the genes of the descendant population contributed by founder i [33]. The effective number of ancestors (fa) was calculated on the basis of qi as the marginal genetic contribution of ancestor i (fa = 1 / ∑ qi2) [32]. The ratio between the effective number of founders (fe) and effective number ancestors (fa), as an indicator of a population bottleneck, were calculated according to Boichard et al. [32] The genetic conservation index was calculated on the basis of the proportion of genes of founder i (pi) in the pedigree of an animal (GCI = 1 / ∑ pi2) [34]. Generation intervals (GI) were calculated as the average age of the parents at the birth of the progeny subsequently used for reproduction, as well as the average age of the parents of all offspring [35,36], and were calculated for the following four paths: father—daughter/son, and mother—daughter/son. The four pathways were compared pairwise using independent sample t-tests.

2.2. Microsatellite Analysis

Hair root samples were collected from 60 Littoral-Dinaric donkeys (45 female and 15 male animals in age from 4 to 9 years) and 60 Istrian donkeys (43 female and 17 male animals in age from 4 to 10 years) reared on different breeding farms in the Mediterranean part of Croatia (Littoral-Dinaric donkey in Dalmatia, Istrian donkey in Istria). Sampling was achieved among minimally related individuals using pedigree information and breeder’s information. DNA extraction and genotyping were performed in an authorized laboratory. Thirteen microsatellite loci (AHT4, HMS2, HMS7, TKY297, TKY343, ABS23, HMS3, HTG10, TKY312, HMS18, HMS6, HTG7, TKY337) which have been recommended for individual identification and parentage verification of equines, were screened from the set recommended by the International Society for Animal Genetics (ISAG) and previous reports [37,38].
Genetic diversity parameters were estimated for each microsatellite locus and across all loci for each population by total (NA), effective (NAE), and private number of alleles (NP), unbiased estimates for observed (HO) and expected (HE) heterozygosity, and migration rate (Nm), using GenAlEx 6.5 [39].
Effective (NAE) are calculated as follows:
N A E = 1 p i 2
where is pi is frequency of the i-th allele in a locus and p i 2 is the sum of the squared population allele frequencies.
Unbiased estimates for observed (HO) heterozygosity is calculated as the proportion of N samples that are heterozygous at a given locus. Expected (HE) heterozygosity is calculated as:
H E = 1 p i 2
where HE is the expected heterozygosity (i.e., the proportion of heterozygosity expected under random mating), and pi is the allele frequency of the i-th allele.
Migration rates (Nm) are calculated as follows:
N m = 1 F S T 1 / 4
where F S T is Wrights fixation index calculated on the basis of the average expected heterozygosity of the subpopulations ( H E ¯ ) and the expected heterozygosity of the total population ( H T ).
Cervus software version 3.0.7. [40] was used to calculate the null allele frequency (F(null)) and polymorphic information content (PIC) using the following equations:
P I C i = 1 j = i n p i j 2
where pij is the frequency of the j-th allele for marker i and the summation extends over n alleles.
The Wright’s F statistics (FST, FIS and FIT) as proposed by Weir and Cockerham [41], and the allelic richness (AR), were computed using FSTAT Version 2.9.3 [42]. Fisher’s exact test was performed to test possible significant departures from the Hardy–Weinberg (HW) proportions using GenePop 4.3 [43]. p-values of the heterozygote deficit and the excess for each locus were obtained simultaneously.
Genetic relationships among individuals were represented using factorial correspondence analysis (FCA) performed with the option of using 3D over populations with Genetix 4.05 software [44]. Likelihood test of breed assignment and analysis of molecular variance were performed using the GenAlEx 6.5 [39]. Heterozygosity-excess was quantified using the approach of Cornuet and Luikart [45], implemented in the program Bottleneck 1.2.02 [46], and shifted away from an L-shaped distribution of allele frequencies.

2.3. Mitochondrial DNA Analysis

MtDNA was extracted from blood samples of 15 unrelated older female animals (older than 14 years, bred in different and geographically dispersed herds) per donkey breed (30 samples in total). Based on the complete donkey mtDNA sequence (GenBank X97337) [21], two pairs of primers were designed (5′-AGTCTCACCATCAACCCCCAAAGC-3′ and 5′-CCTGAAGTAGGAACCAGATG-3′) to amplify a 358 bp fragment of the hypervariable D-loop region comprised between sites 15,479 and 15,837. Amplification was performed on an MJ Research PTC-100 thermal cycler with the following conditions: initial denaturation at 95 °C for 5 min, followed by 32 cycles of 94 °C (1 min) at 52 °C (30 s) and 72 °C (1 min), and a final extension at 72 °C (5 min). Fragments were sequenced using the ABI PRISM BigDye Terminator Cycle Sequencing Ready Reaction Kit and an ABI PRISMTM® 310 Genetic Analyzer. Multiple alignments of mtDNA sequences were performed using the Clustal-W program (Version 1.82, 2001), and were analysed with MEGA software version X [47].

3. Results

3.1. Pedigree

The demographic data of the Littoral-Dinaric donkey and Istrian donkey populations are shown in Figure 1. The number of animals per year constantly grew in the two last decades. The growing trend in the size of populations is the result of the establishment of programs for their protection, the definition of breeding programs, the establishment of Studbook registers (opened during the inventory of populations), the promotion of breeds (tourism, hobby, milk, meat), the establishment of breeding associations, breeding exhibitions, and other activities. In the period from 2012 to 2014, stagnation is observed, mainly due to changes in the support system for breeders of native breeds (adaptation to the EU legal framework; Croatia joined the EU in 2013) and the Studbook registers closed.
In the 2020 Littoral-Dinaric donkey population, 43.1% of adult males and 68.0% of females are reproductively active, and in the Istrian donkey population, reproductive activity is similar (50.9% males and 65.7% females). About half of the adult males occasionally participate in reproduction to reduce inbreeding (stallion rotation). The age structure of the donkey populations is favorable. In the living populations of Littoral-Dinaric donkeys and Istrian donkeys (REF 02), 32.7% and 33.9% were the three years of age, respectively (Figure 2). In the populations of the Littoral-Dinaric donkey and Istrian donkey, only 11.0% and 10.5% were older than 20 years, respectively. The number of active Littoral-Dinaric donkey and Istrian donkey breeders in 2020 is 809 and 158, respectively, and the average herd size is 4.1 and 4.8 animals, respectively.
An analysis of all pedigree entries of the Littoral-Dinaric donkey population revealed 2724 animals for which both parents were known (REF 01, Table 1). The active living reference population (REF 02) consisted of 3.296 animals. An analysis of pedigree records of the Istrian donkey population revealed 897 animals for which both parents were known. The living population (REF 02) of the Istrian donkey population consisted of 758 animals.
The effective number of founders (fe) and ancestors (fa) for the Littoral-Dinaric donkey was 325 and 316, respectively (Table 1). The ratio between fe and fa is 1.03, indicating the absence of a bottleneck in the populations. A similar ratio between fe and fa is observed in Istrian donkeys (1.08), and does not indicate a bottleneck, which is confirmed by the results of microsatellite analysis.
The average inbreeding coefficient (F) in the Littoral-Dinaric donkey population was 0.99%, and ranged from a minimum of 0.02% (2000, the beginning of breeding consolidation and a larger number of founders) to a maximum of 0.99% (2020) (Figure 3). In the last decade, the average inbreeding range was constantly growing, from 0.28 to 0.99, indicating some problems in mating schemes. The average inbreeding in the population of the Istrian donkey was 1.77%, ranging from a minimum of 0.11% (2000, the beginning of breed consolidation) to a maximum of 1.77% (2020). In recent years, the average inbreeding coefficient ranged from 1.79% to 1.77%. The mean AR coefficient in the Istrian donkey population was 1.10%. The effective population size calculated via individual increase in inbreeding is 25.99 and is lower than in the Istrian donkey population (32.78).
The mean value of the genetic conservation index (GCI) in the Littoral-Dinaric donkey populations is 1.76 ± 0.89 and the value of the GCI in REF 02 was 1.88 ± 0.93. The GCI calculated for sex was 1.84 ± 0.90 in females and 1.95 ± 0.96 in males. The mean value of the GCI in the Istrian donkey populations is 2.42 ± 1.41. The mean value of the GCI in REF 02 was 2.64 ± 1.50, and GCI calculated for sex was 2.59 ± 1.44 in females and 2.78 ± 1.65 in males.
The mean number for the maximum number of traced generations in the Studbook for the Littoral-Dinaric donkey and Istrian donkey populations was 1.01 and 1.80, respectively, and the mean number of complete generations was relatively low at 0.56 and 0.88, respectively. Figure 4 shows the completeness of total pedigrees and REF 02 populations of the Littoral-Dinaric donkey and Istrian donkey.
The REF 02 populations of the Istrian donkey had a high completeness value in the first two generations (96.94% and 51.68%, respectively), whereas in the third generation, completeness decreased to 18.59%, and in the population of the Littoral-Dinaric donkey, the completeness value is lower (60.21%, 24.28%, and 5.52%, respectively). Beyond the fifth parental generation, the completeness of both donkeys’ REF 02 populations was close to zero.
Estimates of the average age of parents at the birth of their offspring in the Istrian donkey and Littoral-Dinaric donkey populations ranged from 7.41 to 7.79 years, respectively (Table 2). Higher values are observed in the Littoral-Dinaric donkey population in the mother-daughter pathway (7.79 ± 4.296), compared with the father-daughter pathway (p < 0.02). Considering all pathways, the average age of parents at the birth of their offspring was 7.50 ± 4.067 years in the Istrian donkey populations, and 7.59 ± 4.057 years in the Littoral-Dinaric donkey populations. The average generation interval in the Istrian donkey population was 7.73 ± 3.94 years and ranged from 7.53 ± 3.84 (mother-daughter) to 7.89 ± 3.91 (father-daughter). The average generation interval in the Littoral-Dinaric donkey population was 0.47 years less (7.27 vs. 7.73 years).

3.2. Microsatellite Variability and Genetic Diversity Indices

All 13 microsatellite markers were polymorphic in the whole sample and in each breed. The basic parameters of genetic diversity across microsatellites are presented in Table 3. A total of 83 alleles (NA) were found, ranging from 3 (HMS6) to 10 (HTG7) per locus, with a mean of 6.31. The average values for ENA and AR were 3.317 and 6.017, respectively.
The abundance of genetic variation in microsatellite loci was indicated by a mean value of PIC index (PIC = 0.624) and 86% of them were highly polymorphic [48]. The estimated null allele frequency (F(null)) of all 13 microsatellites has values below 20% (varying from −0.030 HMS18 to 0.114 HMS6) and was suitable for genetic analyses. The Ewens–Watterson neutrality showed that none of the tested markers favored any kind of selection, as the F values (sum of square of allele frequency) were within the upper and lower limits of the 95% confidence interval. This shows the suitability and utility of these markers for genetic diversity studies
The average observed heterozygosity was lower (HO = 0.648) than the expected heterozygosity (HE = 0.673), resulting in a positive, but not significant, inbreeding coefficient (FIS) of 1.4%. Of the 13 loci examined, all were within the Hardy–Weinberg equilibrium, with the exception of HMS3, which had a significant excess of heterozygotes of 0.048 (p < 0.01) (Table 3). The overall inbreeding index FIT averaged 0.058 and no loci made a significant contribution. The overall FST index revealed that 4.5% of the total genetic variation observed in the sample is explained between breeds. Since most of the total genetic variability comes from differences among individuals (95.5%), and only 4.5% is due to differences between breeds, a low level of genetic differentiation exists between the populations studied. The locus that contributed most to the differentiation of the samples was HMS6, whereas ABS23 proved to be a nondiscriminatory marker (Table 3). A low level of population differentiations contributes to a high migration rate of the samples and loci overall (Nm = 12.431).
Summary statistics describing microsatellite marker polymorphisms and genetic diversity per breed are presented in Table 4. Allelic variability between the two breeds was almost identical, with an average NA and ENA of 5.85 and 3.33 for Istrian donkeys and 5.93 and 3.31 for Littoral-Dinaric donkeys, respectively. Of the total 83 alleles, 11 alleles were private (PA), which were evenly represented between the Istrian donkey (PA = 5) and Littoral-Dinaric donkey (PA = 6) breeds. The highest frequency of PA was observed in the Littoral-Dinaric donkey breed (AHT 4, PA = 0.233), whereas the frequencies of the other PA ranged from 0.008 to 0.05 for both breeds. The mean HO and HE heterozygosity between breeds were very close, 0.640 and 0.653 for Istrian donkeys and 0.656 and 0.650 for Littoral-Dinaric donkeys. A loss of heterozygotes was observed in the Istrian donkey (2.9%), to which two loci gave a relevant significant contribution (HMS3 and HMS6). On the contrary, an excess of heterozygotes (0.2%) in the Littoral-Dinaric donkey population significantly contributed AHT4 and HMS3 markers.
The scatter plot of the factorial correspondence analysis (FCA) summarizes the individual relationships in metric space, in which the first axis and second axis contribute to total variation with 5.87% and 5.51%, respectively (data not shown). FCA did not reveal a defined grouping between Istrian donkey and Littoral-Dinaric donkey populations, although there is some indication of separation. The results of the GenAlEx assignment test revealed that 93% of the animals could be assigned to the population from which they were sampled. The highest percentages of individuals assigned to their original population occurred in the Istrian donkey (94.8%) and Littoral-Dinaric donkey populations (91%) (Figure 5).
The Wilcoxon test showed no significant results for population bottleneck under the stepwise mutation model (SMM) for Istrian donkeys (p = 0.729) and Littoral-Dinaric donkeys (p = 0.773). The qualitative graphical method based on the allele frequency spectra showed no shift in the allele frequency distribution, and a normal L-shaped curve was observed; thus, these results point to the population resilience of the Istrian donkey and Littoral-Dinaric donkey.

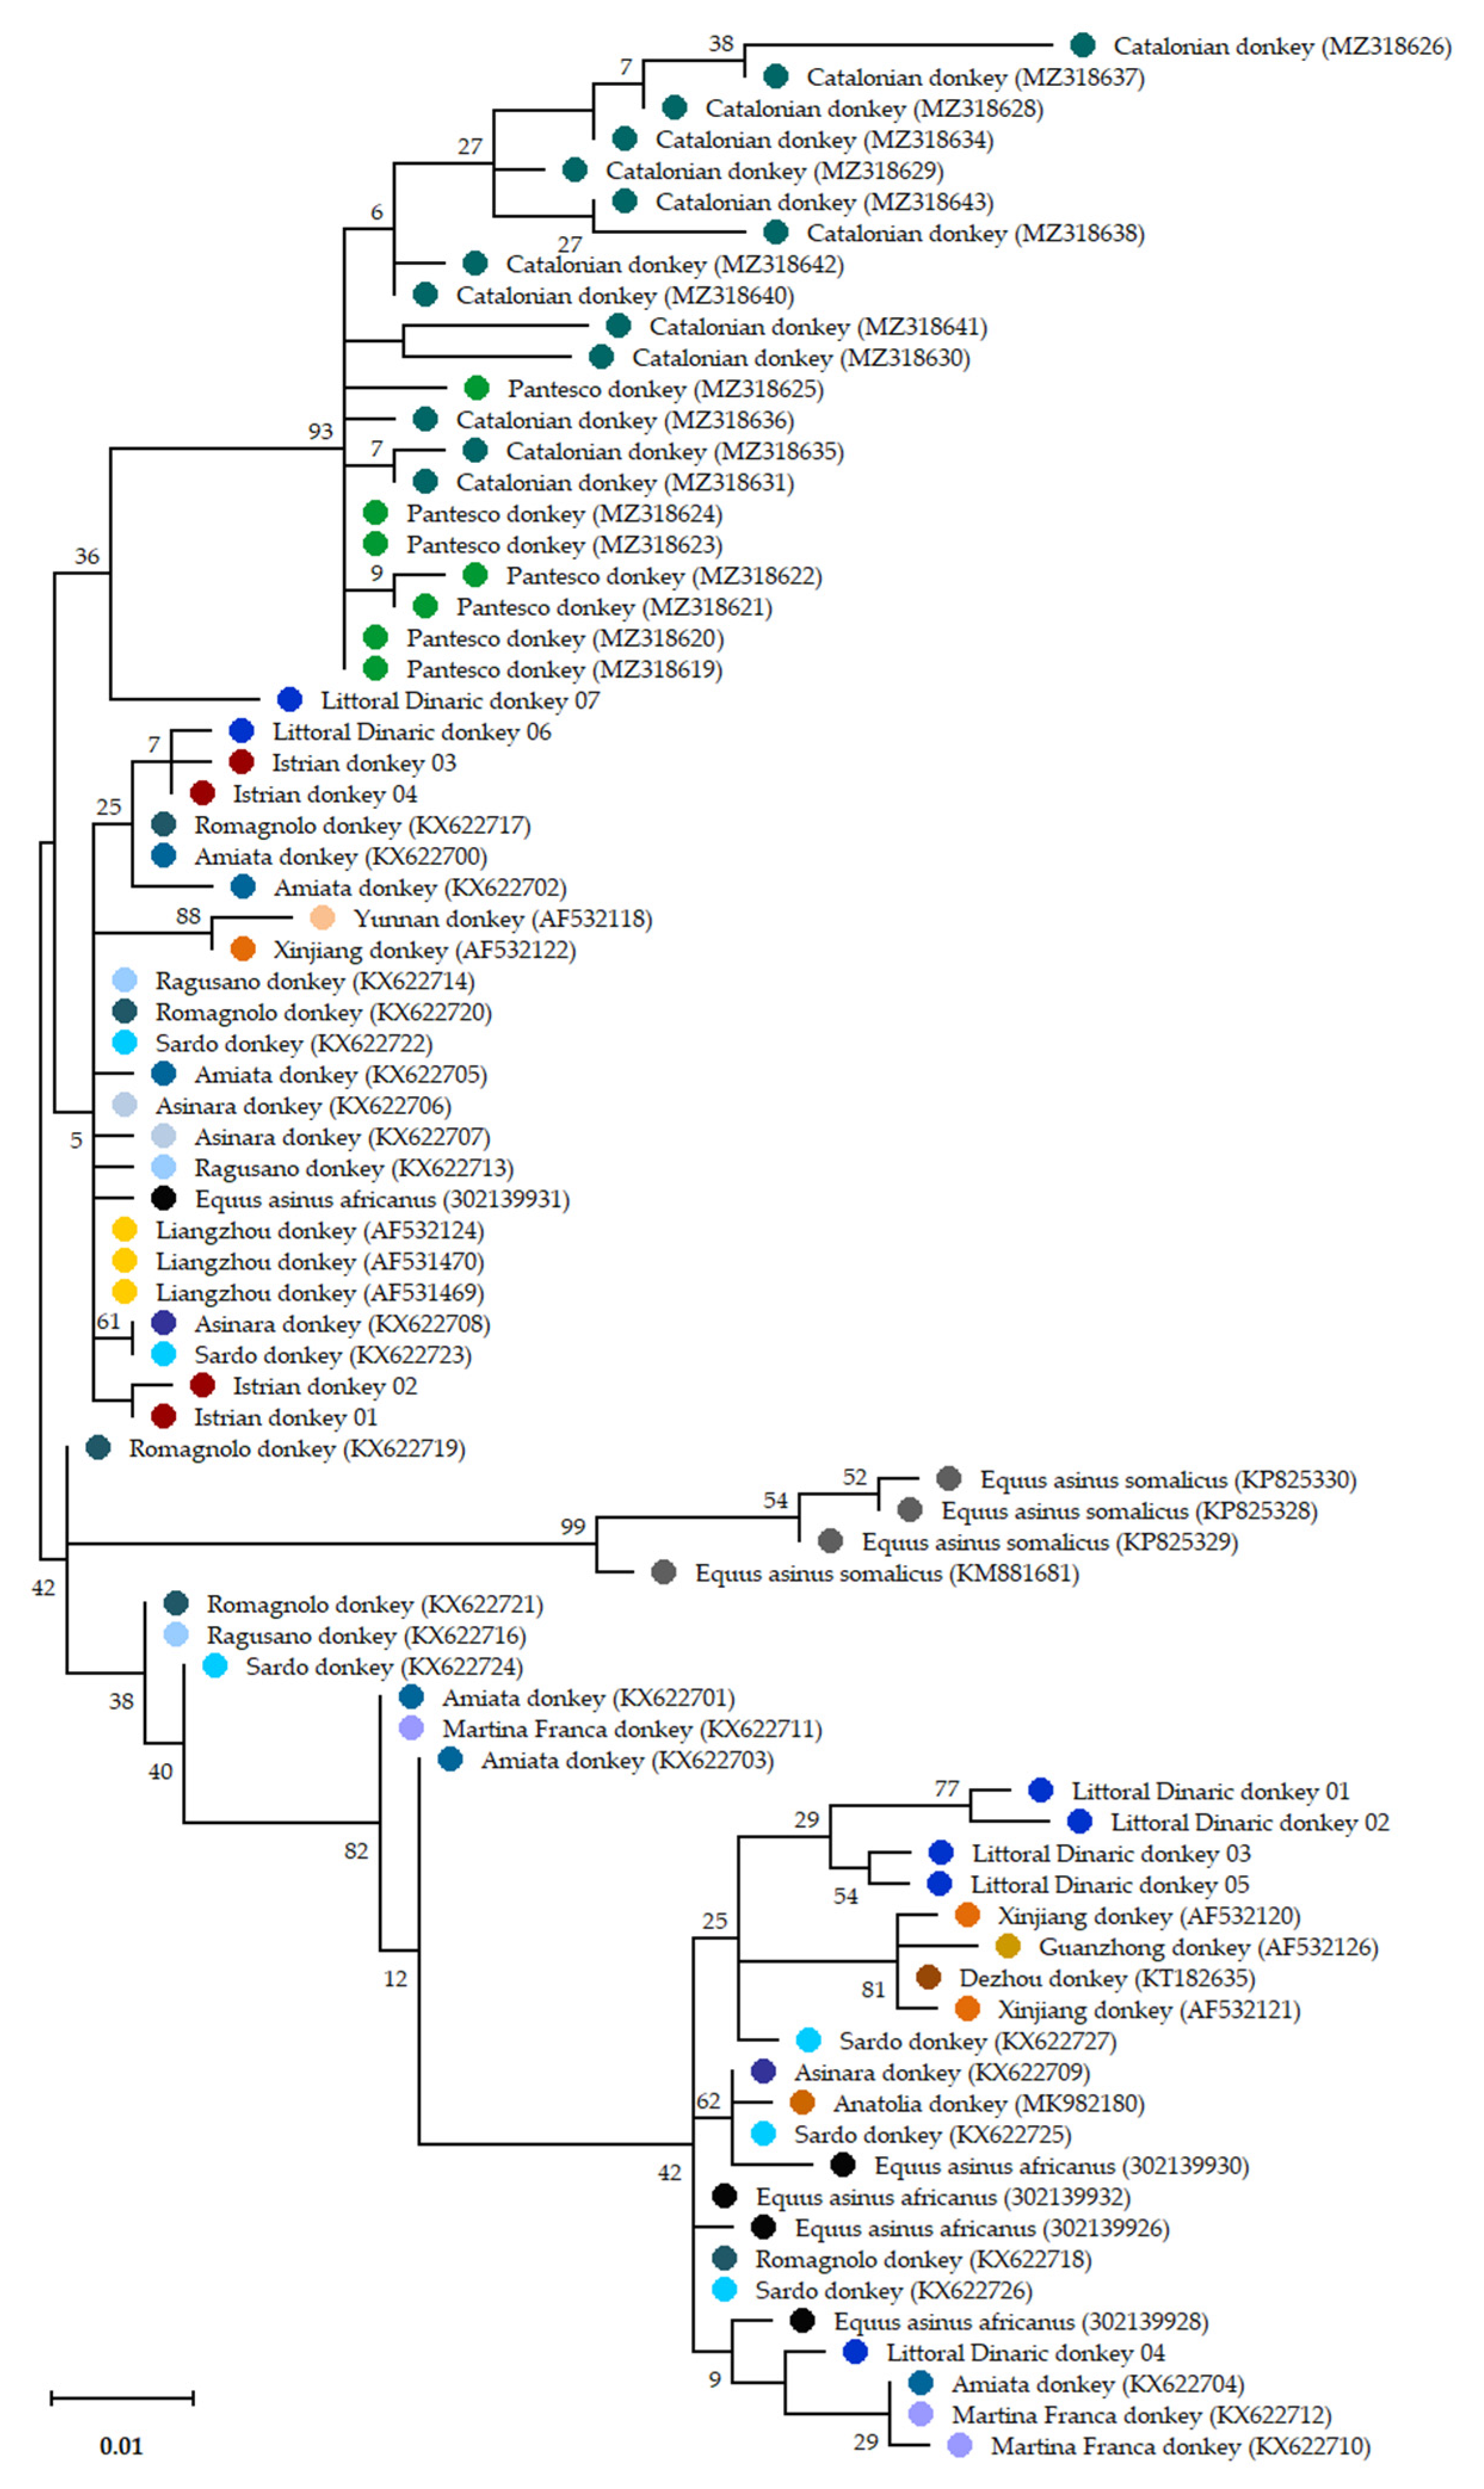
3.3. Mitochondrial Variability and Relationship with Other Donkey Breeds

Based on the 358-bp fragment of the D-loop region of the mtDNA, seven different haplotypes were identified in the Littoral-Dinaric donkey population and four haplotypes were identified in the Istrian donkey population. Twenty-seven polymorphic sites were caused by transitions or transversions, although one polymorphic site was the result of an insertion. Nucleotide sequence diversity among all haplotypes ranged from 0.27% to 5.77%. The mean group distance within the Littoral-Dinaric donkey haplotypes was 0.031, and within the Istrian donkey haplotypes it was lower, at 0.005.
To further analyse the phylogenetic relationship of the donkeys studied, they were compared with sixty-nine publicly available mtDNA D-loop sequences of donkey breeds from other countries (https://www.ncbi.nlm.nih.gov/gene/ (accessed on 17 January 2022)). The basic observation is that the Littoral-Dinaric donkey and the Istrian donkey belong to the phylogenetic group Equus asinus africanus (d = 0.030, d = 0.040), and a clear separation from the group Equus asinus somalicus can be observed (d = 0.067, d = 0.049) (Figure 6). The mtDNA sequences of the Istrian donkey are structured by two phylogenetic groups (haplo-group A, sequence ID 01 and ID 02; haplo-group B, ID 03 and ID 04), but the genetic distance between the groups is small (d = 0.006). The mtDNA sequence of the Littoral-Dinaric donkeys were also divided into two phylogenetic groups (haplo-group C, sequence LDD 01, LDD 02, LDD 03, LDD 04, and LDD 05; haplo-group D, LDD 06, and LDD 07), and the genetic distance between haplo-group C and D is moderate (d = 0.039). The Littoral-Dinaric donkey haplo-group D vs. haplo-group C are closer to the Istrian donkey haplo-group A and haplo-group B (d = 0.018 vs. d = 0.046).
Two phylogenetic groups of the Istrian donkey (haplo-group A and haplo-group B) are phylogenetically closely related to the Ragusano donkey (d = 0.006, d = 0.009), and the distance from the Romagnolo donkey, Asinara donkey, and Amiata donkey increases (d = 0.014–0.020). The highest distance is between the Istrian donkey and the Sardo donkey /Martina Franca donkey (d = 0.029, d = 0.034). Between two phylogenetic haplo-groups of the Littoral-Dinaric donkey, haplo-group C is more distant from the Italian donkey breeds (d = 0.026–0.044) than haplo-group D (d = 0.020–0.031). The Istrian donkey is also phylogenetically more closely related to the Catalonian donkey than to the Littoral-Dinaric donkey (d = 0.029–0.033 vs. 0.042–0.061).

4. Discussion

Breeding consolidation activities of the Littoral-Dinaric donkey and Istrian donkey populations were initiated at the end of the 20th century. In the first phase, an inventory of the remaining donkey population in Croatia was conducted, as well as research on phenotype. Once the breed standards were established, animals that met the requirements were entered into the Pre-Book during the inventory process over the next decade. In 2010, a main breed studbook was established, in which the animals from the Pre-Book were entered. In this way, the populations were systematically divided into two breeds after carefully checking the breeding status of each animal.
Positive population trends can be observed in the donkey populations studied (Littoral-Dinaric donkey, Istrian donkey), as the number of males, females, and registered offspring increases (Figure 1). The number of donkey breeders per breed has also increased over the past five years by 22% in the Istrian donkey population (from 129 to 158 herds) and 29% in the Littoral-Dinaric donkey population (from 628 to 810 herds). The age structure of the two breeds is also favorable, and about ¾ of the population is less than ten years old (Figure 2). The observed population trends are the result of a polyvalent and careful approach to breed conservation. After the start of the program for the protection of breeds, recognizing the importance of educating the public about the benefits of preserving donkey breeds initiated activities to promote the preservation of donkey breeds at local, regional, and national levels. After two decades of activities for the promotion and economic reaffirmation of donkeys, they are more valued animals, and are involved in different activities (leisure, agrotourism, folklore, exhibitions, etc.), economic programs, through the production of donkey milk and meat (people on the Istrian peninsula traditionally consume equine meat), and ecoservice function (biodiversity conservation). The female/male ratio was 3.1/1 in the Littoral-Dinaric donkey and 4.5/1 in the Istrian donkey populations, respectively. The female/male ratio was similar in Pêga donkeys (4.97/1) [9], Miranda donkeys (3.63/1) [8], and Amiata donkeys (2.90/1) [6], but higher than in Martina Franca donkeys (1.48/1) [7]. The reason for the difference in ratio between females and males is in the herd size and breeding technology.
In the Istrian donkey and Littoral-Dinaric donkey populations, the greatest number of traced generations was six and five, respectively, and the average maximum of complete and equivalent generations were 1.80, 1.24, 0.88, and 1.01, 0.74, 0.56, respectively. In the Catalonian donkey, the number of complete and equivalent generations was 1.23 and 1.96 [5]. In Amiata donkeys, the average maximum of complete and equivalent generations were 1.4, 0.53, and 0.78, respectively [6]; in Asinina de Miranda donkeys, 0.33, 0.22, and 0.28, respectively [8]; and in Andalusian donkeys, 1.09, 0.52, and 0.75, respectively [10]. Some donkey breeds have a much deeper pedigree, such as the Martina Franca donkey, for which the average maximum, complete and equivalent generations were 4.67, 1.97, and 3.01, respectively [7]. In Littoral-Dinaric donkeys and Istrian donkeys, pedigree depth has been relatively modest, but has increased in recent years, and is becoming an increasingly reliable tool for population management. Giontella et al. [49] suggest that knowledge of relationships between animals is essential for the genetic management of breeds, and represents one of the principal tools for optimizing their conservation strategies.
Generation intervals are important factors of population management measures [50]. The GI in the Littoral-Dinaric donkey population was lower than in the Istrian donkey population (7.27 vs. 7.73 years) and was similar in the Andalusian donkey (7.34) [10]. The GI for the four different pathways were similar. In Catalonian donkeys [51] and Amiata donkeys [6], lower GI were observed (6.74 and 6.65 years), whereas higher GI were observed in the Asinina de Miranda donkey (8.18 years) [8], the Martina Franca donkey (9.09 years) [7], and the Pêga donkey (10.70 years) [9] populations. The lower GI in the Littoral-Dinaric donkey population is a consequence of the population increasing more quickly and donkeys entering into reproduction early (three to four years). Folch and Jordana [51], and Cecchi et al. [6] observe higher GI in maternal pathways than in paternal pathways (7.32/6.16; 7.0/5.9) in the Catalonian and Amiata donkey populations, but the GI was longer in the sire-offspring pathways than in the dam-offspring pathways [7]. Prolonging the generation interval may be useful to increase the number of males and females selected for breeding, which would thereby progressively increase the effective population size, which is inversely proportional to the rate of inbreeding [52,53], and therefore, it could be a useful tool to maintain the genetic diversity of the population. The average age of parents at the birth of their offspring was similar in the Littoral-Dinaric donkey and Istrian donkey populations (7.59 and 7.50 years, respectively) and lower than in the Asinina de Miranda population (9.32 years) [8]. Navas et al. [10] observed in the Andalusian donkey populations a slightly higher mean age of parents in the dams–sons pathway (8.23 years) than dams–daughters pathway (7.84 years).
The effective number of founders and ancestors in the Littoral-Dinaric donkey population was relatively high (325, 316), which is typical for populations that do not have long historical pedigree records [54]. The effective number of ancestors and founders in the population for Istrian donkeys was lower (70, 65), and the number of ancestors explaining 50% of the genetic variability was 23. In the Catalonian donkey, the effective number of founders and ancestors was 70.6 and 27, respectively [5], in the Amiata donkey 114.9 and 42 [6], in the Martina Franca donkey 22 and 18 [7], in the Asinina de Miranda 38 and 34 [8], and in the Andalusian donkey 153.2 and 142 [10]. The rate of the effective number of founders compared with the effective number of ancestors can be used to determine the bottleneck in the population. If the ratio is 1, the population is stable. A larger ratio reflects a stronger bottleneck effect [32]. The fe/fa ratio in the Littoral-Dinaric donkey and Istrian donkey populations was 1.03 and 1.08, respectively, which is more favorable compared to the Catalonian donkey (2.61) [5]. In the Amiata, Andalusian, Asinina de Miranda and Martina Franca donkeys, the fe/fa ratio is similar (0.85, 1.08, 1.12, 1.22) [6,7,8,10]. The high fe/fa ratio suggests a disproportionate use of some breeding animals, presumably stallions, resulting in a loss of genetic diversity compared with that expected under random mating conditions [55]. The results of the current study did not indicate a bottleneck, so the Littoral-Dinaric donkey and the Istrian donkey populations were stable.
The trend and level of the inbreeding coefficient (F) in the population are crucial for maintaining the genetic diversity of the breed. The level of the inbreeding coefficient in the Littoral-Dinaric donkey population was lower (0.99%) than in the Istrian donkey population (1.77%), but the trend of the inbreeding coefficient is more favorable in the Istrian donkey population (in the last five years the level of F is stable) than in the Littoral-Dinaric donkey population (the level of inbreeding has increased in the last decade). The inbreeding coefficients of the Catalonian and Martina Franca donkeys were higher (3.36; 3.95) [5,7] and those of the Asinina de Miranda, Amiata, and Andalusian donkeys (0.08, 0.29, 0.70) were lower [6,8,10]. The inbreeding coefficients increased with the knowledge of the pedigree, but the poor pedigree completeness levels result in the underestimation of the inbreeding level [56], and therefore, the values found must be carefully analyzed [8]. The observed F value was followed by a low AR value in the Littoral-Dinaric donkey and Istrian donkey populations (0.13, 1.10), indicating a reduced representation of each individual in the whole population. Donkeys with the lowest AR, used as stallions and mares, can reduce inbreeding, and balance the gene contributions of the founders in the population, and thus genetic variability [57]. In the Catalonian and Martina Franca donkeys, the AR coefficients were higher (3.76, 7.35) [5,7], and in the Amiata, Andalusian and Asinina de Miranda donkeys, they are higher (0.94, 0.81, 0.33) [6,8,10].
The average GCI in the Littoral-Dinaric and Istrian donkey populations were relatively low (1.76, 2.42). In general, the trend in GCI in the Littoral-Dinaric donkey and Istrian donkey populations increased over time. Donkeys with higher GCI values have a greater balance in the number of founders and are thought to contain genes transmitted by the founders. From this point of view, animals with higher GCI values are crucial for breed conservation and the genetic variability they possess. Quaresma et al. [8] observed lower values for a GCI (1.30) in the local Portuguese donkey breed Asinina de Miranda and found that the average GCI was negatively associated with the age of the donkeys.
The genetic characterization study of Istrian donkey and Littoral-Dinaric donkey populations revealed a moderate level of genetic diversity. The values for the average (NA(ID) = 5.85; NA(LDD) = 5.92) and effective number of alleles (ENA(ID) = 3.33; ENA(LDD = 3.31), as well as observed (HO(ID) = 0.640; HO(LDD) = 0.656) and expected heterozygosity (HE(ID) = 0.653; HE(LDD) = 0.650), were similar for both breeds. These results indicate that there are no appreciable differences in the level of genetic variability among the Croatian donkey breeds. Istrian donkey and Littoral-Dinaric donkey populations have a lower average number of alleles compared to five native Spanish breeds (range from 7.0 to 7.5) [14], four Chinese breeds (range from 6.0 to 6.80) [58], or donkey breeds from the Balkans (9.3) [19], but they are higher than two Sicilian native breeds (4.05) [59]. Comparing observed and expected heterozygosity, the values of Istrian donkey and Littoral-Dinaric donkey populations are mostly between the reported values of previous studies [20,58], with averages of HO = 0.560 and HE = 0.70, and HO = 0.63-0.71, HE = 0.93–0.70. Although, results of heterozygosity for Croatian donkey breeds were higher than those for Sicilian donkey [59] and Italian donkey [16] breeds, but lower than the heterozygosity in the Balkan donkey breed research [19]. Previous research results by Ivanković et al. [13], which included both breeds, showed slightly higher values for HE (HE(ID) = 0.68, HE(LDD) = 0.70) than the results from this study. Comparing the observed and expected heterozygosity of the Croatian donkey populations with 59 horse breeds (included warmblood, coldblood and pony breeds) [60] found that it was below the average for all breeds ( H E ¯ = 0.80, H O = 0.70).
The results of the preserved genetic diversity in both native breeds are the large breeding area and the geographical distribution of the breeds, especially in the case of the Littoral-Dinaric donkey. In case of the Littoral-Dinaric donkey, its breeding area is Dalmatia and Dalmatian Zagora (12,200 km2), whereas the breeding area for the Istrian donkey is in the Istrian peninsula (3500 km2). Both breeds have a wide genetic base, which is the result of historical migration and the purchasing of animals between villages that contributed to the exchange of genetic material.
The genetic characterization study of the Littoral-Dinaric donkey and the Istrian donkey revealed a moderate level of genetic diversity. The values for the average (NA(LDD) = 5.92, NA(ID) = 5.85;) and effective number of alleles (ENA(LDD = 3.31, ENA(ID) = 3.33), as well as the observed (HO(LDD) = 0.656, HO(ID) = 0.640;) and expected heterozygosity (HE(LDD) = 0.650, HE(ID) = 0.653), were similar for both breeds. These results indicate that there are no appreciable differences in the level of genetic variability among the Croatian donkey breeds. A comparison of genetic diversity using microsatellites in animal species can be generally biased due to the different marker sets used, but they still represent the genetic structure of populations very well; therefore, these results are comparable to those of previous studies. Littoral-Dinaric donkey and Istrian donkey populations have a lower than average number of alleles compared with five local Spanish breeds (range from 7.0 to 7.5) [14], four Chinese breeds (range from 6.0 to 6.80) [58], and donkey breeds from the Balkans (9.3) [19], but they are higher than two local Sicilian breeds (4.05) [59]. Microsatellite genotyping results revealed a relatively high degree of heterozygosity in the Croatian donkey populations included in this study. Comparing the observed and expected heterozygosity, the values of the Littoral-Dinaric donkey and Istrian donkey populations are mostly between the reported values of previous studies, such as those reported by Di et al. [58] (average HO = 0.560 and HE = 0.70) and Yatkın et al. [20] (HO = 0.63–0.71, HE = 0.93–0.70). Although, results of heterozygosity for Croatian donkey breeds were higher than those for Sicilian donkeys [59] and Italian donkeys [16], but lower than the heterozygosity in the Balkan donkey breed [19]. Previous research results by Ivanković et al. [13] which included both breeds, showed slightly higher values for HE (HE(LDD) = 0.70, HE(ID) = 0.68) than the results of this study. A very low percentage of homozygous individuals in the Istrian donkey population was confirmed by a low, non-significant inbreeding coefficient (FIS(ID) = 0.029). A small excess of heterozygotes (FIS(LDD) = −0.002) was observed in the Littoral-Dinaric population. For both populations, this outcome is expected, and can be explained with several reasons. A large breeding area, and thus, a large geographical dispersion of breeds, especially in the case of the Littoral-Dinaric population (see File S1), contributes to a lower possibility of mating between relatives, and consequently, to the preservation of greater genetic diversity. For decades, residents followed the practice of purchasing (or exchanging) male and female breeding animals of the same breed from other villages rather than from neighboring households, which helped control inbreeding. Reports of the inbreeding coefficient in donkey populations from previous studies vary considerably, from 0.09 to 0.225 [20,58]. The large ancestral gene pool, which has a very large number of founders, lack of selection, and planned mating (avoiding mating of relatives), have undoubtedly contributed to the preservation of genetic variability in Croatian local donkey breeds.
The high rate of gene flow between the studied populations was confirmed by the high number of migrants (Nm = 12.431), which reduces genetic differentiation among populations. These results are supported by the low genetic differentiation between Littoral-Dinaric donkey and Istrian donkey (FST = 0.028) populations, suggesting that 97.2% of the total genetic variation resulted from genetic differentiation within breeds. This value is almost identical to the FST = 0.0212 from the previous research of Ivanković et al. [13] Low genetic differentiation for the Spanish donkey population was reported by Aranguren-Méndez et al. [14] and for the Turkish donkey population by Yatkin et al. [20]. The weak differentiation between the two donkey breeds was highlighted by a population assignment where 93% of individuals were correctly assigned to the true breed of origin. It is likely that the retention of ancestral variation contributes to a large gene pool (populations spread from centers of origin possess larger genetic diversity), rather than weak differentiation between breeds.
Although the population size of the Littoral-Dinaric donkey and Istrian donkey breeds have declined significantly throughout history (in 1937 there were ~39,000 animals) [61], these populations have not experienced a bottleneck. It is not unusual to reveal the absence of bottleneck events despite the reduction in population size [62].
The results of the mtDNA study show genetic variability within and between the two donkey breeds in Croatia, but no geographic clustering was observed. Cozzi et al. [28] observed a similar situation in six Italian donkey breeds. Genetic variability within and between breeds was not reflected in their geographical clustering. Phylogenetic analysis based on mtDNA classified two Croatian donkey breeds into the group Equus asinus africanus. Moreover, in other studies concerning the mtDNA D-loop, the donkey breeds included in the study are also in the phylogenetic group Equus asinus africanus, which was established by other authors [25,28,29,31]. All identified haplogroups of the Istrian donkey population (A, B), and one of the Littoral-Dinaric donkey population (D), are close to the Italian donkey breeds, which is important for understanding the breed’s phylogenetic position and further breeding consolidation. For the future program of preserving the uniqueness of two Croatian local donkey breeds, this observation is important, especially the knowledge of phylogenetic closeness with some Italian donkey breeds; however, when reconstructing phylogenetic relationships within and between breeds using mtDNA, we must consider that mtDNA is transmitted from mother to offspring, and therefore, it can only give insights in maternal lineages. This might be discordant with nuclear DNA, and in some cases provide a biased perspective on the evolutionary history of the breeds (species).

5. Conclusions

The preservation of genetic diversity is one of the primary tasks of the program for the protection of local donkey breeds, especially when they are threatened with extinction. After the biological survival of the Littoral-Dinaric donkey, and when the Istrian donkey was threatened, the launch of a program for inventorying, and a breeding consolidation of the remaining populations two decades ago, led to a biological recovery of the populations. Breed indicators observed in a complex study that the pedigree and genetic structure of donkey breeds point to certain population trends, but also to risks that need constant monitoring. Weaknesses in pedigree indicators due to lower pedigree depth were partially verified using genetic structure indicators. In the Littoral-Dinaric donkey population, the level of inbreeding and average relatedness is lower than in the Istrian donkey population, but the trends are less favorable, which requires constant monitoring. If it is necessary to slow down the growth of inbreeding, the equal contribution of animals to reproduction should be ensured, especially those that are less represented in the pedigree, so that the relatedness between mated animals is minimized, the generation interval is extended, and so on. Analysis of pedigrees and microsatellites has not revealed any bottleneck in the populations. Regular monitoring should be continued, precisely to optimize further development of donkey breeds. It is certainly necessary to promote the breeds and develop new sustainable strategies for their conservation (e.g., through tourism, asinotherapy, milk production (and meat), ecoservice function, and so on). Only a complete conservation program for local breeds is sustainable in the long run.

Supplementary Materials

The following are available online at www.mdpi.com/article/10.3390/d14050322/s1, File S1. Description of the phenotype characteristics and breeding areas of the Littoral-Dinaric donkey and Istrian donkey.

Author Contributions

Conceptualization, A.I.; methodology, A.I. and J.R.; data collection, A.I. and Z.I.; formal analysis, A.I., J.R. and G.Š.; writing—original draft preparation, A.I., J.R. and M.P.; writing—review and editing, A.I., J.R., G.Š., E.Š., M.K., I.K. and N.K.U.; supervision, G.B. and A.I.; project administration, A.I. All authors have read and agreed to the published version of the manuscript.

Funding

This research has been fully supported by Croatian Science Foundation (Genetic, Economic and Social Interactions of Local Breed Conservation Programs, GGD LocBreed), grant number IP-2020-02-4860.

Institutional Review Board Statement

The research was approved by the Bioethical committee for the protection and welfare of animals at the Faculty of the Agriculture University of Zagreb (No: 251-71-29-02/19-22-2).

Data Availability Statement

The data presented in this study are available on request from the corresponding author. The data are not publicly available to preserve privacy of the data.

Acknowledgments

The authors thank all farmers of the Istrian and Littoral-Dinaric donkeys for their collaboration and support. The authors would also like to thank Zdravko Barać, Nidal Korabi, and Mato Čačić from the Ministry of Agriculture for providing data sets.

Conflicts of Interest

The authors declare no conflict of interest. The funders had no role in the design of the study; in the collection, analyses, or interpretation of data; in the writing of the manuscript, or in the decision to publish the results.

References

  1. FAO (Food and Agriculture Organsations). Status and Trends of Animal Genetic Resources; FAO—Commission on Genetic Resources for Food and Agriculture: Rome, Italy, 2019; Available online: http://www.fao.org/3/my867en/my867en.pdf (accessed on 16 January 2022).
  2. Babić, E. Prilog poznavanju apuljskih magaraca u Dalmaciji. Vet. Arhiv. 1939, 9, 228–252. [Google Scholar]
  3. Ivanković, A.; Caput, P.; Mioč, B.; Pavić, V. The Phenotype Features of Donkeys in Croatia. Agric. Conspec. Sci. 2000, 65, 99–105. [Google Scholar]
  4. Vostrý, L.; Capková, Z.; Přibyl, J.; Hofmanová, B.; Vydrová, H.V.; Mach, K. Population structure of Czech cold-blooded breeds of horses. Arch. Anim. Breed. 2011, 54, 1–9. [Google Scholar] [CrossRef]
  5. Gutiérrez, J.P.; Marmi, J.; Goyache, F.; Jordana, J. Pedigree information reveals moderate to high levels of inbreeding and a weak population structure in the endangered Catalonian donkey breed. J. Anim. Breed. Genet. 2005, 122, 378–386. [Google Scholar] [CrossRef] [PubMed] [Green Version]
  6. Cecchi, F.; Ciampolini, R.; Ciani, E.; Matteoli, B.; Mazzanti, E.; Tancredi, M.; Presciuttini, S. Demographic genetics of the endangered Amiata donkey breed. Ital. J. Anim. Sci. 2006, 5, 387–391. [Google Scholar] [CrossRef]
  7. Rizzi, R.; Tullo, E.; Cito, A.M.; Caroli, A.; Pieragostini, E. Monitoring of genetic diversity in the endangered Martina Franca donkey population. Sci. J. Anim. Sci. 2011, 89, 1304–1311. [Google Scholar] [CrossRef] [Green Version]
  8. Quaresma, M.; Martins, A.M.F.; Rodrigues, J.B.; Colaço, J.; Payan-Carreira, R. Pedigree and herd characterization of a donkey breed vulnerable to extinction. Animal 2014, 8, 354–359. [Google Scholar] [CrossRef] [Green Version]
  9. Santana, M.L.; Bignardi, A.B. Status of the genetic diversity and population structure of the Pega donkey. Trop. Anim. Health Prod. 2015, 47, 1573–1580. [Google Scholar] [CrossRef]
  10. Navas, F.J.; Jordana, J.; León, J.M.; Barba, C.; Delgado, J.V. A model to infer the demographic structure evolution of endangered donkey populations. Animal 2017, 11, 2129–2138. [Google Scholar] [CrossRef]
  11. Gutiérrez, J.P.; Goyache, F. A note on ENDOG: A computer program for analysing pedigree information. J. Anim. Breed. Genet. 2005, 122, 172–176. [Google Scholar] [CrossRef] [Green Version]
  12. Ivanković, A.; Caput, P. Genetic polymorphism of transferrin and albumin in donkeys in Croatia. Czech J. Anim. Sci. 2000, 45, 49–52. [Google Scholar]
  13. Ivanković, A.; Kavar, T.; Caput, P.; Mioč, B.; Pavić, V.; Dovč, P. Genetic diversity of three donkey populations in the Croatian coastal region. Anim. Genet. 2002, 33, 169–177. [Google Scholar] [CrossRef]
  14. Aranguren-Mendez, J.; Jordana, J.; Gomez, M. Genetic diversity in Spanish donkey breeds using microsatellite DNA markers. Genet. Sel. Evol. 2001, 33, 433–442. [Google Scholar] [CrossRef]
  15. Blasi, M.; Perrotta, G.; Lanza, A.; Iamartino, D.; Pilla, F. Genetic diversity in three Italian donkey populations assessed by microsatellite markers. Ital. J. Anim. Sci. 2005, 4, 127. [Google Scholar]
  16. Matassino, D.; Cecchi, F.; Ciani, F.; Incoronato, C.; Occidente, M.; Santoro, L.; Ciampolini, R. Genetic diversity and variability in two Italian autochthonous donkey genetic types assessed by microsatellite markers. Ital. J. Anim. Sci. 2014, 13, 53–60. [Google Scholar] [CrossRef] [Green Version]
  17. Rosenbom, S.; Costa, V.; Al-Araimi, N.; Kefena, E.; Abdel-Moneim, A.S.; Abdalla, M.A.; Bakhiet, A.; Beja-Pereira, A. Genetic diversity of donkey populations from the putative centers of domestication. Anim. Genet. 2015, 46, 30–36. [Google Scholar] [CrossRef]
  18. Jordana, J.; Ferrando, A.; Miro, J.; Goyache, F.; Loarca, A.; Martínez López, O.R.; Canelón, J.L.; Stemmer, A.; Aguirre, L.; Lara, M.A.C.; et al. Genetic relationships among American donkey populations: Insights into the process of colonization. J. Anim. Breed. Genet. 2016, 133, 155–164. [Google Scholar] [CrossRef]
  19. Stanisic, L.J.; Aleksic, J.M.; Dimitrijevic, V.; Simeunovic, P.; Glavinic, U.; Stevanovic, J.; Stanimirovic, Z. New insights into the origin and the genetic status of the Balkan donkey from Serbia. Anim. Genet. 2017, 48, 580–590. [Google Scholar] [CrossRef]
  20. Yatkın, S.; Özdil, F.; Özkan Ünal, E.; Genç, S.; Kaplan, S.; Gürcan, E.K.; Arat, S.; Soysal, M.I. Genetic characterization of native donkey (Equus asinus) populations of turkey using microsatellite markers. Animals 2020, 10, 1093. [Google Scholar] [CrossRef]
  21. Xu, X.; Gullberg, A.; Arnason, U. The complete mitochondrial DNA (mtDNA) of the donkey and mtDNA comparisons among four closely related mammalian species-pairs. J. Mol. Evol. 1996, 43, 438–446. [Google Scholar] [CrossRef]
  22. Underhill, P.A.; Shen, P.; Lin, A.A.; Jin, L.; Passarino, G.; Yang, W.H.; Kauffman, E.; Bonné-Tamir, B.; Bertranpetit, J.; Francalacci, P.; et al. Y chromosome sequence variation and the history of human populations. Nat. Genet. 2000, 26, 358–361. [Google Scholar] [CrossRef] [PubMed]
  23. Wolf, C.; Rentsch, J.; Hübner, P. PCR-RFLP analysis of mitochondrial DNA: A reliable method for species identification. J. Agric. Food Chem. 1999, 47, 1350–1355. [Google Scholar] [CrossRef] [PubMed]
  24. Aranguren-Mendez, J.; Beja-Pereira, A.; Avellanet, R.; Dzama, K.; Jordana, J. Mitochondrial DNA variation and genetic relationships in Spanish donkey breeds (Equus asinus). J. Anim. Breed. Genet. 2004, 121, 319–330. [Google Scholar] [CrossRef]
  25. Beja-Pereira, A.; England, P.R.; Ferrand, N.; Jordan, S.; Bakhiet, A.O.; Abdalla, M.A.; Mashkour, M.; Jordana, J.; Taberlet, P.; Luikart, G. African origins of the domestic donkey. Science 2004, 304, 1781. [Google Scholar] [CrossRef] [Green Version]
  26. Lei, C.Z.; Chen, H.; Yang, G.S.; Sun, W.B.; Lei, X.Q.; Ge, Q.L.; Wang, Z.F.; Lu, N.; Gao, X.; Hou, W.T. Study on mitochondrial DNA D-loop polymorphism in Chinese donkeys. Yi Chuan Xue Bao 2005, 35, 481–486. [Google Scholar]
  27. Chen, S.Y.; Zhou, F.; Xiao, H.; Sha, T.; Wu, S.F.; Zhang, Y.P. Mitochondrial DNA diversity and population structure of four Chinese donkey breeds. Anim. Genet. 2006, 37, 427–429. [Google Scholar] [CrossRef]
  28. Cozzi, M.C.; Valiati, P.; Cherchi, R.; Gorla, E.; Prinsen, R.T.M.M.; Longeri, M.; Bagnato, A.; Strillacci, M.G. Mitochondrial DNA Genetic Diversity in Six Italian Donkey Breeds (Equus Asinus). Mitochondrial DNA A DNA Mapp. Seq. Anal. 2018, 29, 409–418. [Google Scholar] [CrossRef]
  29. Pengjia, B.; Guo, X.; Pei, J.; Ding, X.; Wu, X.; Xiong, L.; Liang, C.; Chu, M.; Yan, P. Characterization of the complete mitochondrial genome of the Liangzhou donkey (Equus asinus). Mitochondrial DNA Part B 2019, 4, 1846–1847. [Google Scholar] [CrossRef] [Green Version]
  30. Ünal, E.Ö.; Özdil, F.; Kaplan, S.; Gürcan, E.K.; Genç, S.; Arat, S.; Soysal, M.I. Phylogenetic Relationships of Turkish Indigenous Donkey Populations Determined by Mitochondrial DNA D-loop Region. Animals 2020, 10, 1970. [Google Scholar] [CrossRef]
  31. Mazzatenta, A.; Vignoli, M.; Caputo, M.; Vignola, G.; Tamburro, R.; De Sanctis, F.; Roig, J.M.; Bucci, R.; Robbe, D.; Carluccio, A. Maternal Phylogenetic Relationships and Genetic Variation among Rare, Phenotypically Similar Donkey Breeds. Genes 2021, 12, 1109. [Google Scholar] [CrossRef]
  32. Boichard, D.; Maignel, L.; Verrier, E. The value of using probabilities of gene origin to measure genetic variability in a population. Genet. Sel. Evol. 1997, 29, 5–23. [Google Scholar] [CrossRef]
  33. Lacy, R.C. Analysis of founder representation in pedigrees: Founder equivalents and founder genome equivalents. Zoo Biol. 1989, 8, 111–123. [Google Scholar] [CrossRef]
  34. Alderson, L. Alderson, L. A system to maximize the maintenance of genetic variability in small populations. In Genetic Conservation of Domestic Livestock II; Alderson, L., Bodo, I., Eds.; CABI: Wallingford, UK, 1992; pp. 18–29. [Google Scholar]
  35. Duru, S. Pedigree analysis of the Turkish Arab horse population: Structure, inbreeding and genetic variability. Animal 2017, 11, 1449–1456. [Google Scholar] [CrossRef]
  36. James, J.W. A note on selection differentials and generation length when generations overlap. Anim. Sci. 1977, 24, 109–112. [Google Scholar] [CrossRef]
  37. Kwon, D.Y.; Cho, G.J. Standardization and usefulness of ISAG microsatellite markers for individual identification and parentage verification in horse breeds. J. Vet. Clin. 2009, 26, 220–225. [Google Scholar]
  38. FAO. Molecular Genetic Characterization of Animal Genetic Resources; FAO Animal Production and Health Guidlines. No. 9; FAO: Rome, Italy, 2011; Available online: https://www.fao.org/3/i2413e/i2413e00.pdf (accessed on 16 January 2022).
  39. Peakall, R.; Smouse, P.E. GENALEX 6.5: Genetic analysis in Excel. Population genetic software for teaching and research-an update. Bioinformatics 2012, 28, 2537–2539. [Google Scholar] [CrossRef] [Green Version]
  40. Kalinowski, S.T.; Taper, M.L.; Marshall, T.C. Revising how the computer program CERVUS accommodates genotyping error increases success in paternity assignment. Mol. Ecol. 2007, 116, 1099–1106. [Google Scholar] [CrossRef]
  41. Weir, B.S.; Cockerham, C.C. Estimating F-statistics for the analysis of population structure. Evolution 1984, 38, 1358–1370. [Google Scholar] [CrossRef]
  42. Goudet, J. FSTAT, a Program to Estimate and Test Gene Diversities and Fixation (Version 2.9.3.2). 2001. Available online: http://www2.unil.ch/popgen/softwares/fstat.htm (accessed on 24 April 2017).
  43. Rousset, F. GENEPOP’007: A complete re-implementation of the genepop software for Windows and Linux. Mol. Ecol. 2008, 8, 1103–1106. [Google Scholar] [CrossRef]
  44. Belkhir, K.; Borsa, P.; Chikhi, L.; Raufaste, N.; Bonhomme, F. GENETIX 4.05, Logiciel Sous Windows TM Pour La Génétique des Populations. Laboratoire Génome, Populations, Interactions, CNRS UMR 5000; Université de Montpellier II: Montpellier, France, 2004. [Google Scholar]
  45. Cornuet, J.M.; Luikart, G. Description and power analysis of two tests for detecting recent population bottlenecks from allele frequency data. Genetics 1996, 144, 2001–2014. [Google Scholar] [CrossRef]
  46. Piry, S.; Luikart, G.; Cornuet, J.M. Computer note. BOTTLENECK: A computer program for detecting recent reductions in the effective size using allele frequency data. Heredity 1999, 90, 502–503. [Google Scholar] [CrossRef]
  47. Kumar, S.; Stecher, G.; Li, M.; Knyaz, C.; Tamura, K. MEGA X: Molecular Evolutionary Genetics Analysis across computing platforms. Mol. Biol. Evol. 2018, 35, 1547–1549. [Google Scholar] [CrossRef]
  48. Botstein, D.; White, R.L.; Skolnick, M.; Davis, R.W. Construction of a genetic linkage map in man using restriction fragment length polymorphisms. Am. J. Hum. Genet. 1980, 32, 314–331. [Google Scholar]
  49. Giontella, A.; Cardinali, I.; Lancioni, H.; Giovannini, S.; Pieramati, C.; Silvestrelli, M.; Sarti, F.M. Mitochondrial DNA Survey Reveals the Lack of Accuracy in Maremmano Horse Studbook Records. Animals 2020, 10, 839. [Google Scholar] [CrossRef]
  50. Pjontek, J.; Kadlečík, O.; Kasarda, R.; Horný, M. Pedigree analysis in four Slovak endangered horse breeds. Czech J. Anim. Sci. 2012, 57, 54–64. [Google Scholar] [CrossRef] [Green Version]
  51. Folch, P.; Jordana, J. Demographic characterization, inbreeding and maintenance of genetic diversity in the endangered Catalonian donkey breed. Genet. Sel. Evol. 1998, 30, 195–202. [Google Scholar] [CrossRef]
  52. Meuwissen, T.H.E. Operation of conservation schemes. In Genebanks and the Conservation of Farm Animal Genetic Resources; Oldenbroek, K.K., Ed.; DLO Institute for Animal Science and Health: Lelystad, The Netherlands, 1999; pp. 9–112. [Google Scholar]
  53. Caballero, A.; Toro, M.A. Analysis of genetic diversity for the management of conserved subdivided populations. Conserv. Genet. 2002, 3, 289–299. [Google Scholar] [CrossRef]
  54. Gutiérrez, J.P.; Altarriba, J.; Díaz, C.; Quintanilla, R.; Cañón, J.; Piedrafita, J. Pedigree analysis of eight Spanish beef cattle breeds. Genet. Sel. Evol. 2003, 35, 43–64. [Google Scholar] [CrossRef] [Green Version]
  55. Stephens, T.D.; Splan, R.K. Population history and genetic variability of the American Shire horse. Anim. Genet. Resour. 2013, 52, 31–38. [Google Scholar] [CrossRef]
  56. Lutaaya, E.; Misztal, I.; Bertrand, J.K.; Mabry, J.W. Inbreeding in populations with incomplete pedigrees. J. Anim. Breed. Genet. 1999, 116, 475–480. [Google Scholar] [CrossRef]
  57. Pinheiro, M.; Kjöllerström, H.J.; Oom, M.M. Genetic diversity and demographic structure of the endangered Sorraia horse breed assessed through pedigree analysis. Livest. Sci. 2013, 152, 1–10. [Google Scholar] [CrossRef]
  58. Di, R.; Liu, Q.; Xie, F.; Hu, W.; Wang, X.-Y.; Cao, X.-H.; Pan, Z.-Y.; Chen, G.; Chu, M. Evaluation of genetic diversity and population structure of five Chinese indigenous donkey breeds using microsatellite markers. Czech J. Anim. Sci. 2017, 62, 219–225. [Google Scholar] [CrossRef] [Green Version]
  59. Bordonaro, S.; Guastella, A.M.; Criscione, A.; Zuccaro, A.; Marletta, D. Genetic Diversity and Variability in Endangered Pantesco and Two Other Sicilian Donkey Breeds Assessed by Microsatellite Markers. Sci. World J. 2012, 2012, 648427. [Google Scholar] [CrossRef] [Green Version]
  60. Khanshour, A.M.; Hempsey, E.K.; Juras, R.; Cothran, E.G. Genetic Characterization of Cleveland Bay Horse Breed. Diversity 2019, 11, 174. [Google Scholar] [CrossRef] [Green Version]
  61. Babić, E. Prilog Poznavanju Domaćih Primorskih Magaraca (A Contribution to the Knowledge of Local Coastal Donkeys). Ph.D. Thesis, Faculty of Agriculture and Forestry in Zagreb, Zagreb, Croatia, 1939. [Google Scholar]
  62. Maretto, F.; Cassandro, M. Temporal variation in genetic diversity and population structure of Burlina cattle breed. Ital. J. Anim. Sci. 2014, 13, 322–329. [Google Scholar] [CrossRef] [Green Version]
Figure 1. The number of males, females, and newly registered animals in a year, concerning the Littoral-Dinaric donkey (a) and Istrian donkey (b) populations.
Diversity 14 00322 g001
Figure 2. Share of animals in the Littoral-Dinaric donkey and Istrian donkey populations by year of foaling.
Diversity 14 00322 g002
Figure 3. Average level of inbreeding coefficient and average relatedness in the Littoral-Dinaric donkey and Istrian donkey populations.
Diversity 14 00322 g003
Figure 4. Average percentage of total pedigree completeness and REF 02 reference populations of the Littoral-Dinaric donkey and Istrian donkey.
Diversity 14 00322 g004
Figure 5. Plot shows the population assignment test for the Littoral-Dinaric donkey (LDD, n = 60) and the Istrian donkey (ID, n = 60). Each point represents an individual donkey. Individuals assigned to a different population are marked. For example, individual 043ID, which originally belonged to the Istrian donkey population (green), was assigned to the Littoral-Dinaric donkey population (red). The genotype’s expected frequency are log-transformed, and it gives the log likelihood of occurrence for each population.
Diversity 14 00322 g005
Figure 6. Maximum likelihood phylogenetic tree from eleven mtDNA D-loop haplotypes of Croatian local breeds (Littoral-Dinaric donkey; Istrian donkey) and sixty-nine haplotypes of Italian, Spanish, Chinese, and Turkish donkey breeds, including nine African wild ass sequences (Equus asinus africanus, Equus asinus somalicus). Bootstrap values (expressed as percentages of 1000 replications) are shown at the branch points.
Diversity 14 00322 g006
Table 1. Summary statistics of the pedigree analysis of the Littoral-Dinaric donkey (LDD) and Istrian donkey (ID) populations.
ItemLDDID
Original dataset (TP; total population)50301233
Reference population 1 (REF 01; animal with both parents known)2724897
Reference population 2 (REF 02; live animals in 2020)3296758
Number of founders contributing to REF 01 population1097210
Effective number of founders (fe)32570
Effective population size of founders914.13121.77
Number of ancestors contributing to REF 01 population1023200
Effective number of ancestors (fa)31665
Number of ancestors explaining 50% of genetic variability 14123
Effective number of founders/effective number of ancestors (fe/fa)1.031.08
Number of founder herds in REF 01 population (fh)35879
Effective number of founder herds for the REF 01 population65.418.6
Effective population size (Ne)74.5981.27
Effective population size REF 02 population (computed via individual increase in inbreeding)25.9932.78
Mean inbreeding (F)0.991.77
Mean Average Relatedness coefficient (AR)0.131.10
Genetic Conservation Index (GCI)1.762.42
Mean number of maximum generations1.011.80
Mean number of equivalent generations0.560.88
Mean number of complete generations0.741.24
Table 2. Average age of parents at the birth of their offspring and the generation interval (years) for the Littoral-Dinaric donkey and Istrian donkey populations (REF 01).
PathwayLittoral-Dinaric DonkeyIstrian Donkey
nMean ± SDnMean ± SD
Average age
Father—son10907.57 ± 3.9023437.41 ± 4.118
Father—daughter14127.47 ± 3.798 a5027.56 ± 4.109
Mother—son12187.50 ± 4.1613607.61 ± 3.913
Mother—daughter15717.79 ± 4.296 b5347.42 ± 4.104
Overall52917.59 ± 4.05717397.50 ± 4.067
Generation interval
Father—son1367.34 ± 3.652467.87 ± 4.436
Father—daughter4027.30 ± 3.7011877.89 ± 3.912
Mother—son1666.94 ± 4.055557.84 ± 4.032
Mother—daughter4807.34 ± 4.1622037.53 ± 3.843
Overall11847.27 ± 3.9364917.73 ± 3.943
SD, standard deviation; different superscript letters show significant differences (p < 0.05).
Table 3. Indices of genetic diversity of the whole sample (n = 120) for the Littoral-Dinaric donkey and Istrian donkey breeds.
MarkerNAENAARPICHOHEFISFSTFITNmF(Null)HW
AHT463.0785.6280.6490.7080.703−0.0460.0700.0285.936−0.0052ns
HMS253.0204.9700.6320.6750.690−0.0050.0520.0487.8390.0113ns
HMS751.6354.5000.3640.3580.3880.0710.0130.08422.2060.0537ns
TKY29794.5938.3740.7660.7420.7980.0600.0230.08215.2620.0374ns
TKY34342.5053.9930.5630.5420.6260.1060.0630.1636.4430.0712ns
ABS2364.5245.9700.7530.7920.789−0.0080.0090.00128.910−0.0031ns
HMS373.2065.9850.6390.6420.6930.0476 **0.0550.1007.4430.0363**
HTG1095.6678.7210.8100.8500.834−0.0260.013−0.01323.014−0.014ns
TKY31253.1164.7510.6360.6920.691−0.0150.0250.01114.5300.002ns
HMS1893.3708.4250.6680.7500.711−0.0690.024−0.04315.144−0.0303ns
HMS631.8832.9700.3890.3920.4920.1640.0930.2414.4100.1141ns
HTG7104.3019.9900.7490.7330.7700.0080.0770.0845.4160.0273ns
TKY33742.2303.9390.5010.5500.559−0.0280.0830.0575.0490.0027ns
Mean6.313.3176.0170.6240.6480.6730.0140.0450.05812.431
Number of animals (N), number of alleles (NA); effective number of alleles (ENA); allelic richness (AR); polymorphism information content (PIC); observed (HO) and expected (HE) heterozygosities; fixation indices (FIS, FST, FIT); migration rate (Nm); frequency of null alleles F(null); deviation form Hardy–Weinberg equilibrium (HW); ns—non significant; ** p < 0.01.
Table 4. Indices of genetic diversity in Istrian donkey and Littoral-Dinaric donkey breeds in Croatia. Abbreviations in Table 3 are identical to those in this table.
Littoral-Dinaric Donkey (LDD, n = 60)Istrian Donkey (ID, n = 60)
MarkerNAENAHOHEFISNAENAHOHEFIS
AHT463.3790.7830.704−0.104 *52.7770.6330.6400.019
HMS253.2850.7500.696−0.0752.7550.6000.6370.067
HMS741.7980.3670.4440.18251.4730.3500.321−0.082
TKY29794.7120.7670.7880.03584.4750.7170.7770.085
TKY34342.5760.5170.6120.16442.4330.5670.5890.046
ABS2354.5140.7830.7780.00264.5340.8000.779−0.018
HMS373.9980.7670.750−0.014 *52.4140.5170.5860.126 ***
HTG1096.2770.8830.841−0.04275.0560.8170.802−0.01
TKY31243.4160.6830.7070.04252.8160.7000.645−0.077
HMS1872.8550.7330.650−0.1293.8860.7670.743−0.024
HMS631.6990.4000.4110.03632.0670.3830.5160.265 *
HTG7102.7480.6000.6360.065105.8540.8670.829−0.037
TKY33741.7620.5000.432−0.14842.6980.6000.6290.055
Mean5.923.310.6560.650−0.0025.853.330.6400.6530.029
* p < 0.05; *** p < 0.001.
Publisher’s Note: MDPI stays neutral with regard to jurisdictional claims in published maps and institutional affiliations.

