Article

Diversity of Pod Shape in Pisum

John Innes Centre, Norwich Research Park, Colney Lane, Norwich NR4 7UH, UK
*
Authors to whom correspondence should be addressed.
Diversity 2021, 13(5), 203; https://doi.org/10.3390/d13050203
Submission received: 31 March 2021 / Revised: 29 April 2021 / Accepted: 8 May 2021 / Published: 12 May 2021
(This article belongs to the Special Issue Legume Evolution and Diversity)

Abstract

:
The seed-containing pod is the defining structure of plants in the legume family, yet pods exhibit a wide range of morphological variation. Within a species pod characters are likely to be correlated with reproductive strategy, and within cultivated forms will correspond to aspects of yield determination and/or end use. Here variation in pod size, described as pod length: pod width ratio, has been analyzed in pea germplasm represented by 597 accessions. This pod size variation is discussed with respect to population structure and to known classical pod morphology mutants. Variability of the pod length: width ratio can be explained by allelic variation at two genetic loci that may correspond to organ-specific negative regulators of growth.

1. Introduction

Legumes (Leguminoseae, or Fabaceae) are defined by their pod, or legume. Pods vary greatly in morphology among legume taxa [1], from winged types as in Centrolobium spp. [2], to those buried in the ground in Arachis [3]. Within a species, pod morphology is generally conserved, but as Darwin [4,5] noted:
“Any part or organ developed to an extraordinary size or in an extraordinary manner, in comparison with the same part or organ in the allied species, must have gone through an extraordinary amount of modification since the genus arose; and thus we can understand why it should often still be variable in a much higher degree than other parts; for variation is a long-continued and slow process, and natural selection will in such cases not as yet have had time to overcome the tendency to further variability and to reversion to a less modified state”.
Exceptional variation among related taxa is often associated with extensive intraspecific variation [4,5]. Within a species, pod characters are likely to be correlated with dispersal strategy and defense [6]. Within cultivated peas, pod characters are correlated with end use, as an edible vegetable, or as a by-product [7]. Pod wall ratio, defined as the ratio between pod wall weight and whole pod weight, was found to be highly heritable and correlated with yield, seeds per pod and harvest index under cool, wet growing conditions [8]. Pod length and single pod weight were included as considerations for yield improvement by selection [9], while pod length was found to be positively correlated with seeds per pod and 100 seed weight in a sub-tropical climate [10]. For these reasons, the intraspecific variation in legume pod characters is of interest and further study may lead to the understanding of the genetic basis of such variation.
Many classical genes have been described that condition the appearance of the pod in pea (Pisum sativum L.). These were categorized by Blixt [11] and genes relating to pod shape are summarized in Table 1. Here, variation associated with pod length and width is described and this most likely reflects natural variation in the genes te and lt.

2. Materials and Methods

2.1. Selection of Material

A selection of 600 diverse accessions from the JI Pisum Germplasm collection was made based on the data of Jing et al. [12] and using the Core Hunter 3 algorithm [13] implemented in package ‘Corehunter’ (v3.2.1) in the R software suite (v4.0.3) using the default setting. The R script and genotype data are available on request. This selection was augmented to include all accessions designated P. elatius or P. fulvum. These were grown as single plants in a greenhouse in 2020, one plant failed to germinate and two were not of the expected phenotype and therefore not analyzed further. Trellised plants were grown in a greenhouse (Keder, bubble-wrap 9-layer laminate) from March to August 2020 in a Peat/Loam/Grit (75/15/10) mix with mineral supplement, in single 1l pots placed on capillary matting which was soaked twice per day.

2.2. Pod Measurements

Phenotypic characters were recorded, including pod length, pod width and ovule number. For these characters the first pod at the second pod-bearing node was measured when this pod had filled. Measurements were made using calipers. Length was measured from the base of the pod where the two dorsal sepals diverge to the pod tip, excluding the remains of the stigma. Pod width was measured from the dorsal suture to the ventral suture, at the widest point. For accessions with curved pods conditioned by loci co, cp, or cpa, this measurement underestimated pod length. Historical data was obtained for similar measurements recorded between 1959 and 2013.

2.3. Statistical Analysis

Statistical analyses and regression were performed in Excel.

3. Results

3.1. General Description

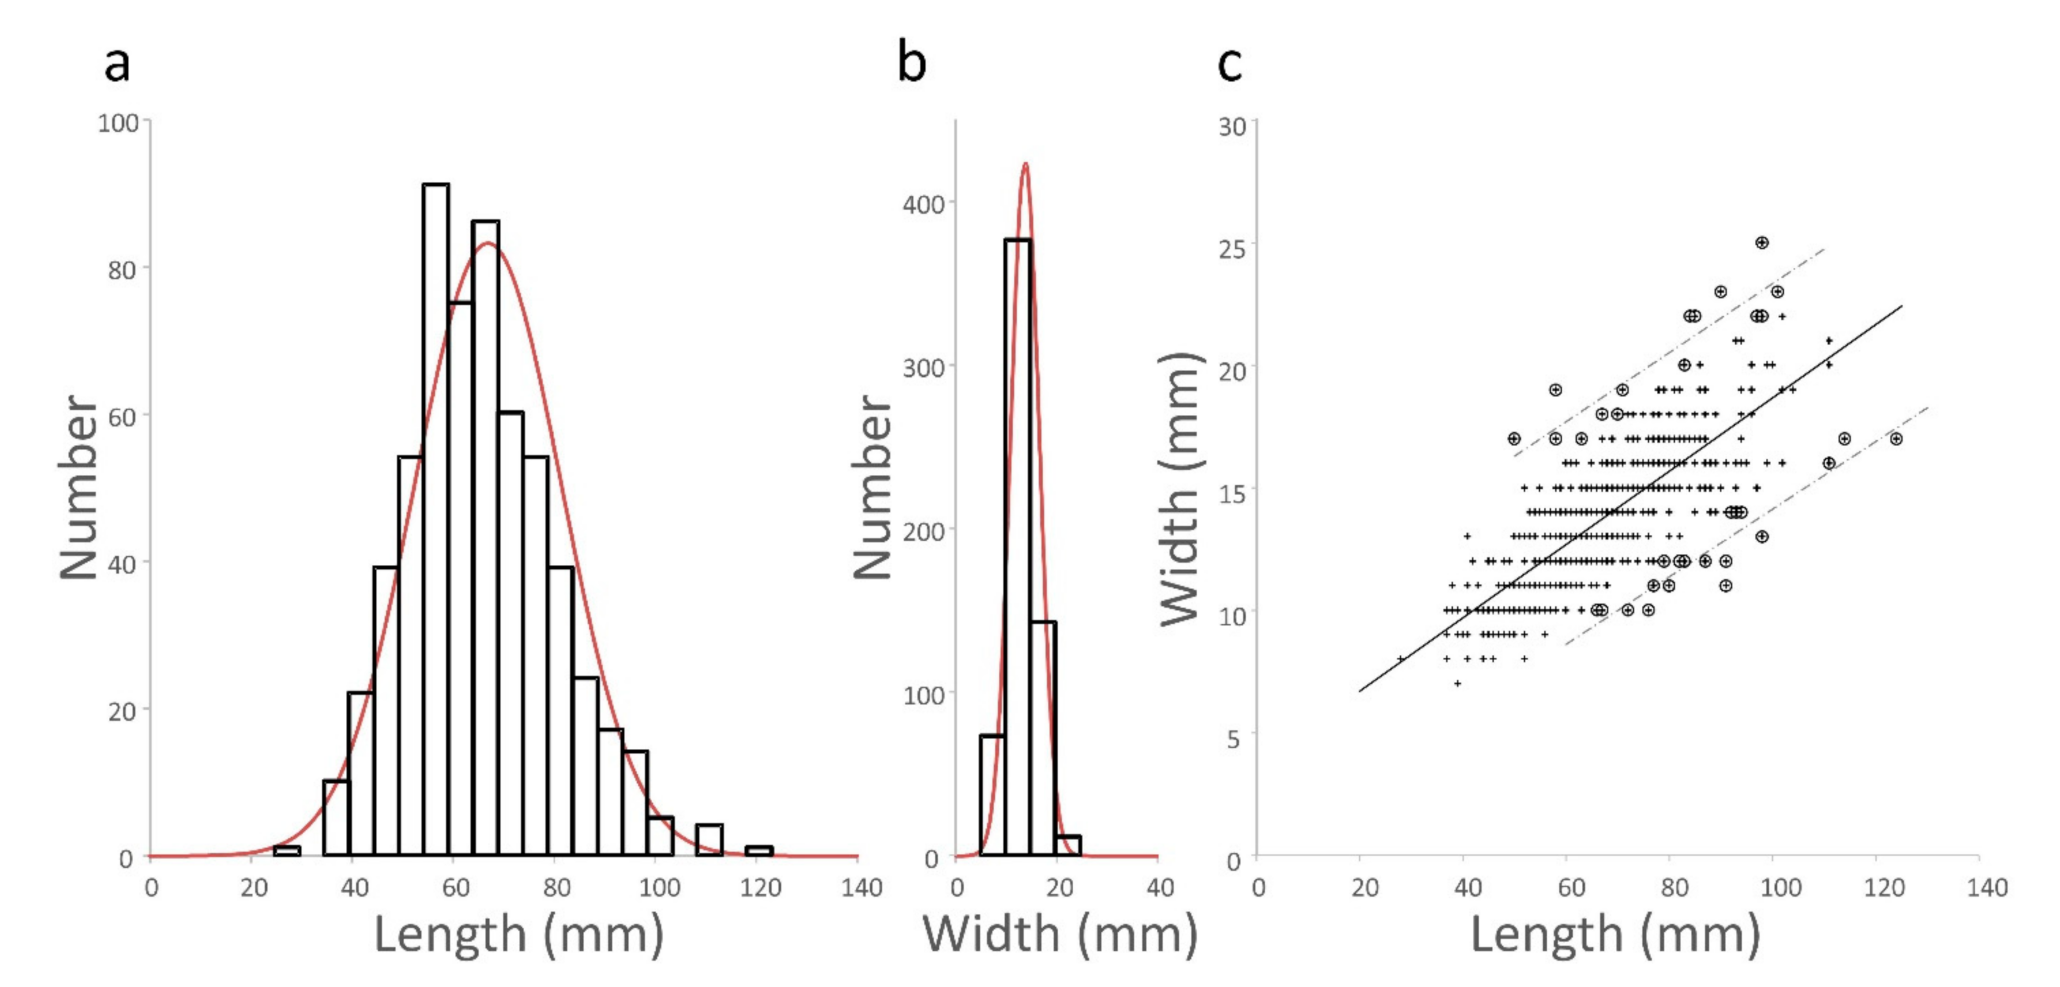
3.1.1. Distribution of Pod Length and Width Measurements

Pod length and width were measured for the first pod on the second pod bearing node of 597 different individuals grown in a greenhouse at JIC in the 2020 growing season. A selection of pod shapes corresponding to the phenotypes listed in Table 1 is shown in Figure 1. Length and width (66.94 ± 14.53 mm and 13.73 ± 2.85 mm, μ ± SD respectively) were a good fit to a normal distribution of the observed mean and standard deviation (Figure 2).

3.1.2. Length and Width Are Correlated

Figure 2c shows that length and width are correlated (r ≃ 0.76); much of this co-variation is a reflection of overall pod size. Pod size can be described as the product (S) of the observed length, Lo and width Wo which, together with the regression equation predict the length (Lp) and width (Wp) for a given pod size according to follow the relationships:
Regression line:
Wo = a + bLo
Defining area:
S = LoWo = LpWp
From 1 and 2:
S = LW = aL + bL2
Or:
bL2 + aL − S = 0, L = [−a ± √(a2 + 4bS)]/2b
The quadratic Equation (3) can be solved to determine Lp and Wp for a given pod size. The difference between observed and predicted values of length and width was calculated as the sum of the absolute differences between the observed and expected values. This difference has a mean ± standard deviation of 4.78 ± 4.11 mm. Points where the difference is greater than 3 standard deviations are circled in Figure 2. This analysis identified three groups of length and width values; the upper group which are unusually short and wide, the lower group which are unusually long and narrow, and the remainder which can be considered typical; see Figure 1 for an example of each class.
There is likely to be some overlap between the distributions of typical and unusual values, but taking the assignments in Figure 2 three relationships have been derived:
W = (0.14 ± 0.017) L + (9.24 ± 1.39) for the unusually wide group
W = (0.16 ± 0.004) L + (3.04 ± 0.31) for the typical group
W = (0.14 ± 0.012) L + (0.32 ± 1.04) for the unusually narrow group
The differences between the slopes of these regression lines are not statistically significant, nor are they different from that of the data set as a whole, but the three values for the intercept are significantly different. This indicates that there is a constant difference in width of a given pod in each class, irrespective of its length. These classes probably correspond to allelic variation at the loci listed in Table 1. These regression relationships can be rearranged for pod length on the y-axis and pod width on the x-axis. This rearrangement would also describe variation in pod length respect to pod width, with a common slope, but with three different constants independent of pod length, suggesting that the different phenotypic descriptors of pod length: width ratios (Table 1) should be interpreted with caution. For example, the dominant Laitor (broader pod) could be described as a recessive narrow pod. In his review Blixt [11] assigned all but two pod shape loci to “Chr 5” with curt assigned to “Chr 4” and lt assigned to “Chr 6”. These “Chr” designations do not correspond to current linkage group, chromosome or pseudomolecule identifiers [14].

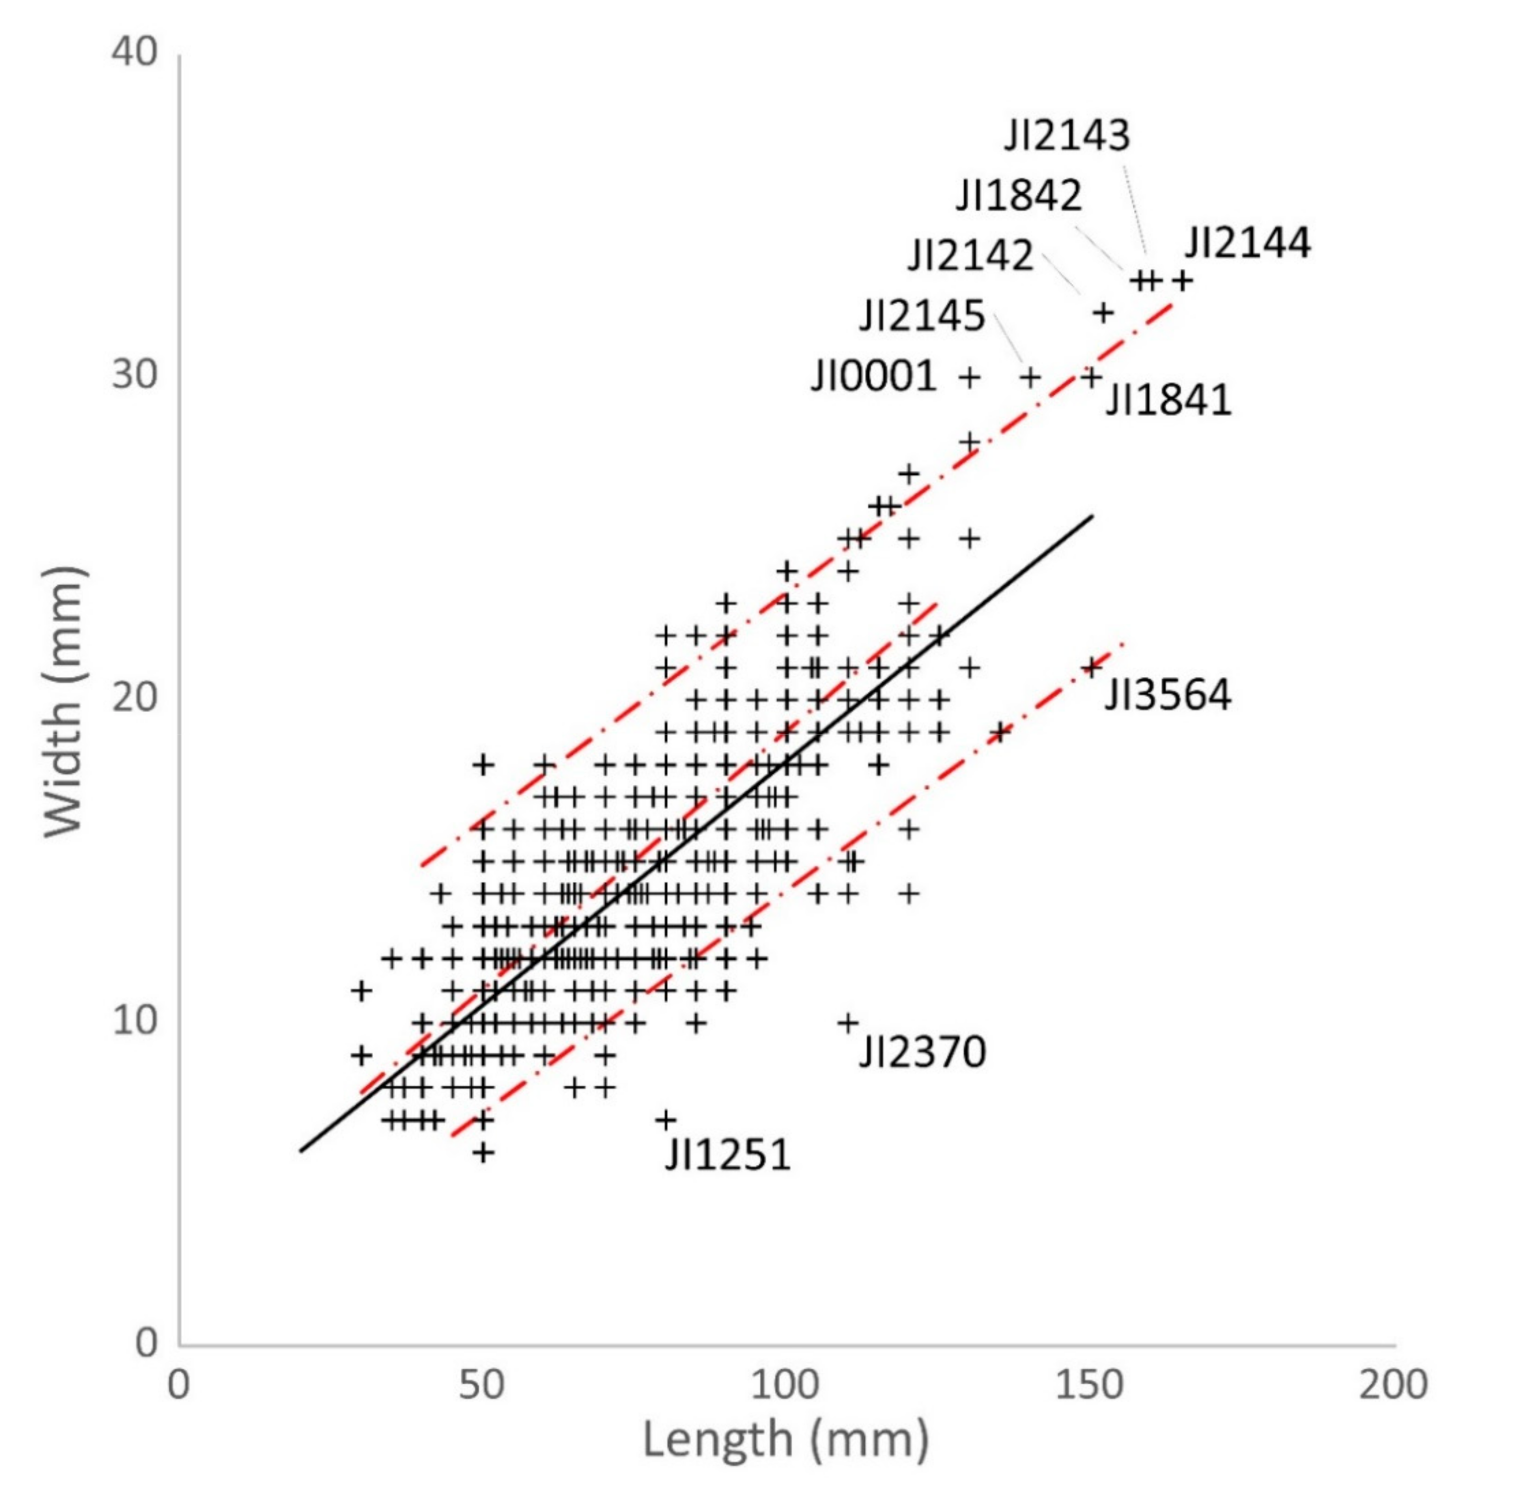
3.2. Historical Data

Pod length and width data for the JI Pisum germplasm have been collected systematically and records of these measurements date back to 1959. A total of 1158 paired records for pod length and width were available (Supplementary Table S2) and these data are plotted in Figure 3. The regression line for this data set is in good agreement with the 2020 data (i.e., the parameters of the linear regression are within their standard errors) despite the inclusion of additional accessions (283 accessions were in common to both data sets and 875 were in the historical data alone), and the data having been obtained under a variety of growing conditions.
In addition to the slope and intercept of the regression not being significantly different from the 2020 data, there are also features of the historical data that are consistent with the short-wide and long-narrow groups identified in Figure 2. In the historical data set there are eight accessions with pods that are larger than in the 2020 data set (shown in the upper right quadrant of Figure 3), all of which are cultivars. Of these, seven accessions are in the short-wide class, corresponding to mangetout types. Note that these seven are all longer than most other pods, but they are also very much wider; for their length they are much wider than expected and for their width they are much shorter than expected. Two accessions are indicated with notably narrower pods than any seen in the 2020 data set.

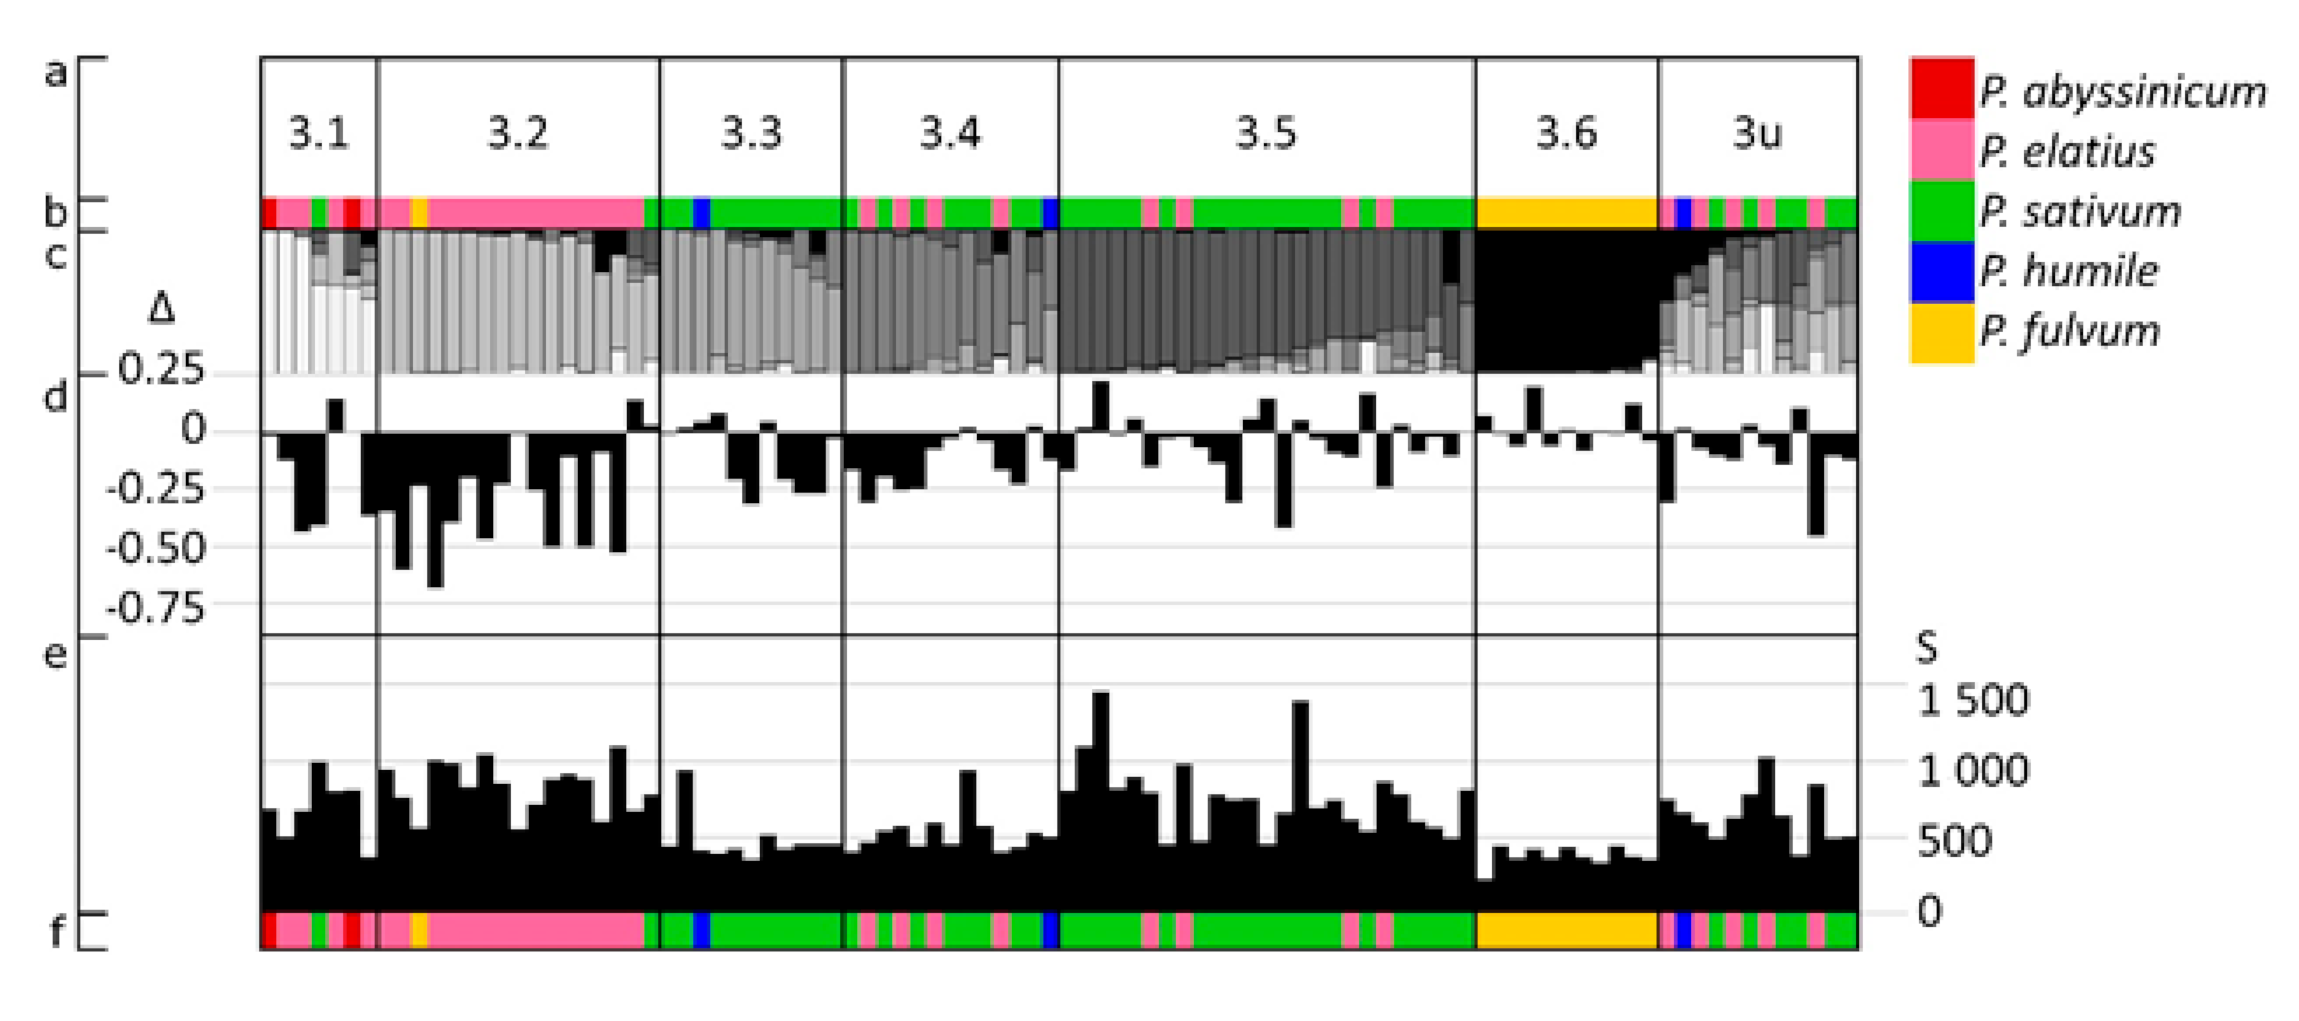
3.3. The Distribution of Pod Size, Length and Width Variation with Respect to Structure Groups

Jing et al. [12] undertook a structure analysis of the JI Pisum germplasm collection and partitioned the accessions into groups and sub-groups which correlated with taxonomic and other descriptors. Of the set of lines analyzed here, 577 were included in the Jing et al. data set. The figures below relate to that sub-set of 577 lines. There were no strong correlations of either pod size or length: width ratio with the assigned proportions of group or sub-group contribution (Q values). However, within Structure Group 3 there is a clear partitioning on the basis of pod size and the narrow types (Figure 4). Group 3 includes wild accessions of P. elatius and P. fulvum, together with domesticated P. abyssinicum accessions, the Afghan types [15] and two other subgroups of P. sativum.
The Structure subgroup 3.3 includes many accessions designated ‘P. sativum Afghanistan’ (23 of 35 in [15]) although other accessions identified as ‘Afghanistan’ occur elsewhere. The subgroups 3.4 and 3.5 have not been assigned to a named taxon and are not predominantly associated with a specific taxonomic subgroup, but these accessions are predominantly of Asian origin [12].
The other subgroups (3.1, 3.2 and 3.6) correspond reasonably well to named taxa. The predominance of P. abyssinicum in subgroup 3.1 is not obvious in Figure 4 because there were only two P. abyssinicum accessions included in this analysis, because of the lack of genetic diversity in this group.

3.3.1. Pod Size

In Figure 4, the Structure subgroups 3.3 and 3.6 have consistently small pods. The data in Figure 5 show that the pods of subgroup 3.6 and all P. fulvum accessions are significantly smaller than the accessions as a whole.
For Structure subgroup 3.3 and P. sativum from Afghanistan the size difference is less marked but significant. The accessions of ‘P. sativum Afghanistan’ within subgroup 3.3 have smaller pods than ‘P. sativum Afghanistan’ as a whole. ‘P. sativum Afghanistan’ may include any P. sativum from Afghanistan, accounting for its broad distribution in the Structure analysis, in contrast to the narrow distribution of cv Afghanistan in subgroup 3.3. Furthermore the ‘ecotype’ from Afghanistan described by Young and Matthews [15], although distinct, is itself quite diverse and notably does not always carry the sym2 allele.

3.3.2. Pod Length: Width Ratio

For the accessions as a whole, the deviation of the pod length: width ratio from its expectation (as plotted in Figure 4) is, as would be expected, close to zero; Δ = −0.020 ± 0.153 (μ ± SD, n = 577), so few, if any, of the accessions in Figure 4 (i.e., Structure group 3) are unusually short and wide. There is however a concentration of long, narrow podded accessions in subgroup 3.2, and this appears to be characteristic of the P. elatius accessions of subgroup 3.2. Of the 9 accessions where S is more than 3 standard deviation units below the mean, 6 are from subgroup 3.2, 5 of which are designated P. elatius. For P. elatius as a whole r is not significantly different from 0 (Δ = −0.17 ± 0.21; μ ± SD, n = 44).

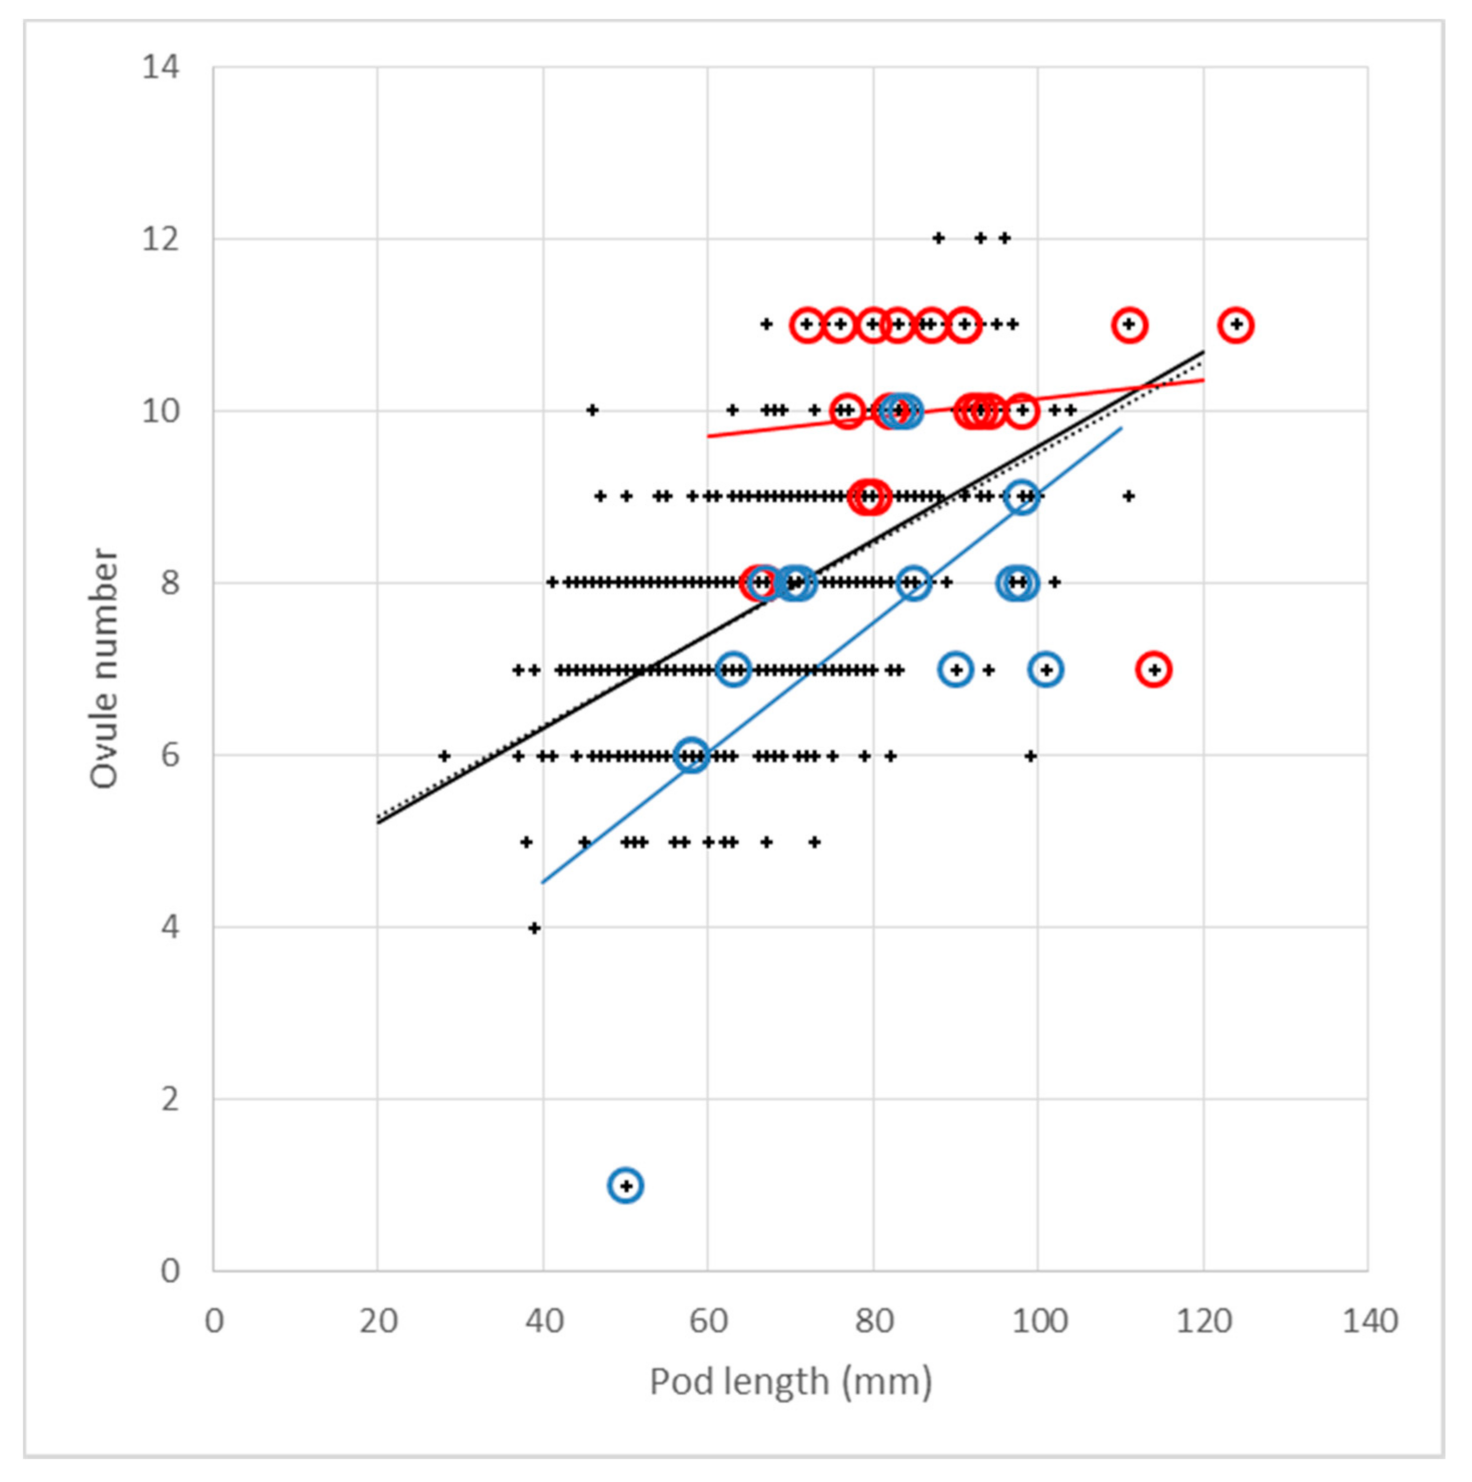
3.3.3. Ovule Number, Pod Length and Pod Width

Ovule number (Supplementary Table S1) was counted for 594 accessions in the 2020 data set. Pod length and ovule number are weakly correlated (r2 = 0.34); the correlation is even weaker for pod width or pod size (r2 = 0.07 and 0.19 respectively). This is consistent with longer pods having more ovules, but suggests that there are additional important factors affecting, or associated with, ovules per pod (see Appendix A).

4. Discussion

The results presented here suggest that for a given pod size there are three phenotypic classes, the wild type and those that are unusually wide, or unusually narrow for their length (Figure 1, Figure 2 and Figure 3). These can be called normal, short-wide, and long-narrow, respectively, but note that a short-wide pod can be longer than many long-narrow pods (Figure 3). Furthermore, the short-wide or long-narrow pods seem to differ from expectation by a constant value, consistent with each being a coherent class, independent of pod size. This identification of two variant classes contrasts with the diversity of pod-shape genes which have been described previously (reviewed by Blixt [11]), corresponding to multiple genetic map locations. These genetic map locations were determined with respect to classical genes, so the markers are sparse, and the map distances are large, ca. 20cM [11] so have correspondingly large errors associated with their position.
The genes curt (reduced pod length) and lt (increased pod width) reportedly map to different genetic locations: curt is linked to the gene v and lt is linked to p. The polymeric genes p and v condition very similar phenotypes, a reduction of the pod sclerenchyma layer, and in mangetout pea varieties they are often combined as the combination completely eliminates the sclerenchyma layer [11]. Furthermore, increased pod width and decreased pod length have the same phenotypic consequence. So, if p or v were incorrectly assigned, then curt or lt could be incorrectly located on the genetic map. It is therefore possible that these two correspond to one gene, of the short-wide class, corresponding to the upper regression line in Figure 2c.
The genes, te and teu conferring long (and narrow) pods are both linked to gp, but they are positioned on either side of gp on linkage group V of Blixt’s genetic map [11]. The dominant allele of Laf confers wide (and short) pods, and is located on Blixt’s map more distantly from gp, beyond te. Many, but not all, yellow podded lines also have narrow pods. In green-podded x yellow-podded crosses the long-narrow phenotype will often segregate in coupling phase with gp. However, if the phase was in repulsion then the dominant pod-shape allele (conferring a wider pod) would be linked to the recessive gp allele. It would be tempting, when it is segregating, to assign the linked pod shape allele to the dominant short-wide phenotype rather than the recessive long-narrow phenotype; this would be consistent with the designation of Laf. With linkage in repulsion phase fewer F2 individuals will be identified as gp/gp (yellow podded types) and even fewer would also be recessive for both alleles conferring long-narrow pod shape (laf/laf). In such a cross linkage distance could easily be overestimated. Thus these three genes Laf, te and teu could possibly represent alleles of one gene where the recessive allele confers long-narrow pods. This conclusion would be supported if the historic te and teu alleles could be identified unambiguously and an allelism test performed.
The phenotypic description given here, and previous genetic data could be taken to be consistent with two genetic loci, one linked to gp where the recessive allele confers long-narrow pods and the other linked to p or v where the recessive allele confers short-wide pods. Historical precedent would name these lt (short-wide) and te (long-narrow). This scheme does not account for cotr, which reportedly maps on linkage group V near Laf [11].
Li et al. [16] have described two recessive mutations in pea, bigger organs (bio MG515008) and elephant ear-like leaf1 (ele1 MG515010), which confer an increase in the size of multiple organs; leaves, flowers and pods. Virus-induced gene silencing (VIGS) of either Bio or Ele resulted in larger organs, including pods which (measuring the aspect ratio in their figure) are of the short-wide type. These two genes are unlikely to correspond to the pod shape mutants lt and te, which do not condition a general change in organ size. Nevertheless, the Bio and Ele proteins were shown to be part of a complex that interacts with the pea orthologue of the co-repressor TOPLESS (PsTpl) [16]. Within the Cameor v1a assembly [14] there are seven genomic locations corresponding to PsTpl-related sequences (with an e-value less than 10−50). One of these corresponds to an unannotated sequence on linkage group VI (chr1 343863094..343863397), at a location consistent with lt. Organ specific regulation of PsTpl partners of Bio and Ele1 could lead to organ-specific differences in size, such as is reflected in pod shape. Further genetic studies are required to clarify such relationships.
This is a very preliminary analysis, without measurement replication of each individual accession so the conclusions reached need to be treated with caution, however, these data are consistent with long-term historical records (Figure 3), which are also consistent with this interpretation. Adequate variation can be found among these accessions for further analysis, for example in association studies. The Structure analysis of Jing et al. [12] is confounded by a high proportion of missing data, but nevertheless is consistent with subsequent analyses with larger numbers of markers, albeit with fewer accessions [14,17,18]. The work presented here suggests that any future association studies carried out on large, diverse germplasm collections will need to take adequate account of the considerable variation in these quantitative traits that corresponds to population sub-structure.

Supplementary Materials

The following are available online at https://www.mdpi.com/article/10.3390/d13050203/s1, Table S1 2020 data, Table S2 Historical data.

Author Contributions

Conceptualization, N.C., J.M.I.H. and T.H.N.E.; methodology, N.C., L.U.W., J.M.I.H. and T.H.N.E.; formal analysis, T.H.N.E.; investigation, E.V., P.H.-P., J.M.I.H., T.H.N.E. and M.J.A.; resources, N.C. and M.J.A.; data curation, N.C. and M.J.A.; writing—original draft preparation, T.H.N.E.; writing—review and editing, all authors; visualization, T.H.N.E. and J.M.I.H.; supervision, N.C.; project administration, N.C.; funding acquisition, N.C. All authors have read and agreed to the published version of the manuscript.

Funding

This research was funded by The UK Biotechnology and Biological Sciences Research Council, grant number BB/CCG1740/1 and by the UK Department for Environment, Food and Rural Affairs, grant number 24005. NE and JH acknowledge funding from UKRI for the Institute Strategic Programme grant (BBS/E/J/000PR799). NE gratefully acknowledges receipt of an Institute Strategic Fellowship from the John Innes Centre.

Institutional Review Board Statement

Not applicable.

Informed Consent Statement

Not applicable.

Data Availability Statement

The described germplasm and the associated data can be requested and browsed on SeedStor public database at https://www.seedstor.ac.uk/ (accessed on 10 May 2021).

Acknowledgments

We thank the Horticultural Service Department of JIC, the laboratory managers and support staff who facilitated this work under exceptionally difficult circumstances.

Conflicts of Interest

The authors declare no conflict of interest.

Appendix A

Ovule number
Although the correlation between pod length and ovule number is weak it is possible to glean further information from this relationship as illustrated in Figure A1. The marginal change in ovule number for a marginal change in pod length (ca. 0.05 ovules/mm) is the slope of the regression line which is approximately one additional ovule for each additional 2 cm. As this relationship is derived from the data set as a whole, it is of interest to know whether it also holds for the unusually long-narrow pods and the unusually short-wide pods.
Figure A1. Pod length vs. ovule number: Data are plotted (+) for 594 accessions grown in 2020 (Supplementary Table S1). Data for the 20 accessions with unusually long and narrow pods are ringed in red, and the 15 accessions identified with unusually short and wide pods are ringed in blue. Linear regressions are plotted for all data (solid black line), the unusually long and wide pods (solid red line), unusually short and wide pods (solid blue line) and all data excluding the unusual pods (dotted black line). The regression lines are y = (4.1 ± 0.21) + (0.05 ± 0.003) x, r2 = 0.33, n = 594; y = (9.0 ± 1.66) + (0.01 ± 0.01) x, r2 = 0.02, n = 20; y = (1.5 ± 2.25) + (0.08 ± 0.03) x, r2 = 0.35, n =15 and y = (4.2 ± 0.22) + (0.05 ± 0.003) x, r2 = 0.32, n = 559 respectively. The three accessions with 12 ovules per pod are JI0582, JI2016 and JI2294.
Diversity 13 00203 g0a1
For the unusually short-wide pods the regression coefficient (0.08 ± 0.03) is not significantly different from the accessions as a whole, although the standard errors differ by an order of magnitude and the accession scored as having a single ovule (JI0850) has a strong effect on the regression. Omitting this data point the regression becomes y = (5.4 ± 1.69) + (0.03 ± 0.021) x; r2 = 0.18; n =14 which is closer to the data for the accessions as a whole.
The regression coefficients for the long-narrow pods are significantly different from the accessions as a whole (slope 0.01 ± 0.01 vs. 0.05 ± 0.003 and intercept 9.0 ± 1.66 vs. 4.1 ± 0.21). Indeed for these long-narrow pods the marginal change in ovule number for a marginal change in pod length is not significantly different from zero. This implies that increasing pod length has little relationship to ovule number for the long-narrow pod accessions. Again there is an outlier (JI0151) with 7 ovules and a pod length of 114 mm; removing this data point changes the relationship to y = (7.1 ± 1.3) + (0.04 ± 0.015) x; r2 = 0.25; n =19. In this case the slope is not significantly different from the accessions as a whole, but the intercept is significantly different. Thus the long-narrow pod class has an intrinsic ovule number, which may account for the distinct shape of these pods.
There are two possible interpretations: (i) The long-narrow pods are observed to have about 3 more ovules per pod compared to normal pods. The slope of the regression line (Δyx = 0.04 ± 0.015) indicates that the corresponding extra length of the pod (Δx) should be in the range 54.5 > Δx > 7.8. (ii) Alternatively, the long-narrow pods may have a fixed ovule number (of 9.0 ± 1.66). On the basis of their length: width ratio these 19 pods are ca. 14 mm longer than expected, which is consistent with either interpretation, but for the longest pods suggests that the unusual length width ratio is not sufficient to explain their high ovule number and therefore that a fixed ovule number in this pod class is a better explanation.
In the historical data set the longest pod in the long-narrow class was JI3546 at 150 mm for which no ovule number data is available. However the longest pod, recorded for JI2144, which is of the short-wide class, is 165 mm and the number of ovules per pod is recorded as 9 (https://www.seedstor.ac.uk/search-infoaccession.php?idPlant=25533 accessed on 10 May 2021) consistent with the fixed ovule number for this class. If this interpretation is correct then it suggests that the long-narrow pod trait would not be a useful proxy for selecting increased ovule number. Indeed the three accessions with the largest number of ovules are not of the long-narrow class (Figure A1). The longest pods are also the largest pods, which are of the short-wide class, i.e., wider than expected for their length, consistent with mangetout types having been selected for large pods.

References

  1. Lewis, G.P.; Schrire, B.; Mackinder, B.; Lock, M. Legumes of the World; Kew Publishing: Kew, UK, 2005. [Google Scholar]
  2. Pirie, M.D.; Klitgaard, B.B.; Pennington, R.T. Revision and Biogeography of Centrolobium (Leguminosae-Papilionoideae). Syst. Bot. 2009, 34, 345–359. [Google Scholar] [CrossRef]
  3. Krapovickas, A.; Gregory, W.C.; Williams, D.E.; Simpson, C.E. The taxonomy of the genus Arachis (Leguminoseae). Bonplandia 2007, 16, 1–205. [Google Scholar] [CrossRef] [Green Version]
  4. Darwin, C. On the Origin of Species, 2nd ed.; Appleton & Coy: New York, NY, USA, 1861; p. 154. [Google Scholar]
  5. Literature.org. Available online: https://www.literature.org/authors/darwin-charles/the-origin-of-species/chapter-05.html (accessed on 19 January 2021).
  6. Aviezer, I.; Lev-Yadun, S. Pod and seed defensive coloration (camouflage and mimicry) in the genus Pisum. Is. J. Plant Sci. 2015, 62, 39–51. [Google Scholar] [CrossRef]
  7. Mejri, F.; Ben Khoud, H.; Njim, L.; Baati, T.; Selmi, S.; Martins, A.; Serralheiro, M.L.M.; Rauter, A.P.; Hosni, K. In vitro and in vivo biological properties of pea pods (Pisum sativum L.). Food Biosci. 2019, 32, 100482. [Google Scholar] [CrossRef]
  8. Sadras, V.O.; Lake, L.; Kaur, S.; Rosewarne, G. Phenotypic and genetic analysis of pod wall ratio, phenology and yield components in field pea. Field Crops Res. 2019, 241, 107551. [Google Scholar] [CrossRef]
  9. Gautam, K.K.; Syamal, M.M.; Singh, A.K.; Gupta, N. Variability, character association and path coefficient analysis of green pod yield and its related traits in pea (Pisum sativum L.). Legume Res. 2017, 40, 818–823. [Google Scholar] [CrossRef] [Green Version]
  10. Bhuvaneswari, S.; Sharma, S.K.; Punitha, P.; Shashidhari, K.S.; Naveenkumar, K.L.; Prakash, N. Evaluation of morphological diversty of field pea (Pisum sativum subsp. arvense L.) germplasm under sub-tropical climate of Manipur. Legume Res. 2017, 40, 215–223. [Google Scholar]
  11. Blixt, S. Mutation genetics in Pisum. Agri. Hort. Genet. 1972, 30, 1–293. [Google Scholar]
  12. Jing, R.; Vershinin, A.; Grzebyta, J.; Shaw, P.; Smýkal, P.; Marshall, D.; Ambrose, M.J.; Ellis, T.H.N.; Flavell, A. The genetic diversity and evolution of field pea (Pisum) studied by high throughput retrotransposon based insertion polymorphism (RBIP) marker analysis. BMC Evol. Biol. 2010, 10, 44. [Google Scholar] [CrossRef] [PubMed] [Green Version]
  13. De Beukelaer, H.; Davenport, G.F.; Fack, V. Core Hunter 3: Flexible core subset selection. BMC Bioinform. 2018, 19, 203. [Google Scholar] [CrossRef] [PubMed]
  14. Kreplak, J.; Madoui, M.-A.; Cápal, P.; Novák, P.; Labadie, K.; Aubert, G.; Bayer, P.E.; Gali, K.K.; Syme, R.A.; Main, D.; et al. A reference genome for pea provides insight into legume genome evolution. Nat. Genet. 2019, 51, 1411–1422. [Google Scholar] [CrossRef] [PubMed]
  15. Young, J.P.W.; Matthews, P. A distinct class of peas (Pisum sativum L.) from Afghanistan that show strain specificity for symbiotic rhizobium. Heredity 1982, 48, 203–210. [Google Scholar] [CrossRef] [Green Version]
  16. Li, X.; Liu, W.; Zhuang, L.; Zhu, Y.; Wang, F.; Chen, T.; Yang, J.; Ambrose, M.; Hu, Z.; Weller, J.L.; et al. BIGGER ORGANS and ELEPHANT EAR-LIKE LEAF1 control organ size and floral organ internal asymmetry in pea. J. Exp. Bot. 2019, 70, 179–191. [Google Scholar] [CrossRef] [PubMed]
  17. Smýkal, P.; Hradilová, I.; Trněný, O.; Brus, J.; Rathore, A.; Bariotakis, M.; Das, R.R.; Bhattacharyya, D.; Richards, C.; Coyne, C.J.; et al. Genomic diversity and macroecology of the crop wild relatives of domesticated pea. Sci. Rep. 2017, 7, 17384. [Google Scholar] [CrossRef] [PubMed] [Green Version]
  18. Trněný, O.; Brus, J.; Hradilová, I.; Rathore, A.; Das, R.R.; Kopecký, P.; Coyne, C.J.; Reeves, P.; Richards, C.; Smýkal, P. Molecular Evidence for Two Domestication Events in the Pea Crop. Genes 2018, 9, 535. [Google Scholar] [CrossRef] [PubMed] [Green Version]
Figure 1. Phenotypes of pods illustrating different length: width ratios and pigmentation. (a) JI0064 P. elatius, showing purple spotting of the pod (rup) and occasional neoplasms (Np) with a length: width ratio consistent with te and a blunt tip (Bt). (b) JI0841 P. sativum with a convexly curved pod, consistent with co and a pointed tip (bt) (c) JI1245 P. sativum with a concavely curved pod, consistent with cp and a pointed tip (bt). (d) JI1473 P. sativum with wild type pod length: width ratio with a blunt tip (Bt, Co, Cp, Te). (e) JI0268 P. sativum from Crete with straight, blunt pods and exhibiting neoplasms (Bt, Co, Cp, Np, Te). (f) JI0007 P. sativum with unusually wide pods consistent with lt. Gene symbols are explained in Table 1 and Blixt 1972 [11] and the scale bar represents 5 cm for all panels see also Supplementary Table S1.
Diversity 13 00203 g001
Figure 2. Pod length and width. Frequency distribution of (a) pod lengths and (b) pod widths. The red line in (a,b) is the expected normal distribution with the same mean and standard deviation. (c) Covariation of pod length and width. The crosses represent the individual length, width measurements (see Supplementary Table S1). The solid black line is the regression line for all data. The ringed data points are extreme values (see text) and the dashed lines are the regression lines for the upper and lower extremes respectively. The central solid regression line follows the relationship: W = (0.15 ± 0.005) L + (3.71 ± 0.356).
Diversity 13 00203 g002
Figure 3. Pod length and width distribution for historic data (see also Supplementary Table S2). The solid black line is the regression for these data W = (0.15 ± 0.003) L + (3.02 ± 0.25). The dashed red lines are the three regression lines for the 2020 data from Figure 2c. The accession numbers for pods outside the upper and lower ranges of the 2020 data set are indicated.
Diversity 13 00203 g003
Figure 4. Pod, size and length: width ratio of 96 accessions from Structure group 3 of Jing et al. [12] with respect to subgroup assignments (Q). (a) Subgroup number, (b) taxa assigned according to the colors on the right. (c) Q plot of proposed parental assignment from [12] where each accession is represented by a vertical bar with grey shading for according to subgroup Q value. (d) The deviation of pod length: width ratio from its expectation is plotted as Δ = ((Lo/Wo) − (Lp/Wp))/(Lp/Wp) so that short-wide pods have a positive ratio and long-narrow pods have a negative ratio. The scale is on the left. (e) Pod size in mm2 (S = LoWo), with the scale on the right. (f) as (b).
Diversity 13 00203 g004
Figure 5. Pod size in selected sets of accessions taken from historic and 2020 data combined. Pod size is represented as the product of pod length and width in mm2. The sets are: (1) All accessions, n = 1735, (2) Structure subgroup 3.3, n = 45, (3) Peas from Afghanistan, n = 80, (4) Accessions Afghanistan within Structure subgroup 3.3, n = 28, (5) Structure subgroup 3.6, n = 18, (6) Pisum fulvum n = 16. One P. fulvum data point is not assigned to structure group 3.6 and two data points in structure group 3.6 are not assigned to P. fulvum. Structure subgroup assignments and named taxa are as in [12]. Error bars are standard errors.
Diversity 13 00203 g005
Table 1. Relevant genes relating to pod character variation in pea.
Gene NameSymbol 1Phenotypic Description
acutilegumenbtpod apex pointed
convexumco
con
pod curved convex with respect to the seed side of attachment
concavumcp
cpa
pod curved concavely with respect to the seed side of attachment
contractivuscotr
curt
pod length reduced by ca. 20%
tenuiste
teu
pod breadth reduced by ca. 25%
latusltincreased pod width
LaitorLafbroader pod
1 Gene names and symbols as described by Blixt [11]; an initial capital indicates the dominant allele as the variant or mutant form. Where more than one gene has been described both symbols are given.
Publisher’s Note: MDPI stays neutral with regard to jurisdictional claims in published maps and institutional affiliations.

