Article

Patterns of Understory Community Assembly and Plant Trait-Environment Relationships in Temperate SE European Forests

Slovenian Forestry Institute, Department of Forest Ecology, Večna pot 2, 1000 Ljubljana, Slovenia
*
Author to whom correspondence should be addressed.
Diversity 2020, 12(3), 91; https://doi.org/10.3390/d12030091
Submission received: 17 February 2020 / Revised: 28 February 2020 / Accepted: 2 March 2020 / Published: 4 March 2020

Abstract

:
We analyzed variation in the functional composition and diversity of understory plant communities across different forest vegetation types in Slovenia. The study area comprises 10 representative forest sites covering broad gradients of environmental conditions (altitude, geology, light availability, soil type and reaction, nutrient availability, soil moisture), stand structural features and community attributes. The mean and variation of the trait values were quantified by community-weighted means and functional dispersion for four key plant functional traits: plant height, seed mass, specific leaf area and leaf dry matter content. At each study site, forest vegetation was surveyed at two different spatial scales (4 and 100 m2) in order to infer scale-dependent assembly rules. Patterns of community assembly were tested with a null model approach. We found that both trait means and diversity values responded to conspicuous gradients in environmental conditions and species composition across the studied forests. Our results mainly support the idea of abiotic filtering: more stressful environmental conditions (e.g., high altitude, low soil pH and low nutrient content) were occupied by communities of low functional diversity (trait convergence), which suggests a selective effect for species with traits adapted to such harsh conditions. However, trait convergence was also detected in some more resource-rich forest sites (e.g., low altitude, high soil productivity), most likely due to the presence of competitive understory species with high abundance domination. This could, at least to some extent, indicate the filtering effect of competitive interactions. Overall, we observed weak and inconsistent patterns regarding the impact of spatial scale, suggesting that similar assembly mechanisms are operating at both investigated spatial scales. Our findings contribute to the baseline understanding of the role of both abiotic and biotic constraints in forest community assembly, as evidenced by the non-random patterns in the functional structure of distinct temperate forest understories.

1. Introduction

Analyzing patterns of functional composition (community trait means) and functional diversity (the degree of trait variation among coexisting species in a community) within and across plant communities has been recognized as a promising avenue in attempts to infer mechanisms of community assembly [1,2,3,4]. As such, functional diversity patterns serve as indicators of different assembly processes and have important implications for understanding global, regional and local plant species distributions [5,6]. Relating community functional properties to environmental gradients is commonly used to quantify trait-environment relationships [7,8] that may be informative for understanding community assembly processes [9]. Such evaluations of trait-based (dis)similarities among coexisting plant species are also used to objectively test the assumption that local plant communities do not simply result from the random gathering of species from a regional species pool [10].
In its broadest context, community assembly is conceived of as a multi-step process, during which species assemblages are gradually delimited by a set of hierarchically organized filters [11,12,13,14]. The establishment, growth and survival of plant species is therefore not a straightforward process, as species face seemingly opposing challenges at the different stages of the process. On one hand, species trait values should correspond as much as possible to the prevailing environmental conditions of a given (micro)site. On the other hand, species need to display some degree of functional trait differentiation in order to minimize niche overlap and thus coexist with other species present in a local community [15,16,17].
Two core groups of mechanisms have been proposed to explain vegetation assembly, namely stochastic (random) processes and deterministic (non-random) processes [11,13,18]. The latter assume that community assembly is generally driven by abiotic filtering, which acts as a strong selective force by excluding species unsuited for the habitat and causes increased trait similarity of co-occurring species [19]. This phenomenon has been described as trait convergence, meaning that the functional traits of co-occurring species are more similar than those expected by chance, and thus a limited number of functional strategies is preferred within a realized local community [14,20,21]. The range of trait values within a community is expected to decrease with increasing environmental adversity [22,23]. Abiotic filtering, and the resulting trait convergence, play a major role in harsher environments [24,25]. As abiotic filtering causes increased similarity of traits among species that passed through all abiotic filters and were established in a given location, species must then overcome the regulative constraints induced by interspecific competition [10,26]. According to this line of reasoning, competition for resources presumably promotes niche differentiation and hinders the coexistence of species with highly similar trait values [19]. This is known as the limiting similarity principle [15,16], which causes trait divergence [20], i.e., the functional traits of co-occurring species are more similar than those expected at random [21,27]. Niche differences and resource partitioning among species are considered key drivers of coexistence [28]. Greater diversity of life history strategies should generally be found in more competitive and resource-rich habitats [4,14].
Distinguishing patterns of trait convergence and divergence has been a notable challenge in community ecology [29], since different assembly processes can be responsible for trait convergence/divergence [5]. For example, trait divergence in more stressful abiotic conditions can be attributed to facilitation [25]. Another notation is that trait convergence in more favorable environments has been found to be related to the exclusion of weak competitors [24,27,30]. In contrast to the described niche-based assembly processes, the assemblages might also result from stochastic processes (neutral theory) [28,31]. When functional diversity patterns indicate random assembly, stochastic processes have the dominant influence on community assembly and allow the coexistence of functionally equivalent species [27].
Assembly mechanisms have been widely studied [3,5], especially in non-forest vegetation types [5,14,19,23,32]. Regarding forest ecosystems, relevant studies have so far been either conducted in (sub)tropical forests [27,33] or have focused solely on tree species in the overstory layer [4,34], woody plant species [35] or tree sapling communities [17]. In recent years, there has been increasing research focus on understory (herbaceous) forest communities [18,21,24,30,36]. However, less consideration has been given to temperate forest understory communities in Europe, particularly in regard to the comparison of different forest vegetation types.
Compared to other widely spread vegetation types (e.g., grasslands), forest understories are ecologically specific and most often resource-limited habitats, where the overstory tree layer induces both abiotic constraints (resource filtering, e.g., shading) and complex biotic interactions, as mature trees are strong competitors and major consumers of space, light, water and nutrients [30,37,38]. From an ecological perspective, the understory in mature, closed canopy forest stands can be seen as a highly selective environment, where shade tolerance affects the ability of plants to cope with other stressors [39,40]. For example, in a dense monospecific forest with high canopy cover, low light availability prevents the establishment and survival of more light-demanding understory herbaceous and tree species. In addition, soil characteristics play an important role in filtering plant species. Forest soils on calcareous bedrock (limestone and dolomite) normally have higher nutrient availability and soil pH, which is favorable for a larger set of species [38], thus increasing the potential for competitive interactions. By contrast, acidic and nutrient-poor soils usually harbor considerably lower species richness, as not many plant species are able to tolerate low pH values in the temperate forest understories [41,42]. One of the focal questions in forest functional ecology still pending is related to how the role of abiotic vs. biotic constraints is expected to change along ecological gradients such as altitude, tree species composition and forest stand structural features [30,40].
Apart from environmental effects on community assembly patterns, there has been an active debate among community ecologists about how the relative importance of community assembly mechanisms may depend on the spatial scale of observation [27,32,33,43]. When spatial scale, i.e., the unit of observation (e.g., plot size), is reduced, patterns of trait divergence can be enhanced [10]. This is because biotic interactions (competition for resources) occur over smaller scales and because larger spatial scales integrate environmental heterogeneity [12]. Consequently, abiotic filtering is expected to be the strongest at spatial scales larger than those for competition [44,45]. With increasing spatial scales, the relative importance of abiotic filtering, resulting in trait convergence, should increase [12,20,46]. In contrast, the strength of biotic effects is expected to decrease with increasing spatial scale [47]. Biotic interactions, such as niche-based exclusion, may lead to significant trait divergence at relatively fine scales [48]. However, the weaker competitor exclusion may cause trait convergence at small scales where only strong competitive traits are retained [49]. Zhang et al. [27] showed that at larger spatial scales, dispersal limitation becomes more prominent, causing the weakening (towards random distribution) of trait convergence.
Theoretical expectations and evidence from previous studies suggest that the strength of assembly mechanisms varies along environmental gradients and with spatial scale. To our knowledge, however, hypothesis-driven evaluations considering both aspects (ecological gradients and spatial scale) in the temperate forest understory are rather scarce. In this study, the sampling design used and the broad spectrum of forest vegetation types allowed us to investigate trait-based plant community composition and diversity among 10 forest understory communities along significant ecological gradients associated with major abiotic factors (e.g., altitude, light, soil reaction, nutrient availability, soil moisture). For four functional traits representing both resource-use and regeneration strategies, we first characterized trends in community-weighted mean (CWM) trait values along the environmental gradients. We then used a null model approach [47,50,51] to estimate how patterns of functional diversity (FD) change along environmental gradients and whether these patterns also depend on the spatial scale, by comparing patterns from plots of two different sizes (4 m2 vs. 100 m2). We hypothesized that (1) abiotic filtering is associated with trait convergence and is strongest in forest understories where unfavorable environmental conditions prevail (e.g., cold climate in high altitudes, low soil pH and nutrient availability). Regarding the impact of spatial scale, we anticipated that (2) trait convergence becomes more pronounced with increasing spatial scale. In both cases (CWM and FD), we expected trait-specific responses, i.e., different traits show different convergence/divergence patterns along environmental gradients. Lastly, we expected that (3) patterns of trait convergence and divergence are also affected by plant community attributes, i.e., species evenness. Communities with low species evenness (reflecting dominance of strong competitive species) are presumed to show more biotically-driven convergence patterns due to the filtering effects of competitive exclusion.

2. Materials and Methods
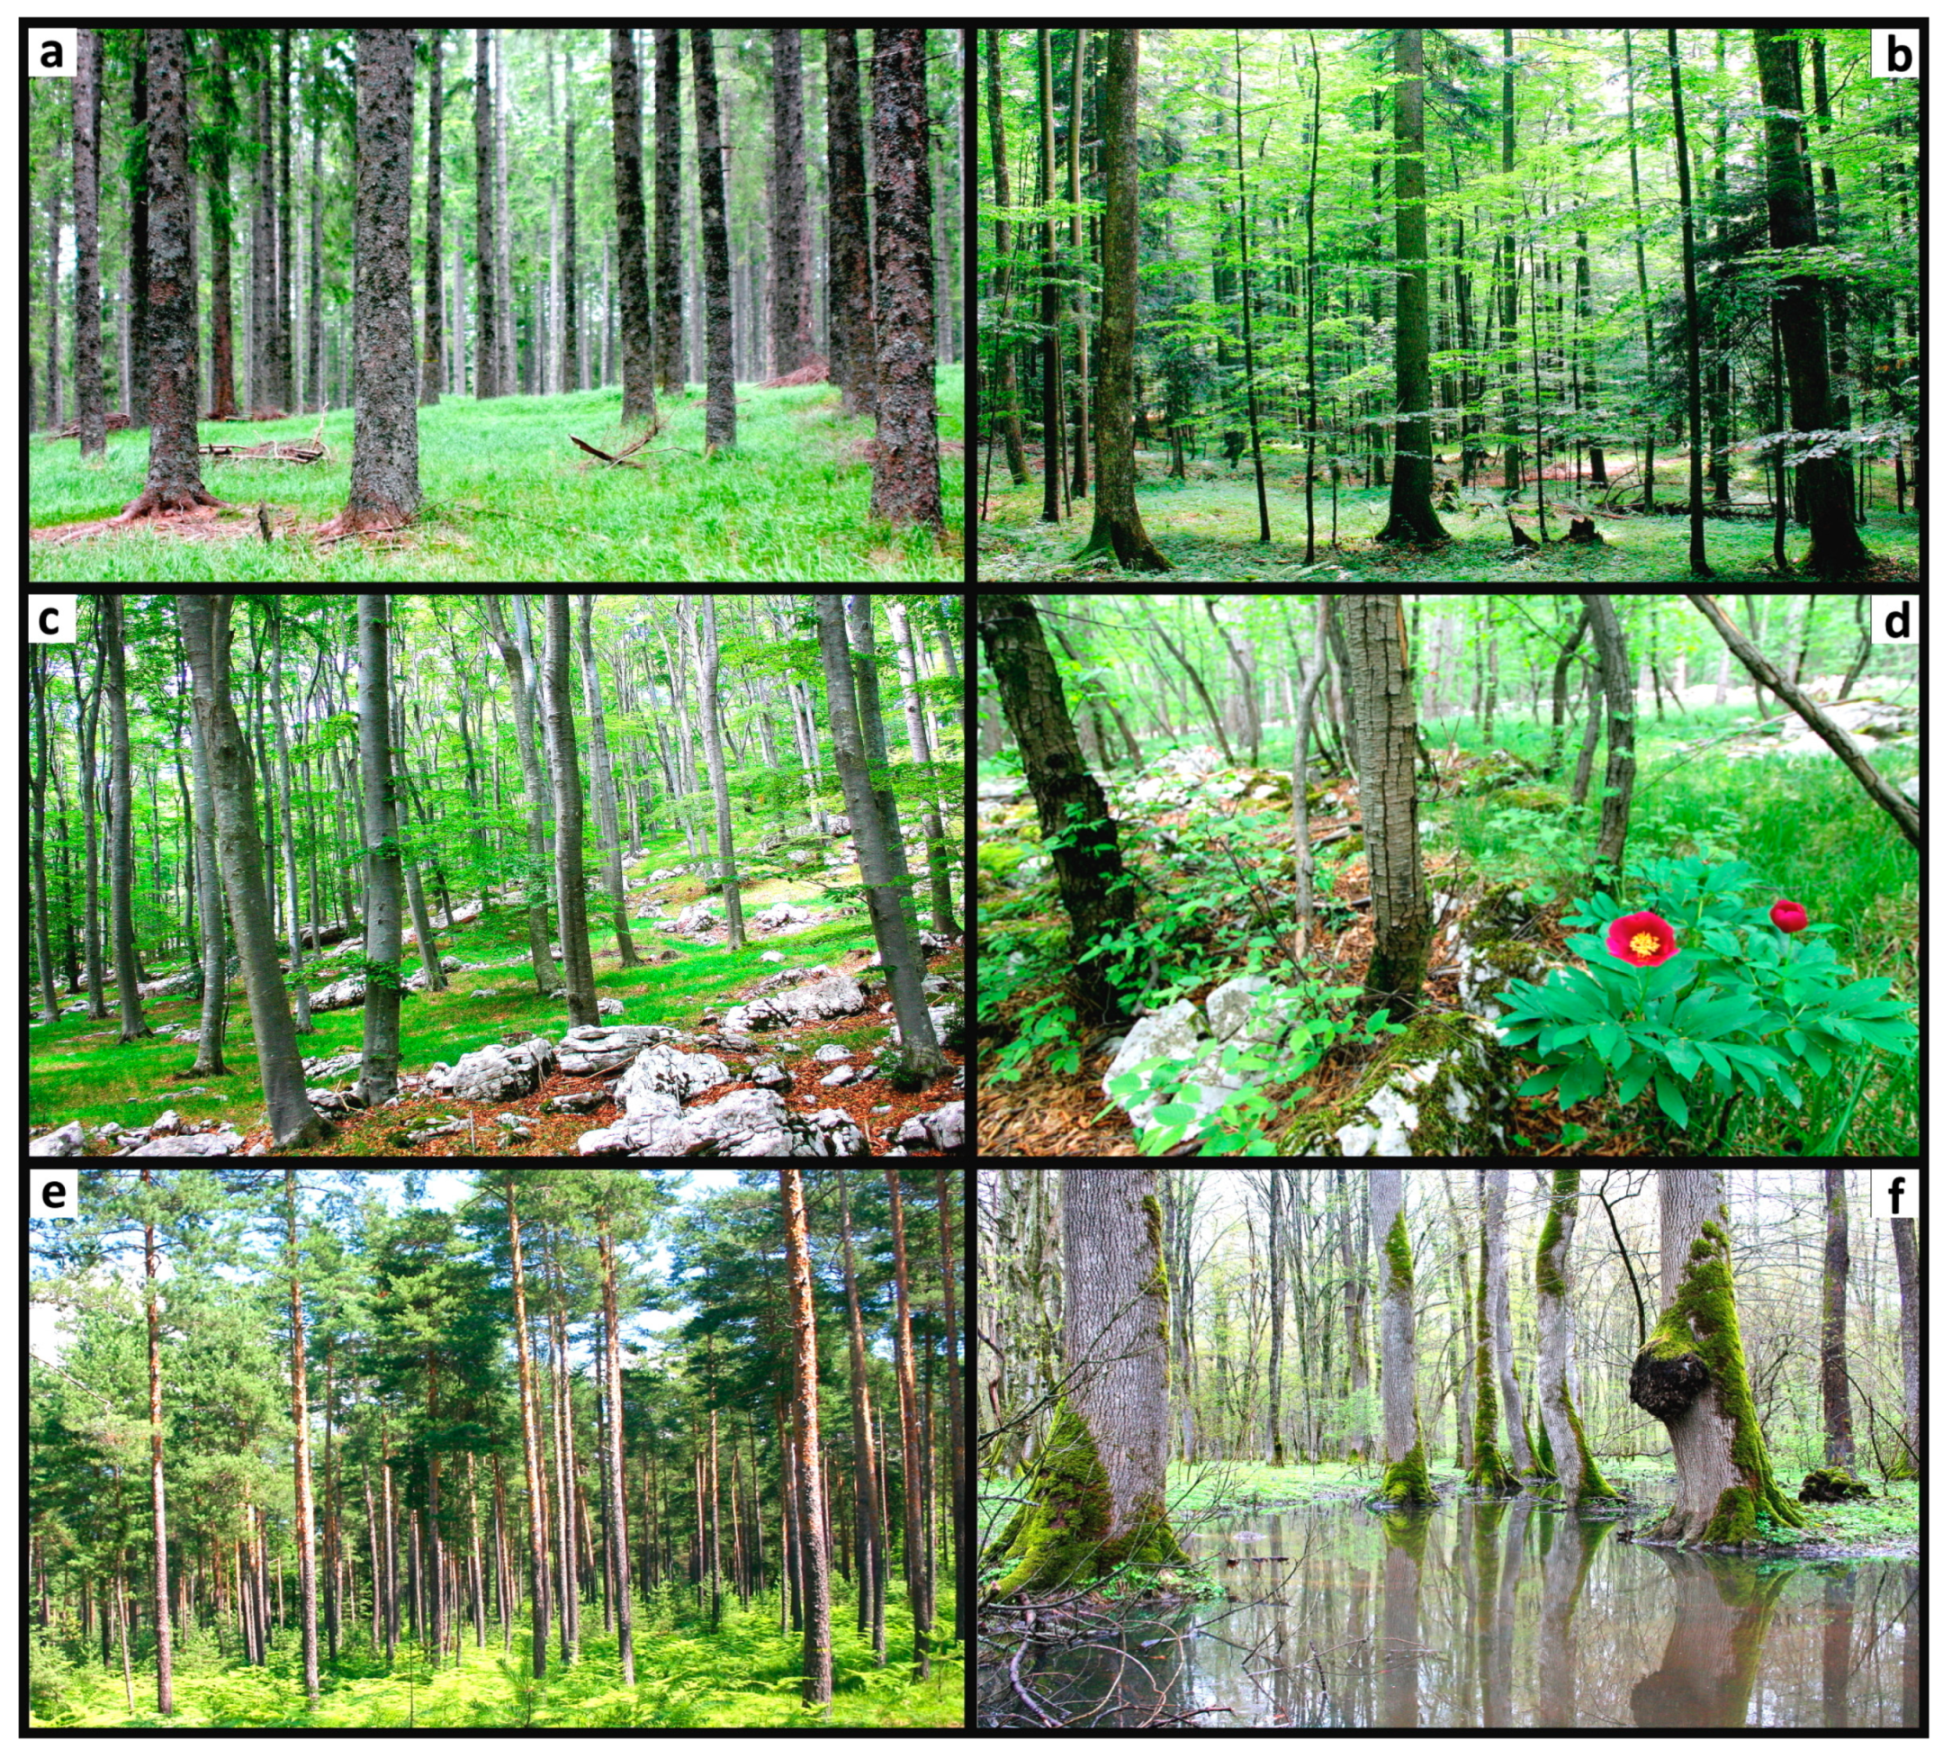
2.1. Study Area

The study area comprised 10 undisturbed, closed canopy forest stands, spanning from lowland floodplain deciduous forests, through mesic (mixed) beech forests to mountain spruce forests (Table 1, Figure 1). The selected sites represent the major forest ecosystems and forest vegetation communities across the country [52,53]. The study sites differ significantly in altitude (ranging from 160 to almost 1400 m), climatic conditions (mean annual temperature, amount of precipitation), geology, soil characteristics, tree layer species and understory composition, and stand structural features. Detailed information on our study sites and their spatial distribution across Slovenia was given in Kutnar et al. [54].
The characteristics of forest stands are important factors influencing the quality and quantity of understory plant communities. All 10 forest stands were characterized by a mature forest stand structure, with fully developed climax overstory and understory vegetation, representative for each forest vegetation type. The main environmental and vegetation characteristics of the study sites are summarized in Table 1.

2.2. Vegetation Data Collection

The monitoring of the study sites was initiated in 2004. The sites were sampled in accordance with the standard protocol of the Intensive Monitoring (IM) Programme [55,56]. At each site, a core area (1–3 ha) with homogeneous environmental and vegetation conditions was selected. The sampling of vegetation was conducted at two different spatial scales, i.e., plot sizes. Large plots of 10 × 10 m (hereafter Lplots) were placed systematically across the core area, with a minimum distance between plots of 20 m. The number of Lplots per site (4 or 8) depended on the intensity and type of monitoring activities. In total, 60 Lplots were placed across all IM sites [54]. Additionally, 10 small plots of 2 × 2 m (hereafter Splots) were established at each IM site, i.e., 100 plots altogether. These plots were also systematically installed across the core area. Lplots and Splots were spatially separated. In some rare cases, the spatial distribution of Splots needed to be slightly adjusted due to the presence of IM sampling equipment or other restrictions (e.g., vicinity to skidding trails).
We sampled forest vegetation according to standardized sampling protocols [56]. In all Lplots and Splots, all vascular plant species in the tree, shrub and herb layer were recorded. The percentage cover of each species was visually estimated using a modification of Barkman’s method ([57], for Lplots) and Londo’s method ([58], for Splots). For the analyses, we used the percentage class mid-points as quantitative values. The vegetation surveys were performed during spring (April–May), summer (June–July) and late summer (August–September) in 2004 and 2005. At some IM sites, where vernal geophytes dominated the understory vegetation during early spring (e.g., in lowland oak-hornbeam forests and some species-rich beech forest sites), species composition differed significantly between the spring and summer period. Therefore, only data for the summer period were used in this study. Nevertheless, many vernal geophytes were still present in our sampling plots during the summer period. The nomenclature for vascular plants followed the Flora Europaea [59,60] and National Flora [61].

2.3. Plant Functional Traits

For each species recorded in the shrub and herb layer, we compiled data for four plant functional traits: specific leaf area (SLA, mm2/mg), plant height (H, m), seed mass (SM, mg) and leaf dry matter content (LDMC, mg/g). These functional traits have been demonstrated to capture the main plant leaf-history strategies (leaf-height-seed scheme) [62], and their use has been widely advocated in studies dealing with the ecological drivers of functional diversity and community assembly [46,47]. Specific leaf area is a good surrogate for the ability of a plant to use light efficiently, while plant height is typically associated with the ability to compete for light [1,63,64]. Seed mass was used to depict reproductive strategies, as this trait strongly influences species dispersal and establishment ability [65], but it is also commonly associated with shade tolerance [34]. We additionally included LDMC as a plant trait related to leaf physical resistance and species stress tolerance [14]. We chose these two leaf traits (SLA and LDMC) because they are widely recognized as good predictors of how plant species respond to variation in resource availability [9,29]. In the herbaceous layer of temperate forest, leaf traits have been shown to be associated with the canopy closure gradient [66] and stand basal area [9]. They are closely linked to the resource-use and acquisition/conservation trade-off known as the worldwide leaf economics spectrum [67]. The leaf economics spectrum paradigm posits that resource conservation is the prevailing strategy in resource-poor habitats, while resource acquisition is favored in resource-rich habitats [68].
Trait values were mainly sourced from the LEDA trait database [69] and additionally searched for in the available literature and other online databases (e.g., BiolFlor, D3; [70,71]). As functional trait metrics are sensitive to the completeness of the species’ trait data [72], for each study site we ensured that the most abundant understory species, i.e., those accounting for more than 80% of the total abundance [65,73], did not have any missing trait values.

2.4. Data Analyses

To describe the functional composition of the plant assemblages within each plot, we calculated the community-weighted mean (CWM; [73]) of each trait, which can be seen as the average trait value in the community reflective of the relative abundances of species. As a measure of the diversity in functional trait values in the community, among several available methods [6], we chose functional dispersion (FDis; [74]). FDis is unaffected by community species richness, and it calculates the mean distance of individual species to the centroid of all species in the community [74]. We calculated CWM and abundance-weighted FDis for each functional trait separately as well as for all traits together (MULTI FDis) in order to better elucidate the processes shaping communities [23]. The CWM and FDis were computed in R [75] with the FD package [76]. For height, we excluded the recorded woody species (shrubs and trees) because they were represented by seedlings/saplings in the herb and shrub layer, whereas the height trait data corresponded to the adult plants. The four continuous traits (height—H, seed mass—SM, specific leaf area—SLA, leaf dry matter content—LDMC) were log10 transformed before analysis to conform to normality and then standardized, i.e., centered and divided by their SD.
To infer the community structure and assembly mechanisms, we compared the observed FDis values with values based on randomly generated communities using a null model approach [50,77]. Null models are commonly used to reveal assembly processes from functional diversity patterns [47]. Species abundances were shuffled randomly across species but within the site-level species pool [5,51] while maintaining the observed sample species richness using the function “randomizeMatrix” implemented in the R package picante [78]. The community data matrices were randomized 999 times. The described randomization procedure was done separately for each spatial scale (plot size).
The standardized effect size (SES) was used to test for significant deviation between observed and random communities, and was calculated as follows [79]: SES = (FDisobs – FDisnull)/FDissd, where FDisobs is the value of FDis observed in the actual assemblage (plot), while FDisnull and FDissd represent the mean value and standard deviation, respectively, of FDis values generated from the 999 simulations. Negative (positive) SES values indicate that the trait distribution patterns are more convergent (divergent) than would be expected at random. Observed values close to zero indicate random trait distribution, i.e., no prevalence of significant convergence or divergence patterns.
For SES FDis, we tested if the values in Splots were significantly different from zero (either positive or negative) using a two-tailed Wilcoxon signed-rank test, separately for each functional trait and study site. This test was possible because the number of Splots was the same (n = 10) in all study sites. Then, the same statistical test was used to examine potential differences in SES FDis values between Lplots (n = 4 or 8) and Splots. According to our hypothesis regarding the effect of spatial scale, we expected that the SES FDis values in Lplots would be lower (more negative) compared to SES FDis in Splots.
Data on the Ellenberg Indicator Values (EIVs; [80]) were incorporated to estimate the mean environmental conditions in each plot. Bioindication with EIVs has been widely used by vegetation scholars to indicate species preferences in their realized niche, which may characterize the environmental conditions in the absence of directly measured parameters [81,82,83,84,85]. We calculated a presence/absence based mean community EIVs from all vegetation, including the tree, shrub and herb layer. As the IM sites represent a broad altitudinal gradient (more than 1000 m difference between the lowest and highest site), altitude was also included as an important explanatory variable. Mean plot-level EIVs for light (L), soil moisture (F), soil reaction (R) and nutrient availability (N), and altitude (ALT) were analyzed using Principal Component Analysis (PCA), separately for Lplots and Splots. EIVs for temperature and continentality were highly collinear with altitude and thus not included in the final ordination analysis. We performed PCA to obtain axes scores for the major sources of variation. We then used the average site-level scores of the first three PCA axes (PC1, PC2, PC3) to investigate how functional composition (CWM) and functional diversity/community assembly (SES FDis) change along the main ecological gradients derived from the PCA ordination.
We plotted CWM and SES FDis values against each environmental gradient and tested for significant trends using linear regressions. Since the functional metrics usually do not change linearly along the environmental gradients, we also considered quadratic terms for all predictors. Indeed, for some traits in our dataset, visual and statistical inspection suggested non-linear trends. In such cases, the partial F-test was implemented to quantify if the quadratic term of the predictor (PC2) significantly improved the regression model. Multiple linear regression analysis and analysis of variance (ANOVA) were used to test for the significant effect of quantitative (PC1, PC2, PC3) and qualitative (spatial scale with two levels) predictors and their interactions on the dependent variables (CWM and SES FDis).
In addition, SES FDis was also analyzed along a gradient of species evenness (J). Plots with low evenness values were mainly dominated by one plant species with a significantly higher abundance compared to other recorded species. The influence of dominant species and associated community-level species evenness can be used as simplified proxies for general biotic interactions in the community [86]. This index was calculated with the following equation: J = H’/log(S), where H’ is the Shannon diversity index and S is species richness. The vegan package [87] was used for this calculation.
All statistical analyses were carried out in version 3.6.1 of the R software program [75] and were based on averaged site-level data (n = 10 for each spatial scale), which were calculated by averaging plot-level values.

3. Results

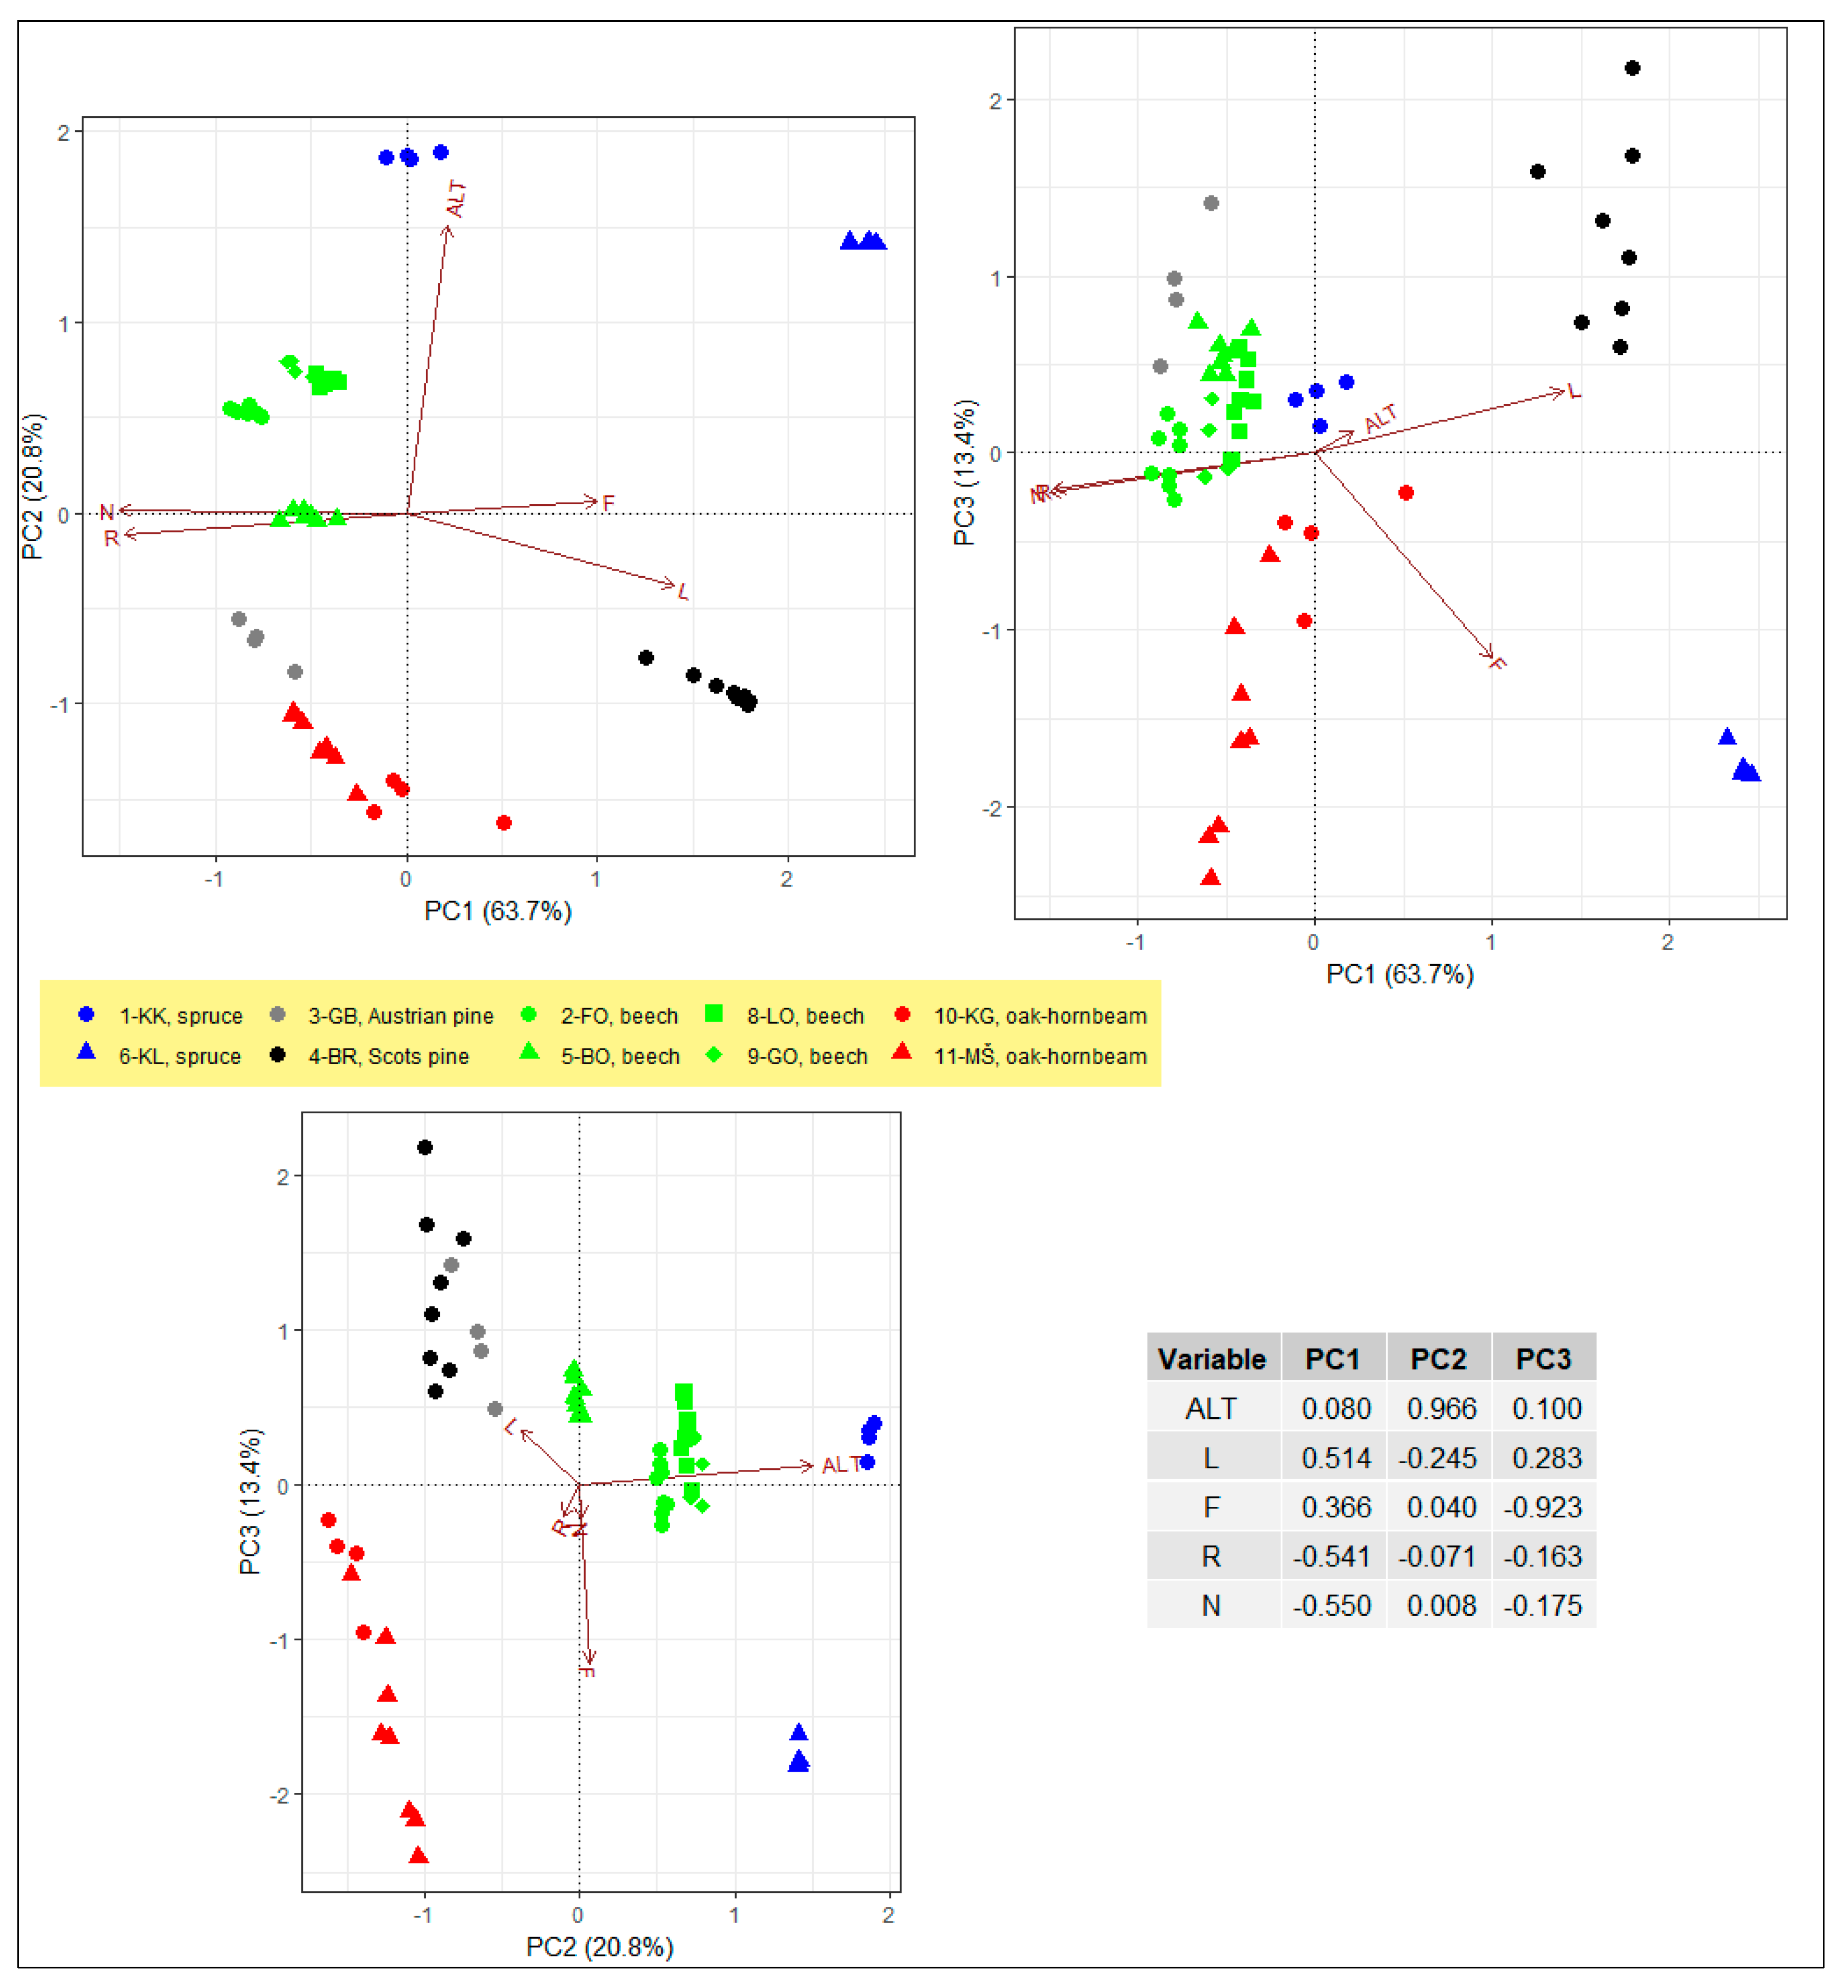
3.1. Understory Vegetation and Environmental Conditions Across IM Sites

Our sampled data set consisted of 267 different plant species in 60 Lplots (10 × 10 m; total sampled area of 6000 m2), whereas in 100 Splots (2 × 2 m; total sampled area is 400 m2), 224 different species were recorded in the understory layer. Understory species richness varied greatly between study sites (Table 2), ranging from 10.3 (6-KL) to 55.0 (9-GO) species per Lplot. Despite the significantly smaller sampling area compared to Lplots, quite high species richness was observed in Splots. The overall mean was 31.1 species per Lplot and 17.0 species per Splot. Understory vegetation cover was, on average, lowest at 5-BO (50.6%) and highest at 4-BR (100.0%), with an overall mean of 78.0%. The IM sites also exhibited substantial differences in species evenness, ranging from 0.19 (6-KL) to 0.87 (5-BO) per Lplot. Mean evenness across all sites was 0.64 for Lplots (Table 2).
The IM sites showed strong differences in environmental conditions. In the case of Lplots, the first three PCA axes (PC1, PC2 and PC3) explained 63.7%, 20.8% and 13.4% of the variability, respectively (Figure 2). For Splots, PC1 accounted for 60.5%, PC2 for 19.2% and PC3 for 17.3% of the total variation (Figure S1). In both cases, PC1 was negatively correlated with N (Pearson’s correlation coefficient r = −0.549 for Lplots, r = −0.562 for Splots) and R (Lplots: −0.541, Splots: −0.554) and positively associated with L (Lplots: 0.514, Splots: 0.516). The second axis, PC2, showed a significant positive relation to altitudinal gradient (Lplots: 0.966, Splots: 0.939), while PC3 was strongly correlated with F (Lplots: −0.923, Splots: 0.948) (Figure 2, Figure S1).

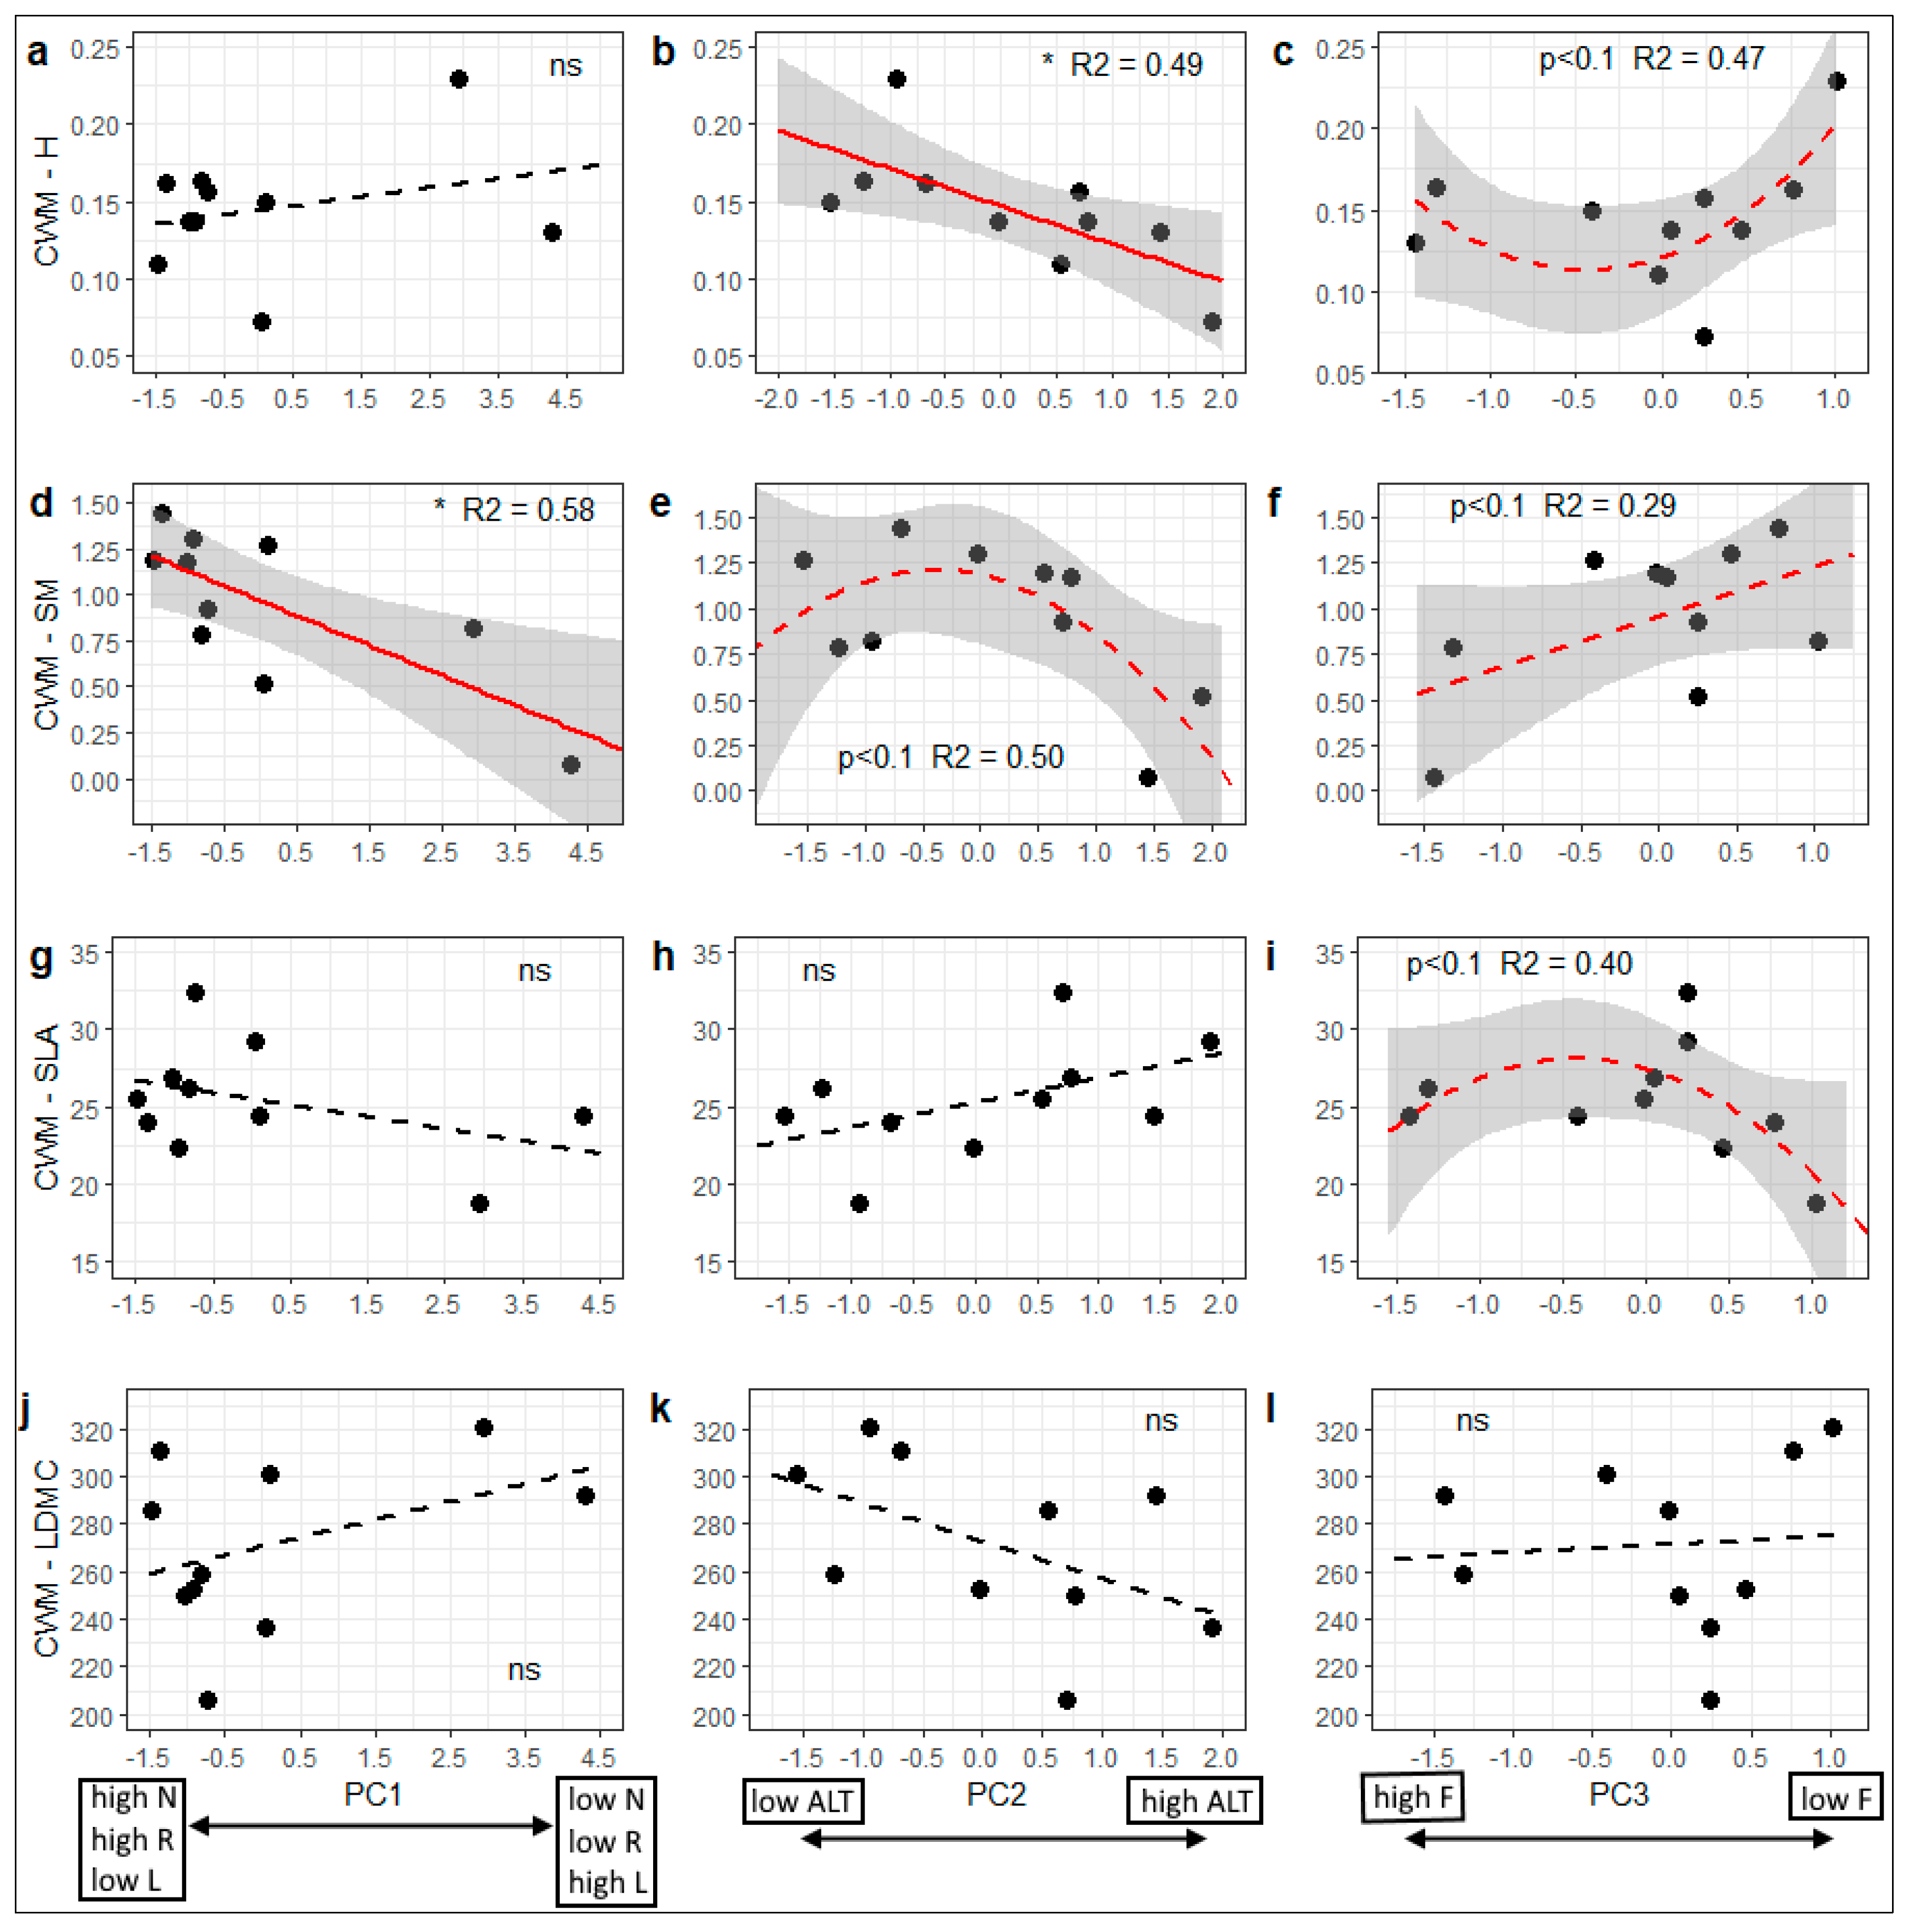
3.2. Variation in Community-Weighted Trait Means Along Environmental Gradients

In terms of functional composition, CWMs showed significant trends along at least one of the ecological gradients for all traits, except LDMC. The strongest linear relationship was found between CWM-SM and PC1 (Figure 3d, Table 3; Figure 2, Figure S1). IM sites with lower light availability and higher soil pH and nutrient availability (i.e., negative PC1 values) were, on average, characterized by understory plants with heavier seeds. In contrast, seed mass was lower in sites with more light and more acidic and nutrient-poor soils. The CWM for this trait also decreased along the PC2 gradient (Figure 3e). This relationship was more hump-shaped, meaning that mid-altitude sites hosted plant species with the highest seed mass. CWM-SM increased with increasing PC3 scores, but this relationship was marginally significant (Figure 3f). The CWM of plant height (H) showed a significant negative relationship with PC2 (Figure 3b) and a bowl-shaped regression with the PC3 gradient (Figure 3c). Regarding the two leaf traits, only CWM-SLA tended to be related to PC3 (Figure 3i), suggesting that mesic sites with intermediate soil moisture had species with the highest SLA values, whereas the CWM of SLA dropped at both ends of this gradient. The CWM of LDMC did not show significant relationships with any of the three environmental gradients (Figure 3j–l).

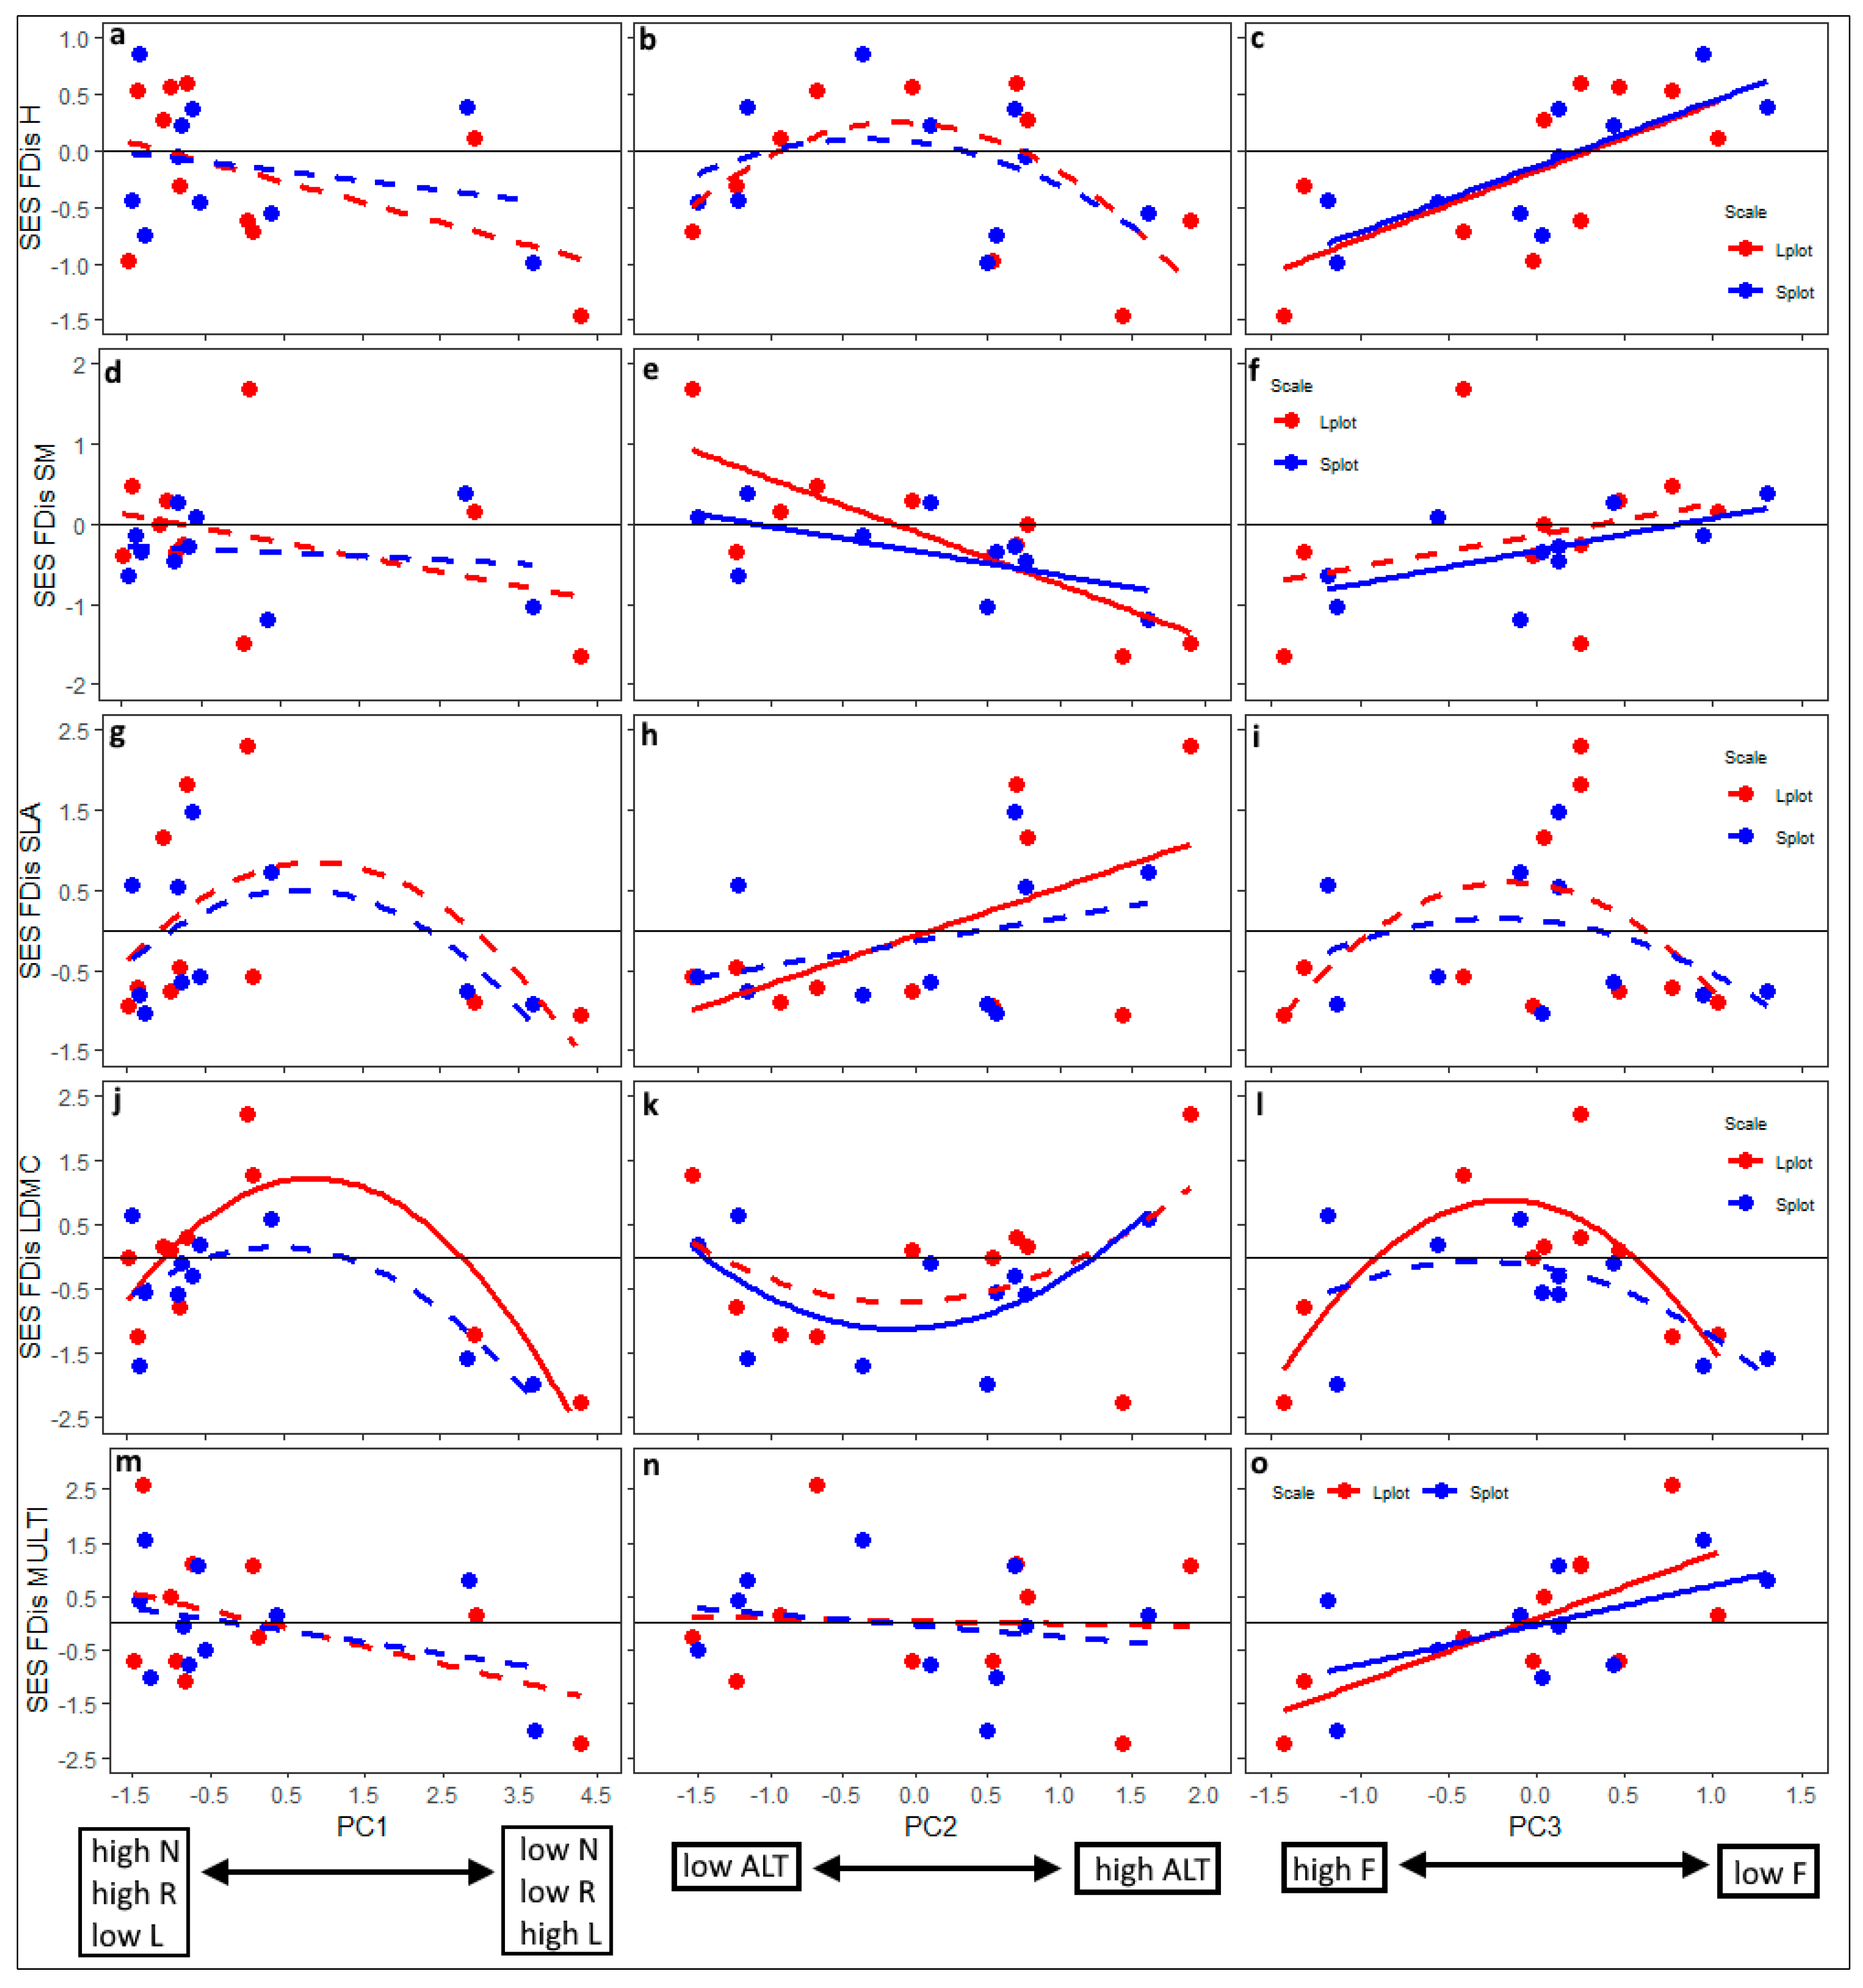
3.3. Patterns of Trait Convergence and Divergence: Dependence on Environmental Gradients, Spatial Scale and Community Attributes

Significant trends in SES FDis were found along at least one environmental gradient for all four traits and their multivariate combination (Figure 4, Table 4). SES FDis SLA showed the least significant response. The functional dispersion of all four traits tended to converge along the PC1 axis (Figure 2, Figure S1), but the only significant (unimodal) relationship was detected for SES FDis LDMC (Figure 4j, Table 4). Along the second gradient (PC2), i.e., the altitudinal gradient, the SES FDis of SM significantly decreased, shifting from trait divergence in the lowlands to trait convergence in high-altitude forests (Figure 4e, Table 4). Interestingly, the environmental gradient of PC3 related to soil moisture showed a significant relation to the SES FDis of two individual traits (H and LDMC) and to the overall multivariate trait combination (Figure 4, Table 4). The results for SES FDis H and trait combination (MULTI) show a significant shift from trait convergence towards divergence along the soil moisture gradient (Figure 4c,o). Overall, SES FDis showed a stronger response to the environmental gradients than to CWM.
While the SES FDis of the studied traits showed more or less similar decreasing pattern along PC1 and increasing trend along PC3, the traits showed different responses along the altitudinal gradient (PC2). For example, SES FDis SM decreased with PC2 (Figure 4e), whereas SES FDis SLA showed the opposite pattern (Figure 4h). Similarly, SES FDis H tended to be divergent at the middle of the PC2 gradient and more convergent at both ends (Figure 4b), whereas SES FDis LDMC exhibited the opposite pattern (Figure 4k, bowl-shaped relation). These differential responses of individual traits resulted in a non-significant and weak relationship between SES FDis MULTI and PC2 (Figure 4n).
Spatial scale and the interaction between ecological gradients (PC) and spatial scale had no significant effect on functional diversity patterns for any of the studied traits (Table 4). The interaction between PC and scale was most pronounced (but non-significant) in the relationship between SES FDis SM and PC2, which can be also recognized by the quite different slopes of regression lines for Lplots and Splots (Figure 4e).
Comparing SES FDis values in Lplots and Splots (Table 5), 32% of all comparisons (50 in total) show that SES values in Lplots were lower (more negative) compared to Splots (green values in Table 5). In only 6% of all comparisons, we found significant trait divergence in Splots and significant trait convergence in Lplots (values in blue, Table 5). This pattern was found for SLA, LDMC and MULTI at site 11-MŠ, a lowland oak-hornbeam forest. In contrast, 58% of comparisons showed the opposite trend, i.e., Lplots had higher (more positive) SES values than Splots. In fact, for two comparisons (LDMC at 8-LO and 9-GO), we even found significant trait convergence in Splots and signs of trait divergence in Lplots. For some traits and sites, SES FDis showed no significant convergence or divergence patterns (18% in total, Table 5).
SES FDis showed a positive relationship with species evenness (Figure S2). IM sites with lower species evenness (suggesting the uneven distribution of species cover values) exhibited patterns of trait convergence (negative SES FDis), whereas sites with higher species evenness tended to be more divergent in functional traits (Figure S2).

4. Discussion

The study of assembly rules in plant communities has gained attention among vegetation scholars, in part due to recent advances in methodological and statistical approaches [4,51]. The early recognition that plant species sorting does not merely depend on stochastic processes was an important turning point from which deterministic processes were defined and later successfully incorporated into theoretical frameworks to improve the general understanding of species assemblages. Plant functional traits and associated functional diversity metrics have helped immensely in such attempts to quantify community structure as a deviation from randomness [17]. Trait-based approaches are useful for inferring the underlying mechanisms responsible for shaping understory plant assemblages. Disentangling the relative importance of the different processes involved in community assembly (e.g., abiotic filtering, limiting similarity, dispersal limitation) is not only interesting in itself but also crucial for understanding how communities will behave under future environmental scenarios, e.g., temporal changes in understory vegetation due to global environmental change or increasing impacts of disturbances [84,85].
The studied forest vegetation types in Slovenia differ significantly in terms of environmental conditions and understory and overstory vegetation characteristics. Our results show that plant functional traits respond to environmental gradients, both in terms of functional community means and diversity. Overall, patterns in mean trait values (CWM) mainly corresponded to general trait-environment relationships; for comprehensive global overviews, see [88,89,90,91]. Although some traits (e.g., LDMC) did not show significant patterns along the studied ecological gradients, the observed relationships are in agreement with the main axes of plant adaptation emphasized by the plant global spectrum [84]. For example, plant height is known to decrease with altitude. A harsh mountainous climate favors species of smaller stature [88,92]. The other significant relationship was found between the gradient of soil pH, nutrient availability and light conditions (PC1) and seed mass. IM sites with higher soil pH and nutrient availability tend to harbor understory species with heavier seeds, whereas plants with smaller seeds are more characteristic of more open forests with higher light availability but lower soil pH and nutrient availability (e.g., site 4-BR). Generally, forest plant species in the understory layer are most often more conservative species that are able to tolerate multiple abiotic stresses due to low resource availability (e.g., deep shade, low soil pH). Typically, forest understory specialists are very good at persisting but have limited dispersal abilities due to often large and heavy seeds [18,39]. Larger seeds have been interpreted as a successful regeneration trait under dense cover where seedling competition may arise and light may be the limiting factor [83]. Jager et al. [34] reported that large-seeded shade-tolerant species can persist in fertile soils where light is more limited.
In general, our results corroborate previous studies showing that trait convergence primarily occurs in resource-poor environments and mainly results from abiotic filtering, whereas the strength of trait convergence tends to diminish in less stressful conditions [10]. Increasing trait convergence along stress gradients has been demonstrated by many empirical studies [4,19,23,25,33]. The most stressful abiotic conditions in our study sites occur in IM site 6-KL, a high-altitude, single-species dominated overstory (spruce) forest on silicate parent material, resulting in acidic and nutrient-poor soils. Less productive soils can act as a filter for a narrow subset of plant strategies able to deal with resource scarcity [9]. High abiotic stress at this IM site resulted in trait convergence (negative SES values) for all traits examined. However, the 6-KL site has a relatively more open overstory canopy (greater light availability in the understory) and receives a substantial amount of precipitation, hence light and moisture are presumably not limiting factors. In addition to the harsh ecological conditions, this site exhibited by far the lowest species evenness (Table 2) among all the sites due to the evident dominance of Calamagrostis villosa, a mat-forming grass species with high clonal reproduction abilities. Stressful abiotic conditions coupled with low species richness and evenness resulted in pronounced trait convergence in this understory community.
The other IM site covered by mountain spruce forest (1-KK) importantly differs from site 6-KL in terms of soil conditions and consequent understory species composition and diversity. This forest grows on calcareous bedrock, and although coniferous litterfall causes topsoil acidification, and nutrient leaching is common due to high precipitation [93], greater environmental (microsite) heterogeneity enables the coexistence of species with different resource requirements. This is reflected in functional diversity patterns, as site 1-KK showed significant trait convergence for H and SM, but SLA and LDMC were more divergent (Table 5). Moreover, plots at the 1-KK site were not dominated by single plant species, resulting in higher species evenness. Although one forb species, Aposeris foetida, showed relatively high abundance at this site, this low-statured rosette forb does not form dense understory stands like C. villosa at the 6-KL site.
Compared to other studied forests, IM site 4-BR is a unique forest vegetation type with some distinct abiotic and biotic conditions. With respect to ecological factors, this site is occupied by plant indicators for high light availability due to the sparse overstory canopy of Pinus sylvestris. The understory, which is formed by acidophilous species and species adapted to nutrient-poor soils, is consequently very dense (Table 2), with a vertically well-structured mixture of tall and low-statured plant species. This is reflected in trait divergence for H, indicating that species in environments with high light availability have diverse strategies. In contrast, traits related to resource acquisition and use (SLA and LMDC) exhibited negative SES FDis values (Table 5). Site 4-BR is characterized by low soil pH and low nutrient availability (Figure 2, Figure S1), and this abiotic stress caused SLA and LDMC to converge.
IM site 3-GB is located in the sub-Mediterranean phytogeographic region of Slovenia [54], where a warmer and drier regional climate prevails. It is characterized by secondary forest composed of Pinus nigra in the overstory and diverse ingrowth of thermophilous deciduous tree species (e.g., Ostrya carpinifolia, Quercus pubescens, Fraxinus ornus) in the lower tree layer. The vegetation is characterized by drought-tolerant species and the understory is dominated by the grass species Sesleria autumnalis. This site showed trait convergence for H and divergence for SLA and LDMC (Table 5). This exemplifies that even in sites with dominant species where trait convergence is expected, trait divergence patterns can emerge due to reduced environmental adversity, e.g., higher temperatures and soil pH, but lower soil moisture.
The selected beech forests were similar in terms of ecological conditions and vegetation structure and composition (Figure 2, Figure S1). However, one beech site (2-FO) showed some deviation from the other beech forests (5-BO, 8-LO, 9-GO). IM site 2-FO represents a more thermophilous form of beech forest vegetation [93] and is dominated by Fagus sylvatica in the overstory and shade-tolerant Sesleria autumnalis in the understory. The other three beech forests were, on average, more diverse (Table 2). Owing to dominance-driven species impoverishment and, at least to some extent, more stressful environmental conditions (e.g., lower soil moisture), 2-FO experienced trait convergence for all traits (Table 5). The other beech sites, especially 8-LO and 9-GO, showed less convergent patterns. The mid-altitude beech sites in this study are generally characterized by high soil pH (limestone and dolomite bedrock), more fertile soils (high N) and mesic soil moisture conditions. Conversely, the presence of species with low L values could indicate that the main abiotic stress is induced by low light availability, owing to the dense overstory canopy formed by European beech and an admixture of other broadleaves (e.g., Acer sp. in 5-BO and 8-LO) or conifers (e.g., Abies alba in 9-GO), with similarly high shade-casting ability. Even so, more fertile soils seem to offset the presumably negative impact of low light availability, partly suggesting the “compensation effect” of high soil pH and nutrient content. The simultaneous occurrence of multiple unfavorable abiotic stressors in the studied beech forests (e.g., a combination of low light and low soil pH, plus high altitude) would likely result in more convergent trait patterns.
The lowland oak-hornbeam forest sites (10-KG and 11-MŠ) have very similar abiotic conditions (Figure 2, Figure S1) and overall species composition, but show differences regarding community attributes, the most evident of which is the difference in species evenness (Table 2), with 10-KG showing higher evenness compared to 11-MŠ. This can be attributed to the dominance of forb species Galeobdolon montanum in the summer period at site 11-MŠ, which has a great capacity for vegetative propagation due to extensive aboveground runners. Differences in evenness are reflected in patterns of functional diversity. Overall, both sites showed convergence for H but exhibited different convergence/divergence patterns for other traits (Table 5). The most interesting patterns were detected for the 11-MŠ site. In particular, for the two leaf traits (SLA and LDMC) and the multivariate combination of all traits (MULTI), 11-MŠ was the only site for which we detected significant trait divergence (despite the dominance of G. montanum) for the smaller spatial scale (Splots) and trait convergence for the large plots (Lplots). These are the only comparisons that corroborate our hypothesis related to the scale-dependent patterns of forest community assembly (Table 5).
The described patterns support our hypotheses that patterns of functional diversity and community assembly processes depend on ecological conditions and community attributes. To a much lesser degree, the observed patterns in our study depended on spatial scale (plot size). Although we did not detect significant differences between the Lplots and Splots, for some traits abiotic filtering tended to be less pervasive at the smaller spatial scale (suggesting a divergence signal), although it was still overwhelming. Overall, we did not detect significant trait divergence in Splots. For each study site, differences in the SES value between Lplots and Splots were rather small, suggesting that similar drivers of community assembly are operating at both investigated spatial scales. In fact, abiotic filtering might be the major determinant of assembly processes at both studied spatial scales. The lack of trait divergence signal in Splots may also be interpreted in the context of biotic interactions, e.g., weaker competitor exclusion. However, our plot size (4 m2) is quite small for sampling forest vegetation. Herbaceous plants usually display patchy spatial distributions in mature forest understories. Moreover, environmental heterogeneity in Splots was likely considerably smaller compared to Lplots. Therefore, greater microsite availability at the larger spatial scale (100 m2) led to the presence of plant species with different trait values and consequently higher trait divergence. With respect to the dependence of community assembly on spatial scale, our results are not in agreement with previous studies which showed that contrasting assembly mechanisms are responsible for different trait diversity patterns along a gradient of spatial scale [27,30,32,33,43].
The selected traits responded differently to the investigated ecological gradients, as has been emphasized by many previous studies (e.g., [5,14]). We detected some contrasting patterns for individual traits, such as convergence for SM and divergence for SLA along an altitudinal gradient. Aside from the effects of different abiotic stressors on community assembly, we were able to infer the impacts of biotic interactions. The dominance of competitive understory species, which was observed for stressful abiotic conditions (site 6-KL) as well as for more benign environments (site 11-MŠ), can add to potential explanations for trait convergence patterns. Moreover, for some traits we found trait divergence despite low species richness. For instance, IM site 4-BR (the second most species-poor site in our study) exhibited significant trait divergence for H, SM and MULTI (Table 5). This could be explained by the facilitative interactions in sites with relatively high environmental adversity, as has been shown by the work of Luo et al. [30].
Nevertheless, our trait selection in this study might not have captured the main responses relevant for forest plant species. Using a diverse set of traits may be important to differentiate ecological processes acting on community assembly [94]. The inclusion of clonal and bud bank traits, which are associated with vegetative propagation and the re-sprouting ability of plants [8], might be insightful in this context. Similarly, below-ground traits and traits associated with root system properties, including mycorrhizal status, are likely to play an important role in the understory composition of mature forest stands [85].
Stochasticity seems to be quite important in the assembly of undisturbed forest vegetation [21], but see [28]. A relatively recent review [13] about assembly rules in plant communities concluded that random patterns are frequently found. Liu et al. [21] documented that boreal understory communities are primarily regulated by stochastic processes. Luo et al. [30] demonstrated that the herbaceous strata of forest understory communities appear to be markedly random in functional structure. Sonnier et al. [18] illustrated how forest fragmentation reduces the importance of niche-based factors relative to dispersal traits in structuring temperate forest understories in Wisconsin, USA. Furthermore, due to their short stature and relatively high seed mass, understory herbs could be affected by dispersal limitations. Forest herbaceous understory species are mainly stress-tolerant species with limited dispersal ability [39]. Therefore, the lack of clear divergence or convergence signatures in some of our IM sites could suggest that dispersal limitations are likely to be important determinants of species absence from a given microhabitat. Differences in functional diversity might also be attributed to random species colonization and extinction. The role of other potential factors affecting assembly mechanisms cannot be assessed with our results. However, legacies of past land use and disturbance regimes (e.g., forest management) might play an important role in structuring the taxonomic and functional composition and the diversity of understory plant communities across the studied Slovenian forests.

5. Conclusions

During the period in which our study was conducted, the selected IM sites were managed with the same management practices and close-to-nature principles (e.g., small-scale interventions, sustainable use of forest resources). It is also important to note that the study sites were intentionally selected in homogeneous closed canopy stands lacking evidence of disturbance [54]. Consequently, the potential effects of disturbances on community assembly are difficult to explicitly assess with our results. However, future work will be dedicated to potential (long-term) temporal changes in understory vegetation in the studied forests and possible shifts in the drivers of community assembly caused by the increasing impacts of disturbance in recent years [54]. For instance, forest disturbances could prevent dominant species from competitively excluding others, thus favoring the coexistence of functional traits in understory plant communities [24,32].
This study emphasizes the importance of ecological gradients in structuring forest plant communities. Regarding our research hypotheses, we can draw the following conclusions: (1) In agreement with our prediction, we found that abiotic filtering and associated trait convergence is the major determinant in stressful environmental conditions. (2) Understory community assembly did not significantly depend on the examined plot sizes (spatial scales), although some traits at some study sites responded as expected. (3) The dominance of competitive understory species with high abundances seems to contribute to trait convergence, suggesting the filtering effects of competitive exclusion. Collectively, our findings are important for the general understanding of understory community assembly in temperate European forests and beyond.

Supplementary Materials

The following are available online at https://www.mdpi.com/1424-2818/12/3/91/s1. Figure S1: Principal component analysis for the small vegetation plots (2 × 2 m, 100 plots in total) across 10 IM sites in Slovenia, Figure S2: Linear regressions between the SES FDis of four functional traits (plant height, seed mass, specific leaf area, leaf dry matter content) and species evenness.

Author Contributions

Conceptualization, J.K. and L.K.; Data curation, L.K. and J.K.; Formal analysis, J.K.; Funding acquisition, L.K.; Investigation, L.K.; Methodology, L.K.; Project administration, L.K.; Supervision, L.K.; Visualization, J.K.; Writing – original draft, J.K. and L.K.; Writing – review & editing, J.K. and L.K. All authors have read and agreed to the published version of the manuscript.

Funding

The study was funded by the Forest Focus Programme (Regulation (EC) No 2152/2003 of the European Parliament and of the Council of 17 November 2003 concerning the monitoring of forests and environmental interactions in the Community); Slovenian Ministry of Agriculture, Forestry and Food; and the Slovenian Research Agency (research core funding No. P4-0107). J.K. received funding from the Slovenian Research Agency as part of the Young Researcher Programme (Contract No. 1000-18-0404).

Acknowledgments

The study was performed as a part of the Intensive Monitoring Programme in Slovenia (part of EU Programme ICP-Forests). We would like to thank Matej Rupel, Aleksander Marinšek, Daniel Žlindra, Primož Simončič and other colleagues from the Slovenian Forestry Institute for their assistance and many experts from the Slovenian Forest Service for their technical support. We are also grateful to two anonymous referees for providing helpful comments and suggestions on an earlier version of the manuscript. We thank Philip J. Nagel for proofreading and language editing.

Conflicts of Interest

The authors declare no conflict of interest. The funders had no role in the design of the study; in the collection, analyses, or interpretation of data; in the writing of the manuscript, or in the decision to publish the results.

References

  1. Lepš, J.; de Bello, F.; Lavorel, S.; Berman, S. Quantifying and interpreting functional diversity of natural communities: Practical consideration matter. Preslia 2006, 78, 481–501. Available online: https://hal.archives-ouvertes.fr/halsde-00293183/ (accessed on 15 December 2019).
  2. McGill, B.J.; Enquist, B.J.; Weiher, E.; Westoby, M. Rebuilding community ecology from functional traits. Trends Ecol. Evol. 2006, 21, 178–185. [Google Scholar] [CrossRef]
  3. Herben, T.; Goldberg, D.E. Community assembly by limiting similarity vs. competitive hierarchies: Testing the consequences of dispersion of individual traits. J. Ecol. 2014, 102, 156–166. [Google Scholar] [CrossRef] [Green Version]
  4. Chapman, J.I.; McEwan, R.W. The Role of Environmental Filtering in Structuring Appalachian Tree Communities: Topographic Influences on Functional Diversity Are Mediated through Soil Characteristics. Forests 2018, 9, 19. [Google Scholar] [CrossRef] [Green Version]
  5. Spasojevic, M.J.; Suding, K.N. Inferring community assembly mechanisms from functional diversity patterns: The importance of multiple assembly processes. J. Ecol. 2012, 100, 652–661. [Google Scholar] [CrossRef]
  6. Mason, N.W.H.; de Bello, F.; Mouillot, D.; Pavoine, S.; Dray, S. A guide for using functional diversity indices to reveal changes in assembly processes along ecological gradients. J. Veg. Sci. 2013, 24, 794–806. [Google Scholar] [CrossRef]
  7. Chelli, S.; Marignani, M.; Barni, E.; Petraglia, A.; Puglielli, G.; Wellstein, C.; Acosta, A.T.R.; Bolpagni, R.; Bragazza, L.; Campetella, G.; et al. Plant-environment interactions through a functional traits perspective: A review of Italian studies. Plant Biosyst. 2018, 153, 853–869. [Google Scholar] [CrossRef]
  8. Chelli, S.; Ottaviani, G.; Simonetti, E.; Wellstein, C.; Canullo, R.; Carnicelli, S.; Andreetta, A.; Puletti, N.; Bartha, S.; Cervellini, M.; et al. Climate is the main driver of clonal and bud bank traits in Italian forest understories. Perspect. Plant. Ecol. 2019, 40, 125478. [Google Scholar] [CrossRef] [Green Version]
  9. Pinho, B.X.; de Melo, F.P.L.; Arroyo-Rodríguez, V.; Pierce, S.; Lohbeck, M.; Tabarelli, M. Soil-mediated filtering organizes tree assemblages in regenerating tropical forests. J. Ecol. 2018, 106, 137–147. [Google Scholar] [CrossRef]
  10. Weiher, E.; Keddy, P.A. Assembly rules, null models, and trait dispersion: New questions from old patterns. Oikos 1995, 74, 159–164. [Google Scholar] [CrossRef] [Green Version]
  11. Keddy, P.A. A pragmatic approach to functional ecology. Funct. Ecol. 1992, 6, 621–626. [Google Scholar] [CrossRef]
  12. Weiher, E.; Freund, D.; Bunton, T.; Stefanski, A.; Lee, T.; Bentivenga, S. Advances, challenges and a developing synthesis of ecological community assembly theory. Philos. Trans. R. Soc. B 2011, 366, 2403–2413. [Google Scholar] [CrossRef] [PubMed]
  13. Götzenberger, L.; de Bello, F.; Bråthen, K.A.; Davison, J.; Dubuis, A.; Guisan, A.; Lepš, J.; Lindborg, R.; Moora, M.; Pärtel, M.; et al. Ecological assembly rules in plant communities—Approaches, patterns and prospects. Biol. Rev. 2012, 87, 111–127. [Google Scholar] [CrossRef] [PubMed]
  14. Bernard-Verdier, M.; Navas, M.-L.; Vellend, M.; Violle, C.; Fayolle, A.; Garnier, E. Community assembly along a soil depth gradient: Contrasting patterns of plant trait convergence and divergence in a Mediterranean rangeland. J. Ecol. 2012, 100, 1422–1433. [Google Scholar] [CrossRef]
  15. MacArthur, R.; Levins, R. The Limiting Similarity, Convergence, and Divergence of Coexisting Species. Am. Nat. 1967, 101, 377–385. [Google Scholar] [CrossRef]
  16. Chesson, P. Mechanisms of maintenance of species diversity. Annu. Rev. Ecol. Syst. 2000, 31, 1388–1391. [Google Scholar] [CrossRef] [Green Version]
  17. Carlucci, M.B.; Streit, H.; Duarte, L.D.S.; Pillar, V.D. Individual-based trait analyses reveal assembly patterns in tree sapling communities. J. Veg. Sci. 2012, 23, 176–186. [Google Scholar] [CrossRef]
  18. Sonnier, G.; Johnson, S.E.; Waller, D.M. Fragmentation reduces the importance of niche-based factors relative to dispersal traits in structuring temperate forest understories. J. Veg. Sci. 2020, 31, 75–83. [Google Scholar] [CrossRef]
  19. Lhotsky, B.; Kovács, B.; Ónodi, G.; Csecserits, A.; Rédei, T.; Lengyel, A.; Kertész, M.; Botta-Dukát, Z. Changes in assembly rules along a stress gradient from open dry grasslands to wetlands. J. Ecol. 2016, 104, 507–517. [Google Scholar] [CrossRef] [Green Version]
  20. Grime, J.P. Trait convergence and trait divergence in herbaceous plant communities: Mechanisms and consequences. J. Veg. Sci. 2006, 17, 255–260. [Google Scholar] [CrossRef]
  21. Liu, B.; Chen, H.Y.H.; Yang, J. Understory Community Assembly Following Wildfire in Boreal Forests: Shift from Stochasticity to Competitive Exclusion and Environmental Filtering. Front. Plant Sci. 2018, 9, 1854. [Google Scholar] [CrossRef] [PubMed]
  22. Cornwell, W.K.; Schwilk, D.; Ackerly, D.D. A trait-based approach for habitat filtering: Convex hull volume. Ecology 2006, 87, 1465–1471. [Google Scholar] [CrossRef]
  23. Schellenberger Costa, D.; Gerschlauer, F.; Pabst, H.; Kühnel, A.; Huwe, B.; Kiese, R.; Kuzyakov, Y.; Kleyer, M. Community-weighted means and functional dispersion of plant functional traits along environmental gradients on Mount Kilimanjaro. J. Veg. Sci. 2017, 28, 684–695. [Google Scholar] [CrossRef]
  24. Miedema, L.J.; Capmourteres, V.; Anand, M. Impact of land composition and configuration on the functional trait assembly of forest communities in southern Ontario. Ecosphere 2019, 10, e02633-10. [Google Scholar] [CrossRef] [Green Version]
  25. Bricca, A.; Conti, L.; Tardella, M.F.; Catorci, A.; Iocchi, M.; Theurillat, J.-P.; Cutini, M. Community assembly processes along a sub-Mediterranean elevation gradient: Analyzing the interdependence of trait community weighted mean and functional diversity. Plant Ecol. 2019, 220, 1139–1151. [Google Scholar] [CrossRef]
  26. Diamond, J.M. Assembly of species communities. In Ecology and Evolution of Communities; Cody, M.L., Diamond, J.M., Eds.; Belknap Press: Cambridge, MA, USA, 1975; pp. 342–444. [Google Scholar]
  27. Zhang, H.; Chen, H.Y.H.; Lian, J.; John, R.; Ronghua, L.; Liu, H.; Ye, W.; Berninger, F.; Ye, Q. Using functional trait diversity patterns to disentangle the scale-dependent ecological processes in a subtropical forest. Funct. Ecol. 2018, 32, 1379–1389. [Google Scholar] [CrossRef]
  28. Gilbert, B.; Lechowicz, M.J. Neutrality, niches, and dispersal in a temperate forest understory. Proc. Natl. Acad. Sci. USA 2004, 101, 7651–7656. [Google Scholar] [CrossRef] [Green Version]
  29. Wilson, P.J.; Thompson, K.; Hodgson, J.G. Specific leaf area and leaf dry matter content as alternative predictors of plant strategies. New Phytol. 1999, 143, 155–162. [Google Scholar] [CrossRef]
  30. Luo, Y.-H.; Cadotte, M.W.; Burgess, K.S.; Liu, J.; Tan, S.-L.; Xu, K.; Li, D.-Z.; Gao, L.-M. Forest community assembly is driven by different strata-dependent mechanisms along an elevational gradient. J. Biogeogr. 2019, 46, 2174–2187. [Google Scholar] [CrossRef]
  31. Hubbell, S.P. The Unified neutral Theory of Biodiversity and Biogeography; Princeton University Press: Princeton, NJ, USA, 2001; 375p. [Google Scholar]
  32. De Bello, F.; Vandewalle, M.; Reitalu, T.; Lepš, J.; Prentice, H.C.; Lavorel, S.; Sykes, M.T. Evidence for scale- and disturbance-dependent trait assembly patterns in dry semi-natural grasslands. J. Ecol. 2013, 101, 1237–1244. [Google Scholar] [CrossRef]
  33. Long, W.; Schamp, B.S.; Zang, R.; Ding, Y.; Huang, Y.; Xiang, Y. Community assembly in a tropical cloud forest related to specific leaf area and maximum species height. J. Veg. Sci. 2015, 26, 513–523. [Google Scholar] [CrossRef]
  34. Jager, M.M.; Richardson, S.J.; Bellingham, P.J.; Clearwater, M.J.; Laughlin, D.C. Soil fertility induces coordinated responses of multiple independent functional traits. J. Ecol. 2014, 103, 374–385. [Google Scholar] [CrossRef]
  35. De la Riva, E.G.; Tosto, A.; Pérez-Ramos, I.M.; Navarro-Fernández, C.M.; Olmo, M.; Anten, N.P.R.; Marañón, T.; Villar, R. A plant economics spectrum in Mediterranean forests along environmental gradients: Is there coordination among leaf, stem and root traits? J. Veg. Sci. 2016, 27, 187–199. [Google Scholar] [CrossRef] [Green Version]
  36. Luo, Y.; Liu, J.; Tan, S.; Cadotte, M.W.; Xu, K.; Gao, L.; Li, D. Trait variation and functional diversity maintenance of understory herbaceous species coexisting along an elevational gradient in Yulong Mountain, Southwest China. Plant Divers. 2016, 38, 303–311. [Google Scholar] [CrossRef] [PubMed]
  37. Grime, J.P. Benefits of plant diversity to ecosystems: Immediate, filter and founder effects. J. Ecol. 1998, 86, 902–910. [Google Scholar] [CrossRef]
  38. Su, X.; Wang, M.; Huang, Z.; Fu, S.; Chen, H.Y.H. Forest Understory Vegetation: Colonization and the Availability and Heterogeneity of Resources. Forests 2019, 10, 944. [Google Scholar] [CrossRef] [Green Version]
  39. Valladares, F.; Laanisto, L.; Niinemets, Ü.; Zavala, M.A. Shedding light on shade: Ecological perspectives of understory plant life. Plant Ecol. Divers. 2016, 9, 237–251. [Google Scholar] [CrossRef] [Green Version]
  40. Ottaviani, G.; Götzenberger, L.; Bacaro, G.; Chiarucci, A.; de Bello, F.; Marcantonio, M. A multifaceted approach for beech forest conservation: Environmental drivers of understory plant diversity. Flora 2019, 256, 85–91. [Google Scholar] [CrossRef]
  41. Schuster, B.; Diekmann, M. Changes in species density along the soil pH gradient—Evidence from German plant communities. Folia Geobot. 2003, 38, 367–379. [Google Scholar] [CrossRef]
  42. Landuyt, D.; Perring, M.P.; Seidl, R.; Taubert, F.; Verbeeck, H.; Verheyen, K. Modelling understorey dynamics in temperate forests under global change-Challenges and perspectives. Perspect. Plant Ecol. 2018, 31, 44–54. [Google Scholar] [CrossRef] [Green Version]
  43. Carmona, C.P.; de Bello, F.; Mason, N.W.H.; Leps, J. Traits without borders: Integrating functional diversity across scales. Trends Ecol. Evol. 2016, 31, 382–394. [Google Scholar] [CrossRef] [PubMed]
  44. Kraft, J.B.N.; Ackerly, D.D. Functional trait and phylogenetic tests of community assembly across spatial scales in an Amazonian forest. Ecol. Monogr. 2010, 80, 410–422. [Google Scholar] [CrossRef]
  45. Yang, J.; Zhang, G.; Ci, X.; Swenson, N.G.; Cao, M.; Sha, L.; Li, J.; Baskin, C.C.; Slik, J.W.F.; Lin, L. Functional and phylogenetic assembly in a Chinese tropical tree community across size classes, spatial scales and habitats. Funct. Ecol. 2014, 28, 520–529. [Google Scholar] [CrossRef]
  46. Weiher, E.; Clarke, G.D.P.; Keddy, P.A. Community assembly rules, morphological dispersion, and the coexistence of plant species. Oikos 1998, 81, 309–322. [Google Scholar] [CrossRef]
  47. Chalmandrier, L.; Münkmüller, T.; Gallien, L.; de Bello, F.; Mazel, F.; Lavergne, S.; Thuiller, W. A family of null models to distinguish between environmental filtering and biotic interactions in functional diversity patterns. J. Veg. Sci. 2013, 24, 853–864. [Google Scholar] [CrossRef]
  48. Siefert, A. Spatial patterns of functional divergence in old-field plant communities. Oikos 2012, 121, 907–914. [Google Scholar] [CrossRef]
  49. Mayfield, M.M.; Levine, J.M. Opposing effects of competitive exclusion on the phylogenetic structure of communities. Ecol. Lett. 2010, 13, 1085–1093. [Google Scholar] [CrossRef]
  50. De Bello, F. The quest for trait convergence and divergence in community assembly: Are null-models the magic wand? Global Ecol. Biogeogr. 2012, 21, 312–317. [Google Scholar] [CrossRef]
  51. Götzenberger, L.; Botta-Dukát, Z.; Lepš, J.; Pärtel, M.; Zobel, M.; de Bello, F. Which randomizations detect convergence and divergence in trait-based community assembly? A test of commonly used null models. J. Veg. Sci. 2016, 27, 1275–1287. [Google Scholar] [CrossRef]
  52. Kutnar, L. Intensive Monitoring of Vegetation of Forest Ecosystems in Slovenia. In Monitoring the Management of Forests and Forested Landscapes; Hladnik, D., Ed.; Studia Forestalia Slovenica, Biotehniška Fakulteta, Oddelek za Gozdarstvo in Obnovljive Gozdne Vire: Ljubljana, Slovenia, 2006; pp. 277–290. ISBN1 9616020420. ISBN2 9789616020428. (In Slovenian with English Summary). [Google Scholar]
  53. Kutnar, L. Diversity of woody species on forest monitoring plots in Slovenia. GozdVestn 2011, 69, 271–278, (In Slovenian with English Summary). [Google Scholar]
  54. Kutnar, L.; Nagel, T.A.; Kermavnar, J. Effects of Disturbance on Understory Vegetation across Slovenian Forest Ecosystems. Forests 2019, 10, 1048. [Google Scholar] [CrossRef] [Green Version]
  55. De Vries, W.; Vel, E.M.; Reinds, G.J.; Deelstra, H.; Klap, J.M.; Leeters, E.E.J.M.; Hendriks, C.M.A.; Kerkvoorden, M.; Landmann, G.; Herkendell, J.; et al. Intensive monitoring of forest ecosystems in Europe. 1. Objectives, set-up and evaluation strategy. For. Ecol. Manag. 2003, 174, 77–95. [Google Scholar] [CrossRef]
  56. Canullo, R.; Starlinger, F.; Granke, O.; Fischer, R.; Aamlid, D.; Neville, P. ICP Forests Manual on Methods and Criteria for Harmonized Sampling, Assessment, Monitoring and Analysis of the Effects of Air Pollution on Forests; Part VII.1: Assessment of Ground Vegetation; UNECE ICP Forests Programme Coordinating Centre: Hamburg, Germany, 2011; p. 19. [Google Scholar]
  57. Barkman, J.J.; Doing, H.; Segal, S. Kritische Bemerkungen und Vorschläge zur quantitativen Vegetationsanalyse. Acta Bot. Neerl. 1964, 13, 394–419. [Google Scholar] [CrossRef]
  58. Londo, G. The decimal scale for relevés of permanent quadrats. Vegetatio 1976, 33, 61–64. [Google Scholar] [CrossRef]
  59. Tutin, T.G.; Heywood, V.H.; Burges, N.A.; Moore, D.M.; Valentine, D.H.; Walters, S.M.; Webb, D.A. Flora Europaea; Cambridge University Press: Cambridge, UK, 1964–1980; Volume 1. [Google Scholar]
  60. Tutin, T.G.; Burges, N.A.; Chater, A.O.; Edmondson, J.R.; Heywood, V.H.; Moore, D.M.; Valentine, D.H.; Walters, S.M.; Webb, D.A. Flora Europaea, 2nd ed.; Cambridge University Press: Cambridge, UK, 1993. [Google Scholar]
  61. Martinčič, A.; Wraber, T.; Jogan, N.; Podobnik, A.; Turk, B.; Vreš, B.; Ravnik, V.; Frajman, B.; Strgulc Krajšek, S.; Trčak, B.; et al. Mala Flora Slovenije: Ključ za Določanje Praprotnic in Semenk; Tehniška Založba Slovenije: Ljubljana, Slovenia, 2007; p. 967. ISBN 978-961-251-026-8. [Google Scholar]
  62. Westoby, M. A leaf-height-seed (LHS) plant ecology strategy scheme. Plant Soil 1998, 199, 213–227. [Google Scholar] [CrossRef]
  63. Keddy, P.A.; Shipley, B. Competitive Hierarchies in Herbaceous Plant Communities. Oikos 1989, 54, 234–241. [Google Scholar] [CrossRef]
  64. Westoby, M.; Falster, D.S.; Moles, A.T.; Vesk, P.A.; Wright, I.J. Plant ecological strategies: Some leading dimensions of variation between species. Annu. Rev. Ecol. Syst. 2002, 33, 125–159. [Google Scholar] [CrossRef] [Green Version]
  65. Pakeman, R.J.; Garnier, E.; Lavorel, S.; Ansquer, P.; Castro, C.; Cruz, P.; Dolezal, J.; Eriksson, O.; Freitas, H.; Golodets, C.; et al. Impact of abundance weighting on the response of seed traits to climate and land use. J. Ecol. 2008, 96, 355–366. [Google Scholar] [CrossRef]
  66. Joner, F.; Anand, M.; Pillar, V.D. Trait-convergence and divergence assembly patterns in a temperate forest herbaceous layer along the gradient of canopy closure. Community Ecol. 2012, 13, 178–184. [Google Scholar] [CrossRef]
  67. Wright, I.J.; Reich, P.B.; Westoby, M.; Ackerly, D.D.; Baruch, Z.; Bongers, F.; Cavender-Bares, J.; Chapin, T.; Cornelissen, J.H.C.; Diemer, M.; et al. The worldwide leaf economics spectrum. Nature 2004, 428, 821–827. [Google Scholar] [CrossRef]
  68. Pérez-Ramos, I.M.; Roumet, C.; Cruz, P.; Blanchard, A.; Autran, P.; Garnier, E. Evidence for a “plant community economics spectrum” driven by nutrient and water limitations in a Mediterranean rangeland of southern France. J. Ecol. 2012, 100, 1315–1327. [Google Scholar] [CrossRef] [Green Version]
  69. Kleyer, M.; Bekker, R.M.; Knevel, I.C.; Bakker, J.P.; Thompson, K.; Sonnenschein, M.; Poschlod, P.; van Groenendael, J.M.; Klimeš, L.; Klimešová, J.; et al. The LEDA traitbase: A database of life-history traits of the Northwest European flora. J. Ecol. 2008, 96, 1266–1274. [Google Scholar] [CrossRef]
  70. Klotz, S.; Kühn, I.; Durka, W. BIOLFLOR—Eine Datenbank Mit Biologisch-Ökologischen Merkmalen Zur Flora Von Deutschland [A Database with Biological-Ecological Characteristics for the Flora of Germany]. Bundesamt fur Naturschutz Bonn, Bonn, Germany. 2002. Available online: http://www.vifabio.de/iqfBio/detail/5415 (accessed on 15 December 2019).
  71. Hintze, C.; Heydel, F.; Hoppe, C.; Cunze, S.; König, A. D3: Dispersal and Diaspore Database—Baseline data and statistics on seed dispersal. Perspect. Plant. Ecol. 2013, 15, 180–192. [Google Scholar] [CrossRef] [Green Version]
  72. Pakeman, R.J. Functional trait metrics are sensitive to the completeness of the species’ trait data? Methods Ecol. Evol. 2014, 5, 9–15. [Google Scholar] [CrossRef]
  73. Garnier, E.; Cortez, J.; Billès, G.; Navas, M.-L.; Roumet, C.; Debussche, M.; Laurent, G.; Blanchard, A.; Aubry, D.; Bellmann, A.; et al. Plant functional markers capture ecosystem properties during secondary succession. Ecology 2004, 85, 2630–2637. [Google Scholar] [CrossRef]
  74. Laliberté, E.; Legendre, P. A distance-based framework for measuring functional diversity from multiple traits. Ecology 2010, 91, 299–305. [Google Scholar] [CrossRef]
  75. R Core Team. R: A Language and Environment for Statistical Computing; R Foundation for Statistical Computing: Vienna, Austria, 2019; Available online: https://www.R-project.org/ (accessed on 15 December 2019).
  76. Laliberté, E.; Legendre, P.; Shipley, B. Package “FD”: Measuring Functional Diversity (FD) from Multiple Traits, and Other Tools for Functional Ecology, R Package Version 1.0–12. 2015. Available online: https://cran.r-project.org/web/packages/FD/FD.pdf (accessed on 4 December 2019).
  77. Gotelli, N.J.; Graves, G.R. Null Models in Ecology; Smithsonian Institution Press: Washington, DC, USA, 1996. [Google Scholar]
  78. Kembel, S.W.; Cowan, P.D.; Helmus, M.R.; Cornwell, W.K.; Morlon, H.; Ackerly, D.D.; Blomberg, S.P.; Webb, C.O. Picante: R tools for integrating phylogenies and ecology. Bioinformatics 2010, 26, 1463–1464. [Google Scholar] [CrossRef] [Green Version]
  79. Gotelli, N.J.; McCabe, D.J. Species co-occurrence: A meta-analysis of J. M. Diamond’s assembly rules model. Ecology 2002, 83, 2091–2096. [Google Scholar] [CrossRef]
  80. Ellenberg, H.; Weber, H.E.; Düll, R.; Wirth, V.; Werner, W.; Paulißen, D. Zeigerwerte von Pflanzen in Mitteleuropa. 2. verbesserte und erweiterte Auflage. Scr. Geobot. 1992, 18, 1–258. [Google Scholar]
  81. Szymura, T.H.; Szymura, M.; Macioł, A. Bioindication with Ellenberg’s indicator values: A comparison with measured parameters in Central European oak forests. Ecol. Indic. 2014, 46, 495–503. [Google Scholar] [CrossRef]
  82. Bartelheimer, M.; Poschlod, P. Functional characterization of Ellenberg indicator values—A review on ecophysiological determinants. Funct. Ecol. 2016, 30, 506–516. [Google Scholar] [CrossRef]
  83. Shipley, B.; Belluau, M.; Kühn, I.; Soudzilovskaia, N.A.; Bahn, M.; Penuelas, J.; Kattge, J.; Sack, L.; Cavender-Bares, J.; Ozinga, W.A.; et al. Predicting habitat affinities of plant species using commonly measured functional traits. J. Veg. Sci. 2017, 28, 1082–1095. [Google Scholar] [CrossRef]
  84. Dalle Fratte, M.; Brusa, G.; Pierce, S.; Zanzottera, M.; Cerabolini, B.E.L. Plant trait variation along environmental indicators to infer global change impacts. Flora 2019, 254, 113–121. [Google Scholar] [CrossRef]
  85. Maes, S.L.; Perring, M.P.; Depauw, L.; Bernhardt-Römermann, M.; Blondeel, H.; Brūmelis, G.; Brunet, J.; Decocq, G.; den Ouden, J.; Govaert, S.; et al. Plant functional trait response to environmental drivers across European temperate forest understorey communities. Plant Biol. 2019. Early View. [Google Scholar] [CrossRef] [PubMed]
  86. Le Roux, P.C.; Pellissier, L.; Wisz, M.S.; Luoto, M. Incorporating dominant species as proxies for biotic interactions strengthens plant community models. J. Ecol. 2014, 102, 767–775. [Google Scholar] [CrossRef] [Green Version]
  87. Oksanen, J.; Blanchet, F.G.; Friendly, M.; Kindt, R.; Legendre, P.; McGlinn, D.; Minchin, P.R.; O’Hara, R.B.; Simpson, G.L.; Solymos, P.; et al. Package Vegan Community Ecology Package. 2019. Available online: https://cran.r-project.org/web/packages/vegan/vegan.pdf (accessed on 20 December 2019).
  88. Moles, A.T.; Warton, D.I.; Warman, L.; Swenson, N.G.; Laffan, S.W.; Zanne, A.E.; Pitman, A.; Hemmings, F.A.; Leishman, M.R. Global patterns in plant height. J. Ecol. 2009, 97, 923–932. [Google Scholar] [CrossRef]
  89. Moles, A.T.; Ackerly, D.D.; Tweddle, J.C.; Dickie, J.B.; Smith, R.; Leishman, M.R.; Mayfield, M.M.; Pitman, A.; Wood, J.T.; Westoby, M. Global patterns in seed size. Glob. Ecol. Biogeogr. 2007, 16, 109–116. [Google Scholar] [CrossRef]
  90. Díaz, S.; Kattge, J.; Cornelissen, J.H.C.; Wright, I.J.; Lavorel, S.; Dray, S.; Reu, B.; Kleyer, M.; Wirth, C.; Prentice, I.C.; et al. The global spectrum of plant form and function. Nature 2016, 529, 167–171. [Google Scholar] [CrossRef]
  91. Bruelheide, H.; Dengler, J.; Purschke, O.; Lenoir, J.; Jiménez-Alfaro, B.; Hennekens, S.M.; Botta-Dukát, Z.; Chytrý, M.; Field, R.; Jansen, F.; et al. Global trait-environment relationships of plant communities. Nat. Ecol. Evol. 2018, 2, 1906–1917. [Google Scholar] [CrossRef]
  92. Jafari, S.M.; Zarre, S.; Alavipanah, S.K.; Ghahremaninejad, F. Functional turnover from lowland to montane forest: Evidence from the Hyrcanian forest in Northern Iran. iForest 2015, 8, 359–367. [Google Scholar] [CrossRef] [Green Version]
  93. Urbančič, M.; Kutnar, L.; Kobal, M.; Žlindra, D.; Marinšek, A.; Simončič, P. Soil and vegetation characteristics on Intensive Monitoring Plots of forest ecosystems. GozdVestn 2016, 74, 3–27, (In Slovenian with English Summary). [Google Scholar]
  94. Funk, J.L.; Larson, J.E.; Ames, G.M.; Butterfield, B.J.; Cavender-Bares, J.; Firn, J.; Laughlin, D.C.; Sutton-Grier, A.E.; Williams, L.; Wright, J. Revisiting the Holy Grail: Using plant functional traits to understand ecological processes. Biol. Rev. 2017, 92, 1156–1173. [Google Scholar] [CrossRef] [PubMed]
Figure 1. Distinct forest vegetation types from the Intensive Monitoring (IM) sites in Slovenia: (a) Mountain spruce forest (6-KL), (b) Dinaric fir-beech forest (9-GO), (c) Thermophilous beech forest (2-FO), (d) Secondary Austrian pine forest with thermophilous deciduous trees (3-GB), (e) Scots pine forest (4-BR) and (f) Lowland oak-hornbeam forest (10-KG). For study site abbreviations, see Table 1.
Diversity 12 00091 g001
Figure 2. Principal component analysis (PCA) ordination diagrams for 10 IM sites in Slovenia, based on five environmental variables: ALT = altitude, L = Ellenberg Indicator Value (EIV) for light, F = EIV for soil moisture, R = EIV for soil reaction, N = EIV for soil nutrients. The EIVs were calculated based on presence/absence data from all vegetation, including the tree, shrub and herb layer. Results are shown for large vegetation plots (Lplots, 10 × 10 m, 60 plots in total). The bottom right table shows Pearson’s correlation coefficients between the environmental variables and the three PCA axes (PC1, PC2, PC3).
Diversity 12 00091 g002
Figure 3. Relationship between the community-weighted means (CWM) of four functional traits (height—H, seed mass—SM, specific leaf area—SLA, leaf dry matter content - LDMC) and three environmental gradients associated with: PC1 = nutrient availability (N), soil pH (R) and light availability (L); PC2 = altitude (ALT); PC3 = soil moisture (F). Significant regressions are indicated with solid red lines and grey ribbons (95% confidence intervals), whereas dashed red lines indicate marginally significant results (p < 0.1). Each data point (n = 10) represents average site-level CWMs, averaged across large plots (10 × 10 m). Statistics for regression analyses are reported (* p < 0.05, ns – not significant (p > 0.05), R2 – explained variance).
Diversity 12 00091 g003
Figure 4. Standardized effect size (SES) of functional dispersion (FDis) for four functional traits (H—plant height, SM—seed mass, SLA—specific leaf area, LDMC—leaf dry matter content) and their multivariate combination (MULTI) along three environmental gradients (PC1 = gradient related to nutrient availability (N), soil reaction (R) and light availability (L); PC2 = altitudinal gradient (ALT); PC3 = gradient in soil moisture (F)). Values on the X-axis are average site-level (n = 10) scores derived from PCA ordination. Red data points represent large plots (Lplot, 10 × 10 m) and blue dots represent small plots (Splot, 2 × 2 m). Significant regressions (p < 0.05) are indicated with solid lines. SES values higher than 0 (solid horizontal line) suggest trait divergence, whereas SES values lower than 0 suggest trait convergence.
Diversity 12 00091 g004
Table 1. Main environmental and vegetation characteristics of 10 study sites in Slovenia, based on data from large vegetation plots (10 × 10 m). Values are mean ± SD.
SiteAltitude (m)Slope (°)Rockiness (%)Dominant Tree SpeciesTree Layer Cover (%)Tree Layer Richness aShrub Layer Cover (%)Five Most Abundant (Frequent) Understory Species
1-KK
(Krucmanove konte)
13979.0
(1.4)
8.8
(7.8)
Norway spruce
(Picea abies)
60.0
(14.1)
11.1
(1.9)
Aposeris foetida, Picea abies, Hieracium murorum, Oxalis acetosella, Vaccinium myrtillus
2-FO
(Fondek)
82710.9
(3.6)
40.6
(25.3)
European beech
(Fagus sylvatica)
95.3
(10.4)
43.4
(1.8)
Sesleria autumnalis, Anemone trifolia, Vinca minor, Cyclamen purpurascens, Mercurialis perennis
3-GB
(Gropajski bori)
4208.3
(2.1)
39.5
(28.6)
Austrian pine
(Pinus nigra)
94.3
(3.0)
58.3
(5.4)
Sesleria autumnalis, Brachypodium rupestre, Hedera helix, Frangula rupestris, Helleborus multifidus
4-BR
(Brdo)
4713.0
(2.5)
0.0
(0.0)
Scots pine
(Pinus sylvestris)
45.6
(30.1)
35.4
(8.1)
Vaccinium myrtillus, Pteridium aquilinum, Molinia caerulea subsp. arundinacea, Calluna vulgaris, Vaccinium vitis-idaea
5-BO
(Borovec)
70513.3
(6.5)
14.1
(13.8)
European beech
(Fagus sylvatica)
98.8
(3.5)
611.1
(7.4)
Omphalodes verna, Acer pseudoplatanus, Fagus sylvatica, Pteridium aquilinum, Sanicula europaea
6-KL
(Kladje)
13044.8
(1.0)
0.0
(0.0)
Norway spruce
(Picea abies)
62.5
(5.0)
10.4
(0.3)
Calamagrostis villosa, Deschampsia flexuosa, Picea abies, Luzula pilosa, Melamyprum pratense
8-LO
(Lontovž)
95826.6
(1.8)
3.1
(1.8)
European beech
(Fagus sylvatica)
99.4
(1.8)
34.1
(2.8)
Mercurialis perennis, Hacquetia epipactis, Acer pseudoplatanus, Polygonatum verticillatum, Galium sylvaticum
9-GO
(Gorica)
95514.0
(1.6)
2.5
(1.7)
European beech
(Fagus sylvatica)
88.8
(19.3)
517.5
(15.5)
Acer pseudoplatanus, Mercurialis perennis, Omphalodes verna, Fagus sylvatica, Hacquetia epipactis
10-KG
(Krakovski gozd)
1600.0
(0.0)
0.0
(0.0)
European hornbeam (Carpinus betulus), Pedunculate oak (Quercus robur)96.3
(2.5)
716.3
(9.5)
Carex brizoides, Galeobdolon montanum, Quercus robur, Circea lutetiana, Aegopodium podagraria
11-MŠ
(Murska šuma)
1700.1
(0.4)
0.0
(0.0)
Pedunculate oak (Quercus robur), European hornbeam (Carpinus betulus)100.0
(0.0)
810.3
(16.3)
Galeobdolon montanum, Galeopsis tetrahit, Galium odoratum, Aegopodium podagraria, Asarum europaeum
a Number of different tree species recorded in the tree layer (i.e., site-level tree species pool).
Table 2. Species richness (number of species per plot), understory cover (sum of shrub and herb layer) and species evenness for 10 IM forest sites in Slovenia. Results are shown for two different spatial scales (plot sizes): large plots (Lplots, 100 m2) and small plots (Splots, 4 m2). Values are mean ± SD. For abbreviations of IM sites, see Table 1.
IM siteSpecies RichnessCover (%)Species Evenness
Lplots SplotsLplotsSplotsLplotsSplots
1-KK40.5
(9.3)
20.7
(4.8)
76.3
(20.6)
79.5
(12.1)
0.65
(0.13)
0.61
(0.13)
2-FO25.5
(5.7)
10.9
(3.0)
75.9
(19.3)
70.5
(23.0)
0.51
(0.05)
0.57
(0.14)
3-GB25.3
(1.7)
8.5
(3.5)
75.0
(28.0)
77.5
(26.5)
0.45
(0.07)
0.43
(0.20)
4-BR10.9
(2.4)
7.7
(1.4)
100.0
(0.0)
100.0
(0.0)
0.62
(0.07)
0.67
(0.08)
5-BO43.5
(4.7)
18.0
(3.3)
50.6
(16.4)
43.5
20.8
0.87
(0.02)
0.84
(0.08)
6-KL10.3
(2.9)
6.9
(1.7)
85.0
(12.2)
91.2
(9.5)
0.19
(0.04)
0.36
(0.16)
8-LO50.4
(3.5)
27.1
(3.0)
75.6
(6.8)
48.5
(21.2)
0.83
(0.03)
0.81
(0.12)
9-GO55.0
(3.2)
26.5
(3.6)
86.3
(8.5)
56.0
(20.4)
0.86
(0.05)
0.85
(0.03)
10-KG29.8
(1.5)
25.3
(4.5)
80.0
(11.5)
70.5
(17.2)
0.77
(0.07)
0.74
(0.07)
11-MŠ22.3
(6.1)
18.7
(3.1)
81.9
(13.1)
84.0
(17.3)
0.49
(0.23)
0.62
(0.06)
Total
(average)
31.1
(15.4)
17.0
(8.3)
78.0
(19.0)
72.1
(24.7)
0.64
(0.22)
0.65
(0.19)
Table 3. Results from multiple linear regression models applied to the community-weighted means of four traits (height—H, seed mass—SM, specific leaf area—SLA, leaf dry matter content—LDMC) and three predictor variables (PC1, PC2, PC3 and/or their quadratic terms). Averaged site-level data from large (10 × 10 m, n = 10) plots were used. Reported values are parameter estimates.
Functional TraitPC1 (PC12)PC2 (PC22)PC3 (PC32)Whole Model R2 (%)
H0.010 m−0.026 *0.01674.6 *
SM−0.129 **−0.146 *0.179 m81.1 **
SLA−1.106 m1.813 m−1.46859.3
LDMC10.022−17.998 m8.02152.6
Significant results are in bold. ** p < 0.01, * p < 0.05, m—marginally significant (p < 0.1).
Table 4. Results of the ANOVA for standardized effect size (SES) of functional dispersion for four functional traits and explanatory variables (PC1, PC2, PC3, spatial scale). F statistics and corresponding p-values are reported based on averaged site-level data (n = 20). PC2 denotes the quadratic term. The effect of the interaction between ecological gradient (PC) and spatial scale was also tested.
Dependent VariableExplanatory VariableGradient 1 (PC1)Gradient 2 (PC2)Gradient 3 (PC3)
SES-H
(plant height)
PC2.821.1117.34 ***
PC2/4.30 m/
Scale0.030.010.03
PC:Scale0.360.090.00
PC2:Scale/0.19/
Model R2 (%)16.728.952.1 **
SES-SM
(seed mass)
PC1.4619.72 ***3.37 m
PC2///
Scale0.310.920.35
PC:Scale0.492.420.00
PC2:Scale///
Model R2 (%)12.359.1 **18.9
SES-SLA
(specific leaf area)
PC1.504.79 *0.01
PC23.21 m/3.67 m
Scale0.160.030.07
PC:Scale0.060.480.01
PC2:Scale0.01/0.47
Model R2 (%)26.124.923.2
SES-LDMC
(leaf dry matter content)
PC10.21 **0.320.02
PC212.56 **4.35 m15.23 **
Scale2.010.221.05
PC:Scale0.440.010.10
PC2:Scale0.500.132.50
Model R2 (%)64.8 **26.357.4 *
SES-MULTI
(all 4 traits combined)
PC3.59 m0.1911.93 **
PC2///
Scale0.040.020.07
PC:Scale0.180.080.68
PC2:Scale///
Model R2 (%)19.21.844.2 *
Significant results are indicated in bold. *** p < 0.001, ** p < 0.01, * p < 0.05, m—marginally significant (p < 0.1).
Table 5. Results of the Wilcoxon signed-rank tests for standardized effect size of functional dispersion (SES FDis), separately for each IM study site and functional trait (H—height, SM—seed mass, SLA—specific leaf area, LDMC—leaf dry matter content, MULTI—all 4 traits combined). Values are the mean site-level SES FDis values. The first test (Test 1) refers to whether the values from the small plots (Splots, n = 10) are significantly different from zero. Negative values indicate trait convergence, whereas positive values indicate trait divergence. The second test (Test 2) was performed to check if the SES values from the large plots (Lplots) significantly differ from the SES values in Splots.
IM SiteHSMSLALDMCMULTI
Splots (test 1)Lplots (test 2)Splots (test 1)Lplots (test 2)Splots (test 1)Lplots (test 2)Splots (test 1)Lplots (test 2)Splots (test 1)Lplots (test 2)
1-KK−0.56 **−0.62−1.19 **−1.50 m0.74 *2.30 *0.612.23 *0.141.06 *
2-FO−0.74 **−0.98 *−0.36 *−0.39−1.03 **−0.95−0.56 m0.00−1.00 *−0.70
3-GB0.86 m0.53−0.130.48−0.81 **−0.71−1.68 **−1.221.542.57
4-BR0.39 **0.11 *0.38 **0.16 *−0.75 **−0.90−1.56 **−1.21 **0.81 *0.16 **
5-BO0.220.570.280.29−0.64 **−0.75−0.090.11−0.78 **−0.70
6-KL−0.98 **−1.46 **−1.03 **−1.64 **−0.93 **−1.05−1.98 **−2.25−1.99 **−2.23
8-LO0.370.60−0.27−0.251.48 **1.82−0.27 **0.32 **1.07 *1.09
9-GO−0.050.27−0.45 m0.010.541.16 *−0.57 *0.17 *−0.050.48 *
10-KG−0.45 **−0.720.091.68 *−0.58 **−0.580.191.28 *−0.51 **−0.25
11-MŠ−0.44 **−0.32−0.63 m−0.360.57 **−0.46 **0.66 **−0.77 **0.43 **−1.08 ***
Significant results are indicated in bold (* p < 0.05, ** p < 0.01, *** p < 0.001, m—marginally significant (p < 0.1)). The green color denotes the comparisons of SES values where the SES for Lplots was lower than the SES for Splots, supporting our hypothesis that FDis in Lplots would exhibit more convergent diversity patterns (i.e., lower SES values) compared to Splots. Values in blue denote the situations where this ratio was highly significant (i.e., significantly positive SES in Splots and significantly negative SES in Lplots). The red color denotes the opposite situation, indicating where our expectations about scale-dependent forest community assembly processes were not supported.

