Landscape and Climate Influence the Patterns of Genetic Diversity and Inbreeding in Cerrado Plant Species

 ,
,  and
and
Abstract

1. Introduction
2. Materials and Methods
2.1. Literature Search of Genetic Studies on the Vascular Plants of the Cerrado
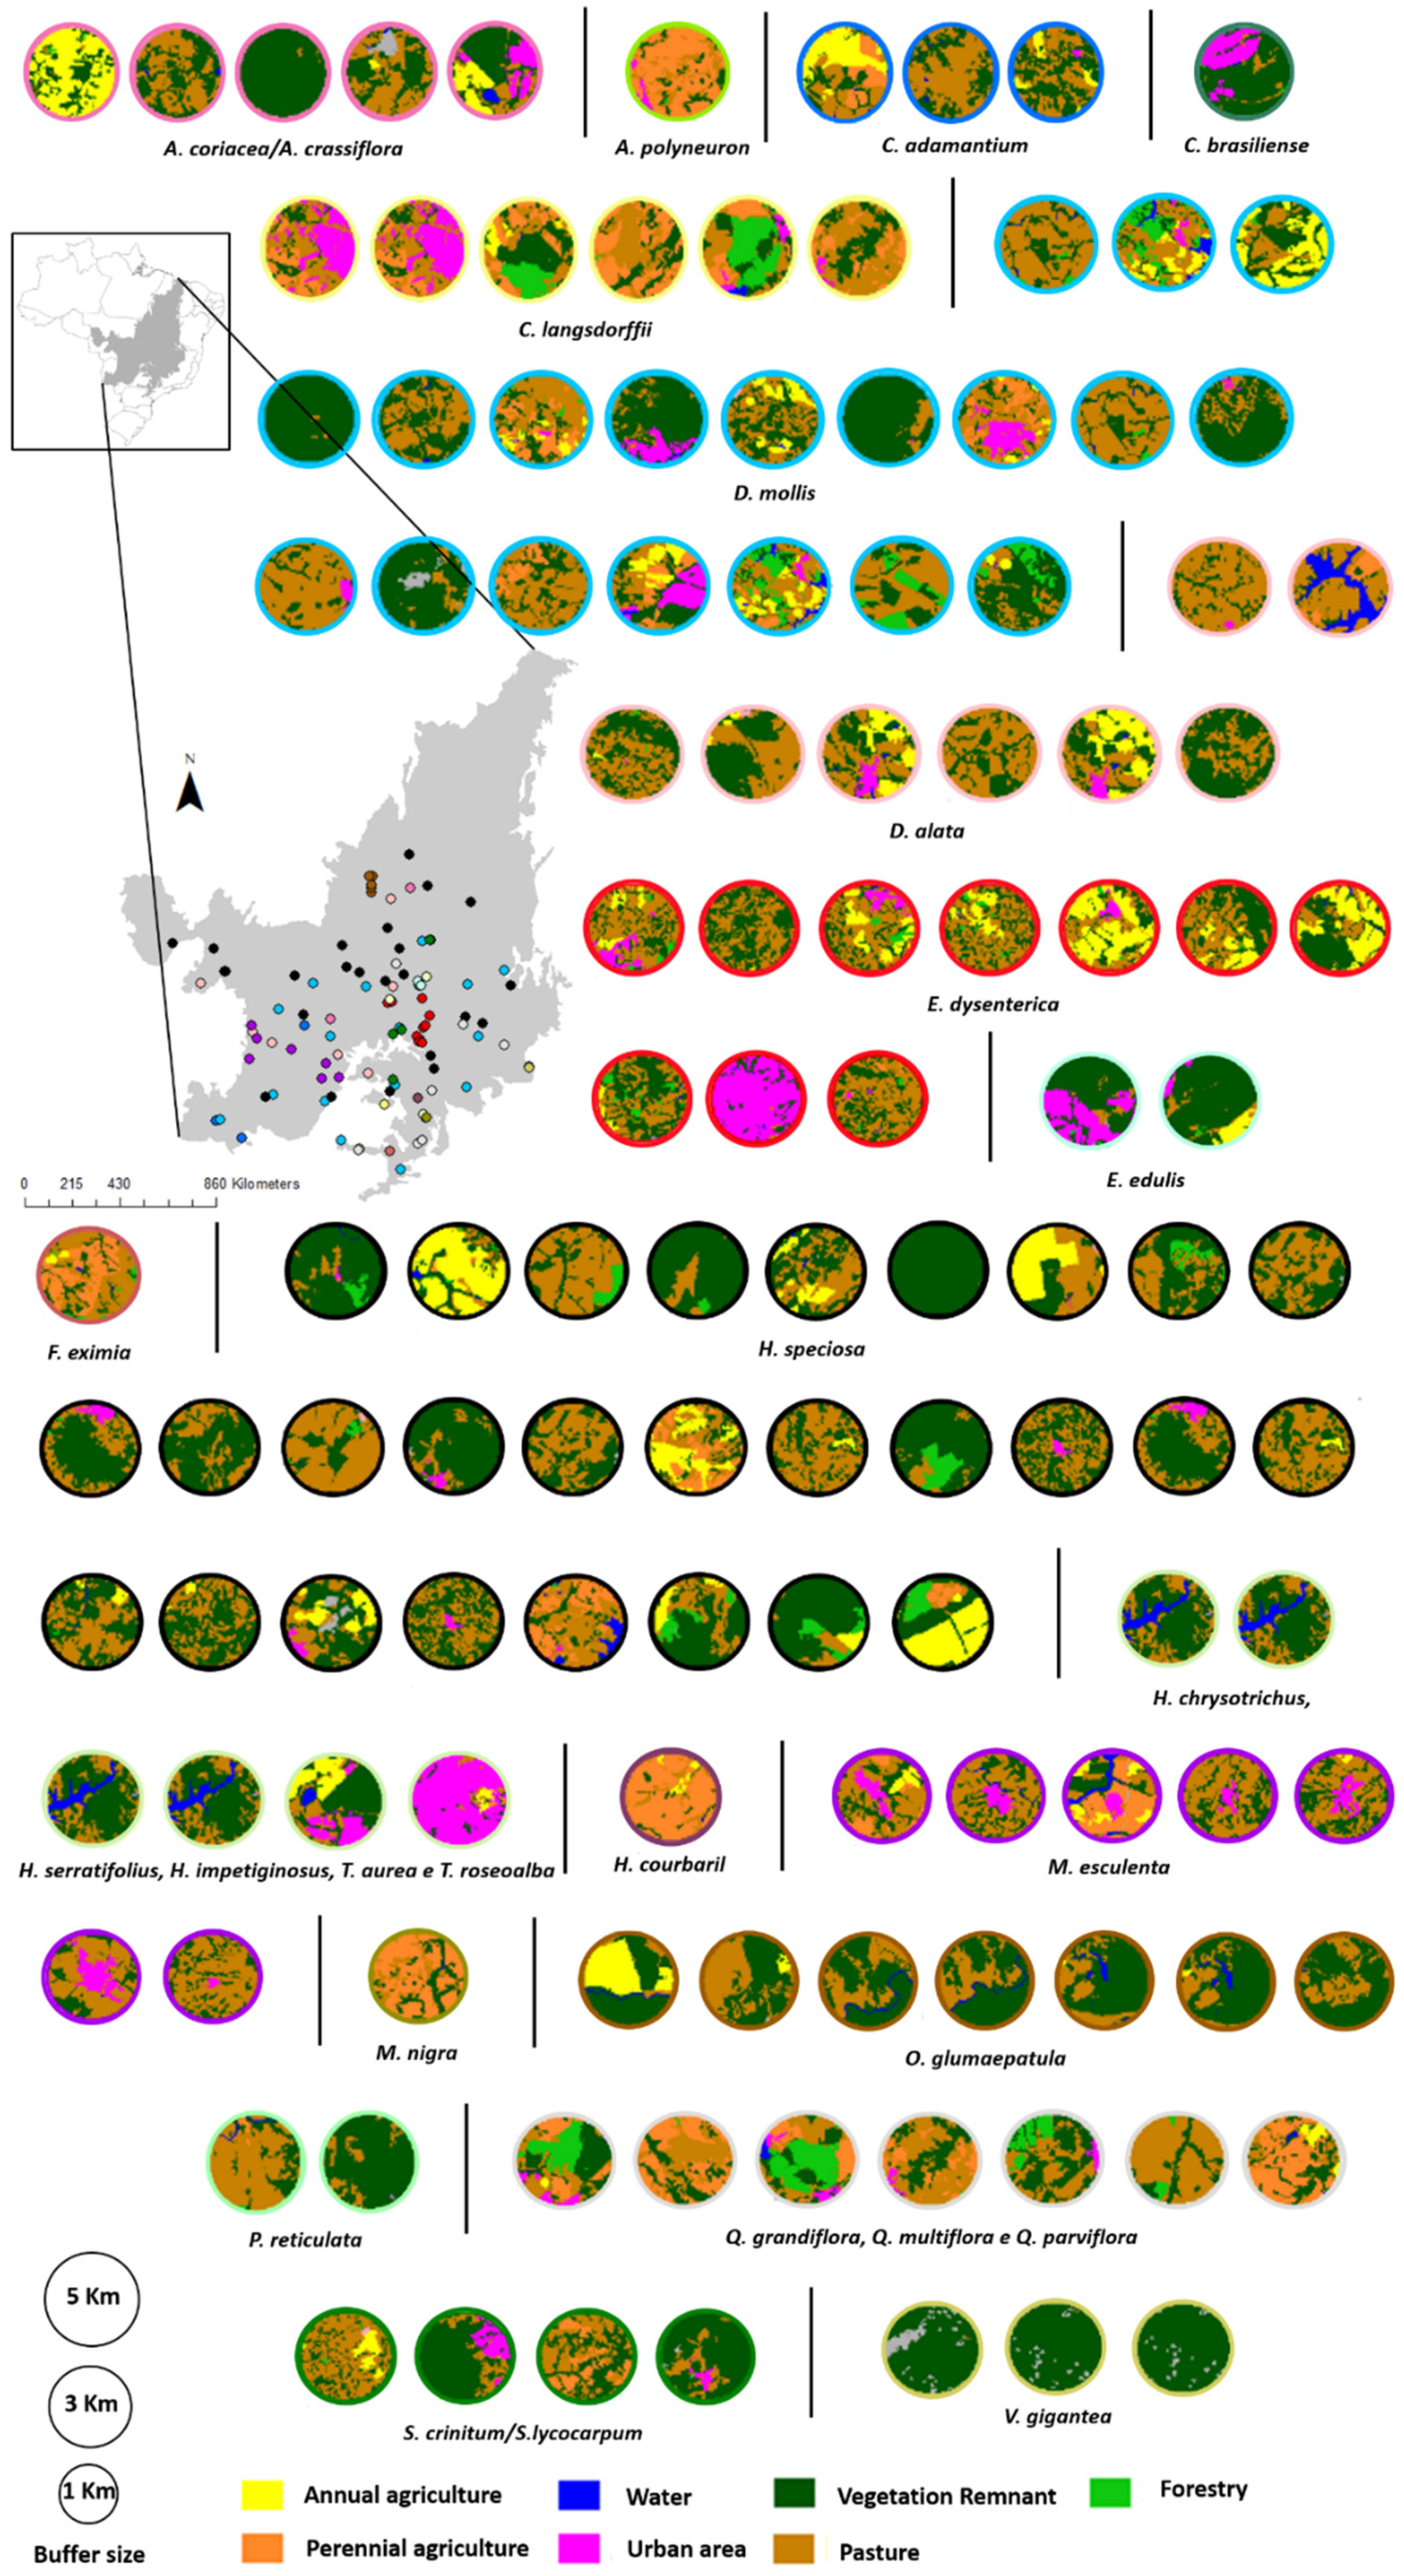
2.2. Retrieving Data on Landscape Features
2.3. Retrieving the Data on Landscape Features
2.4. Spatial Patterns of Genetic Diversity and Structure
2.5. Effects of Landscape and Climate on the Genetic Diversity of Cerrado Plants
3. Results
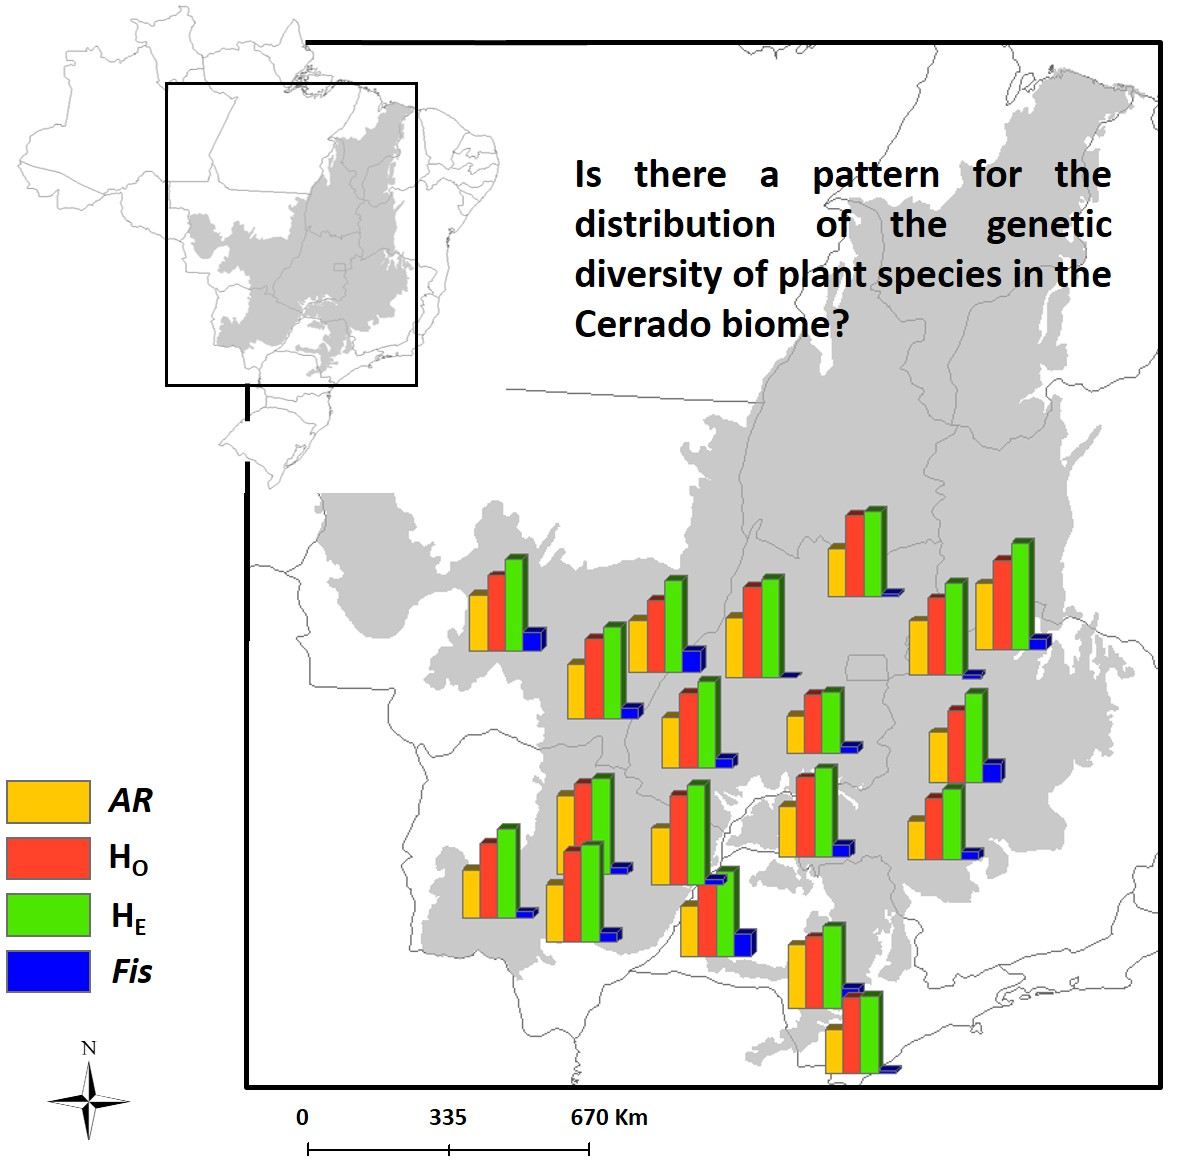
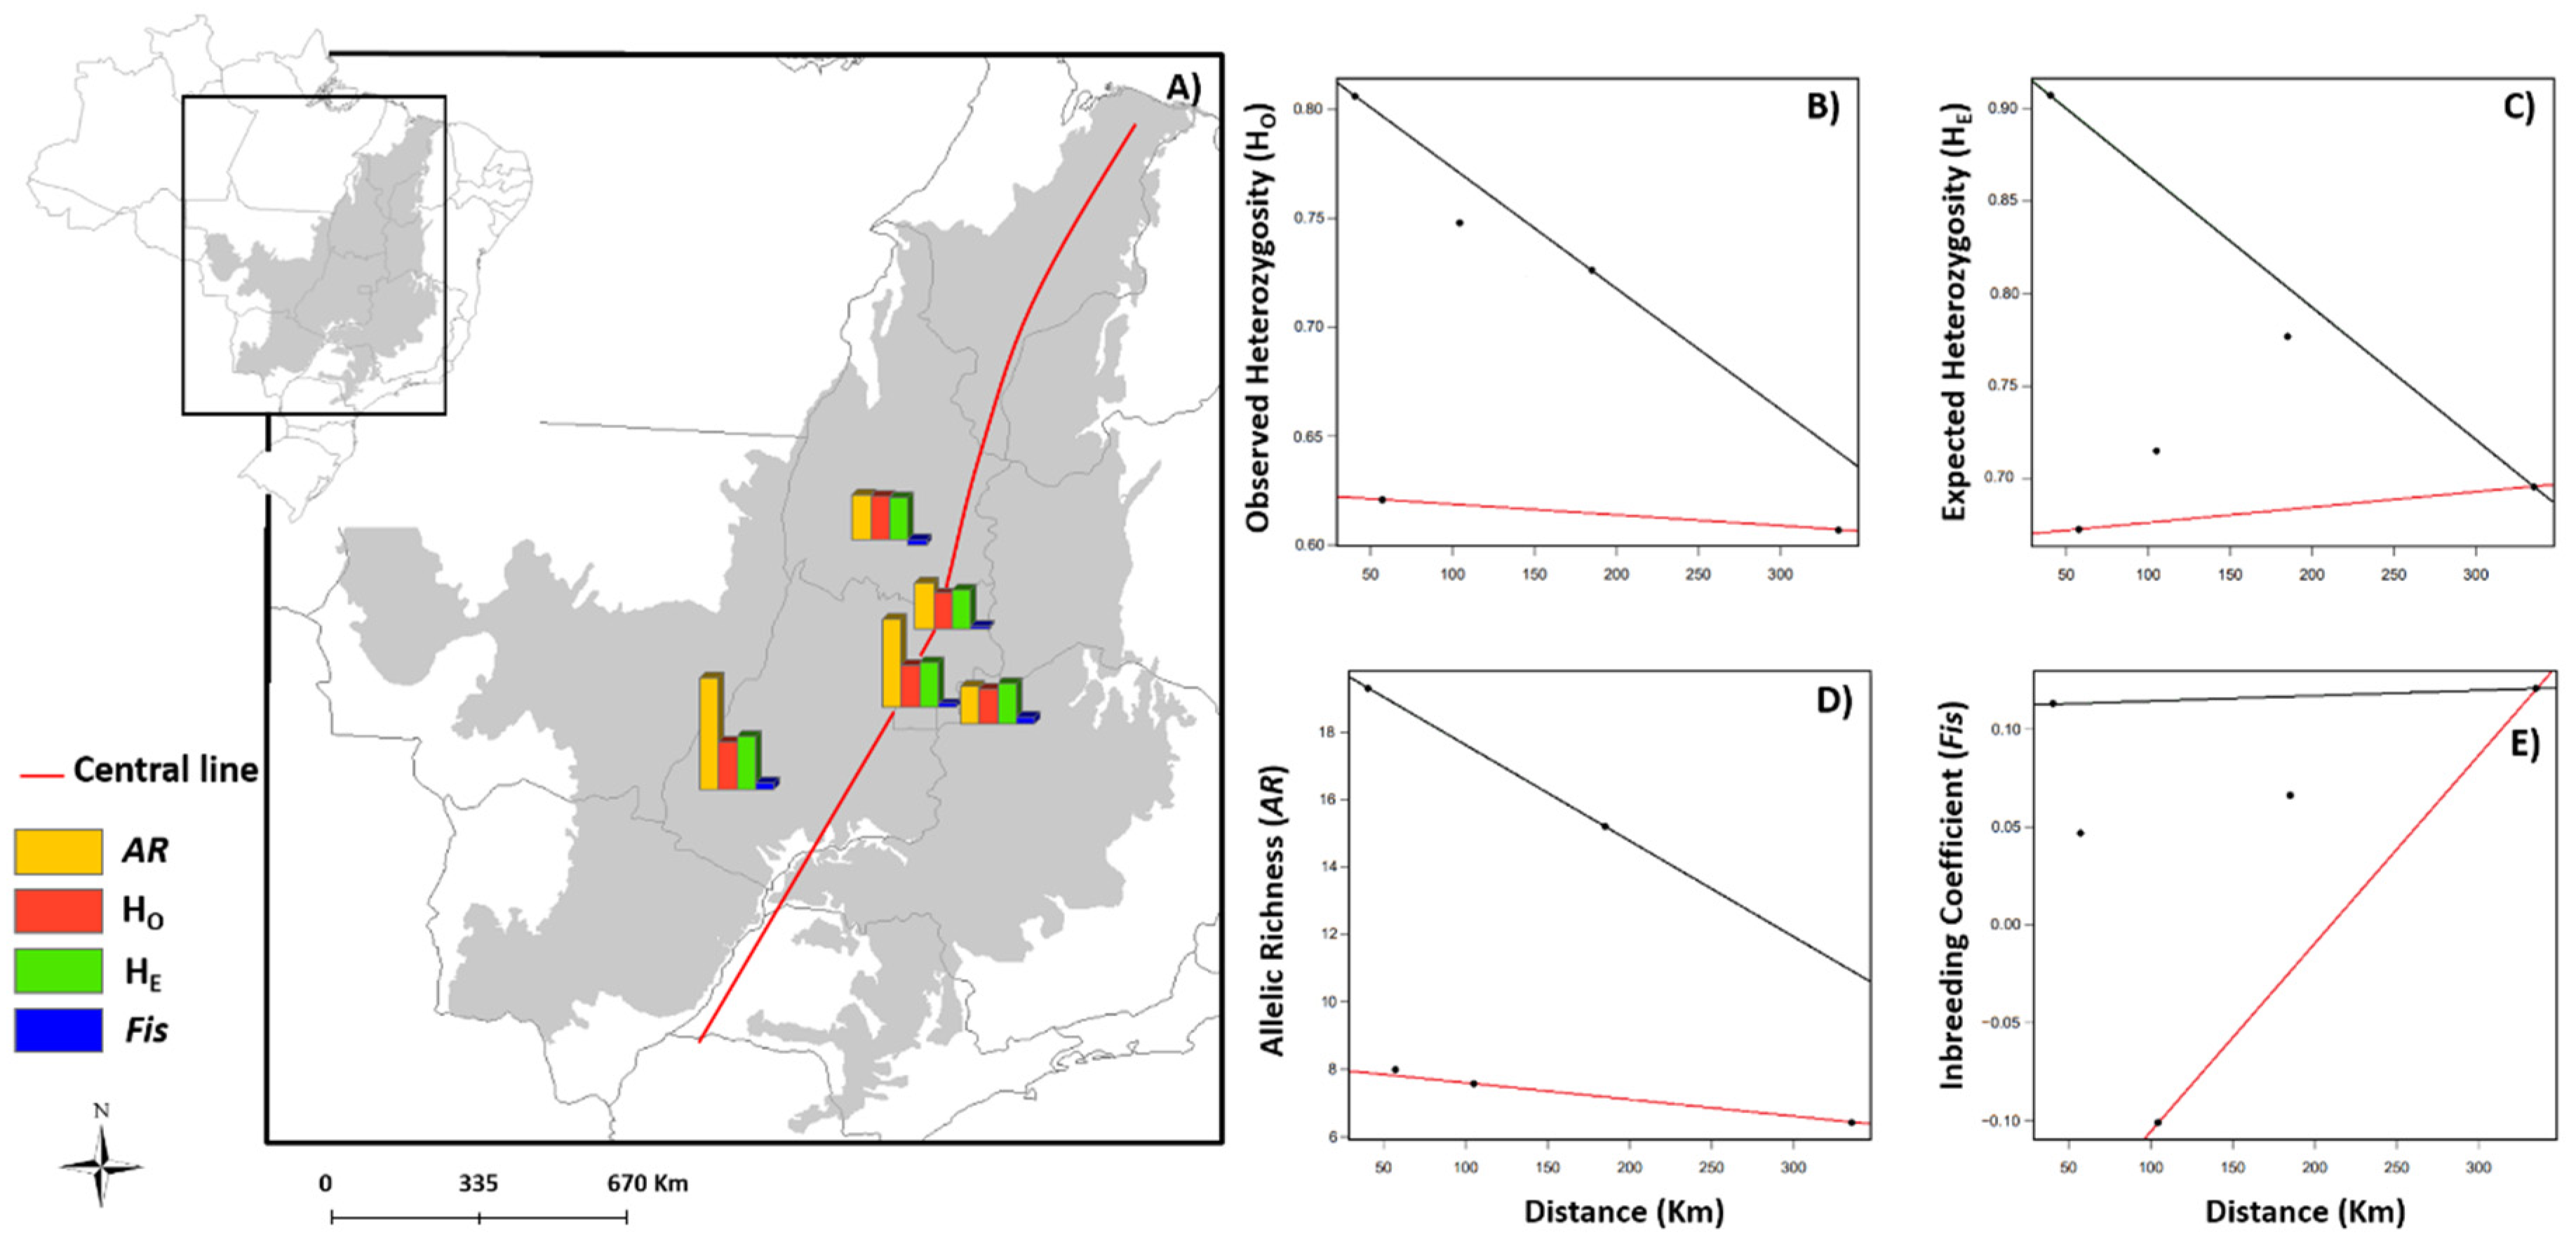
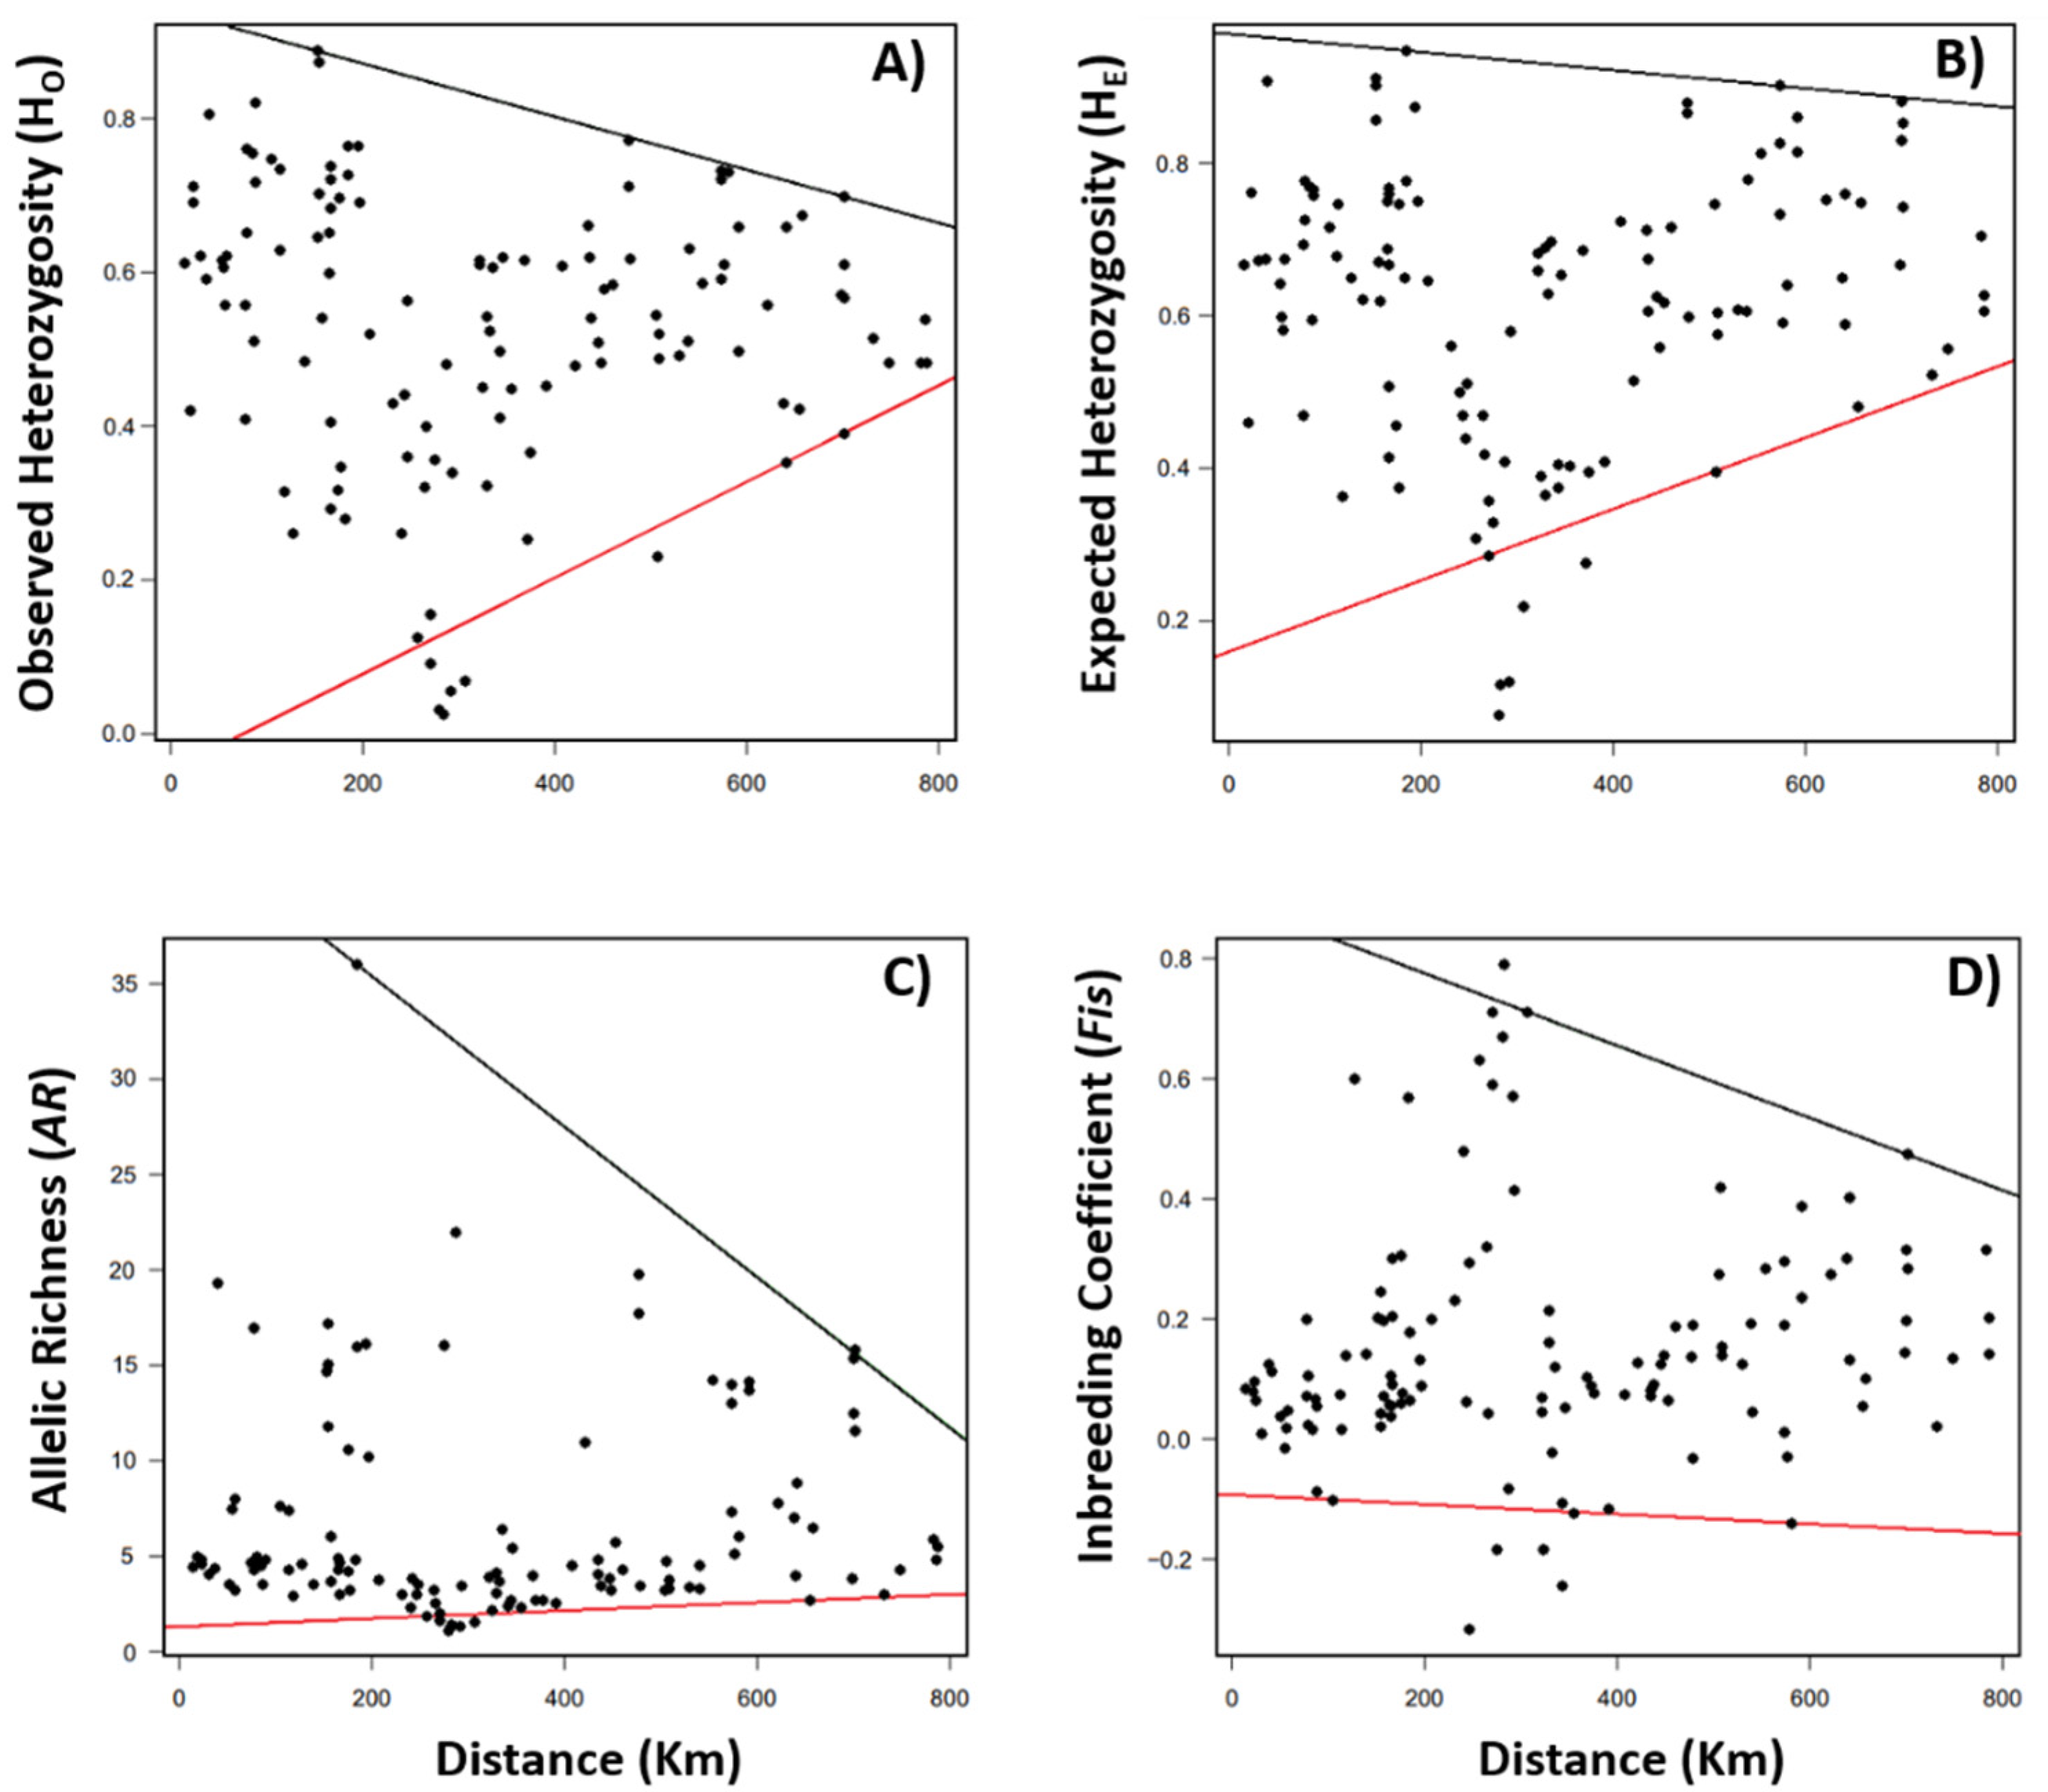
3.1. Spatial Patterns of Genetic Diversity and Structure
3.2. Effects of Landscape and Climate on Genetic Diversity
4. Discussion
5. Conclusions
Supplementary Materials
Author Contributions
Funding
Acknowledgments
Conflicts of Interest
References
- Andeson, C.D.; Eppeeson, B.K.; Fortin, M.-J.; Holderegger, F.; James, P.M.A.; Rosenberg, M.S.; Scribner, K.T.; Spear, S. Considering spatial and temporal scale in landscape-genetic studies of gene flow. Mol. Ecol. 2010, 19, 3565–3575. [Google Scholar] [CrossRef]
- Cushman, S.A.; Shirk, A.; Landguth, E.L. Separating the effects of habitat area, fragmentation and matrix resistance on genetic differentiation in complex landscapes. Landsc. Ecol. 2012, 27, 369–380. [Google Scholar] [CrossRef]
- Holderegger, R.; Di Giulio, M. The genetic effects of roads: A review of empirical evidence. Basic Appl. Ecol. 2010, 11, 522–531. [Google Scholar] [CrossRef]
- Kamm, U.; Gugerli, F.; Rotach, P.; Edwards, P.; Holderegger, R. Open areas in a landscape enhance pollen-mediated gene flow of a tree species: Evidence from northern Switzerland. Landsc. Ecol. 2010, 25, 903–911. [Google Scholar] [CrossRef]
- Leimu, R.; Vergeer, P.; Angeloni, F.; Ouborg, N.J. Habitat fragmentation, climate change, and inbreeding in plants. Ann. N. Y. Acad. Sci. 2010, 1195, 84–98. [Google Scholar] [CrossRef] [PubMed]
- Ezard, T.H.G.; Travis, J.M.J. The impact of habitat loss and fragmentation on genetic drift and fixation time. Oikos 2006, 114, 367–375. [Google Scholar] [CrossRef]
- Brook, B.W.; Sodhi, N.S.; Bradshaw, C.J. Synergies among extinction drivers under global change. Trends Ecol. Evol. 2008, 23, 453–460. [Google Scholar] [CrossRef] [PubMed]
- Pujol, B.; Blanchet, S.; Charmantier, A.; Danchin, E.; Facon, B.; Marrot, P.; Roux, F.; Scotti, I.; Teplitsky, C.; Thomson, C.E.; et al. The missing response to selection in the wild. Trends Ecol. Evol. 2018, 33, 337–346. [Google Scholar] [CrossRef] [PubMed]
- Keller, L.F.; Waller, D.M. Inbreeding effects in wild populations. Trends Ecol. Evol. 2002, 17, 230–241. [Google Scholar] [CrossRef]
- Reed, D.H.; Frankham, R. Correlation between fitness and genetic diversity. Conserv. Biol. 2003, 17, 230–237. [Google Scholar] [CrossRef]
- Berec, L.; Angulo, E.; Courchamp, F. Multiple Allee effects and population management. Trends Ecol. Evol. 2007, 22, 185–191. [Google Scholar] [CrossRef]
- Strassburg, B.B.N.; Brooks, T.; Feltran-Barbieri, R.; Iribarrem, A.; Crouzeilles, R.; Loyola, R.; Latawiec, A.E.; Oliveira, F.F.J.B.; Scaramuzza, C.A.M.; Scarano, F.R.; et al. Moment of truth for the Cerrado hotspot. Nat. Ecol. Evol. 2017, 1, 0099. [Google Scholar] [CrossRef]
- Gibbs, P.E.; Leitão Filho, H.D.F.; Shepherd, G. Floristic composition and community structure in an area of cerrado in SE Brazil. Flora 1983, 173, 433–449. [Google Scholar] [CrossRef]
- Sano, E.E.; Rosa, R.; Brito, J.L.S.; Ferreira, L.G. Land cover mapping of the tropical savanna region in Brazil. Environ. Monit. Assess. 2010, 166, 113–124. [Google Scholar] [CrossRef]
- Spera, S.A.; Galford, G.L.; Coe, M.T.; Macedo, M.N.; Mustard, J.F. Land-use change affects water recycling in Brazil’s last agricultural frontier. Glob. Chang. Biol. 2016, 22, 3405–3413. [Google Scholar] [CrossRef]
- Latrubesse, E.M.; Arima, E.; Ferreira, M.E.; Nogueira, S.H.; Wittmann, F.; Dias, M.S.; Dagosta, F.C.P.; Bayer, M. Fostering water resource governance and conservation in the Brazilian Cerrado biome. Conserv. Sci. Pract. 2019, 1, e77. [Google Scholar] [CrossRef]
- Myers, N.; Mittermeier, R.A.; Mittermeier, C.G.; da Fonseca, G.A.B.; Kent, J. Biodiversity hotspots for conservation priorities. Nature 2010, 403, 853–858. [Google Scholar] [CrossRef]
- Leidner, A.K.; Haddad, N.M. Combining measures of dispersal to identify conservation strategies in fragmented landscapes. Conserv. Biol. 2011, 25, 1022–1031. [Google Scholar] [CrossRef]
- Aguilar, R.; Quesada, M.; Ashworth, L.; Herrerias-Diego, Y.; Lobo, J. Genetic consequences of habitat fragmentation in plant populations: Susceptible signals in plant traits and methodological approaches. Mol. Ecol. 2008, 17, 5177–5188. [Google Scholar] [CrossRef]
- Diniz-Filho, J.A.F.; Nabout, J.C.; Bini, L.M.; Soares, T.N.; Telles, M.P.C.; Marco, P., Jr.; Collevatti, R.G. Niche modelling and landscape genetics of Caryocar brasiliense (“Pequi” tree: Caryocaraceae) in Brazilian Cerrado: An integrative approach for evaluating central–peripheral population patterns. Tree Genet. Genomes 2009, 5, 617–627. [Google Scholar] [CrossRef]
- Collevatti, R.G.; Telles, M.P.C.; Nabout, J.C.; Chaves, L.J.; Soares, T.N. Demographic history and the low genetic diversity in Dipteryx alata (Fabaceae) from Brazilian Neotropical savannas. Heredity 2013, 111, 97–105. [Google Scholar] [CrossRef]
- Eidesen, P.B.; Ehrich, D.; Bakkestuen, V.; Alsos, I.G.; Gilg, O.; Taberlet, P.; Brochmann, C. Genetic roadmap of the Arctic: Plant dispersal highways, traffic barriers and capitals of diversity. New Phytol. 2013, 200, 898–910. [Google Scholar] [CrossRef]
- Gwitira, I.; Murwira, A.; Shekede, M.D.; Masocha, M.; Chapano, C. Precipitation of the warmest quarter and temperature of the warmest month are key to understanding the effect of climate change on plant species diversity in Southern African savannah. Afr. J. Ecol. 2014, 52, 209–216. [Google Scholar] [CrossRef]
- Collevatti, R.G.; Nabout, J.C.; Diniz-Filho, J.A.F. Range shift and loss of genetic diversity under climate change in Caryocar brasiliense, a Neotropical tree species. Tree Genet. Genomes 2011, 7, 1237–1247. [Google Scholar] [CrossRef]
- Taberlet, P.; Fumagalli, L.; Wust-Saucy, A.G.; Cosson, J.F. Comparative phylogeography and postglacial colonization routes in Europe. Mol. Ecol. 1998, 7, 453–464. [Google Scholar] [CrossRef]
- Soltis, D.E.; Morris, A.B.; McLachlan, J.S.; Manos, P.S.; Soltis, P.S. Comparative phylogeography of unglaciated eastern North America. Mol. Ecol. 2006, 15, 4261–4293. [Google Scholar] [CrossRef]
- Stewart, J.R. The progressive effect of the individualistic response of species to Quaternary climate change: An analysis of British mammalian faunas. Quat. Sci. Rev. 2008, 27, 2499–2508. [Google Scholar] [CrossRef]
- Edwards, D.L.; Keogh, J.S.; Knowles, L.L. Effects of vicariant barriers, habitat stability, population isolation and environmental features on species divergence in the south-western Australian coastal reptile community. Mol. Ecol. 2012, 21, 3809–3822. [Google Scholar] [CrossRef]
- Collevatti, R.G.; Lima, N.E.; Vitorino, L.V. The diversification of extant angiosperms in the South American dry diagonal. In Neotropical Diversification: Patterns and Processes; Rull, V., Carnaval, A.C., Eds.; Springer: Berlin/Heidelberg, Germany, 2020; pp. 547–567. [Google Scholar]
- Sagarin, R.D.; Gaines, S.D. The ‘abundant centre’ distribution: To what extent is it a biogeographical rule? Ecol. Lett. 2002, 5, 137–147. [Google Scholar] [CrossRef]
- Eckert, C.G.; Samis, K.E.; Lougheed, S.C. Genetic variation across species’ geographical ranges: The central–marginal hypothesis and beyond. Mol. Ecol. 2008, 17, 1170–1188. [Google Scholar] [CrossRef]
- Gaston, K.J. Geographic range limits: Achieving synthesis. Proc. R. Soc. B 2009, 276, 1395–1406. [Google Scholar] [CrossRef]
- Pironon, S.; Villellas, J.; Morris, W.F.; Doak, D.F.; García, M.B. Do geographic, climatic or historical ranges differentiate the performance of central versus peripheral populations? Glob. Ecol. Biogeogr. 2015, 24, 611–620. [Google Scholar] [CrossRef]
- Pironon, S.; Papuga, G.; Villellas, J.; Angert, A.L.; García, M.B.; Thompson, J.D. Geographic variation in genetic and demographic performance: New insights from an old biogeographical paradigm. Biol. Rev. 2017, 92, 1877–1909. [Google Scholar] [CrossRef]
- Hampe, A.; Petit, R.J. Conserving biodiversity under climate change: The rear edge matters. Ecol. Lett. 2005, 8, 461–467. [Google Scholar] [CrossRef]
- Jones, B.; Gliddon, C.; Good, J.E.G. The conservation of variation in geographically peripheral populations: Lloydia serotina (Liliaceae) in Britain. Biol. Conserv. 2001, 101, 147–156. [Google Scholar] [CrossRef]
- Barrett, S.C.; Ness, R.W.; Vallejo-Marín, M. Evolutionary pathways to self-fertilization in a tristylous plant species. New Phytol. 2009, 183, 546–556. [Google Scholar] [CrossRef] [PubMed]
- Ortego, J.; Riordan, E.C.; Gugger, P.F.; Sork, V.L. Influence of environmental heterogeneity on genetic diversity and structure in an endemic southern Californian oak. Mol. Ecol. 2012, 21, 3210–3223. [Google Scholar] [CrossRef]
- Lesica, P.; Allendorf, F.W. When are peripheral populations valuable for conservation? Conserv. Biol. 1995, 9, 753–760. [Google Scholar] [CrossRef]
- Moretti, M.; Caretti, P.; Bricalli, A.; Andrello, M. Genetic diversity and reproductive ecology of the sage-leaved rockrose, Cistus salviifolius L., in the Swiss Alps. Plant Ecol. 2020, 221, 361–374. [Google Scholar] [CrossRef]
- Morente-López, J.; Kass, J.M.; Lara-Romero, C.; Serra-Diaz, J.M.; Soto-Correa, J.C.; Anderson, P.; Iriondo, J.M. Ecological niche models as hypothesis generators of functional genetic differentiation and potential local adaptation in a Mediterranean alpine ecosystem. bioRxiv 2020. [Google Scholar] [CrossRef]
- Nei, M. Molecular Evolutionary Genetics, 1st ed.; Columbia University Press: New York, NY, USA, 1987; p. 512. [Google Scholar]
- Nei, M.; Kumar, S. Molecular Evolution and Phylogenetics, 1st ed.; Oxford University Press: New York, NY, USA, 2000; p. 333. [Google Scholar]
- Vitorino, L.C.; Souza, U.J.B.; Jardim, T.P.F.A.; Ballesteros-Mejia, L. Towards inclusion of genetic diversity measures into IUCN assessments: A case study on birds. Anim. Biodiv. Conserv. 2019, 42, 317–335. [Google Scholar] [CrossRef]
- MMA, IBAMA, EMBRAPA, INPE, UFG, UFU Terra Class Cerrado—Mapeamento Do Uso e Cobertura da Terra Do Cerrado. Available online: http://www.dpi.inpe.br/tccerrado/download.php (accessed on 4 February 2020).
- Collevatti, R.G.; Estolano, R.; Garcia, S.F.; Hay, J.D. Short-distance pollen dispersal and high self-pollination in a bat-pollinated neotropical tree. Tree Genet. Genomes 2010, 6, 555–564. [Google Scholar] [CrossRef]
- Almeida-Júnior, E.B.; Collevatti, R.G.; Telles, M.P.D.C.; Chaves, L.J.; Neres, D.F.; Soares, T.N. Short-distance pollen dispersal in a protogynous Annonaceae tree species from the Brazilian Cerrado. Plant Syst. Evol. 2018, 304, 1091–1099. [Google Scholar] [CrossRef]
- Fragoso, J.M.; Silvius, K.M.; Correa, J.A. Long-distance seed dispersal by tapirs increases seed survival and aggregates tropical trees. Ecology 2003, 84, 1998–2006. [Google Scholar] [CrossRef]
- Bonate, P.L. The effect of collinearity on parameter estimates in nonlinear mixed effect models. Pharm. Res. 1999, 16, 709–717. [Google Scholar] [CrossRef]
- Lima-Ribeiro, M.S.; Varela, S.; González-Hernández, J.; Oliveira, G.; Diniz-Filho, J.A.F.; Terribile, L.C. EcoClimate: A database of climate data from multiple models for past, present, and future for macroecologists and biogeographers. Biodivers. Inform. 2015, 10, 1–21. [Google Scholar] [CrossRef]
- Gosz, J.R.; Sharpe, P.J.H. Broad-scale concepts for interactions of climate, topography, and biota at biome transitions. Landsc. Ecol. 1989, 3, 229–243. [Google Scholar] [CrossRef]
- Cade, B.S.; Noon, B.R. A gentle introduction to quantile regression for ecologists. Front. Ecol. Environ. 2003, 1, 412–420. [Google Scholar] [CrossRef]
- Hadfield, J.D. MCMC methods for multi-response generalized linear mixed models: The MCMCglmm R package. J. Stat. Softw. 2010, 33, 1–22. [Google Scholar] [CrossRef]
- R Core Team. A Language and Environment for Statistical Computing; R Foundation for Statistical Computing: Vienna, Austria, 2019; Available online: https://cran.rproject.org/bin/windows/base/old/3.5.3/ (accessed on 4 February 2020).
- Burnham, K.P.; Anderson, D.R. Model Selection and Multimodel Inference, 2nd ed.; Springer: New York, NY, USA, 2002. [Google Scholar]
- Zuur, A.; Ieno, E.N.; Walker, N.; Saveliev, A.A.; Smith, G.M. Mixed Effects Models and Extensions in Ecology with R; Springer Science & Business Media: Berlin/Heidelberg, Germany, 2009. [Google Scholar]
- Wang, I.J. Examining the full effects of landscape heterogeneity on spatial genetic variation: A multiple matrix regression approach for quantifying geographic and ecological isolation. Evolution 2013, 67, 3403–3411. [Google Scholar] [CrossRef] [PubMed]
- Adamack, A.T.; Gruber, B. PopGenReport: Simplifying basic population genetic analyses in R. Methods Ecol. Evol. 2014, 5, 384–387. [Google Scholar] [CrossRef]
- Grose, S.O.; Olmstead, R.G. Taxonomic Revisions in the Polyphyletic Genus Tabebuia s. I. (Bignoniaceae). Syst. Bot. 2007, 33, 660–670. [Google Scholar] [CrossRef]
- Hamilton, J.A.; Eckert, C.G. Population genetic consequences of geographic disjunction: A prairie plant isolated on Great Lakes alvars. Mol. Ecol. 2007, 16, 1649–1660. [Google Scholar] [CrossRef]
- Pulliam, H.R. On the relationship between niche and distribution. Ecol. Lett. 2020, 3, 349–361. [Google Scholar] [CrossRef]
- Zinn, K.E.; Tunc-Ozdemir, M.; Harper, J.F. Temperature stress and plant sexual reproduction: Uncovering the weakest links. J. Exp. Bot. 2010, 61, 1959–1968. [Google Scholar] [CrossRef]
- Braasch, J.; Barker, B.S.; Dlugosch, K.M. Expansion history and environmental suitability shape effective population size in a plant invasion. Mol. Ecol. 2019, 28, 2546–2558. [Google Scholar] [CrossRef] [PubMed]
- Lázaro-Nogal, A.; Matesanz, S.; García-Fernández, A.; Traveset, A.; Valladares, F. Population size, center-periphery, and seed dispersers’ effects on the genetic diversity and population structure of the Mediterranean relict shrub Cneorum Tricoccon. Ecol Evol. 2017, 7, 7231–7242. [Google Scholar] [CrossRef]
- Arnaud-Haond, S.; Teixeira, S.; Massa, S.I.; Billot, C.; Saenger, P.; Coupland, G.; Serrao, E.A. Genetic structure at range edge: Low diversity and high inbreeding in Southeast Asian mangrove (Avicennia marina) populations. Mol. Ecol. 2006, 15, 3515–3525. [Google Scholar] [CrossRef]
- Gapare, W.J.; Aitken, S.N. Strong spatial genetic structure in peripheral but not core populations of Sitka spruce [Picea sitchensis (Bong.) Carr.]. Mol. Ecol. 2005, 14, 2659–2667. [Google Scholar] [CrossRef]
- Françoso, R.D.; Haidar, R.F.; Machado, R.B. Tree species of South America central savanna: Endemism, marginal areas and the relationship with other biomes. Acta Bot. Bras. 2016, 30, 78–86. [Google Scholar] [CrossRef]
- Crow, J.F.; Morton, N.E. Measurement of gene frequency drift in small populations. Evolution 1955, 9, 202–214. [Google Scholar] [CrossRef]
- Frankham, R. Relationship of genetic variation to population size in wildlife. Conserv. Biol. 1996, 10, 1500–1508. [Google Scholar] [CrossRef]
- Kimura, M.; Crow, J.F. The measurement of effective population number. Evolution 1963, 17, 279–288. [Google Scholar] [CrossRef]
- Wright, S. Size of population and breeding structure in relation to evolution. Science 1938, 87, 430–431. [Google Scholar]
- Mesquita, M.A.M.; Naves, R.V.; Souza, E.R.B.; Bernardes, T.G.; Silva, L.B. Caracterização de ambientes com alta ocorrência natural de araticum (Annona crassiflora Mart.) no estado de Goiás. Rev. Bras. Frutic. 2007, 29, 15–19. [Google Scholar] [CrossRef]
- Silva, R.S.M.; Chaves, L.J.; Naves, R.V. Caracterização de frutos e árvores de cagaita (Eugenia dysenterica DC.) no sudeste do Estado de Goiás, Brasil. Rev. Bras. Frutic. 2001, 23, 330–334. [Google Scholar] [CrossRef]
- Vieira, N.R.D.; da Silva, J.J.F.; Ledo, A.; da Mangaba, S. Fruticultura Tropical: Espécies Regionais e Exóticas; dos Santos Serejo, J.A., Dantas, J.L.L., Coelho, C.V.S., Coelho, Y.d.S., Eds.; Embrapa Informação Tecnológica: Brasilia/Distrito Federal, Brasil, 2009; pp. 323–338. [Google Scholar]
- Correa, R.P.; Lemos-Filho, J.P.; de Oliveira, B.R.S.; Lovato, M.B.; Heuertz, M. Species-specific phylogeographical patterns and Pleistocene east–west divergence in Annona (Annonaceae) in the Brazilian Cerrado. Bot. J. Linn. Soc. 2016, 181, 21–36. [Google Scholar] [CrossRef]
- Collevatti, R.G.; Rodrigues, E.E.; Vitorino, L.C.; Lima-Ribeiro, M.S.; Chaves, L.J.; Telles, M.P. Unravelling the genetic differentiation among varieties of the Neotropical savana tree Hancornia speciosa Gomes. Ann. Bot. 2018, 122, 973–984. [Google Scholar] [CrossRef] [PubMed]
- Cunningham-Minnick, M.J.; Peters, V.E.; Crist, T.O. Bee communities and pollination services in adjacent crop fields following flower removal in an invasive forest shrub. Ecol. Appl. 2020, 30, e02078. [Google Scholar] [CrossRef]
- Tscharntke, T.; Klein, A.M.; Kruess, A.; Steffan-Dewenter, I.; Thies, C. Landscape perspectives on agricultural intensification and biodiversity–ecosystem service management. Ecol. Lett. 2005, 8, 857–874. [Google Scholar] [CrossRef]
- Prevedello, J.A.; Almeida-Gomes, M.; Lindenmayer, D.B. The importance of scattered trees for biodiversity conservation: A global meta-analysis. J. Appl. Ecol. 2018, 55, 205–214. [Google Scholar] [CrossRef]
- Gonçalves, F.R.; Vieira, F.A.; Carvalho, D. Naturally fragmented but not genetically isolated populations of Podocarpus sellowii Klotzsch (Podocarpaceae) in southeast Brazil. Genet. Mol. Res. 2016, 15, 1–17. [Google Scholar] [CrossRef] [PubMed]
- Beheregaray, L.B.; Cooke, G.M.; Chao, N.L.; Landguth, E.L. Ecological speciation in the tropics: Insights from comparative genetic studies in Amazonia. Front. Genet. 2015, 5, 477. [Google Scholar] [CrossRef]
- Cook, B.D.; Kennard, M.J.; Real, K.; Pusey, B.J.; Hughes, J.M. Landscape genetic analysis of the tropical freshwater fish Mogurnda mogurnda (Eleotridae) in a monsoonal river basin: Importance of hydrographic factors and population history. Freshw. Biol. 2011, 56, 812–827. [Google Scholar] [CrossRef]
- Sebbenn, A. Effects of forest fragmentation on the effective and realized gene flow of Neotropical tree species: Implications for genetic conservation. BMC Proc. 2011, 5, 6. [Google Scholar] [CrossRef]
- Miles, L.S.; Rivkin, L.R.; Johnson, M.T.J.; Munshi-South, J.; Verrelli, B.C. Gene flow and genetic drift in urban environments. Mol. Ecol. 2019, 28, 4138–4151. [Google Scholar] [CrossRef]
- Nascimento, V.T.; Agostini, K.; Souza, C.S.; Maruyama, P.K. Tropical urban areas support highly diverse plant-pollinator interactions: An assessment from Brazil. Landsc. Urban Plan. 2020, 198, 103801. [Google Scholar] [CrossRef]
- Diniz, U.M.; Lima, S.A.; Machado, I.C. Short-distance pollen dispersal by bats in an urban setting: Monitoring the movement of a vertebrate pollinator through fluorescent dyes. Urban Ecosyst. 2019, 22, 281–291. [Google Scholar] [CrossRef]
- Gribel, R.; Hay, J.D. Pollination ecology of Caryocar brasiliense (Caryocaraceae) in Central Brazil cerrado vegetation. J. Trop. Ecol. 1993, 9, 199–211. [Google Scholar] [CrossRef]
- Barros, M.G. Pollination ecology of Tabebuia aurea (Manso) Benth. & Hook. and T. ochracea (Cham.) Standl. (Bignoniaceae) in Central Brazil cerrado vegetation. Rev. Bras. Bot. 2001, 24, 255–261. [Google Scholar] [CrossRef]
- Fava, W.S.; da Costa, P.C.; Lorenz, A.P. Ecological niche modelling and genetic analyses reveal lack of geographic differentiation of Leptolobium dasycarpum (Leguminosae, Papilionoideae) across the Brazilian savannah. Flora 2020, 264, 151566. [Google Scholar] [CrossRef]
- Diniz-Filho, J.A.F.; Soares, T.N.; Lima, J.S.; Dobrovolski, R.; Landeiro, V.L.; Telles, M.P.D.C.; Bini, L.M. Mantel test in population genetics. Genet. Mol. Biol. 2013, 36, 475–485. [Google Scholar] [CrossRef]
- Zucchi, M.I.; Brondani, R.P.V.; Pinheiro, J.B.; Chaves, L.J.; Coelho, A.S.G.; Vencovsky, R. Genetic structure and gene flow in Eugenia dysenterica DC in the Brazilian Cerrado utilizing SSR markers. Genet. Mol. Biol. 2003, 26, 449–457. [Google Scholar] [CrossRef][Green Version]
- Batistini, A.P.; Telles, M.P.D.C.; Bertoni, B.W.; Coppede, J.D.S.; Môro, F.V.; Pereira, A.M.S.; França, S.D.C. Genetic diversity of natural populations of Anemopaegma arvense (Bignoniaceae) in the Cerrado of São Paulo State, Brazil. Genet. Mol. Res. 2009, 8, 52–63. [Google Scholar] [CrossRef]
- Bonte, D.; Travis, J.M.; De Clercq, N.; Zwertvaegher, I.; Lens, L. Thermal conditions during juvenile development affect adult dispersal in a spider. Proc. Natl. Acad. Sci. USA 2008, 105, 17000–17005. [Google Scholar] [CrossRef]
- Hedhly, A. Sensitivity of flowering plant gametophytes to temperature fluctuations. Environ. Exp. Bot. 2011, 74, 9–16. [Google Scholar] [CrossRef]
- Dusenge, M.E.; Duarte, A.G.; Way, D.A. Plant carbon metabolism and climate change: Elevated CO2 and temperature impacts on photosynthesis, photorespiration and respiration. New Phytol. 2019, 221, 32–49. [Google Scholar] [CrossRef]
- Grace, J. Climatic tolerance and the distribution of plants. New Phytol. 1987, 106, 113–130. [Google Scholar] [CrossRef]
- Pauls, S.U.; Nowak, C.; Bálint, M.; Pfenninger, M. The impact of global climate change on genetic diversity within populations and species. Mol. Ecol. 2013, 22, 925–946. [Google Scholar] [CrossRef] [PubMed]
- Kramer, K.; Degen, B.; Buschbom, J.; Hickler, T.; Thuiller, W.; Sykes, M.T.; de Winter, W. Modelling exploration of the future of European beech (Fagus sylvatica L.) under climate change—Range, abundance, genetic diversity and adaptive response. For. Ecol. Manag. 2010, 259, 2213–2222. [Google Scholar] [CrossRef]
- Doi, H.; Takahashi, M.; Katano, I. Genetic diversity increases regional variation in phenological dates in response to climate change. Glob. Chang. Biol. 2010, 16, 373–379. [Google Scholar] [CrossRef]
- Dubey, S.; Pike, D.A.; Shine, R. Predicting the impacts of climate change on genetic diversity in an endangered lizard species. Clim. Chang. 2013, 117, 319–327. [Google Scholar] [CrossRef]


| Class | Abbreviation | Description |
|---|---|---|
| Agriculture | AG | Farmland planted with annual or perennial crops |
| Water | WA | Natural or artificial bodies of water |
| Urban area | UA | Areas of urban development |
| Vegetation Remnant | VR | Remnant areas of native vegetation |
| Pasture | PA | Areas of cattle ranching, with no arboreal vegetation |
| Forestry | FO | Areas of preservation and restoration of native forests |
| Variable | Code | Description |
|---|---|---|
| Bio 01—Mean Annual Temperature | MAT | |
| Bio 03—Isothermality | ISO | (Mean Diurnal Range/BIO7) (* 100) |
| Bio 07—Annual Temperature Range | ATR | (Max Temperature of Warmest Month–Min Temperature of Coldest Month) |
| Bio 09—Mean Temperature of Driest Quarter | TDQ | |
| Bio 12—Annual Precipitation | AP | |
| Bio 15—Precipitation Seasonality | PS | (Coefficient of Variation) |
| Bio 18—Precipitation of the Warmest Quarter | PWQ |
| Species or Subspecies | Number of Individuals | Number of Populations | HO | HE | AR | Fis |
|---|---|---|---|---|---|---|
| Annona coriacea Mart. | 55 | 3 | 0.658 | 0.696 | 7.333 | 0.022 |
| Annona crassiflora Mart. | 104 | 2 | 0.766 | 0.842 | 17.65 | 0.089 |
| Aspidosperma polyneuron Müll.Arg. | 30 | 1 | 0.430 | 0.650 | 7.060 | 0.301 |
| Campomanesia adamantium (Cambess.) O.Berg | 207 | 3 | 0.586 | 0.563 | 5.333 | −0.030 |
| Caryocar brasiliense A.St.-Hil. | 101 | 1 | 0.764 | 0.874 | 16.100 | 0.131 |
| Copaifera langsdorffii Desf. | 886 | 6 | 0.697 | 0.873 | 15.975 | 0.205 |
| Dimorphandra mollis Benth. | 157 | 19 | 0.439 | 0.589 | 3.652 | 0.255 |
| Dipteryx alata Vogel | 166 | 8 | 0.333 | 0.418 | 3.312 | 0.208 |
| Eugenia dysenterica DC. | 127 | 10 | 0.458 | 0.427 | 3.128 | −0.062 |
| Euterpe edulis Mart. | 883 | 2 | 0.693 | 0.748 | 10.400 | 0.075 |
| Ficus eximia Schott. | 60 | 1 | 0.711 | 0.879 | 17.750 | 0.191 |
| Hancornia speciosa var. cuyabensis Malme | 164 | 5 | 0.591 | 0.689 | 4.020 | 0.144 |
| Hancornia speciosa var. gardinerii (A.DC.) Müll.Arg. | 379 | 14 | 0.639 | 0.700 | 4.272 | 0.090 |
| Hancornia speciosa var. pubescens (Nees & Mart.) Müll.Arg. | 146 | 6 | 0.682 | 0.737 | 4.643 | 0.078 |
| Hancornia speciosa var. speciosa | 97 | 3 | 0.604 | 0.677 | 4.163 | 0.099 |
| Handroanthus chrysotrichus (Mart. ex DC.) Mattos | 98 | 1 | 0.888 | 0.906 | 15.000 | 0.021 |
| Handroanthus serratifolius (Vahl) S.O.Grose | 108 | 1 | 0.646 | 0.857 | 17.200 | 0.245 |
| Handroanthus impetiginosus (Mart. ex DC.) Mattos | 75 | 1 | 0.703 | 0.857 | 11.800 | 0.199 |
| Hymenaea courbaril L. | 241 | 1 | 0.586 | 0.813 | 14.200 | 0.284 |
| Manihot esculenta Crantz | 219 | 7 | 0.315 | 0.568 | 3.551 | 0.435 |
| Metrodorea nigra A.St.-Hil. | 40 | 1 | 0.353 | 0.588 | 4.000 | 0.403 |
| Oryza glumaepatula Steud. | 195 | 7 | 0.078 | 0.211 | 1.572 | 0.667 |
| Plathymenia reticulata Benth. | 111 | 2 | 0.729 | 0.739 | 7.388 | 0.013 |
| Qualea grandiflora Mart. | 500 | 5 | 0.541 | 0.794 | 12.120 | 0.320 |
| Qualea multiflora Mart. | 20 | 1 | 0.578 | 0.618 | 5.750 | 0.064 |
| Qualea parviflora Mart. | 20 | 1 | 0.607 | 0.598 | 7.500 | −0.015 |
| Solanum crinitum Lam. | 120 | 2 | 0.443 | 0.492 | 14.000 | 0.099 |
| Solanum lycocarpum A.St.-Hil. | 120 | 2 | 0.418 | 0.368 | 19.000 | −0.133 |
| Tabebuia aurea (Silva Manso) Benth. & Hook.f. ex S.Moore | 260 | 1 | 0.765 | 0.947 | 36.000 | 0.178 |
| Tabebuia roseoalba (Ridl.) Sandwith | 690 | 2 | 0.716 | 0.831 | 11.300 | 0.158 |
| Vellozia gigantea N.L.Menezes & Mello-Silva | 24 | 3 | 0.500 | 0.645 | 5.398 | 0.220 |
| Mean ± SD | 206.55 ± 230.35 | 3.903 ± 4.190 | 0.578 ± 0.170 | 0.684 ± 0.176 | 10.018 ± 7.235 | 0.159 ± 0.161 |
| Model | ∆AICc | wAIC | K | β | p |
| 1 km | |||||
| HO vs. Species + FO + Matrix | 0.0 | 0.7720 | 6 | 0.021 | - |
| HO vs. Species + WA + Matrix | 3.3 | 0.0037 | 6 | 0.015 | 1.000 |
| HO vs. Species + AG + Matrix | 6.7 | <0.001 | 6 | 0.012 | 1.000 |
| HO vs. Species + VR + Matrix | 7.3 | <0.001 | 6 | 0.015 | 1.000 |
| HO vs. Species + UA + Matrix | 7.6 | <0.001 | 6 | 0.001 | 1.000 |
| HO vs. Species + PA + Matrix | 8.2 | <0.001 | 6 | 0.016 | 1.000 |
| HO vs. Full Model | 68.2 | <0.001 | 11 | 0.012 | 0.432 |
| 3 km | |||||
| HO vs. Species + FO + Matrix | 0.0 | 0.6330 | 6 | 0.022 | - |
| HO vs. Species + WA + Matrix | 2.4 | 0.1690 | 6 | 0.019 | 1.000 |
| HO vs. Species + VR + Matrix | 4.4 | 0.0015 | 6 | 0.025 | 1.000 |
| HO vs. Species + AG + Matrix | 4.6 | <0.001 | 6 | 0.022 | 1.000 |
| HO vs. Species + UA + Matrix | 5.8 | <0.001 | 6 | 0.023 | 1.000 |
| HO vs. Species + PA + Matrix | 6.1 | <0.001 | 6 | 0.022 | 1.000 |
| HO vs. Full Model | 64.9 | <0.001 | 11 | 0.015 | 0.231 |
| 5 km | |||||
| HO vs. Species + FO + Matrix | 0.0 | 0.6410 | 6 | 0.001 | - |
| HO vs. Species + WA + Matrix | 2.7 | 0.1630 | 6 | 0.000 | 1.000 |
| HO vs. Species + AG + Matrix | 3.8 | 0.0950 | 6 | 0.002 | 1.000 |
| HO vs. Species + PA + Matrix | 5.7 | 0.0370 | 6 | 0.002 | 1.000 |
| HO vs. Species + UA + Matrix | 6.0 | 0.0330 | 6 | 0.000 | 1.000 |
| HO vs. Species + VR + Matrix | 6.0 | 0.0310 | 6 | 0.003 | 1.000 |
| HO vs. Full Model | 62.9 | <0.001 | 11 | 0.001 | 0.321 |
| Model | ∆AICc | wAIC | K | β | p |
| 1 km | |||||
| HE vs. Species + WA + Matrix | 0.0 | 0.9120 | 6 | −0.002 | 0.000 |
| HE vs. Species + PA + Matrix | 7.3 | 0.0023 | 6 | −0.005 | 0.000 |
| HE vs. Species + AG + Matrix | 7.8 | 0.0019 | 6 | −0.002 | 0.000 |
| HE vs. Species + UA + Matrix | 7.9 | 0.0018 | 6 | −0.007 | 0.000 |
| HE vs. Species + FO + Matrix | 8.2 | 0.0015 | 6 | −0.007 | - |
| HE vs. Species + VR + Matrix | 8.6 | 0.0013 | 6 | −0.002 | 0.000 |
| HE vs. Full Model | 69.2 | <0.001 | 11 | −0.005 | 0.026 |
| 3 km | |||||
| HE vs. Species + WA + Matrix | 0.0 | 0.3300 | 6 | −0.002 | 0.000 |
| HE vs. Species + VR + Matrix | 1.3 | 0.1700 | 6 | −0.005 | 0.000 |
| HE vs. Species + FO + Matrix | 1.5 | 0.1590 | 6 | −0.002 | - |
| HE vs. Species + AG + Matrix | 1.6 | 0.1450 | 6 | −0.007 | 0.000 |
| HE vs. Species + UA + Matrix | 2.2 | 0.1090 | 6 | −0.007 | 0.000 |
| HE vs. Species + PA + Matrix | 2.7 | 0.0870 | 6 | −0.002 | 0.000 |
| HE vs. Full Model | 65.0 | <0.001 | 11 | −0.005 | 0.122 |
| 5 km | |||||
| HE vs. Species + WA + Matrix | 0.0 | 0.3550 | 6 | −0.074 | 0.000 |
| HE vs. Species + FO + Matrix | 0.6 | 0.2680 | 6 | −0.063 | - |
| HE vs. Species + AG + Matrix | 1.7 | 0.1500 | 6 | −0.063 | 1.000 |
| HE vs. Species + UA + Matrix | 2.1 | 0.1220 | 6 | −0.072 | 0.000 |
| HE vs. Species + VR + Matrix | 3.6 | 0.0580 | 6 | −0.062 | 1.000 |
| HE vs. Species + PA + Matrix | 4.0 | 0.0470 | 6 | −0.069 | 1.000 |
| HE vs. Full Model | 64.1 | <0.001 | 11 | −0.077 | 0.345 |
| Model | ∆AICc | wAIC | K | β | p |
| 1 km | |||||
| AR vs. Species + UA + Matrix | 0.0 | 0.3820 | 6 | 0.692 | 0.000 |
| AR vs. Species + WA + Matrix | 0.5 | 0.3000 | 6 | 0.740 | 0.000 |
| AR vs. Species + PA + Matrix | 1.4 | 0.1930 | 6 | 0.835 | 0.000 |
| AR vs. Species + AG + Matrix | 4.1 | 0.0049 | 6 | 0.661 | 0.000 |
| AR vs. Species + FO + Matrix | 4.3 | 0.0045 | 6 | 0.683 | - |
| AR vs. Species + VR + Matrix | 5.0 | 0.0031 | 6 | 0.716 | 0.000 |
| AR vs. Full Model | 40.1 | <0.001 | 11 | 0.869 | 0.088 |
| 3 km | |||||
| AR vs. Species + UA + Matrix | 0.0 | 0.3350 | 6 | −0.169 | 0.000 |
| AR vs. Species + WA + Matrix | 0.9 | 0.2050 | 6 | 0.071 | 0.000 |
| AR vs. Species + AG + Matrix | 1.1 | 0.1920 | 6 | −0.054 | 0.000 |
| AR vs. Species + PA + Matrix | 2.2 | 0.1090 | 6 | 0.050 | 0.000 |
| AR vs. Species + FO + Matrix | 2.3 | 0.1030 | 6 | 0.016 | - |
| AR vs. Species + VR + Matrix | 3.2 | 0.0670 | 6 | 0.029 | 0.000 |
| AR vs. Full Model | 37.0 | <0.001 | 11 | −0.184 | 0.108 |
| 5 km | |||||
| AR vs. Species + UA + Matrix | 0.0 | 0.3600 | 6 | −0.317 | 0.000 |
| AR vs. Species + WA + Matrix | 0.5 | 0.2800 | 6 | −0.354 | 1.000 |
| AR vs. Species + FO + Matrix | 1.3 | 0.1920 | 6 | −0.152 | - |
| AR vs. Species + AG + Matrix | 3.3 | 0.0690 | 6 | −0.359 | 0.000 |
| AR vs. Species + PA + Matrix | 3.5 | 0.0620 | 6 | −0.164 | 0.000 |
| AR vs. Species + VR + Matrix | 4.5 | 0.0380 | 6 | −0.214 | 1.000 |
| AR vs. Full Model | 31.3 | <0.001 | 11 | −0.201 | 1.000 |
| Model | ∆AICc | wAIC | K | β | p-Value |
| 1 km | |||||
| Fis vs. Species + FO + Matrix | 0.0 | 0.6100 | 6 | −0.029 | - |
| Fis vs. Species + WA + Matrix | 2.9 | 0.1460 | 6 | −0.003 | 1.000 |
| Fis vs. Species + UA + Matrix | 3.4 | 0.0023 | 6 | −0.024 | 1.000 |
| Fis vs. Species + PA + Matrix | 3.8 | 0.0017 | 6 | −0.022 | 1.000 |
| Fis vs. Species + AG + Matrix | 6.7 | <0.001 | 6 | −0.031 | 1.000 |
| Fis vs. Species + VR + Matrix | 6.9 | <0.001 | 6 | −0.029 | 1.000 |
| Fis vs. Full Model | 65.7 | <0.001 | 11 | −0.017 | 0.321 |
| 3 km | |||||
| Fis vs. Species + UA + Matrix | 0.0 | 0.6920 | 6 | 0.048 | 0.000 |
| Fis vs. Species + FO + Matrix | 3.0 | 0.1560 | 6 | 0.059 | - |
| Fis vs. Species + WA + Matrix | 5.0 | 0.0058 | 6 | 0.062 | 1.000 |
| Fis vs. Species + PA + Matrix | 5.2 | <0.001 | 6 | 0.055 | 1.000 |
| Fis vs. Species + VR + Matrix | 6.7 | <0.001 | 6 | 0.064 | 1.000 |
| Fis vs. Species + AG + Matrix | 7.2 | <0.001 | 6 | 0.062 | 1.000 |
| Fis vs. Full Model | 62.4 | <0.001 | 11 | 0.044 | 0.061 |
| 5 km | |||||
| Fis vs. Species + UA + Matrix | 0.0 | 0.5190 | 6 | −0.036 | 0.000 |
| Fis vs. Species + FO + Matrix | 2.2 | 0.1740 | 6 | −0.030 | - |
| Fis vs. Species + PA + Matrix | 2.6 | 0.1390 | 6 | −0.028 | 0.000 |
| Fis vs. Species + WA + Matrix | 2.8 | 0.1290 | 6 | −0.026 | 1.000 |
| Fis vs. Species + AG + Matrix | 6.4 | 0.0220 | 6 | −0.028 | 1.000 |
| Fis vs. Species + VR + Matrix | 6.7 | 0.0180 | 6 | −0.030 | 1.000 |
| Fis vs. Full Model | 58.6 | <0.001 | 11 | −0.037 | 0.055 |
| Model | ∆AICc | wAIC | K | β | p |
|---|---|---|---|---|---|
| HO vs. Species + MAT + Matrix | 0.0 | 0.9949 | 6 | 0.003 | 0.000 |
| HO vs. Species + PWQ + Matrix | 12.9 | 0.0016 | 6 | 0.003 | 0.002 |
| HO vs. Species + PS + Matrix | 13.3 | 0.0013 | 6 | 0.006 | 0.025 |
| HO vs. Species + TDQ + Matrix | 13.8 | <0.001 | 6 | 0.005 | 0.002 |
| HO vs. Species + Matrix | 14.4 | <0.001 | 5 | 0.001 | - |
| HO vs. Species + ISO + Matrix | 16.4 | <0.001 | 6 | 0.000 | 0.348 |
| HO vs. Species + ATR + Matrix | 17.6 | <0.001 | 6 | 0.001 | 0.456 |
| HO vs. Species + AP + Matrix | 20.3 | <0.001 | 6 | 0.001 | 0.920 |
| HO vs. Full Model | 24.1 | <0.001 | 12 | 0.000 | 0.000 |
| HE vs. Species + MAT + Matrix | 0.0 | 0.7116 | 6 | −0.001 | 0.005 |
| HE vs. Species + Matrix | 3.4 | 0.1318 | 5 | 0.006 | - |
| HE vs. Species + PS + Matrix | 5.1 | 0.0557 | 6 | 0.000 | 0.136 |
| HE vs. Species + ISO + Matrix | 6.3 | 0.0308 | 6 | 0.006 | 0.965 |
| HE vs. Species + ATR + Matrix | 7.0 | 0.0217 | 6 | 0.008 | 0.628 |
| HE vs. Species + TDQ + Matrix | 7.1 | 0.0210 | 6 | 0.000 | 0.020 |
| HE vs. Species + PWQ + Matrix | 7.5 | 0.0167 | 6 | −0.002 | 0.059 |
| HE vs. Species + AP + Matrix | 9.2 | 0.0073 | 6 | 0.008 | 0.665 |
| HE vs. Full Model | 25.0 | <0.001 | 12 | −0.004 | 0.087 |
| AR vs. Full Model | 0.0 | 0.7116 | 12 | −1.088 | 0.005 |
| AR vs. Species + PS + Matrix | 13.2 | 0.1318 | 6 | −0.826 | 0.036 |
| AR vs. Species + MAT + Matrix | 13.6 | 0.0557 | 6 | −0.945 | 0.037 |
| AR vs. Species + PWQ + Matrix | 14.7 | 0.0308 | 6 | −1.033 | 0.010 |
| AR vs. Species + ISO + Matrix | 15.4 | 0.0217 | 6 | −0.990 | 0.317 |
| AR vs. Species + ATR + Matrix | 16.4 | 0.0210 | 6 | −0.916 | 0.331 |
| AR vs. Species + AP + Matrix | 18.3 | 0.0167 | 6 | −0.874 | 0.269 |
| AR vs. Species + TDQ + Matrix | 19.0 | 0.0073 | 6 | −0.904 | 0.059 |
| Ra vs. Species + Matrix | 19.3 | <0.001 | 5 | −0.931 | 0.068 |
| Fis vs. Species + ISO + Matrix | 0.0 | 0.3530 | 12 | −0.012 | 0.049 |
| Fis vs. Species + MAT + Matrix | 0.8 | 0.2380 | 6 | −0.006 | 0.036 |
| Fis vs. Species + Matrix | 1.3 | 0.1870 | 6 | −0.014 | 0.037 |
| Fis vs. Species + ATR + Matrix | 2.9 | 0.0810 | 6 | −0.011 | 0.187 |
| Fis vs. Species + PS + Matrix | 3.2 | 0.0710 | 6 | −0.011 | 0.204 |
| Fis vs. Species + AP + Matrix | 4.4 | 0.0401 | 6 | −0.017 | 0.115 |
| Fis vs. Species + PWQ + Matrix | 5.3 | 0.0250 | 6 | −0.003 | 0.075 |
| Fis vs. Species + TDQ + Matrix | 8.5 | 0.0005 | 6 | −0.011 | 0.268 |
| Fis vs. Full Model | 21.2 | <0.001 | 5 | −0.005 | 0.167 |
| Landscape—1 km | |||||||||||
| HO | HE | AR | Fis | ||||||||
| p | R2 | p | R2 | p | R2 | p | R2 | ||||
| Intercept | 0.91 | 0.083 | Intercept | 0.788 | 0.038 | Intercept | 0.494 | 0.030 | Intercept | 0.993 | 0.109 |
| Geo distance | 0.263 | 0.007 | Geo distance | 0.833 | 0.077 | Geo distance | 0.047 | 0.246 | Geo distance | 0.057 | 0.006 |
| AG | 0.890 | 0.083 | AG | 0.580 | 0.038 | AG | 0.835 | 0.028 | AG | 0.054 | 0.109 |
| WA | 0.001 | 0.007 | WA | 0.030 | 0.077 | WA | 0.799 | 0.246 | WA | 0.007 | 0.006 |
| UA | 0.623 | 0.083 | UA | 0.389 | 0.038 | UA | 0.978 | 0.028 | UA | 0.171 | 0.109 |
| PA | 0.614 | 0.007 | PA | 0.039 | 0.077 | PA | 0.933 | 0.246 | PA | 0.430 | 0.006 |
| VR | 0.579 | 0.082 | VR | 0.474 | 0.038 | VR | 0.003 | 0.028 | VR | 0.035 | 0.109 |
| FO | 0.272 | 0.007 | FO | 0.949 | 0.077 | FO | 0.090 | 0.246 | FO | 0.095 | 0.006 |
| Landscape—3 km | |||||||||||
| p | R2 | p | R2 | p | R2 | p | R2 | ||||
| Intercept | 0.505 | 0.023 | Intercept | 0.308 | 0.014 | Intercept | 0.592 | 0.034 | Intercept | 0.736 | 0.019 |
| Geo distance | 0.045 | 0.248 | Geo distance | 0.618 | 0.504 | Geo distance | 0.143 | 0.191 | Geo distance | 0.026 | 0.503 |
| AG | 0.255 | 0.024 | AG | 0.715 | 0.014 | AG | 0.482 | 0.034 | AG | 0.893 | 0.020 |
| WA | 0.178 | 0.248 | WA | 0.076 | 0.504 | WA | 0.304 | 0.191 | WA | 0.659 | 0.503 |
| UA | 0.879 | 0.023 | UA | 0.962 | 0.014 | UA | 0.060 | 0.034 | UA | 0.989 | 0.020 |
| PA | 0.707 | 0.248 | PA | 0.701 | 0.504 | PA | 0.511 | 0.191 | PA | 0.222 | 0.503 |
| VR | 0.191 | 0.024 | VR | 0.103 | 0.014 | VR | 0.699 | 0.034 | VR | 0.198 | 0.020 |
| FO | 0.095 | 0.248 | FO | 0.639 | 0.504 | FO | 0.073 | 0.191 | FO | 0.585 | 0.503 |
| Landscape—5 km | |||||||||||
| p | R2 | p | R2 | p | R2 | p | R2 | ||||
| Intercept | 0.175 | 0.038 | Intercept | 0.173 | 0.023 | Intercept | 0.649 | 0.060 | Intercept | 0.478 | 0.023 |
| Geo distance | 0.034 | 0.079 | Geo distance | 0.415 | 0.215 | Geo distance | 0.211 | 0.051 | Geo distance | 0.021 | 0.400 |
| AG | 0.178 | 0.038 | AG | 0.661 | 0.023 | AG | 0.188 | 0.060 | AG | 0.827 | 0.023 |
| WA | 0.142 | 0.079 | WA | 0.057 | 0.215 | WA | 0.191 | 0.051 | WA | 0.507 | 0.400 |
| UA | 0.651 | 0.038 | UA | 0.877 | 0.023 | UA | 0.031 | 0.060 | UA | 0.397 | 0.023 |
| PA | 0.172 | 0.079 | PA | 0.053 | 0.215 | PA | 0.799 | 0.051 | PA | 0.157 | 0.400 |
| VR | 0.191 | 0.038 | VR | 0.165 | 0.023 | VR | 0.510 | 0.060 | VR | 0.309 | 0.023 |
| FO | 0.033 | 0.079 | FO | 0.207 | 0.215 | FO | 0.333 | 0.051 | FO | 0.635 | 0.400 |
| Climate | |||||||||||
| p | R2 | p | R2 | p | R2 | p | R2 | ||||
| Intercept | 0.885 | 0.038 | Intercept | 0.886 | 0.024 | Intercept | 0.859 | 0.064 | Intercept | 1.000 | 0.048 |
| Geo distance | 0.345 | 0.018 | Geo distance | 0.382 | 0.076 | Geo distance | 0.009 | 0.015 | Geo distance | 0.231 | 0.018 |
| TDQ | 0.005 | 0.038 | TDQ | 0.172 | 0.024 | TDQ | 0.646 | 0.064 | TDQ | 0.173 | 0.048 |
| PWQ | 0.054 | 0.018 | PWQ | 0.757 | 0.076 | PWQ | 0.046 | 0.015 | PWQ | 0.015 | 0.018 |
| PS | 0.162 | 0.038 | PS | 0.901 | 0.024 | PS | 0.658 | 0.064 | PS | 0.642 | 0.048 |
| AP | 0.223 | 0.018 | AP | 0.204 | 0.076 | AP | 0.370 | 0.015 | AP | 0.474 | 0.018 |
| ATR | 0.527 | 0.038 | ATR | 0.675 | 0.024 | ATR | 0.192 | 0.064 | ATR | 0.507 | 0.048 |
| MAT | 0.001 | 0.018 | MAT | 0.002 | 0.076 | MAT | 0.026 | 0.015 | MAT | 0.004 | 0.018 |
| ISO | 0.950 | 0.038 | ISO | 0.310 | 0.024 | ISO | 0.001 | 0.064 | ISO | 0.015 | 0.048 |
Publisher’s Note: MDPI stays neutral with regard to jurisdictional claims in published maps and institutional affiliations. |
© 2020 by the authors. Licensee MDPI, Basel, Switzerland. This article is an open access article distributed under the terms and conditions of the Creative Commons Attribution (CC BY) license (http://creativecommons.org/licenses/by/4.0/).
Share and Cite
Vitorino, L.C.; Reis, M.N.O.; Bessa, L.A.; Souza, U.J.B.d.; Silva, F.G. Landscape and Climate Influence the Patterns of Genetic Diversity and Inbreeding in Cerrado Plant Species. Diversity 2020, 12, 421. https://doi.org/10.3390/d12110421
Vitorino LC, Reis MNO, Bessa LA, Souza UJBd, Silva FG. Landscape and Climate Influence the Patterns of Genetic Diversity and Inbreeding in Cerrado Plant Species. Diversity. 2020; 12(11):421. https://doi.org/10.3390/d12110421
Chicago/Turabian StyleVitorino, Luciana Cristina, Mateus Neri Oliveira Reis, Layara Alexandre Bessa, Ueric José Borges de Souza, and Fabiano Guimarães Silva. 2020. "Landscape and Climate Influence the Patterns of Genetic Diversity and Inbreeding in Cerrado Plant Species" Diversity 12, no. 11: 421. https://doi.org/10.3390/d12110421
APA StyleVitorino, L. C., Reis, M. N. O., Bessa, L. A., Souza, U. J. B. d., & Silva, F. G. (2020). Landscape and Climate Influence the Patterns of Genetic Diversity and Inbreeding in Cerrado Plant Species. Diversity, 12(11), 421. https://doi.org/10.3390/d12110421