Review

Urban Re-Greening: A Case Study in Multi-Trophic Biodiversity and Ecosystem Functioning in a Post-Industrial Landscape

1
Department of Landscape Architecture, the State University of New Jersey, New Brunswick, NJ 07043, USA
2
Department of Chemistry and Biochemistry, Montclair State University, Montclair, NJ 07043, USA
3
Department of Earth and Environmental Sciences, Montclair State University, Montclair, NJ 07043, USA
4
Department of Biology, Rutgers the State University of New Jersey, Newark, NJ 07043, USA
5
Department of Biology, Montclair State University, Montclair, NJ 07043, USA
*
Author to whom correspondence should be addressed.
Diversity 2018, 10(4), 119; https://doi.org/10.3390/d10040119
Submission received: 31 July 2018 / Revised: 5 October 2018 / Accepted: 9 October 2018 / Published: 1 November 2018
(This article belongs to the Special Issue Food Webs, Ecosystem Functioning and Environmental Quality)

Abstract

:
The biodiversity of urban and post-industrial ecosystems is a highly relevant and growing new frontier in ecological research. Even so, the functionality of these ecosystems may not always be successfully predicted based on prior biodiversity and ecosystem functioning theory. Indeed, evidence suggests that the general biological impoverishment within the urban context envisioned thirty years ago was overstated. Many of the world’s urban centers support some degree of biodiversity that is indigenous, as well as a complex array of non-native species, resulting in highly functional, and often, novel communities. For over two decades, a multi-disciplinary team has examined the sub-lethal impact of soil metal contamination on the multi-trophic biodiversity and ecosystem functioning of a post-industrial brownfield in the New York City metropolitan area. We do this through examinations of photosynthesis, carbon allocation, and soil enzyme activity as well as multi-trophic metal translocation via the plant and rhizosphere. In this paper, we synthesize the findings of our research network and apply the results to a framework of functional diversity. Due to the unique constraints many post-industrial lands impose on communities, functional diversity may be more meaningful to ecosystem health than species richness.

1. Introduction

The perception of the urban environment as biologically depressed has been pervasive for approximately four decades. Most of the focus was justified using the cascading impacts of habitat destruction and/or chemical contamination [1]. Such work took the traditional approach of comparing an index of measured diversity at an urban or disturbed site to a hypothetical historic reference. These reports generally subscribed to the theory that species richness could be positively correlated with ecosystem stability and function (i.e., health) [2,3]. This perception and the data are compounded by the fact that most development tends to occur in areas that are/were biologically rich, and therefore, species losses tend to be great [4,5]. These studies may have skewed our perception of biodiversity and the functioning of communities within the urban context. However, in recent years, this assumption has been challenged. Attention to urban ecology and human impacted ecosystems is a growing and highly relevant field of ecological research (e.g., [6,7,8]), and indeed, research is finding that these ecosystems can be quite biodiverse and exhibit high ecological functioning despite stress and selective pressure on those communities (i.e., [9,10]). This has been seen in habitats as extreme as the street islands of New York City with respect to insects [11].
The stressors associated with the urban environment are undeniable, and by the 1990s, research was being conducted to elucidate the ecology of urban areas. As more researchers [12,13,14,15] began to look closely at the relationships between disturbed areas and their biodiversity, new models began to emerge. For example, Adler and Tanner [16] suggested that the relationship between biological diversity and hardscape development in cities is not linear. Rather, it is best represented as a threshold where diversity increases with development to a certain point after which it rapidly declines. However, despite the decline in biodiversity, biomass may continue to increase even within the urban core, as development often provides abundant food resources for a select group of species. In addition, over the last several decades, postindustrial sites are being increasingly abandoned and are therefore available for biotic colonization. While these abandoned sites provide open space for vegetative and habitat development, they lack a traditional ecological/successional legacy and tend not to respond as expected either in natural recovery or through traditional restoration techniques [17,18,19]. Such communities often develop along gradients, which are best characterized by unique trajectories in community composition and therefore biodiversity [20]. Within this context, traditional paradigms that correlate high species diversity with system stability and high function [21,22,23] may not apply. These observations are opening a new frontier in the way we measure and value urban biological diversity.
Urban centers and sites of intense anthropogenic use are situated within a mosaic of landscape level effects on biodiversity and trophic interactions among species. Such urban communities are shaped differently than more pristine environments. The transition between developed and undeveloped lands, which serve as the regional pool and source of regional diversity, is often abrupt, irregular or fragmented. Furthermore, as the occurrence of many species can be human facilitated, the regional species pool may actually be global in nature [24] even when many urban species are regionally endemic [10]. While this may sound contradictory, the net effect of long-range anthropogenically facilitated dispersal is the establishment of certain species often in areas of high human population density, and urban environments are not necessarily recruiting species from a similar regional area. Rather, anthropogenic and, often, selective [25] abiotic filters tend to determine community composition and subsequent dynamics. Therefore, urban and post-industrial biodiversity may best be described by assembly theory, where species composition over time is not defined by an ecological legacy, but rather seen as the result of biotic, abiotic and socioeconomic filters [26]. In summary, and essential to the case study we will present here, we argue that the success of species within and the biodiversity of urban environments are affected more by their functional traits and less by their historical legacy.
In this paper, we synthesize the results of a multi-disciplinary team and present a highly relevant case study into the multi-trophic biodiversity and functioning of a well-studied post-industrial landscape and designated urban brownfield, Liberty State Park (LSP), in Jersey City, New Jersey, USA (Figure 1). This un-remediated site is characterized by heavy metal and petroleum contamination. Within the selective environment of LSP, the community that persists demonstrates some unique functional abilities. For instance, soil metal load tolerance and stabilization, while normally not considered an ecosystem function or service, are critically important in the context of a post-industrial landscape. We argue that, in urban or post-industrial environments, diverse functional abilities or trait-based biodiversity may be more important than taxonomic biodiversity in affecting ecosystem health (sensu [27]), as has been modeled in microbial mediated decomposition in soils [28].

2. The Case Study: Liberty State Park in Jersey City, NJ, USA

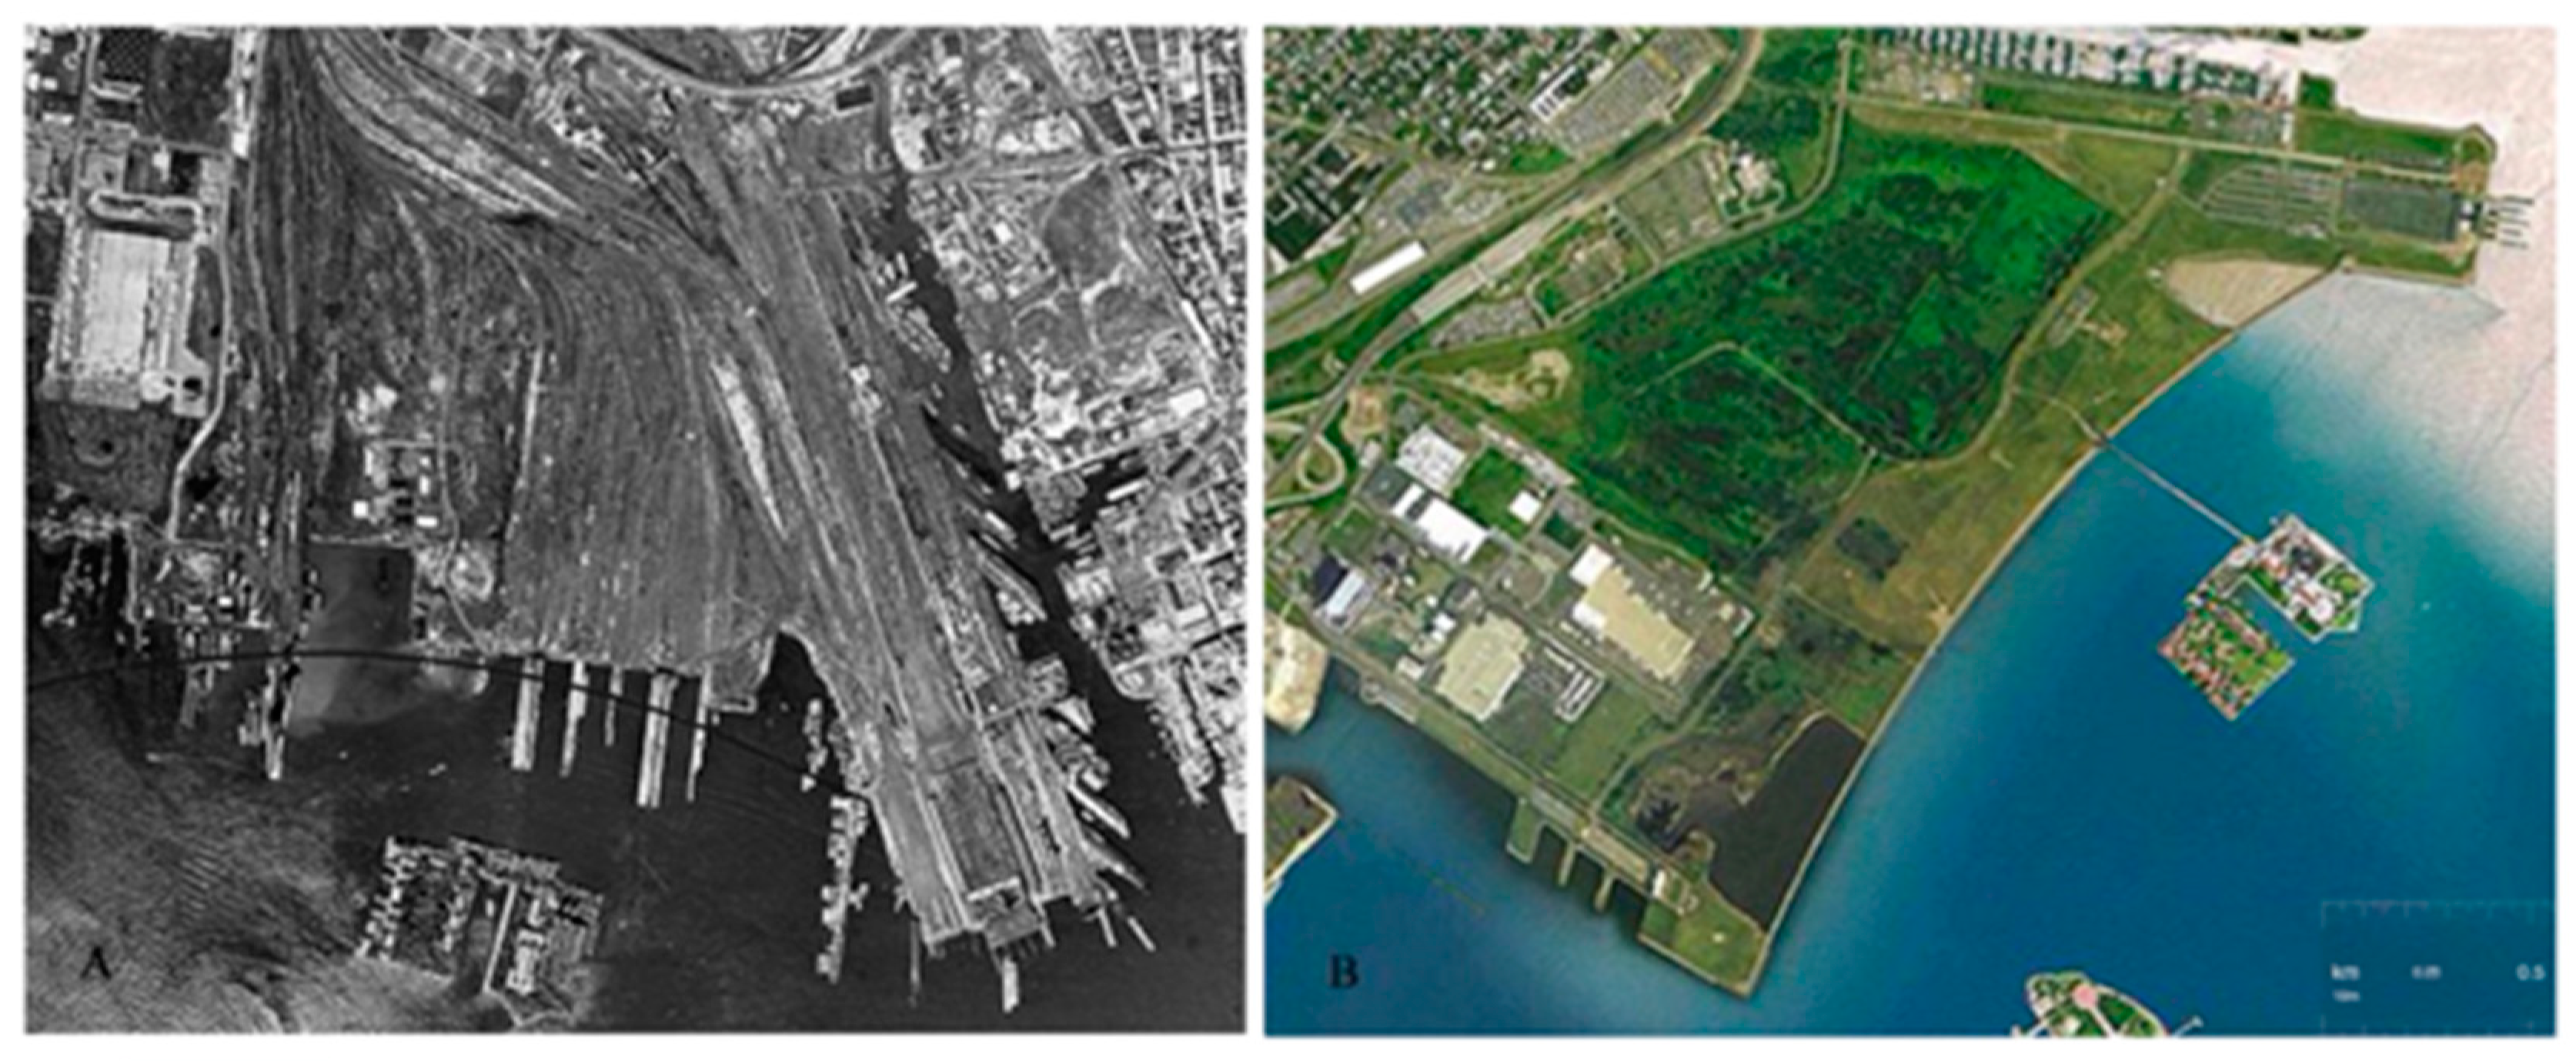
2.1. Site Description

The 251-acre case study site is located within a limited access and un-remediated portion of LSP. It sits on the west bank of the Upper New York Bay and was originally part of an intertidal mud flat and salt marsh. Over the course of the late 19th and early 20th centuries, the Central Railroad of New Jersey (CRRNJ) filled the area for industrial use. The 15 million m3 of fill material consisted of dredge spoils from the harbor, debris from construction projects and refuse from New York City. The majority of the surface was then stabilized with cider ash and stone [30]. Between 1864 and 1967, the CRRNJ used the site as a rail yard for both freight and passenger service. Industrial activities resulted in localized deposits of hydrocarbons, herbicides, pesticides, iron tailings, and coal ash. In 1967, CRRNJ discontinued operations at the site, the iron rails were removed, and the land was abandoned. The State of New Jersey began acquiring the land in the 1970s. A fraction of the site (>100 ha) was fenced off from human access and never remediated; it remains a heterogeneous mix of soil that exceeds both residential and ecological screening criteria for metals [30]; the nature of the organic contaminants at the site are currently under investigation. The soils of the site were classified as the Lady Liberty Series, by the USDA Natural Resource Conservation Department in 2011 as part of their urban soils classification initiative [31]. Within the un-remediated portion of LSP, soil microbial, plant, insect and bird communities have been well studied at designated sampling plots (See Table A1 for a complete list of sampling plots). The sampling plots within LSP that are highlighted in this review are labeled 48, 43, 14, 146 (or 14/16) and 25R and 25F. The sites were chosen to reflect total metal load as well as vegetative assemblage composition, and for further reference see a complete description in a prior publication, Gallagher et al. 2008 [30]). The plot numbers have been assigned arbitrarily (Appendix Table A1) [30]. The results and data presented here are frequently compared to a reference research site, an abandoned agricultural site that is of similar successional age, but not impacted by contamination. The reference sampling plots are from within Rutgers Hutcheson Memorial Forest and are labeled HMF.
To facilitate the examination of the combined impacts of the various metals found in the soils, a total soil metal load index was developed in 2005 [32]. Higher than normal soil metal concentrations are considered a major abiotic filter at this site and it therefore important to understand their distribution and concentrations over time. To this end, a review of data spanning the twenty years from 1995 to 2015 was conducted [33]. These data indicate that Cu, Pb and Zn remained fairly consistent in the upper soil horizons. These elements translocate into the plant tissue, Pb and Cu into the root tissue and Zn into the aerial section of the plant [30] and we thus suspect that their mineral, soluble and organic fractions have reached a state of quasi-equilibrium.
Over the course of more than 40 years, the largely unassisted community of flora and fauna at the LSP site has resulted in a species rich island within a regional diversity that is typical of other major urban centers (i.e., [10,34,35]) (Table 1). Table 1 gives a rough overview of species diversity for several plant and animal taxa and illustrates the precipitous differences in species richness and therefore biodiversity between the undeveloped and urban matrix. Regardless of whether one considers the small-scale community level (here 1000 m2), the meta community scale (here 200 ha) or the regional scale (state wide scale = 22,590 km2), undeveloped land tends to harbor much greater biodiversity than urban centers [36]. Savard et al. [11] described the same scale-independent effects when considering the differences in landscapes that contain intensively human-used patches and those with lesser-used patches. While we do not contend that undeveloped lands offer a maximum measure of taxonomic diversity, we do suggest that these unique novel assemblages offer a functional diversity that provides for some degree of ecosystem health. The study site at LSP is a representative example for the New York Metropolitan area and many highly urbanized areas as a significant fraction of the state consists of vacant and abandoned, post-industrial lands [37]. As such, the review and synthesis of results we present here may facilitate meaningful comparisons with other industrialized regions of the world.

2.2. Urban Ecosystem Function Classification

With respect to the urban environment, several different classification schemes have been used to categorize ecosystem functions [38]. Biophysical traits that mitigate air pollution have been categorized [39,40], while the social and economic benefits have been the subject of many initiatives [41,42,43]. In addition, the contribution of urban ecosystem functions that are unique and have special value in human impacted environments gained validation through their inclusion in the Millennium Ecosystem Assessment of 2005 [44]. In an effort to concisely describe ecosystem functions, De Groot et al. [45] proposed four basic categories: (1) Production—the result of photosynthesis and nutrient uptake; (2) Regulation—control of ecological bio-physical cyclic processes; (3) Habitat functions—related to plant and animal refuge; and (4) Information functions—those that provide context to a reference system. In the context of this paper, and as directly related to the biodiversity of LSP, we highlight the most relevant two of these four primary functions, regulation and production. In addition, for the purpose of this paper, and as part of regulation, we will consider translocation (remediation) of soil contamination as an ecosystem function that is a service to humankind.

3. Functional Diversity within Our Urban Case Study

3.1. Photosynthesis and Carbon Allocation as Production Functions

Primary production within LSP has been the subject of several studies and has been characterized using the Normalized Data Vegetation Index (NDVI) [30], Red/Green Ratio Index [32] and above ground biomass accumulation [46]. In general, all of these studies indicate that the relationship between soil metals and primary productivity is not linear and impacted at only the highest soil metal loads. Out of the 251 acres studied, only approximately 18 acres showed significant evidence of decreased primary productivity. To determine differences in productivity, the site was separated into the vegetative guild communities consisting of herbaceous, shrub and tree species. These were digitized and fit to a map of the site. By layering kriged NDVI values and kriged total soil metal load on the vegetative guild map, statistically significant differences in productivity were observed at total soil metal loads above 3.5 on a scale (approximately 18% of the site). This relationship was strongest in the successional hardwood forest guild. Furthermore, when fit to a second-order polynomial regression to simulate a threshold model, the successional northern hardwood forest yielded an r2 of 0.85 and a p value of >0.01 [30] (Figure 2). Neither the herbaceous or shrub guild yielded a significant relationship between productivity and soil metal load (Gallagher 2005 unpublished data) using the same methodology. Plant diversity, as measured by a Shannon index, and total metal load was also examined. In this case, a linear regression model was the best fit, and yielded a much weaker and relationship r2 = 0.27 and which was not statistically significant p = 0.21 (Figure 3). A plausible explanation for the differences between structure as measured by diversity and function as measured by productive could be that the site has a comparatively high sol metal load which selects for tolerant species. The resulting assemblages function well until a threshold is reached.
The apparent disconnect between diversity and function at the study site is demonstrated most poignantly in the accumulation of above ground biomass. Dahle and colleagues [46] examined the allometric and biomass accumulation of the dominant species, Betula populifolia, within the hardwood assemblage along a gradient transect of soil metal loads. The study demonstrated that there was no significant difference in the diameter at breast height (DBH) or the tree mass along the soil metal load gradient. In addition, there were no differences between branch diameter and branch mass or vertical distribution along the tree trunk along the same soil metal load gradient. There were however, differences in total aboveground woody biomass accumulation between the sites, which have different total metal loads. Interestingly, the greatest biomass accumulation occurred in one of the sites above the critical soil metal threshold, which according to our previous work exhibited a decrease in both productivity, as measured by NDVI, and measured diversity. The increase in biomass is explained by differences in the site’s community composition and successional state [20]. At sites above the total soil metal load threshold, where competition from herbaceous plants was limited, the metal tolerant woody species Betula poulifolia and Populus tremuloides colonized earlier and therefore the stands were older relative to sites below the soil metal threshold. In this case, the dominant hardwood species produced more above ground biomass than other sites, which exhibited greater species richness.
Salisbury et al. [47] described the mechanistic properties and associated photosynthetic efficiencies in the dominant woody species Betula populifolia along the soil metal gradient. The results of this study indicate the maximum net assimilation, light compensation points, quantum efficiencies, dark respiration rates, net assimilation transportation and stomatal conductance were similar in trees growing in high and low soil metal load sites [47]. The only significant difference between the sites was in measured leaf mass, which was significantly lower at sites with soil total metal loads above the threshold. Apparently, resource allocation between growth and maintenance within these heterogeneous soils leads to this physiological difference. The emerging picture resulting from this study is a system where photosynthetic efficiencies are fairly constant along a soil metal load gradient, indicating that trait and functional diversity [48], which includes such photosynthetic mechanisms as mentioned here, may be more relevant than species richness in this regional pool.

3.2. Rhizosphere Microbial Metal Transfer and Amelioration, Regulatory Functions

One of the primary filters that regulate plant production in contaminated soils is the rhizosphere microbial community. As such, the functioning of that community is determined by the dynamic feedbacks between the plant community on which it depends and the contaminated substrate in which it sits [49]. Therefore, species richness and community composition become both the cause and the effect of ecosystem functioning. Mycorrhizal species composition is determined by both host specificity and metal tolerance, while host viability is facilitated by mycorrhizal metal filtering capacity. In results from our case study at LSP [50], the biodiversity of mycorrhizal taxa in the soil was not found to vary with total soil metal load. However, the species composition of that community varied significantly with total soil metal load and correlated significantly with leaf area index (LAI), a measure of primary production. These results paralleled a concurrent study at the same sites within LSP [51], finding significant differences in free enzymatic activities in soil from sites of varying metal load (Figure 4). The findings suggest that elevated enzyme activity in soils with very high total soil metal loads may be attributable to a unique mycorrhizal community in those locations. Follow up work using advanced sequencing techniques showed distinct fungal and bacterial communities (Figure 5) associated with sites that have very high enzymatic activities [51]. Furthermore, in an examination of the fungal and bacterial communities using the same sites and an offsite control (HMF), the bacterial community at LSP 25R appears (the site with the highest soil metal load) was different than the rest of the sites based on Bray-Curtis dissimilarity (Figure 5), and the fungal community at the offsite control (HMF) appears to be different from any of the LSP sites. These findings have important implications. Even though the level of below ground species richness does not change with environmental conditions at the site, community composition and functioning does. Variation in taxa within this microbial filter may enhance soil health and contaminant uptake and, likewise, dilute the impacts of toxicity when toxic metals move up through trophic transfer.

3.3. Metal Translocation and the Plant Community, a Regulatory Function

At LSP, eight of the dominant species representing vegetative guilds within the park were studied for the distribution of five soil metals (As, Cu, Cr, Pb, and Zn) found in the soil at high concentrations [30]. In general, the results showed an order of magnitude decrease in metal concentration from the soil to the root, and a subsequent order of magnitude decrease from the root to the aerial section of the plant (Table A1). Of particular interest at the study site was the distribution of dominant species of wetland plants. Pharagmites australis, which excluded soil metal transfer at the root zone, dominated in those areas that exhibited soil metal concentrations above critical threshold levels. Conversely, semi-emergent wetlands below critical threshold values tended to include, if not be dominated by, herbaceous plants such as Typha lattifolia or Onoclea sensibilis [30]. As mentioned above, upland sites with soil metal concentrations above the soil metal threshold were characteristically dominated by the successional hardwood species Betula populifolia and Populus tremuloides. In a different set of studies, the root tissues of both Phragmites australis and Typha latifolia [52,53] were examined for the distribution of several metal species. In T. Latifolia the spatial distribution of Fe, Mn, Pb, and Zn was observed in both the dermal and vascular tissue. Studies at the site have demonstrated that the sediment concentrations of Cu were 124 ± 51 µg g−1, Pb, 453 ± 266 µg g−1 and Zn, 309 ± 125 µg g−1 all above the background levels in New Jersey. The accumulation of Fe plaque appears to effectively scavenge Pb, as there was a significant relationship between the localization of these elements on the dermal tissue. On the other hand, the localization of Mn, Cu and Zn in the vascular tissue of the root points to a sequestration of these elements once they have entered the root of these species [52,53].

3.4. Trophic Transfer to Secondary and Tertiary Consumers, a Regulatory Function

Litwhiler [54] investigated the potential for trophic transfer in the fruit of both native and nonnative shrubs at the site. Five species of fruiting plants, including Morus alba (white mulberry), Ampelopsis brevipedunctulata (Porcelain Berry), Elaeagnus umbellata (Autumn Olive), Prunus serotina (Black Cherry) and Vitis spp. (Wild Grape) were analyzed for concentrations of Cd, Cr, Cu, and Pb. In general, most species of metals were found in relatively low concentrations within the fruit of the targeted plant species compared to the soil. For example, soil concentrations of Pb, were 385 times higher than average fruit concentrations of Pb. However, Cd, a non-essential element that has been shown to translocate well in acidic soils [55,56], was found to exceed the soil concentration in the fruit of A. brevipedunctulata. These results were fairly consistent with previous literature on above ground tissue transfer [57] and work at the site [30], and suggest a minimal risk of both metal transfer from fruits to birds. That said, the most obvious vector for offsite soil metal contamination, given that the stability of the existing vegetative cover limits erosion, is via avian or insect transport through fecal material or tissue decay.
Trophic transfer of soil metals could result in dilution of the overall toxicity of the site as mobile species transport toxins offsite. Metal transfer to avian populations was studied using Troglodytes aedon (House Wren; Litwhiler et al. [54] and Hofer et al. [58] and Turdus migratorius (American Robin; [58]). Both of these studies examined metal concentrations in the feathers of nestlings, which are known to be an acceptable proxy for the contaminant load within the body (feathers; [59]) and excretion from the body (fecal material; [60]). Hofer et al. [58] compared avian metal load (As, Cr, Cu, Pb, Fe and Zn) in the two target avian species at both the study site and our reference site (Hutcheson Memorial Forest, HMF). Growth metrics, including tarsus length, wing cord length and weight of both nestling cohorts, were also measured. While both species of birds carried a higher metal load at the study site as compared to the control, the inter-clutch variation did not correlate with the soil metal load. In fact, the intra-clutch variation in metal load was significant, in most cases exceeding the inter-clutch variation. This result indicates that either prey species were collected from outside what is considered their normal range or, more likely that prey species availability/abundance at the micro scale variation may be more significant than soil metal concentrations. Metal concentration within various trophic levels was examined and found to vary considerably (Figure 6). Interestingly, Pb was found in concentration much lower than soil concentration indicating that biomagnification of Pb was not associated with trophic transfer within this site.

3.5. Functional Costs of Metal Transfer and Tolerance

The above characterization of translocation properties are not meant to imply that there is no metabolic or physiological costs associated with soil metal tolerance or trophic transfer. As mentioned, at the producer level there are indications that lower primary productive values, as measured by NDVI [30] could in fact be due to the decrease in leaf mass at sites above the soil metal threshold level (above 3.5 on the scale of 0–5 as mentioned above). We propose, however, that the metabolic or physiological costs are associated primarily with mitigation strategies and in general do not appear to change the structure or function of the photosynthetic process. This is a hypothesis in need for direct testing. However, it has been examined. Fluctuating asymmetries (random non-directional deviations from established morphological size, shapes and weights, which have been used as an indicator of abiotic stress [61]) were examined in the two dominant plant species, B. populifolia and P. deltoids [62]. In both species of plants, fluctuating asymmetries, in terms of leaf shape and size, were not observed. However, specific leaf mass differences were. As in the former studies [47,63], both B. populifoloia and P. deltoids exhibited less mass per unit leaf area in areas of high soil metal loads. One plausible explanation is that there is a cost to production of phytochelatin enzymes, which are known to play a role in the detoxification of the metals once translocated [64].
In addition to the plant studies described above, Whadwa [62] examined fluctuating asymmetries in various insect taxa. In general, fluctuating asymmetries were absent within the insect assemblage, with the exception of the head to body size ratio of isopods. In this case, the body to head size ratio was greater in sites with low soil metal loads. On the other hand, the length to width ratios of both head and body exhibited no significant difference. As above, these general differences in mass were thought to be caused by the cost of production of metallothioneins or metal binding proteins, and follow up experiments will test this.

4. Conclusions

In 1986, The National Academy of Sciences and the Smithsonian Institute organized the “National Forum on Biodiversity”. The result of increasing interest in the loss of diversity, especially associated with international conservation efforts, the forum featured over 60 of the leading scientists, economists and philosophers of the time. Among the many presentations given was a talk by Dennis D. Murphy of Stanford University entitled “Challenges to Biological Diversity in Urban Areas”. The talk accurately described the loss of diversity associated with habitat destruction and contamination associated with both development and industrialization. While the talk did recognize the value of remnant habitats such as the salt marshes of the San Francisco Bay, it concluded with the notion that the biological impoverished urban context could be the “bellwethers of our global environmental fate”. Decades of paradigm changing research in urban ecology have since followed.
Through recent ecological work, especially in urban wildlands on post-industrial sites like LSP, presented here, it is becoming increasingly apparent that the general biological impoverishment within the urban context envisioned thirty years ago may have been overstated. Many of the world’s urban centers support some degree of biodiversity that is indigenous to the region [10]. Urban areas can offer substantial levels of biodiversity, with unique multi-trophic relationships even within the context of strong abiotic filters. Indeed, though taxa diversity may not be as high in urban areas as is found in pristine habitats of the same regional biome, the functional diversity and ecosystem health may be high. These observations have led to a growing and highly relevant field of research. Indeed, studies are needed across multiple urban and post-industrial sites such that we can better understand and manage these environments. Given that such a large proportion of human habitation is now in urban and post-industrial centers, a deeper understanding of urban ecosystem health is warranted. In no way do we suggest lowering societal standards with respect to conservation and preservation, but rather, we suggest a more open perspective on what a healthy ecosystem may look like.

Author Contributions

Conceptualization, F.G. and J.A.K., Analysis of Data, all authors; Writing and Editing, all authors.

Funding

This research was funded in part by the National Science Foundation, CBET# 1603741, the New Jersey Department of Environmental Protection, and Montclair State University. In addition, supported by two McIntire-Stennis Capacity Grants (#s 17325 and 17350) from the United States Department of Agriculture’s National Institute of Food and Agriculture provided support as well.

Acknowledgments

The authors would like to thank the laboratory of Pederick Weis, Rutgers New Jersey Medical School for much of the metal analysis. We also thank the anonymous reviewers for valuable suggestions to improve this manuscript.

Conflicts of Interest

The authors declare no conflict of interest.

Appendix A

Table A1. Metal distribution and dominant plant species among Liberty State Park sampling sites.
SiteSpeciesAsCrCuPbZnVaNa
lrstslrstslrstslrstslrstslrstslrsts
TP-1Rhus sp.0.000.75>MD12.50.374.920.0041.35.141261.3124>MD121145354.769414.8309>MD6.12>MD19.60.063.950.330.80
TP-3Rhus sp.0.000.92>MD38.90.5810.10.0070.15.5835.71.6379>MD27134129.114711.3168>MD11.6>MD44.20.083.020.371.04
TP-8aArtemisia vulgaris0.002.29>MD11.90.406.630.0738.420.085.47.4168>MD911349122339154207>MD11.3>MD29.00.076.070.433.05
TP-8bSolidago virgaurea0.00>MD>MD>MD0.47>MD0.12>MD9.30>MD10.1>MD>MD>MD1>MD69.5>MD396>MD>MD>MD>MD>MD0.04>MD1.58>MD
TP-10Populus tremuloides0.0020.20>MD1930.339.160.0061.68.9978.42.5257>MD934500130927081.8131>MD11.7>MD27.00.065.630.141.16
TP-14Betula populifolia0.000.90>MD87.40.259.340.0037.84.3233.01.3103>MD9443832563206749.9>MD3.31>MD20.70.121.700.132.55
TP-16aOnoclea sensibilis0.002.91>MD35.10.7213.40.5153.44.6248.04.267.0>MD4701682.6937.525.538.7>MD21.8>MD72.30.144.991.051.50
TP-16bPhragmites australis0.00>MD>MD>MD0.27>MD0.00>MD5.41>MD4.2>MD>MD>MD1>MD2.09>MD30.2>MD>MD>MD>MD>MD0.09>MD3.55>MD
TP-18Betula populifolia0.001.77>MD33.30.0610.70.0027.66.931201.3238>MD7443931284458241491>MD10.6>MD1180.0613.400.201.38
TP-21Artemisia vulgaris0.001.68>MD37.40.385.930.3738.219.081.98.2345>MD67156395.43771721058>MD8.94>MD58.00.043.070.602.49
TP-24Populus sp.0.000.95>MD23.60.203.180.0044.08.6243.63.3249>MD9214861693487127718>MD6.73>MD24.90.092.260.101.24
TP-25Populus sp.0.043.25>MD2700.162.760.0040.48.051133.01527>MD1999464016576041521586>MD8.87>MD54.00.065.780.256.72
TP-28Betula populifolia0.011.64>MD22.50.0313.70.0068.55.4520.11.344.3>MD56417310914564.272.5>MD16.5>MD37.80.101.850.245.26
TP-40Artemisia vulgaris0.001.08>MD13.20.096.380.0020.323.346.310.7153>MD47130354.859.850.7159>MD8.60>MD1930.0512.180.771.91
TP-40 BRhus sp.0.001.21>MD24.80.046.660.1246.62.9853.52.7212>MD5404211.0649.24.19232>MD11.8>MD66.90.092.501.332.34
TP40CArtemisia vulgaris0.000.55>MD14.20.622.060.1520.221.457.06.6224>MD221421107374118603>MD2.57>MD39.00.052.870.773.83
TP-41Betula populifolia0.080.91>MD13.30.131.830.009.76.1128.61.6229>MD6034491617303243304>MD5.78>MD40.60.082.480.260.79
TP-43Betula populifolia0.021.56>MD21.00.373.861.3210.25.2940.61.668>MD1122686105181.370.0198>MD7.92>MD1180.111.710.210.67
TP-48Betula populifolia0.001.26>MD10.70.489.440.1216.75.1438.71.31661012510333103416969.664>MD3.98>MD79.80.173.620.381.80
TP7/8Rhus sp.0.001.24>MD57.10.312.420.0050.64.4417.32.9199>MD2834092.5116523.5218>MD3.25>MD9.310.052.740.392.32
TP-14/16Betula populifolia0.053.34>MD42.80.5752.80.002095.5751.42.276.4>MD3321619682415311824.9>MD28.0>MD7.370.162.180.371.42
TP-21/40Rhus sp.0.000.52>MD15.70.282.670.0732.13.1340.61.8129>MD4315521.8123921.5157>MD3.94>MD0.000.042.770.831.56
TP-28/17Polygonum cuspidatum0.002.56>MD12.50.5112.70.0643.44.2940.36.548.3>MD4311569813159.196>MD22.5>MD18.10.134.191.243.00
TP-43/14Betula populifolia0.007.16>MD17.60.192.830.6411.46.1536.03.269.9818122117106213511249.0>MD10.6>MD8.280.092.390.262.07

References

  1. Wilcox, B.A.; Murphy, D.D. Conservation strategy: The effects of fragmentation on extinction. Am. Nat. 1985, 125, 879–887. [Google Scholar] [CrossRef]
  2. Powell, G.V.N.; Powell, A.H.X. Reproduction by Great white herons Ardea herodias in Florida bay as an indicator of habitat quality. Biol. Conserv. 1986, 36, 101–113. [Google Scholar] [CrossRef]
  3. Canterbury, G.E.; Martin, T.E.; Petit, D.R.; Petit, L.J.; Bradford, D.F. Bird communities and habitat as ecological indicators of forest condition in regional monitoring. Conserv. Biol. 2000, 14, 544–558. [Google Scholar] [CrossRef]
  4. Luck, G.W. A review of the relationships between human population density and biodiversity. Biol. Rev. 2007, 82, 607–645. [Google Scholar] [CrossRef] [PubMed]
  5. Cincotta, R.P.; Wisnewski, J.; Engelman, R. Human population in the biodiversity hotspots. Nature 2000, 404, 990–992. [Google Scholar] [CrossRef] [PubMed]
  6. Pickett, C.M.L. Beyond urban legends: An emerging framework of urban ecology, as illustrated by the Baltimore Ecosystem Study. Bioscience 2008, 58, 139–150. [Google Scholar] [CrossRef]
  7. Grimm, N.B.; Faeth, S.H.; Golubiewski, N.E.; Redman, C.L.; Wu, J.; Bai, X.; Briggs, J.M. Global change and the ecology of cities. Science 2008, 319, 756–760. [Google Scholar] [CrossRef] [PubMed]
  8. McPhearson, T.; Pickett, S.T.; Grimm, N.B.; Niemelä, J.; Alberti, M.; Elmqvist, T.; Weber, C.; Haase, D.; Breuste, J. Advancing urban ecology toward a science of cities. Bioscience 2016, 66, 198–212. [Google Scholar] [CrossRef]
  9. Ossola, A.; Irlich, U.M.; Niemelä, J. Bringing Urban Biodiversity Research into Practice. Rout. Assoc. GSE Res. 2018, 1, 1–17. [Google Scholar]
  10. Aronson, M.F.J.; La Sorte, F.A.; Nilon, C.H.; Katti, M.; Goddard, M.A.; Lepczyk, C.A.; Warren, P.A.; Williams, N.S.G.; Cilliers, S.; Clarkson, B.; et al. A global analysis of the impacts of urbanization on bird and plant diversity reveals key anthropogenic drivers. Proc. R. Soc. B. 2014, 281, 2013–3330. [Google Scholar] [CrossRef] [PubMed]
  11. Savage, A.M.; Hackett, B.; Guénard, B.; Youngsteadt, E.K.; Dunn, R.R. Fine-scale heterogeneity across Manhattan’s urban habitat mosaic is associated with variation in ant composition and richness. Insect Conserv. Divers. 2015, 8, 216–228. [Google Scholar] [CrossRef]
  12. Savard, J.P.L.; Clergeau, P.; Mennechez, G. Biodiversity Concepts and Urban Ecosystems. Landsc. Urban Plan. 2000, 48, 131–142. [Google Scholar] [CrossRef]
  13. Pickett, S.T.A.; Kolasa, J.; Armesto, J.J.; Collins, S.L. The Ecological Concept of Disturbance and Its Expression at Various Hierarchical Levels. Oikos 1989, 54, 129–136. [Google Scholar] [CrossRef]
  14. McDonnell, M.J.; Pickett, S.T.A. Humans as Components of Ecosystems: The Ecology of Subtle Human Effects and Populated Areas; Springer: New York, NY, USA, 1993. [Google Scholar]
  15. Grimm, N.B.; Grove, J.M.; Pickett, S.T.A. Integrated Approaches to Long Term Studies of Urban Ecological Systems. Bioscience 2000, 50, 571–584. [Google Scholar] [CrossRef]
  16. Adler, F.R.; Tanner, C.J. Urban Ecosystems, Ecological Principals for the Built Environment; Cambridge University Press: Cambridge, UK, 2008. [Google Scholar]
  17. Hobbs, R.J.; Harris, J.A. Repairing the Earth’s Ecosystem in the New Millennium. Restor. Ecol. 2001, 9, 239–246. [Google Scholar] [CrossRef]
  18. Klötzli, F.; Grootjans, A.P. Restoration of Natural and Semi-Natural Wetland Systems in Central Europe: Progress and Predictability of Developments. Restor. Ecol. 2001, 9, 209–219. [Google Scholar] [CrossRef] [Green Version]
  19. Prach, P.; Hobbs, R.J. Spontaneous Succession verses Technical Reclamation in the Restoration of Disturbed Sites. Restor. Ecol. 2008, 16, 363–366. [Google Scholar] [CrossRef]
  20. Gallagher, F.J.; Pechmann, I.; Holzapfel, C.; Grabosky, J. Altered Vegetative Assemblage Trajectories within an Urban Brownfield. Environ. Pollut. 2011, 159, 1159–1166. [Google Scholar] [CrossRef] [PubMed]
  21. Chapman, C.; Chapman, L.; Wrangham, R.W.; Isabirye-Basuta, G.; Ben-David, K. Spatial and temporal variability in the structure of a tropical forest. Afr. J. Ecol. 1997, 35, 287–302. [Google Scholar] [CrossRef] [Green Version]
  22. Tilman, D.; Knops, J.; Wedin, D.; Reich, P.; Ritchie, M.; Siemann, E. The Influence of Functional Diversity and Composition on Ecosystem Processes. Science 1997, 277, 1300–1302. [Google Scholar] [CrossRef] [Green Version]
  23. Mayfield, M.M.; Levine, J.M. Opposing effects of competitive exclusion on the phylogenetic structure of communities. Ecol. Lett. 2010, 13, 1085–1093. [Google Scholar] [CrossRef] [PubMed]
  24. Vitousek, P.M.; Antonio, D.; Loope, C.M.; Lloyd, L.; Westbrooks, R. Biological Invasions as Global Environmental Change. Am. Sci. 1996, 84, 468. [Google Scholar]
  25. Faeth, S.H.; Saari, S.; Bang, C. Urban Biodiversity: Patterns, Processes and Implications for Conservation; John Wiley and Sons: Hoboken, NJ, USA, 2012. [Google Scholar] [CrossRef]
  26. Keddy, P.A. Assembly and response rules: Two goals for predicting community ecology. J. Veg. Sci. 1993, 3, 157–164. [Google Scholar] [CrossRef]
  27. Hillebrand, H.; Matthiessen, B. Biodiversity in a complex world: Consolidation and progress in functional biodiversity research. Ecol. Lett. 2009, 12, 1405–1419. [Google Scholar] [CrossRef] [PubMed] [Green Version]
  28. Allison, S.D. A trait-based approach for modelling microbial litter decomposition. Ecol. Lett. 2012, 15, 1058–1070. [Google Scholar] [CrossRef] [PubMed]
  29. Texas Instruments (TI). Liberty State Park Ecological Study; Prepared for the Port Authority of New York and New Jersey; Texas Instruments: Dallas, TX, USA, 1976. [Google Scholar]
  30. Gallagher, F.J.; Pechmann, I.; Bogden, J.; Grabosky, J.; Weis, P. Soil Metal Concentrations and Plant Productivity in an Urban Brownfield. Environ. Pollut. 2008, 153, 351–361. [Google Scholar] [CrossRef] [PubMed]
  31. National Cooperative Soil Survey NCS. Available online: https://soilseries.sc.egov.usda.gov/OSD_Docs/L/LADYLIBERTY.html (accessed on 11 February 2018).
  32. Gallagher, F.J.; Pechmann, I.; Bogden, J.; Grabosky, J.; Weis, P. Soil Metal concentrations and productivity of Betula populifolia (gray birch) as measured by field spectrometry and incremental annual growth in an abandoned urban Brownfield in New Jersey. Environ. Pollut. 2008, 156, 699–706. [Google Scholar] [CrossRef] [PubMed]
  33. Salisbury, A.; Reinfelder, J.R.; Gallagher, F.J.; Grabosky, J.C. Long-Term Stability of Trace Element Concentrations in a Spontaneously Vegetated Urban Brownfield with Anthropogenic Soils. Soil Sci. 2017, 182, 69–81. [Google Scholar] [CrossRef]
  34. Bartha, S.; Meiners, S.J.; Pickett, S.T.; Cadenasso, M.L. Plant colonization windows in a mesic old field succession. Appl. Veg. Sci. 2003, 6, 205–212. [Google Scholar] [CrossRef]
  35. Ramirez, K.S.; Leff, J.W.; Barberán, A.; Bates, S.T.; Betley, J.; Crowther, T.W.; Kelly, E.F.; Oldfield, E.E.; Shaw, E.A.; Steenbock, C. Biogeographic patterns in below-ground diversity in New York City’s Central Park are similar to those observed globally. Proc. R. Soc. B. 2014, 281, 20141988. [Google Scholar] [CrossRef] [PubMed]
  36. Zhang, Y.; Holzapfel, C.; Yuan, X. Scale-dependent Ecosystem Service. Ecos. Serv. Agr. Urban Landsc. 2013, 105–121. [Google Scholar] [CrossRef]
  37. Lurie, M.N.; Wacker, P.O. Mapping New Jersey: An Evolving Landscape; Rutgers University Press: New Brunswick, NJ, USA, 2009. [Google Scholar]
  38. Bolund, P.; Hunhammar, S. Ecosystem services in urban areas. Ecol. Econ. 2009, 29, 293–301. [Google Scholar] [CrossRef]
  39. Escobedo, F.J.; Kroeger, T.; Wagner, J.E. Urban forests and pollution mitigation: Analyzing ecosystem services and disservices. Environ. Polut. 2011, 8–9, 2078–2087. [Google Scholar] [CrossRef] [PubMed]
  40. Pataki, D.E.; Carreiro, M.M.; Cherrier, J.; Grulke, N.E.; Jennings, V.; Pincetl, S.; Pouyat, R.V.; Whitlow, T.H.; Zipperer, W.C. Coupling biogeochemical cycles in urban environments: ecosystem services, green solutions, and misconceptions. Front. Ecol. Environ. 2011, 9, 27–36. [Google Scholar] [CrossRef] [Green Version]
  41. Jim, C.Y.; Wendy, Y.; Chen, W.Y. Ecosystem services and valuation of urban for-ests in China. Cities 2009, 26, 187–219. [Google Scholar] [CrossRef]
  42. Sander, H.; Polasky, S.; Haight, R.G. The value of urban tree cover: A hedonic property price model in Ramsey and Dakota Counties, Minnesota, USA. Ecol. Econ. 2010, 69, 1646–1656. [Google Scholar] [CrossRef]
  43. Andersson, E.; Barthel, S.; Ahrné, K. Measuring social-ecological dynamics behind the generation of ecosystem services. Ecol. Appl. 2007, 17, 1267–1278. [Google Scholar] [CrossRef] [PubMed]
  44. McGranahan, G.; Marcotullio, P.; Bai, X.; Balk, D.; Braga, T.; Douglas, I.; Elmqvist, T.; Rees, W.; Satterthwaite, D.; Songsore, J.; et al. Urban Systems. In Millennium Ecosystem Assessment. Ecosystems and Human Well-Being: Current State and Trends; Island Press: Washington, DC, USA, 2005; pp. 795–825. [Google Scholar]
  45. De Groot, R.S.; van der Perk, J.; Chiesura, A.; Marguliew, S. Ecological functions and socio-economic values of critical natural capital as a measure for ecological integrity and environmental health. In Implementing Ecological Integrity: Restoring Regional and Global Environmental and Human Health; NATO-Science Series, IV Earth and Environmental Sciences; Kluwer Academic Publishers: London, UK, 2000. [Google Scholar]
  46. Dahle, G.A.; Gallagher, F.J.; Gershenson, D.; Schäfer, K.V.R.; Grabosky, J.C. Allometric and Mass Relationships of Betula populifolia in a Naturally Assembled Urban Woodlot. Urban Ecosyst. 2014, 17, 1147–1160. [Google Scholar] [CrossRef]
  47. Salisbury, A.; Gallagher, F.J.; Caplan, J.; Grabosky, J.C. Maintenance of photosynthetic capacity despite high load of trace metals in contaminated anthropogenic soils. Sci. Total Environ. 2018, 625, 1615–1627. [Google Scholar] [CrossRef] [PubMed]
  48. Petchey, O.L.; Gaston, K.J. Functional diversity: Back to basics and looking forward. Ecol. Lett. 2006, 9, 741–758. [Google Scholar] [CrossRef] [PubMed]
  49. Krumins, J.A.; Goodey, N.M.; Gallagher, F.J. Plant-Soil Interactions in Metal Contaminated Soils. Soil Biol. Biochem. 2015, 80, 224–231. [Google Scholar] [CrossRef]
  50. Evans, J.M.; Parker, A.; Gallagher, F.J.; Krumins, J.A. Plant Productivity, Ectomycorrhiza and Metal Contamination in Urban Brownfield Soils. Soil Sci. 2015, 180, 198–206. [Google Scholar] [CrossRef]
  51. Hagmann, D.; Goodey, N.M.; Matheau, C.; Evans, J.M.; Aronson, M.F.J.; Gallagher, F.J.; Krumins, J.A. Effect of metal contamination on microbial enzymatic activity in soil. Soil Biol. Biochem. 2015, 91, 291–297. [Google Scholar] [CrossRef]
  52. Qian, Y.; Feng, F.H.; Gallagher, F.J.; Zhu, Q.; Wu, M.; Liu, C.J.; Jones, K.; Tappero, R. Synchrotron Study of Metal Localization in Typha latifolia L. Root Sections. J. Synchrotron Radiat. 2015, 22, 1459–1468. [Google Scholar] [CrossRef] [PubMed]
  53. Feng, F.H.; Qian, Y.; Tappero, M.R.; Gallagher, F.J.; Wu, M.; Zhang, W.; Yu, L.; Zhu, Q.; Zhang, K.; Liu, C.J. Lead accumulation and association with Fe on Typha latifolia root from an urban brownfield site. Env. Sci. Pollut. Res. 2015, 20, 3743–3750. [Google Scholar] [CrossRef] [PubMed]
  54. Litwhiler, M. Attraction and Risk in Urban Bird Habitats. Ph.D. Thesis, New Jersey Institute of Technology, Newark, NJ, USA, 2017. [Google Scholar]
  55. Das, P.; Samantaray, S.; Rout, G.R. Studies on cadmium toxicity in plants: A review. Environ. Pollut. 1997, 98, 29–36. [Google Scholar] [CrossRef]
  56. Li, H.; Smith, S.E.; Holloway, R.E.; Zhu, Y.; Smith, F.A. Arbuscular mycorrhizal fungi contribute to phosphorus uptake by wheat grown in a phosphorus-fixing soil even in the absence of positive growth responses. New Phytol. 2006, 172, 536–543. [Google Scholar] [CrossRef] [PubMed] [Green Version]
  57. Peralta-Videa, J.R.; Lopez, M.L.; Narayan, M.; Saupe, G.; Gardea-Torresdey, J. The biochemistry of environmental heavy metal uptake by plants: implications for the food chain. Int. J. Biochem. Cell Biol. 2006, 41, 1665–1677. [Google Scholar] [CrossRef] [PubMed]
  58. Hofer, C.; Gallagher, F.J.; Holzapfel, C. Metal accumulation and growth performance of nestlings of passerine bird species at an urban brownfield site. Envrion. Pollut. 2010, 158, 1207–1213. [Google Scholar] [CrossRef] [PubMed]
  59. Abdullah, M.; Fasola, M.; Muhammad, A.S.A.; Malik, N.; Bostan, H.; Bokhari, M.A.; Kamran, M.N.; Shafqat, A.; Alamdar, K.M.; Ali, N.; et al. Avian feathers as a non-destructive bio-monitoring tool of trace metals signatures: A case study from severely contaminated areas. Chemosphere 2015, 119, 553–561. [Google Scholar] [CrossRef] [PubMed]
  60. Dauwe, T.L.; Bervoets, R.; Blust, R.; Pinxten, M.; Eens, M. Can excrement and feathers of nestling songbirds be used as biomonitors for heavy metal pollution? Arch. Environ. Contam. Toxicol. 2000, 39, 541–546. [Google Scholar] [CrossRef] [PubMed]
  61. Beasley, D.A.E.; Bonisoli-Alquati, A.; Mousseau, T.A. The use of fluctuating asymmetry as a measure of environmentally induced developmental instability: A meta-analysis. Ecol. Indic. 2013, 30, 218–226. [Google Scholar] [CrossRef]
  62. Wadhwa, S.; Gallagher, F.J.; Rodriguez-Saône, C.; Holzapfel, C. Analysis of fluctuating asymmetry in isopod and hardwood tree populations in brown fields. J. Environ. Indic. 2017, 76, 42–51. [Google Scholar] [CrossRef]
  63. Radwanski, D.; Gallagher, F.J.; Vanderklein, D.W.; Schafer, K.V.R. Physiology and carbon allocation of two co-occurring poplar species (Populus 1 deltoides and 2 Populus tremuloides) in an urban brownfield. Environ. Pollut. 2017, 23, 497–506. [Google Scholar] [CrossRef] [PubMed]
  64. Schill, R.; Öhler, H.R. Energy reserves and metal-storage granules in the hepatopancreas of Oniscus asellus and Porcellio scaber (Isopoda) from a metal gradient at Avonmouth, UK. Ecotoxicology 2004, 13, 787–796. [Google Scholar] [CrossRef] [PubMed]
Figure 1. Located on the west bank of the New York Harbor, Liberty State Park was built on fill material deposited over a period of 70 years, beginning in 1860, by the Central Rail Road of New Jersey. By 1969 the railroad company had declared bankruptcy and removed most of the rails to be sold for scrap iron (A. Faircloth Aerial Image). Currently (B. Faircloth Aerial Image). The park has been developed around its perimeter using the traditional soil contamination mitigation methodology of capping. However, the interior 251 acres, shown in dark green, has remained undisturbed and has developed a robust and novel vegetative community. For more detailed maps describing recent vegetation and metals distributions across the site, please see [29].
Diversity 10 00119 g001
Figure 2. Polynomial regression between total soil metal load (TML) and diversity as measured by the Shannon index was significant only in the early successional hardwood tree community (SAS, 2003. Version 9. SAS Institute Inc., Cary, NC, USA). This suggests that the soil metal load significantly limited the establishment of tree species only at fairly high concentrations. The relationship between soil metal load and the early successional hardwood community diversity can be more accurately described using a threshold model.
Diversity 10 00119 g002
Figure 3. Taken collectively, the various vegetative assemblages within the study area demonstrated no statistically significant relationship (using a linear regression) between the total soil metal load index (TML) and biological diversity as measured by stem count (herbaceous) or basal area (woody) and diversity then calculated by the Shannon Index using percent composition as the importance value based on the density values (SAS, 2003. Version 9. SAS Institute Inc.). A nested plot survey was used to collect the data.
Diversity 10 00119 g003
Figure 4. Soil free enzymatic response across a gradient of total soil metal load sites at LSP in addition to a reference site (Hutcheson Memorial Forest, HMF) that has no history of industrial use or metal contamination. The sites (HMF, 48, 43, 14, 146 (14/16)) are shown in increase in metal loads from left to right (and also see Table A1). Enzyme activities: (A) L-leucine amino peptidase, (B) cellobiohydrolase, and (C) phosphatase are representative are N, C, and P cycling respectively. Enzyme activities for all three enzymes were significantly (ANOVA performed in SAS Version 9.0) highest at the site with the highest total metal load (site 146 (14/16)). Data from [51].
Diversity 10 00119 g004aDiversity 10 00119 g004b
Figure 5. Dendrograms representing the relationship in microbial community structure for both bacterial (A) and fungal (B) communities, as analyzed by Ion torrent sequencing using 515f/806r primers for the bacteria and ITS1 primer for the fungi. Cluster analysis was carried out in R (R version 3.4) using the hclust command. Bray-Curtis dissimilarity of the relative abundances of bacteria and fungi was used for the cluster analysis.
Diversity 10 00119 g005
Figure 6. Log transformed mean concentration (µg) of Pb, Cd Cu, and Cr in Lepidoptera (n = 4) herbivores, Orthoptera (n = 9) omnivores and Araneae (n = 9) carnivore samples. Feather and fecal samples were taken from nestlings of Troglodytes aedon (House Wren), which feed heavily on Araneae. While the Araneae exhibited increased levels of of metals the variation was great, and transfer to the next trophic level, Troglodytes aedon did not occur.
Diversity 10 00119 g006
Table 1. Species richness of urban and undeveloped landscapes in NJ.
Liberty SPUrban Matrix in NJRegion: NJ, Urban DevelopedRegion: NJ, Urban Undeveloped
Site Size0.1 ha200 ha0.1 ha200 ha
Vascular Plants20–651856–1245210560
Birds8–17874–72145210
Mammals2–8112–461745
Odonata5–7121–361435
Lepidoptera12–14254–5112450

