Article

Combined Prokaryotic Transcriptomics and Proteomics Analysis of Clinical Trueperella pyogenes Isolates with Distinctive Cytotoxicity

1
College of Veterinary Medicine, Northeast Agricultural University, Harbin 150030, China
2
Key Laboratory of the Provincial Education Department of Heilongjiang for Common Animal Disease Prevention and Treatment, College of Veterinary Medicine, Northeast Agricultural University, Harbin 150030, China
*
Author to whom correspondence should be addressed.
Int. J. Mol. Sci. 2025, 26(4), 1490; https://doi.org/10.3390/ijms26041490
Submission received: 17 December 2024 / Revised: 6 February 2025 / Accepted: 8 February 2025 / Published: 11 February 2025

Abstract

Trueperella pyogenes is a widely distributed opportunistic pathogenic bacterium that can infect livestock, wildlife, community animals, and humans, resulting in suppurative infection of tissue and organ mucosa, including pneumonia, liver abscessation, mastitis, metritis, endocarditis, and osteoarthritis. TP1804 and TP1808 were isolated from the uterine lavage fluid of cows with endometritis. This study analyzed the prokaryotic transcriptomics and proteomics of two strains of T. pyogenes with similar growth curves but different cytotoxicity. Studying the metabolic mechanisms of these differentially expressed genes and proteins can greatly promote the discovery of new biomarkers and improve the accuracy of biomarker identification, which is of great value for molecular mechanisms, biomarkers, early diagnosis of diseases, molecular typing, and prognosis. Our results indicate that the control of the virulence by tRNAs to bacteria during ribosome biosynthesis is crucial.

1. Introduction

Trueperella pyogenes is a widely distributed opportunistic pathogenic bacterium that can infect livestock, wildlife, community animals, and humans, resulting in suppurative infection of tissue and organ mucosa, including pneumonia, liver abscessation, mastitis, metritis, endocarditis, and osteoarthritis [1,2,3]. It was reclassified as T. pyogenes according to the 16S rRNA sequence based on phylogenetic and chemotaxonomic observations [1,2]. T. pyogenes have been isolated from edible animals in many countries around the world [3]. The infection of T. pyogenes can cause serious economic losses and even lead to the elimination of infected animals, mainly in breeding cattle and pigs [3,4].
T. pyogenes secretes several important virulence factors, such as pyolysin (PLO), fimbriae (Fim), neuraminidase (NanH and NanP), and collagen-binding protein (CbpA) [5,6]. The most important and primary virulence factor is PLO encoded by the plo gene [7,8], which is associated with cell lysis and hemolysis [2,9,10]. Other virulence factors are related to adherence, colonization, and pathogenesis [8,11]. Curiously, the previous report exhibited distinct differences in the expression of eight known virulence genes in T. pyogenes isolated from cows of different health states [12]. This demonstrates the significance of the regulatory mechanisms of virulence gene expression in the development of infection [8,13]. Liu et al. [3] also reported significant differences in the cell lysis ability of T. pyogenes isolated from cow uterine lavage fluid. All this evidence demonstrates that the infection and pathogenicity of T. pyogenes may be attributed to other unknown bacterial factors.
Measuring the expression of RNA and proteins in pathogenic bacteria is fundamental for understanding bacterial pathogenicity and pathogenic mechanisms. This study may be the first to explore the pathogenicity and pathogenic mechanism of T. pyogenes through the combined analysis of protein levels with transcript levels. These investigations could complement transcriptomic studies and provide insights into post-transcriptional regulatory mechanisms [14], as well as into bacterial pathogenicity and pathogenic mechanisms.
This study analyzed the prokaryotic transcriptomics and proteomics of two strains of T. pyogenes with similar growth curves but different cytotoxicity. Our research findings emphasize the importance of comparing transcriptomic and proteomic analyses for bacterial pathogenicity and drug resistance. Our research displayed the differences in bacterial pathogenicity and drug resistance, providing evidence for a better understanding of bacteria virulence genes.

2. Results

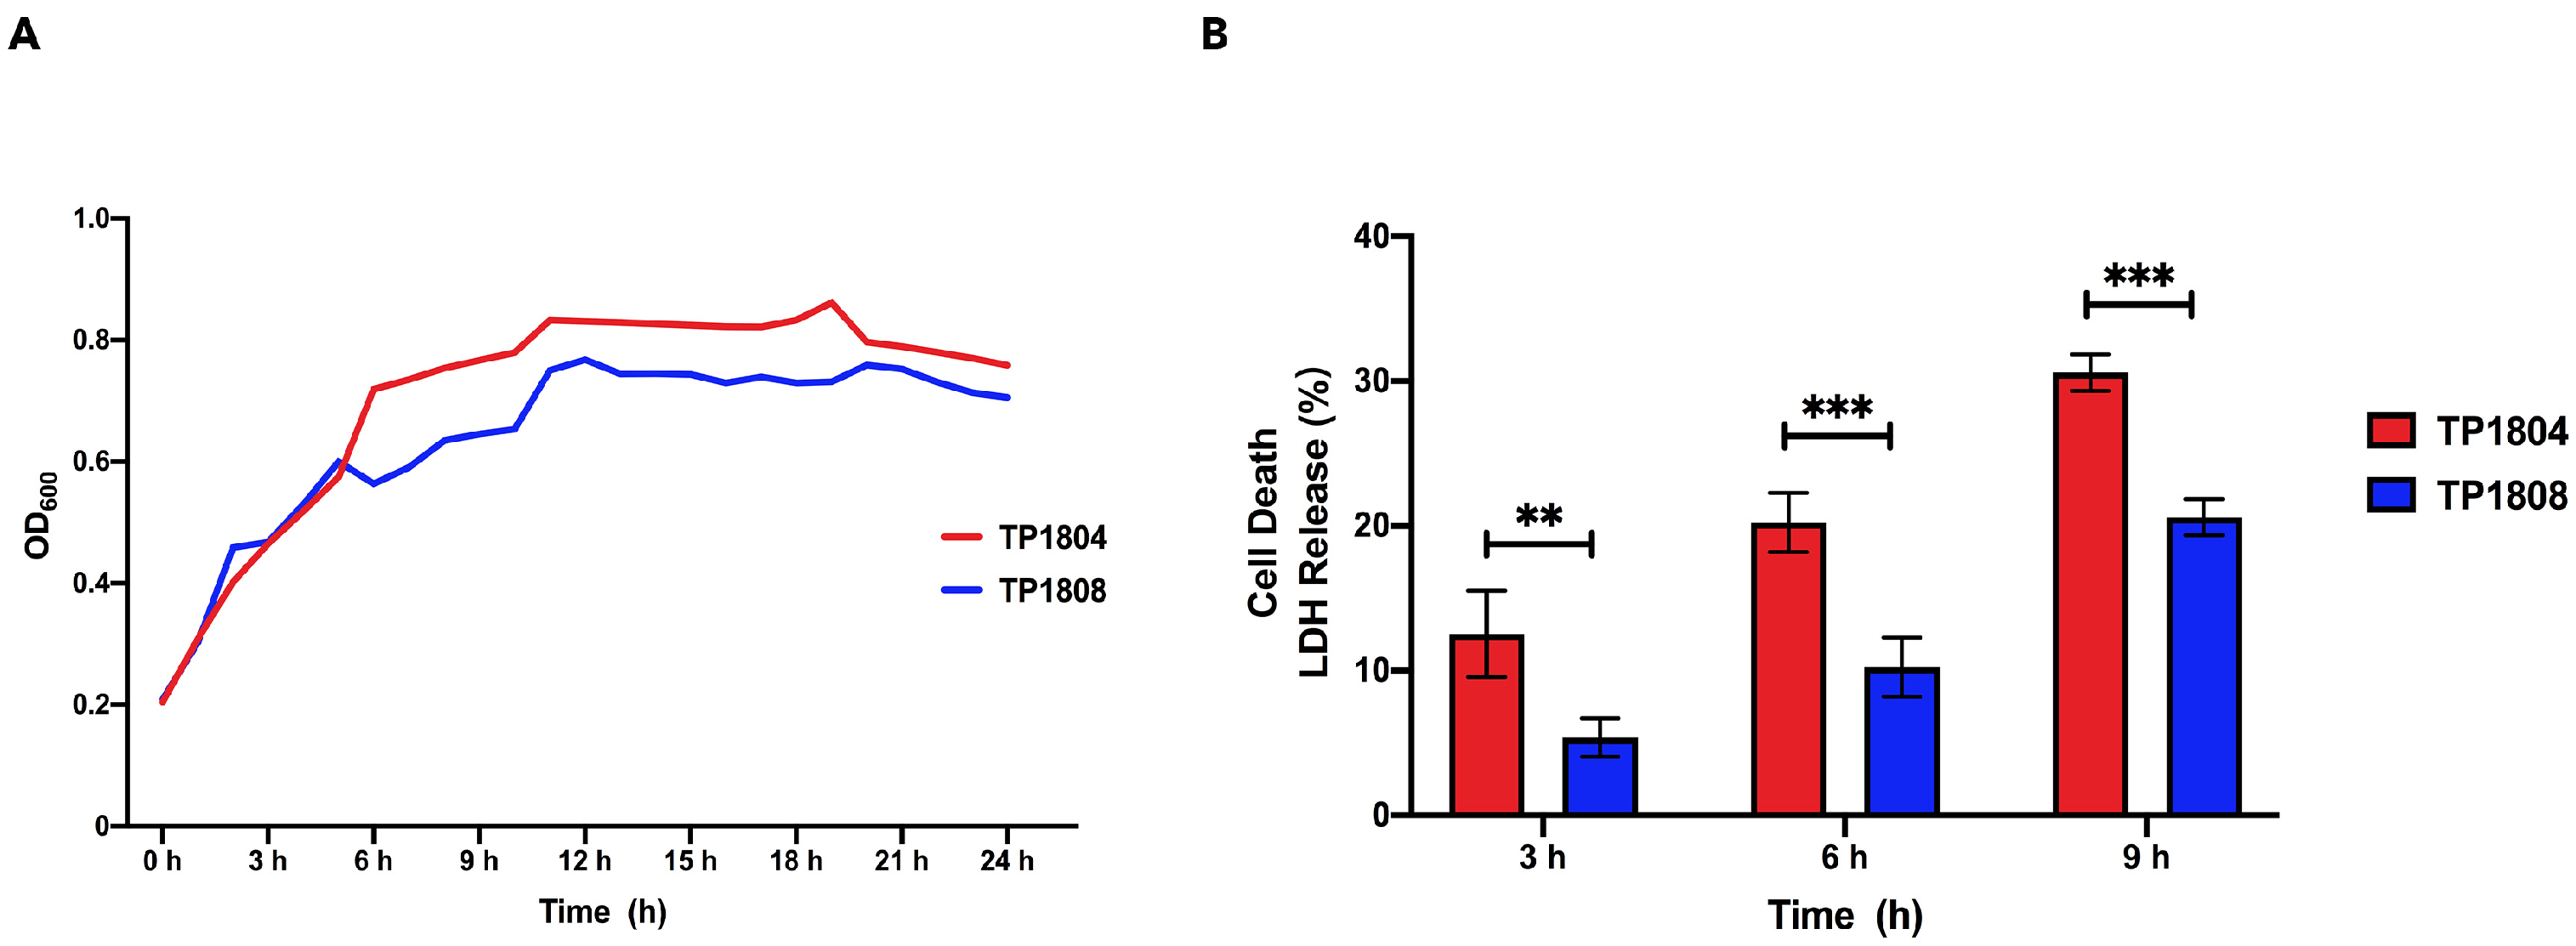
2.1. Bacterial Growth Characteristics and Toxicity

Our previous study reported that 23 strains of T. pyogenes were isolated from cow uterine lavage fluid [3]. Among them, TP1804 has the strongest cytotoxicity, while TP1808 has the weakest cytotoxicity. In this study, two strains of T. pyogenes with the greatest difference in cytotoxicity were selected to compare their differential genes and proteins. The growth curves of TP1804 and TP1808 were measured from 1 h to 24 h (Figure 1A). The growth curve can reflect the growth condition of bacteria and the time for bacteria to reach the logarithmic phase, which is of great significance. TP1804 and TP1804 both passed their mid-log phase at 11 h with similar growth curves.
The lactate dehydrogenase (LDH) method was performed to examine the cell cytotoxicity after 3 h, 6 h, and 9 h of challenge of TP1804 and TP1808 (Figure 1B). Comparing 3 h, 6 h, and 9 h, the cell death rates infected by TP1804 were particularly higher than those of TP1808. There was no significant difference between TP1804 and TP1808 at 3 h. Starting from 6 h, the cytotoxicity of TP1804 obviously increased and showed significant differences compared to TP1808 (p < 0.01).

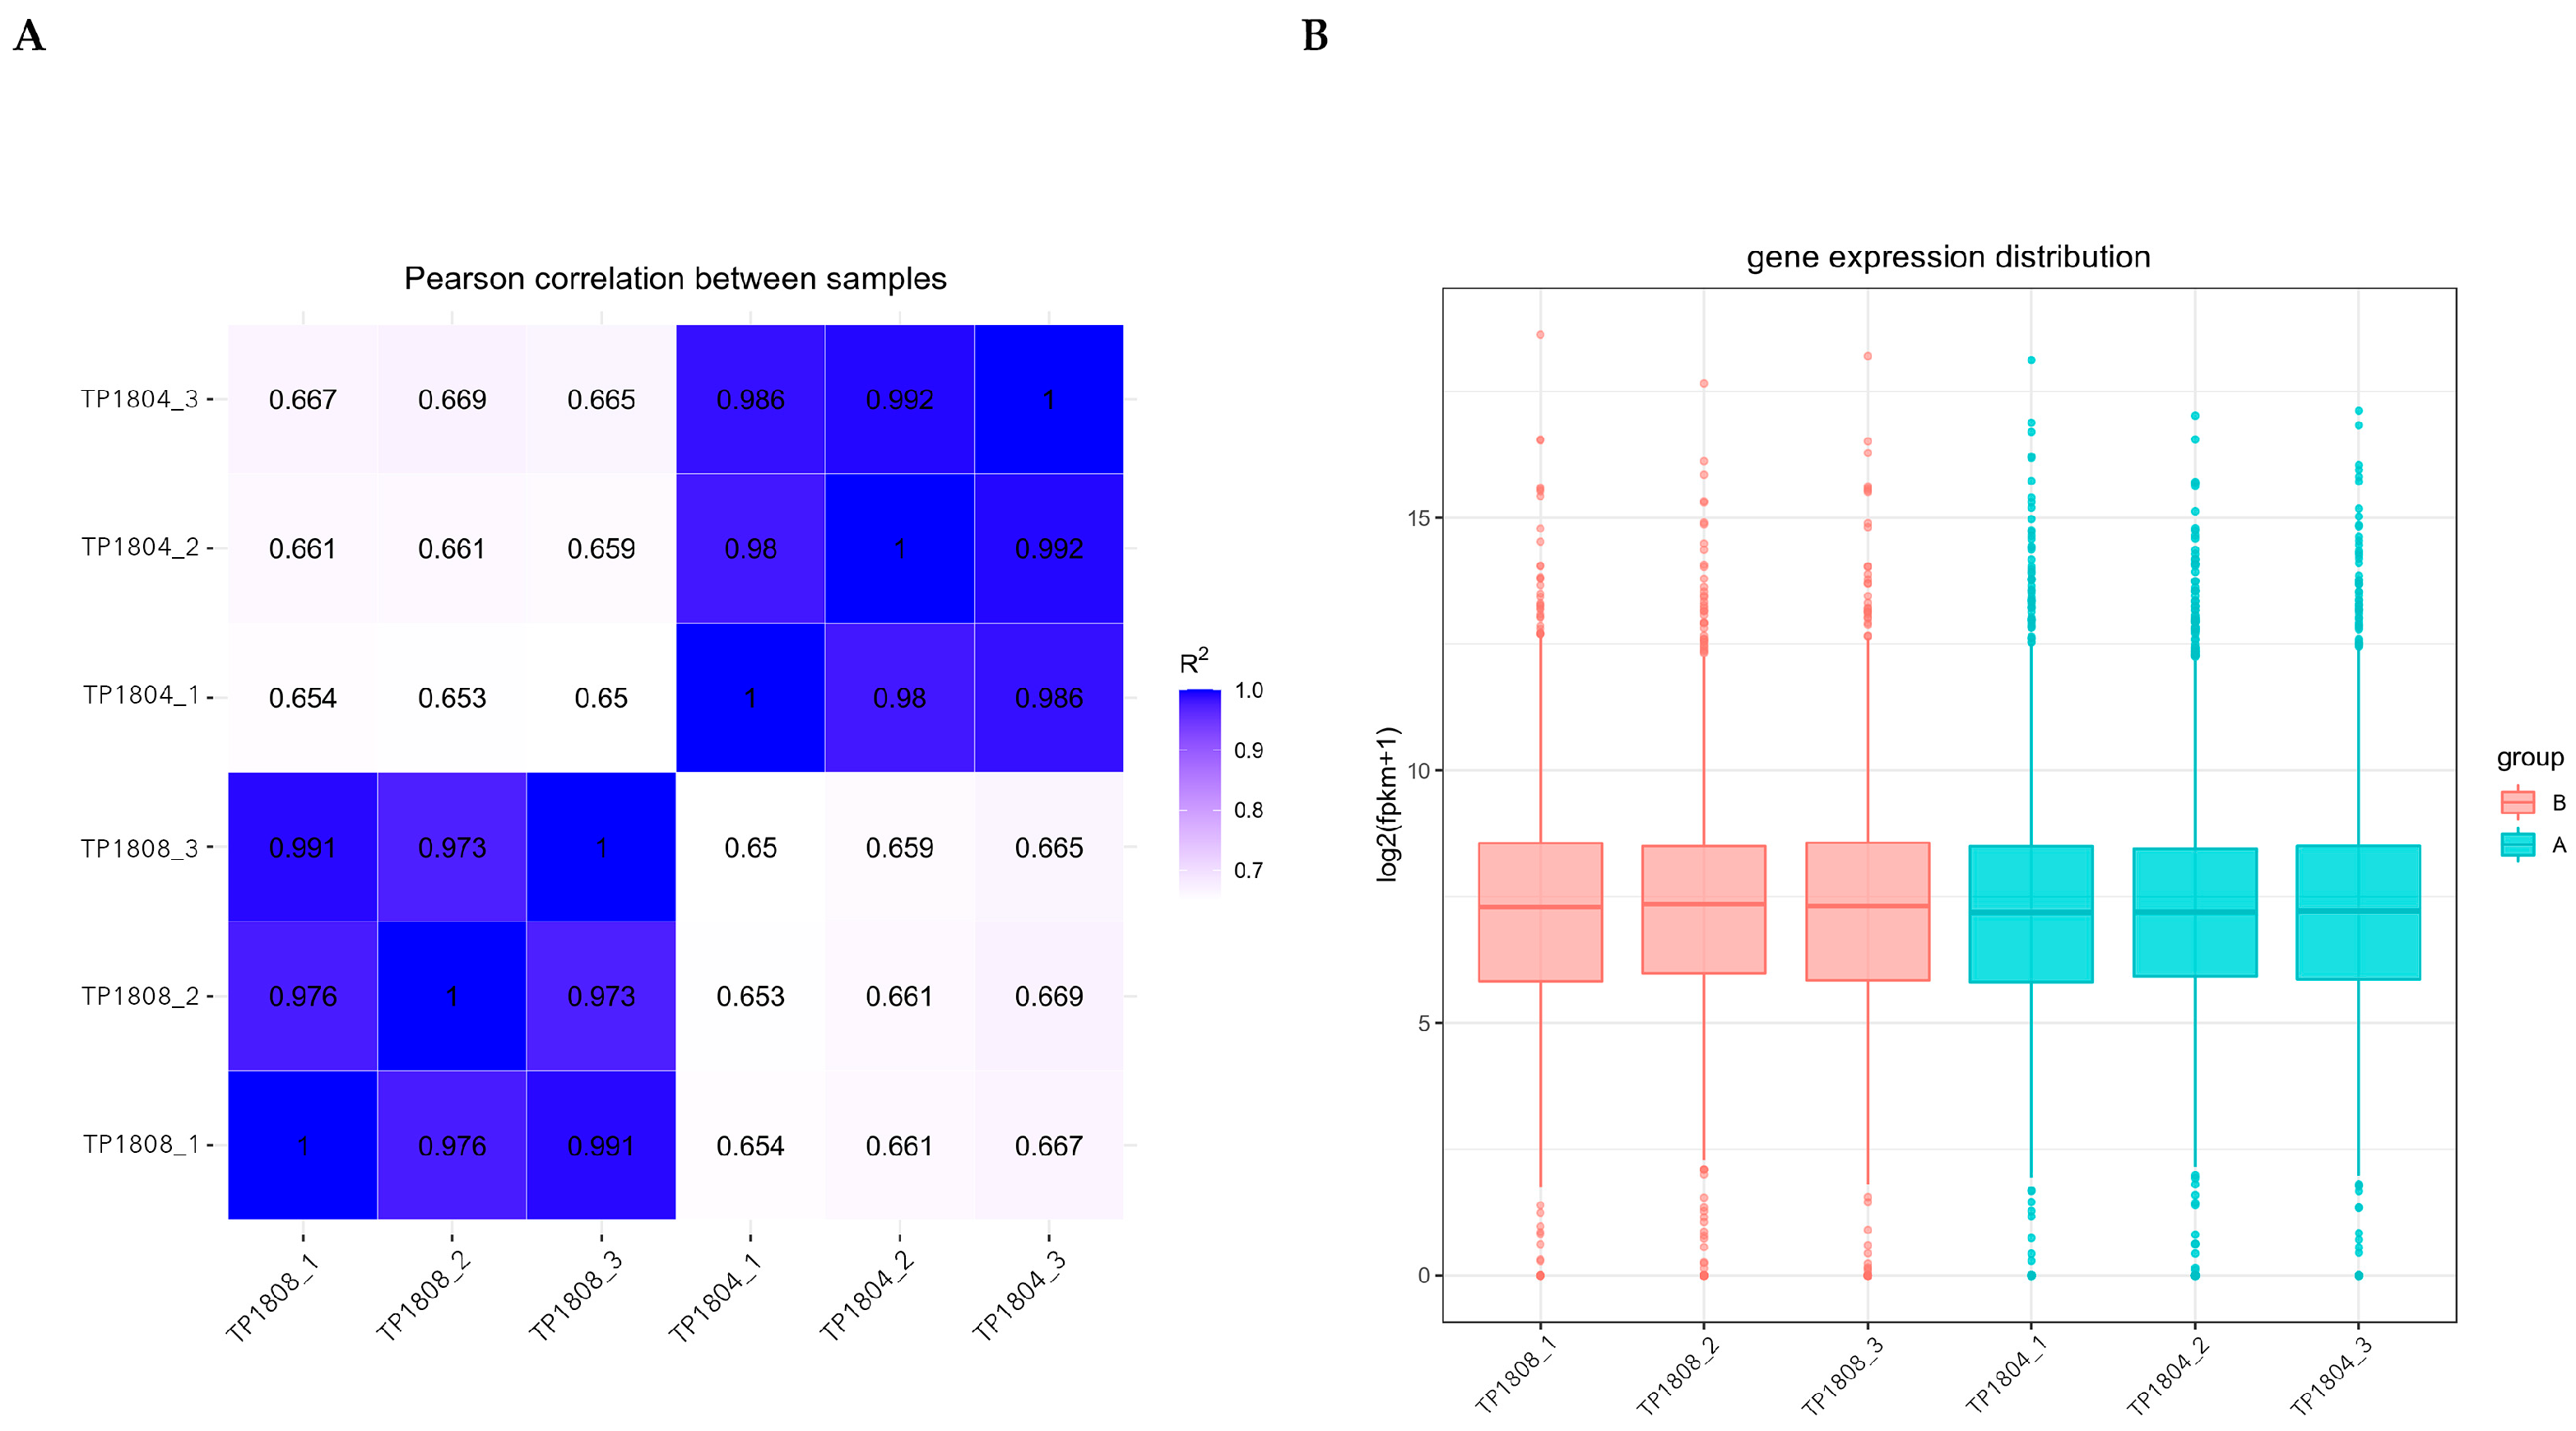
2.2. Sample Correlation and Gene Expression Distribution

The correlation between gene expression levels among samples is an important indicator for testing the reliability of experiments and the rationality of sample selection (Figure 2A). The correlation coefficients of between-group and within-group samples were calculated based on the fragments per kilobase million (FPKM) values of all genes in each sample, and a heatmap was drawn to visually display the differences between group samples and the duplication of within-group samples. The higher the correlation coefficient between samples, the closer their expression patterns are. It can be seen that the genes of the samples within the group are very close, while there are differences in the genes of the samples between groups.
Due to the influence of sequencing depth and gene length, RNA-seq gene expression values are generally not represented by read count but by FPKM, which corrects sequencing depth and gene length in sequence. After calculating the expression values (FPKM) of all genes in each sample, the distribution of gene expression levels in different samples is displayed through a box plot (Figure 2B). The box plots for each region show five statistical measures (maximum upper quartile, median, lower quartile, and minimum). The genetic differences within the group are not significant, while the genetic differences between groups are significant.

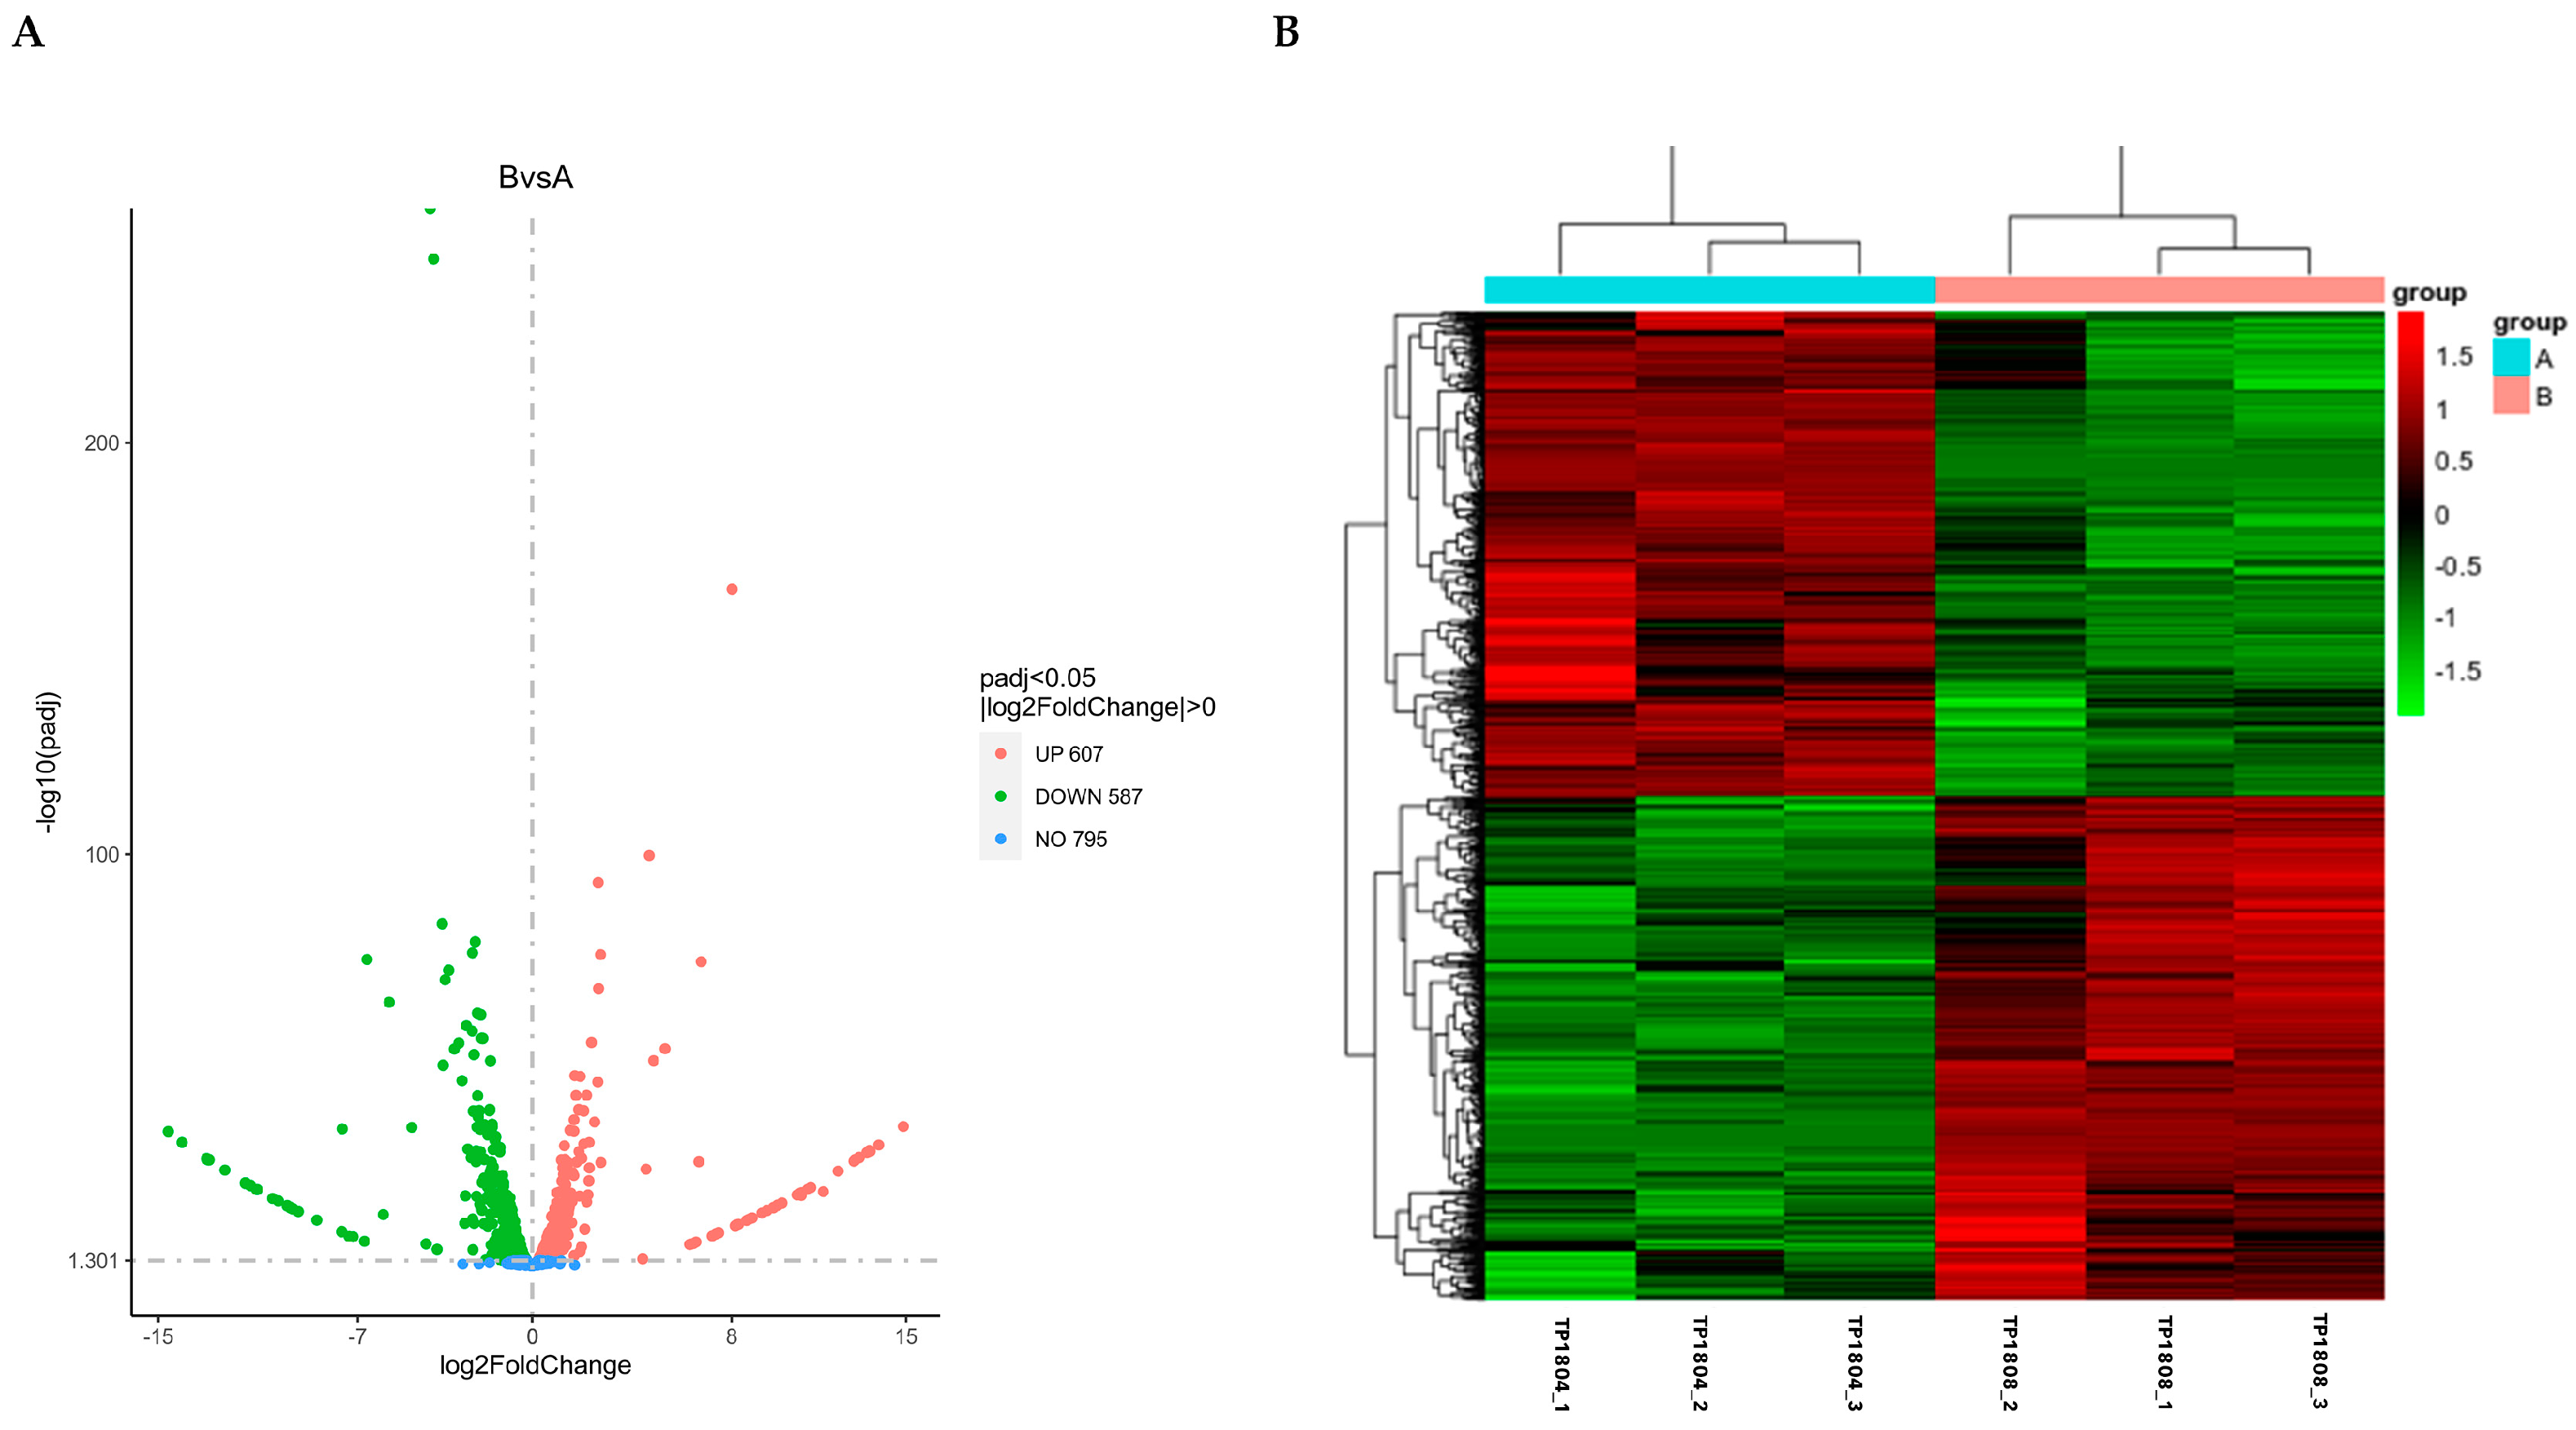
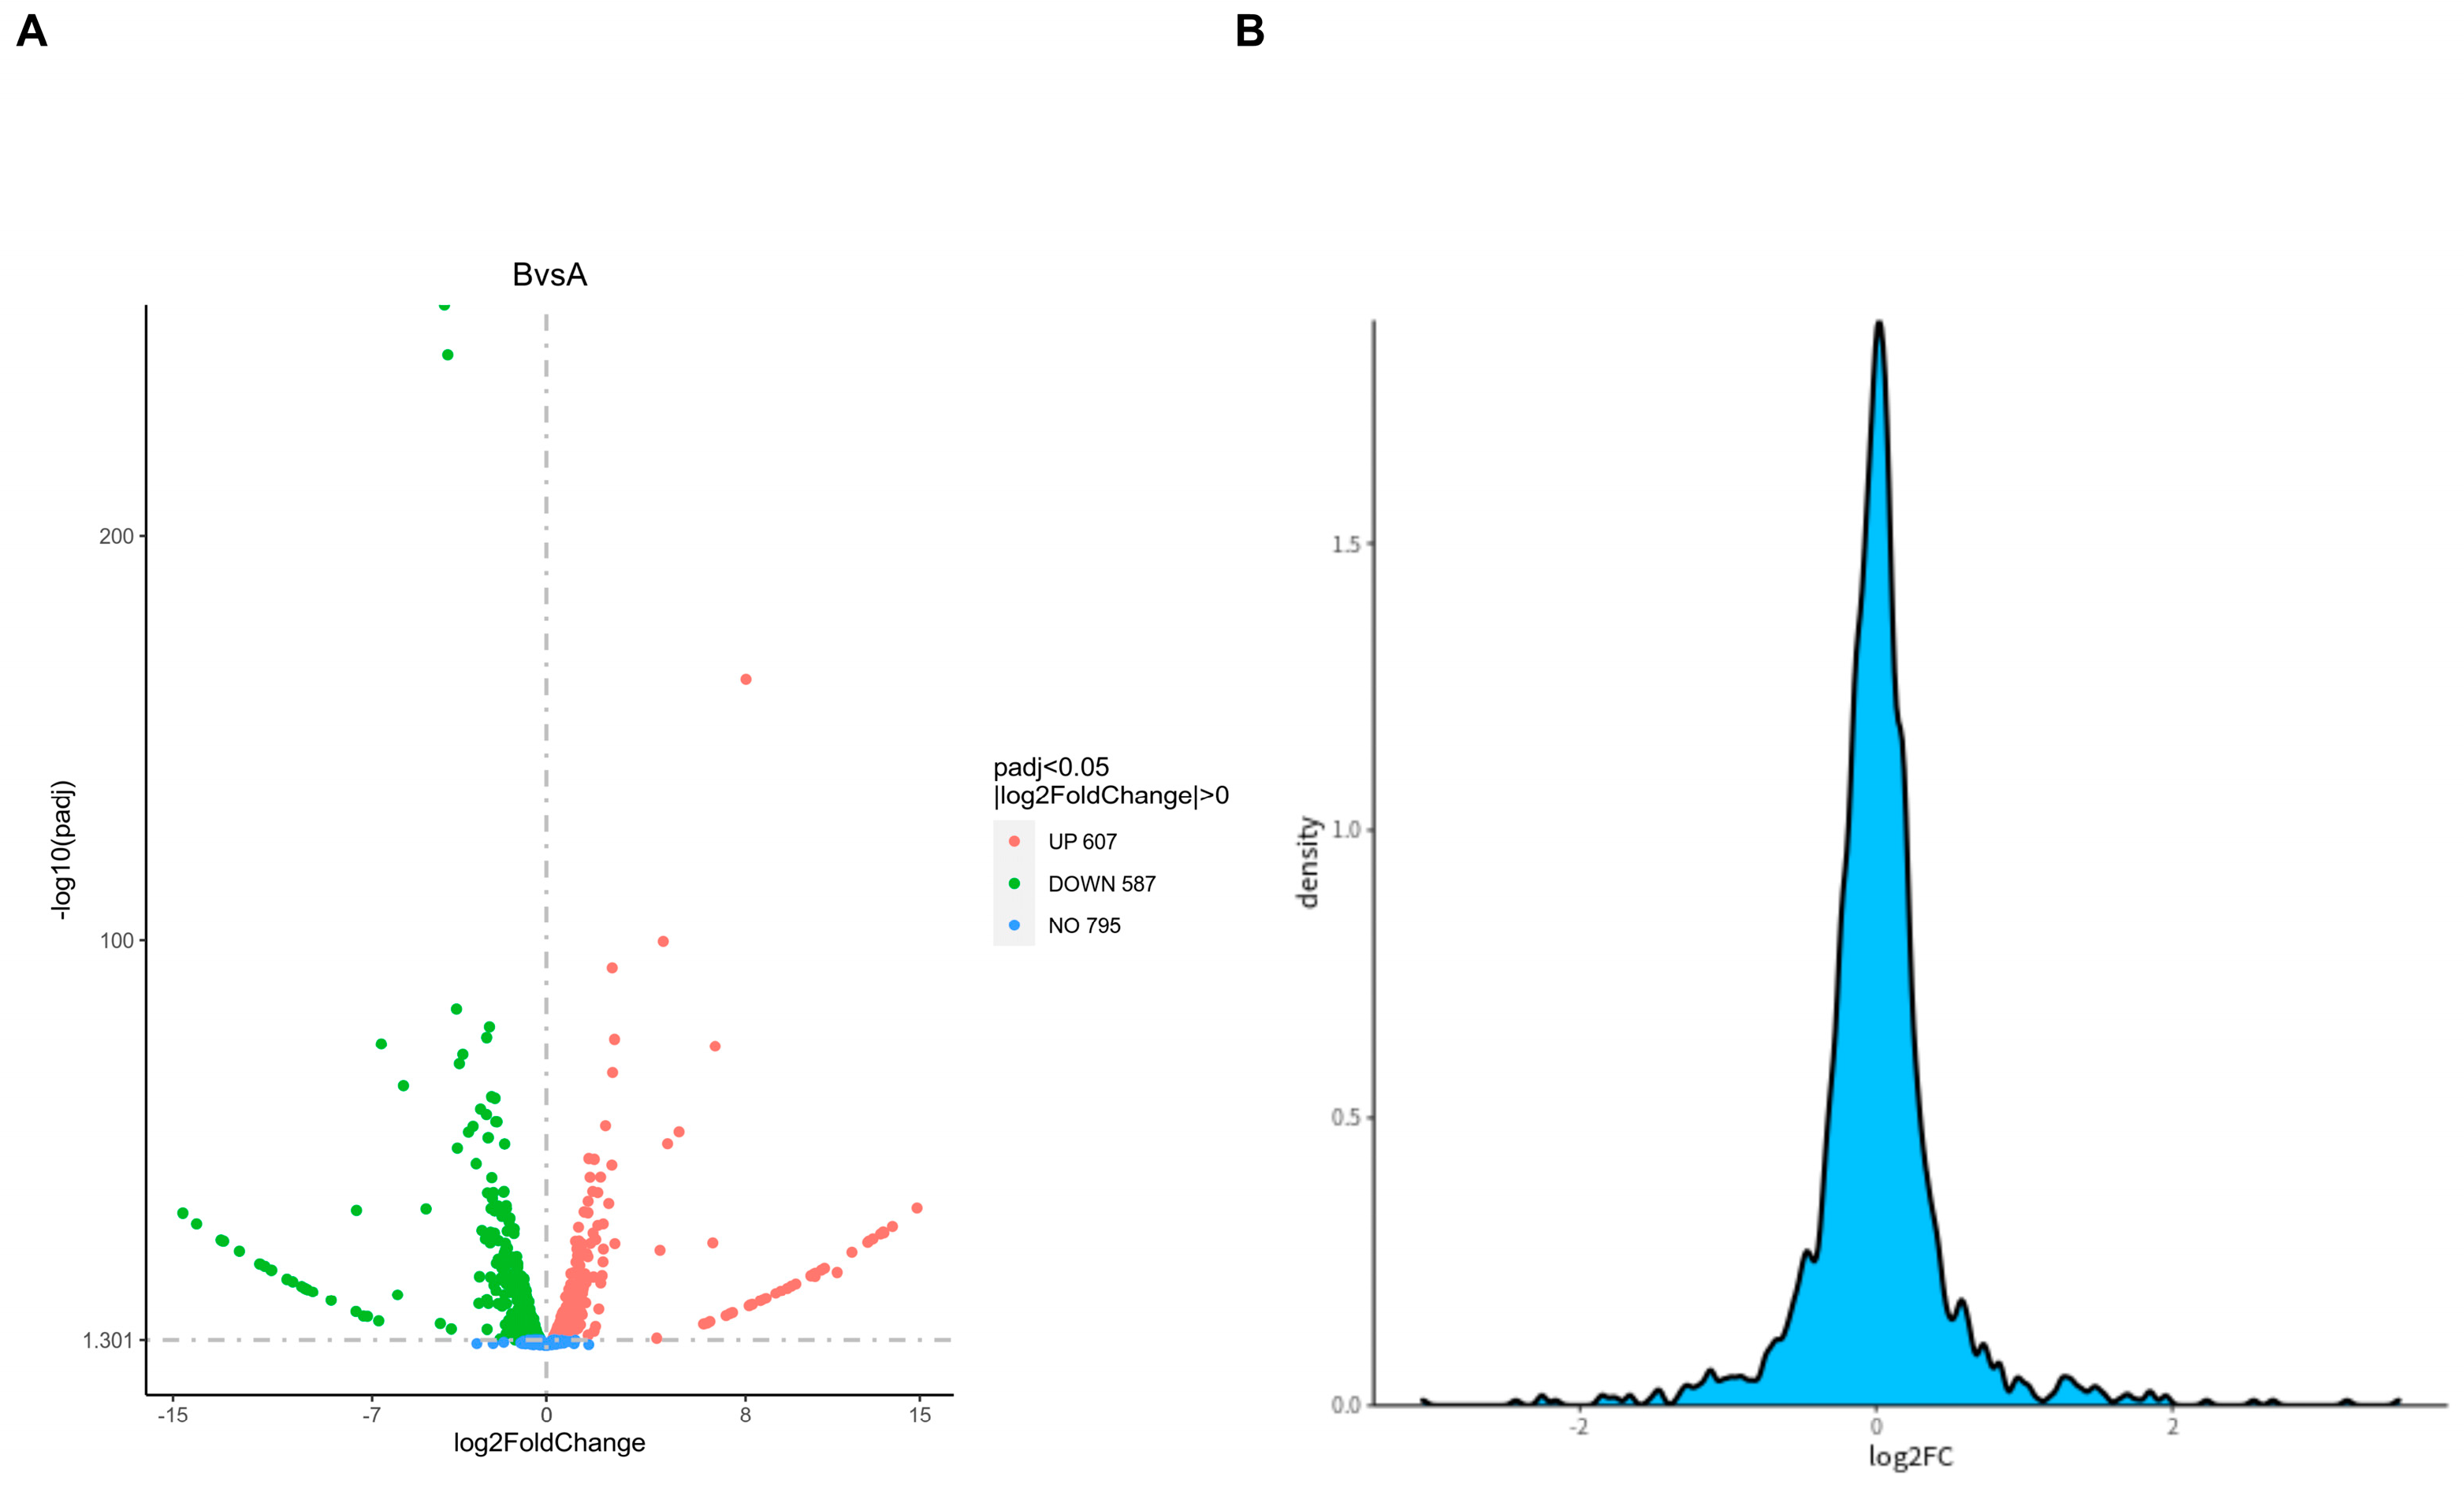
2.3. Differential Gene Analysis

The volcano map visually displays the distribution of differentially expressed genes for each comparison combination, as shown in Figure 3A. The horizontal axis represents the expression fold change in genes in the treatment and control groups denoted by log2 (Fold Change) and the vertical axis represents the significance level of gene expression differences between the treatment and the control groups denoted by −log10 (paj) or −log10 (p-value). There are 607 upregulated genes and 587 downregulated genes. The top ten genes with the most significant upregulation and downregulation are listed in Table 1 and Table 2, respectively.
Cluster analysis of differential genes is set for two or more experiments (Figure 3B). It groups genes with similar expression patterns together, which may have common functions or participate in common metabolic and signaling pathways. Mainstream hierarchical clustering was used to cluster gene expression values and normalize the rows of expression data. Genes or samples with similar expression patterns in the heatmap will be clustered together. The colors in each square do not reflect the gene expression values, but rather the values obtained by normalizing the rows of expression data. Therefore, the colors in the heatmap can only be compared horizontally (the expression of the same gene in different samples), while they cannot be compared vertically (the expression of different genes in the same sample). When comparing horizontally, red indicates high gene expression and green indicates low gene expression.

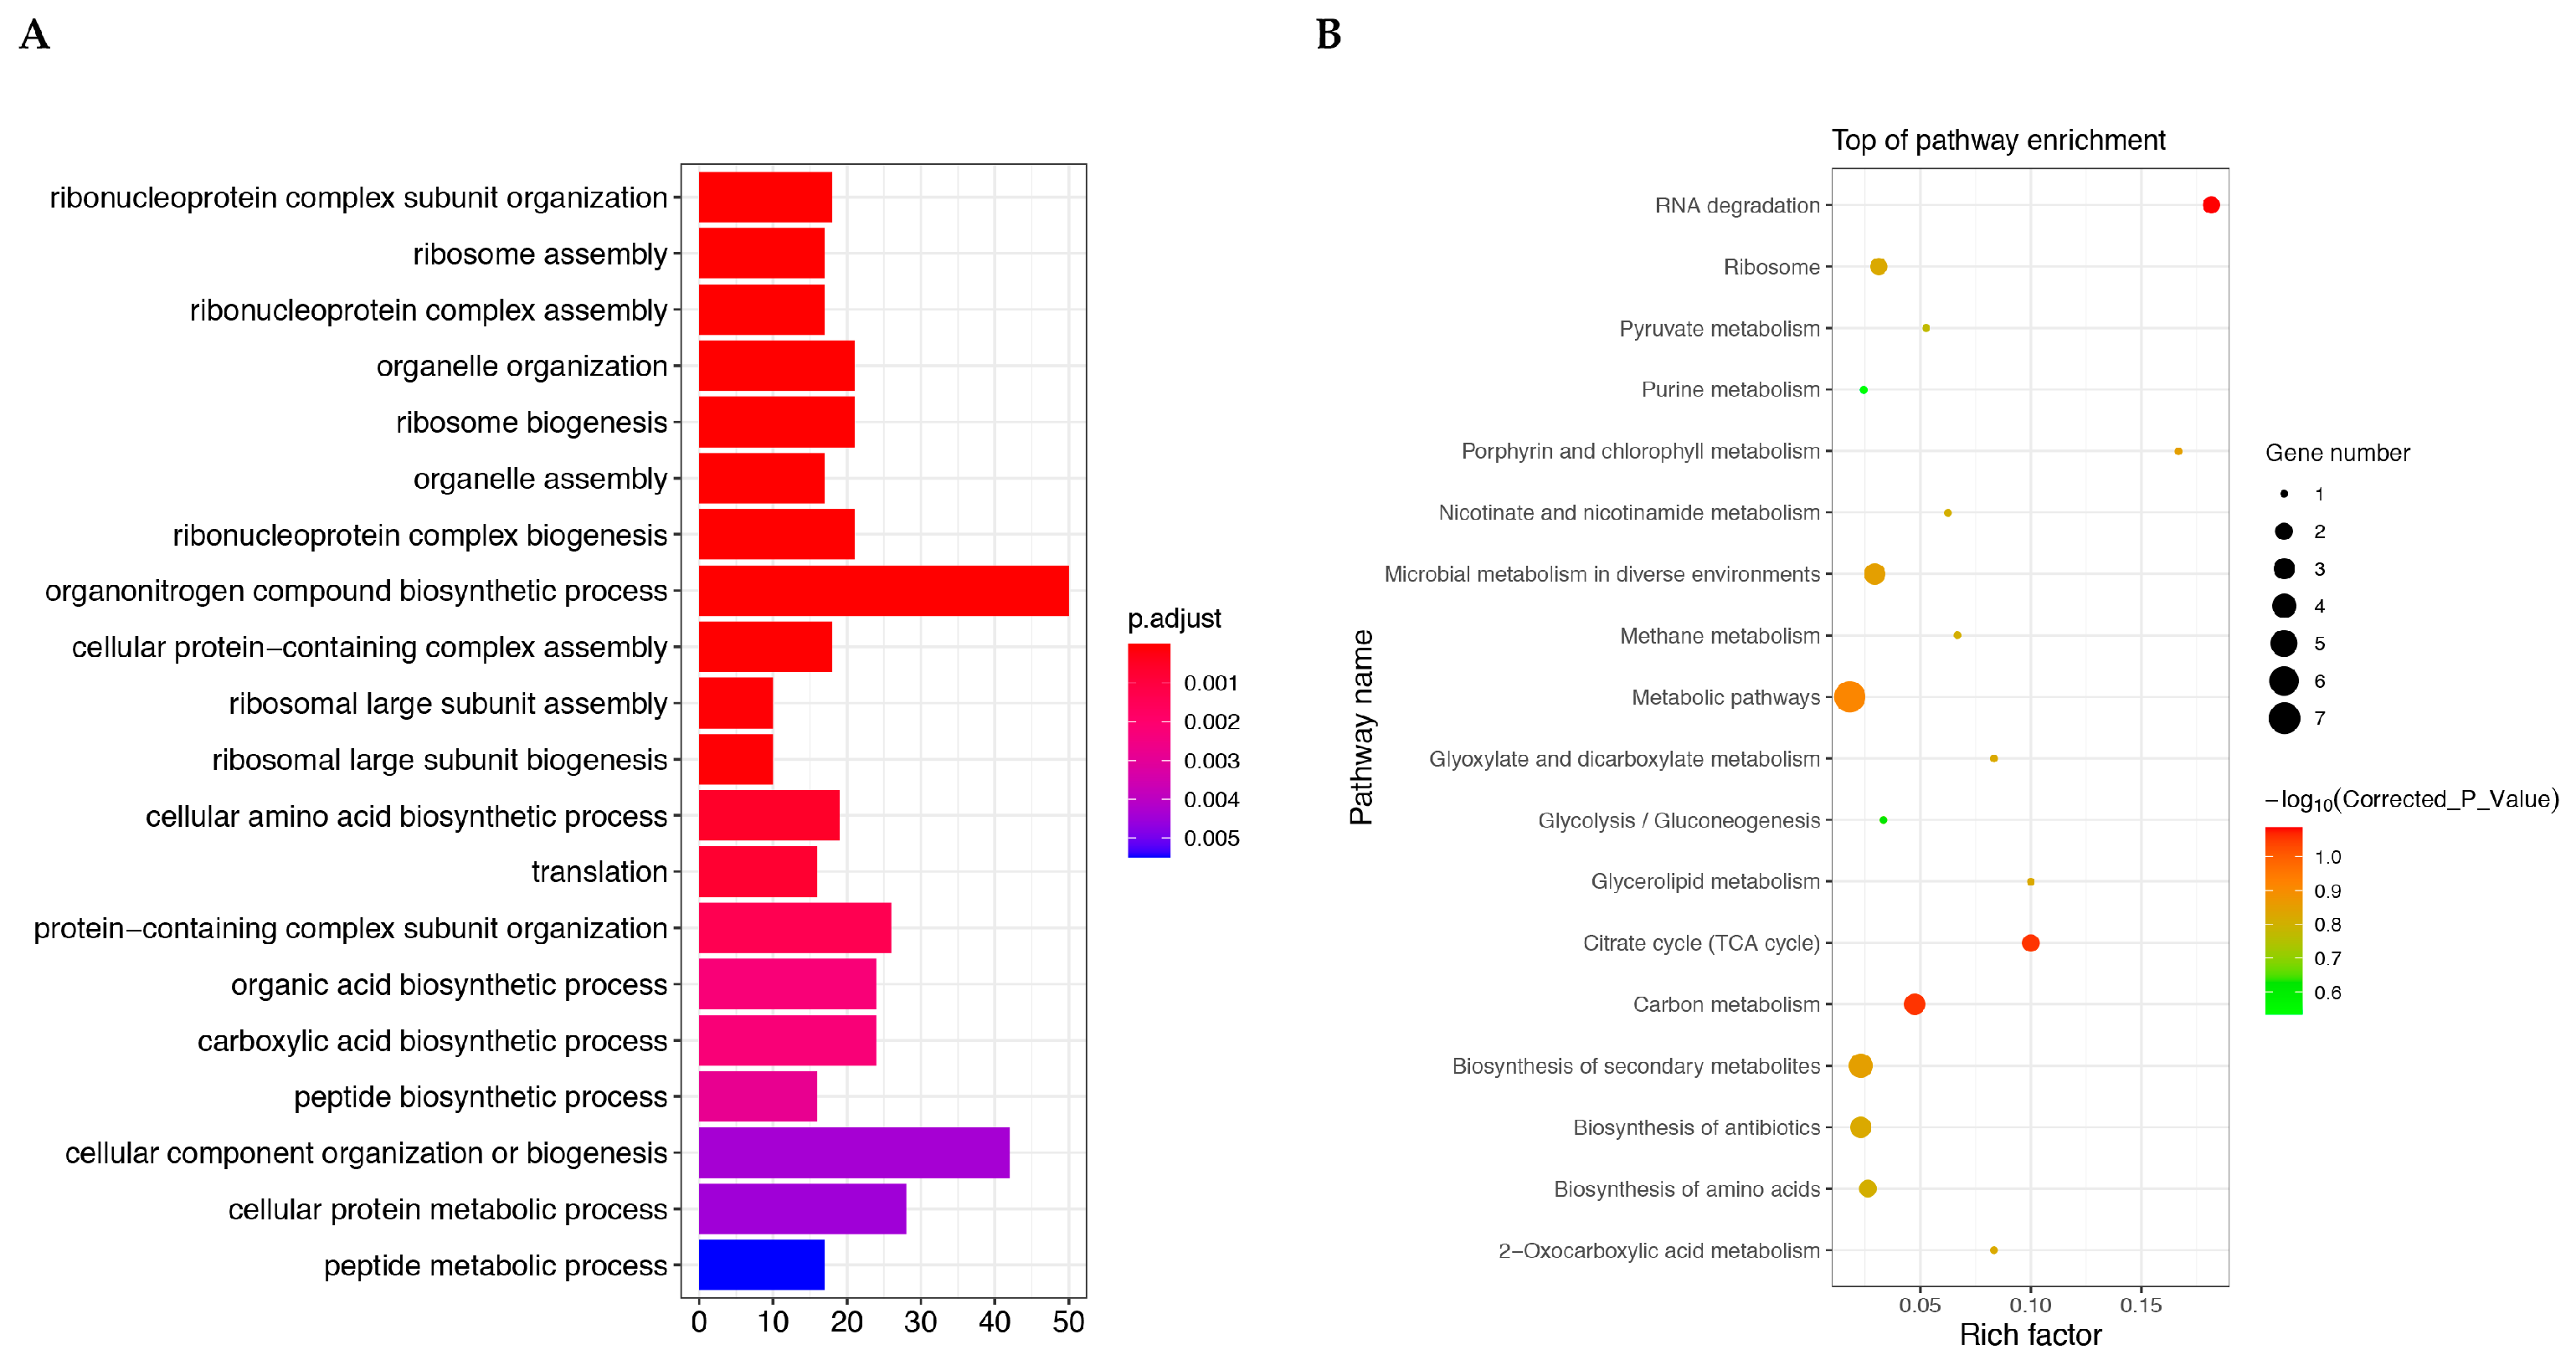
2.4. Enrichment Analysis

ClusterProfiler software virsion 4.6.1 as used to perform GO functional enrichment analysis and KEGG pathway enrichment analysis on differential gene sets (Figure 4). It shows the enrichment analysis results of all significantly different genes for all combinations. The differential gene set is obtained from significant difference analysis and annotated to GO or KEGG databases, while the background gene set is of all genes subjected to significant difference analysis and annotated to GO or KEGG databases. The enrichment analysis results enrich all sets of differentially expressed genes, upregulated differentially expressed genes, and downregulated differentially expressed genes for each differential comparison combination.
The 30 most significant terms from the GO enrichment analysis results were selected (Figure 4A). The candidate genes cover the ten most significant differences in biological process (BP), cellular component (CC), and molecular function (MF), respectively. The 20 most significant KEGG pathways from the KEGG enrichment results were selected and a scatter plot was drawn (Figure 4B). The results showed that six pathways reached the recommended significant level, which were oxidative phosphorylation, ribosome, streptomycin biosynthesis, RNA degradation, glycerophospholipid metabolism, and glycolysis/gluconeogenesis. Through the analysis of gene enrichment results of GO and KEGG, it can be seen that these genes are related to the bacterial biological process.

2.5. Principal Component Analysis (PCA)

PCA is the process of dimensionality reduction for multiple variables into a few independent variables (Figure 5). In proteomic analysis, PCA reduces the large amount of protein expression information contained in the sample into a few independent principal components for comparison between groups, facilitating the identification of outlier samples and discrimination of sample clusters with high similarity. In Figure 5A, the results show that samples within groups gather together, while samples between groups separate. There are significant differences in the genes of two different clinical T. pyogenes isolates. In Figure 5B, we show the top 10 proteins with significant differences between groups for analysis, which are 50S ribosomal proteinL7/L12, phosphopyruvate hydratase, type I plyceraldehyde-3-phosphate dehydrogenase, elongation factor G, formate C-acetyltransferase, phosphoenolpyruvate carboxykinase (GTP), class II fructose-bisphosphate aldolase, type I polyketide synthase, elongation factor Tu, and chaperonin GroEL.

2.6. Differential Expression Protein Analysis

For sample analysis with biological replicates, DESeq2 was conducted based on the negative binomial distribution (Figure 6A). By comparing each sample group pairwise, we were able to identify the proteins with differential expression in different groups. The scattered dots in the figure represent proteins. Gray dots represent proteins with no significant differences. Red dots represent significantly upregulated differential proteins. Green dots represent significantly downregulated differential proteins. The top ten proteins with the most significant upregulation and downregulation are listed in Table 3 and Table 4, respectively. Figure 6B shows the ratio of the number of proteins to the total number at this difference multiple. In theory, the vast majority of proteins have no significant differences, so the peak position of FC should be around 0 and show a normal distribution.

2.7. Differential Protein Functional Enrichment Analysis

Based on the identification of all differentially expressed proteins, we conducted enrichment analysis using GO and KEGG, with the aim of detecting whether differentially expressed proteins have significant enrichment trends in certain functional types. The differential protein GO enrichment results are shown in Figure 7A containing the top 20 sub-functions with highly significant corrected p-values. The highest gene ratio is the term of the organonitrogen compound biosynthetic process.
In organisms, different genes coordinate with each other to perform their biological functions, and significant enrichment through pathways can determine the most important biochemical metabolic pathways and signal transduction pathways involved in candidate proteins. The KEGG enrichment scatter plot of candidate proteins is a graphical display of KEGG enrichment analysis results (Figure 7B). The top 10 most significant terms are RNA degradation, citrate cycle, carbon metabolism, metabolic pathways, biosynthesis of secondary metabolites, microbial metabolism in diverse environments, porphyrin and chlorophyll metabolism, glycerolipid metabolism, biosynthesis of antibiotics, and ribosome.

3. Discussion

Analyzing the genetic characteristics of different clinical strains of T. pyogenes can better understand the pathogenic mechanism of T. pyogenes. This study used T. pyogenes with significant differences in virulence isolated from the same dairy farm as research materials, combined with genome and proteome analysis, to explore their genetic characteristics and pathogenic mechanisms. This study mainly includes the determination of growth curves and the cytotoxicity of two clinical strains of T. pyogenes, genomic analysis of differential genes between two strains of T. pyogenes, and differential proteins coded by them based on proteomics analysis.
Our previous studies have shown that both TP1804 and TP1808 express genes of plo, nanP, cbpA, fimA, fimC, and fimE [3]. These virulence factors contribute to promoting adhesion, including fimbriae, extracellular matrix-binding proteins, and neuraminidases [1]. Fimbriae, including FimA, FimB, FimC, FimE, and FimG, are involved in the adhesion and colonization of host tissue [15]. Collagen-binding protein A (CbpA) is also expressed by T. pyogenes to associate with adhesion and improve colonization by binding to extracellular matrix compounds on the surface of mammalian cells [16]. The expression levels of virulence genes are of importance to the pathogenicity of T. pyogenes [17]. However, the creation and advancement of the T. pyogenes infection may originate not only from these known factors but also from other unknown virulence factors [3,8]. It is frustrating that these unknown virulence factors have been rarely studied in depth.
Moreover, the prokaryotic transcriptome results have shown that three tRNAs showed significant differences between the two strains of T. pyogenes. The differences in tRNA mainly manifest in the initial stage of protein synthesis, involving the interaction between tRNA and ribosome translation mechanism components [18]. In eukaryotes, the initiator methyonyl-tRNA (Met-tRNAi) will not be formylated [19]. However, whether this phenomenon also applies to prokaryotes remains to be studied. This may be the main factor affecting the virulence of bacteria. As in canonical translation, the nascent chain is transferred to the Ala residue of SsrA/transfer-messenger RNA (tmRNA) in the peptidyl transferase center (PTC) and translation resumes on the open reading frame (ORF) of the SsrA mRNA-like domain [20]. Amazingly, the plo gene, which encodes the PLO toxin, is located in the ORF [6]. This indicates that the virulence of different clinical strains of T. pyogenes is closely related to the ribosomes and their biosynthesis.
Many RNA modifications were first discovered on tRNA. It is known that tRNA has the highest frequency of modifying nucleosides per length. There is an average of eight modifications per tRNA molecule in bacteria [21]. In bacteria, tRNA modification is essential for responding to stress and regulating the expression of virulence factors. It is a participant in bacterial and viral infections, such as regulating bacterial growth, adapting to stress conditions and host antiviral responses, and affecting viral replication and pathogenicity [22,23]. About 1.5% of the proteins in the E. coli proteome are required for the synthesis of different tRNA nucleotide modifications, which also shows the importance of tRNA modification in cell function [24,25]. tRNA modification plays an important role in the virulence of pathogenic bacteria. In Pseudomonas aeruginosa, tRNA-modifying enzymes are required to induce cytotoxicity in human lung epithelial cells [26]. The expression of Ttc A is upregulated under oxidative stress conditions, and the absence of this enzyme in the host model will affect virulence [27]. The deletion of Trm B affects the translation of tRNAPhe (GAA) and tRNAAsp (GUC) codon-enriched transcripts, including catalase, which decomposes hydrogen peroxide, KatA, and KatB, thereby affecting virulence [28].
In the current study, we conducted prokaryotic transcriptomics and proteomics to explore the genetic characteristics between two different strains of T. pyogenes. We found that three tRNAs showed significant differences between the two strains of T. pyogenes. However, the limitation of this study is that only two strains were investigated. More strains should be involved in future research. Determining how the control of virulence by tRNA to bacteria functions during ribosome biosynthesis also requires further study. Studying the metabolic mechanisms of these differentially expressed genes and proteins can largely stimulate the development of new biomarkers and enhance the accuracy of biomarker identification, which is of extreme importance for molecular mechanisms, biomarkers, early diagnosis of diseases, molecular typing, and prognosis.

4. Materials and Methods

4.1. Strain and Culture Medium

The strains of T. pyogenes TP1804 and TP1808 used in this study were isolated from dairy cow uterine lavage fluid and stored in 25% glycerol at −80 °C. Sheep blood culture medium and Brain–Heart Infusion (BHI) Broth were used for bacterial isolation and activation. The growth conditions of the two strains of bacteria are completely identical.

4.2. DNA Extraction and Sequencing

The DNA of T. pyogenes was extracted and the 16S gene was sequenced, as previously described [29]. Briefly, the DNA was extracted with a Solarbio bacterial DNA kit (D3350, Solarbio, Beijing, China), and PCR amplification was performed by 16S gene primers (F: AACTGGAGGAAGGTGGGGAT, R: AGGAGGTGATCCAACCGCA). The PCR products were sent to Sangon Biotech (Shanghai, China) Co., Ltd. for sequencing, and the results were analyzed using the BLAST program (National Center for Biotechnology Information, Bethesda, MD, USA).

4.3. Bacterial Growth Curves

To examine different growth rates of T. pyogenes, bacterial growth curves were measured for TP1804 and TP1808 in BHI Broth with a Turbidity meter (BioMérieux, Durham, NC, USA) as previously described [1]. The 96-well plate was put in the microplate reader (Tecan Group, Männedorf, Switzerland) at 37 °C, and OD600 was measured every hour for a continuous 24 h of measurement.

4.4. Cell Culture

The primary bovine endometrial epithelial cells (BEECs) were purchased from BeNa Culture Collection, Beijing, China. The BEECs were cultured with Dulbecco’s Modified Eagle medium/Ham’s F-12 medium (1:1) (Invitrogen, Carlsbad, CA, USA) and supplied with 10% heat-inactivated fetal horse serum (Invitrogen, Carlsbad, CA, USA) and 1% penicillin and streptomycin (Invitrogen, Carlsbad, CA, USA). After flowing evenly into cell flasks (Corning, Corning, NY, USA), the BEECs were cultured at 37 °C in an incubator with 5% CO2 atmosphere.

4.5. Lactate Dehydrogenase (LDH) Assay

The cytotoxicity was evaluated with LDH Cytotoxicity Assay (Beyotime, Beijing, China) following the instructions of the manufacturer. BEECs (2 × 10⁵ cells/well) were harvested into six-well cell culture plates (Corning, Corning, NY, USA) after reaching 80% confluency as previously described [30]. The release of LDH into the supernatant from the control cells (Medium alone) and cells challenged by TP1804 and TP1808 (1 × 10⁶ CFU/well) for 9 h was measured. A maximum-lysis control was used for uninfected cells. Cells were washed three times with PBS and incubated with 100 μL Trypsin-EDTA (0.25%, Gibico, Waltham, MA, USA) for 4 min after the supernatant was collected for LDH measurement and bacteria counting. F-12 medium (1:1, 900 μL) was added into each well and pipetted completely for cell counting. The results of cytotoxicity or mortality (%) were calculated using the following formula: % cytotoxicity = (infected LDH − control LDH)/(max lysis LDH − correction volume LDH − control LDH + background LDH) × 100%.

4.6. RNA Extraction and Transcriptomic Analysis

Total RNA was extracted with an RNAprep Pure Cell/Bacterial Kit (TIangen Biotech Co., Ltd, Beijing, China) following the manufacturer’s instruction [31]. The concentration of bacteria for RNA extraction exceeded 1 × 10⁶ CFU. The purity and integrity of total RNA were analyzed by agarose gel electrophoresis, Nanodrop (OD 260/280 ratio), Qubit 2.0, and Agilent 2100. A TruSeqTM Stranded Total RNA Library Prep Kit was used to generate sequencing libraries. Sequencing was carried out by Wekemo Tech Co., Ltd. (Shenzhen, China) on the Illumina (Miseq/Hiseq) platform. The quality control on the raw sequencing data of each sample used FastP software v0.23.4, and clean data were obtained for downstream analysis.
The Bowtie2 software v2.5.2 was used to perform genomic localization analysis on the filtered sequences [32]. If the reference genome selection is appropriate and there is no contamination in the relevant experiments, the proportion of sequencing reads successfully aligned with the genome generated by the experiment will be higher than 70% (Total Mapped Reads or Fragments), with the percentage of sequencing sequences with multiple loci (Multiple Mapped Reads or Fragments) usually not exceeding 10% of the total. ClusterProfiler software virsion 4.6.1 was used to perform Gene Ontology (GO) functional enrichment analysis and the Kyoto Encyclopedia of Genes and Genomes (KEGG) pathway enrichment analysis on differential gene sets. The differential gene set is obtained from significant difference analysis and annotated to GO or KEGG databases, while the background gene set is of all genes subjected to significant difference analysis and annotated to GO or KEGG databases. The enrichment analysis results enrich all sets of differentially expressed genes, upregulated differentially expressed genes, and downregulated differentially expressed genes for each differential comparison combination. After the quantification of gene expression is completed, statistical analysis of its expression data is required to screen for genes with significant differences in expression levels in different states of the sample.

4.7. Proteomic Analysis

Protein was extracted as previously described [31]. Briefly, each sample was washed three times with sterilized PBS, and 1 mL of radio-immunoprecipitation assay (RIPA, Solarbio, Beijing, China) buffer containing 1% phenylmethylsulfonyl fluoride (PMSF, Solarbio, Beijing, China) was added to each sample and ground for 5 min at 4 °C. The mixture was centrifuged at 12,000× g for 15 min at 4 °C after incubating with rotation at 4 °C for 10 min. The nano LC-MS/MS analysis of peptides was performed by Wekemo Tech Co., Ltd. (Shenzhen, China). Based on the identification of all differentially expressed proteins, enrichment analyses were conducted through GO and KEGG to detect whether differentially expressed proteins have significant enrichment trends in certain functional types. The experiment was repeated three times.

4.8. Statistical Analysis

All experiments were repeated three times, and data were exhibited as mean values with standard deviations. The screening criteria for significantly differentially expressed genes were FDR < 0.05, with the additional criteria of |log2 (fold change)| > 1. The differentially expressed proteins were screened by the criteria of fold change > 1.2 (over 1.2-fold upregulation) or <0.83 (downregulation), and p < 0.05 was considered statistically significant [33].

5. Conclusions

The main hemolysin of T. pyogenes is PLO, which is also recognized as a cytotoxic agent. Although all T. pyogenes strains express PLO, the cytotoxicity exhibited by different strains varies. Following a deep comparison between two strains of T. pyogenes with significant differences in virulence through prokaryotic transcriptomics and proteomics, three tRNAs showed significant differences between the two strains of T. pyogenes. Our results indicate that T. pyogenes strains with different virulence have significant differences in tRNAs during ribosome biosynthesis. However, more detailed studies on the mechanisms of virulence are still needed.

Author Contributions

Conceptualization, N.L. and Q.S.; methodology, N.L. and Q.L.; software, N.L.; validation, N.L. and Q.S.; formal analysis, N.L.; investigation, N.L.; resources, N.L. and Q.S.; data curation, N.L.; writing—original draft preparation, N.L.; writing—review and editing, N.L. and Q.S.; visualization, N.L.; supervision, Q.S.; project administration, N.L.; funding acquisition, N.L. All authors have read and agreed to the published version of the manuscript.

Funding

This research was funded by the National Key R&D program of China (Grant No. 2023YFD1801100) and the program for Postdoctoral of Heilongjiang Province (project No. LBH-Z23085).

Institutional Review Board Statement

Not applicable.

Informed Consent Statement

Not applicable.

Data Availability Statement

All experimental data are included in this article.

Acknowledgments

The authors give thanks to Zhu and Wang for providing experimental materials to support this project.

Conflicts of Interest

The authors declare no conflicts of interest.

References

  1. Zhang, Z.; Liang, Y.; Yu, L.; Chen, M.; Guo, Y.; Kang, Z.; Qu, C.; Tian, C.; Zhang, D.; Liu, M. TatD DNases Contribute to Biofilm Formation and Virulence in Trueperella pyogenes. Front. Microbiol. 2021, 12, 758465. [Google Scholar] [CrossRef]
  2. Qin, L.; Meng, F.; He, H.; Yang, Y.B.; Wang, G.; Tang, Y.D.; Sun, M.; Zhang, W.; Cai, X.; Wang, S. A Virulent Trueperella pyogenes Isolate, Which Causes Severe Bronchoconstriction in Porcine Precision-Cut Lung Slices. Front. Vet. Sci. 2021, 8, 824349. [Google Scholar] [CrossRef] [PubMed]
  3. Liu, N.; Shan, Q.; Wu, X.; Xu, L.; Li, Y.; Wang, J.; Wang, X.; Zhu, Y. Phenotypic Characteristics, Antimicrobial Susceptibility and Virulence Genotype Features of Trueperella pyogenes Associated with Endometritis of Dairy Cows. Int. J. Mol. Sci. 2024, 25, 3974. [Google Scholar] [CrossRef]
  4. Risseti, R.M.; Zastempowska, E.; Twaruzek, M.; Lassa, H.; Pantoja, J.C.F.; de Vargas, A.P.C.; Guerra, S.T.; Bolanos, C.A.D.; de Paula, C.L.; Alves, A.C.; et al. Virulence markers associated with Trueperella pyogenes infections in livestock and companion animals. Lett. Appl. Microbiol. 2017, 65, 125–132. [Google Scholar] [CrossRef]
  5. Ashrafi Tamai, I.; Mohammadzadeh, A.; Zahraei Salehi, T.; Mahmoodi, P. Genomic characterisation, detection of genes encoding virulence factors and evaluation of antibiotic resistance of Trueperella pyogenes isolated from cattle with clinical metritis. Antonie Van Leeuwenhoek 2018, 111, 2441–2453. [Google Scholar] [CrossRef] [PubMed]
  6. Shan, Q.; Ma, W.; Li, B.; Li, Q.; Wang, X.; Li, Y.; Wang, J.; Zhu, Y.; Liu, N. Revealing the Mechanism of NLRP3 Inflammatory Pathway Activation through K(+) Efflux Induced by PLO via Signal Point Mutations. Int. J. Mol. Sci. 2024, 25, 6703. [Google Scholar] [CrossRef]
  7. Tamai, I.A.; Mohammadzadeh, A.; Mahmoodi, P.; Pakbin, B.; Salehi, T.Z. Antimicrobial susceptibility, virulence genes and genomic characterization of Trueperella pyogenes isolated from abscesses in dairy cattle. Res. Vet. Sci. 2023, 154, 29–36. [Google Scholar] [CrossRef] [PubMed]
  8. Rzewuska, M.; Kwiecien, E.; Chrobak-Chmiel, D.; Kizerwetter-Swida, M.; Stefanska, I.; Gierynska, M. Pathogenicity and Virulence of Trueperella pyogenes: A Review. Int. J. Mol. Sci. 2019, 20, 2737. [Google Scholar] [CrossRef] [PubMed]
  9. Zhao, K.; Liu, M.; Zhang, X.; Wang, H.; Yue, B. In vitro and in vivo expression of virulence genes in Trueperella pyogenes based on a mouse model. Vet. Microbiol. 2013, 163, 344–350. [Google Scholar] [CrossRef] [PubMed]
  10. Jost, B.H.; Billington, S.J. Arcanobacterium pyogenes: Molecular pathogenesis of an animal opportunist. Antonie Van Leeuwenhoek 2005, 88, 87–102. [Google Scholar] [CrossRef] [PubMed]
  11. Ashrafi Tamai, I.; Mohammadzadeh, A.; Zahraei Salehi, T.; Mahmoodi, P.; Pakbin, B. Investigation of antimicrobial susceptibility and virulence factor genes in Trueperella pyogenes isolated from clinical mastitis cases of dairy cows. Food Sci. Nutr. 2021, 9, 4529–4538. [Google Scholar] [CrossRef] [PubMed]
  12. Ibrahim, M.; Peter, S.; Wagener, K.; Drillich, M.; Ehling-Schulz, M.; Einspanier, R.; Gabler, C. Bovine Endometrial Epithelial Cells Scale Their Pro-inflammatory Response In vitro to Pathogenic Trueperella pyogenes Isolated from the Bovine Uterus in a Strain-Specific Manner. Front. Cell Infect. Microbiol. 2017, 7, 264. [Google Scholar] [CrossRef] [PubMed]
  13. Rudnick, S.T.; Jost, B.H.; Billington, S.J. Transcriptional regulation of pyolysin production in the animal pathogen, Arcanobacterium pyogenes. Vet. Microbiol. 2008, 132, 96–104. [Google Scholar] [CrossRef] [PubMed]
  14. Jiang, L.; Wang, M.; Lin, S.; Jian, R.; Li, X.; Chan, J.; Dong, G.; Fang, H.; Robinson, A.E.; Consortium, G.T.; et al. A Quantitative Proteome Map of the Human Body. Cell 2020, 183, 269–283.E19. [Google Scholar] [CrossRef]
  15. Liu, M.; Wang, B.; Liang, H.; Ma, B.; Wang, J.; Zhang, W. Determination of the expression of three fimbrial subunit proteins in cultured Trueperella pyogenes. Acta Vet. Scand. 2018, 60, 53. [Google Scholar] [CrossRef] [PubMed]
  16. Pietrocola, G.; Valtulina, V.; Rindi, S.; Jost, B.H.; Speziale, P. Functional and structural properties of CbpA, a collagen-binding protein from Arcanobacterium pyogenes. Microbiology 2007, 153, 3380–3389. [Google Scholar] [CrossRef] [PubMed]
  17. Alkasir, R.; Wang, J.; Gao, J.; Ali, T.; Zhang, L.; Szenci, O.; Bajcsy, A.C.; Han, B. Properties and antimicrobial susceptibility of Trueperella pyogenes isolated from bovine mastitis in China. Acta Vet. Hung. 2016, 64, 1–12. [Google Scholar] [CrossRef] [PubMed]
  18. Graifer, D.; Karpova, G. Interaction of tRNA with eukaryotic ribosome. Int. J. Mol. Sci. 2015, 16, 7173–7194. [Google Scholar] [CrossRef] [PubMed]
  19. Hinnebusch, A.G. Molecular mechanism of scanning and start codon selection in eukaryotes. Microbiol. Mol. Biol. Rev. 2011, 75, 434–467. [Google Scholar] [CrossRef]
  20. Filbeck, S.; Cerullo, F.; Pfeffer, S.; Joazeiro, C.A.P. Ribosome-associated quality-control mechanisms from bacteria to humans. Mol. Cell 2022, 82, 1451–1466. [Google Scholar] [CrossRef] [PubMed]
  21. Zhang, W.; Foo, M.; Eren, A.M.; Pan, T. tRNA modification dynamics from individual organisms to metaepitranscriptomics of microbiomes. Mol. Cell 2022, 82, 891–906. [Google Scholar] [CrossRef] [PubMed]
  22. Mandler, M.D.; Maligireddy, S.S.; Guiblet, W.M.; Fitzsimmons, C.M.; McDonald, K.S.; Warrell, D.L.; Batista, P.J. The modification landscape of Pseudomonas aeruginosa tRNAs. RNA 2024, 30, 1025–1040. [Google Scholar] [CrossRef]
  23. Srinivasan, R.; Ramadoss, R.; Kandasamy, V.; Ranganadin, P.; Green, S.R.; Kasirajan, A.; Pillai, A.B. Exploring the regulatory role of small RNAs in modulating host-pathogen interactions: Implications for bacterial and viral infections. Mol. Biol. Rep. 2025, 52, 115. [Google Scholar] [CrossRef] [PubMed]
  24. Bjork, G.R.; Hagervall, T.G. Transfer RNA Modification: Presence, Synthesis, and Function. EcoSal Plus 2014, 6, 1–68. [Google Scholar] [CrossRef]
  25. de Crécy-Lagard, V.; Ross, R.L.; Jaroch, M.; Marchand, V.; Eisenhart, C.; Brégeon, D.; Motorin, Y.; Limbach, P.A. Survey and Validation of tRNA Modifications and Their Corresponding Genes in sp Subtilis Strain 168. Biomolecules 2020, 10, 977. [Google Scholar] [CrossRef]
  26. Lin, Q.; Huang, J.; Liu, Z.; Chen, Q.; Wang, X.; Yu, G.; Cheng, P.; Zhang, L.H.; Xu, Z. tRNA modification enzyme MiaB connects environmental cues to activation of Pseudomonas aeruginosa type III secretion system. PLoS Pathog. 2022, 18, e1011027. [Google Scholar] [CrossRef] [PubMed]
  27. Romsang, A.; Duang-Nkern, J.; Khemsom, K.; Wongsaroj, L.; Saninjuk, K.; Fuangthong, M.; Vattanaviboon, P.; Mongkolsuk, S. Pseudomonas aeruginosa ttcA encoding tRNA-thiolating protein requires an iron-sulfur cluster to participate in hydrogen peroxide-mediated stress protection and pathogenicity. Sci. Rep. 2018, 8, 11882. [Google Scholar] [CrossRef]
  28. Thongdee, N.; Jaroensuk, J.; Atichartpongkul, S.; Chittrakanwong, J.; Chooyoung, K.; Srimahaeak, T.; Chaiyen, P.; Vattanaviboon, P.; Mongkolsuk, S.; Fuangthong, M. TrmB, a tRNA m7G46 methyltransferase, plays a role in hydrogen peroxide resistance and positively modulates the translation of katA and katB mRNAs in Pseudomonas aeruginosa. Nucleic Acids Res. 2019, 47, 9271–9281. [Google Scholar] [CrossRef]
  29. Liu, N.; Wang, X.; Shan, Q.; Xu, L.; Li, Y.; Chu, B.; Yang, L.; Wang, J.; Zhu, Y. Lactobacillus rhamnosus Ameliorates Multi-Drug-Resistant Bacillus cereus-Induced Cell Damage through Inhibition of NLRP3 Inflammasomes and Apoptosis in Bovine Endometritis. Microorganisms 2022, 10, 137. [Google Scholar] [CrossRef] [PubMed]
  30. Shan, Q.; Liu, N.; Wang, X.; Zhu, Y.; Yin, J.; Wang, J. Lactobacillus rhamnosus GR-1 attenuates foodborne Bacillus cereus-induced NLRP3 inflammasome activity in bovine mammary epithelial cells by protecting intercellular tight junctions. J. Anim. Sci. Biotechnol. 2022, 13, 101. [Google Scholar] [CrossRef] [PubMed]
  31. Zhao, Y.; Min, H.; Luo, K.; Zhang, R.; Chen, Q.; Chen, Z. Transcriptomics and proteomics revealed the psychrotolerant and antibiotic-resistant mechanisms of strain Pseudomonas psychrophila RNC-1 capable of assimilatory nitrate reduction and aerobic denitrification. Sci. Total Environ. 2022, 820, 153169. [Google Scholar] [CrossRef]
  32. Langmead, B.; Salzberg, S.L. Fast gapped-read alignment with Bowtie 2. Nat. Methods 2012, 9, 357–359. [Google Scholar] [CrossRef] [PubMed]
  33. Liu, S.; Liu, Y.; Zhang, J. Proteomic mechanisms for the regulation of growth, photosynthetic activity and nitrogen fixation in Nostoc sp. PCC 7120 exposed to three antibiotic contaminants. Ecotoxicol. Environ. Saf. 2021, 225, 112753. [Google Scholar] [CrossRef] [PubMed]
Figure 1. Growth curves (A) and cytotoxicity (B). (A) Bacterial growth curves of TP1804 and TP1808 for 24 h. (B) Cytotoxicity of TP1804 and TP 1808 for 3 h, 6 h, and 9 h. The mean ± SEM of data is shown from three independent repeats (** p < 0.01, *** p < 0.001).
Ijms 26 01490 g001
Figure 2. Gene expression correlation (A) and gene expression box plot (B). (A) The horizontal and vertical axes represent the squared correlation coefficients of each sample. (B) The horizontal axis represents the sample name, and the vertical axis represents log2 (FPKM + 1).
Ijms 26 01490 g002
Figure 3. Volcano map of differential gene analysis (A) and differential gene clustering heatmap (B). (A) The horizontal axis presents the log2 (fold change) and the vertical axis represents −log10 (paj) or −log10 (p-value); upregulated genes are represented by red dots, while downregulated genes are represented by green dots; (B) the horizontal axis represents the sample name and the vertical axis represents the normalized value of the differential gene FPKM.
Ijms 26 01490 g003
Figure 4. GO function enrichment analysis (A) and KEGG pathway enrichment analysis (B). (A) The horizontal axis represents GO Term and the vertical axis represents the significance level of GO Term enrichment, denoted by −log10 (padj). Different colors indicate different functional classifications. The 30 most significant terms from the GO enrichment analysis results were selected, and a bar chart for display was drawn. If there were less than 30 terms, we drew a bar chart for all terms, classified by biological processes, cellular components, and molecular functions, as well as differentially expressed genes. (B) The horizontal axis represents the ratio of the number of differentially expressed genes annotated onto the KEGG pathway to the total number of differentially expressed genes, while the vertical axis represents the KEGG pathway.
Ijms 26 01490 g004
Figure 5. Sample grouping PCA analysis (A) and the principal component diagram of the top ten contributions (B).
Ijms 26 01490 g005
Figure 6. Differential protein volcano diagram (A) and differential multiple density plot (B). (A) The horizontal axis represents the expression fold changes in proteins in different experimental groups/samples, and the vertical axis represents the statistical significance of changes in protein expression levels. (B) The X-axis represents log2 (FC) and the Y-axis represents the fold density of proteins between groups.
Ijms 26 01490 g006
Figure 7. Candidate protein GO function enrichment analysis (A) and KEGG pathway enrichment analysis (B). (A) The vertical axis represents the GO term at the next level of the three major categories and the horizontal axis represents the number of candidate proteins annotated under that term (including its subterms). (B) The top 20 enriched pathway entries were selected for display in (B). If there are less than 20 enriched pathway entries, they will all be displayed. p-value is the corrected p-value.
Ijms 26 01490 g007
Table 1. Upregulated gene statistics results (Top 10).
ID/NameDescriptionLog2 FCp-Value
CQ11_RS06575hypothetical protein8.018815177098066.24680407290023 × 10−168
CQ11_RS07205choice-of-anchor M domain-containing protein4.694058278576623.98052216466355 × 10−103
CQ11_RS00725hypothetical protein2.64371612091021.7332343504935 × 10−96
CQ11_RS07305HD domain-containing protein2.737228653108651.07719646567085 × 10−78
CQ11_RS11205DUF1349 domain-containing protein6.779078775225277.36392725346365 × 10−77
CQ11_RS00105rhodanese-like domain-containing protein2.658613365143933.45483260566808 × 10−70
CQ11_RS08465dimethyl sulfoxide reductase anchor subunit2.375094517391126.22678372311554 × 10−57
CQ11_RS05835hypothetical protein5.328341239178152.18027298280556 × 10−55
CQ11_RS10335tRNA-Met4.867926261745942.23813376131865 × 10−52
CQ11_RS02580/pheTPhenylalanine tRNA ligase subunit beta/Ferredoxin-fold anticodon binding domain1.705672002965191.02370047692426 × 10−48
Table 2. Downregulated gene statistics results (Top 10).
ID/NameDescriptionLog2 FCp-Value
CQ11_RS04815peptidoglycan bridge formation glycyltransferase FemA/FemB family protein−4.095984343096140
CQ11_RS04810UDP-N-acetylmuramate dehydrogenase/UDP-N-acetylenolpyruvoylglucosamine reductase−3.962070952644882.17463477730769 × 10 −248
CQ11_RS04820/rpmG50S ribosomal protein L33−3.611499215778852.49897333558599 × 10 −86
CQ11_RS06175universal stress protein−2.286354331733047.53326393741449 × 10 −82
CQ11_RS04790phosphotransferase−2.398487224722873.50225282301118 × 10 −79
CQ11_RS05950hypothetical protein−6.632266465053961.89968005619395 × 10 −77
CQ11_RS04825tRNA-Met−3.356648806555729.57703127155594 × 10 −75
CQ11_RS07665type IV toxin-antitoxin system AbiEi family antitoxin domain-containing protein−3.496048625853572.04467148122348 × 10 −72
CQ11_RS03615tRNA-Glu−5.742279573276546.64897669722015 × 10 −67
CQ11_RS01540RNA-binding S4 domain-containing protein−2.202574477740723.71201280550628 × 10 −64
Table 3. Upregulated protein statistics results (Top 10).
ID/NameDescriptionLog2 FCp-Value
WP_024963008.1sulfatase-like hydrolase/transferase0.9760302376428281.02255789360905 × 10−53
WP_024963088.1hypothetical protein0.480387248061139.16585334898564 × 10−21
WP_024963127.1/pknBStk1 family PASTA domain-containing Ser/Thr kinase0.06827839031468630.016432574900883
WP_024963128.1penicillin-binding protein0.0694730850834760.0497705393613076
WP_024963167.1threonylcarbamoyl-AMP synthase0.1832027490336430.0000800968930751222
WP_024963168.1hypothetical protein0.192007663133860.000144392977367676
WP_024963245.1dCTP deaminase0.1288533016973930.0114288489838083
WP_024963273.1/sufBFe-S cluster assembly protein SufB0.08719935863679440.000183042840201825
WP_024963278.1SUF system NifU family Fe-S cluster assembly protein0.7977696035207334.35880831787613 × 10−15
WP_024963289.1NfeD family protein0.4416820513911751.42689523273307 × 10−8
Table 4. Downregulated protein statistics results (Top 10).
ID/NameDescriptionLog2 FCp-Value
WP_024963019.1DUF3039 domain-containing protein−0.2969620549443210.0000746811041672553
WP_024963030.1peroxiredoxin−0.3195494841832037.9950611280789 × 10−27
WP_024963103.1ferredoxin family protein−0.1794680515870510.00566840136579069
WP_024963105.1citrate synthase−0.4155826608378125.97700695284514 × 10−67
WP_024963116.1DNA topoisomerase (ATP-hydrolyzing) subunit B−0.1272991787625010.0000394313454208064
WP_024963121.1hypothetical protein−0.246360308143530.0398927209768755
WP_024963122.1peptidylprolyl isomerase−0.08302560301057120.000222111411178628
WP_024963141.1ribonuclease HI−0.131866396407180.0419950883999149
WP_024963170.1DUF3145 domain-containing protein−0.3438414821447340.0231910525838472
WP_024963187.1deoxyguanosinetriphosphate triphosphohydrolase−0.07965918237120230.0354396623845714
Disclaimer/Publisher’s Note: The statements, opinions and data contained in all publications are solely those of the individual author(s) and contributor(s) and not of MDPI and/or the editor(s). MDPI and/or the editor(s) disclaim responsibility for any injury to people or property resulting from any ideas, methods, instructions or products referred to in the content.

