Article

Further Insights into the Gut Microbiota of Cow’s Milk Allergic Infants: Analysis of Microbial Functionality and Its Correlation with Three Fecal Biomarkers

by
Elisa Zubeldia-Varela
1,
Tomás Clive Barker-Tejeda
1,2,
Leticia Mera-Berriatua
1,
Raphaëlle Bazire
3,
Paula Cabrera-Freitag
4,
Carles Ubeda
5,6,
Domingo Barber
1,
María Pilar Francino
6,7,
David Rojo
2,
María Dolores Ibáñez-Sandín
3,† and
Marina Pérez-Gordo
1,*,†
1
Departamento de Ciencias Médicas Básicas, Instituto de Medicina Molecular Aplicada (IMMA) Nemesio Díez, Facultad de Medicina, Universidad San Pablo-CEU, CEU Universities, 28668 Boadilla del Monte, Spain
2
Centro de Metabolómica y Bioanálisis (CEMBIO), Facultad de Farmacia, Universidad San Pablo-CEU, CEU Universities, 28668 Boadilla del Monte, Spain
3
Department of Allergy, H. Infantil Universitario Niño Jesús, FibHNJ, ARADyAL-RETICs Instituto de Salud Carlos III, IIS-P, 28031 Madrid, Spain
4
Allergy Paediatric Unit, Allergy Service, Hospital General Universitario Gregorio Marañón, Gregorio Marañón Health Research Institute (IiSGM), 28007 Madrid, Spain
5
Fundació per al Foment de la Investigació Sanitària i Biomèdica de la Comunitat Valenciana (FISABIO), 46020 Valencia, Spain
6
CIBER en Epidemiología y Salud Pública, 28029 Madrid, Spain
7
Joint Research Unit in Genomics and Health, Fundació per al Foment de la Investigació Sanitària i Biomèdica de la Comunitat Valenciana (FISABIO) and Institut de Biologia Integrativa de Sistemes (Universitat de València/Consejo Superior de Investigaciones Científicas), Avda. Catalunya 21, 46020 València, Spain
*
Author to whom correspondence should be addressed.
These authors contributed equally to this work.
Int. J. Mol. Sci. 2023, 24(11), 9247; https://doi.org/10.3390/ijms24119247
Submission received: 4 May 2023 / Revised: 17 May 2023 / Accepted: 19 May 2023 / Published: 25 May 2023

Abstract

:
Cow’s milk allergy (CMA) is one of the most prevalent food allergies in children. Several studies have demonstrated that gut microbiota influences the acquisition of oral tolerance to food antigens at initial stages of life. Changes in the gut microbiota composition and/or functionality (i.e., dysbiosis) have been linked to inadequate immune system regulation and the emergence of pathologies. Moreover, omic sciences have become an essential tool for the analysis of the gut microbiota. On the other hand, the use of fecal biomarkers for the diagnosis of CMA has recently been reviewed, with fecal calprotectin, α-1 antitrypsin, and lactoferrin being the most relevant. This study aimed at evaluating functional changes in the gut microbiota in the feces of cow’s milk allergic infants (AI) compared to control infants (CI) by metagenomic shotgun sequencing and at correlating these findings with the levels of fecal biomarkers (α-1 antitrypsin, lactoferrin, and calprotectin) by an integrative approach. We have observed differences between AI and CI groups in terms of fecal protein levels and metagenomic analysis. Our findings suggest that AI have altered glycerophospholipid metabolism as well as higher levels of lactoferrin and calprotectin that could be explained by their allergic status.

1. Introduction

The human microbiota is a complex ecosystem in which bacteria, fungi, viruses, archaea, and parasites cohabit within the human body. Among all its components, bacteria are the most abundant [1]. Among the body’s microbial ecosystems, the most complex, diverse, and numerous is the one associated with the gastrointestinal tract (GIT), where the density of microorganisms increases from the stomach to the colon [2]. Feces are representative of the microbiota composition of the colon, which, together with their noninvasive collection method, make them the biological sample of election for the study of the gut microbiota [3,4,5].
The gut microbiota composition changes throughout life. It is thought that 70% of the gut microbiota primary colonization occurs through maternal transmission [6,7], and that the first 1000 days of life, where the body encounters for the first time with external factors, are crucial [8]. Moreover, the development of the gut microbiota in the first years of life correlates with the development and maturation of the intestine and the immune system. From birth, there is a symbiotic relationship between the microbiota and human cells, which evolves over time, adapting to changes. After the first 2–3 years of life, the gut microbiota becomes similar to what it will be for the rest of the human’s life [1,9]. Notably, multiple factors such as age, nutrition, use of antibiotics, lifestyle, and environmental conditions have an impact on the gut microbiota’s dynamic composition [4,10,11].
The greatest source of stimulation of the immune system is found in the mucous surfaces of the body. About 70–80% of the immune system cells are found in the small and large intestines [12,13]. The gut microbiota stimulates and modulates the immune system by a dendritic cell-mediated immune regulation. Microbes promote the differentiation of regulatory T cells by the activation of dendritic cells present in the mucous surface of the intestine through the Toll-like receptor (TLR) pathway [14]. These activated cells produce cytokines that in turn activate naïve T cells or Th0 cells so that they mature towards the corresponding T cell subtype, Th1, Th2, Th17, or regulatory T cells. In healthy individuals, all Th cell subpopulations are present in a dynamic balance with regulatory T cells [15].
The prevalence of allergic diseases has increased in the last decades [16], with cow’s milk allergy (CMA) being one of the most prevalent food allergies in children. Several studies have demonstrated that the presence of certain bacteria in our GIT mediates the initiation of tolerogenic responses to antigens [17,18,19]. Dysbiosis—changes in the microbiota’s composition and/or functionality—has been linked to inadequate immune system regulation and the emergence of pathologies that are not just GIT-related. Several studies have shown a link between lung microbiota and respiratory allergy, as well as skin microbiota and the development of atopic dermatitis, and gut microbiota and food allergies [15,20,21,22,23].
It is not clear, however, whether the imbalance of the gut microbiota is a cause that triggers the disease or, on the contrary, it is a consequence of the disease that alters the bacterial populations and their functionality. To shed light on this issue, the omics technique of metagenomics has been used. Shotgun metagenomic sequencing offers an excellent approach to the study of the gut microbiota, as it allows researchers to determine its associated biological functions through DNA analysis [24,25]. This omic technique provides data about which metabolic pathways are encoded in the microbial genome, thus providing insight into microbial biological functions [26].
On the other hand, the use of fecal biomarkers for the diagnosis of CMA has recently been reviewed [27]. The proteins most studied as potential fecal biomarkers of this disease are fecal calprotectin, α-1 antitrypsin, and lactoferrin [28,29,30,31,32]. α1-Antitrypsin is a non-dietary serum protein synthesized in the liver [33]. It is resistant to digestive degradation and can therefore be reliably used to assess excessive gastrointestinal protein losses [32,34]. Lactoferrin is a globular protein belonging to the family of transferrin, non-heme iron-binding glycoproteins [35]. Lactoferrin was first described in mammalian milk [36]. It is also part of other secretions in the body and is produced by hematopoietic tissue in the bone marrow as part of neutrophil granules [37,38]. In addition, lactoferrin acts as a prominent component of the host’s first line of defense against infection and inflammation [39,40,41]. Finally, calprotectin is an immunomodulatory, antimicrobial, and antiproliferative protein that is present in the cytoplasm of neutrophils, in macrophage membranes, in activated monocytes, and in mucosal epithelial cells [42,43]. Among them, calprotectin has been the most discussed, and has been the subject of a recent systematic review for its use as a biomarker in CMA [44].
By using shotgun metagenomic sequencing, this study aimed to evaluate functional changes in the fecal gut microbiota of cow’s milk allergic infants (AI) compared to control infants (CI), aged between 4 and 6 months, and to determine the relationship between these findings and the levels of the fecal biomarkers α-1 antitrypsin, lactoferrin, and calprotectin.

2. Results

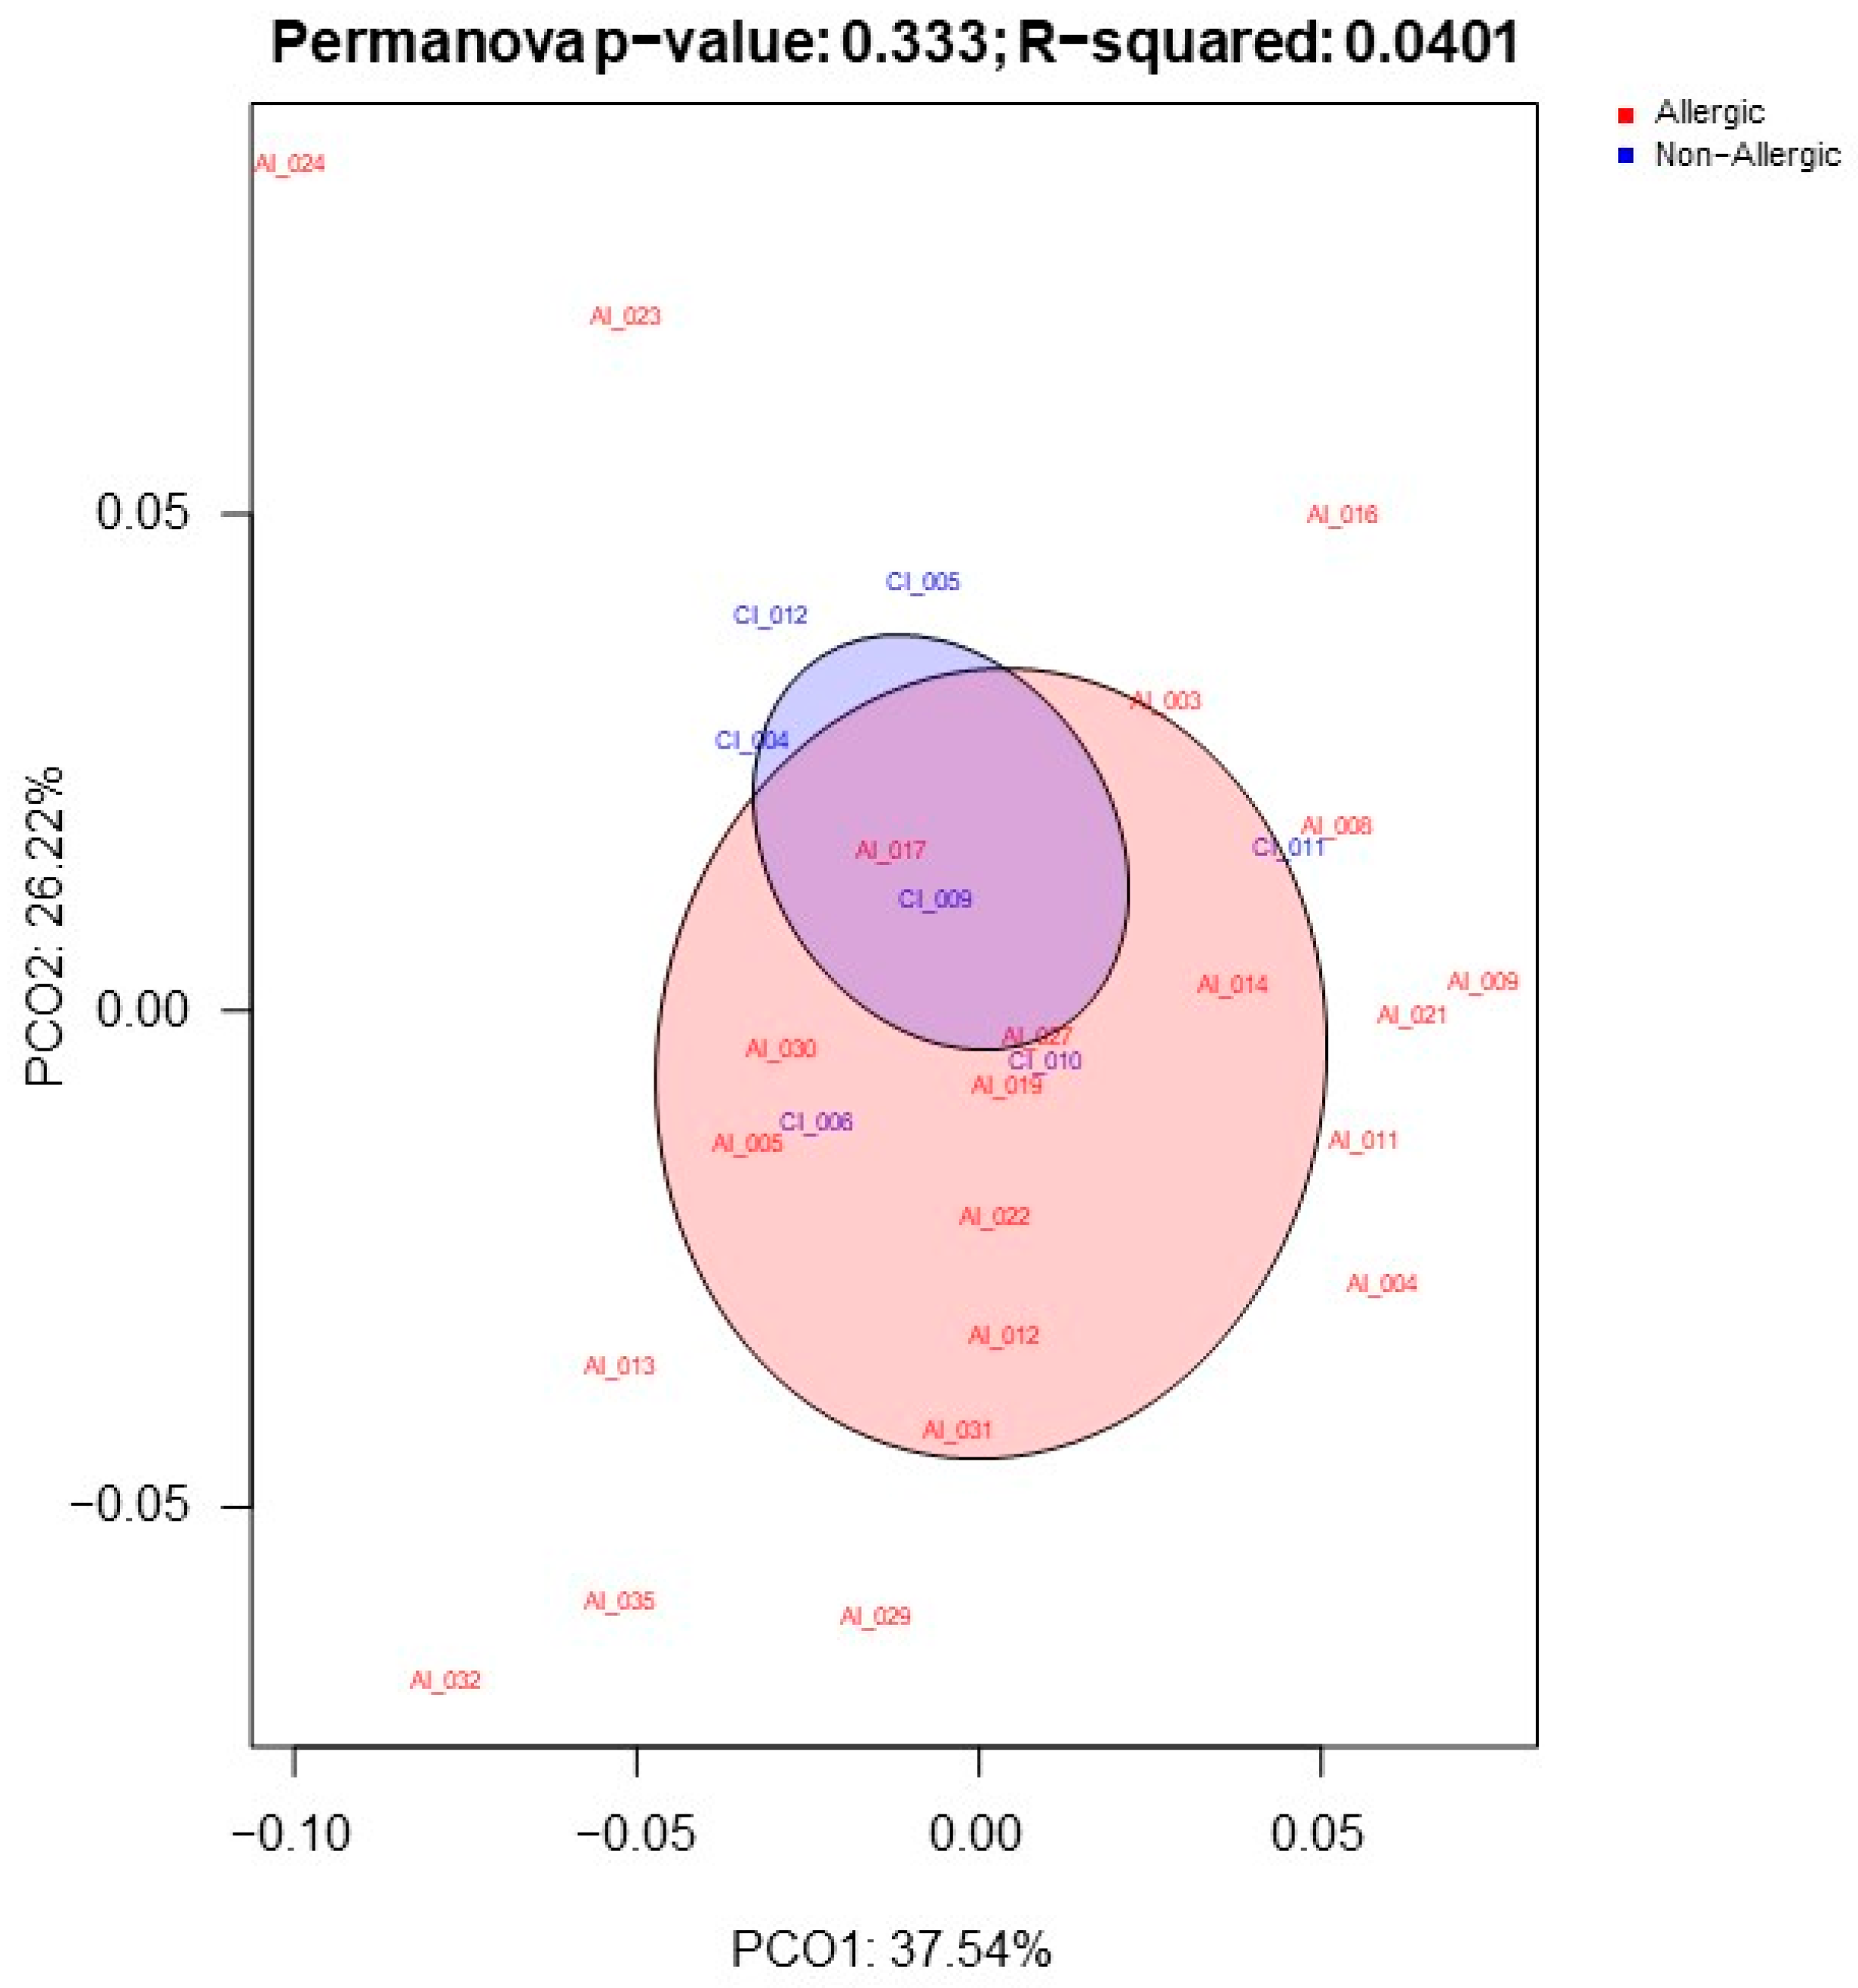
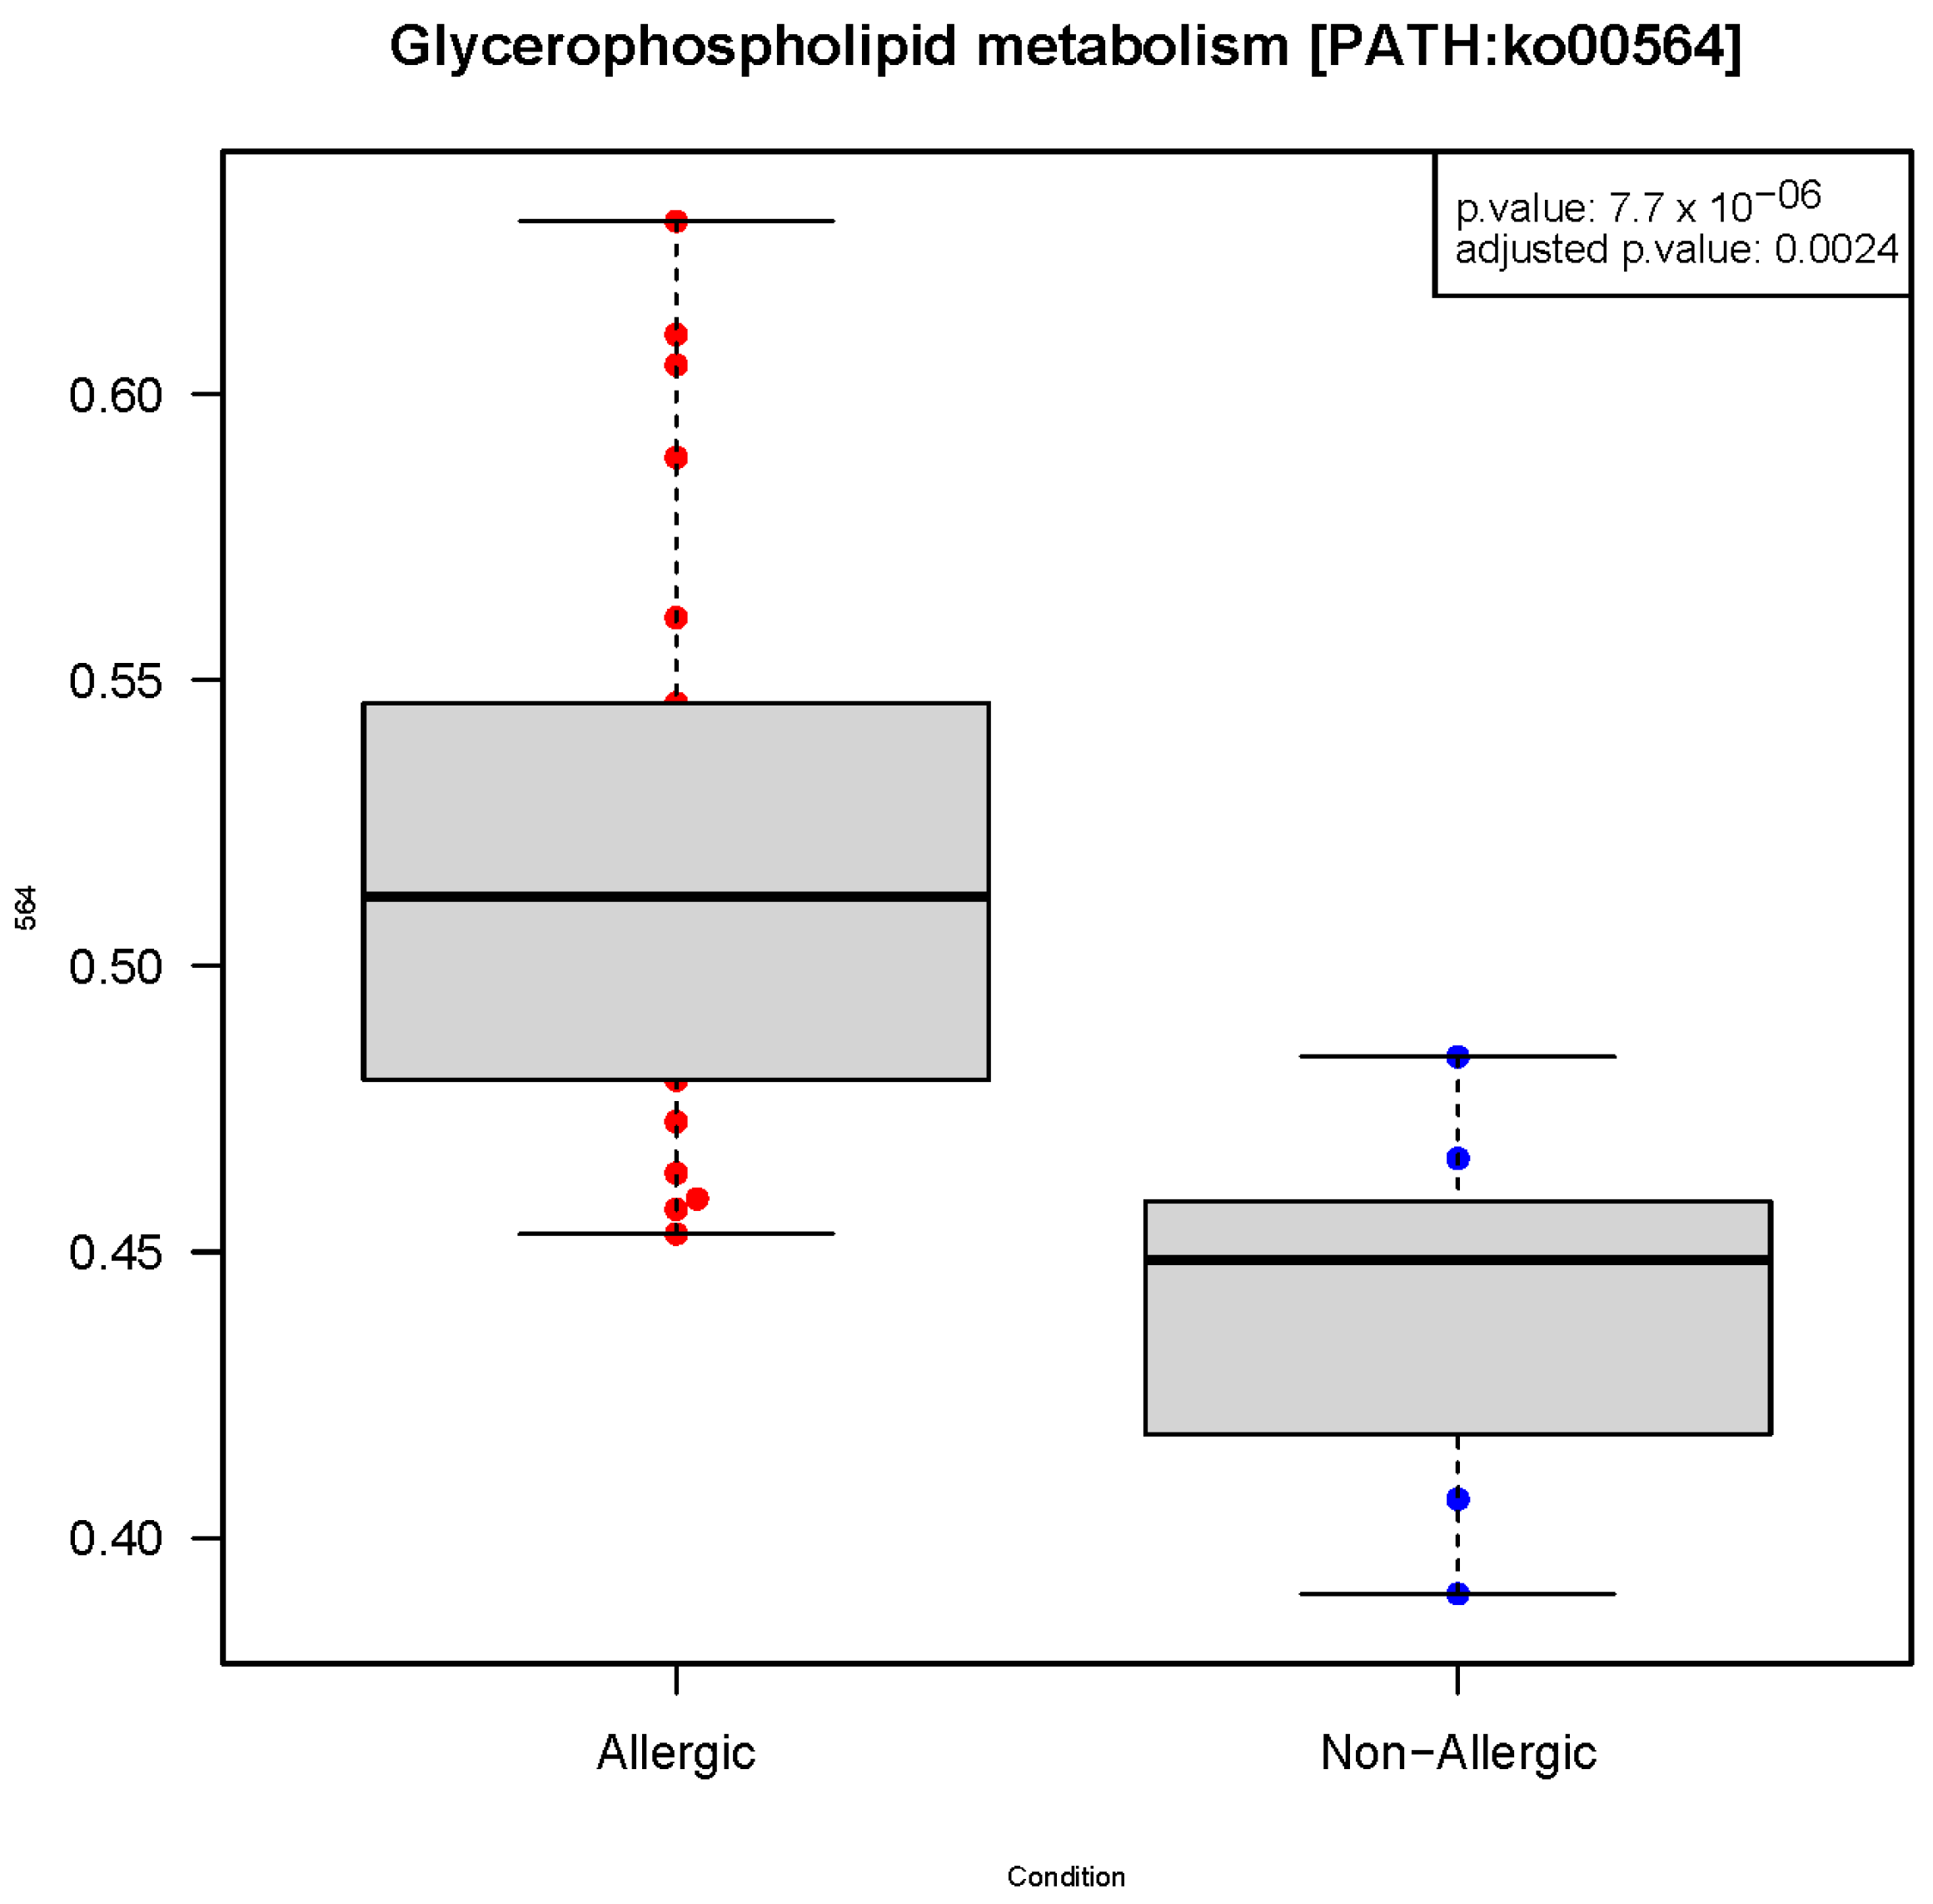
2.1. Gut Microbiota Functionality Profile Associated with CMA

For an overview of the link between gut microbiota functionality and the development of CMA, a principal coordinate analysis (PCoA) was performed between AI and CI groups (Figure 1), aiming at seeking associations between two sets of variables. These analyses did not show significant differences in the gut microbiome of AI and CI.
Results showed 313 metabolic pathways. Among them, 14 metabolic pathways were significantly different in relative abundance (p-value < 0.05) between AI and CI. All significant metabolic pathways with their corresponding statistical values are shown in Table 1.
The only metabolic pathway with a significant adjusted p-value (<0.05) was glycerophospholipid metabolism. This metabolism was found to be increased in AI, as shown in the box plot in Figure 2.

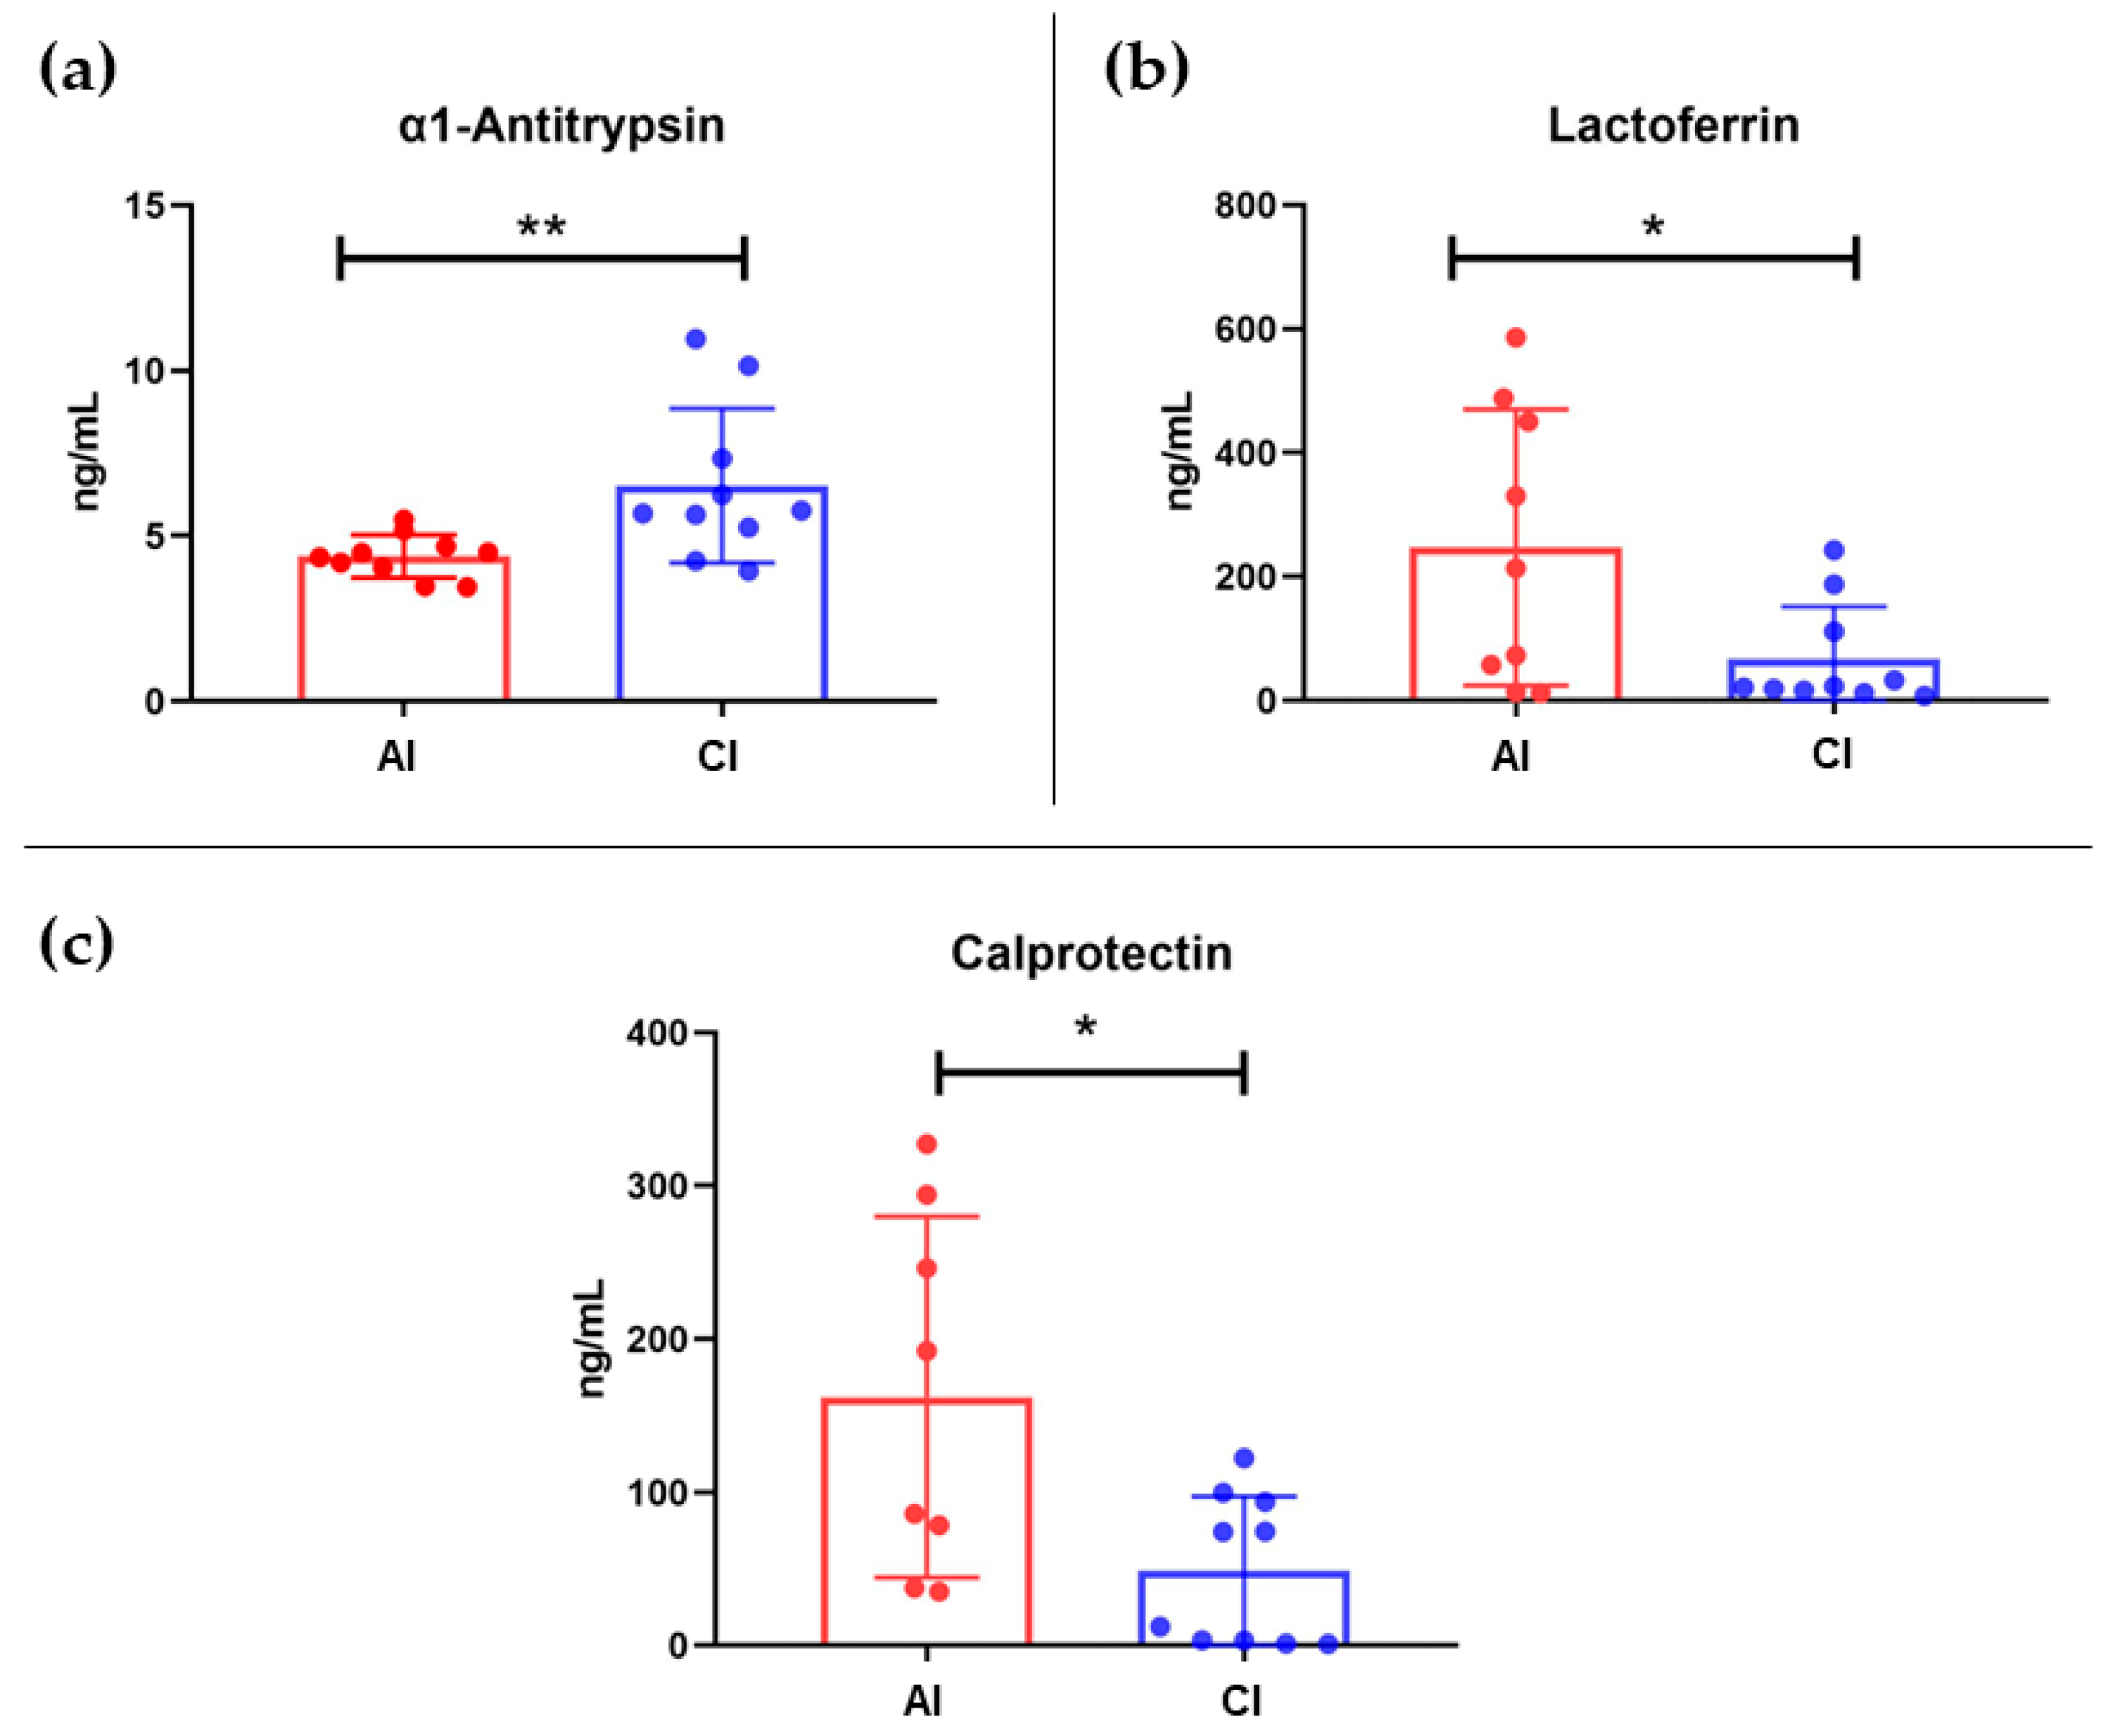
2.2. Fecal Protein Immunodetection

ELISA analysis showed clear differences in the concentrations of the three fecal proteins between AI and CI. In the analysis of α1-antitrypsin, protein concentrations were higher in CI than in AI (p-value = 0.0068). As for lactoferrin, concentrations were higher in the AI compared to the CI (p-value = 0.0296). Finally, calprotectin concentrations followed a similar trend to lactoferrin, being higher in AI compared to CI. In the univariate statistical analysis, a significant p-value of 0.0132 was obtained. Figure 3 shows the bar graphs of these three fecal biomarkers between the two study groups.

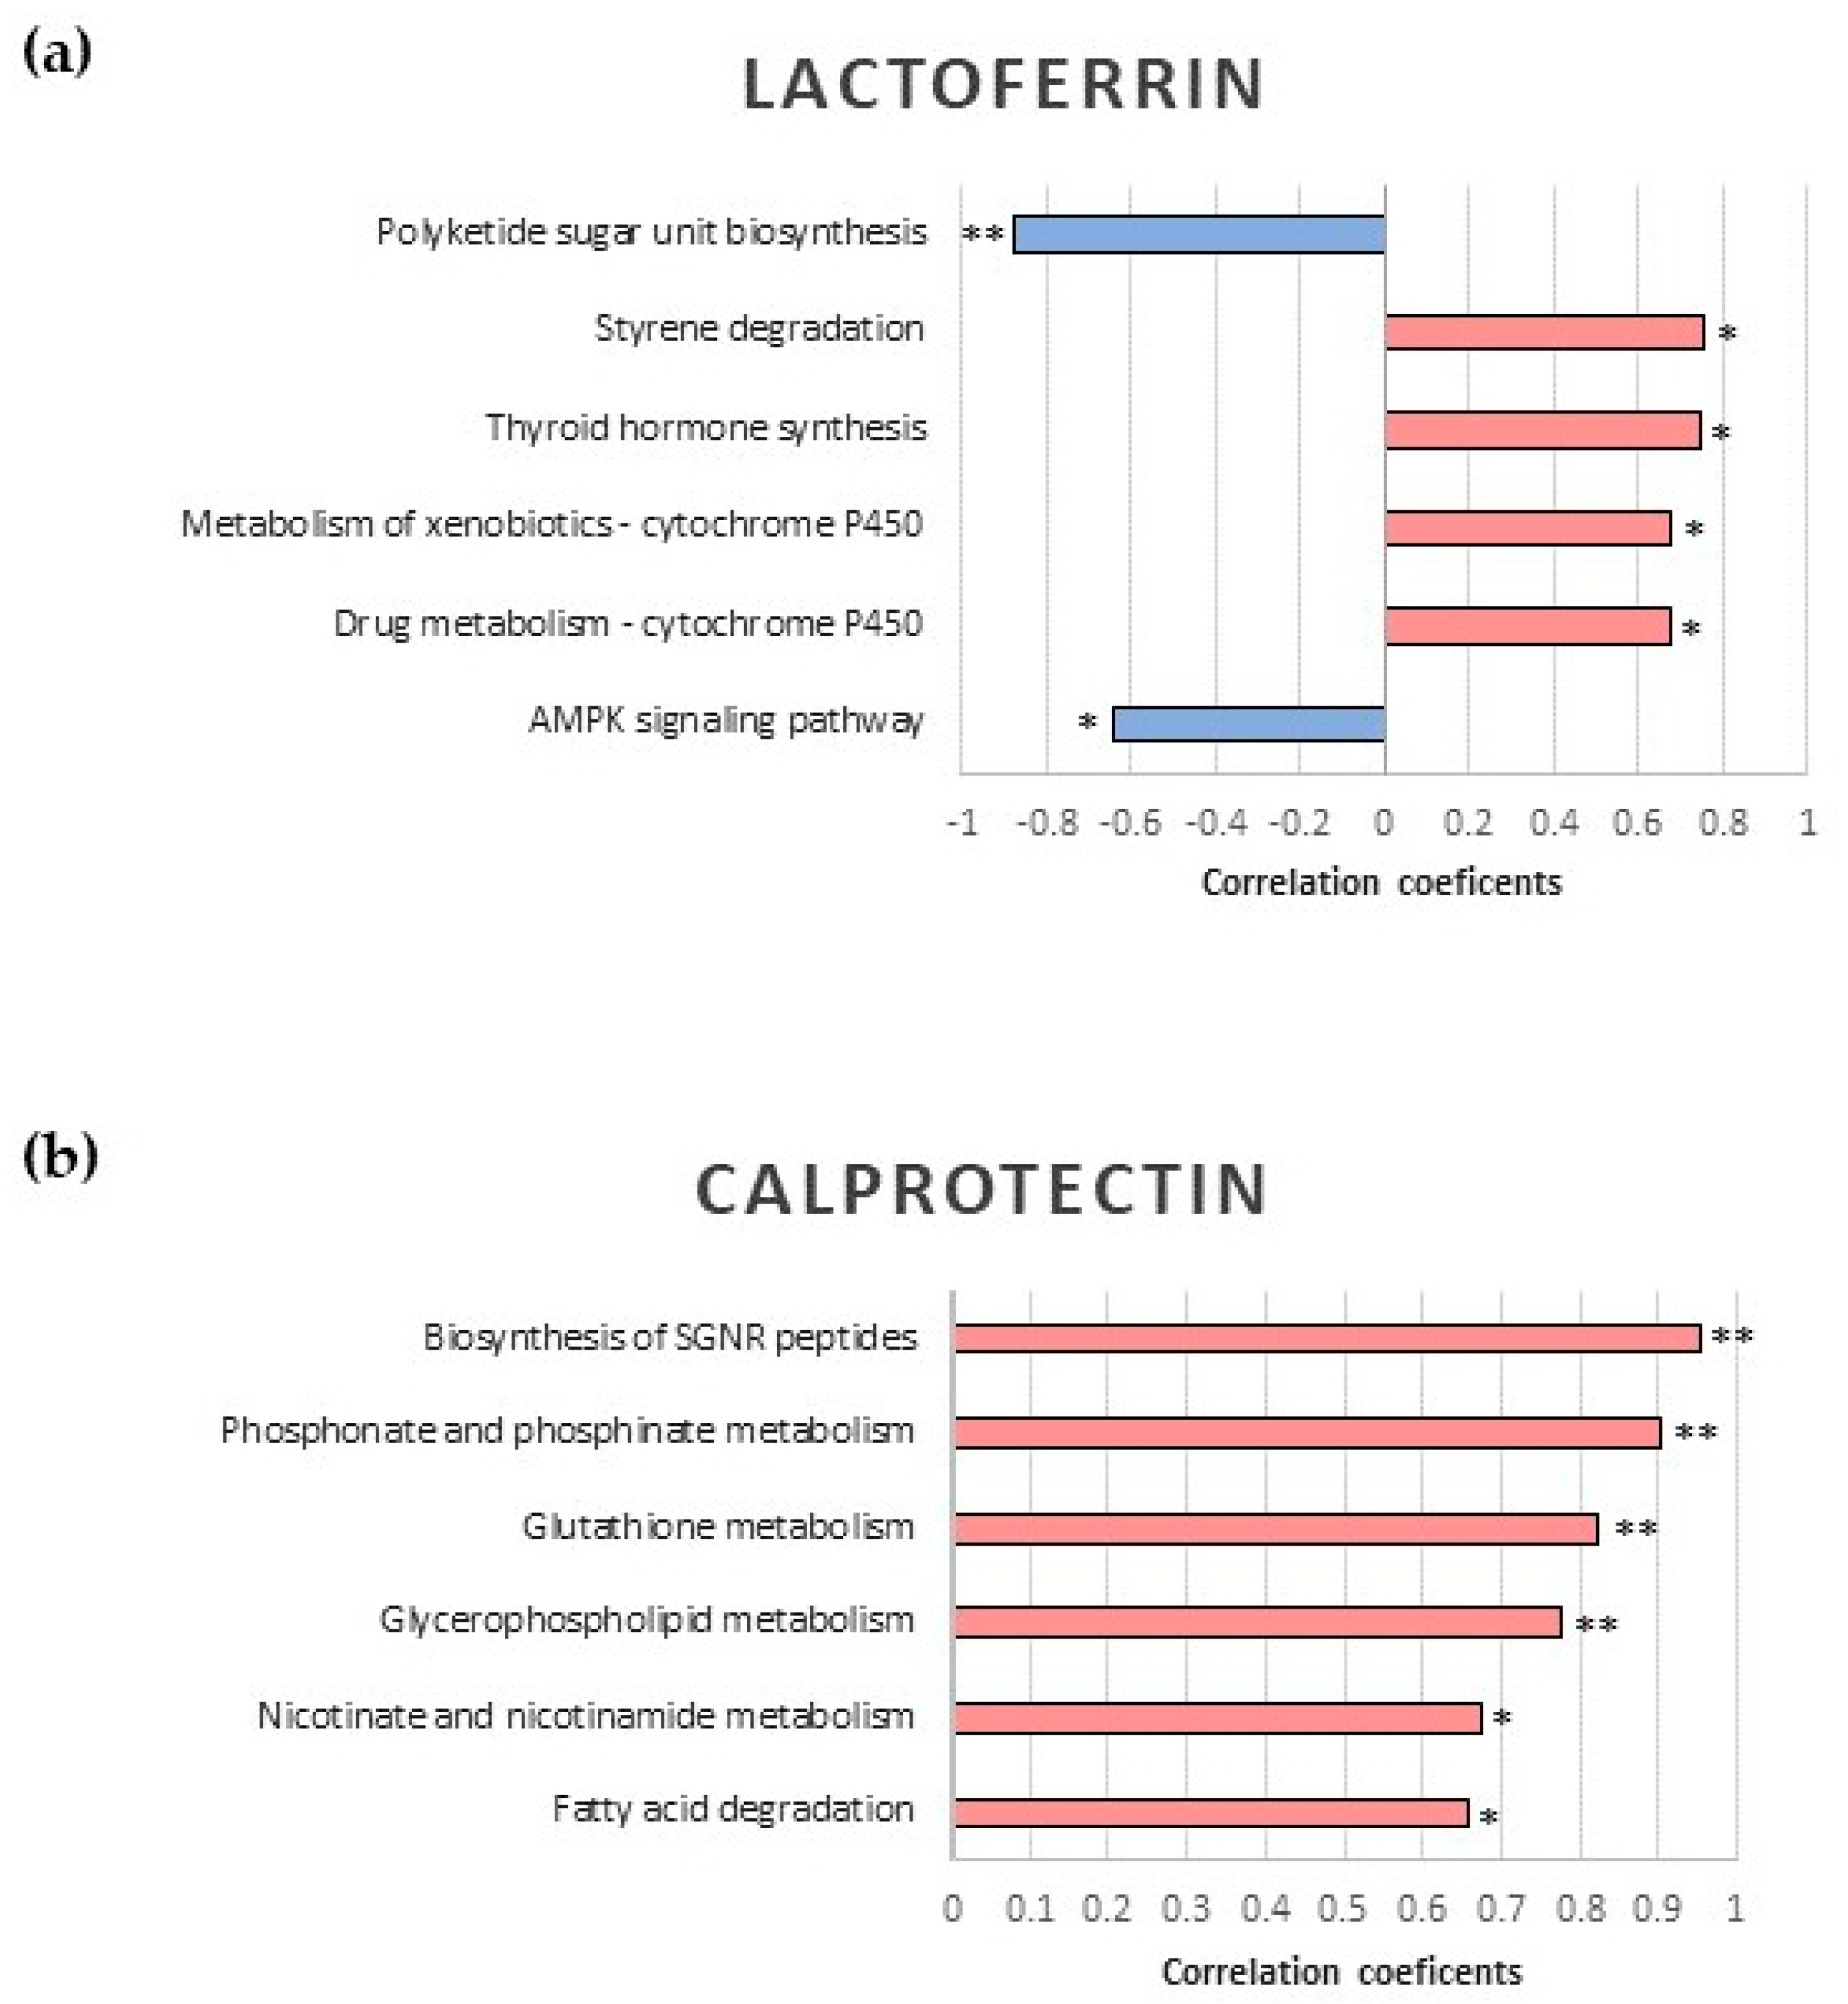
2.3. Correlation Analysis between Fecal Proteins and Microbiota Functionality

The exploratory correlation analysis, performed with the Metaboanalyst 5.0 platform, between the three fecal proteins and all metabolic pathways obtained in the metagenomic sequencing yielded 39 routes. Notably, these routes included glycerophospholipid metabolism, the most significant pathway in the metagenomic analysis (Table 1). Pathways that were not related to immunity, inflammation, and gut microbiota were discarded from further analysis. After filtering, a total of 22 metabolic pathways were selected.
It was observed that α1-antitrypsin had no significant correlations in the chosen pathways. On the other hand, in the correlation analysis between lactoferrin concentrations and the 22 metabolic pathways, six significant pathways were obtained. Finally, the correlation analysis of fecal calprotectin yielded six significant metabolic pathways, four of which had a p-value < 0.005. These results are shown in Figure 4.

3. Discussion

In this study, infants were recruited to investigate the effect of the microbiota on allergy development from a novel point of view involving fecal protein immunodetection and shotgun metagenomics.
The metagenomic analysis allowed the identification of 15 metabolic microbiome-encoded pathways associated with disease status, among which one of them stood out for its significant adjusted p-value and its possible relationship with CMA: the metabolism of glycerophospholipids. Changes in lipid metabolism at the mucosal level can lead to loss of epithelial barrier integrity and dysbiosis [45]. These changes and the immune responses that take place in the mucous membranes are related to a specific and systemic release of metabolites, with a corresponding alteration of their metabolic pathways [46,47]. In this study, four metabolic pathways related to lipid metabolism are increased in the AI group compared to CI. These data may suggest a potential disruption of intestinal barrier associated with the onset of food allergy.
On the other hand, clear differences were observed between the AI and CI groups in fecal proteins obtained by immunodetection. First, α1-antitrypsin was found to be significantly decreased in AI. Majamaa et al. [48] observed that an increased concentration of fecal α1-antitrypsin is associated with CMA in infants with atopic eczema. However, other authors analyzed α 1-antitrypsin levels along with a panel of different markers in patients with GIT disorders and found no significant differences for this protein [32,49]. In relation to CMA, there are scarce data, and the results are contradictory.
In this study, lactoferrin and calprotectin were found to be significantly elevated in the AI group, which is in line with previous literature. Lactoferrin is an abundant component of neutrophil-specific granules and can be released into serum upon neutrophil degranulation [40]. Increased fecal lactoferrin levels have been linked to diseases characterized by chronic inflammation of the GIT [40,50,51]. Borkowska et al. [50] described children diagnosed with Crohn’s disease or moderate ulcerative colitis as having significantly higher fecal lactoferrin concentrations than those with a mild or inactive disease. It has been described that lactoferrin increases the permeability of the bacterial cell membrane, resulting in the discharge of bacterial lipopolysaccharide and other cell contents from the outer membrane [38] that may lead to tissue inflammation. On the other hand, calprotectin measurement has been evaluated as a non-invasive marker of gastrointestinal inflammation, as its concentrations are known to correlate with the level of inflammation of the intestinal mucosa [52,53]. Based on this fact, it has been used for tracking intestinal conditions such as inflammatory bowel disease [27,54]. In relation to CMA, a notable example is the study of Qiu et al. [30], in which they noticed that the level of fecal calprotectin in infants with CMA decreased after dietary intervention, so it seems to be a promising biological indicator for controlling gastro-intestinal allergic diseases. Likewise, Beşer et al. [55] observed elevated calprotectin levels in children with CMA, suggesting its use as a biomarker. However, the evidence is conflicting, as other authors found no significant differences [31,56]. Both lactoferrin and calprotectin are released by the gastrointestinal tract in response to infection and mucosal inflammation and numerous studies have analyzed both [28,29,57,58,59]. In general, fecal markers have been found to be more accurate than serum markers. In this way, calprotectin and lactoferrin can differentiate inflammatory disease from functional bowel disorders. An example of this is a study conducted with patients with Clostridium difficile infection, where it was observed that both fecal calprotectin and lactoferrin were higher in those infected, especially in those with detectable toxin in the feces [59]. There are several studies pointing to lactoferrin and calprotectin, together with C-reactive protein, as reliable biomarkers of active inflammation in intestinal bowel disease (IBD) [29,51]. Therefore, in our study, we suggest that the increase of both proteins in the feces of AI compared to CI points to damage in the mucosa and intestinal inflammation produced by CMA.
In the correlation analysis, no significant metabolic pathways correlating with α1-antitrypsin were identified, but several pathways were identified to be associated with lactoferrin and calprotectin. Likewise, lactoferrin was inversely correlated with the biosynthesis of the polyketide sugar unit. Polyketides are secondary metabolites of bacteria, and it has been described that saturated fatty acids can be considered the smallest end product of the polyketide pathway. Moreover, the bacteriostatic activity of lactoferrin lead to the leakage of bacterial cell membrane components, such as fatty acids. Thus, our results suggest that lactoferrin may be related to a fatty acid increase during allergy development. These findings provide new insight into the physiological role of lactoferrin for the maintenance of cellular and tissue homeostasis [60].
Fecal calprotectin had a significant positive correlation with several metabolic pathways. The first correlation observed was with the fatty acid degradation pathway. Calprotectin has been described as having an essential role in inflammation-related processes, such as regulating the accumulation of neutrophils and macrophages, cytokine production, and fatty acid transport, among others. It can bind to unsaturated fatty acids, including arachidonic acid, and oleic acid [61], leading to structural changes that could be beneficial for their participation in the inflammatory process. On the other hand, short-chain fatty acids (SCFAs) are metabolites related to the gut microbiota, as they are the main source of energy for colonocytes [62]. It has also been reported that SCFAs can promote the differentiation of colon Tregs [63]. Increased fatty acid degradation could reduce the abundance of SCFAs, leading to a more pro-inflammatory environment with a lower number of Tregs and an increase in the inflammation marker calprotectin. Finally, in previous studies, gut microbiota, permeability, SCFAs, and inflammation have been shown to be altered in allergic diseases [63]. The correlation between fecal calprotectin and fatty acid degradation has also been studied in other diseases such as chronic stress [64] and Parkinson’s disease [65]. A possible alteration of fatty acid metabolism caused by CMA might be related to increased calprotectin levels in the AI group. Another metabolic pathway with a positive correlation with calprotectin was that of glutathione metabolism. Food allergy is associated with dysfunction of the intestinal epithelial barrier, which can be affected by oxidative stress. Some studies suggest that catalase and glutathione peroxidase concentrations correlate significantly with fecal calprotectin levels in patients with inflammatory bowel disease [66,67]. Interestingly, calprotectin levels have been also positively correlated with platelet aggregation and activation [68]. Although we have not analyzed in this manuscript platelet aggregation and activation, these previously published result data may be of great interest since it has been described that patients with a severe respiratory allergic phenotype, with or without a food allergy, present an alteration of platelet functions such as aggregation, adhesion, activation, and release of granules compared to moderate allergic phenotypes and non-allergic subjects [69]. Thus, it will be interesting to study platelet aggregation and activation in the context of CMA in the future. Finally, the correlation of calprotectin with the metabolism of glycerophospholipids stands out, as this pathway has a significant adjusted p-value in the metagenomic analysis. Schwarz et al. [70] have confirmed significantly higher fecal calprotectin levels in patients with Crohn’s disease than in healthy subjects. Phospholipids and glycerophospholipids may play several roles in the chronic inflammation of the gastrointestinal tract that characterizes Crohn’s disease. For instance, they might function as signaling molecules that stimulate the production of inflammatory mediators and activate immune cells. There is evidence that the intestinal phospholipid and glycerophospholipid profile may be altered in Crohn’s disease, with some studies demonstrating lower levels of certain species [71,72]. These alterations in phospholipid composition could play a role in the development of inflammation and, consequently, in the increased calprotectin levels observed not only in Crohn’s disease activity but also in other inflammatory diseases such as CMA. Likewise, the increase of calprotectin has been associated with obesity, a disease in which there are frequently higher levels of lipids in children, and the potential usefulness of this biomarker in the follow-up of their metabolic complications has been suggested [73].
The strengths of this study are the rigorous determination of CMA in the hospitals and health centers involved, the rigorous collection of epidemiological data from participants, and the use of high-yield, culture-independent techniques for the identification of the microbiota and the pathways involved. As limitations, we found that diet and the allergic status of infants were confounded, since AI infants fed cow’s milk-based formula (exclusively or as a complement to breastfeeding), were shifted to other alternatives such as partially hydrolyzed formula, extensively hydrolyzed formula, or hydrolyzed soybean formula at the time of diagnosis of CMA [74,75]. On the other hand, fecal samples were collected only once so changes in the microbiota over time (e.g., before and after allergy development) were not studied.
In this study, we have established that AI and CI groups vary in terms of fecal protein levels and the abundance of specific bacterial encoded pathways. Our findings further indicate that the AI group has altered lipid and fatty acid metabolisms as well as higher levels of lactoferrin and calprotectin. These metabolic changes may result in alterations in bacterial membranes that might cause modifications in lipid metabolism at the mucosal level [76]. The higher levels of lactoferrin and calprotectin pinpoint to intestinal inflammation and barrier disruption brought on by CMA. To what extent bacterial glycerophospholipids participate in this process should be clarified in future studies.

4. Materials and Methods

4.1. Study Design and Population

A longitudinal and observational case-control study approved by the Regional Committee on Ethics in Clinical Research of the Hospital Universitario Infantil Niño Jesús in Madrid was conducted in accordance with the ethical guidelines outlined in the Declaration of Helsinki and its amendments [77]. Infants were recruited into the Allergy Service of Hospital Universitario Infantil Niño Jesús, Hospital General Universitario Gregorio Marañón and five health centers in Madrid, Spain. All participants provided informed consent.
Fifty participants up to 8 months of age were recruited for this study: 34 infants with CMA (AI) and 18 healthy control infants (CI). Epidemiological data of the included infants are given in Table 2. Analysis of epidemiological data, including potential confounding factors such as age, diet, type of delivery, etc., was previously performed by our group [20]. Shotgun sequencing was performed on samples from infants aged 4–6 months, thus comprising 25 AI and 12 CI. This selection allowed us to standardize the AI and CI groups and to avoid biases due to the age of the infants and the introduction of solid foods. For fecal protein analysis, 20 samples from infants, 10 AI and 10 CI, were analyzed due to quantity limitations of the samples. Finally, correlation analysis was performed with paired data from 10 infants, 6 AI and 4 CI.

4.2. Inclusion and Exclusion Criteria

Infants up to 8 months with a clinical history of IgE-mediated food allergy and positive Skin Prick Test (SPT) to cow’s milk proteins (α-lactalbumin, β-lactoglobulin, and/or casein (Diater®, Madrid, Spain)) were included. Infants with a history consistent with CMA and a negative SPT were also included at their first visit if the test was positive after three months. All SPT were performed using standardized techniques in accordance with international guidelines [78].
The included CI had no symptoms related to CMA or any serious illness and were recruited from five health centers in Madrid.
Exclusion criteria were the intake of hydrolyzed formula for more than 2 weeks at diagnosis of CMA and antibiotic intake in the 3 months prior to study recruitment (also applicable to their mothers).
All participating centers applied the same recruitment protocols and questionnaires. Information was collected on personal data and risk factors for allergy in infants, such as age, sex, feeding regimen, mode of delivery, and use of antibiotics at birth for infants.

4.3. Sample Collection and Processing

Each participant received a sample collection kit designed and made by our group, which included: collection paper, a sterile stool collection container, gloves, a cold bag, an airtight bag, labels for coding and tracking the samples, and an easy-to-read guide, developed by our group, to facilitate sample collection in the private home [4]. Participants recorded the collection date of each sample and stored them in the home freezer at −20 °C for up to three days before taking them to the hospital. A total of 52 fecal samples (one per infant) were collected and stored at −80 °C before being processed for DNA and protein extraction.

4.4. Shotgun Metagenomics

4.4.1. Sample Preparation

DNA was extracted from 200 mg of feces using the kit “QIAamp DNA Stool Mini Kit” (QIAGEN, Hilden, Germany) following the manufacturer’s instructions. To this protocol was added an additional step of membrane disruption using metal beads [79]. Negative controls were included in each extraction run. The extracted DNA was quantified using the Qubit® 2.0 fluorometer following the protocol of the “dsDNA HS Assay” kit. Shotgun sequencing was performed on 29 samples from infants aged 4–6 months, that had a concentration greater than 0.2 μg/μL: 22 AI (AI_03, AI_04, AI_05, AI_08, AI_09, AI_11, AI_12, AI_13, AI_14, AI_16, AI_17, AI_19, AI_21, AI_22, AI_23, AI_24, AI_27, AI_29, AI_30, AI_31, AI_32, and AI_35) and 7 CI (CI_04, CI_05, CI_06, CI_09, CI_10, CI_11, and CI_12).

4.4.2. Shotgun Sequencing

Metagenomic sequencing was performed using a NextSeq platform (Illumina, San Diego, USA) according to the manufacturer’s recommendations for obtaining paired-end sequences of 150 base pairs.

4.4.3. Bioinformatics and Statistical Analysis

First, the paired-end Fastq files were filtered by quality with the Fastp application (version 0.20.1) [80]: low-quality bases were trimmed from the tail of each read, low complex reads were removed, and reads shorter than 35 bases were discarded. Next, all the reads passing the previous filters were mapped onto the Homo sapiens genome (GCA_000001405.28 GRCh38.p13 assembly) by means of Bowtie2 (version 2.4.2) [81]. Finally, the reads that did not align concordantly against the Homo sapiens genome were analyzed with the SqueezeMeta pipeline with co-assembly mode (version 1.3.1; database built on September 2020) [82]. Tabular outputs were generated from the SqueezeMeta results using the sqm2tables.py SqueezeMeta script, ignoring unclassified reads in the TPM calculation.
To identify significant differences in abundance between KEGG modules, metabolic pathways and KOs between AI and CI groups, the DESeq2 v.1.24.0 algorithm was used with default parameters in R software R4.0.0 [83]. False Discovery Rate (FDR) was applied to adjust for multiple hypothesis tests using the “doTestDESeq2” test. In addition, to study differences in the overall microbiome composition, permutational multivariate analysis of variance using Bray–Curtis distance matrices (ADONIS) [84] was performed. Furthermore, the script doAdonisFromDistances.R was used to perform a PCoA and a Permanova with an associated p-value. Metabolic pathways with an adjusted p value < 0.05 per FDR were considered significant.

4.5. Fecal Protein Immunodetection (ELISA)

A total of 20 infant feces samples of sufficient quantity, 10 AI (AI_16, AI_20, AI_22, AI_26, AI_28, AI_29, AI_31, AI_32, AI_34, and AI_35) and 10 CI (CI_01, CI_03, CI_04, CI_05, CI_06, CI_07, CI_11, CI_16, CI_23, and CI_24), were analyzed by ELISA for the concentrations of three proteins: α1-antitrypsin, lactoferrin, and calprotectin.

4.5.1. Sample Preparation

The 20 selected feces samples were homogenised, and 20 aliquots of 180 mg were prepared. Next, protein extraction was performed by a 1:9 dilution (sample: PBS) in three serial dilutions. First, 540 μL of PBS were added to the Eppendorf tubes with 180 mg of stool sample and a 5-min sonication was performed. The samples were then centrifuged (10,000 rpm, 10 min, 4 °C) and the supernatants were transferred to another Eppendorf tube. On the remaining pellet, the extraction process was repeated twice. The pool of supernatants obtained was divided into 3 aliquots of 400 μL for the different protein analyses.

4.5.2. ELISA Protocol

The appropriate dilutions for each protein were calculated and prepared, considering the expected concentrations obtained in the literature search. The final dilutions were 1:250, 1:250, and 1:100 for α1-antitrypsin, lactoferrin, and calprotectin, respectively. Once the corresponding dilutions were made in all the samples, the protocol of the commercial kit for Fine Test® ELISA (Wuhan, China) was followed for each of the study proteins.
The optical density of the results was analyzed by a Varioskan plate reader at 450 nm and 620 nm in two measurements. With the data obtained from the 7 standard patterns, a standard curve of 5 parameters was obtained that was used to interpolate the sample data.

4.5.3. Data Processing and Statistical Analysis

For data processing, the absorbances measured at 450 nm minus the measurements at 620 nm in each sample were subtracted and the duplicates of the first measurement were averaged. Then, the same process was conducted with the second measurement and an average of the measurements obtained in each sample was made.
Statistical analysis was performed with GraphPad Prism v8.0.1 software (GraphPad Software). This program was used to calculate the concentrations with the calibration curve, the statistical value with parametric and non-parametric analysis and the bar graph of each study protein. Comparisons between experimental groups were carried out in 3 steps. First, a nonlinear fit analysis and subsequent interpolation of concentrations were performed. Then, we checked if within each group the data fitted the normal distribution, using the Shapiro–Wilk normality test. Finally, parametric analyses were performed for unpaired samples (T-Student). When groups did not behave following a normal distribution, the nonparametric Mann–Whitney U test was applied, which compares the means of the experimental groups. In all analyses, a p-value < 0.05 was considered significant.

4.6. Correlation Analysis

The correlation study between the results obtained by metagenomics and the ELISA technique was performed with a total population of 10 infants, 6 AI (AI_16, AI_22, AI_29, AI_31, AI_32, and AI_35) and 4 CI (CI_04, CI_05, CI_06 and CI_11). The sample size was reduced due to two factors: the amount of sample collected in many cases was not sufficient to carry out both analysis and not all infants were included in the study before sequencing, so data were obtained from the ELISA analysis but not from metagenomics in some of them.
Initially, the important biological pathways were manually screened. The information for each protein was then combined in a comma-separated values (CSV) file with the information for the chosen metabolic pathways in accordance with the specifications of the Metaboanalyst platform. For the statistical correlation analysis, the data were entered into the Metaboanalyst 5.0 (https://www.metaboanalyst.ca, accessed on 29 June 2021) online platform with auto-scaling and without normalization nor transformation. The metabolic pathway correlation by pairs and their grouping using Pearson’s correlation coefficient were displayed on the research proteins’ heatmap. The p-values of the connection with each of the metabolic pathways were then determined by doing a pattern study for each protein.

5. Conclusions

In this work, we have confirmed that there are differences, both in metagenomic pathways and in fecal protein levels, between AI and CI groups. Our results show an alteration in lipid and fatty acid metabolisms, as well as an increase in lactoferrin and calprotectin in the AI group. These findings could point to intestinal inflammation and disturbance possibly brought on by food allergy. Previous work by our group has shown that epithelial barrier integrity is compromised in severe allergic phenotypes, regardless of the triggering allergen, and that this has systemic consequences [85,86]. In our study, the integrity of the epithelial barrier of allergic infants could be compromised beforehand due to metabolic alterations that help establish the allergic phenotype. Dysbiosis could therefore be a consequence of the disease. However, prospective studies in this regard would be necessary to confirm this hypothesis.
On the other hand, since allergy and diet factors were confounded in AI and CI, prospective studies that include different time intervals during the first months of life of infants are necessary to understand the role of differences at the level of intestinal microbiota between AI and CI in the development of allergy. Finally, the identification by omics techniques of the altered metabolic pathways and metabolites involved, such as lipid mediators, would complement our findings and help discover additional mechanisms by which the intestinal microenvironment of the first years of life influences the risk of developing a food allergy.

Author Contributions

M.P.-G. and M.D.I.-S. were the PI. D.B. participated in the concept design of the study and contributed to the analysis. R.B., P.C.-F. and M.D.I.-S. included all study patients and the clinical data. E.Z.-V., T.C.B.-T. and L.M.-B. performed the sample treatment, DNA isolation, ELISA analysis, and data treatment. C.U. and M.P.F. supervised the metagenomics shotgun sequencing. M.P.-G. and D.R. supervised genomic and ELISA data treatment. All authors have read and agreed to the published version of the manuscript.

Funding

This research was funded by Instituto de Salud Carlos III (PI17/01087 and PI20/01366) and Fundación Sociedad Española de Alergia e Inmunología Clínica (FSEAIC_2016). It was co-funded by the European Regional Development Fund “Investing in your future” for the thematic network and co-operative research centers ARADyAL RD16/0006/0015 and RD16/0006/0026. T.B-T is supported by FPI-CEU predoctoral fellowship. D.B. acknowledges financial support from Instituto de Salud Carlos III (PI19/00044).

Institutional Review Board Statement

The study was conducted in accordance with the Declaration of Helsinki and approved by the Ethics Committee for Clinical Research of Hospital Universitario Infantil Niño Jesús (R-0004/17).

Informed Consent Statement

Informed consent was obtained from all subjects involved in the study. Written informed consent has been obtained from the patients to publish this paper.

Data Availability Statement

The shotgun metagenomics sequencing files and metadata have been deposited in the Sequence Read Archive (SRA) at NIH and are available under accession number SUB13444105.

Acknowledgments

We would like to thank all institutions and hospitals involved: Institute of Applied Molecular Medicine (IMMA, San Pablo CEU University, Madrid), Sequencing and Bioinformatics Service (FISABIO, Valencia), Hospital Universitario Infantil Niño Jesús (Madrid, España) and Hospital Universitario Gregorio Marañón, Centro de Salud (C.S) Eloy Gonzalo (Feliciano López, Ana María López Madrazo, Sonia Luna Ramírez), C.S Baviera (Mercedes Velez García-Nieto), C.S Ibiza (Alberto Morlan Sala), C.S Justicia (Mª Rosario Antón Jiménez), C. S Valleaguado (Paloma Ortiz Ramos) y C.S. Goya (Yolanda Martín Peinador). All authors would also like to thank the help received from all IMMA researchers that have participated in sample processing.

Conflicts of Interest

The authors declare no conflict of interest. The funders had no role in the design of the study; in the collection, analyses, or interpretation of data; in the writing of the manuscript; or in the decision to publish the results.

References

  1. Power, S.E.; O’Toole, P.W.; Stanton, C.; Ross, R.P.; Fitzgerald, G.F. Intestinal Microbiota, Diet and Health. Br. J. Nutr. 2014, 111, 387–402. [Google Scholar] [CrossRef] [PubMed]
  2. Sartor, R. Microbial Influences in Inflammatory Bowel Diseases. Gastroenterology 2008, 134, 577–594. [Google Scholar] [CrossRef] [PubMed]
  3. Burz, S.D.; Abraham, A.-L.; Fonseca, F.; David, O.; Chapron, A.; Béguet-Crespel, F.; Cénard, S.; le Roux, K.; Patrascu, O.; Levenez, F.; et al. A Guide for Ex Vivo Handling and Storage of Stool Samples Intended for Fecal Microbiota Transplantation. Sci. Rep. 2019, 9, 8897. [Google Scholar] [CrossRef] [PubMed]
  4. Zubeldia-Varela, E.; Barber, D.; Barbas, C.; Perez-Gordo, M.; Rojo, D. Sample Pre-Treatment Procedures for the Omics Analysis of Human Gut Microbiota: Turning Points, Tips and Tricks for Gene Sequencing and Metabolomics. J. Pharm. Biomed Anal. 2020, 191, 113592. [Google Scholar] [CrossRef]
  5. Zubeldia-Varela, E.; Raczkowska, B.A.; Ferrer, M.; Perez-Gordo, M.; Rojo, D. Techniques for Phenotyping the Gut Microbiota Metabolome. In Microbiome and Metabolome in Diagnosis, Therapy, and Other Strategic Applications; Elsevier: Amsterdam, The Netherlands, 2019; pp. 33–41. [Google Scholar]
  6. Gomez de Agüero, M.; Ganal-Vonarburg, S.C.; Fuhrer, T.; Rupp, S.; Uchimura, Y.; Li, H.; Steinert, A.; Heikenwalder, M.; Hapfelmeier, S.; Sauer, U.; et al. The Maternal Microbiota Drives Early Postnatal Innate Immune Development. Science 2016, 351, 1296–1302. [Google Scholar] [CrossRef]
  7. Liu, L.; Guo, Q.; Cui, M.; Liu, J.; Yang, C.; Li, X.; Liu, P.; Wang, L. Impact of Maternal Nutrition during Early Pregnancy and Diet during Lactation on Lactoferrin in Mature Breast Milk. Nutrition 2022, 93, 111500. [Google Scholar] [CrossRef]
  8. Wopereis, H.; Oozeer, R.; Knipping, K.; Belzer, C.; Knol, J. The First Thousand Days—Intestinal Microbiology of Early Life: Establishing a Symbiosis. Pediatr. Allergy Immunol. 2014, 25, 428–438. [Google Scholar] [CrossRef]
  9. Milani, C.; Duranti, S.; Bottacini, F.; Casey, E.; Turroni, F.; Mahony, J.; Belzer, C.; Palacio, S.D.; Montes, S.A.; Mancabelli, L.; et al. The First Microbial Colonizers of the Human Gut: Composition, Activities, and Health Implications of the Infant Gut Microbiota. Microbiol. Mol. Biol. Rev. 2017, 81, e00036-17. [Google Scholar] [CrossRef]
  10. Yatsunenko, T.; Rey, F.E.; Manary, M.J.; Trehan, I.; Dominguez-Bello, M.G.; Contreras, M.; Magris, M.; Hidalgo, G.; Baldassano, R.N.; Anokhin, A.P.; et al. Human Gut Microbiome Viewed across Age and Geography. Nature 2012, 486, 222–227. [Google Scholar] [CrossRef]
  11. Ruiz-Ruiz, S.; Sanchez-Carrillo, S.; Ciordia, S.; Mena, M.C.; Méndez-García, C.; Rojo, D.; Bargiela, R.; Zubeldia-Varela, E.; Martínez-Martínez, M.; Barbas, C.; et al. Functional Microbiome Deficits Associated with Ageing: Chronological Age Threshold. Aging Cell 2020, 19, e13063. [Google Scholar] [CrossRef]
  12. Furness, J.B.; Kunze, W.A.; Clerc, N. Nutrient Tasting and Signaling Mechanisms in the Gut. II. The Intestine as a Sensory Organ: Neural, Endocrine, and Immune Responses. Am. J. Physiol. 1999, 277, G922–G928. [Google Scholar] [CrossRef]
  13. Levy, M.; Kolodziejczyk, A.A.; Thaiss, C.A.; Elinav, E. Dysbiosis and the Immune System. Nat. Rev. Immunol. 2017, 17, 219–232. [Google Scholar] [CrossRef]
  14. Pascal, M.; Perez-Gordo, M.; Caballero, T.; Escribese, M.M.; Lopez Longo, M.N.; Luengo, O.; Manso, L.; Matheu, V.; Seoane, E.; Zamorano, M.; et al. Microbiome and Allergic Diseases. Front. Immunol. 2018, 9, 1584. [Google Scholar] [CrossRef]
  15. Zubeldia-Varela, E.; Barker-Tejeda, T.C.; Obeso, D.; Villaseñor, A.; Barber, D.; Pérez-Gordo, M. Microbiome and Allergy: New Insights and Perspectives. J. Investig. Allergol. Clin. Immunol. 2022, 32, 327–344. [Google Scholar] [CrossRef]
  16. Yepes-Nuñez, J.J.; Fiocchi, A.; Pawankar, R.; Cuello-Garcia, C.A.; Zhang, Y.; Morgano, G.P.; Ahn, K.; Al-Hammadi, S.; Agarwal, A.; Gandhi, S.; et al. World Allergy Organization-McMaster University Guidelines for Allergic Disease Prevention (GLAD-P): Vitamin D. World Allergy Organ. J. 2016, 9, 17. [Google Scholar] [CrossRef]
  17. Ivanov, I.I.; de Llanos Frutos, R.; Manel, N.; Yoshinaga, K.; Rifkin, D.B.; Sartor, R.B.; Finlay, B.B.; Littman, D.R. Specific Microbiota Direct the Differentiation of IL-17-Producing T-Helper Cells in the Mucosa of the Small Intestine. Cell Host Microbe 2008, 4, 337–349. [Google Scholar] [CrossRef] [PubMed]
  18. O’Mahony, C.; Scully, P.; O’Mahony, D.; Murphy, S.; O’Brien, F.; Lyons, A.; Sherlock, G.; MacSharry, J.; Kiely, B.; Shanahan, F.; et al. Commensal-Induced Regulatory T Cells Mediate Protection against Pathogen-Stimulated NF-ΚB Activation. PLoS Pathog. 2008, 4, e1000112. [Google Scholar] [CrossRef]
  19. Huang, Y.J.; Marsland, B.J.; Bunyavanich, S.; O’Mahony, L.; Leung, D.Y.M.; Muraro, A.; Fleisher, T.A. The Microbiome in Allergic Disease: Current Understanding and Future Opportunities-2017 PRACTALL Document of the American Academy of Allergy, Asthma & Immunology and the European Academy of Allergy and Clinical Immunology. J. Allergy Clin. Immunol. 2017, 139, 1099–1110. [Google Scholar] [CrossRef]
  20. Mera-Berriatua, L.; Zubeldia-Varela, E.; Martín-Antoniano, I.A.; López de Maturana, E.; Rojo, D.; Bazire, R.; Cabrera-Freitag, P.; Barker-Tejeda, T.C.; Ubeda, C.; Barber, D.; et al. Unravelling the Gut Microbiota of Cow’s Milk-Allergic Infants, Their Mothers, and Their Grandmothers. J. Investig. Allergol. Clin. Immunol. 2022, 32, 395–398. [Google Scholar] [CrossRef]
  21. Su, Y.-J.; Luo, S.-D.; Hsu, C.-Y.; Kuo, H.-C. Differences in Gut Microbiota between Allergic Rhinitis, Atopic Dermatitis, and Skin Urticaria: A Pilot Study. Medicine 2021, 100, e25091. [Google Scholar] [CrossRef]
  22. Delgado Dolset, M.I.; Obeso, D.; Rodriguez-Coira, J.; Villaseñor, A.; González Cuervo, H.; Arjona, A.; Barbas, C.; Barber, D.; Carrillo, T.; Escribese, M.M. Contribution of Allergy in the Acquisition of Uncontrolled Severe Asthma. Front. Med. 2022, 9, 1009324. [Google Scholar] [CrossRef] [PubMed]
  23. Koh, L.F.; Ong, R.Y.; Common, J.E. Skin Microbiome of Atopic Dermatitis. Allergol. Int. 2022, 71, 31–39. [Google Scholar] [CrossRef] [PubMed]
  24. Sharpton, T.J. An Introduction to the Analysis of Shotgun Metagenomic Data. Front. Plant Sci. 2014, 5, 209. [Google Scholar] [CrossRef]
  25. Abril, A.G.; Carrera, M.; Sánchez-Pérez, Á.; Villa, T.G. Gut Microbiome Proteomics in Food Allergies. Int. J. Mol. Sci. 2023, 24, 2234. [Google Scholar] [CrossRef]
  26. Wang, W.-L.; Xu, S.-Y.; Ren, Z.-G.; Tao, L.; Jiang, J.-W.; Zheng, S.-S. Application of Metagenomics in the Human Gut Microbiome. World J. Gastroenterol. 2015, 21, 803–814. [Google Scholar] [CrossRef]
  27. Calvani, M.; Anania, C.; Cuomo, B.; D’auria, E.; Decimo, F.; Indirli, G.C.; Marseglia, G.; Mastrorilli, V.; Sartorio, M.U.A.; Santoro, A.; et al. Non-IgE- or Mixed IgE/Non-IgE-Mediated Gastrointestinal Food Allergies in the First Years of Life: Old and New Tools for Diagnosis. Nutrients 2021, 13, 226. [Google Scholar] [CrossRef]
  28. Abraham, B.P.; Kane, S. Fecal Markers: Calprotectin and Lactoferrin. Gastroenterol. Clin. North Am. 2012, 41, 483–495. [Google Scholar] [CrossRef]
  29. Langhorst, J.; Elsenbruch, S.; Koelzer, J.; Rueffer, A.; Michalsen, A.; Dobos, G.J. Noninvasive Markers in the Assessment of Intestinal Inflammation in Inflammatory Bowel Diseases: Performance of Fecal Lactoferrin, Calprotectin, and PMN-Elastase, CRP, and Clinical Indices. Am. J. Gastroenterol. 2008, 103, 162–169. [Google Scholar] [CrossRef]
  30. Qiu, L.; Wang, J.; Ren, F.; Shen, L.; Li, F. Can Fecal Calprotectin Levels Be Used to Monitor Infant Milk Protein Allergies? Allergy Asthma Clin. Immunol. 2021, 17, 132. [Google Scholar] [CrossRef]
  31. Ataee, P.; Zoghali, M.; Nikkhoo, B.; Ghaderi, E.; Mansouri, M.; Nasiri, R.; Eftekhari, K. Diagnostic Value of Fecal Calprotectin in Response to Mother’s Diet in Breast-Fed Infants with Cow’s Milk Allergy Colitis. Iran. J. Pediatr. 2018, 28, e66172. [Google Scholar] [CrossRef]
  32. Singer, A.A.M. Food Protein-Induced Enterocolitis and Alpha-1-Antitrypsin Deficiency. J. Allergy Clin. Immunol. 2020, 145, 444. [Google Scholar] [CrossRef] [PubMed]
  33. Carrell, R.W.; Jeppsson, J.O.; Laurell, C.B.; Brennan, S.O.; Owen, M.C.; Vaughan, L.; Boswell, D.R. Structure and Variation of Human Alpha 1-Antitrypsin. Nature 1982, 298, 329–334. [Google Scholar] [CrossRef]
  34. Elli, L.; Topa, M.; Rimondi, A. Protein-Losing Enteropathy. Curr. Opin. Gastroenterol. 2020, 36, 238–244. [Google Scholar] [CrossRef]
  35. Kanwar, J.R.; Roy, K.; Patel, Y.; Zhou, S.F.; Singh, M.R.; Singh, D.; Nasir, M.; Sehgal, R.; Sehgal, A.; Singh, R.S.; et al. Multifunctional Iron Bound Lactoferrin and Nanomedicinal Approaches to Enhance Its Bioactive Functions. Molecules 2015, 20, 9703–9731. [Google Scholar] [CrossRef]
  36. Johanson, B.; Virtanen, A.I.; Tweit, R.C.; Dodson, R.M. Isolation of an Iron-Containing Red Protein from Human Milk. Acta Chem. Scand. 1960, 14, 510–512. [Google Scholar] [CrossRef]
  37. Kell, D.B.; Heyden, E.L.; Pretorius, E. The Biology of Lactoferrin, an Iron-Binding Protein That Can Help Defend Against Viruses and Bacteria. Front. Immunol. 2020, 11, 1221. [Google Scholar] [CrossRef]
  38. Cao, X.; Ren, Y.; Lu, Q.; Wang, K.; Wu, Y.; Wang, Y.; Zhang, Y.; Cui, X.-S.; Yang, Z.; Chen, Z. Lactoferrin: A Glycoprotein That Plays an Active Role in Human Health. Front. Nutr. 2022, 9, 1018336. [Google Scholar] [CrossRef]
  39. Ward, P.P.; Uribe-Luna, S.; Conneely, O.M. Lactoferrin and Host Defense. Biochem. Cell Biol. 2002, 80, 95–102. [Google Scholar] [CrossRef]
  40. Conneely, O.M. Antiinflammatory Activities of Lactoferrin. J. Am. Coll. Nutr. 2001, 20, 389S–395S. [Google Scholar] [CrossRef]
  41. Ward, P.P.; Conneely, O.M. Lactoferrin: Role in Iron Homeostasis and Host Defense against Microbial Infection. BioMetals 2004, 17, 203–208. [Google Scholar] [CrossRef]
  42. Koszewicz, M.; Mulak, A.; Dziadkowiak, E.; Budrewicz, S. Is Fecal Calprotectin an Applicable Biomarker of Gut Immune System Activation in Chronic Inflammatory Demyelinating Polyneuropathy?—A Pilot Study. Front. Hum. Neurosci. 2021, 15, 733070. [Google Scholar] [CrossRef] [PubMed]
  43. Zubeldia-Varela, E.; Barker-Tejeda, T.C.; Blanco-Pérez, F.; Infante, S.; Zubeldia, J.M.; Pérez-Gordo, M. Non-IgE-Mediated Gastrointestinal Food Protein-Induced Allergic Disorders. Clinical Perspectives and Analytical Approaches. Foods 2021, 10, 2662. [Google Scholar] [CrossRef] [PubMed]
  44. Xiong, L.J.; Xie, X.L.; Li, Y.; Deng, X.Z. Current Status of Fecal Calprotectin as a Diagnostic or Monitoring Biomarker for Cow’s Milk Protein Allergy in Children: A Scoping Review. World J. Pediatr. 2021, 17, 63–70. [Google Scholar] [CrossRef]
  45. Murakami, M. Lipid Mediators in Life Science. Exp. Anim. 2011, 60, 7–20. [Google Scholar] [CrossRef]
  46. McHarg, A.S.; Leach, S. The Role of the Gut Microbiome in Paediatric Irritable Bowel Syndrome. AIMS Microbiol. 2022, 8, 454–469. [Google Scholar] [CrossRef]
  47. Sinclair, E.M.; Cohen, C.C.; Tran, V.; Jones, D.P.; Alvarez, J.A.; Kamaleswaran, R.; Rad, M.G.; Kruszewski, P.G.; Vos, M.B. Untargeted, High-Resolution Metabolomics in Pediatric Eosinophilic Esophagitis. J. Pediatr. Gastroenterol. Nutr. 2023, 76, 355–363. [Google Scholar] [CrossRef]
  48. Majamaa, H.; Aittoniemi, J.; Miettinen, A. Increased Concentration of Fecal Alpha1-Antitrypsin Is Associated with Cow’s Milk Allergy in Infants with Atopic Eczema. Clin. Exp. Allergy 2001, 31, 590–592. [Google Scholar] [CrossRef]
  49. Kalach, N.; Kapel, N.; Waligora-Dupriet, A.J.; Castelain, M.C.; Cousin, M.O.; Sauvage, C.; Ba, F.; Nicolis, I.; Campeotto, F.; Butel, M.J.; et al. Intestinal Permeability and Fecal Eosinophil-Derived Neurotoxin Are the Best Diagnosis Tools for Digestive Non-IgE-Mediated Cow’s Milk Allergy in Toddlers. Clin. Chem. Lab. Med. 2013, 51, 351–361. [Google Scholar] [CrossRef]
  50. Borkowska, A.; Liberek, A.; Łuczak, G.; Jankowska, A.; Plata-Nazar, K.; Korzon, M.; Kamińska, B. Fecal Lactoferrin, a Marker of Intestinal Inflammation in Children with Inflammatory Bowel Disease. Acta Biochim. Pol. 2015, 62, 541–545. [Google Scholar] [CrossRef]
  51. Mosli, M.H.; Zou, G.; Garg, S.K.; Feagan, S.G.; MacDonald, J.K.; Chande, N.; Sandborn, W.J.; Feagan, B.G. C-Reactive Protein, Fecal Calprotectin, and Stool Lactoferrin for Detection of Endoscopic Activity in Symptomatic Inflammatory Bowel Disease Patients: A Systematic Review and Meta-Analysis. Am J. Gastroenterol. 2015, 110, 802–819; quiz 820. [Google Scholar] [CrossRef]
  52. Berni Canani, R.; Terrin, G.; Rapacciuolo, L.; Miele, E.; Siani, M.C.; Puzone, C.; Cosenza, L.; Staiano, A.; Troncone, R. Faecal Calprotectin as Reliable Non-Invasive Marker to Assess the Severity of Mucosal Inflammation in Children with Inflammatory Bowel Disease. Dig. Liver Dis. 2008, 40, 547–553. [Google Scholar] [CrossRef] [PubMed]
  53. Canani, R.B.; Rapacciuolo, L.; Romano, M.T.; de Horatio, L.T.; Terrin, G.; Manguso, F.; Cirillo, P.; Paparo, F.; Troncone, R. Diagnostic Value of Faecal Calprotectin in Paediatric Gastroenterology Clinical Practice. Dig. Liver. Dis. 2004, 36, 467–470. [Google Scholar] [CrossRef] [PubMed]
  54. Bunn, S.K.; Bisset, W.M.; Main, M.J.C.; Golden, B.E. Fecal Calprotectin as a Measure of Disease Activity in Childhood Inflammatory Bowel Disease. J. Pediatr. Gastroenterol. Nutr. 2001, 32, 171–177. [Google Scholar] [CrossRef]
  55. Beşer, Ö.F.; Sancak, S.; Erkan, T.; Kutlu, T.; Çokuǧraş, H.; Cokuǧraş, F.Ç. Can Fecal Calprotectin Level Be Used as a Markers of Inflammation in the Diagnosis and Follow-Up of Cow’s Milk Protein Allergy? Allergy Asthma Immunol. Res. 2014, 6, 33–38. [Google Scholar] [CrossRef]
  56. Díaz, M.; Guadamuro, L.; Espinosa-Martos, I.; Mancabelli, L.; Jiménez, S.; Molinos-Norniella, C.; Pérez-Solis, D.; Milani, C.; Rodríguez, J.M.; Ventura, M.; et al. Microbiota and Derived Parameters in Fecal Samples of Infants with Non-IgE Cow’s Milk Protein Allergy under a Restricted Diet. Nutrients 2018, 10, 1481. [Google Scholar] [CrossRef]
  57. Otten, C.M.T.; Kok, L.; Witteman, B.J.M.; Baumgarten, R.; Kampman, E.; Moons, K.G.M.; de Wit, N.J. Diagnostic Performance of Rapid Tests for Detection of Fecal Calprotectin and Lactoferrin and Their Ability to Discriminate Inflammatory from Irritable Bowel Syndrome. Clin. Chem. Lab. Med. 2008, 46, 1275–1280. [Google Scholar] [CrossRef]
  58. Menees, S.B.; Powell, C.; Kurlander, J.; Goel, A.; Chey, W.D. A Meta-Analysis of the Utility of C-Reactive Protein, Erythrocyte Sedimentation Rate, Fecal Calprotectin, and Fecal Lactoferrin to Exclude Inflammatory Bowel Disease in Adults with IBS. Am. J. Gastroenterol. 2015, 110, 444–454. [Google Scholar] [CrossRef]
  59. Barbut, F.; Gouot, C.; Lapidus, N.; Suzon, L.; Syed-Zaidi, R.; Lalande, V.; Eckert, C. Faecal Lactoferrin and Calprotectin in Patients with Clostridium Difficile Infection: A Case-Control Study. Eur. J. Clin. Microbiol. Infect Dis. 2017, 36, 2423–2430. [Google Scholar] [CrossRef]
  60. Drago-Serrano, M.E.; Campos-Rodríguez, R.; Carrero, J.C.; de la Garza, M. Lactoferrin: Balancing Ups and Downs of Inflammation Due to Microbial Infections. Int. J. Mol. Sci. 2017, 18, 501. [Google Scholar] [CrossRef]
  61. Gheibi, N.; Ghorbani, M.; Shariatifar, H.; Farasat, A. Effects of Unsaturated Fatty Acids (Arachidonic/Oleic Acids) on Stability and Structural Properties of Calprotectin Using Molecular Docking and Molecular Dynamics Simulation Approach. PLoS ONE 2020, 15, e0230780. [Google Scholar] [CrossRef]
  62. Fan, Y.; Pedersen, O. Gut Microbiota in Human Metabolic Health and Disease. Nat. Rev. Microbiol. 2021, 19, 55–71. [Google Scholar] [CrossRef] [PubMed]
  63. Smith, P.M.; Howitt, M.R.; Panikov, N.; Michaud, M.; Gallini, C.A.; Bohlooly-Y, M.; Glickman, J.N.; Garrett, W.S. The Microbial Metabolites, Short-Chain Fatty Acids, Regulate Colonic Treg Cell Homeostasis. Science 2013, 341, 569–573. [Google Scholar] [CrossRef] [PubMed]
  64. Michels, N.; van de Wiele, T.; de Henauw, S. Chronic Psychosocial Stress and Gut Health in Children: Associations With Calprotectin and Fecal Short-Chain Fatty Acids. Psychosom. Med. 2017, 79, 927–935. [Google Scholar] [CrossRef]
  65. Aho, V.T.E.; Houser, M.C.; Pereira, P.A.B.; Chang, J.; Rudi, K.; Paulin, L.; Hertzberg, V.; Auvinen, P.; Tansey, M.G.; Scheperjans, F. Relationships of Gut Microbiota, Short-Chain Fatty Acids, Inflammation, and the Gut Barrier in Parkinson’s Disease. Mol. Neurodegener. 2021, 16, 6. [Google Scholar] [CrossRef]
  66. Vaghari-Tabari, M.; Moein, S.; Qujeq, D.; Kashifard, M.; Hajian-Tilaki, K. Positive Correlation of Fecal Calprotectin With Serum Antioxidant Enzymes in Patients With Inflammatory Bowel Disease: Accidental Numerical Correlation or a New Finding? Am. J. Med. Sci. 2018, 355, 449–455. [Google Scholar] [CrossRef]
  67. Pijls, K.E.; Jonkers, D.M.A.E.; Elizalde, M.; Drittij-Reijnders, M.J.; Haenen, G.R.; Bast, A.; Masclee, A.A.M.; Koek, G.H. Is Intestinal Oxidative Stress Involved in Patients with Compensated Liver Cirrhosis? Ann. Hepatol. 2016, 15, 402–409. [Google Scholar] [CrossRef]
  68. Larsen, S.B.; Grove, E.L.; Pareek, M.; Kristensen, S.D.; Hvas, A.M. Calprotectin and Platelet Aggregation in Patients with Stable Coronary Artery Disease. PLoS ONE 2015, 10, e0125992. [Google Scholar] [CrossRef]
  69. Obeso, D.; Mera-Berriatua, L.; Rodríguez-Coira, J.; Rosace, D.; Fernández, P.; Martín-Antoniano, I.A.; Santaolalla, M.; Marco Martín, G.; Chivato, T.; Fernández-Rivas, M.; et al. Multi-Omics Analysis Points to Altered Platelet Functions in Severe Food-Associated Respiratory Allergy. Allergy 2018, 73, 2137–2149. [Google Scholar] [CrossRef]
  70. Schwarz, J.; Vecka, M.; Stožický, F.; Pomahačová, R.; Staňková, B.; Tvrzická, E.; Kreslová, M.; Zahálková, R.; Sýkora, J. The Assessment of Plasma Fatty Acid Profiles in Newly Diagnosed Treatment-Naive Paediatric Crohn’s Disease. Physiol. Res. 2021, 70, 799–808. [Google Scholar] [CrossRef]
  71. Bjerrum, J.T.; Wang, Y.; Hao, F.; Coskun, M.; Ludwig, C.; Günther, U.; Nielsen, O.H. Metabonomics of Human Fecal Extracts Characterize Ulcerative Colitis, Crohn’s Disease and Healthy Individuals. Metabolomics 2015, 11, 122–133. [Google Scholar] [CrossRef]
  72. Sewell, G.W.; Hannun, Y.A.; Han, X.; Koster, G.; Bielawski, J.; Goss, V.; Smith, P.J.; Rahman, F.Z.; Vega, R.; Bloom, S.L.; et al. Lipidomic Profiling in Crohn’s Disease: Abnormalities in Phosphatidylinositols, with Preservation of Ceramide, Phosphatidylcholine and Phosphatidylserine Composition. Int. J. Biochem. Cell Biol. 2012, 44, 1839–1846. [Google Scholar] [CrossRef] [PubMed]
  73. Calcaterra, V.; de Amici, M.; Leonard, M.M.; de Silvestri, A.; Pelizzo, G.; Buttari, N.; Michev, A.; Leggio, M.; Larizza, D.; Cena, H. Serum Calprotectin Level in Children: Marker of Obesity and Its Metabolic Complications. Ann. Nutr. Metab. 2018, 73, 177–183. [Google Scholar] [CrossRef]
  74. Vandenplas, Y.; Brueton, M.; Dupont, C.; Hill, D.; Isolauri, E.; Koletzko, S.; Oranje, A.P.; Staiano, A. Guidelines for the Diagnosis and Management of Cow’s Milk Protein Allergy in Infants. Arch. Dis. Child. 2007, 92, 902–908. [Google Scholar] [CrossRef]
  75. Kemp, A.S.; Hill, D.J.; Allen, K.J.; Anderson, K.; Davidson, G.P.; Day, A.S.; Heine, R.G.; Peake, J.E.; Prescott, S.L.; Shugg, A.W.; et al. Guidelines for the Use of Infant Formulas to Treat Cows Milk Protein Allergy: An Australian Consensus Panel Opinion. Med. J. Aust. 2008, 188, 109–112. [Google Scholar] [CrossRef]
  76. Lamichhane, S.; Sen, P.; Alves, M.A.; Ribeiro, H.C.; Raunioniemi, P.; Hyötyläinen, T.; Orešič, M. Linking Gut Microbiome and Lipid Metabolism: Moving beyond Associations. Metabolites 2021, 11, 55. [Google Scholar] [CrossRef]
  77. World Medical Association World Medical Association Declaration of Helsinki: Ethical Principles for Medical Research Involving Human Subjects. JAMA 2013, 310, 2191–2194. [CrossRef]
  78. Dreborg, S. Skin Testing. The Safety of Skin Tests and the Information Obtained from Using Different Methods and Concentrations of Allergen. Allergy 1993, 48, 473–475. [Google Scholar] [CrossRef]
  79. Thompson, J.A.; Oliveira, R.A.; Djukovic, A.; Ubeda, C.; Xavier, K.B. Manipulation of the Quorum Sensing Signal AI-2 Affects the Antibiotic-Treated Gut Microbiota. Cell Rep. 2015, 10, 1861–1871. [Google Scholar] [CrossRef]
  80. Chen, S.; Zhou, Y.; Chen, Y.; Gu, J. Fastp: An Ultra-Fast All-in-One FASTQ Preprocessor. Bioinformatics 2018, 34, i884–i890. [Google Scholar] [CrossRef]
  81. Langmead, B.; Salzberg, S.L. Fast Gapped-Read Alignment with Bowtie 2. Nat. Methods 2012, 9, 357–359. [Google Scholar] [CrossRef]
  82. Tamames, J.; Puente-Sánchez, F. SqueezeMeta, A Highly Portable, Fully Automatic Metagenomic Analysis Pipeline. Front. Microbiol. 2019, 9, 3349. [Google Scholar] [CrossRef] [PubMed]
  83. Love, M.I.; Huber, W.; Anders, S. Moderated Estimation of Fold Change and Dispersion for RNA-Seq Data with DESeq2. Genome. Biol. 2014, 15, 550. [Google Scholar] [CrossRef] [PubMed]
  84. Oksanen, J.; Blanchet, F.G.; Friendly, M.; Kindt, R.; Legendre, P.; Mcglinn, D.; Minchin, P.R.; O’hara, R.B.; Simpson, G.L.; Solymos, P.; et al. Package “vegan” Title Community Ecology Package, Version 2.5-7; 2020. CRAN Repository. Available online: https://github.com/vegandevs/vegan (accessed on 18 May 2023).
  85. Sanchez-Solares, J.; Delgado-Dolset, M.I.; Mera-Berriatua, L.; Hormias-Martin, G.; Cumplido, J.A.; Saiz, V.; Carrillo, T.; Moreno-Aguilar, C.; Escribese, M.M.; Gomez-Casado, C.; et al. Respiratory Allergies with No Associated Food Allergy Disrupt Oral Mucosa Integrity. Allergy 2019, 74, 2261–2265. [Google Scholar] [CrossRef]
  86. Rosace, D.; Gomez-Casado, C.; Fernandez, P.; Perez-Gordo, M.; del Carmen Dominguez, M.; Vega, A.; Belver, M.T.; Ramos, T.; Vega, F.; Marco, G.; et al. Profilin-Mediated Food-Induced Allergic Reactions Are Associated with Oral Epithelial Remodeling. J. Allergy Clin. Immunol. 2019, 143, 681–690.e1. [Google Scholar] [CrossRef]
Figure 1. PCoA of Bray–Curtis dissimilarities at the metabolic pathway level. The analysis is based on the KEGG functional classification. Ellipses represent the experimental groups (AI and CI) and the clustering of the samples (Permanova p-value = 0.33). AI: allergic infants; CI: control infants.
Ijms 24 09247 g001
Figure 2. Box plot of the two groups of infants in relation to the abundance of glycerophospholipid metabolism counts. The y-axis shows the relative frequencies of the metabolic pathway reads. p-value = 7.7 × 10⁻⁶. The means and standard deviations of the groups were: Allergic = 0.521 ± 0.052 and Non-Allergic = 0.439 ± 0.033.
Ijms 24 09247 g002
Figure 3. (a) Bar graph of α1-Antitrypsin ** p-value < 0.01 by Mann–Whitney U test. Group means were AI = 4.387 and CI = 6.523. (b) Bar graph of Lactoferrin * p-value < 0.05 by T-Student test. Group means were AI = 247.268 and CI = 67.406. (c) Bar graph of Calprotectin * p-value < 0.05 by Mann–Whitney U test. Group means were AI = 162.148 and CI = 48.482. AI: allergic infants; CI: control infants.
Ijms 24 09247 g003
Figure 4. (a) Correlation plot for Lactoferrin; (b) correlation plot for Calprotectin; SGNR: siderophore group non-ribosomal; AMPK: AMP-activated protein kinase; * p-value < 0.05; ** p-value < 0.01.
Ijms 24 09247 g004
Table 1. Significant metabolic pathways (p-value < 0.05) between AI and CI. KP: KEGG pathway; FC: fold change.
Metabolic PathwayKPp-ValueAdj. p-Valuelog2FC
Glycerophospholipid metabolism * ko005640.0000080.0024190.243
Nicotinate and nicotinamide metabolism ko007600.0015770.2468080.233
Primary immunodeficiency ko053400.0051610.5384570.328
Inositol phosphate metabolism ko005620.0083590.6540970.451
Glycerolipid metabolismko005610.0166400.8926110.183
Phosphatidylinositol signaling systemko040700.0175520.8926110.203
Lipoic acid metabolismko007850.0220280.8926110.328
Atrazine degradationko007910.0284420.8926110.983
Glycine, serine, and threonine metabolism ko002600.0285720.8926110.139
Chlorocyclohexane and chlorobenzene degradationko003610.0306980.8926110.404
Biosynthesis of unsaturated fatty acids ko010400.0352660.8926110.337
Carbon fixation pathways in prokaryotes ko007200.0359610.892611−0.175
Ubiquitin system ko041210.0463580.8926110.461
Limonene and pinene degradationko009030.0470010.8926110.438
* Pathway with an adjusted p-value < 0.05.
Table 2. Main demographic and clinical characteristics of the infants included in the study. AI: allergic infant; CI, control infant; M: male; F: female; BM, breast milk; MF: milk formula; H: hydrolyzed formula; -: missing information.
Sample IDAge (Months)GenderConditionDelivery ModeAntibiotics in LaborFeeding
AI_014MAllergicC-sectionYesBM+H
AI_025FAllergicC-sectionNoBM
AI_035MAllergicVaginalNoBM+H
AI_044MAllergicC-sectionNoBM+H
AI_055FAllergicVaginalYesBM+H
AI_063FAllergicVaginalNoBM+H
AI_072MAllergicVaginalNoH
AI_086FAllergicVaginalNoH
AI_096MAllergicVaginalNoH
AI_103FAllergicC-sectionYesBM+MF
AI_115MAllergicVaginalNoH
AI_126FAllergicVaginalNoBM
AI_135MAllergicVaginalNoH
AI_145FAllergicVaginalNoBM+MF
AI_153MAllergicVaginalNoBM+H
AI_164FAllergicVaginalYesBM
AI_175FAllergicVaginalNoH
AI_195FAllergicVaginalNoBM+H
AI_207MAllergicVaginalNoBM
AI_216FAllergicVaginalNoBM+MF
AI_226FAllergicC-sectionNoBM
AI_236FAllergicVaginalNoH
AI_246FAllergicVaginalNoBM+H
AI_268FAllergicVaginalNoBM+H
AI_275MAllergicVaginalNoBM+H
AI_287MAllergicVaginalYesBM
AI_295FAllergicVaginalYesBM+H
AI_306MAllergicVaginalNoH
AI_314FAllergicVaginalNoH
AI_326MAllergicC-sectionNoH
AI_334FAllergicVaginalNoBM+H
AI_343MAllergicVaginalNoBM+H
AI_356MAllergicVaginalNoH
AI_361FAllergicVaginalNoH
CI_016MNon-allergicVaginalNoBM
CI_027MNon-allergicVaginalNoBM+MF
CI_036FNon-allergicVaginalNoBM+MF
CI_046FNon-allergicVaginalYesBM+MF
CI_056MNon-allergicVaginalNoMF
CI_066MNon-allergicVaginalNoMF
CI_078MNon-allergicVaginalNoBM+MF
CI_085FNon-allergicVaginalNoMF
CI_095FNon-allergicC-sectionNoMF
CI_105FNon-allergicC-sectionNoMF
CI_115FNon-allergicVaginalNoBM
CI_124MNon-allergicVaginalNoMF
CI_133FNon-allergicVaginalNoMF
CI_144FNon-allergicVaginalNoBM+MF
CI_151FNon-allergicVaginalNoBM+MF
CI_163FNon-allergicC-sectionYesBM+MF
CI_234FNon-allergicC-section-BM+MF
CI_243FNon-allergicC-sectionNoBM+MF
Disclaimer/Publisher’s Note: The statements, opinions and data contained in all publications are solely those of the individual author(s) and contributor(s) and not of MDPI and/or the editor(s). MDPI and/or the editor(s) disclaim responsibility for any injury to people or property resulting from any ideas, methods, instructions or products referred to in the content.

