Article

The Mechanism of LTXN4C-Induced Ca2+ Influx Involves Latrophilin-Mediated Activation of Cav2.x Channels

by
Jennifer K. Blackburn
1,†,
John-Paul Silva
2,‡,
Evelina Petitto
1,§,
Dietmar Cholewa
3,
Elizaveta Fasler-Kan
3,
Kirill E. Volynski
2,‖ and
Yuri A. Ushkaryov
1,2,*
1
Medway School of Pharmacy, University of Kent, Chatham ME4 4TB, UK
2
Department of Biological Sciences, Imperial College London, London SW7 2AZ, UK
3
Department of Pediatric Surgery, Inselspital Bern, University of Bern, CH-3010 Bern, Switzerland
*
Author to whom correspondence should be addressed.
Current address: Department of Psychiatry, Yale University School of Medicine, New Haven, CT 06511, USA.
Current address: Merck Sharp & Dohme (UK) Limited, UK Discovery Biologics, London, EC2M 6UR, UK.
§
Current address: Ashfield MedComms, Macclesfield SK11 7HQ, UK.
Current address: UCL Institute of Neurology, University College London, London WC1N 3BG, UK.
Int. J. Mol. Sci. 2025, 26(22), 11200; https://doi.org/10.3390/ijms262211200
Submission received: 28 October 2025 / Revised: 14 November 2025 / Accepted: 17 November 2025 / Published: 19 November 2025

Abstract

Store-operated Ca2+ entry (SOCE) is a key regulator of cytosolic Ca2+ (Ca2+cyt). Presynaptic SOCE can be activated by ligands like α-latrotoxin, which acts through the presynaptic G-protein-coupled receptor latrophilin-1 (LPHN1), inducing Ca2+ influx and neurotransmitter release. To understand how SOCE-associated proteins contribute to LPHN1 signaling in neurons, we used mouse neuroblastoma NB2a cells as a genetically tractable neuronal model. The cells were stably transfected with exogenous LPHN1 or its non-signaling mutant and stimulated with the non-pore-forming α-latrotoxin mutant LTXN4C, a known trigger of neurotransmitter release. LPHN1 expression increased the proportion of neuron-like cells and upregulated the voltage-gated Ca2+ channels Cav1.2 and Cav2.1. LPHN1 stimulation by LTXN4C induced a small Ca2+ release sensitive to thapsigargin, and a strong, gradual influx of Ca2+, which was insensitive to thapsigargin. Single-cell imaging revealed that this influx consisted of desynchronized high-amplitude Ca2+ oscillations in individual cells. This response was reduced by Orai2 knockdown and completely blocked by the Cav2.1/2.2 inhibitor ω-conotoxin MVIIC. We conclude that LPHN1 activation by LTXN4C primes Ca2+ stores and induces the opening of Cav2.1/2.2 channels. These channels mediate an initial Ca2+ influx that triggers Ca2+-induced Ca2+ release and SOCE. This mechanism, elucidated in model cells, can explain how LTXN4C stimulates neurotransmitter release.

1. Introduction

Neurotransmitter release at presynaptic terminals is orchestrated by sophisticated Ca2+ dynamics, where influx through voltage-gated Ca2+ channels (VGCCs) creates a Ca2+ transient, which provides the immediate and essential trigger for synchronous, phasic release of neurotransmitters within sub-millisecond timescales [1,2,3]. While being mainly driven by the canonical influx through VGCCs, this Ca2+ transient is modified by the coordinated activity of multiple other sources of Ca2+ [4].
In addition to vesicle fusion, the initial Ca2+ influx through VGCCs triggers Ca2+-induced Ca2+ release (CICR) from the presynaptic endoplasmic reticulum (ER) stores via ryanodine receptors (RyRs) [5,6]. This secondary release sustains and amplifies the Ca2+ transients during repetitive stimulation [7,8]; modulates asynchronous release [9,10], regulates short-term plasticity [11,12], and supports spontaneous release (minis) [13].
Recent advances have identified store-operated Ca2+ entry (SOCE) as another crucial regulator of presynaptic Ca2+ homeostasis [14,15], particularly during sustained neuronal activity [16]. The SOCE mechanism is initiated when Ca2+ is released from the ER Ca2+ stores [17]. Store depletion triggers the oligomerization of ER-resident stromal interaction molecules (STIM1/2), which then translocate to ER-plasma membrane junctions, where they activate Orai1 channels in the plasma membrane and thus induce highly selective influx of extracellular Ca2+ (Ca2+e). In neurons, the ER extends into axons and nerve terminals, allowing STIM proteins to mediate presynaptic SOCE [18]. Apart from its role in maintaining the ER Ca2+ stores, presynaptic SOCE modulates fundamental synaptic properties including vesicle release probability and post-tetanic potentiation [5,19,20], with emerging evidence indicating the influence of presynaptic SOCE on the availability of readily releasable vesicles, which implies a role in vesicle priming and spontaneous release [19,21].
The activation of SOCE is also dynamically controlled by G protein-coupled receptors (GPCRs), which serve as critical transducers of extracellular signals into intracellular Ca2+ responses [22]. Canonical GPCR signaling through Gαq/11 subunits stimulates phospholipase Cβ (PLCβ), which hydrolyses phosphatidylinositol 4,5-bisphosphate (PIP2), generating inositol 1,4,5-trisphosphate (IP3) and diacylglycerol (DAG). IP3 activates the ER-resident IP3 receptors, which release Ca2+ and thereby initiate SOCE [23]. DAG, acting via protein kinase C (PKC) or directly, modulates (primarily activates) many types of Ca2+ channels, including some VGCCs, Orai channels, TRPC channels, IP3 receptors, and RyRs. Alternative pathways may engage SOCE through PLC-independent mechanisms [24], potentially involving direct STIM recruitment or lipid-mediated signaling [25,26]. These diverse activation mechanisms position GPCRs as central regulators of presynaptic SOCE, capable of integrating Ca2+ signaling pathways with synaptic activity.
To investigate the role of extracellular ligands in GPCR-mediated control of SOCE, we selected the mouse neuroblastoma Neuro-2a cell line (NB) as an experimentally tractable model system that recapitulates key features of neuronal Ca2+ regulation [27]. When differentiated through serum withdrawal or cAMP elevation, NB cells undergo morphological and functional transformation, extending neurite-like processes and generating specialized compartments resembling presynaptic terminals, which enables detailed investigation of Ca2+ signals with spatial organization similar to that in neurons. Upon differentiation, NB cells express neuronal markers including synaptophysin and MAP2 [28,29,30], while maintaining endogenous expression of critical Ca2+ handling proteins such as STIM/Orai, RyRs, and Ca2+ ATPases [31,32,33,34]. By contrast, they do not express latrophilin 1 (LPHN1, or ADGRL1) [35], the adhesion GPCR type L1 that binds several protein ligands, including α-latrotoxin (αLTX) [36,37], teneurin-2 [38], and FLRT3 [39]. This lack of endogenous LPHN1 permits transgenic expression of its mutants designed to investigate intracellular signaling associated with this receptor. On the other hand, these cells possess different GPCR-coupled pathways [27,40,41] and demonstrate robust responsiveness to GPCR ligands [42,43]. Combined with exceptional transfection efficiency, these features of NB cells facilitate precise manipulation of Ca2+ regulatory components and real-time monitoring of Ca2+ dynamics using genetically encoded indicators [27]. While lacking the full synaptic complexity of primary neurons, NB cells offer an optimal balance between physiological relevance and experimental practicality for mechanistic studies of receptor-mediated Ca2+ signaling [44].
In this study, we exploit these advantages to investigate how LPHN1 couples extracellular stimuli to SOCE activation [45]. Using differentiated NB cells expressing LPHN1 or its non-signaling mutant, we catalog the changes in the expression of a range of proteins involved in Ca2+ homeostasis and SOCE. By stimulating the cells with the αLTX mutant LTXN4C [46], we demonstrate receptor-mediated release of stored Ca2+ and subsequent SOCE engagement. Our results not only elucidate the interplay between GPCR-induced SOCE and CICR in shaping presynaptic Ca2+ transients but also establish a framework for understanding how extracellular signals integrate with presynaptic Ca2+ homeostasis under physiological and pathological conditions.

2. Results

2.1. Differentiation Changes Cell Morphology and Receptor Expression

For dissecting the role of intracellular signaling in LTXN4C-induced response, two receptor constructs were used (Figure 1a): the full-length LPHN1 and its chimeric mutant ΔLPH. In ΔLPH, the native CTF was replaced with the transmembrane domain and C-terminus of neurexin I. As a result, ΔLPH retains the ability to bind αLTX and LTXN4C with its NTF but loses the ability to signal via G proteins. N- and C-terminal immunological tags (V5 and myc) were added to both constructs for reliable detection (Figure 1a). These constructs were used to transfect NB cells, which were then extensively selected and cell-sorted to produce two stable cell lines expressing LPHN1 (LPH cells) or ΔLPH (ΔLPH cells).
In our experiments under high-serum conditions, undifferentiated NB cells rapidly proliferated and exhibited an adherent, epithelial-like morphology (Figure 1), as also reported previously [27]. The proliferating culture contained two distinct types of cells, with neuronal and amoeboid stem cell features (Figure 1b, NB-PC), which were similar to the N-type and S-type cells found in human neuroblastoma lines [47]. N-type neuroblastic cells had small, round cell bodies with a small amount of cytoplasm and several processes (neurites). Substrate-adherent S-type cells possessed broad and flattened cell bodies with shorter processes, and exhibited non-neuronal properties similar to glial cells, Schwann cells, and melanocytes.
A key feature of NB cells is their ability to differentiate upon serum reduction and cAMP elevation and develop strong neuronal characteristics [27,42,48,49]. To elucidate how the expression of the receptor constructs and cell differentiation affected the cells, we quantified the number of N-type cells and the number and length of neurites. The three cell lines were treated with a serum-free (SF) medium alone or with the addition of dibutyryl cyclicAMP (dbcAMP) (Figure 1b). Proliferating NB cells (NB-PC) and ΔLPH cells (ΔLPH-PC) contained a roughly equal mixture of S- and N-type cells, whereas proliferating LPH cells (LPH-PC) were predominantly of the N-type (80% in LPH-PC vs. 41% in NB-PC, p < 0.007; vs. 52% in ΔLPH-PC, p = 0.037) (Figure 1b, top row; 1c). Serum-deprivation significantly increased the proportion of N-type cells in SF-differentiated cultures (83% in NB-SF vs. 41% in NB-PC, p < 0.0001, and 84% in ΔLPH-SF vs. 52% in ΔLPH-PC, p < 0.009) but did not further increase the number of N-type cells in SF-differentiated LPH cultures (79% in LPH-SF vs. 80% in LPH-PC) (Figure 1b, middle row; 1c). The addition of dbcAMP to SF medium increased the population of N-type cells insignificantly in NB and ΔLPH cells only (91% in NB-dbcA vs. 41% in NB-PC, p < 0.0001; 96% LPH-dbcA vs. 80% in LPH-PC, p = 0.15; 84% in ΔLPH-dbcA vs. 52% in ΔLPH-PC, p 0.002) (Figure 1b, bottom; 1c).
In PC and SF cultures, N-type cells displayed fewer neurites than S-type cells (2.9 ± 0.1 vs. 4.2 ± 0.2 neurites per cell, respectively; p = 0.0007) (Figure 1b, top, middle rows; Figure S1a), but they were generally longer (25 ± 2.3 vs. 19 ± 0.8 μm, respectively; p = 0.039) (Figure S1b). Receptor expression or cell differentiation had no effect on the average number of neurites per cell (Figure S1a). There was no change in neurite length in S-type cells, suggesting that they were unable to undergo differentiation under any treatment. Neurite length in N-type cells also was not affected by SF-differentiation, but serum deprivation with dbcAMP dramatically increased neurite length only in N-type NB and LPH cells (Figure 1b, bottom row; Figure S1b). The percentage of N-type NB-dbcA and LPH-dbcA that expressed neurites over 50 μm, an indicator of neuronal differentiation, was 36 ± 8.5 and 42 ± 2.1%, respectively (NB-dbcA and LPH-dbcA vs. all other cells: p > 0.001) (Figure S1c).
In summary, LPH cells displayed morphological features that were indicative of a more neuronal phenotype, compared to NB and ΔLPH cells. The higher number of N-type cells in undifferentiated LPH cells and the increased length of neurites upon SF/dbcAMP treatment suggested that LPHN1 expression supported neuronal differentiation of NB cells.
We next evaluated receptor expression in LPH and ΔLPH cells. While immunostaining clearly demonstrated the presence of the target proteins in both transgenic lines (but not in the wild-type NB cells), only a proportion of transfected cells produced a sufficient amount of receptor for immunostaining (Figure 1d). Furthermore, proliferating LPH cells did not appear to express the receptor until they were differentiated using SF medium (Figure 1e). Even after differentiation with or without dbcAMP, only ~54% of LPH cells showed LPHN1 immunostaining (Figure 1f). By contrast, ~80% of ΔLPH cells differentiated in SF medium demonstrated detectable ΔLPH staining (Figure 1f).
These observations implied that the LPHN1 transgene was repressed in most proliferating and in some differentiated LPH cells. However, this was inconsistent with the constitutive character of the strong cytomegalovirus promoter driving LPHN1 expression and the role of the receptor in morphological changes in proliferating LPH cells, as described above. We therefore hypothesized that LPHN1 was expressed but rapidly degraded in dividing cells. To test this, the images of proliferating LPH cells that appeared to lack LPHN1 immunostaining were enhanced, revealing the presence of small amounts of receptor (Figure 1e). Importantly, only the NTF remained on the cell surface, while the CTF was primarily localized to intracellular organelles, likely lysosomes (Figure 1e, bottom), indicating that it was recycled separately from the NTF, as previously reported [50].
This hypothesis was tested by immunocytochemical analysis of the subcellular distribution of receptor fragments in LPH-SF and LPH-PC cells (Figure S1d). In differentiated LPH-SF cells, 96.3 ± 0.9% of the NTF and 36.3 ± 4.3% of the CTF localized to the plasma membrane. These proportions were dramatically reduced in proliferating LPH cells. In addition to an overall low level of LPH expression, only 19.7 ± 1.9% of the NTF and 7.6 ± 1.5% of the CTF were detected in the plasma membrane. Furthermore, 59.29 ± 7.18% of the intracellular CTF was localized to lysosomes, identified by LysoTracker staining (Figure S1e), while the remaining 40.71 ± 7.18% was present in non-lysosomal vesicular compartments. Notably, 86.5 ± 4.1% of lysosomes contained the CTF, suggesting that receptor was continuously expressed in LPH-PC cells. A substantial overlap between lysosomal and CTF staining was confirmed by quantitative colocalization analysis, which yielded Manders’ split coefficients M1 and M2 of 0.8 and 0.39, respectively. Finally, the specificity of the immunostaining was verified by Western blotting (Figure 1h), which demonstrated not only smaller amounts of receptor fragments in LPH-PC cells than in LPH-SF cells but also substantial CTF degradation in the proliferating cells.
We conclude that proliferating LPH cells express LPHN1 but actively recycle it to prevent background signaling and a consequent N-type differentiation. Serum deprivation, with or without dbcAMP, causes the cells to cease division, a phase of the cell cycle when protein ubiquitination and proteasome-mediated protein degradation are most active [51,52,53,54]. We propose that when the cells enter the growth stage, this allows LPHN1 to escape rapid degradation and accumulate.
Based on these results, all subsequent experiments investigating LPHN1’s role in Ca2+cyt dynamics used SF medium to differentiate receptor-expressing cells, but omitted dbcAMP due to its relatively minor additional effect on receptor expression.

2.2. LPHN1 Activation by LTXN4C Elevates Ca2+cyt in the Presence of Ca2+e

The αLTX mutant LTXN4C was designed in the laboratory of Thomas C. Südhof [46] and subsequently extensively used to characterize LPHN1-mediated signaling in neurons, endocrine cells, and transfected NB cells [35,55,56,57,58,59,60,61]. In contrast to αLTX, LTXN4C lacks the ability to form cation-permeable pores in the cell membrane [62] and permits LPHN1 stimulation in the absence of the non-specific effects of αLTX pores.
To specifically identify which actions of the mutant toxin involved intracellular signaling from the receptor, we monitored Ca2+cyt changes induced by LTXN4C in differentiated LPH and ΔLPH cells, following a protocol typically employed to measure Ca2+ release and SOCE induced by thapsigargin (TG) (Figure S2a). According to this protocol, cells are loaded with the Ca2+-sensing dye Fluo-4, and their fluorescence is continuously recorded. Stimulating the cells with TG in a Ca2+e-free medium reveals Ca2+ release from intracellular stores, while the subsequent addition of 2 mM Ca2+e shows SOCE manifested as a large transient peak of [Ca2+]cyt (Figure S2a, left). At the end of SOCE, a new post-SOCE Ca2+cyt equilibrium (PostEq) is established, which in the case of TG often equals the basal [Ca2+]cyt in the presence of Ca2+e. As reported previously [45], αLTX also causes Ca2+ release and SOCE (Figure S2a, middle), which are mediated by LPHN1, although this action is complicated by αLTX forming a membrane pore.
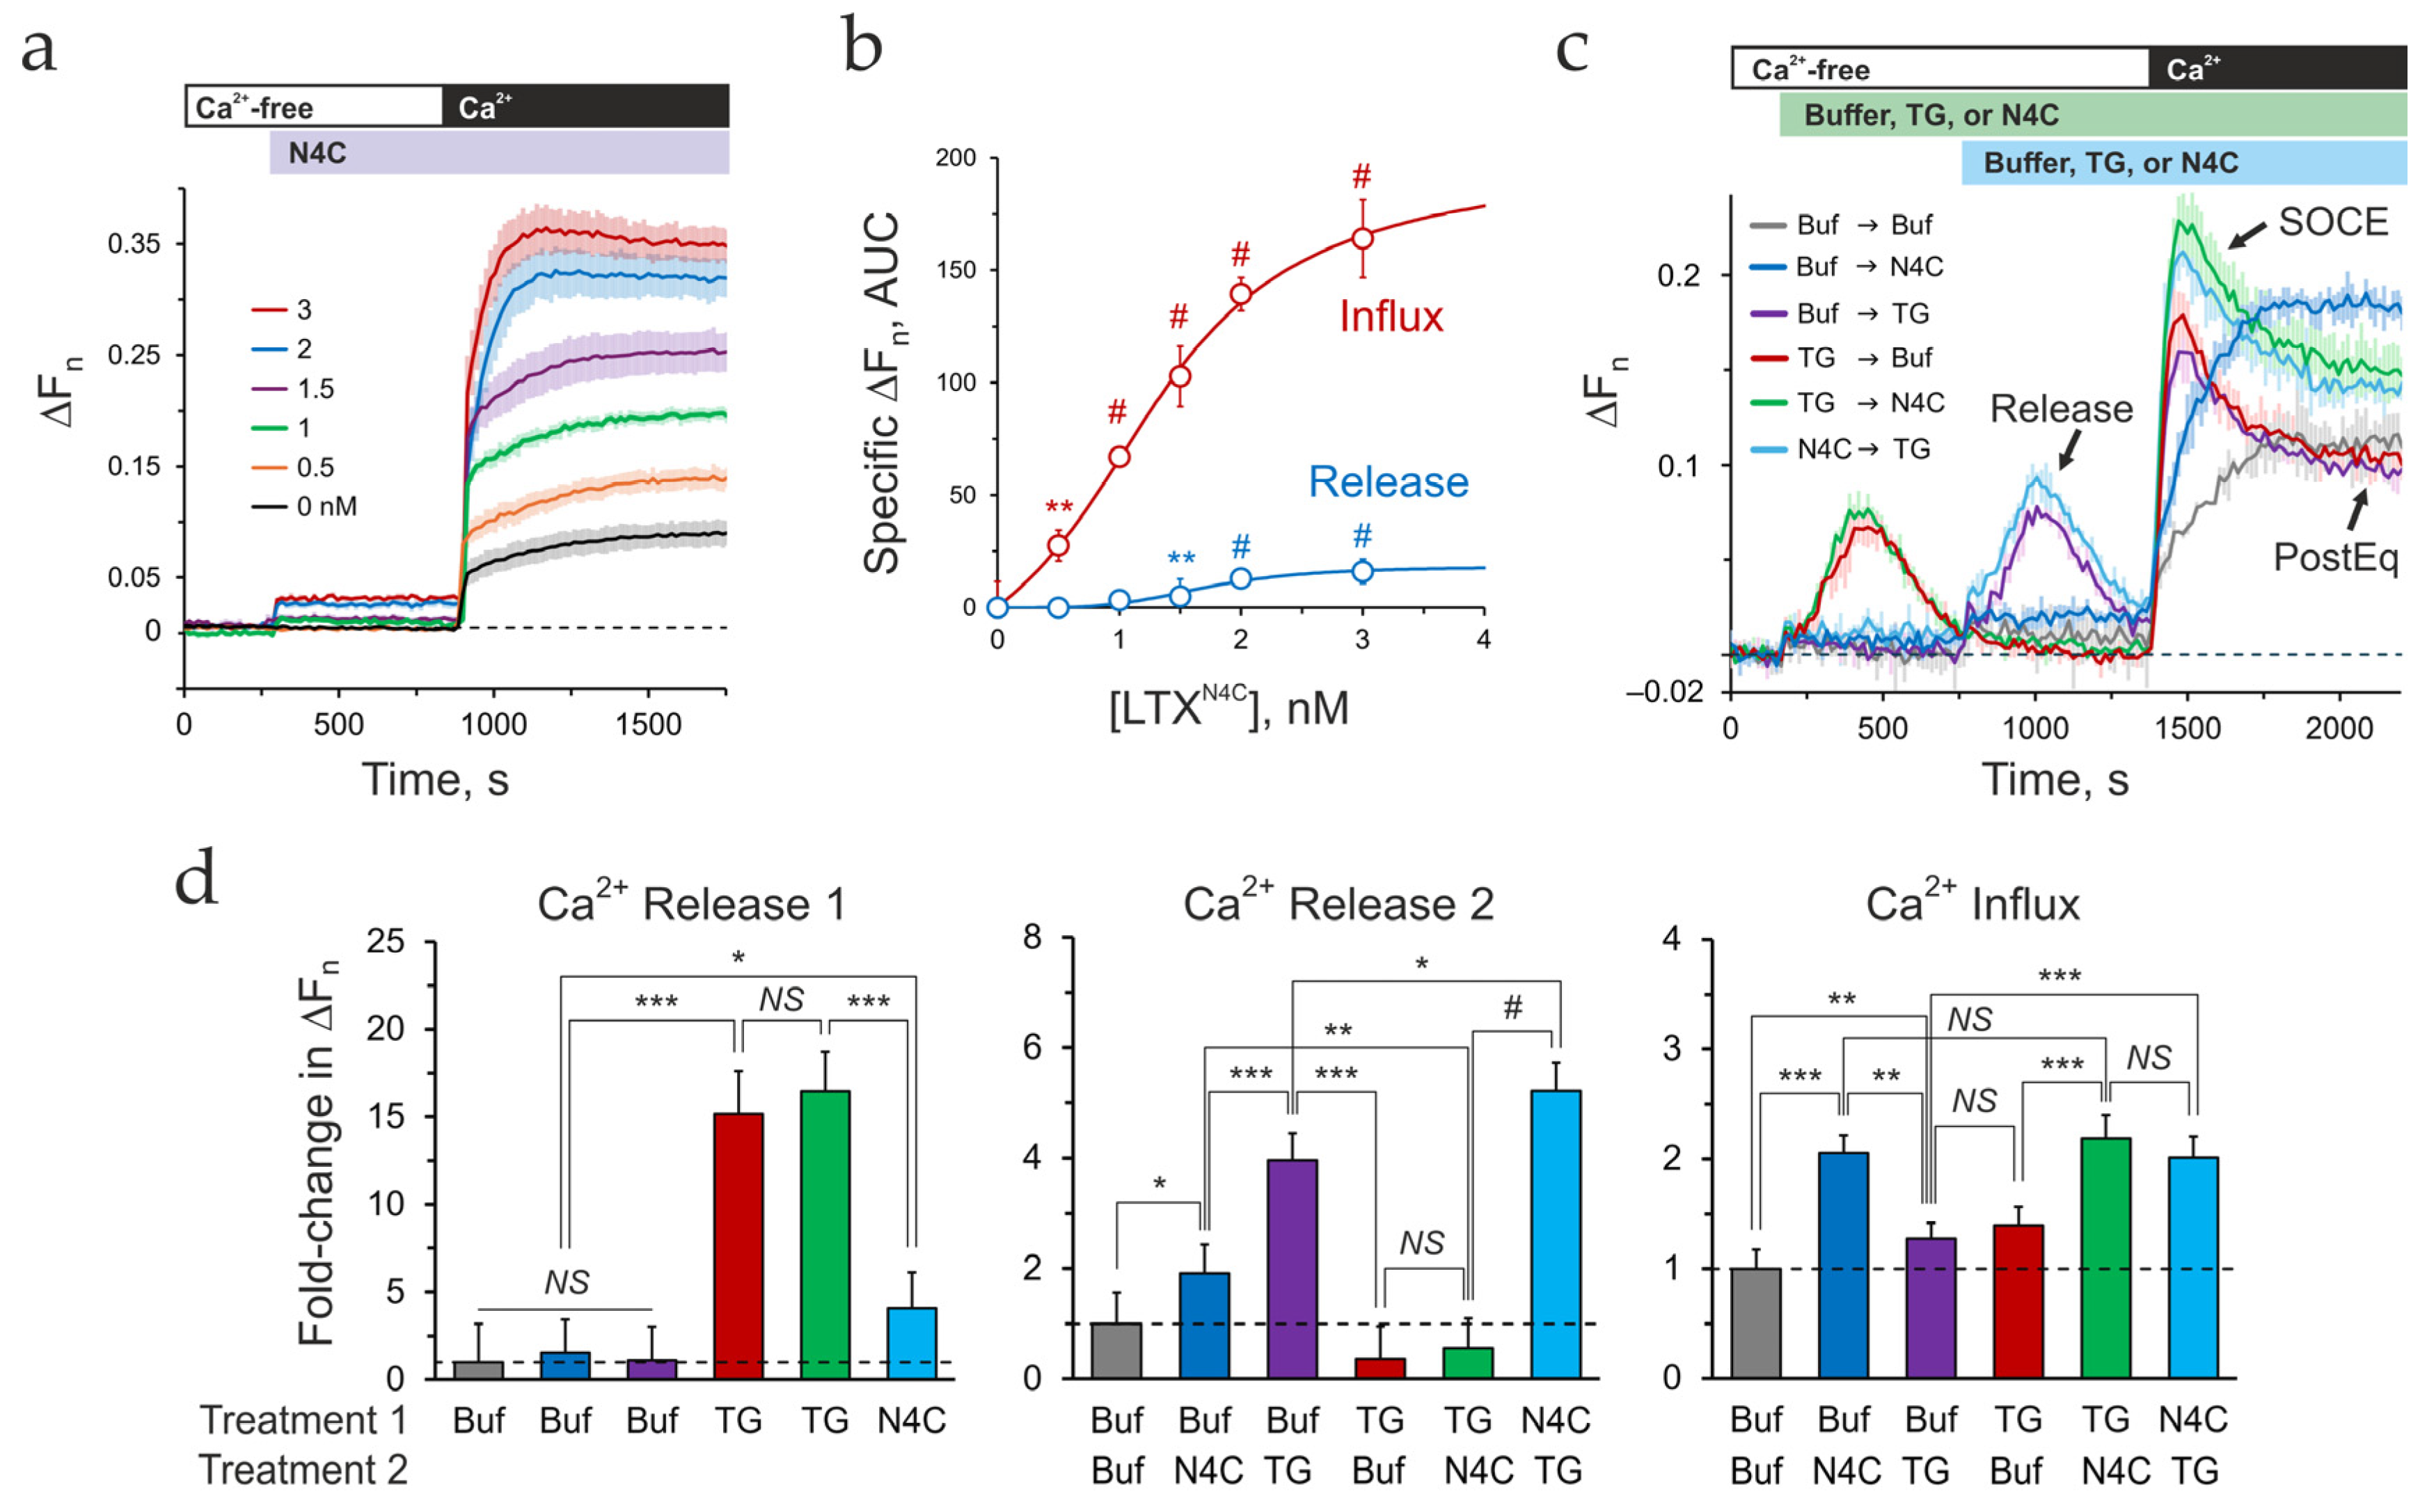
Stimulation of LPH-SF cells by LTXN4C in the absence of Ca2+e led to a fast but small increase in [Ca2+]cyt, which occurred within 15 s of toxin addition and was sustained at the same level during Ca2+-free incubation (Figure 2a and Figure S2a, right). This rise in Ca2+cyt represented LTXN4C-induced Ca2+ Release. This LTXN4C effect was dose-dependent (Figure 2b).
Subsequent addition of 2 mM Ca2+ to the medium induced a fast surge in [Ca2+]cyt, followed by a gradual increase in Ca2+cyt (Figure 2a). While unstimulated LPH cells reacted to Ca2+ addition similarly, response to LTXN4C was much more robust and dose-dependent (Figure 2b). The slow phase of this increase in Ca2+cyt developed over ~120–200 s, did not decay within the time of the experiment, and displayed a small transient peak at high LTXN4C concentrations (Figure 2a), which was reminiscent of the SOCE induced by TG or αLTX (Figure S2a). However, due to the lack of a transient peak of Ca2+ fluorescence, quantification of SOCE separately from the PostEq was not possible, and the overall effect was determined as LTXN4C-induced Ca2+ influx above basal (Figure 2b and Figure S2a).
The specificity of LTXN4C action was demonstrated by applying LTXN4C to proliferating LPH cells and differentiated ΔLPH-SF cells (Figure S2b,c). Consistent with the low level of surface-exposed LPHN1 in proliferating cells (Figure 1g and Figure S1d,e), LPH-PC cells reacted to the toxin by both releasing some Ca2+ and allowing a small Ca2+ influx during respective stages of the protocol. Functional data analysis (FDA) [63] revealed significant difference between the control and LTXN4C stimulation in proliferating LPH-PC cells (p = 0.038, FANOVA) (Figure S2b). Pointwise tests confirmed differences during both the Ca2+ release phase (300–1200 s) and Ca2+ influx phase (1250–2000 s). As expected, the reaction of differentiated ΔLPH cells (ΔLPH-SF) to LTXN4C did not differ from that of control (unstimulated) ΔLPH-SF cells at both protocol stages (Figure S2c).
The Ca2+ release and influx stimulated by LTXN4C via LPHN1 exhibited two unexpected characteristics.
First, the Ca2+ level during the release phase was both low and constant, implying a weak signal or a limited Ca2+ store. To determine whether LTXN4C acts on ER Ca2+ stores, we stimulated LPH-SF cells with LTXN4C and TG, a sarcoplasmic/endoplasmic reticulum Ca2+-ATPase (SERCA) inhibitor that depletes ER stores. The two stimulants were applied sequentially during the Ca2+-free phase, followed by Ca2+e addition (Figure 2c). As anticipated, TG consistently produced classical Ca2+ dynamics: Ca2+ release, SOCE, and PostEq (Figure 2c; compare Buf → TG with TG → Buf). Unexpectedly, when LTXN4C was applied first, it did not diminish TG-induced Ca2+ release or SOCE but instead had an additive effect with TG (Figure 2c,d; compare Buf → TG with N4C → TG). Even more strikingly, pre-treatment with TG significantly inhibited the subsequent LTXN4C-induced Ca2+ release but still resulted in a Ca2+ influx substantially stronger than that induced by TG alone (Figure 2c,d; compare Buf → N4C with TG → N4C and TG → Buf).
To explain the Release data, we hypothesized that LTXN4C signaling via LPHN1 mobilizes a TG-insensitive Ca2+ store that can exchange Ca2+ with the ER. When LTXN4C is applied before TG, the ER remains full, leading to additive Ca2+ release from both stores. However, when TG is applied first, it depletes the ER, which subsequently draws Ca2+ from the small LTXN4C-sensitive store. This reduces the amount of Ca2+ available for subsequent release by LTXN4C. Consistent with this model, the SOCE phase data indicate that the TG- and LTXN4C-sensitive stores activate Ca2+ influx independently and so have an additive effect.
Second, the LTXN4C-induced Ca2+ influx lacked the large transient peak typically associated with the synchronized opening and inactivation of SOCCs, as seen with TG or αLTX treatment, prompting us to investigate its underlying cause. While the distinct Ca2+ stores mobilized by LTXN4C and TG likely contribute to the differing influx patterns (see Section 3), a technical factor may also be responsible. Ca2+ fluorescence traces recorded in a microplate fluorometer represent integrated population-level signals from 500 to 1000 cells in each well. Although individual cells may exhibit transient SOCE peaks, when these responses are desynchronized across the population, they will average out to a smooth, gradual increase in bulk measurements—a known limitation of such assays [64]. To overcome this constraint and resolve Ca2+ dynamics at the single-cell level, we turned to confocal fluorescence microscopy.

2.3. Ca2+ Signaling Induced by LPHN1 Activation in Individual Cells

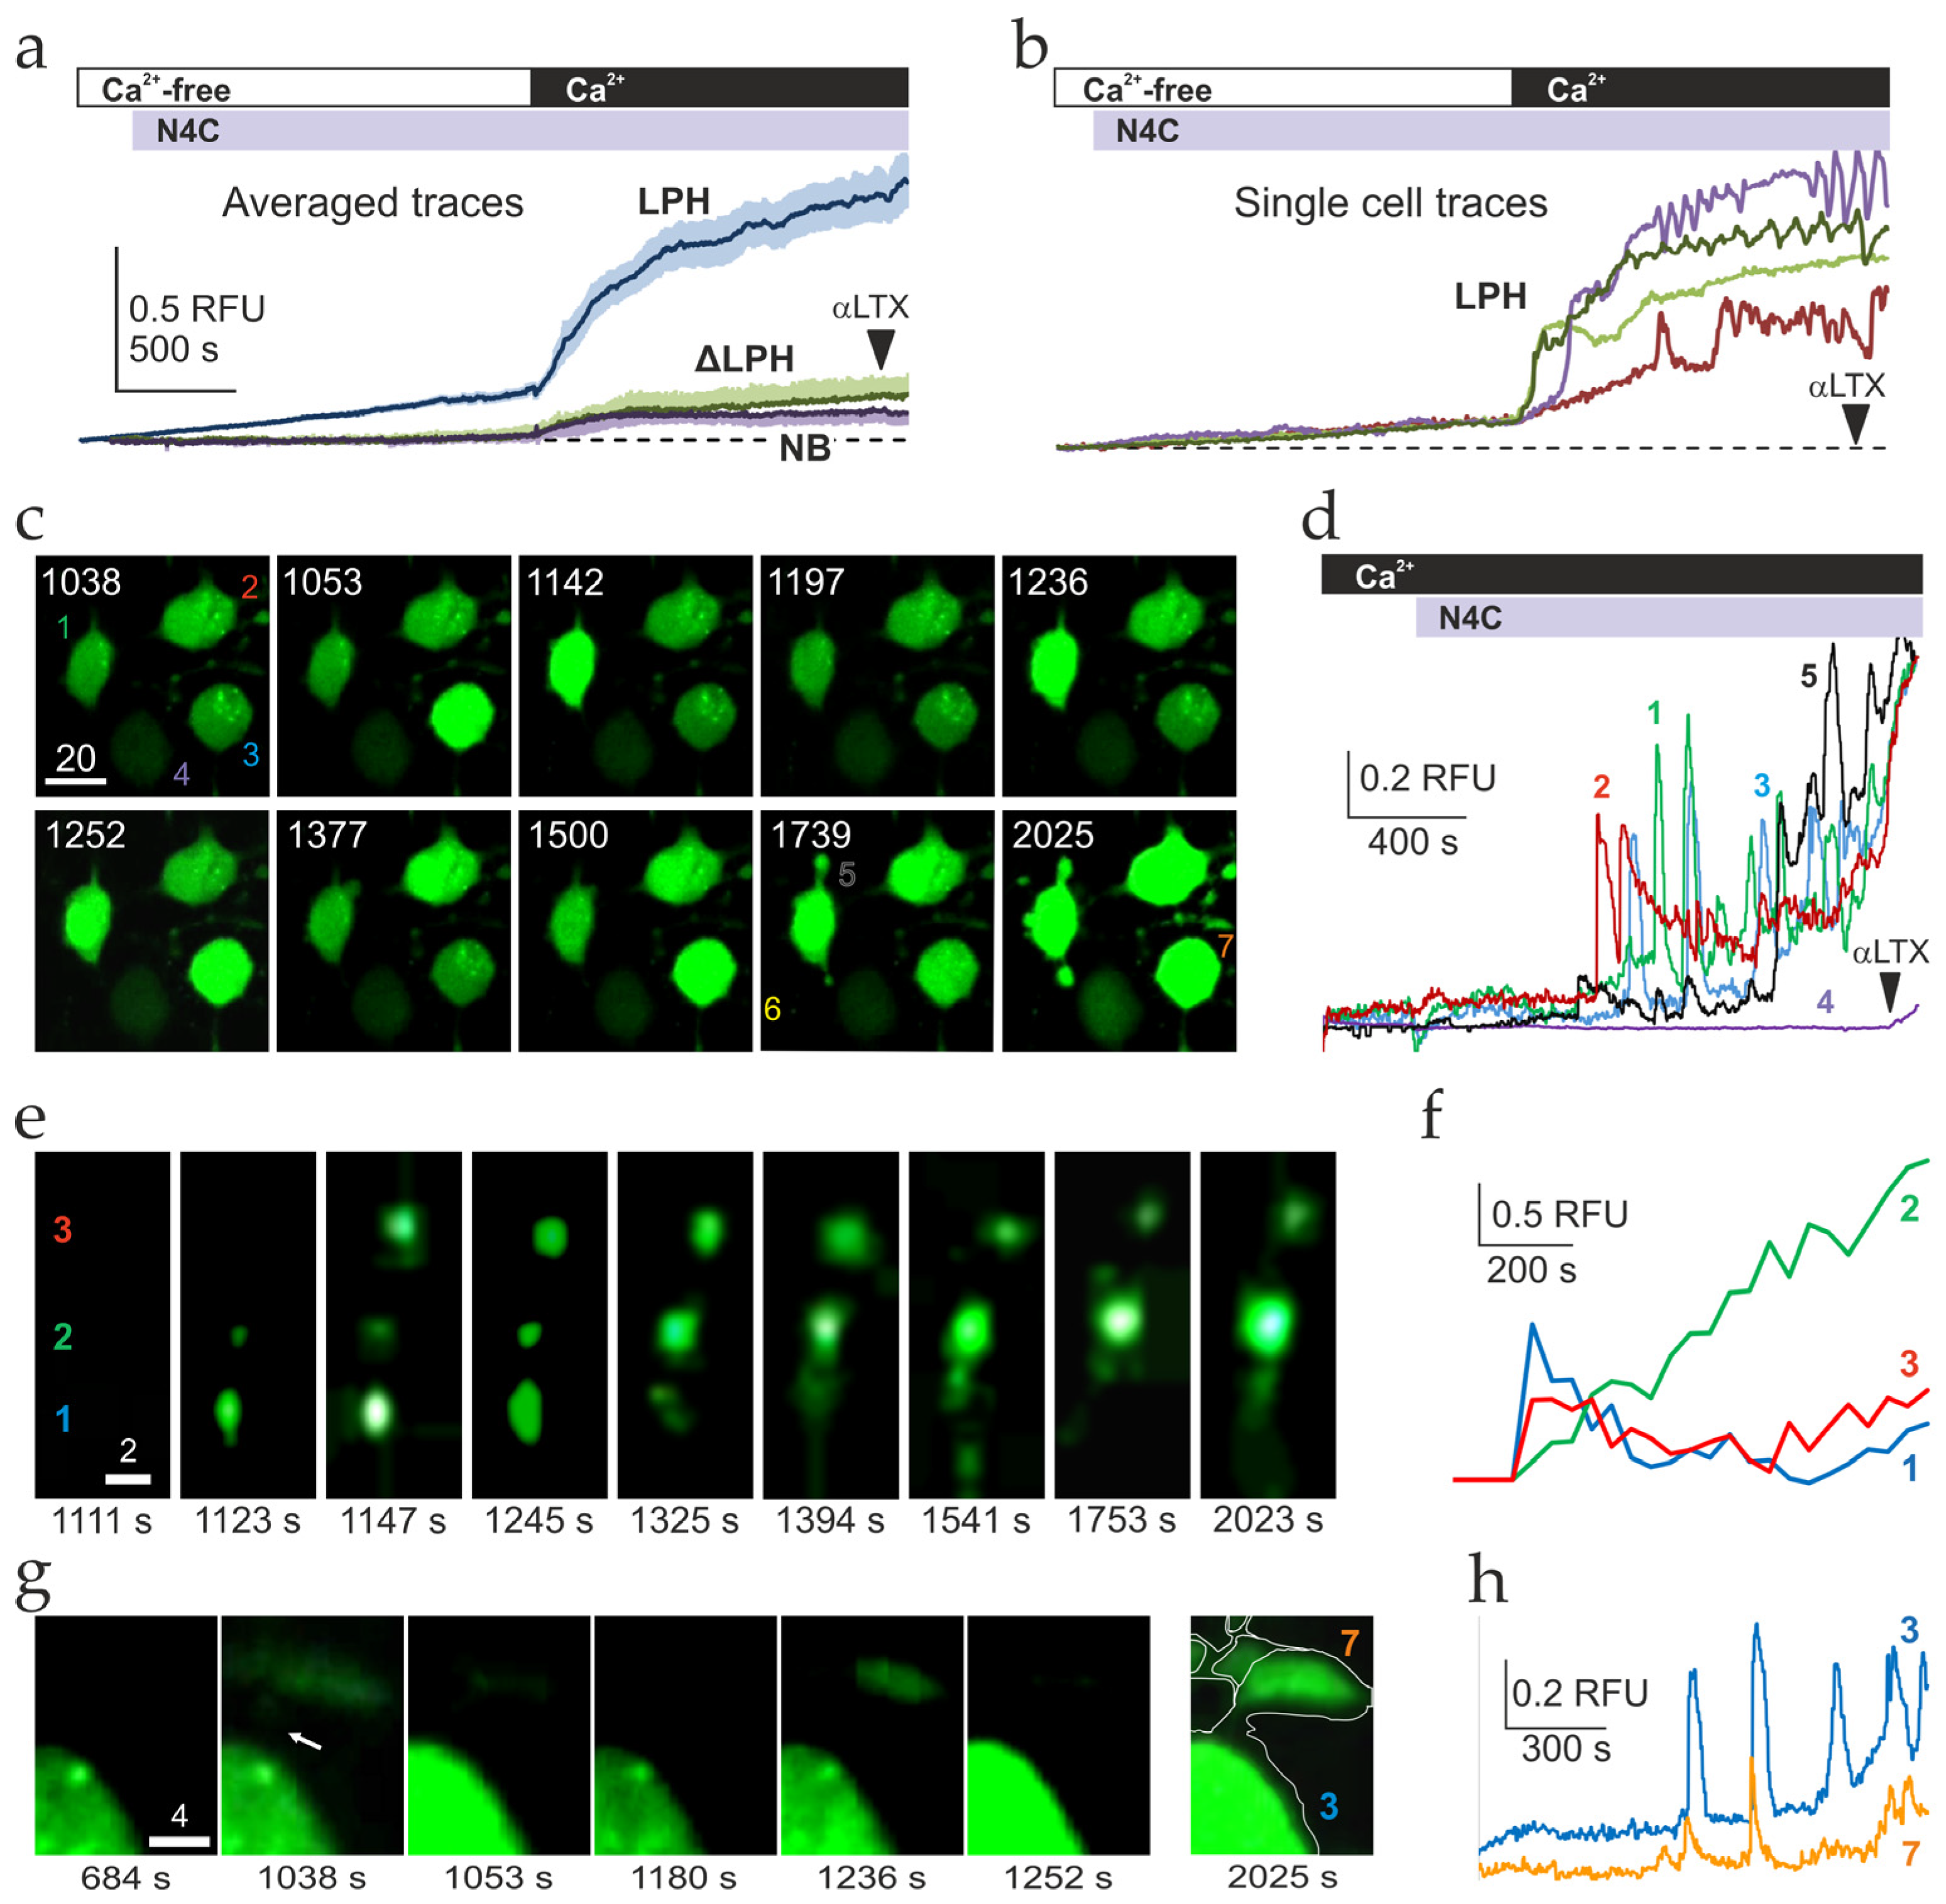
Differentiated LPH, ΔLPH, and NB cells were loaded with Fluo-4 AM and treated according to the standard protocol, while confocal images of multiple cells were frequently acquired under a confocal fluorescent microscope. By measuring the brightness of all cells in a series of time-lapse images, average Ca2+ fluorescence traces were produced, which appeared very similar to the bulk fluorescence traces described above (Figure 3a). The average traces show that LPH cells reacted to LTXN4C by releasing Ca2+ during the Ca2+e-free phase, and by gradually increasing [Ca2+]cyt after Ca2+e addition. By contrast, ΔLPH and NB average traces did not demonstrate Ca2+ release but only showed a low basal Ca2+cyt influx after Ca2+e addition (Figure 3a).
However, Ca2+ fluorescence traces of individual cells obtained from the same confocal images revealed a more complex behavior (Figure 3b). During the Ca2+ influx phase, single LPH cells showed sharp Ca2+cyt peaks, combined in some cells with [Ca2+]cyt oscillations. A key feature of these Ca2+ spikes and oscillations was the lack of their synchronization between individual cells (Figure 3b). Individual ΔLPH and NB cells showed no Ca2+ oscillations (Figure S3a).
To extract more detailed information from single-cell recordings, we carried out confocal fluorescent imaging of LPH-SF and ΔLPH-SF cells at a higher magnification and added Ca2+e before LTXN4C to prevent any Ca2+ signal synchronization (Figure 3c and Figure S3b). Ca2+ fluorescence traces (Figure 3d) demonstrate that, after a delay of 10.7 ± 0.6 min, LTXN4C induced high-amplitude Ca2+cyt spikes. Using Equation (3) (Section 4.7.2), peak [Ca2+] in these spikes was estimated to average 2.2 ± 1.1 μM but reached 27 μM Ca2+cyt in some cells. In many cells, these spikes occurred with an imperfect periodicity of 113.8 ± 18.1 s, while other cells demonstrated Ca2+cyt oscillations with a lower frequency (average period 73.9 ± 6.4 s) and amplitude (average peak Ca2+ concentration 127.6 ± 6.7 nM). These effects were specific to LPH cells, where they occurred in 61 ± 5% of cells, and were never observed in ΔLPH cells (Figure S3b,c). In addition, 25 ± 3.2% of LPH-SF cells did not undergo full differentiation and, therefore, only expressed low amounts of receptors. Such cells showed no LTXN4C-induced Ca2+ influx but reacted to permeabilization with αLTX by a very small increase in Ca2+cyt (Figure 3c, cell 4). Thus, LTXN4C produced in LPH cells a desynchronized SOCE, which was likely combined with CICR.
The single-cell Ca2+ fluorescence recordings demonstrated interesting features of LTXN4C effect. For example, individual varicosities, which were located on the same neurite within 3–4 μm from each other (Figure 3e), showed different and independent patterns of Ca2+ regulation (Figure 3f). Other varicosities were apparently functionally connected to the cell body (Figure 3g), so that periodic small Ca2+ spikes occurring within the varicosity were transmitted to the cell body, where they were amplified, producing, after a short delay, large Ca2+cyt peaks of higher amplitudes (Figure 3h). This suggests that varicosities, which in differentiated NB cells resemble immature nerve terminals [65], contain both LPHN1 and its downstream signaling machinery, and can be activated by LTXN4C independently of each other or the cell body.
A key characteristic of LPHN1-mediated LTXN4C action was its dependence on Ca2+e and delayed onset. When LTXN4C was applied in the presence of Ca2+e, calcium spikes appeared after a 15–20 min delay (Figure 3d). However, if cells were first preincubated with the toxin, subsequent Ca2+e addition triggered an immediate strong Ca2+ influx, which later led to Ca2+ spikes (Figure 3b). Similarly, the rate of the gradual overall increase in [Ca2+]cyt (another feature observed after the onset of toxin’s action) (Figure 3a,b,d,f,h) also depended on the order of reagent addition: it was slow when LTXN4C followed Ca2+e (Figure 3d,h), but rapid when LTXN4C preceded it (Figure 3a,b). Together, these findings indicate that LTXN4C binding to LPHN1 primes the opening of plasma membrane Ca2+ channels and activates a concerted mechanism of SOCE and CICR (see Section 3).
Based on these results, we designed subsequent experiments to identify the specific Ca2+ channels and Ca2+ sensor proteins involved in SOCE that are uniquely expressed in differentiated LPH cells.

2.4. Expression of SOCE-Associated Proteins

To define the repertoire of SOCE-associated proteins in proliferating and differentiated NB, LPH, and ΔLPH cells, we analyzed key sensor and channel proteins (Figure 4). These included the ER-resident Ca2+ sensors STIM1, STIM2, and the regulatory factor SARAF, which fine-tunes SOCE and prevents excessive Ca2+ influx [66,67]. We also assessed potential SOCCs: Orai1–3 and TRPC1–7 channels [68]. While Orai1–3 are primary contributors to SOCE, some TRPC channels (particularly TRPC1/4/5) can also play a role [69,70].
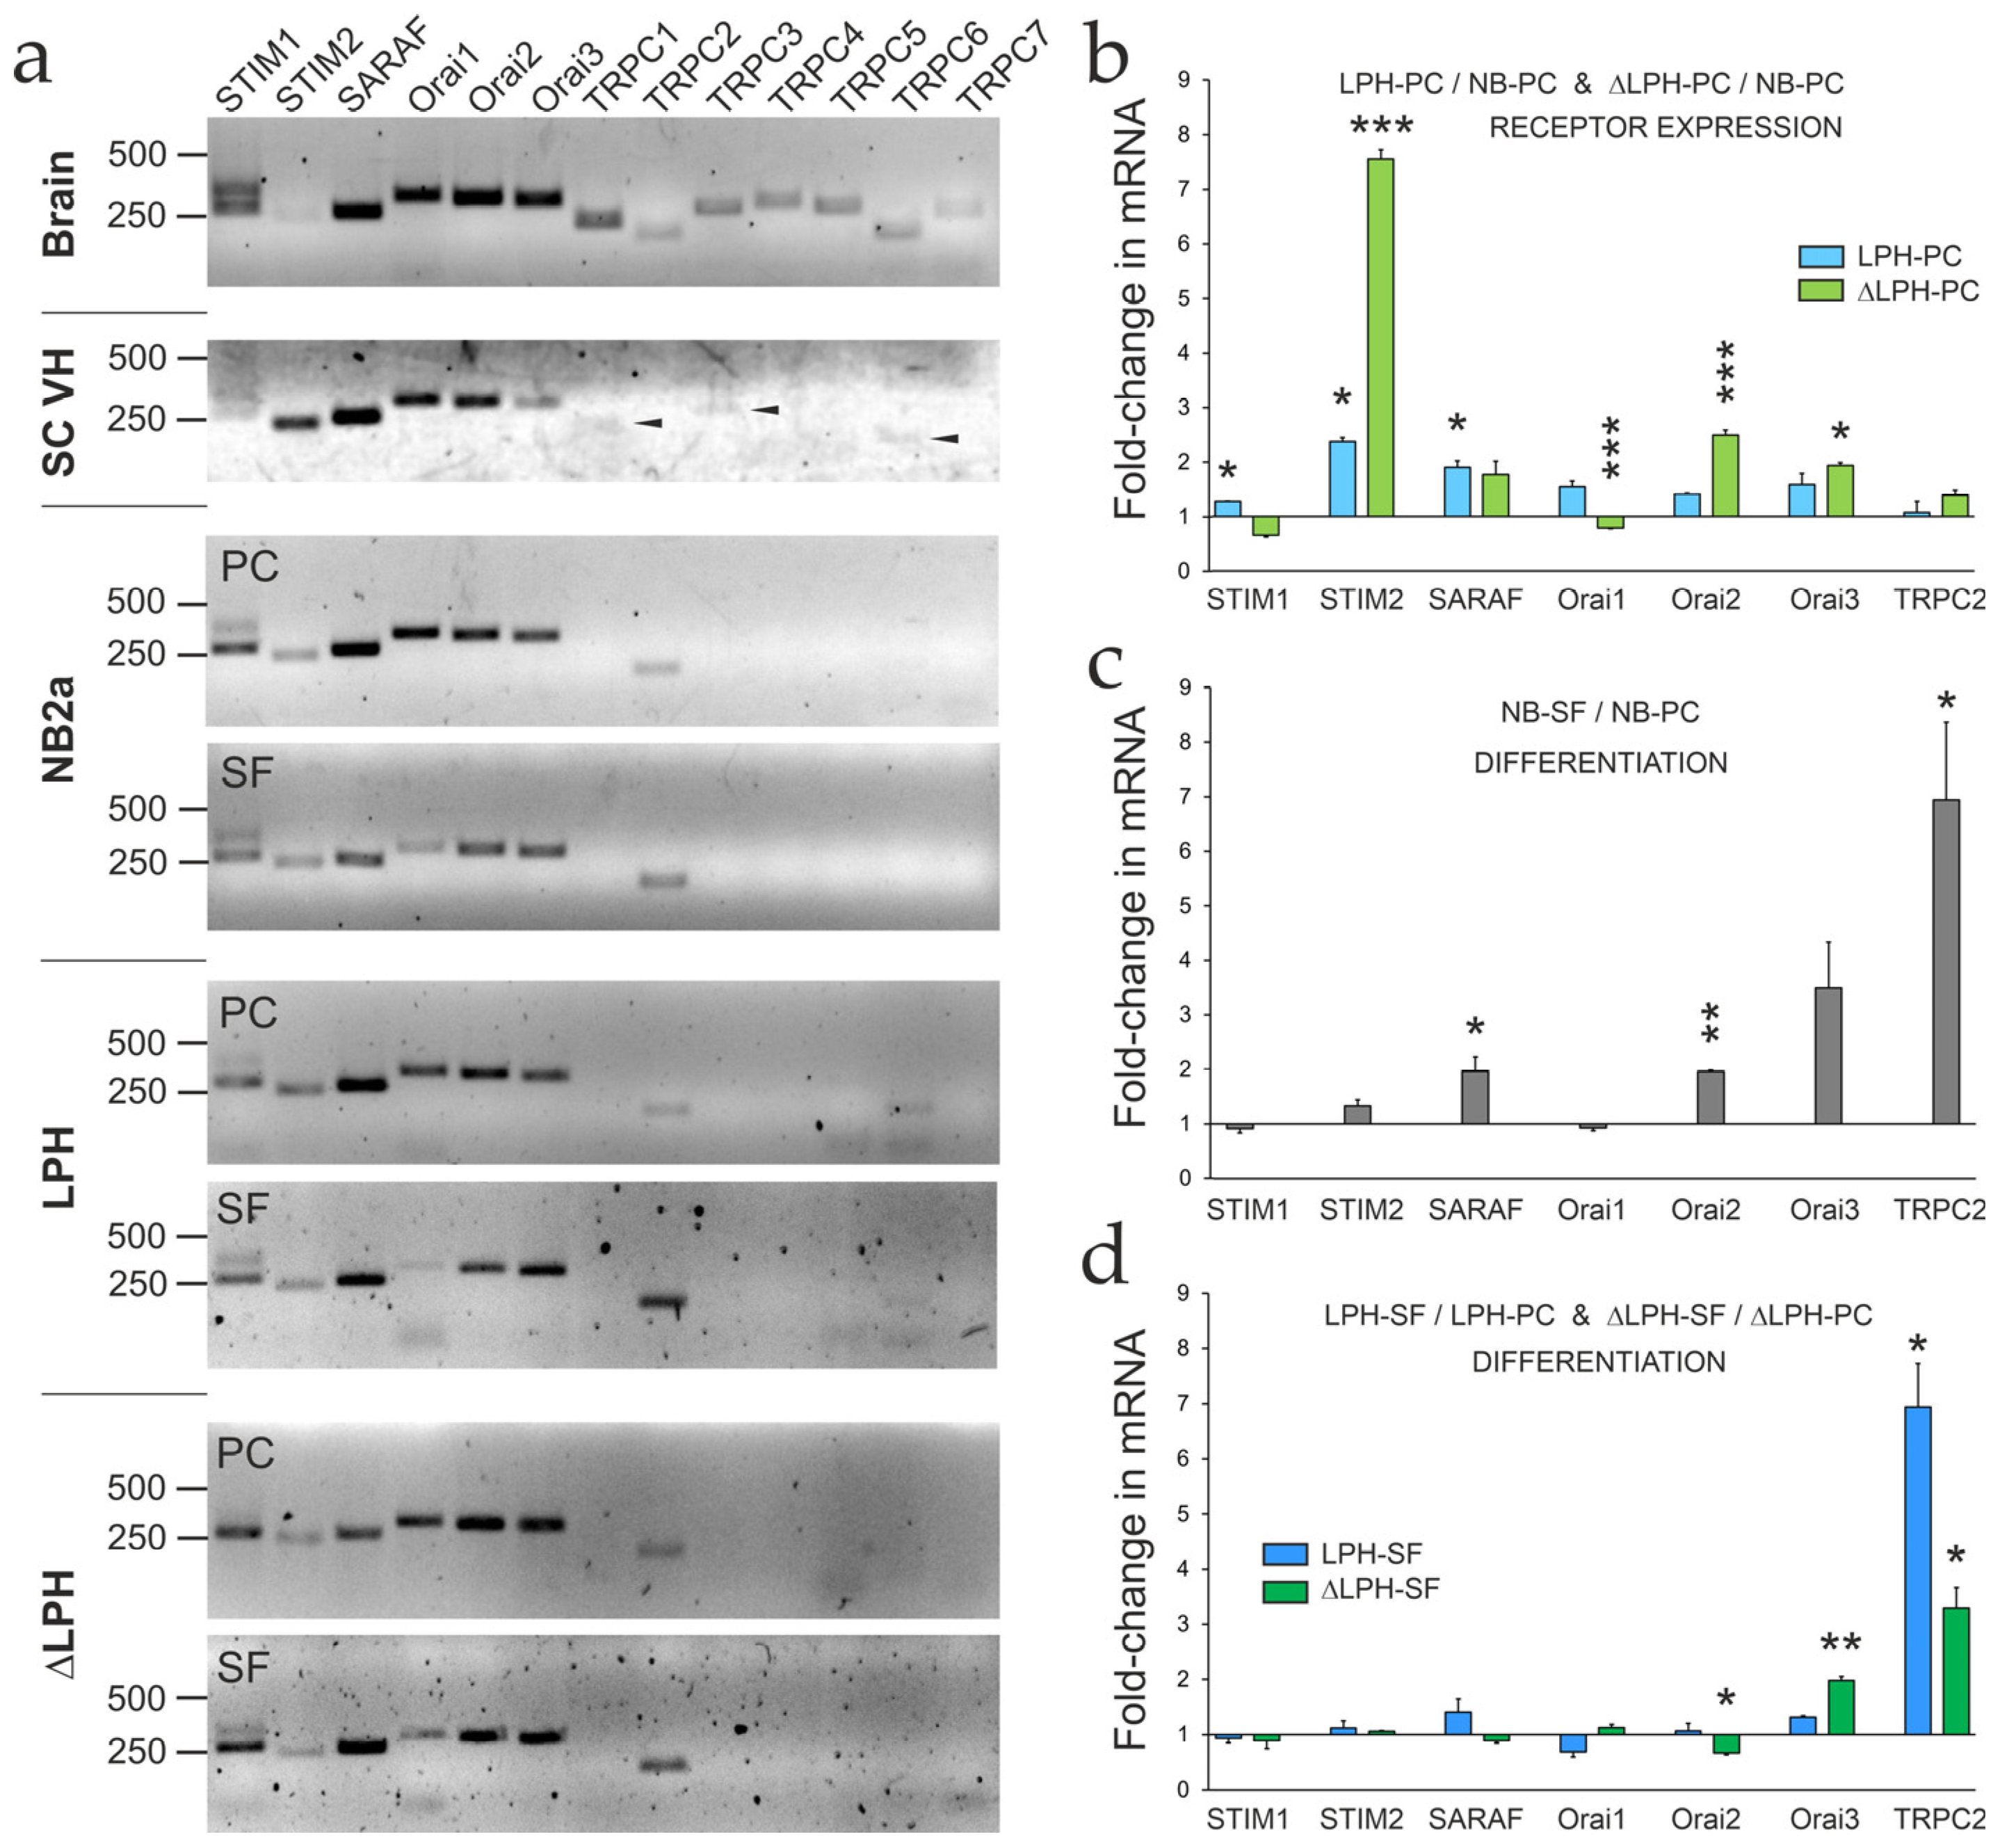
Endogenous mRNAs encoding SOCE proteins were first identified by standard RT-PCR and agarose gel electrophoresis (Figure 4a), which confirmed the specificity of the primers used. All the cell lines tested expressed the ER-membrane proteins (STIM1–2 and SARAF) and some plasma membrane channels (Orai1–3 and TRPC2), while only LPH cells contained TRPC6. Expression profiles in all cells and especially LPH-PC were similar to those in motor neurons from the ventral horn of a mouse spinal cord (Figure 4a), except that the neurons lacked TRPC2 but expressed low levels of TRPC3 (Figure 4a). This supported the relevance of LPH cells as a model system for studying the molecular components of Ca2+ regulation by LPHN1, with the possibility of extending certain conclusions to neurons.
To determine the effect of receptor expression and cell differentiation on the levels of SOCE-associated proteins, qRT-PCR was performed on proliferating and differentiated NB, LPH, and ΔLPH cells (Figure S4). Overall, all cells contained approximately 10-fold more SARAF than STIM and Orai proteins, while expressing very low amounts of TRPC2.
Receptor expression upregulated most mRNAs, but to varying extents (Figure 4b). STIM1 and Orai1 reached higher levels in LPH cells than in ΔLPH cells. SARAF and Orai3 were equally upregulated in both receptor-expressing cells, while STIM2, Orai2, and TRPC2 were especially increased in ΔLPH cells.
Differentiation of cells by serum deprivation (Figure 4c,d) caused an upregulation of SARAF, Orai2, Orai3, and TRPC2 in NB-SF cells, but only Orai3 and TRPC2 in receptor-expressing cells. STIM1, STIM2, Orai2, and Orai3 were less affected by differentiation in receptor-expressing cells than NB cells, possibly because they were already significantly upregulated in proliferating LPH or ΔLPH cells. Differentiation of LPH cells did not significantly affect individual SOCE mRNAs, except for TRPC2, but it was also strongly upregulated in ΔLPH-SF and NB-SF cells.
In summary, STIM2 and Orai2 exhibited the strongest specific upregulation in response to receptor expression. Importantly, Orai2 is much more strongly expressed in the brain than in other tissues [71], suggesting that it is likely to be associated with LPHN1 signaling. The role of these proteins in LPHN1-mediated LTXN4C action was further investigated by RNA interference (RNAi).

2.5. The Role of Orai2 in LPHN1-Mediated LTXN4C Action

shRNA-mediated knockdown of Orai2 mRNA was performed by transfecting LPH-SF cells with plasmids encoding small hairpin RNAs (shRNAs). Four previously uncharacterized Orai2-targeting shRNA constructs (sh1–4) were evaluated. The level of Orai2 mRNA in shRNA-transfected cells was assessed by qRT-PCR and compared to that in untransfected cells (Figure S5a). Plasmids encoding sh1 and sh2 produced the highest level of Orai2 mRNA degradation. Based on the positive knockdown results, sh1 and sh2 were compared in relation to their effect on [Ca2+]cyt regulation and the expression of other SOCE-associated genes.
Bulk Ca2+ fluorescence recordings were performed on LPH-SF cells transfected with sh1 or sh2, loaded with Fluo-4 AM, and stimulated with TG using the standard stimulation protocol (Figure S5b). The sh1 plasmid caused a significant decrease in TG-induced Ca2+ release and also attenuated SOCE and PostEq (Figure S5c), while the sh2 plasmid had no effect on TG actions.
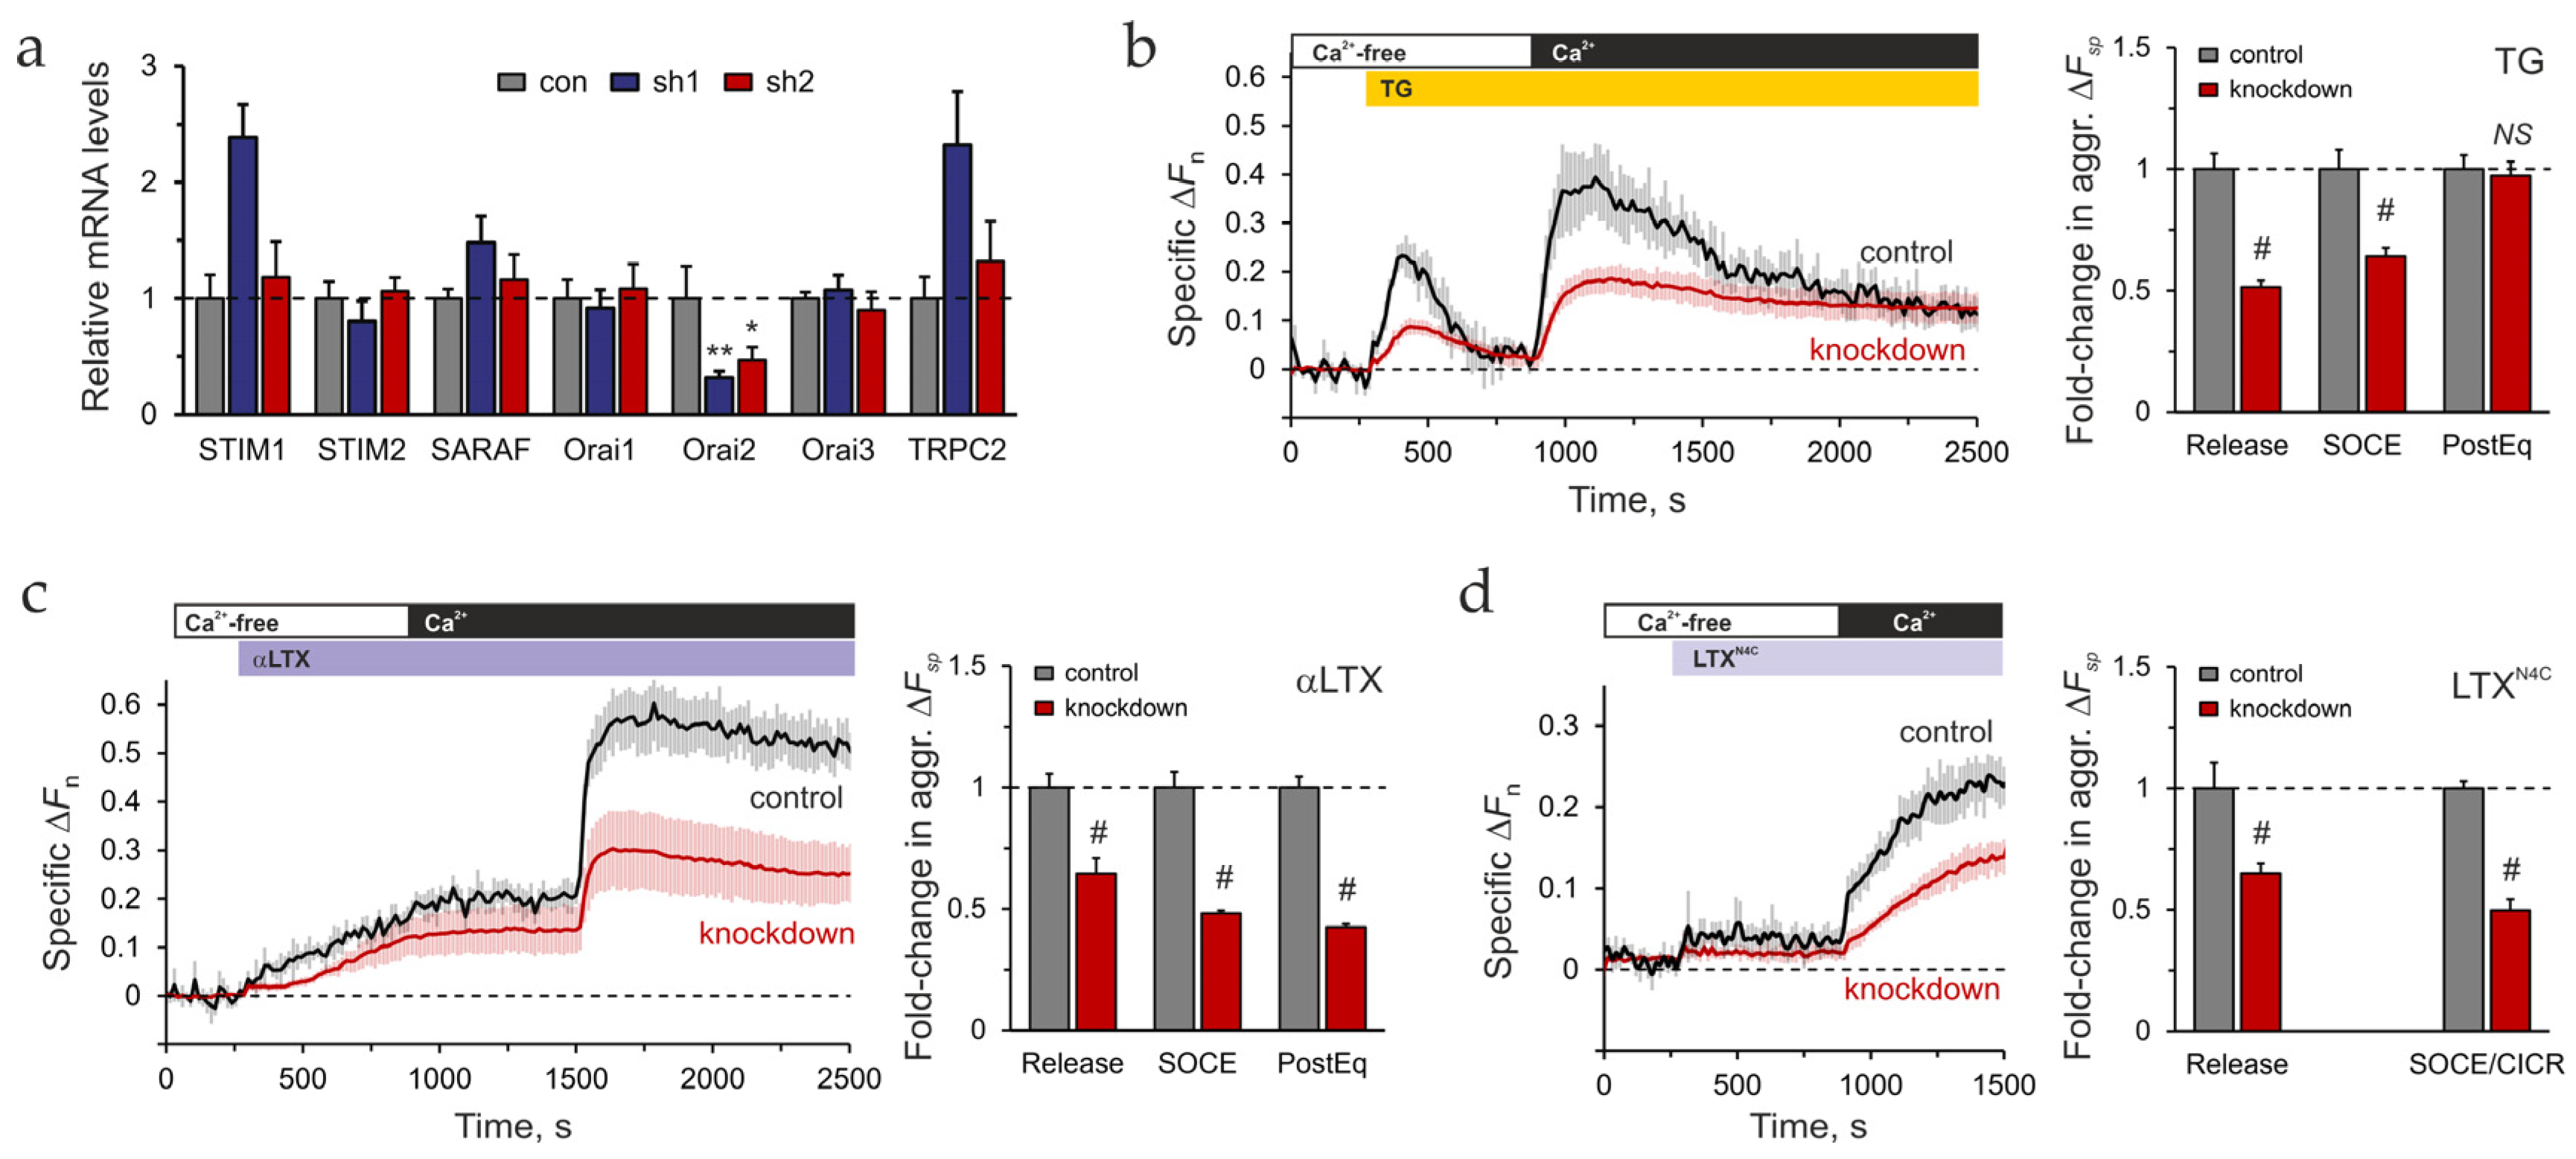
Surprisingly, while sh1 and sh2 inhibited Orai2 expression to a similar extent, only sh1 significantly upregulated other SOCE mRNAs (STIM1, SARAF, and TRPC2) (Figure 5a). This could be due to off-target effects of sh1, which would hinder the interpretation of any results. Consequently, sh2 was selected for Orai2 knockdown studies.
It is important to note that mRNA quantification likely underestimates the extent of knockdown in individual cells. Since the mRNA analysis was performed on the whole culture, while only 30–40% of cells were transfected with the sh plasmids, the data in Figure S5a and Figure 5a likely reflect the complete degradation of Orai2 mRNA in the successfully transfected cells. To overcome this discrepancy, we used a genetically encoded Ca2+ indicator, GCaMP protein. When co-transfected with the sh plasmid, both Orai2 mRNA interference and GCaMP expression occur in the same cells, allowing Ca2+ fluorescence recordings to be limited to knockdown cells.
First, to compare the performance of GCaMP and Fluo-4 under our experimental conditions, we analyzed their sensitivity and response kinetics to cytosolic Ca2+ changes. Differentiated NB cells were either transfected with GCaMP6S or loaded with Fluo-4 AM, then stimulated with TG. As shown by the baseline-normalized traces (Figure S5d), GCaMP exhibited a lower response amplitude than Fluo-4 during both Ca2+ release and SOCE phases. This difference was partly due to GCaMP’s expression in transfected cells only, as opposed to Fluo-4’s presence in the entire population. However, Fluo-4 also more accurately reported low Ca2+ concentrations and displayed a slightly faster dissociation rate (illustrated by the shape of SOCE peaks in Figure S5d and consistent with previous reports [72]). Nevertheless, two similar GCaMP fluorescence traces can be quantitatively compared within the relatively wide area of linear response. Therefore, despite its limitations, GCaMP was essential for our knockdown experiments, as it enabled specific recording of Ca2+ signals from transfected cells.
To determine the role of Orai2 in LTXN4C- and LPHN1-mediated [Ca2+]cyt dynamics, differentiated LPH cells were co-transfected with the sh2 and GCaMP6S plasmids, and stimulated by TG, αLTX, or LTXN4C. GCaMP-Ca2+ fluorescence of knockdown cells was recorded in a microplate fluorometer. Orai2 knockdown did not affect Ca2+ release or influx under the basal (unstimulated) conditions (Figure S5e,f). However, the knockdown resulted in a 40–60% inhibition of both Ca2+ release and SOCE compared to control cells, upon stimulation with TG or αLTX (Figure 5b,c). This suggests that Orai2 mediated about 50% of SOCE in LPH cells, and the knockdown-induced decrease in Ca2+ influx could in turn affect the size of ER Ca2+ stores. Only the PostEq phase after TG stimulation did not differ in knockdown and control cells (Figure 5b), indicating that Ca2+cyt extrusion machinery was not affected by Orai2 knockdown. LTXN4C-induced Ca2+ release and Ca2+ influx (SOCE/CICR) were also strongly decreased by Orai2 knockdown (Figure 5d).
In summary, while Orai2 contributes to the maintenance of Ca2+ stores and the influx stimulated by TG or latrotoxins, it is not critical, as its knockdown neither fully blocks SOCE nor depletes the stores. This indicates the involvement of other proteins in LPHN1-mediated Ca2+ dynamics. Indeed, we identified STIM2 as one such protein specifically upregulated by LPHN1, which aligns with our hypothesis that LTXN4C acts by stimulating SOCE. We also reasoned that targeting STIM proteins could determine whether LPHN1 signaling opens Ca2+ channels directly or indirectly by store depletion and STIM activation. We therefore focused our subsequent investigation on STIM2.

2.6. The Role of STIM2 in LPHN1-Mediated LTXN4C Action

The role of STIM2 in LPHN1-mediated LTXN4C action was also studied using shRNA-based RNAi technology to knock down STIM2 expression in LPH cells. To alleviate the problems with the non-linearity of GCaMP fluorescence response, [Ca2+]cyt recordings were again performed by loading the cells with Fluo-4 dye. However, lentivirus-mediated transduction of STIM2-targeting shRNA was used this time to overcome the low efficiency of plasmid transfection. Lentiviral transduction conditions, such as multiplicity of infection (MOI), cell density, duration of exposure, and polybrene concentration, were extensively optimized (Figure S6a,b). The transduction efficiency was quantified using the signal from red fluorescent protein (RFP), encoded by the lentiviral vector, and reached ~65% (Figure S6a,b).
The inhibition of STIM2 mRNA in transduced LPH cells was ascertained by qRT-PCR and constituted ~65% (Figure 6a), while other SOCE-associated proteins were not significantly affected. We then assessed the effect of STIM2 knockdown on Ca2+ signaling in cells loaded with Fluo-4 AM and stimulated with αLTX or LTXN4C (Figure S6c–e and Figure 6b–e). Under basal conditions (no stimulation), Ca2+ release during incubation in Ca2+-free medium was slightly but insignificantly lower in knockdown cells compared to control LPH cells (Figure S6c,d). By contrast, Ca2+ influx was increased by ~28% in STIM2 knockdown LPH cells (Figure S6c,d).
STIM2 knockdown altered the Ca2+ response to αLTX stimulation (Figure 6b,c), resulting in a marginal reduction in specific (above background) Ca2+ influx, a substantial augmentation of specific SOCE amplitude, and a higher PostEq Ca2+ level compared to control cells. Finally, while STIM2 knockdown had no significant effect on LTXN4C-induced Ca2+ dynamics (Figure 6d), we noted a similar, although non-significant, trend toward decreased release and increased SOCE/CICR (Figure 6e).
These findings corroborate our data reported in Section 2.2, which identify the LTXN4C-sensitive Ca2+ pools as distinct from the ER, as they are not directly sensitive to TG. This non-ER nature of the toxin-mobilized stores indicates that the mutant toxin acts through a mechanism independent of the canonical ER-SOCC coupling pathway and thus does not involve STIM proteins. We discuss alternative mechanisms for Ca2+ release and influx in Section 2.8 and Section 3.6.
While the observation that STIM2 knockdown slightly reduces the size of Ca2+ stores but enhances SOCE seems counterintuitive, it is consistent with the established dual-role model of STIM proteins (discussed in Section 3.3). Importantly, the inability of STIM knockdown to affect LTXN4C action excluded its involvement in LTXN4C-induced, LPHN1-mediated Ca2+ dynamics and indicated a direct signaling link between LPHN1 and Ca2+ channels.
Together, the Orai2 and STIM2 knockdown results ruled out SOCE as the main target of LPHN1-mediated signaling. Furthermore, the data described in Section 2.2 and Section 2.3 demonstrated that LTXN4C-induced Ca2+ spiking was always accompanied by a constant influx of Ca2+e, implicating the opening of specific Ca2+ channels. Therefore, we concentrated our subsequent efforts on identifying these Ca2+ channels.

2.7. VGCC Expression

While a large number of channels can provide Ca2+ entry pathways [73], one group potentially involved in LPHN1-mediated LTXN4C actions in presynaptic nerve terminals is the VGCC family. While VGCCs are not part of the core SOCE mechanism, they can modulate it indirectly in excitable cells [74]. Importantly, VGCCs are central to CICR in myocytes/neurons by providing the initial Ca2+ spark [75,76] and thus could be functionally connected to LPHN1 signaling in synapses.
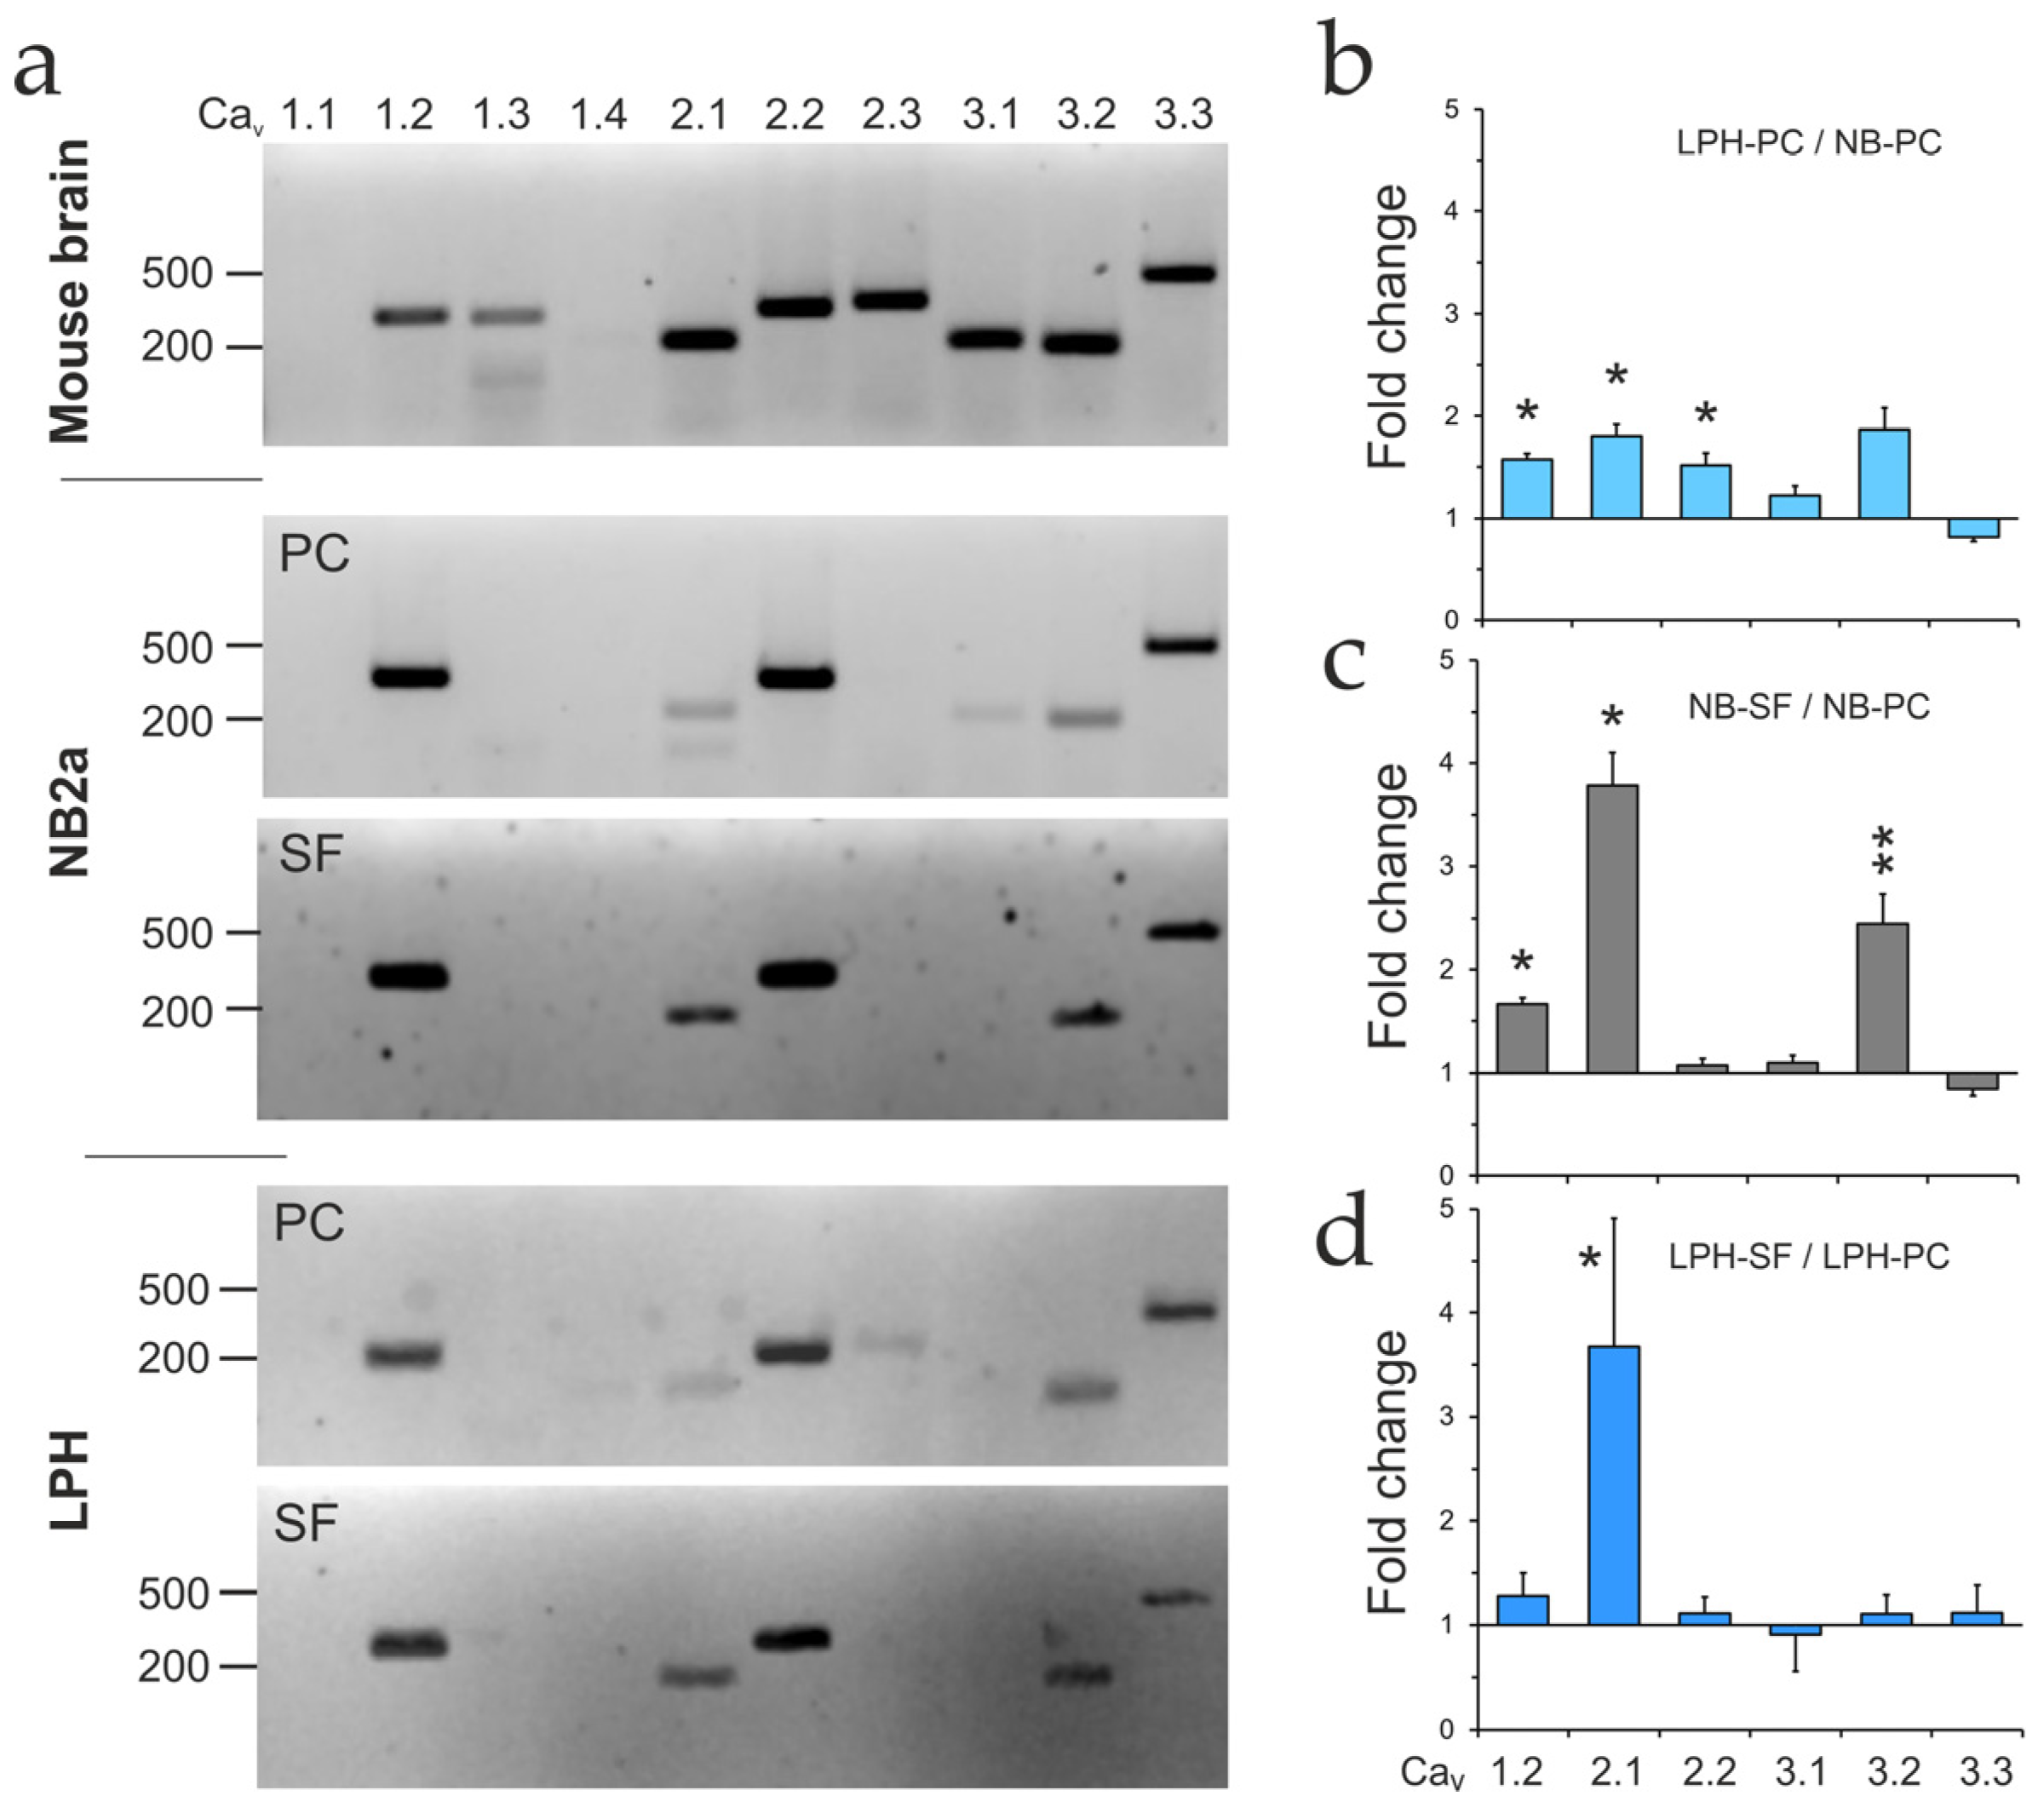
Initially, the expression of different VGCC α1 subunits was assessed in NB and LPH cell lines, and compared to mouse brain using RT-PCR and agarose gel electrophoresis (Figure 7a). For all mRNAs tested, products of expected size were observed, confirming the specificity of the amplification reactions. All VGCC α1 subunits, except Cav1.1 and 1.4, were detected in the mouse brain. Proliferating NB cells expressed only a subset of these VGCCs: one L-type channel (Cav1.2), two neuronal channels: P/Q-type (Cav2.1) and N-type (Cav2.2), and all three T-type channels (Cav3.1–3.3). However, in NB cells, the levels of Cav2.1, 3.1, and 3.2 were significantly reduced, while Cav1.3 and 2.3 were absent. Proliferating LPH cells expressed a similar repertoire of VGCCs as NB cells, but contained some Cav2.3, while lacking Cav3.1.
To reveal the effects of LPHN1 expression and cell differentiation on VGCC levels, we performed qRT-PCR in both proliferating and differentiating NB and LPH cells (Figure S7). For all mRNAs tested, the amplification and melting curves were consistent with specific amplification. As shown in Figure 7b, LPHN1 expression in proliferating cells upregulated all VGCC α1-subunits except Cav3.3.
Differentiation in SF medium increased the levels of Cav1.2, 2.1, and 3.2 in NB cells but only Cav2.1 in LPH cells (Figure 7c,d). Notably, differentiation upregulated the neuronal channel Cav2.1 especially strongly, corroborating our previous conclusion that it shifts NB cells toward a neuronal phenotype.
Based on these results, Cav1.2 and Cav2.1 were selected for further investigation of their role in LTXN4C actions.

2.8. Cav2.1 Is Critical for LPHN1-Mediated LTXN4C Action

To assess the role of Cav1.2 in LPHN1-mediated LTXN4C action, we used specific L-type VGCC inhibitors [77]. Nimodipine is highly selective for L-type (Cav1.1–1.3) calcium channels and does not interact with other Ca2+ channels or transporters (e.g., non-L-type VGCCs, Orai, TRPC channels) [77,78].
While Cav2.1 (P/Q-type VGCC) is strongly upregulated in differentiated LPH cells, these cells also express much larger amounts of Cav2.2 (N-type VGCC). Each of these channels can be inhibited separately, using specific blockers [77]. However, to determine the contribution of the whole group of neuronal VGCCs, we employed ω-conotoxin MVIIC, which blocks Cav2.1 with high affinity and Cav2.2 with lower affinity [79,80].
First, we determined the inhibitors’ effects on basal Ca2+ regulation and TG-induced SOCE and PostEq. Nimodipine and MVIIC were applied to LPH cells without stimulation and after stimulation with TG, when ER Ca2+ stores were depleted (Figure S8a). Under the basal conditions, MVIIC only marginally but significantly inhibited Ca2+ influx (Figure S8a,b). By contrast, nimodipine strongly reduced basal Ca2+ influx (Figure S8a–d). Consistent with the small impact of MVIIC, the effect of both inhibitors was not additive (Figure S8a,b). In TG-stimulated cells, only nimodipine reduced SOCE, but both inhibitors reduced the PostEq Ca2+ level (Figure S8a,c,d).
These results indicate that, in LPHN1-expressing cells, L-type VGCCs significantly contribute to both constitutive Ca2+ influx and TG-induced SOCE, whereas the neuronal VGCCs are only slightly involved in constitutive Ca2+ influx. Importantly, both types of VGCC must be open (or frequently opening and closing) at resting potential in these cells.
Subsequent experiments were conducted to assess whether nimodipine or MVIIC inhibits LPHN1-mediated increases in [Ca2+]cyt. LPH-SF cells were incubated in Ca2+-free buffer, exposed to MVIIC, then stimulated with LTXN4C and supplied with Ca2+e (Figure 8a,b). These experiments demonstrated that MVIIC inhibited LTXN4C-induced Ca2+ release and fully blocked the subsequent Ca2+ influx. In contrast to MVIIC, nimodipine did not inhibit but instead augmented LTXN4C-induced SOCE/CICR in LPH cells (Figure S8e).
These observations indicate that LTXN4C stimulates the opening—or induces oscillations—of Cav2.1 and/or Cav2.2 channels in LPHN1-expressing cells, and that inhibiting these channels blocks LTXN4C effects. Although LTXN4C-induced Ca2+ influx does not rely exclusively on Cav2.1/2.2 activity and likely involves other mechanisms [56], these channels appear critical for specific components of LTXN4C-triggered Ca2+ influx. These include both the gradual Ca2+ rise and the Ca2+ spikes associated with combined SOCE and CICR. By contrast, Cav1.2 opening does not contribute to LTXN4C-induced Ca2+ influx, which distinguishes its role from that in basal or TG-induced Ca2+ influx.
These findings demonstrate that LTXN4C stimulates Cav2.1/2.2 channels to open or oscillate in LPHN1-expressing cells, and that inhibiting these channels fully abrogates the LTXN4C-induced Ca2+ influx. While other mechanisms may contribute to LTXN4C actions [56], Cav2.1/2.2 are critical for generating both the gradual rise and the high-amplitude spikes of Ca2+ that characterize the LTXN4C response. Conversely, Cav1.2 is dispensable for the LPHN1-mediated pathway, while playing an important role in basal or TG-induced Ca2+ influx.

3. Discussion

3.1. NB Cells as a Neuronal Model

The present study establishes a role for LPHN1 in shaping calcium signaling dynamics, using NB cells as a model system. We demonstrate that expression of LPHN1, as well as chemical differentiation, promotes a shift toward a more neuronal morphology in these cells. To provide a foundational resource for interpreting Ca2+ signaling data in this model, we cataloged the expression of key proteins associated with SOCE and VGCCs. This provides a valuable resource for the community, profiling the signaling toolkit available in this commonly used neuronal model.

3.2. Deciphering the LTXN4C-Induced Calcium Signature

Our central findings demonstrate that the mutant toxin LTXN4C, which binds LPHN1 without pore formation, stimulates receptor signaling and evokes a complex Ca2+ response. This signaling was previously shown to involve a G protein cascade leading to PLC activation and IP3/DAG production [35,46,56]. The LTXN4C-induced Ca2+ response comprises Ca2+ release from intracellular stores during Ca2+-free incubation followed by pronounced influx upon Ca2+ re-addition. The mechanism connecting the signaling to Ca2+cyt changes will be considered in Section 3.5, while here we will discuss the characteristics of the LTXN4C-induced Ca2+ signals.
We confirmed that in neuroblastoma cells, LTXN4C—similar to wild-type αLTX [45]—mobilizes Ca2+ pools distinct from TG-sensitive ER store, as mutant toxin and TG produce additive effects. A key feature of these pools is their ability to exchange Ca2+ with depleted ER. Pre-depleting the ER with TG reduces the amount of Ca2+ available for subsequent LTXN4C release, whereas adding TG after the toxin allows Ca2+ release from both pools independently.
The depletion of these distinct stores triggers characteristically different Ca2+ influx pathways:
  • Depletion of the LTXN4C-sensitive pools alone induces a gradual, non-inactivating influx, manifesting as combined asynchronous oscillations in individual cells.
  • Depletion of the TG-sensitive ER alone produces a standard transient SOCE peak.
  • When ER depletion follows LTXN4C-sensitive pools release, the subsequent SOCE is strongly augmented.
  • Surprisingly, pre-depleting the ER, despite abolishing the LTXN4C-specific release, still produces an augmented SOCE.
This interplay suggests that LTXN4C and TG not only target different stores but also activate Ca2+ influx through fundamentally different mechanisms. The LTXN4C-induced Ca2+ release is disproportionately small relative to the substantial, gradually developing influx it eventually triggers. Furthermore, the response is not an immediate influx through pre-activated channels, as seen with SOCE, but a delayed process that requires extracellular Ca2+ to fully develop.
We therefore propose a model wherein LPHN1 activation by LTXN4C initiates a Ca2+e-dependent positive feedback loop. Ca2+e acts as a critical co-factor that enters through an initial, limited number of channels, likely of a different type than SOCCs, and subsequently amplifies the signal to progressively activate a larger channel population, eventually leading to CICR and canonical SOCE.
These data partially confirm prior findings that LTXN4C-induced neurotransmitter release in neurons is Ca2+e-dependent and inhibited by TG [56]. However, our results demonstrate that in NB cells, ER depletion by TG inhibits LTXN4C-induced calcium release from internal pools but not Ca2+ influx from the extracellular space. This discrepancy may stem from morphological and functional differences between nerve terminals and NB cell bodies, the main target of LTXN4C in our model expressing exogenous LPHN1. NB cells possess a larger cytosol and greater inter-organelle distances, where signaling processes such as IP3 diffusion and degradation could yield functionally distinct outcomes. The identity of the LTXN4C-sensitive, TG-insensitive calcium pools remains unknown, as does the mechanism of calcium exchange with the ER. These pools could represent specialized ER subregions or recyclable vesicular compartments that lack SERCA Ca2+ pumps, which warrants separate investigation.
Finally, a key insight emerged from comparing population-level fluorometry with single-cell Ca2+ imaging. While the population trace suggests a smooth, gradual Ca2+ rise, single-cell recordings revealed that LTXN4C, in fact, triggers asynchronous oscillatory Ca2+ events in individual cells. We interpret this as evidence for desynchronized SOCE, likely potentiated by CICR from ER stores. The summation of these high-amplitude but stochastic events across the population produces the averaged, smooth curve observed in bulk measurements. In addition, the single-cell Ca2+ imaging showed a constant, gradual increase in the background cytosolic Ca2+ concentration, likely representing a form of sustained Ca2+ influx. This feature provided an early indication that plasma membrane Ca2+ channels distinct from SOCCs might be involved.

3.3. Probing the Roles of Orai2 and STIM2

To dissect LPHN1-mediated signaling cascade, we employed RNAi against proteins upregulated by LPHN1 expression. This approach revealed that knockdown of Orai2 significantly attenuated the LTXN4C-induced calcium response.
Orai2 knockdown similarly affected Ca2+ dynamics evoked by three disparate stimulants, suggesting that Orai2 has a universal function. Therefore, we posit that Orai2, as a typical SOCC, likely contributes to the cell’s intrinsic capacity to sustain SOCE and associated CICR. Its knockdown probably reduces the overall amplitude of the cyclical Ca2+ spiking, thereby diminishing the population-averaged Ca2+ signal, but its removal was not critical for LTXN4C-induced Ca2+ influx. Thus, Orai2 appears to be important for the progression and amplification of the LTXN4C-induced signal, but not its initiation.
As the quantitative estimates of inhibition following Orai2 knockdown were derived from GCaMP fluorescence measurements, we needed to carefully consider key drawbacks of this sensor: non-linear response to [Ca2+], potentially variable expression in distinct cell lines, and finite Ca2+-binding kinetics. These technical difficulties were overcome in our experiments by utilizing the same cell line for knockdown and control, making all recordings under identical conditions, and ensuring that the observed calcium changes in both knockdown and control cells fell within the same dynamic, quasi-linear portion of GCaMP’s response. As our primary goal was not to measure absolute Ca2+ concentrations, but to identify a relative attenuation of the response in a targeted manner, GCaMP was ideally suited for this task due to its ability to be co-transfected with shRNA plasmids, ensuring that recorded signals originated exclusively from knockdown cells, a prerequisite for legitimate signal normalization.
Furthermore, the non-linearity of GCaMP’s response means that signals can be compressed at high Ca2+ concentrations, potentially underestimating the magnitude of SOCE in control cells. This suggests that the degree of SOCE inhibition may be even more pronounced than our estimates indicate. Therefore, our conservative reporting provides high confidence that Orai2 knockdown produces a significant and biologically relevant attenuation of the LTXN4C-induced calcium response.
Interestingly, knockdown of STIM2 revealed a more nuanced, regulatory role. We observed that STIM2 knockdown resulted in a slight decrease in agonist-induced ER Ca2+ release, yet paradoxically led to an enhancement of SOCE. This phenomenon can be explained by the distinct and often opposing roles of STIM1 and STIM2. STIM2 is known to form heteromultimers with STIM1 and act as a physiological “brake” on its more potent activity, helping to fine-tune the SOCE response [81,82,83]. The removal of STIM2 via knockdown likely releases this inhibition, leading to STIM1 hyperactivation, which, combined with STIM1’s compensatory overexpression (Figure 6a), amplifies SOCE, despite the reduced Ca2+ level in the ER. Furthermore, as a primary role of STIM2 is to maintain basal ER Ca2+ levels by triggering continuous, low-level SOCE, its knockdown can lower the “full” ER level because the stores are not being constantly refilled. However, this deregulation of both the stores and SOCE does not appear to play any role in the specific Ca2+ dynamics initiated by LTXN4C.

3.4. Identifying the Primary Ionic Effector: VGCCs

The characteristics of the LTXN4C-induced influx pointed directly to a channel-mediated process. When LTXN4C is added in the presence of extracellular Ca2+, it gradually activates some channels and prepares Ca2+ stores for release, leading to bursts of Ca2+ after a certain delay, variable in individual cells. When applied in the absence of extracellular Ca2+, LTXN4C pre-activates this system so that channels mediate a rapid Ca2+ influx immediately upon Ca2+e re-addition. These reactions occur with different efficiency in individual cells, producing the observed desynchronized spiking activity.
We initially considered receptor-operated calcium channels (ROCCs) as candidates. ROCCs, including the TRPC channel family, P2X receptor family and ionotropic neurotransmitter receptors, are gated directly by ligand binding or indirectly by intracellular signaling. However, LTXN4C does not bind P2X or neurotransmitter receptors [36]. Among TRPC channels, the most common neuronal ROCCs, only TRPC2 is expressed in our model, and while it is upregulated by differentiation, its level is not affected by LPHN1 expression, making it an unlikely primary effector.
Crucially, the pharmacological profile of the LTXN4C-induced influx, described here, was definitive. The Ca2+ influx was completely abolished by ω-conotoxin MVIIC, a potent blocker of P/Q-type (Cav2.1) and N-type (Cav2.2) channels, but was unaffected by nimodipine, an L-type (Cav1.2) channel blocker. Therefore, LTXN4C specifically requires neuronal VGCCs (Cav2.1/2.2) to initiate a downstream cascade that engages the cell’s own SOCE and CICR machinery.
Interestingly, we found that basal or TG-induced Ca2+ influx also involves VGCCs but has a distinct pharmacological profile, being nimodipine-sensitive and MVIIC-insensitive. The mechanism of this phenomenon likely includes membrane depolarization, the opening of Cav1.2 channels, the entry of “trigger” Ca2+, and the induction of CICR, which then leads to SOCE.

3.5. A Model for LPHN1-Mediated Activation of Neuronal VGCCs

The requirement for VGCCs in LTXN4C- or TG-induced Ca2+ influx presents some mechanistic questions:
(i) Can VGCCs function in LPH cells, which do not maintain a high membrane potential? The resting potential of differentiated NB cells (−40 to −55 mV) is sufficiently negative to prevent spontaneous VGCC activation but permissive for depolarization-induced opening. At this potential, while some P/Q and N-type channels are inactivated, a significant portion of these channels are in a closed but available state, poised to open upon depolarization. This biophysical setting is ideal for generating the oscillatory Ca2+ activity we observed.
L-type (Cav1.2) channels, the most abundant VGCCs in LPH cells, under these conditions will be primarily in a closed, but available state, because their activation threshold is near −40 mV, and they are known for their highly negative voltage-dependence of inactivation. A cell resting at −40 mV has most of its L-type channels ready to be opened by any further depolarization. These considerations suggest that both Cav1.2 and Cav2.1/2.2 will be able to contribute to Ca2+ influx upon membrane depolarization.
(ii) What is the mechanism by which LPHN1 activation leads to the opening of Cav2.1/2.2 channels, which are normally gated by membrane depolarization? We propose several non-exclusive mechanisms for how LPHN1 could activate VGCCs:
1. Receptor-induced membrane depolarization: Gαq-coupled GPCRs can depolarize the membrane by inhibiting potassium channels (e.g., M-current channels) or activating non-selective cation channels. In fact, LTXN4C has been shown to induce insulin exocytosis in pancreatic β cells by acting via LPHN1 to inhibit voltage-gated K+ channels, which was followed by Ca2+ transients [58]. However, in our current model, LTXN4C is unlikely to act via membrane depolarization, as this should have also engaged Cav1.2.
2. Channel modulation by second messengers: LPHN1 activates a Gαq/PLCβ pathway [35,56], generating DAG and IP3. The DAG–PKC axis is involved in a well-established mechanism for an indirect VGCC potentiation. For instance, Cav2.1 and Cav2.2 channels are known to be potentiated by PKC phosphorylation downstream of Gq-coupled receptor signaling and DAG generation, which reduces voltage-dependent inactivation, thereby prolonging the open state and facilitating sustained Ca2+ entry. While direct evidence for any kinase activation by LTXN4C is currently lacking, the receptor’s CTF itself undergoes activity-dependent phosphorylation/dephosphorylation, a process that modulates the CTF-NTF interaction. Specifically, LTX binding to the NTF has been shown to induce CTF dephosphorylation and its dissociation from the NTF [84]. This post-translational modification could potentially alter the CTF’s interactions with downstream signaling proteins or associated VGCCs. More generally, this finding indicates that specific kinases and phosphatases are co-localized with LPHN1 in neurons and thus are positioned to directly regulate VGCCs that may be recruited to the vicinity of the activated receptor, for instance, via the “toxin bridge” (Mechanism 3).
Furthermore, DAG itself can directly gate a subset of ion channels, notably specific TRPC channels (e.g., TRPC3, C6, C7), causing them to open and allow cation influx (including Ca2+), which can lead to membrane depolarization.
Although these second messenger and phosphorylation signaling pathways are likely engaged by LTXN4C and could contribute to its effects, they do not directly explain the toxin’s selectivity for Cav2.x and therefore warrant specific future investigation.
3. Direct protein–protein interaction (“toxin bridge”): LTXN4C could act as a physical bridge, simultaneously binding to LPHN1 and a specific subunit of a VGCC. The “toxin bridge” model provides a potential structural basis for the observed Cav2.x selectivity. In this scenario, LTXN4C’s high-affinity interaction with LPHN1 positions it to make a second, specific contact with an extracellular loop unique to Cav2.1/2.2 channels, but not Cav1.x. This selective bridging would not only localize the toxin to the correct channel but also allosterically gate it, stabilizing the channel in an open conformation and thus effectively lowering its voltage-dependent activation threshold and facilitating Ca2+ influx. For the “toxin bridge” to be feasible, LPHN1 must be localized in the plasma membrane close to VGCCs. With receptor overexpression in NB cells, such a co-localization is entirely plausible. However, targeted studies are required to explore this possibility in neurons.
4. Signalosome complex formation: LPHN1, its associated signaling proteins (like G-proteins), and VGCCs may be organized within a signaling complex, ensuring highly efficient and specific channel regulation. This model represents an evolution of mechanism 3 above. The characteristic lag phase before LTXN4C action is consistent with a signaling mechanism that may involve the gradual accumulation of a critical second messenger or the complex assembly. This priming phase ultimately sets the stage for the rapid, VGCC-dependent initiation of asynchronous SOCE/CICR oscillations upon Ca2+e re-addition. Importantly, a signaling complex could specifically recruit selected VGCCs.
It must be noted, however, that this hypothesis does not exclude, but can incorporate any of the alternative mechanisms listed above. Moreover, although the signalosome concept can explain many, if not all, of LTXN4C’s actions via LPHN1, there is currently little direct evidence for signalosome formation. Therefore, the precise mechanism by which LPHN1-mediated signaling activates VGCCs remains a subject for future investigation.

3.6. Uniform Priming and Asynchronous Ca2+ Spiking

A key intriguing finding of this work is the lack of synchronized channel opening in a system uniformly primed by LTXN4C via LPHN1. The following discussion proposes a mechanism for this phenomenon, supported by our experimental observations and existing literature.
LTXN4C–LPHN1 signaling via the Gαq–PLC pathway produces a relatively low level of IP3 [46], which binds to and primes the IP3 receptor (an ER-resident Ca2+ release channel) but does not cause it to open fully. The IP3 receptor is known to require two coincident signals—IP3 and a local Ca2+ rise—to open fully [85]. Although LTXN4C stimulates Ca2+ release from non-ER pools, the resulting [Ca2+]cyt is much smaller than that induced by TG (Figure 2 and Section 3.3) and is likely insufficient to support the opening of IP3 receptors and store depletion. Thus, in contrast to TG, LTXN4C signaling only primes the IP3 receptor and fails to activate STIM1/2 and the subsequent opening of SOCCs in the plasma membrane. Critically, however, LTXN4C also activates Cav2.x channels in the plasma membrane. Therefore, when Ca2+ is added, it does not flood the cell via SOCCs to produce the characteristic SOCE peak. Instead, Ca2+ enters via a limited number of LTXN4C-activated Cav2.x channels, as revealed by our observations. This slow, localized increase in [Ca2+]cyt creates a positive feedback loop, amplifying the Ca2+ signal until it is sufficient to gate the primed IP3 receptors and trigger massive Ca2+ release (CICR). The resulting store depletion then leads to SOCE, and the concerted action of CICR and SOCE [73,85] produces the Ca2+ spikes (Figure 3). These spikes represent an intrinsic cellular mechanism of Ca2+ signaling and homeostasis, with LTXN4C only acting as a trigger.
The fundamental explanation of the desynchronized response in cells ready for a massive Ca2+ influx lies in the probabilistic and cell-to-cell variable nature of the final triggering event. The process of LPHN1 signaling, IP3 receptor priming, and slow Ca2+ influx via VGCCs depends on several cell-specific factors, such as the level of LPHN1 expression, membrane potential, and the number and localization of VGCCs or IP3 receptors. As a result, each cell reaches the CICR threshold at a stochastically determined time, leading to asynchronous Ca2+ oscillations driven by the subsequent cell-specific CICR/SOCE interplay. This elegantly explains how a uniform priming stimulus results in the observed asynchronous sharp oscillations at the single-cell level but a gradual kinetic trace at the population level.

3.7. Limitations and Future Directions

While NB cells display many neuronal features, especially upon expression of LPHN1 and differentiation, they can only be employed as a first-approximation model in deciphering the physiological effects in nerve terminals. They do not form proper synapses, so presynaptic events are modeled over the cell body, a much larger environment with different spatial constraints. Furthermore, NB cells express a slightly altered repertoire of signaling proteins compared to neurons, and LPHN1 overexpression may lead to non-native interactions.
However, despite the anatomical and functional differences between nerve terminals and NB cells, our finding that TG indirectly affects LTXN4C-sensitive Ca2+ stores in NB cells is partially in line with the previous observation that TG inhibits LTXN4C-induced glutamate release in hippocampal neurons [56]. Moreover, LTXN4C has been shown to stimulate bursts of neurotransmitter release in motor neuron nerve terminals by acting via LPHN1 [50,86], which fits very well with the high-amplitude bursts of [Ca2+]cyt induced in NB cells expressing the full-size receptor only (Figure 3 and Figure S3). These data confirm that NB cells are a vital, accessible surrogate system that allows for genetic manipulation and reduces animal use.
Nevertheless, given the many limitations of NB cells as a neuronal model, it will be necessary to validate these findings in neurons. Among the specific questions that need to be addressed are (i) the identity of LTXN4C-sensitive Ca2+ stores and their relationship with ER, (ii) the mechanism by which LPHN1-mediated signaling activates Cav2.1/2.2, and (iii) the specific type(s) of VGCC involved.

4. Materials and Methods

4.1. Materials

All materials were from Sigma-Aldrich (Sigma-Aldrich Company Ltd., Gillingham, Dorset, UK) unless otherwise stated. The LPH and ΔLPH constructs were generated by subcloning the cDNA encoding the full-size rat LPHN1 or its NTF and the cDNA encoding a C-terminal fragment of rat neurexin Iα into the pcDNA3.1 vector, downstream of the pCMV promoter, as described earlier [87].

4.2. Cell Culture

The generation of stably transfected cell lines was described in [35]. NB cells were cultured in DMEM containing GlutaMAXTM and 10% fetal bovine serum (FBS). Stably transfected NB cell lines were always maintained in 300 μg/mL G418. Cells were allowed to grow at 37 °C and 5% CO2 to 80% confluency before passaging (every 2–3 days). For differentiation, 24 h after plating, the cells were washed with phosphate-buffered saline (PBS), and the FBS medium was replaced with SF-medium (Neurobasal-A medium containing 2% B-27 supplement, 0.5 mM GlutaMAXTM, and 1 mM dbcAMP when required). Cells were differentiated for 24–48 h and until 70–80% confluent.

4.3. RNA Extraction

Total RNA from respective cells was isolated using a High Pure RNA Isolation Kit (Roche Products Limited, Welwyn Garden City, UK). Total RNA from mouse spinal cord and the ventral horn of its lumbar segment were isolated as follows. Spinal column dissected from a 21–28-day-old mouse was purchased from Charles River Laboratories (Margate, UK). The spinal cord was ejected from the isolated sacral region of the spinal column by hydrostatic pressure exerted using a P200 pipette tip attached to a syringe filled with PBS. Whole spinal cord was homogenized in lysis buffer (E.Z.N.A. Total RNA Kit 1, Omega Bio-tek, Avantor, Inc., Lutterworth, UK) with a Potter-Elvehjem homogenizer (Sartorius, Epsom, UK) or cut into 1 mm sections using a McIlwain tissue chopper (Campden Instruments, Loughborough, UK). The sections were incubated in chilled oxygenated artificial cerebrospinal fluid (in mM: 119, NaCl; 26.2, NaHCO3; 2.5, KCl; 1, NaH2PO4; 2.5, CaCl2; 1.3, MgCl2, 10; glucose). The ventral horn was dissected from each segment and put directly into lysis buffer. Total RNA was isolated using an E.Z.N.A. Total RNA Kit 1 (Omega Bio-tek).

4.4. RT-PCR

cDNA was synthesized using 1 μg total RNA and anchored-oligo(dT) 18 primers using the Transcriptor First Strand cDNA Synthesis Kit (Roche Products Limited). Amplification of cDNA targets was performed using Taq Polymerase (Fermentas UK Limited, Cambridge, UK). The reaction mix (50 μL) included (μL): 1, cDNA (1:10 dilution); 0.25, Taq Polymerase (final concentration: 1.25 U per 50 μL reaction); 5, 10X Fermentas Reaction buffer with Mg2+ (final concentration 1.5 mM); 1, 10 mM dNTPs; 1, 10 μM forward and reverse primers; 40.75, nuclease-free water. RT-PCR reactions consisted of an initial denaturation step of 3 min 30 s at 95 °C, followed by 30 cycles comprising the following steps: 45 s at 95 °C, 45 s at 52–60 °C, and 45 s at 72 °C. Reactions were completed with a final elongation step of 5 min at 72 °C. Primers (Table 1 and Table 2) were designed using Lasergene 9.1.1 software suite (DNASTAR, Inc., Madison, WI, USA), so that the products crossed exon-exon junctions to control genomic DNA amplification. PCR products were analyzed by 2% agarose gel electrophoresis, stained with ethidium bromide, and imaged at 16-bit depth (to ensure a high dynamic range) using a G:Box gel documentation system (Syngene, Cambridge, UK). Product sizes were estimated by comparison to Generuler 50 bp DNA ladder (Thermo-Fisher Scientific—UK, Life Technologies Limited, Dartford, UK).

4.5. Quantification of mRNA Expression

qRT-PCR for relative quantification of expressed genes was performed on LightCycler 480 (Roche Products Limited) using SYBR Green I Master reaction mix (Roche Products Limited) and the specific primers described in Section 4.4. Reactions consisted of a 5 min denaturation at 95 °C, followed by 40–45 cycles including: 10 s at 95 °C, 20 s at 52–60 °C, and 10 s at 72 °C. A final elongation step included 5 min at 72 °C. Product fluorescence was measured at one point of each cycle (80 °C). A melting curve recording was performed from 65 to 97 °C (2.2 °C/s) with continuous detection. Amplification of correct products was confirmed by using the LightCycler melting temperature (Tm) analysis and by agarose gel electrophoresis. To demonstrate that only cDNA template was amplified, a no-template control (NTC) reaction was included for all targets, in which cDNA was replaced with nuclease-free water.
Raw fluorescence data was analyzed using LinRegPCR quantitative PCR data analysis program [88]. The initial amount of target cDNA (N0) in a sample (in AFU) was determined using Equation (1). For each individual reaction the baseline fluorescence was determined and then subtracted from the fluorescence curve. Then LinRegPCR calculated the PCR efficiency for each reaction. For each target group, a fluorescence threshold (Nt) was set and the mean reaction efficiency (Emean) was used to convert the number of cycles, at which a reaction passes the threshold (quantification cycle, Cq), to the initial concentration (N0). Differentiated samples were normalized to proliferating samples to determine fold-changes in mRNA levels.
N 0 = N t / E m e a n C q
Two housekeeping genes (β-actin cyclophilin-D) were used as reference genes. Expression levels of these genes consistently correlated, which indicates their suitability as reference genes. The presence of residual genomic DNA (gDNA) was assessed by qRT-PCR on all samples using 1 μL of undiluted total RNA, using primers targeting β-actin. The level of gDNA was extremely low and did not affect relative quantification.

4.6. Immunocytochemistry

Cells grown on 13 mm poly-D-lysine-coated glass coverslips were washed with ice-cold PBS (3 × 5 min), fixed with 400 μL 4% paraformaldehyde (v/v) for 10 min at room temperature, and washed with PBS (3 × 5 min). The cells were permeabilized with 0.1% (v/v) Triton X-100 for 7 min, then washed with PBS (3 × 5 min) and blocked in 5% (v/v) goat serum for 1 h at room temperature. Antibodies were diluted in 5% (v/v) goat serum. The cells were incubated with primary antibodies by placing the coverslips, cell side down, on top of 30 μL antibody solution spotted on a sheet of Parafilm™, for 1 h, washed (3 × 5 min), incubated with secondary antibodies for 1 h, and washed (3 × 5 min). The cells were then incubated with 0.3 μM DAPI for 5 min, washed (3 × 5 min), mounted onto glass slides, and sealed with nail varnish and stored at 4 °C.
For co-localization of LPHN1 fragments with lysosomes, LPH-SF cells were incubated with 100 nM LysoTracker™ Deep Red (Thermo-Fisher Scientific) for 30 min at 37 °C, then washed, fixed, permeabilized, and immunostained as described above.
The following antibodies were used: anti-V5 polyclonal rabbit IgG (1:1000 dilution) (Merck Life Science UK Limited, Gillingham, Dorset, UK); anti-myc mouse monoclonal antibodies (1:1000) (Bio-Rad Laboratories Limited, Watford, UK); anti-NF-H rabbit IgG (1:1000) (Neuromics, Minneapolis, MN, USA); anti-mouse Alexa Fluor-568-conjugated goat IgG (1:2000) and anti-rabbit Alexa Fluor-488-conjugated goat IgG (1:2000) (Molecular Probes, Thermo-Fisher Scientific).
Confocal microscopy of immunostained cells was carried out as described previously [50]. Briefly, cell preparations were imaged using a DMI8-CS laser scanning confocal microscope (Leica Mikrosysteme Vertrieb GmbH, Wetzlar, Germany) equipped with a 63×/1.4 oil immersion objective. The following configuration was used in double-staining experiments: laser excitation at 488 and 561 nm; emission filters 521 ± 31 and 608 ± 31 nm. For triple-staining, the settings also included excitation at 633 nm and emission detection at >650 nm. Images for subcellular distribution studies were obtained by scanning 1-μm-thick confocal sections near the cell’s equator. Laser power and detector gain were kept constant for all samples to allow for quantitative comparison, except when image over-exposure was required to demonstrate low levels of LPHN1 expression. Composite RGB images (1024 × 1024 pixels) were saved as TIFF files in the Leica Application Suite software LAS X 2.0.0.14332 (Leica Mikrosysteme Vertrieb GmbH, Wetzlar, Germany).

4.7. Fluorescent Ca2+cyt Recordings

4.7.1. Loading Cells with Fluo-4 AM

Cells were seeded onto 96-well clear-bottomed, black-walled plates (Agilent Technologies LDA UK Limited, Stockport, UK) at a density of 5000 cells per well, in DMEM containing GlutaMAX™ and 10% FBS, then differentiated as described above. Experiments were performed in a recording buffer (RB) consisting of (in mM): 145, NaCl; 5.6, KCl; 5.6, glucose; 1, MgCl2; 15, HEPES; 0.25, sulfinpyrazone; 0.5 mg/mL BSA 0.5 mg/mL. Cells were loaded with cell-permeant Ca2+-indicator Fluo-4 AM immediately before experiments. For this purpose, 50 μg Fluo-4 AM was dissolved in 20 μL DMSO containing 10% Pluronic F-127™ and then diluted with Neurobasal-A medium to a final concentration of 2 μM (the final concentration of Pluronic F-127™ was less than 0.01%). This solution was added to the cells and incubated for 20 min at 37 °C, protected from light. The cells were then washed twice and incubated for a further 20 min at 37 °C to allow for dye de-esterification.

4.7.2. Population-Level Ca2+cyt Fluorescence Recording with Fluo-4

Fluorescent measurements were made on a Fluoroskan Ascent FL microplate fluorometer (Labsystems Diagnostics Oy, Vantaa, Finland), using 485/538 nm excitation/emission filters and excitation beam diameter of 3 mm. Fluorescent intensity was measured every 15 s, with 100 ms integration time. The cells were maintained at 25 °C. Baseline fluorescence was measured for 180–300 s in Ca2+-free RB (stage 1). Pharmacological compounds and toxins were added to individual wells by pipette (stage 2) and RB containing Ca2+ (final concentration: 2 mM) was added by an automatic dispenser (stage 3). Maximum fluorescence was determined using 0.1% Triton X-100 to permeabilize all cells or with 1 nM αLTX, acting as a Ca2+ ionophore to permeabilize LPHN1-expressing cells only (stage 4). Initial volume in each well was 50–75 μL and compounds were added in 10–25 μL. Total volume at the end of experiment ranged from 100 to 150 μL. Experiments were usually performed in triplicates and repeated independently at least three times.
Fluorescence values F were normalized to the average baseline value (F0) and the average maximal value achieved with αLTX or Triton X-100 permeabilization (Fmax). Changes in Ca2+cyt are reported as changes in normalized fluorescence (ΔFn) (Equation (2)).
F n = F F 0 F m a x F 0
Characteristic Ca2+ dynamics were quantified as the AUC of ΔFn above the baseline for the three key phases of the experiment: Ca2+ release was measured following a stimulus application during the Ca2+-free phase. SOCE was measured above the Ca2+ influx line defined as the Ca2+ trend between the release phase and PostEq level. PostEq Ca2+ level was measured just before permeabilization.
The [Ca2+]cyt during LTXN4C-induced Ca2+ spikes was estimated using Equation (3) [89,90], where Kd is the dissociation constant of Fluo-4 for Ca2+ (770 nM at 25 °C) and Fmin is Fluo-4 fluorescence in the presence of the Ca2+ chelator EGTA (200 μM) [45]:
[ C a 2 + ] c y t = K d × F F m i n F m a x F
LPHN1-mediated Ca2+ signaling was triggered using αLTX or LTXN4C. In αLTX experiments Ca2+ release, SOCE, and PostEq were quantified as in TG experiments. LTXN4C action caused a gradual increase in Ca2+ influx, which was measured as Ca2+ influx above basal prior to the PosEq plateau. αLTX was used to obtain Fmax in receptor-expressing cells only.

4.7.3. Ca2+cyt Fluorescence Recording in Single Cells by Confocal Microscopy with Fluo-4

Cells were plated on poly-D-lysine-coated coverslips placed inside 30 mm Petri dishes or 6-well plates, differentiated, and loaded with Fluo-4 AM, as described above. The medium was then replaced with RB, and the cells were imaged using a laser-scanning upright microscope Axioplan 2 LSM510 (Zeiss UK, Cambridge, UK) equipped with a water-dipping objective (Achroplan, 40×, Zeiss UK). Two-dimensional confocal images were taken every 5 s, using 488 nm laser excitation and a 505–550 nm emission filter. Time-series images were converted into fluorescence changes over time using LSM510 software AxioVision 4.9.1 SP2 (Zeiss UK). Fluorescence was integrated within regions of interest (ROIs) drawn around individual cells or neurite varicosities. The fluorescence traces were normalized to F0 and Fmax, as described by Equation (2).

4.7.4. Ca2+cyt Recording with GCaMP

GCaMP6S was used to record from cells simultaneously transfected with more than one plasmid. LPH cells were co-transfected with the GCaMP6S plasmid and one of the shRNA plasmids, as described in Section 4.9. After 24 h, the cells were washed with PBS and differentiated in SF medium. Ca2+ recordings were performed after 72 h, using the population-level Fluo-4 protocol above, except the integration time was 300 ms. Fluorescence values were normalized, reported, and quantified according to the same method.

4.8. Plasmid-Mediated Knockdown

A set of four plasmids encoding shRNAs targeting mouse Orai2 mRNA was purchased from Dharmacon, Inc. (Waltham, MA, USA). shRNAs in the pLKO.1 lentiviral vector contained the following mature antisense sequences: TTAGACCCTTATTCATGCGGG (TRCN0000126314; sh1); ATGAGCAGAGCAAACAGATGC (TRCN0000126315; sh2); TAATCCATGCCCTTGTGGCCG (TRCN0000126317; sh3); TACCATGATGATGGTGGACAC (TRCN0000126318; sh4). The shRNA plasmids were amplified in DH5α bacterial cells and purified using QIAGEN® Plasmid Midi kit (QIAGEN Ltd., Manchester, UK) and introduced into the target cells by transfection as described in Section 4.9.

4.9. Plasmid Transfection

To evaluate Orai2 knockdown produced by each shRNA construct, LPH cells were seeded in 6-well plates at 1.5 × 10⁵ cells/well 24 h prior to transfection. Four μg of each shRNA plasmid was diluted in 400 μL DMEM containing 6 μL Turbofect (Thermo-Fisher Scientific), mixed, incubated for 20 min at room temperature, and slowly added to the cells. After 24 h, the cells were washed with PBS and differentiated in SF medium for 72 h. The cells were harvested and used to isolate RNA for quantification of the Orai2 and other SOCE mRNA levels by qRT-PCR (Section 4.3, Section 4.4 and Section 4.5).
For transient co-transfection with the shRNA and GCaMP6S plasmids, LPH cells were seeded into 96-well plates (5000 cells/well) 24 h prior to transfection. For each well, 110 ng plasmid of interest and 90 ng of the GCaMP6S plasmid were diluted in 20 μL DMEM containing 0.3 μL Turbofect (Thermo-Fisher Scientific), mixed by vortexing, incubated for 20 min at room temperature, and added to the cells dropwise. Control cells were transfected with GCaMP6S only.

4.10. Knocdown by Lentiviral Vector Transduction

SMARTvector™ Lentiviral vector encoding STIM2-targeting shRNA and RFP as a reference protein was purchased from Dharmacon, Inc. in the form of purified lentiviral particles (clone ID V3SVMM08_10955358; 100 μL; 108 transduction units/mL). Subsequent procedures were conducted in accordance with the manufacturer’s instructions. Firstly, an optimization experiment was carried out in a 96-well plate to determine the optimal lentiviral transduction conditions, including cell density, duration of exposure to reduced medium volume, and Polybrene concentration. Cells were seeded at three densities (3000, 4000, and 5000 cells/well), grown for 24 h, and exposed to a range of Polybrene concentrations (0, 2, 4, 8, 12, 16, 20, or 24 μg/mL) in reduced medium volume (50 μL of DMEM containing 10% FBS) for 6 h or 16–20 h. 24 h after incubation under this range of conditions, the medium was replaced with SF medium, and cell confluence was monitored for 24–72 h. The optimal conditions (confluence of 70–80%), achieved after a 6 h exposure to 4 μg/mL Polybrene and a starting cell density of 5000 cells/well, were used for subsequent lentiviral transduction experiments. Secondly, a range of virus/cell ratios (multiplicity of infection, MOI) was tested, and the MOI of 60 was subsequently used, consistent with the known refractoriness of neuroblastoma cells to lentiviral infection (Technical Manual, Dharmacon, Inc.).
For the knockdown experiments, LPH cells were seeded into 96-well plates at 5000 cells/well, allowed to grow in complete medium for 24 h, after which the medium was replaced with 50 μL of DMEM with 10% serum containing 4 μg/mL Polybrene and different dilutions of the lentivirus particles, and incubated for 6 h. One hundred μL of complete medium was then added, and the cells were allowed to grow for 24 h, when the medium was replaced with SF medium to induce cell differentiation. After another 48 h incubation, the lentivirus-transduced and differentiated cells were loaded with the Fluo-4 AM dye as described in Section 4.7.1 and used in Ca2+cyt measurement experiments.

4.11. Western Blotting

Western blotting was performed as described previously [35]. Briefly, LPH-SF and LPH-PC cells were washed, solubilized in 1% Triton X-100, and analyzed by SDS-electrophoresis in 10% polyacrylamide gels and Western blotting. The samples were prepared by heating for 30 min at 50 °C in a conventional SDS buffer. Separated proteins were transferred onto Immobilon®-P membrane (Merck Life Science UK Limited, Gillingham, Dorset, UK) employing a wet electro-transfer unit (Bio-Rad Laboratories Limited). Protein bands were visualized using primary antibodies (the anti-NTF rabbit serum RL1 and anti-CTF rabbit serum R4 [91]), horseradish peroxidase-conjugated anti-rabbit goat IgG (Sigma-Aldrich) as secondary antibodies, and a chemiluminescent substrate (Merck). Luminescent signals were captured with a LAS-3000 Fujifilm gel imager (Raytek Scientific Ltd., Sheffield, UK).

4.12. Image Analysis

Images of RT-PCR products separated by agarose gel electrophoresis, taken at 16-bit depth, were used for illustration purposes only, while quantitative analysis was solely based on the results of qRT-PCR (Section 4.5).
Time-series confocal images of Fluo-4 fluorescence in live cells were converted into ΔFn traces by normalization to F0 and Fmax (see Equation (2)). Fmax was obtained after permeabilizing LPH or ΔLPH cells with αLTX. Normalized traces were subsequently quantified as outlined in Section 4.7.2.
Confocal fluorescent images of fixed immunostained cells were used to quantify the subcellular distribution of LPHN1 fragments and their colocalization with lysosomes. The images were preprocessed by background removal and deconvolution and analyzed using ImageJ software (Fiji distribution, version 1.54g) (Laboratory for Optical and Computational Instrumentation, Madison, WI, USA). The preprocessed images of individual cells were then segmented into the plasma membrane and cytoplasm and masked. The NTF and CTF fluorescent signals were integrated for each segment and normalized to the total fluorescent signal.
The NTF and CTF colocalization with lysosomes was quantified by pixel intensity correlation analysis using the Coloc 2 plugin in the Fiji suite. To assess the degree of colocalization, Pearson’s correlation coefficient r and Manders’ split colocalization coefficients (M1 and M2) were used.
Images were prepared for illustrations using ImageJ (Fiji distribution). Any post-acquisition adjustments (e.g., color inversion or changes to contrast) necessary for visualization were applied across the entire image.

4.13. Data Analysis

Data were analyzed in R 3.3.0 (R Foundation for Statistical Computing, Vienna, Austria) and MS Excel (Microsoft Corporation, Redmond, WA, USA). Data are generally presented as mean ± SE of n determinations. Statistical analysis was performed in Prism 8.02 software (GraphPad Software, Boston, MA, USA). The Lilliefors test was applied to determine whether datasets followed a normal distribution. Unless otherwise stated, the two-tailed Student’s t-test was typically performed for comparisons between two groups with equal variances; otherwise, the nonparametric Mann–Whitney test was applied. One-way analysis of variance (ANOVA) with Bonferroni correction was used for three or more groups. Three-way ANOVA and Tukey–Kramer post hoc test were applied to analyze neurite outgrowth in N- and S-type cells. To determine the statistical significance of the differences between curves, an FDA [63] was performed in R 3.3.0. Its results were verified by a spreadsheet-based modified Chi-squared method for comparing arbitrary curves [92]. For graphical presentation of quantitative differences, the curves were represented by respective AUC values. The statistical significance was accepted at p < 0.05; the level of significance was indicated on graphs (*, p < 0.05; **, p < 0.01; ***, p < 0.001; #, p < 0.0001; NS, non-significant).

Supplementary Materials

The following supporting information can be downloaded at: https://www.mdpi.com/article/10.3390/ijms262211200/s1.

Author Contributions

Conceptualization, Y.A.U.; methodology, J.K.B. and Y.A.U.; formal analysis, J.K.B. and Y.A.U.; investigation, J.K.B., E.P., J.-P.S., E.F.-K. and K.E.V.; resources, Y.A.U. and D.C.; data curation, J.K.B. and Y.A.U.; writing—original draft preparation, Y.A.U.; writing—review and editing, J.K.B. and Y.A.U.; visualization, J.K.B., K.E.V. and Y.A.U.; supervision, Y.A.U. and D.C.; project administration, Y.A.U.; funding acquisition, Y.A.U. and D.C. All authors have read and agreed to the published version of the manuscript.

Funding

This research was mainly supported by a University of Kent core fund, and in part by a Wellcome Trust project grant GR074359, and by Biotechnology and Biological Science Research Council Core Support grants 28/B14085 and BB/D523078/1 to Y.A.U.; J.K.B. and E.P. were funded by University of Kent PhD studentships.

Institutional Review Board Statement

Not applicable.

Informed Consent Statement

Not applicable.

Data Availability Statement

The original contributions presented in this study are included in the article/Supplementary Material. Further inquiries can be directed to the corresponding author.

Acknowledgments

The authors are grateful to V.V. Sumbayev for help with the organization of work and B. Bonito for the kind donation of mouse brain total RNA.

Conflicts of Interest

The authors declare no conflicts of interest. The funders had no role in the design of the study; in the collection, analyses, or interpretation of data; in the writing of the manuscript; or in the decision to publish the results.

Abbreviations

The following abbreviations are used in this manuscript:
AbbreviationExplanation
[Ca2+]Ca2+ concentration
ADGRL1Adhesion G-protein-coupled receptor L-type 1
AFUArbitrary fluorescence units
AGPCRAdhesion GPCR
AMAcetoxymethyl ester
AUCArea under the curve
Ca2+cytCytosolic Ca2+
Ca2+eExtracellular Ca2+
Cavα-Subunit of a VGCC
CICRCa2+-induced Ca2+ release
CTFC-terminal fragment
DAGDiacylglycerol
dbcAMPDibutyryl cAMP
EREndoplasmic reticulum
FDAFunctional data analysis
GPCRG-protein-coupled receptor
IP3Inositol 1,4,5-trisphosphate
KDKnockdown
LPH-dbcANB cells stably expressing LPHN1 and differentiated by dbcAMP
LPHN1Latrophilin 1
LPH-PCProliferating NB cells stably transfected with LPHN1
LPH-SFNB cells stably expressing LPHN1 and differentiated by serum deprivation
MOIMultiplicity of infection
NBNeuroblastoma 2a
NRXNeurexin I
NTFN-terminal fragment
PBSPhosphate-buffered saline
PIP2Phosphatidylinositol 4,5-bisphosphate
PKCProtein kinase C
PLCPhospholipase C
PostEqPost-SOCE Ca2+cyt equilibrium
qRT-PCRQuantitative RT-PCR
RBRecording buffer
RFP(Turbo) Red fluorescent protein
RFURelative fluorescence units
ROCCReceptor-operated Ca2+ channel
ROIRegion of interest
RT-PCRReverse-transcription polymerase chain reaction
RyRRyanodine receptor, Ca2+ release channel
SARAFSOCE-associated regulatory factor
SDSSodium dodecyl sulfate
SERCASarcoplasmic/endoplasmic reticulum Ca2+-ATPase (Ca2+ pump)
SFSerum-free
shRNASmall hairpin RNA
SOCCStore-operated Ca2+ channel
SOCEStore-operated Ca2+ entry
STIMStromal interaction molecules
TGThapsigargin
TRPCTransient receptor potential canonical
VGCCVoltage-gated Ca2+ channel
αLTXα-Latrotoxin
ΔLPH-dbcANB cells stably expressing ΔLPHN and differentiated by dbcAMP
ΔLPH-PCProliferating NB cells stably transfected with ΔLPHN
ΔLPH-SFNB cells stably expressing ΔLPHN and differentiated by serum deprivation

References

  1. Katz, B.; Miledi, R. The Timing of Calcium Action during Neuromuscular Transmission. J. Physiol. 1967, 189, 535–544. [Google Scholar] [CrossRef]
  2. Llinás, R.; Steinberg, I.Z.; Walton, K. Relationship between Presynaptic Calcium Current and Postsynaptic Potential in Squid Giant Synapse. Biophys. J. 1981, 33, 323–351. [Google Scholar] [CrossRef]
  3. Stanley, E.F. The Calcium Channel and the Organization of the Presynaptic Transmitter Release Face. Trends Neurosci. 1997, 20, 404–409. [Google Scholar] [CrossRef]
  4. Neher, E.; Sakaba, T. Multiple Roles of Calcium Ions in the Regulation of Neurotransmitter Release. Neuron 2008, 59, 861–872. [Google Scholar] [CrossRef] [PubMed]
  5. Emptage, N.J.; Reid, C.A.; Fine, A. Calcium Stores in Hippocampal Synaptic Boutons Ca2+ Entry, and Spontaneous Transmitter Release. Neuron 2001, 29, 197–208. [Google Scholar] [CrossRef]
  6. Llano, I.; González, J.; Caputo, C.; Lai, F.A.; Blayney, L.M.; Tan, Y.P.; Marty, A. Presynaptic Calcium Stores Underlie Large-Amplitude Miniature IPSCs and Spontaneous Calcium Transients. Nat. Neurosci. 2000, 3, 1256–1265. [Google Scholar] [CrossRef]
  7. Narita, K.; Akita, T.; Osanai, M.; Shirasaki, T.; Kijima, H.; Kuba, K. A Ca2+-Induced Ca2+ Release Mechanism Involved in Asynchronous Exocytosis at Frog Motor Nerve Terminals. J. Gen. Physiol. 1998, 112, 593–609. [Google Scholar] [CrossRef]
  8. Simkus, C.R.L.; Stricker, C. The Contribution of Intracellular Calcium Stores to MEPSCs Recorded in Layer II Neurones of Rat Barrel Cortex. J. Physiol. 2002, 545, 521–535. [Google Scholar] [CrossRef]
  9. Hua, S.; Nohmi, M.; Kuba, K. Characteristics of Ca2+ Release Induced by Ca2+ Influx in Cultured Bullfrog Sympathetic Neurones. J. Physiol. 1993, 464, 245–272. [Google Scholar] [CrossRef] [PubMed]
  10. Smith, A.B.; Cunnane, T.C. Ryanodine-Sensitive Calcium Stores Involved in Neurotransmitter Release from Sympathetic Nerve Terminals of the Guinea-Pig. J. Physiol. 1996, 497, 657–664. [Google Scholar] [CrossRef] [PubMed]
  11. Tanabe, N.; Kijima, H. Ca2+-Dependent and -Independent Components of Transmitter Release at The Frog Neuromuscular Junction. J. Physiol. 1992, 455, 271–289. [Google Scholar] [CrossRef] [PubMed]
  12. Yamada, W.M.; Zucker, R.S. Time Course of Transmitter Release Calculated from Simulations of a Calcium Diffusion Model. Biophys. J. 1992, 61, 671–682. [Google Scholar] [CrossRef]
  13. Collin, T.; Marty, A.; Llano, I. Presynaptic Calcium Stores and Synaptic Transmission. Curr. Opin. Neurobiol. 2005, 15, 275–281. [Google Scholar] [CrossRef]
  14. Szikra, T.; Cusato, K.; Thoreson, W.B.; Barabas, P.; Bartoletti, T.M.; Krizaj, D. Depletion of Calcium Stores Regulates Calcium Influx and Signal Transmission in Rod Photoreceptors. J. Physiol. 2008, 586, 4859–4875. [Google Scholar] [CrossRef]
  15. Majewski, L.; Kuznicki, J. SOCE in Neurons: Signaling or Just Refilling? Biochim. Biophys. Acta—Mol. Cell Res. 2014, 1853, 1940–1952. [Google Scholar] [CrossRef]
  16. Garcia-Alvarez, G.; Lu, B.; Yap, K.A.F.; Wong, L.C.; Thevathasan, J.V.; Lim, L.; Ji, F.; Tan, K.W.; Mancuso, J.J.; Tang, W.; et al. STIM2 Regulates PKA-Dependent Phosphorylation and Trafficking of AMPARs. Mol. Biol. Cell 2015, 26, 1141–1159. [Google Scholar] [CrossRef] [PubMed]
  17. Prakriya, M.; Lewis, R.S. Store-Operated Calcium Channels. Physiol Rev. 2015, 95, 1383–1436. [Google Scholar] [CrossRef]
  18. Chhikara, A.; Maciąg, F.; Sorush, N.; Heine, M. Activity-Dependent Localization and Heterogeneous Dynamics of STIM1 and STIM2 at ER-PM Contacts in Hippocampal Neurons. bioRxiv 2024, 116290. [Google Scholar] [CrossRef]
  19. Chanaday, N.L.; Nosyreva, E.; Shin, O.H.; Zhang, H.; Aklan, I.; Atasoy, D.; Bezprozvanny, I.; Kavalali, E.T. Presynaptic Store-Operated Ca2+ Entry Drives Excitatory Spontaneous Neurotransmission and Augments Endoplasmic Reticulum Stress. Neuron 2021, 109, 1314–1332.e5. [Google Scholar] [CrossRef] [PubMed]
  20. González-Sánchez, P.; del Arco, A.; Esteban, J.A.; Satrústegui, J. Store-Operated Calcium Entry Is Required for MGluR-Dependent Long Term Depression in Cortical Neurons. Front. Cell. Neurosci. 2017, 11, 363. [Google Scholar] [CrossRef]
  21. Kobbersmed, J.R.L.; Grasskamp, A.T.; Jusyte, M.; Böhme, M.A.; Ditlevsen, S.; Sørensen, J.B.; Walter, A.M. Rapid Regulation of Vesicle Priming Explains Synaptic Facilitation despite Heterogeneous Vesicle:Ca2+ Channel Distances. eLife 2020, 9, e51032. [Google Scholar] [CrossRef] [PubMed]
  22. Putney, J.W. Capacitative Calcium Entry: From Concept to Molecules. Immunol. Rev. 2009, 231, 10–22. [Google Scholar] [CrossRef]
  23. Baba, A.; Yasui, T.; Fujisawa, S.; Yamada, R.X.; Yamada, M.K.; Nishiyama, N.; Matsuki, N.; Ikegaya, Y. Activity-Evoked Capacitative Ca2+ Entry: Implications in Synaptic Plasticity. J. Neurosci. 2003, 23, 7737–7741. [Google Scholar] [CrossRef] [PubMed]
  24. Yazbeck, P.; Tauseef, M.; Kruse, K.; Amin, M.R.; Sheikh, R.; Feske, S.; Komarova, Y.; Mehta, D. STIM1 Phosphorylation at Y361 Recruits Orai1 to STIM1 Puncta and Induces Ca 2+ Entry. Sci. Rep. 2017, 7, 42758. [Google Scholar] [CrossRef]
  25. Itagaki, K.; Kannan, K.B.; Hauser, C.J. Lysophosphatidic Acid Triggers Calcium Entry through a Non-Store-Operated Pathway in Human Neutrophils. J. Leukoc. Biol. 2004, 77, 181–189. [Google Scholar] [CrossRef]
  26. Hirata, N.; Yamada, S.; Yanagida, S.; Ono, A.; Yasuhiko, Y.; Nishida, M.; Kanda, Y. Lysophosphatidic Acid Promotes the Expansion of Cancer Stem Cells via TRPC3 Channels in Triple-Negative Breast Cancer. Int. J. Mol. Sci. 2022, 23, 1967. [Google Scholar] [CrossRef]
  27. Tremblay, R.G.; Sikorska, M.; Sandhu, J.K.; Lanthier, P.; Ribecco-Lutkiewicz, M.; Bani-Yaghoub, M. Differentiation of Mouse Neuro 2A Cells into Dopamine Neurons. J. Neurosci. Methods 2010, 186, 60–67. [Google Scholar] [CrossRef]
  28. Aizawa, S.; Yamamuro, Y. Possible Involvement of DNA Methylation in Hippocampal Synaptophysin Gene Expression during Postnatal Development of Mice: DNA Methylation Regulates Syp Expression. Neurochem. Int. 2020, 132, 104587. [Google Scholar] [CrossRef]
  29. Dehmelt, L.; Smart, F.M.; Ozer, R.S.; Halpain, S. The Role of Microtubule-Associated Protein 2c in the Reorganization of Microtubules and Lamellipodia during Neurite Initiation. J. Neurosci. 2003, 23, 9479–9490. [Google Scholar] [CrossRef] [PubMed]
  30. Ohmoto, M.; Shibuya, Y.; Taniguchi, S.; Nakade, T.; Nomura, M.; Ikeda-Matsuo, Y.; Daikoku, T. Protective Effects of Butein on Corticosterone-Induced Cytotoxicity in Neuro2A Cells. IBRO Rep. 2020, 8, 82–90. [Google Scholar] [CrossRef]
  31. Vigont, V.; Kolobkova, Y.; Skopin, A.; Zimina, O.; Zenin, V.; Glushankova, L.; Kaznacheyeva, E. Both Orai1 and TRPC1 Are Involved in Excessive Store-Operated Calcium Entry in Striatal Neurons Expressing Mutant Huntingtin Exon 1. Front. Physiol. 2015, 6, 337. [Google Scholar] [CrossRef]
  32. Linde, C.I.; Feng, B.; Wang, J.B.; Golovina, V.A. Histidine Triad Nucleotide-Binding Protein 1 (HINT1) Regulates Ca2+ Signaling in Mouse Fibroblasts and Neuronal Cells via Store-Operated Ca2+ Entry Pathway. Am. J. Physiol.—Cell Physiol. 2013, 304, 1098–1104. [Google Scholar] [CrossRef]
  33. Yadav, V.; Nayak, S.; Guin, S.; Mishra, A. Impact of Oxidative Stress and Neuroinflammation on Sarco/Endoplasmic Reticulum Ca2+-ATPase 2b Downregulation and Endoplasmic Reticulum Stress in Temporal Lobe Epilepsy. ACS Pharmacol. Transl. Sci. 2025, 8, 173–188. [Google Scholar] [CrossRef]
  34. Schuh, K.; Uldrijan, S.; Telkamp, M.; Röthlein, N.; Neyses, L. The Plasmamembrane Calmodulin-Dependent Calcium Pump: A Major Regulator of Nitric Oxide Synthase I. J. Cell Biol. 2001, 155, 201–205. [Google Scholar] [CrossRef]
  35. Volynski, K.E.; Silva, J.-P.P.; Lelianova, V.G.; Rahman, M.A.; Hopkins, C.; Ushkaryov, Y.A. Latrophilin Fragments Behave as Independent Proteins That Associate and Signal on Binding of LTXN4C. EMBO J. 2004, 23, 4423–4433. [Google Scholar] [CrossRef] [PubMed]
  36. Davletov, B.A.; Shamotienko, O.G.; Lelianova, V.G.; Grishin, E.V.; Ushkaryov, Y.A. Isolation and Biochemical Characterization of a Ca2+-Independent α-Latrotoxin-Binding Protein. J. Biol. Chem. 1996, 271, 23239–23245. [Google Scholar] [CrossRef] [PubMed]
  37. Ushkaryov, Y.A.; Rohou, A.; Sugita, S. α-Latrotoxin and Its Receptors. In Pharmacology of Neurotransmitter Release; Springer: Berlin/Heidelberg, Germany, 2008; pp. 171–206. [Google Scholar] [CrossRef]
  38. Silva, J.-P.J.-P.P.; Lelianova, V.G.; Ermolyuk, Y.S.; Vysokov, N.V.; Hitchen, P.G.; Berninghausen, O.; Rahman, M.A.; Zangrandi, A.; Fidalgo, S.; Tonevitsky, A.G.; et al. Latrophilin 1 and Its Endogenous Ligand Lasso/Teneurin-2 Form a High-Affinity Transsynaptic Receptor Pair with Signaling Capabilities. Proc. Natl. Acad. Sci. USA 2011, 108, 12113–12118. [Google Scholar] [CrossRef] [PubMed]
  39. Lu, Y.C.; Nazarko, O.V.; Sando III, R.; Salzman, G.S.; Li, N.S.; Sudhof, T.C.; Arac, D. Structural Basis of Latrophilin-FLRT-UNC5 Interaction in Cell Adhesion. Structure 2015, 23, 1678–1691. [Google Scholar] [CrossRef]
  40. Wang, Y.; Chen, J.; Li, S.; Cai, Z. Ginsenoside Rh3-Induced Neurotoxicity Involving the IP3R-Ca2+/NOX2/NF-κB Signaling Pathways. J. Nat. Med. 2025, 79, 791–806. [Google Scholar] [CrossRef]
  41. Li, Y.; Zheng, G.; Zhang, Y.; Yang, X.; Liu, H.; Chang, H.; Wang, X.; Zhao, J.; Wang, C.; Chen, L. MicroRNA Analysis in Mouse Neuro-2a Cells after Pseudorabies Virus Infection. J. Neurovirol. 2017, 23, 430–440. [Google Scholar] [CrossRef]
  42. Ma’ayan, A.; Jenkins, S.L.; Barash, A.; Iyengar, R. Neuro2A Differentiation by Gαi/o Pathway. Sci. Signal. 2009, 2, cm1. [Google Scholar] [CrossRef]
  43. Hossain, M.S.; Mineno, K.; Katafuchi, T. Neuronal Orphan G-Protein Coupled Receptor Proteins Mediate Plasmalogens-Induced Activation of ERK and Akt Signaling. PLoS ONE 2016, 11, e0150846. [Google Scholar] [CrossRef]
  44. Sharma, S.; Checco, J.W. Evaluating Functional Ligand-GPCR Interactions in Cell-Based Assays. Methods Cell Biol. 2021, 166, 15–42. [Google Scholar] [CrossRef] [PubMed]
  45. Blackburn, J.K.; Islam, Q.S.; Benlaouer, O.; Tonevitskaya, S.A.; Petitto, E.; Ushkaryov, Y.A. α-Latrotoxin Actions in the Absence of Extracellular Ca2+ Require Release of Stored Ca2+. Toxins 2025, 17, 73. [Google Scholar] [CrossRef] [PubMed]
  46. Ichtchenko, K.; Khvotchev, M.; Kiyatkin, N.; Simpson, L.; Sugita, S.; Südhof, T.C. α-Latrotoxin Action Probed with Recombinant Toxin: Receptors Recruit α-Latrotoxin but Do Not Transduce an Exocytotic Signal. EMBO J. 1998, 17, 6188–6199. [Google Scholar] [CrossRef]
  47. Ross, R.A.; Biedler, J.L.; Spengler, B.A. A Role for Distinct Cell Types in Determining Malignancy in Human Neuroblastoma Cell Lines and Tumors. Cancer Lett. 2003, 197, 35–39. [Google Scholar] [CrossRef]
  48. Chang, J.H.T.; Prasad, K.N. Differentiation of Mouse Neuroblastoma Cells in Vitro and in Vivo Induced by Cyclic Adenosine Monophosphate (CAMP). J. Pediatr. Surg. 1976, 11, 847–858. [Google Scholar] [CrossRef]
  49. Brown, A.M.; Riddoch, F.C.; Robson, A.; Redfern, C.P.F.; Cheek, T.R. Mechanistic and Functional Changes in Ca2+ Entry after Retinoic Acid-Induced Differentiation of Neuroblastoma Cells. Biochem. J. 2005, 388, 941–948. [Google Scholar] [CrossRef]
  50. Petitto, E.; Blackburn, J.K.; Rahman, M.A.; Ushkaryov, Y.A. The Dissociation of Latrophilin Fragments by Perfluorooctanoic Acid (PFOA) Inhibits LTXN4C-Induced Neurotransmitter Release. Toxins 2025, 17, 359. [Google Scholar] [CrossRef] [PubMed]
  51. Craney, A.; Rape, M. Dynamic Regulation of Ubiquitin-Dependent Cell Cycle Control. Curr. Opin. Cell Biol. 2013, 25, 704–710. [Google Scholar] [CrossRef]
  52. Elia, A.E.H.; Boardman, A.P.; Wang, D.C.; Huttlin, E.L.; Everley, R.A.; Dephoure, N.; Zhou, C.; Koren, I.; Gygi, S.P.; Elledge, S.J. Quantitative Proteomic Atlas of Ubiquitination and Acetylation in the DNA Damage Response. Mol. Cell 2015, 59, 867–881. [Google Scholar] [CrossRef] [PubMed]
  53. Foot, N.; Henshall, T.; Kumar, S. Ubiquitination and the Regulation of Membrane Proteins. Physiol. Rev. 2017, 97, 253–281. [Google Scholar] [CrossRef]
  54. Gilberto, S.; Peter, M. Dynamic Ubiquitin Signaling in Cell Cycle Regulation. J. Cell Biol. 2017, 216, 2259–2271. [Google Scholar] [CrossRef]
  55. Ashton, A.C.; Volynski, K.E.; Lelianova, V.G.; Orlova, E.V.; Van Renterghem, C.; Canepari, M.; Seagar, M.; Ushkaryov, Y.A. α-Latrotoxin, Acting via Two Ca2+-Dependent Pathways, Triggers Exocytosis of Two Pools of Synaptic Vesicles. J. Biol. Chem. 2001, 276, 44695–44703. [Google Scholar] [CrossRef]
  56. Capogna, M.; Volynski, K.E.; Emptage, N.J.; Ushkaryov, Y.A. The α-Latrotoxin Mutant LTXN4C Enhances Spontaneous and Evoked Transmitter Release in CA3 Pyramidal Neurons. J. Neurosci. 2003, 23, 4044–4053. [Google Scholar] [CrossRef] [PubMed]
  57. Liu, J.; Wan, Q.; Lin, X.; Zhu, H.; Volynski, K.; Ushkaryov, Y.; Xu, T. α-Latrotoxin Modulates the Secretory Machinery via Receptor-Mediated Activation of Protein Kinase C. Traffic 2005, 6, 756–765. [Google Scholar] [CrossRef]
  58. Lajus, S.; Vacher, P.; Huber, D.; Dubois, M.; Benassy, M.-N.N.; Ushkaryov, Y.; Lang, J. α-Latrotoxin Induces Exocytosis by Inhibition of Voltage-Dependent K+ Channels and by Stimulation of L-Type Ca2+ Channels via Latrophilin in Beta-Cells. J. Biol. Chem. 2006, 281, 5522–5531. [Google Scholar] [CrossRef]
  59. Lelyanova, V.G.; Thomson, D.; Ribchester, R.R.; Tonevitsky, E.A.; Ushkaryov, Y.A. Activation of α-Latrotoxin Receptors in Neuromuscular Synapses Leads to a Prolonged Splash Acetylcholine Release. Bull. Exp. Biol. Med. 2009, 147, 701–703. [Google Scholar] [CrossRef]
  60. Déak, F.; Liu, X.; Khvotchev, M.; Li, G.; Kavalali, E.T.; Sugita, S.; Sudhof, T.C. α-Latrotoxin Stimulates a Novel Pathway of Ca2+-Dependent Synaptic Exocytosis Independent of the Classical Synaptic Fusion Machinery. J. Neurosci. 2009, 29, 8639–8648. [Google Scholar] [CrossRef]
  61. Song, I.; Volynski, K.; Brenner, T.; Ushkaryov, Y.; Walker, M.; Semyanov, A. Different Transporter Systems Regulate Extracellular GABA from Vesicular and Non-Vesicular Sources. Front. Cell. Neurosci. 2013, 7, 23. [Google Scholar] [CrossRef] [PubMed]
  62. Volynski, K.E.; Capogna, M.; Ashton, A.C.; Thomson, D.; Orlova, E.V.; Manser, C.F.; Ribchester, R.R.; Ushkaryov, Y.A. Mutant α-Latrotoxin (LTXN4C) Does Not Form Pores and Causes Secretion by Receptor Stimulation. This Action Does Not Require Neurexins. J. Biol. Chem. 2003, 278, 31058–31066. [Google Scholar] [CrossRef]
  63. Ramsay, J.O.; Silverman, B.W. Functional Data Analysis, 2nd ed.; Springer Series in Statistics; Springer: New York, NY, USA, 2005. [Google Scholar] [CrossRef]
  64. Bootman, M.D.; Rietdorf, K.; Collins, T.; Walker, S.; Sanderson, M. Ca2+-Sensitive Fluorescent Dyes and Intracellular Ca2+ Imaging. Cold Spring Harb. Protoc. 2013, 8, 83–99. [Google Scholar] [CrossRef]
  65. Slack, R.; Lach, B.; Gregor, A.; Al-Mazidi, H.; Proulx, P. Retinoic Acid- and Staurosporine-Induced Bidirectional Differentiation of Human Neuroblastoma Cell Lines. Exp. Cell Res. 1992, 202, 17–27. [Google Scholar] [CrossRef]
  66. Palty, R.; Raveh, A.; Kaminsky, I.; Meller, R.; Reuveny, E. SARAF Inactivates the Store Operated Calcium Entry Machinery to Prevent Excess Calcium Refilling. Cell 2012, 149, 425–438. [Google Scholar] [CrossRef]
  67. Jha, A.; Ahuja, M.; Maléth, J.; Moreno Claudia, C.; Yuan Joseph, J.; Kim, M.S.; Muallem, S. The STIM1 CTID Domain Determines Access of SARAF to SOAR to Regulate Orai1 Channel Function. J. Cell Biol. 2013, 202, 71–78. [Google Scholar] [CrossRef]
  68. Serwach, K.; Gruszczynska-Biegala, J. Target Molecules of STIM Proteins in the Central Nervous System. Front. Mol. Neurosci. 2020, 13, 617422. [Google Scholar] [CrossRef] [PubMed]
  69. Cheng, K.T.; Ong, H.L.; Liu, X.; Ambudkar, I.S. Contribution and Regulation of TRPC Channels in Store-Operated Ca2+ Entry. Curr. Top Membr. 2013, 71, 149–179. [Google Scholar] [CrossRef] [PubMed]
  70. Ambudkar, I.S.; Ong, H.L.; Liu, X.; Bandyopadhyay, B.; Cheng, K.T. TRPC1: The Link between Functionally Distinct Store-Operated Calcium Channels. Cell Calcium 2007, 42, 213–223. [Google Scholar] [CrossRef]
  71. Gross, S.A.; Wissenbach, U.; Philipp, S.E.; Freichel, M.; Cavalié, A.; Flockerzi, V. Murine ORAI2 Splice Variants Form Functional Ca2+ Release-Activated Ca2+ (CRAC) Channels. J. Biol. Chem. 2007, 282, 19375–19384. [Google Scholar] [CrossRef] [PubMed]
  72. Rose, T.; Goltstein, P.M.; Portugues, R.; Griesbeck, O. Putting a Finishing Touch on GECIs. Front. Mol. Neurosci. 2014, 7, 88. [Google Scholar] [CrossRef]
  73. Parekh, A.B. Store-Operated CRAC Channels: Function in Health and Disease. Nat. Rev. Drug Discov. 2010, 9, 399–410. [Google Scholar] [CrossRef]
  74. Wegierski, T.; Kuznicki, J. Neuronal Calcium Signaling via Store-Operated Channels in Health and Disease. Cell Calcium 2018, 74, 102–111. [Google Scholar] [CrossRef]
  75. Bootman, M.D.; Collins, T.J.; Peppiatt, C.M.; Prothero, L.S.; MacKenzie, L.; De Smet, P.; Travers, M.; Tovey, S.C.; Seo, J.T.; Berridge, M.J.; et al. Calcium Signalling—An Overview. Semin. Cell Dev. Biol. 2001, 12, 3–10. [Google Scholar] [CrossRef]
  76. Bers, D.M. Cardiac Excitation–Contraction Coupling. Nature 2002, 415, 198–205. [Google Scholar] [CrossRef] [PubMed]
  77. Zamponi, G.W.; Striessnig, J.; Koschak, A.; Dolphin, A.C. The Physiology, Pathology, and Pharmacology of Voltage-Gated Calcium Channels and Their Future Therapeutic Potential. Pharmacol. Rev. 2015, 67, 821–870. [Google Scholar] [CrossRef]
  78. Lipscombe, D.; Helton, T.D.; Xu, W. L-Type Calcium Channels: The Low Down. J. Neurophysiol. 2004, 92, 2633–2641. [Google Scholar] [CrossRef] [PubMed]
  79. Hillyard, D.R.; Monje, V.D.; Mintz, I.M.; Bean, B.P.; Nadasdi, L.; Ramachandran, J.; Miljanich, G.; Azimi-Zoonooz, A.; McIntosh, J.M.; Cruz, L.J.; et al. A New Conus Peptide Ligand for Mammalian Presynaptic Ca2+ Channels. Neuron 1992, 9, 69–77. [Google Scholar] [CrossRef]
  80. Randall, A.; Tsien, R.W. Pharmacological Dissection of Multiple Types of Ca2+ Channel Currents in Rat Cerebellar Granule Neurons. J. Neurosci. 1995, 15, 2995–3012. [Google Scholar] [CrossRef]
  81. Hogan, P.G.; Lewis, R.S.; Rao, A. Molecular Basis of Calcium Signaling in Lymphocytes: STIM and ORAI. Annu. Rev. Immunol. 2010, 28, 491–533. [Google Scholar] [CrossRef]
  82. Soboloff, J.; Rothberg, B.S.; Madesh, M.; Gill, D.L. STIM Proteins: Dynamic Calcium Signal Transducers. Nat. Rev. Mol. Cell Biol. 2012, 13, 549–565. [Google Scholar] [CrossRef] [PubMed]
  83. Brandman, O.; Liou, J.; Park, W.S.; Meyer, T. STIM2 Is a Feedback Regulator That Stabilizes Basal Cytosolic and Endoplasmic Reticulum Ca2+ Levels. Cell 2007, 131, 1327–1339. [Google Scholar] [CrossRef] [PubMed]
  84. Rahman, M.A.; Manser, C.; Benlaouer, O.; Suckling, J.; Blackburn, J.K.; Silva, J.; Ushkaryov, Y.A. C-terminal Phosphorylation of Latrophilin-1/ADGRL1 Affects the Interaction between Its Fragments. Ann. N. Y. Acad. Sci. 2019, 1456, 122–143. [Google Scholar] [CrossRef]
  85. Berridge, M.J.; Lipp, P.; Bootman, M.D. The Versatility and Universality of Calcium Signalling. Nat. Rev. Mol. Cell Biol. 2000, 1, 11–21. [Google Scholar] [CrossRef] [PubMed]
  86. Vitobello, A.; Mazel, B.; Lelianova, V.G.; Zangrandi, A.; Petitto, E.; Suckling, J.; Salpietro, V.; Meyer, R.; Elbracht, M.; Kurth, I.; et al. ADGRL1 Haploinsufficiency Causes a Variable Spectrum of Neurodevelopmental Disorders in Humans and Alters Synaptic Activity and Behavior in a Mouse Model. Am. J. Hum. Genet. 2022, 109, 1436–1457. [Google Scholar] [CrossRef] [PubMed]
  87. Silva, J.-P.P.; Lelianova, V.; Hopkins, C.; Volynski, K.E.; Ushkaryov, Y. Functional Cross-Interaction of the Fragments Produced by the Cleavage of Distinct Adhesion G-Protein-Coupled Receptors. J. Biol. Chem. 2009, 284, 6495–6506. [Google Scholar] [CrossRef]
  88. Ruijter, J.M.; Ramakers, C.; Hoogaars, W.M.H.; Karlen, Y.; Bakker, O.; van den Hoff, M.J.B.; Moorman, A.F.M. Amplification Efficiency: Linking Baseline and Bias in the Analysis of Quantitative PCR Data. Nucleic Acids Res. 2009, 37, e45. [Google Scholar] [CrossRef]
  89. Grynkiewicz, G.; Poenie, M.; Tsien, R.Y. A New Generation of Ca2+ Indicators with Greatly Improved Fluorescence Properties. J. Biol. Chem. 1985, 260, 3450. [Google Scholar] [CrossRef] [PubMed]
  90. Maravall, M.; Mainen, Z.F.; Sabatini, B.L.; Svoboda, K. Estimating Intracellular Calcium Concentrations and Buffering without Wavelength Ratioing. Biophys. J. 2000, 78, 2655–2667. [Google Scholar] [CrossRef]
  91. Volynski, K.E.; Meunier, F.A.; Lelianova, V.G.; Dudina, E.E.; Volkova, T.M.; Rahman, M.A.; Manser, C.; Grishin, E.V.; Dolly, J.O.; Ashley, R.H.; et al. Latrophilin, Neurexin, and Their Signaling-Deficient Mutants Facilitate α-Latrotoxin Insertion into Membranes but Are Not Involved in Pore Formation. J. Biol. Chem. 2000, 275, 41175–41183. [Google Scholar] [CrossRef]
  92. Hristova, K.; Wimley, W.C. Determining the Statistical Significance of the Difference between Arbitrary Curves: A Spreadsheet Method. PLoS ONE 2023, 18, e0289619. [Google Scholar] [CrossRef]
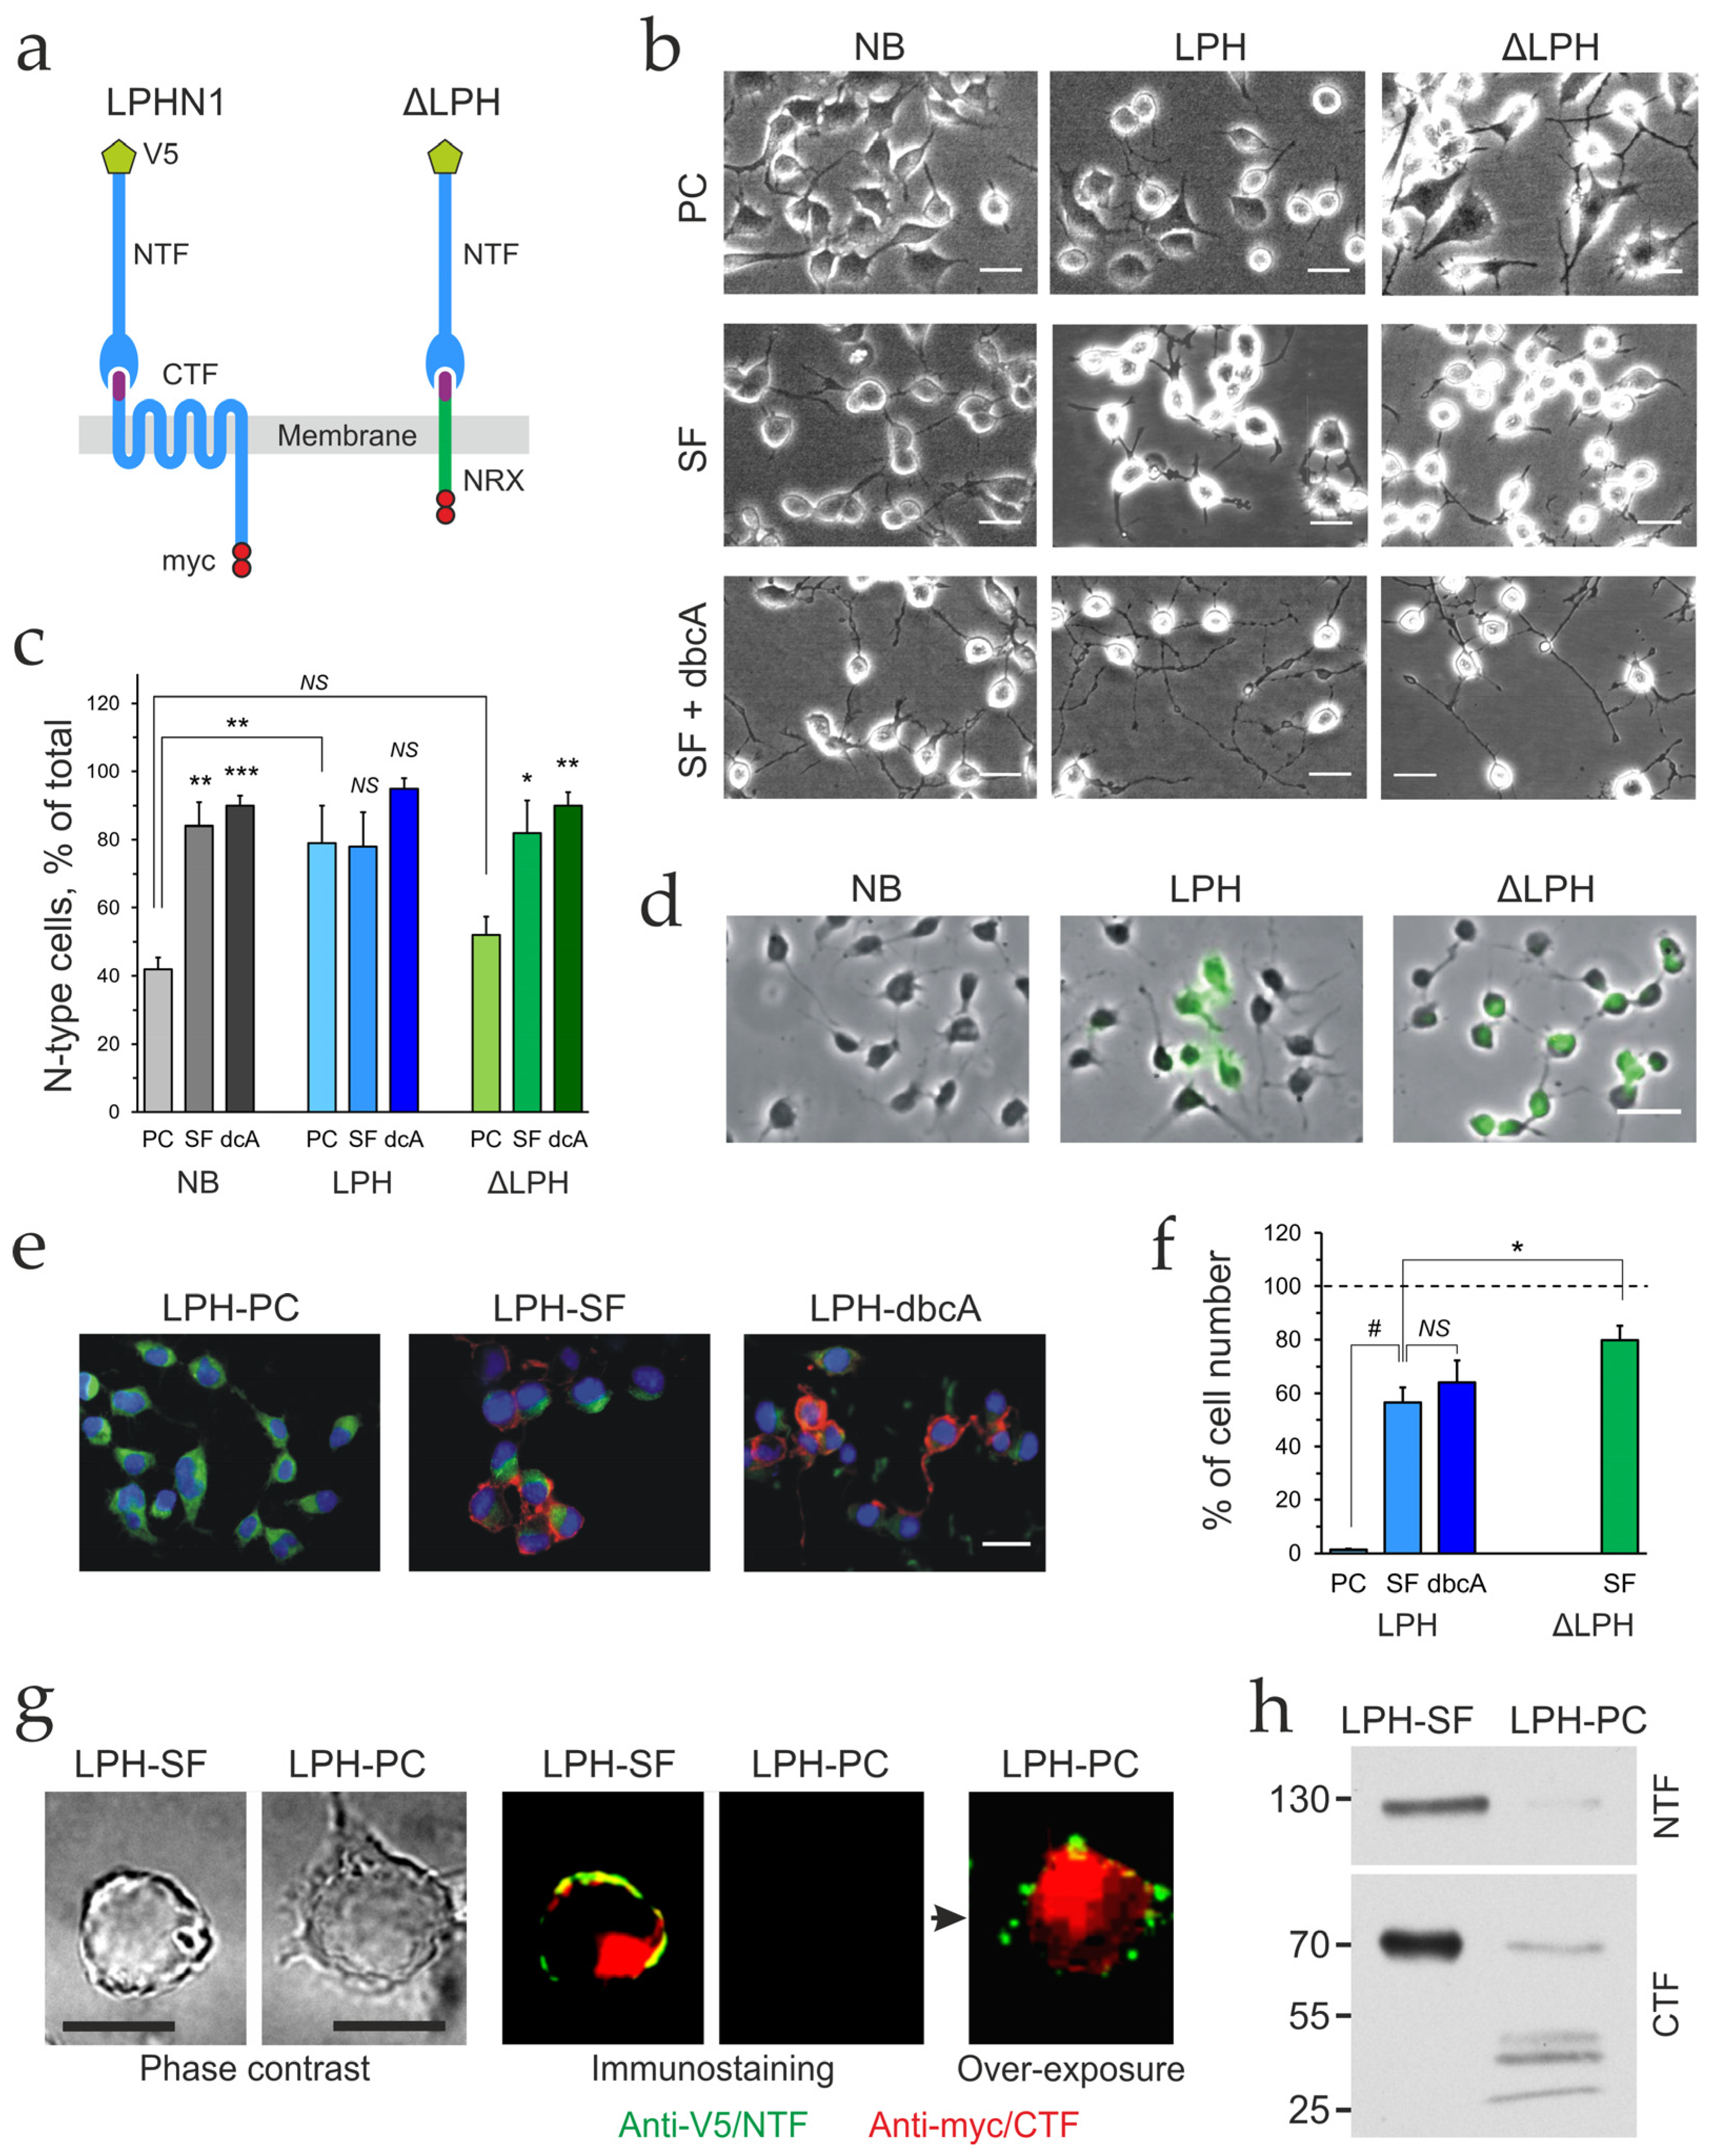
Figure 1. Changes in cell morphology and LPHN1 expression with cell differentiation. (a) Wild-type and mutant receptor constructs that were used to stably transfect NB cells. LPHN1 is self-cleaved into two fragments (NTF and CTF). The mutant construct ΔLPH, consisting of the NTF and a C-terminal segment of neurexin I (NRX), is also self-cleaved. The NTF and CTF contain immunological tags (V5 and myc) for reliable detection. (b) A shift to neuron-like morphology induced in NB, LPH, and ΔLPH cells by construct expression and differentiation. The cells were maintained in complete medium or differentiated by 48 h incubation in SF medium ± 1 mM dbcAMP (dbcA). Neuron-like (N-type) cells have compact somata and show high phase contrast (white halo). The scale bars are 30 μm. (c) Per cent of N-type cells in each culture upon differentiation under respective conditions. (d) Expression of the receptor constructs in stably transfected LPH and ΔLPH cells. NB, LPH, and ΔLPH cells were differentiated by serum deprivation for 24 h, fixed, and labeled with an anti-V5 antibody and Alexa Fluor-488-conjugated IgG (green). The scale bar is 30 μm. (e) LPH cells overexpress LPHN1 upon differentiation. LPH cells were maintained in complete medium or differentiated in SF medium ± dbcAMP, then fixed, permeabilized, and labeled with anti-myc (red) and anti-NFH (green) antibodies, and a nuclear stain, DAPI (blue). The scale bar is 30 μm. (f) Per cent of LPH and ΔLPH cells (PC, proliferating; SF, differentiated by serum deprivation; dbcA, differentiated by dbcAMP) overexpressing respective constructs. (g) Low-level LPHN1 expression in proliferating LPH cells. LPH-SF and LPH-PC cells were pretreated as in (c) and immunostained with fluorescently labeled anti-V5 (green) and anti-myc (red) antibodies. Left, phase contrast images of individual cells from respective cultures. Middle, immunostaining of the same cells with regular image exposure/enhancement. Right, over-exposure and enhancement of the middle image demonstrates that both the NTF and CTF are present in proliferating LPH cells. The scale bar is 10 μm. (h) LPHN1 degradation in proliferating LPH cells. Approximately 1 × 10⁵ LPH-SF cells and 4 × 10⁵ LPH-PC cells were analyzed by SDS-electrophoresis and Western blotting using antibodies against the NTF and CTF. Relative molecular masses in kDa are shown on the left. The graphs in (c,f), show the means ± SE; the number of experiments was n = 6 with 8–37 fields of view (N = 48–95; total number of cells per culture 213–669) (c) and n = 3 with 3–9 fields of view imaged (N = 9–15) (f). Asterisks indicate statistical significance of differences (one-way ANOVA) between the respective differentiated and proliferating cells or as indicated by lines; *, p < 0.05; **, p < 0.01; ***, p < 0.001; #, p < 0.0001; NS, non-significant.
Ijms 26 11200 g001
Figure 2. LTXN4C induces an increase in [Ca2+]cyt via LPHN1 but does not involve the TG-sensitive Ca2+ stores. LPH-SF cells were loaded with the Ca2+-sensing dye Fluo-4 AM and recorded in a multi-well fluorescent plate reader, and stimulated as shown above the traces (a,c). The dye-loading protocol, applicable to all experiments with Fluo-4, is described in detail in Section 4.7.1. Initial incubation in a nominally Ca2+-free medium was followed by the addition of LTXN4C or TG, and subsequent addition of 2 mM Ca2+. (a) Dose dependence of changes in Ca2+cyt fluorescence induced by 0–3 nM LTXN4C. (b) Quantification of the data in (a) after subtracting the basal Ca2+ fluorescence. LTXN4C causes a small increase in Ca2+cyt in the Ca2+-free buffer and a large Ca2+e influx after Ca2+ addition. Both effects are LTXN4C dose-dependent. (c) LTXN4C and TG induce Ca2+ release and influx by acting through different mechanisms. Normalized Ca2+ fluorescence changes triggered by 1 nM LTXN4C before or after treatment with 0.3 μM TG in the absence and then presence of Ca2+e. Buf, buffer (no stimulus). The main phases of TG action are also indicated by arrows: Ca2+ release, SOCE peak, and post-SOCE Ca2+cyt equilibrium (PostEq). (d) Specific (above basal) fold-changes in Ca2+ fluorescence induced by LTXN4C or TG during Treatments 1 and 2 in the Ca2+-free medium (Release 1 and Release 2), and after re-addition of Ca2+ (Influx). For illustration, ΔFn values were aggregated over time for each phase as AUCs and normalized to ΔFn in unstimulated cells (Buf → Buf). The dashed lines show the basal level (fold-change 1). (ad) The data are the means of n = 3–5 experiments ± SE (a,b) or SD (d,c). Asterisks show statistical significance of the differences between indicated conditions, tested using FANOVA (b) or one-way ANOVA (d); *, p < 0.05; **, p < 0.01; ***, p < 0.001; #, p < 0.0001; NS, non-significant.
Ijms 26 11200 g002
Figure 3. Changes in Ca2+cyt levels in individual NB, LPH, and ΔLPH cells upon stimulation with LTXN4C. The cells were loaded with the Ca2+ sensing dye Fluo-4 AM, recorded under a confocal microscope, and stimulated as indicated by bars at the top. (a,b) The cells were incubated in a Ca2+-free medium, when the background fluorescence F0 was recorded. The cells were then stimulated with 2 nM LTXN4C, supplied with 2 mM Ca2+e, and finally permeabilized with 2 nM αLTX to record the maximal Ca2+ fluorescence Fmax (arrowheads). All data were normalized to F0 and Fmax, as described in Section 4.7.2. (a) Average traces ± SE from 22 to 26 individual NB, LPH and ΔLPH cells. RFU, normalized relative fluorescence units. (b) Individual fluorescence traces ± SE from randomly selected LPH cells. The data are representative of n = 4 independent experiments with 20–30 individual cells recorded in each (N = 80–120). (ch) The LPH cells were incubated in the presence of 2 mM Ca2+e, stimulated with 2.5 nM LTXN4C, and permeabilized with 2.5 nM αLTX (arrowhead). (c) Selected time-lapse fluorescent images of a group of cells (1–4). The numbers indicate the time in seconds from the beginning of recording; the scale bar is 20 μm. (d) Fluorescence intensity profiles of individual cells and varicosities from (c). LTXN4C, Ca2+, and αLTX additions are shown by arrowheads. The colored numbers indicate corresponding cells or varicosities in (c). Note that the undifferentiated cell 4 did not respond to either toxin. (e) Selected fluorescent images of neurite 6 from (c) containing varicosities (1–3), which independently respond to LTXN4C stimulation. The scale bar is 2 μm. (f) Relative fluorescence within the individual varicosities from (e). (g) Selected fluorescent images of a varicosity (V) physically and functionally linked to cell 3 from (c). The scale bar is 4 μm; the arrow in image 2 in panel (g) indicates a Ca2+ transient in a neurite connecting the varicosity and cell; the last image in series (g) shows the same neurite traced after permeabilization with αLTX. (h) Respective relative fluorescence intensity profiles. Note that the Ca2+ signal in the varicosity precedes the signal within the cell. The experiment is a representative of n = 9 independent experiments, with 4–25 individual cells recorded (N = 36–160), which showed similar results.
Ijms 26 11200 g003
Figure 4. Expression of SOCE-associated proteins in proliferating and differentiated NB, LPH, and ΔLPH cells. (a) Agarose gel analysis of RT-PCR products obtained on cDNA prepared from mouse forebrain, the ventral horn of the lumbar segment of mouse spinal cord (SC VH), NB cells (NB), and two receptor-expressing cell lines (LPH and ΔLPH), which were proliferating (PC) in complete medium or differentiated for 48 h in SF medium (SF). The following SOCE-associated mRNAs were detected (expected band size, bp): STIM1 (296), STIM2 (256), SARAF (280), Orai1 (335), Orai2 (327), Orai3 (318), and TRPC2 (181). TRPC6 (179) was detected in LPH cells only. The arrowheads show the low levels of TRPC1, 3 and 6 in the spinal cord. An additional band found in all reactions targeting STIM1 cDNA did not affect the relative quantification of STIM1. PC: proliferating cells; SF: cells differentiated in SF medium. Numbers on the left show the sizes of selected markers in bp. The gels are representative of n = 3 experiments with 3 replicates (N = 9), which gave similar results. (bd) Relative quantification of SOCE proteins mRNA levels based on the results of qRT-PCR. (b) Fold-changes in mRNA levels induced by LPH or ΔLPH expression in proliferating cells, relative to NB cells. (c) Fold-changes in mRNA levels induced by SF-differentiation of NB cells, relative to proliferating NB cells. (d) Fold-changes in mRNA levels induced by SF-differentiation of LPH and ΔLPH cells, relative to respective proliferating cells. In (bd), the bars show the means ± SE from n = 3–4 independent experiments performed in triplicates (N = 9–12). Asterisks indicate statistical significance of differences (tested by one-way ANOVA) between proliferating LPH or ΔLPH cells and NB cells in (b), differentiated and proliferating NB cells in (c), and differentiated LPH or ΔLPH cells and respective proliferating cells in (d). Non-significant differences in (c,d) are not shown for simplicity; *, p < 0.05; **, p < 0.01; ***, p < 0.001.
Ijms 26 11200 g004
Figure 5. Knockdown of Orai2 mRNA decreases Ca2+cyt levels during the Ca2+ release and influx phases. (a) The effect of sh1 or sh2 shRNA expression on the mRNA levels of SOCE-associated proteins. LPH cells were transfected with the sh1 or sh2 plasmid, allowed to grow for 24 h, and then differentiated in SF medium for 48 h. The mRNA levels were determined using qRT-PCR and normalized to β-actin and untransfected (control) values for each mRNA. Non-significant differences are not shown for simplicity. (bd) The effect of Orai2 knockdown on stimulated changes in Ca2+cyt. To restrict Ca2+ fluorescence detection to knockdown cells, LPH cells were co-transfected with the sh2 and GCaMP6S plasmids. Subsequently, cells were grown for 24 h, differentiated in SF medium for 48 h, and stimulated (as shown by the bars above) with 0.3 μM TG (b), 1 nM αLTX (c), or 2 nM LTXN4C (d). Finally, the cells were incubated in 2 mM Ca2+e. (Left panels): Averaged traces of specific changes in Ca2+cyt fluorescence after the subtraction of basal fluorescence and normalization to baseline (Figure S5e). The dashed lines indicate 0. (Right panels): Fold-changes in aggregated specific Ca2+ fluorescence (area under the curve, AUC, above background) in Orai2-knockdown cells relative to control (untransfected) cells during the Release, SOCE, and PostEq phases. For illustration, ΔFn values were aggregated over time for each phase as AUCs. The dashed lines indicate the control level (fold-change 1). The data are the means of n = 3 experiments ± SD (a) or SE (bd). Statistical tests applied were one-way ANOVA (a) and FANOVA (bd). Asterisks denote statistical significance of the difference between knockdown and control cells for each condition; *, p < 0.05; **, p < 0.01; #, p < 0.0001; NS, non-significant.
Ijms 26 11200 g005
Figure 6. Knockdown of STIM2 mRNA downregulates Ca2+ stores but increases SOCE. (ae) LPH cells were transduced with the lentivirus encoding anti-STIM2 shRNA at MOI = 60, allowed to grow for 24 h, differentiated in SF medium for 48 h, then loaded with Fluo-4 AM, and stimulated according to the standard protocol (shown above the traces), while recording the fluorescence response. (a) The effect of lentiviral shRNA transduction on mRNA levels of the main SOCE-associated proteins. The mRNA levels were determined using qRT-PCR and normalized to β-actin and control values for each protein (knockdown/control). (be) The effect of STIM2 knockdown on changes in Ca2+cyt in response to stimulation with 1 nM αLTX or 3 nM LTXN4C. (b,d) Time-courses of specific (above background) changes in Ca2+cyt fluorescence after normalization to baseline and subtraction of basal fluorescence. The dashed lines indicate 0. (c,e) Fold-change in aggregated (AUC) specific Ca2+ fluorescence in STIM2-knockdown cells relative to control cells during the Release, Influx/SOCE, and PostEq phases. For illustration, ΔFn values were aggregated over time for each phase as AUCs. The dashed lines indicate the control level (fold-change 1). (ae) The data are the means of n = 3 experiments performed in triplicates (N = 9) ± SE. Statistical tests applied were one-way ANOVA (a) and FANOVA (c,e). Asterisks denote statistical significance of the difference between knockdown and control cells for each condition; *, p < 0.05; **, p < 0.01; #, p < 0.0001; NS, non-significant.
Ijms 26 11200 g006
Figure 7. VGCC α1-subunits expression in proliferating and differentiated NB and LPH cells. NB and LPH cells were maintained in complete medium or differentiated in SF medium for 48 h. mRNA was isolated from mouse brain and the proliferating or differentiated cell cultures, reverse transcribed, and used to amplify the fragments of respective VGCC α1-subunit by qRT-PCR employing specific primers. (a) The amplification products were analyzed by agarose gel electrophoresis. Fragments of the following sizes (in bp) were expected: Cav1.1 (334), Cav1.2 (353), Cav1.3 (337), Cav1.4 (260), Cav2.1 (253), Cav2.2 (354), Cav2.3 (376), Cav3.1 (246), Cav3.2 (230), Cav3.3 (471). PC: proliferating cells; SF: cells differentiated in SF medium. Numbers on the left show the sizes of selected markers in bp. The gels are representative of n = 3 experiments with 3 replicates (N = 9), which gave similar results. (b) Fold changes in VGCC mRNA levels induced by receptor expression in proliferating LPH cells, relative to proliferating NB cells. (c) Fold changes in VGCC mRNA levels induced by SF differentiation of NB cells, relative to proliferating NB cells. (d) Fold changes in VGCC mRNA levels induced by SF differentiation of LPH cells, relative to proliferating LPH cells. In (bd) the bars show the means ± SE from n = 3–4 independent experiments performed in triplicates (N = 9–12). Asterisks indicate statistical significance of differences between proliferating LPH and NB cells in (b), differentiated and proliferating NB cells in (c), and differentiated and proliferating LPH cells in (d). One-way ANOVA was applied to test statistics. Non-significant differences are not shown for simplicity; *, p < 0.05; **, p < 0.01.
Ijms 26 11200 g007
Figure 8. ω-Conotoxin MVIIC blocks LTXN4C-induced LPHN1-mediated SOCE/CICR. LPH-SF cells were incubated in Ca2+-free medium, exposed to 5 μM MVIIC or buffer (Control), then stimulated by 1 nM LTXN4C or treated with buffer, and finally supplied with 2 mM Ca2+e, as shown by bar above. (a) Changes in Ca2+ fluorescence under basal conditions or induced by LTXN4C in the absence (left) or presence (right) of MVIIC. The dashed lines represent zero. (b) Fold-changes in Ca2+ release (left) and Ca2+ influx (right) relative to buffer in the absence (Control) or presence of MIIC. The data are the means ± SE of n = 4 experiments (N = 12). Asterisks indicate the significance of differences (tested by FANOVA) between the connected values: *, p < 0.05; **, p < 0.01; ***, p < 0.001; NS, nonsignificant.
Ijms 26 11200 g008
Table 1. Primers used to amplify SOCE-associated mRNA and reference mRNA.
TargetPrimer SequenceSize
(bp)
Annealing T *, °C
(Forward/Reverse)OptimalUsed
STIM1 CCGCCCTAACCCCGCCCACT/CCCCCTCAATCAGCCGATGGC 296 62.1 60
STIM2 TCAGCCGGCAATGATAGCAAG/TGGAAAGCCCCAGTGGAGTTA 256 54.6 55
SARAF GCGCCTCCTCCGGGCTTTAA/TCCCTGCGCCTCCACCCA 280 61.4 60
Orai1 CGGGACGCTGCTTTTCCTA/CGGTGTTAGAGAATGGTCCCC 335 61.2 60
Orai2 CCTGTGGCCCCCAGATGTTGA/AGTACTGGCCCCCACGCAAGC 327 59.9 60
Orai3 ACAGACCGCCACAAGCAGGAG/GCAGGCGGGCCTCTTTCC 318 59.4 55
TRPC1 GAATCGCGTAACCAGCTCAGC/CTGCAGTGGGCCCAAAATAGA 225 55.2 55
TRPC2 AAGGCCGCAGCCAGAGTGTCT/AGGAGGCGCAGTGCAAAGGAT 181 58.3 60
TRPC3 GGAGGGGCCCCGGGAGTACAT/TCCGGGAGAAGCTGAGCACCA 284 59.8 60
TRPC4 TTTGTTGGGGCCACCATGTTT/CGCCCAATTGTCCCGAAGC 299 55.5 55
TRPC5 AAAACAAATGAGGGGCTAACA/CTTGGGCGCCACTAGCTCTTG 280 54.4 55
TRPC6 CTCAAGGCCCCAAAGAATACT/GTCCCCCAGTGTGACTTTTGT 179 51.8 55
TRPC7 GGCCGCGGGAGTACGTGCTA/CAACCGCAATGGCGTACAGCC 261 60.3 60
β-actin TTCGCGGGCGACGATGC/GGGGCCACACGCAGCTCATT 233 60.2 60
Cycl. ** TAAGCATGATCGGGAGGGTT/CGTCCAGATGAGGAGTCGGAA 101 52.9 55
* T, temperature. ** Cycl., cyclophilin D.
Table 2. Primers used to amplify VGCC α1-subunit mRNA.
TargetPrimer SequenceSize
(bp)
Annealing T *, °C
(Forward/Reverse)OptimalUsed
Cav1.1 ACGCCAATGCCAATGTT/ACGTGCTCCTCAAAGTTCC 334 56.4 56
Cav1.2 CAGACCCCTACGGCCCATCCCTACCCTA/TGTCTGCGGCGTTCTCCATCTCCTCTATTG 353 64.0 63
Cav1.3 CGCGCTGCCCTGCCCCTG/CACTCCTCTGCTTGTCGCTGTTCTTGTTC 337 62.0 61
Cav1.4 ACCATGTGCCACGCCGACG/GCCGCCAAGTTTGCCAAGGTATCC 260 61.1 61
Cav2.1 CAAAGCCCGGCGACTGGATGACTACTC/GTGGTGGTGGTGGTGTGGCCGATGCTTCC 253 63.4 63
Cav2.2 GACCCCACGCCCCAGCATCACCTACAAGA/CCATTGGGTACACGGCGGAGA 354 61.7 61
Cav2.3 GCCACCAAAGCCTCGTCCCCTCCTCTCC/CCTCCGCCGCCGATAGTGCCCGTTAG 376 65.2 63
Cav3.1 GGCGCCATCCCTAAACTACC/CAGGCGGATGTGCTTGGAGACTTT 246 60.5 61
Cav3.2 CCCGGCCGATGAGGAGGTC/GGCCATCCCCATTATCCAGTTCC 230 61.5 61
Cav3.3 GGGGGCCATTCCATTCAACC/GCCCGCAGCCCACGCAGACTA 471 62.4 63
* T, temperature.
Disclaimer/Publisher’s Note: The statements, opinions and data contained in all publications are solely those of the individual author(s) and contributor(s) and not of MDPI and/or the editor(s). MDPI and/or the editor(s) disclaim responsibility for any injury to people or property resulting from any ideas, methods, instructions or products referred to in the content.