Article

Molecular Interaction of Genes Related to Anthocyanin, Lipid and Wax Biosynthesis in Apple Red-Fleshed Fruits

by
Sylwia Elżbieta Keller-Przybyłkowicz
1,*,
Michał Oskiera
2,
Agnieszka Walencik
1 and
Mariusz Lewandowski
1
1
Department of Horticultural Crop Breeding, The National Institute of Horticultural Research, Konstytucji 3 Maja 1/3, 96-100 Skierniewice, Poland
2
Department of Microbiology and Rhizosphere, The National Institute of Horticultural Research, Konstytucji 3-go Maja 1/3, 96-100 Skierniewice, Poland
*
Author to whom correspondence should be addressed.
Int. J. Mol. Sci. 2025, 26(22), 10987; https://doi.org/10.3390/ijms262210987
Submission received: 13 October 2025 / Revised: 7 November 2025 / Accepted: 10 November 2025 / Published: 13 November 2025
(This article belongs to the Section Molecular Plant Sciences)

Abstract

Transcriptomic analysis of fruit flesh of the cultivars ‘Trinity’ (red-fleshed) and ‘Free Redstar’ (white-fleshed) uncovered a set of ten genes involved in different metabolic pathways. Three—N3Dioxy, LAR1 and F3Mo—were mapped via phenylpropanoid and flavonoid biosynthesis (mdm00940, mdm00941); four—AlcFARed, CER1, Cyp86A4 and PalmTransf—were mapped on the cutin, suberine and wax biosynthesis pathways (mdm00073); and three—TropRed, CyP865B1 and CytP450—were mapped via the tropane/piperidine/pyridine alkaloid biosynthesis pathway and the peroxisome pathway (KEGG:mdm00960, KEGG:mdm04146). Our study highlighted the higher activity of AlcFARed, CER1, PalmTransf and CYP86A4 in red-fleshed apple fruits and allowed us to discover a specific relationship between significant reductions in fruit wax coating and anthocyanin enrichment in fruit flesh. In addition, the uncovered inhibition of the TropRed gene and the activation of both Cyp865B1 and CYP86A4 suggests that both compounds generate primary alcohols and alkanes, ultimately bound to wax formation. Our results postulate that the fatty acid degradation process is initiated in the flesh of apple fruits and depends on the relationship between anthocyanin content and lipid and wax metabolism. These findings further our understanding of the molecular mechanism linking anthocyanin and wax, making it significantly important in the context of apple fruit storage stability.

1. Introduction

Apples are one of the most important fruit crops worldwide. Global annual apple production has reached over 80 million tons, and about 45% of production occurs in China, followed by Turkey and the USA [1]. The massive supply of this fruit to the market and its management raises challenges in terms of cultivation and storage. One way to address this situation involves increasing the consumption of fresh apples and their products (such as juices, chips and ciders), which can be achieved by introducing red-fleshed varieties into the apple industry [2].
In apples, selective breeding for red-fleshed fruit can be traced back to the 17th century discovery of Malus pumila var. niedzwetzkyana in forests in Turkestan, leading to development of red-fleshed cultivars with enhanced nutritional benefits [3,4,5,6,7,8].
One of the major health benefits of red-fleshed fruits is the presence of anthocyanins and other plant secondary metabolites, such as flavonoids, terpenoids, long-chain fatty acids and alkaloids. These elements have a huge impact on the development of apples and their physiological parameters and quality. They play an important role in coordinating the interactions between plants and the environment, as well as being involved in plant tissue protection [9,10,11,12].
Given anthocyanins’ health-promoting properties and increasing consumer demand for functional foods, apple breeding programs worldwide have intensified efforts to develop red-fleshed fruit varieties across multiple crops, including sweet orange, peach and kiwi [13,14]. Changes in breeding objectives, with a shift in desired apple characteristics from ornamental and processing features to functional fruit traits and fresh products, led to the cultivation of a series of red-fleshed apple cultivars, such as ‘jpp35’, ‘Weirouge’, ‘Baya Marisa’, ‘Redlove’ and ‘Meihong’ [15,16,17,18,19,20,21].
The anthocyanin biosynthesis pathway and the pigmentation of different tissues seems to be universal in the Plant Kingdom, having been clearly described for many species, such as strawberry [22], peach [23], blueberry, pomelo, citrus [24], tomato [25], Ginkgo biloba [26], etc. The precursors of and structural genes influencing anthocyanin biosynthesis such as phenlylalanine lyase (PAL), as well as chalcone synthase, isomerase (CHS, CHI), falvonon 3-hydroxylase (F3H), dihydroflavonol 4-reductase (DFR), anthocyanidin synthase (ANS) and UDP:flavonoid 3-O-glycosyltransferase (UFGT), have been clearly described [27].
Further investigation of the genetic control of pigmentation patterns in apple fruits underlined that the genetic basis of red-fleshed apple fruits is mainly related to the combination of the alleles of the MdMYB1 and mdMYB10 transcription factors [3,28,29,30].
Similar research uncovered other transcription factors (TFs) involved in anthocyanin pathway regulation, such as NAC, Ja2 and MADS [2,31,32]. TFs carrying structurally conserved DNA-binding domains, consisting of two repeats of R2R3, are strongly associated with anthocyanin biosynthesis. Further studies have also confirmed the dependence of specific MYBs on binding coregulatory proteins such as bHLH and WD40, forming the specific domain complexes required to activate the transcription of anthocyanidin structural genes, acting either early—EABG (PAL, C4H, 4CL, CHS, CHI and F3H)—or late—LABG (DFR, ANS and UFGT)—in the biosynthesis pathway [28,33,34,35,36].
External environmental factors, including light and temperature, as well as internal environmental factors, such as sugar content and fatty acids, substantially affect anthocyanin biosynthesis, determining color development in both apple fruit skin and flesh [3,37,38].
Generally, sugars are important precursors in anthocyanin production, serving as signaling substances that can induce the cytoplasmic biosynthesis of this element [39,40]. They promote the glycosylation of unstable anthocyanidins by transforming UDP-Glc:flavonoid-3-O-glucosyltransferase (UFGT) to stable colorful (pink to purple in color) anthocyanins [41,42,43]. In Arabidopsis, sucrose and sucrose transporters (known as SUCs) can regulate the production of anthocyanin pigment factors (PAP), followed by the expression of the DFR (dihydroflavonol-4 reductase) structural gene, and finally induce anthocyanin synthesis and promote its accumulation [44,45,46,47,48]. It has also been observed that sucrose can activate MdHXK1 gene-encoding hexokinase, which phosphorylates the MdbHLH3 transcription factor and mediates apple fruit coloration [49].
Despite efforts in apple breeding, red-fleshed varieties remain commercially limited due to the unfavorable acid–sugar balance and concerns about storage stability [50]. Regarding this issue, it must be underlined that the most important factors impacting apple fruit attractiveness are the intensity and composition of the cuticle (the waxy layer of the fruit’s skin).
The relationship between flavonoids and cutin formation was first described in tomato fruits by Heredia and coworkers [25]. They explained that some flavonoids are accumulated in cell vacuoles, and others are de novo synthesized and incorporated into the cuticle [25]. This indicates that the accumulation of anthocyanins results in reduced cutin formation, decreasing an apple’s potential shelf life [51].
Recent studies of the fruit skin of “Golden Delicious” (white-skinned fruits) and “Red Delicious” (dark red-skinned fruits) revealed varying levels of hydrolyzed cutin molecules and different compositions of aliphatic hydrocarbons, resulting in significant reductions in polysaccharides and phenolic compounds in red-skinned varieties [52]. This suggests a potential molecular link between pigmentation and fruit storage characteristics that remains poorly understood.
Very-long-chain fatty acids (VLCFAs) are pivotal in apple skin cuticle formation. In their biosynthesis, external metabolic pathways such as the tricarboxylic acid cycle (TCA) and glycolysis, which regulate carbon and acetyl CoA production, providing adequate precursors for fatty acid elongation, are employed [53,54,55,56,57,58]. Additionally, the cell wall invertase (CWI) gene plays a significant role in cuticle development, deposition and composition. Generally, CWI cleaves sucrose, irreversibly yielding glucose and fructose, which can be tracked via the hexose transporter. These hexose sugars are then taken up by plant cells via hexose transporters and may also act as signaling molecules in anthocyanin biosynthesis [59,60,61].
Recent research has confirmed the role of an additional mechanism in anthocyanin accumulation related to the transportation of primary synthesized anthocyanins from the pericarp to the cell vacuole, where they accumulate and generate the final fruit flesh color. Glutathione S-transferases (GSTs) [62,63], ATP-binding cassette (ABC-transporters) [64] and toxic compound extrusion metallothionein-transporters [65] seem to represent the key enzymes driving in this mechanism [66].
Since the fruit flesh color trait is very complex, current genetic models still inadequately explain the observed variations in apple flesh pigmentation intensity and its relationship with the fatty acid and wax biosynthesis pathways. This knowledge gap limits both breeding efficiency and our understanding of factors affecting fruit quality and shelf life.
In our study, we have uncovered new genes involved in alkaloid and general fatty acid biosynthesis, probably contributing to the final fruit wax coating process. Their expression profiles were validated in the fruit flesh of selected hybrid genotypes, derived from ‘Free Redstar’ and ‘Trinity’ crosspollination, which differ in fruit flesh coloration (white and red, respectively). This research may clarify the complexity of the anthocyanin accumulation and degradation processes, confirming the relatedness of anthocyanin formation and final cuticle disintegration in red-fleshed apple fruits.

2. Results

2.1. Significant Differences in Apple Genotypes with Regard to Total Anthocyanin Content

Measuring the spectral absorbance level in fruit juice with regard to pH points 1 and 4.5 allowed us to verify the phenotypical variance between fruits for the analyzed apple genotypes. The calculated average total anthocyanin content ranged from 9482 mg/100 mL (in ‘Free Redstar’, control) to 321 mg/100 mL (in genotype no. 48) (Table 1). The most informative and variable significance between evaluated samples is presented in Figure 1.
The calculated R square index (0.9920) explained the high variation between the individual apple genotypes tested. In addition, no significant (ns) correlation of variance between ‘Trinity’ and hybrid genotype number 154 was calculated (Table 2). As expected, the highest accumulation of anthocyanins was observed in seedling number 48, corresponding to its dark red fruit coloration of its flesh. Simultaneously, total anthocyanin content decreased when bright (pink, yellow to white) fruit flesh was present.
A summary of the statistical relationships, representing the correlation matrix between each of analyzed fruit samples, is presented in Table 2.
The data show that plant material significantly varies depending on the trait of interest and is properly characterized for validating the genetic backgrounds of newly uncovered differentially expressed genes. Furthermore, the individual fruit flesh samples from the above-selected genotypes were used for molecular analysis.

2.2. Comparative Analysis of Red and White Fruit Flesh Transcriptomes

Based on the RNA-seq experiment performed for ripe fruits of red-fleshed ‘Trinity’ and white-fleshed ‘Free Redstar’, we determined the difference between the transcript activities of candidate genes.
Four cDNA libraries were constructed and an average of 26,237,181 paired reads were obtained with the effective data volume for each sample, increasing to approximately 41,723,064 for ‘Free Redstar’ and 34,514,117 for ‘Trinity’. Clean reads were mapped on the apple reference genome (at a similar ratio,), with an average of approximately 89.7% unique mapping reads identified with proper pairing, giving a total of 54,299,271 mapped sequences (Supplementary Table S1).
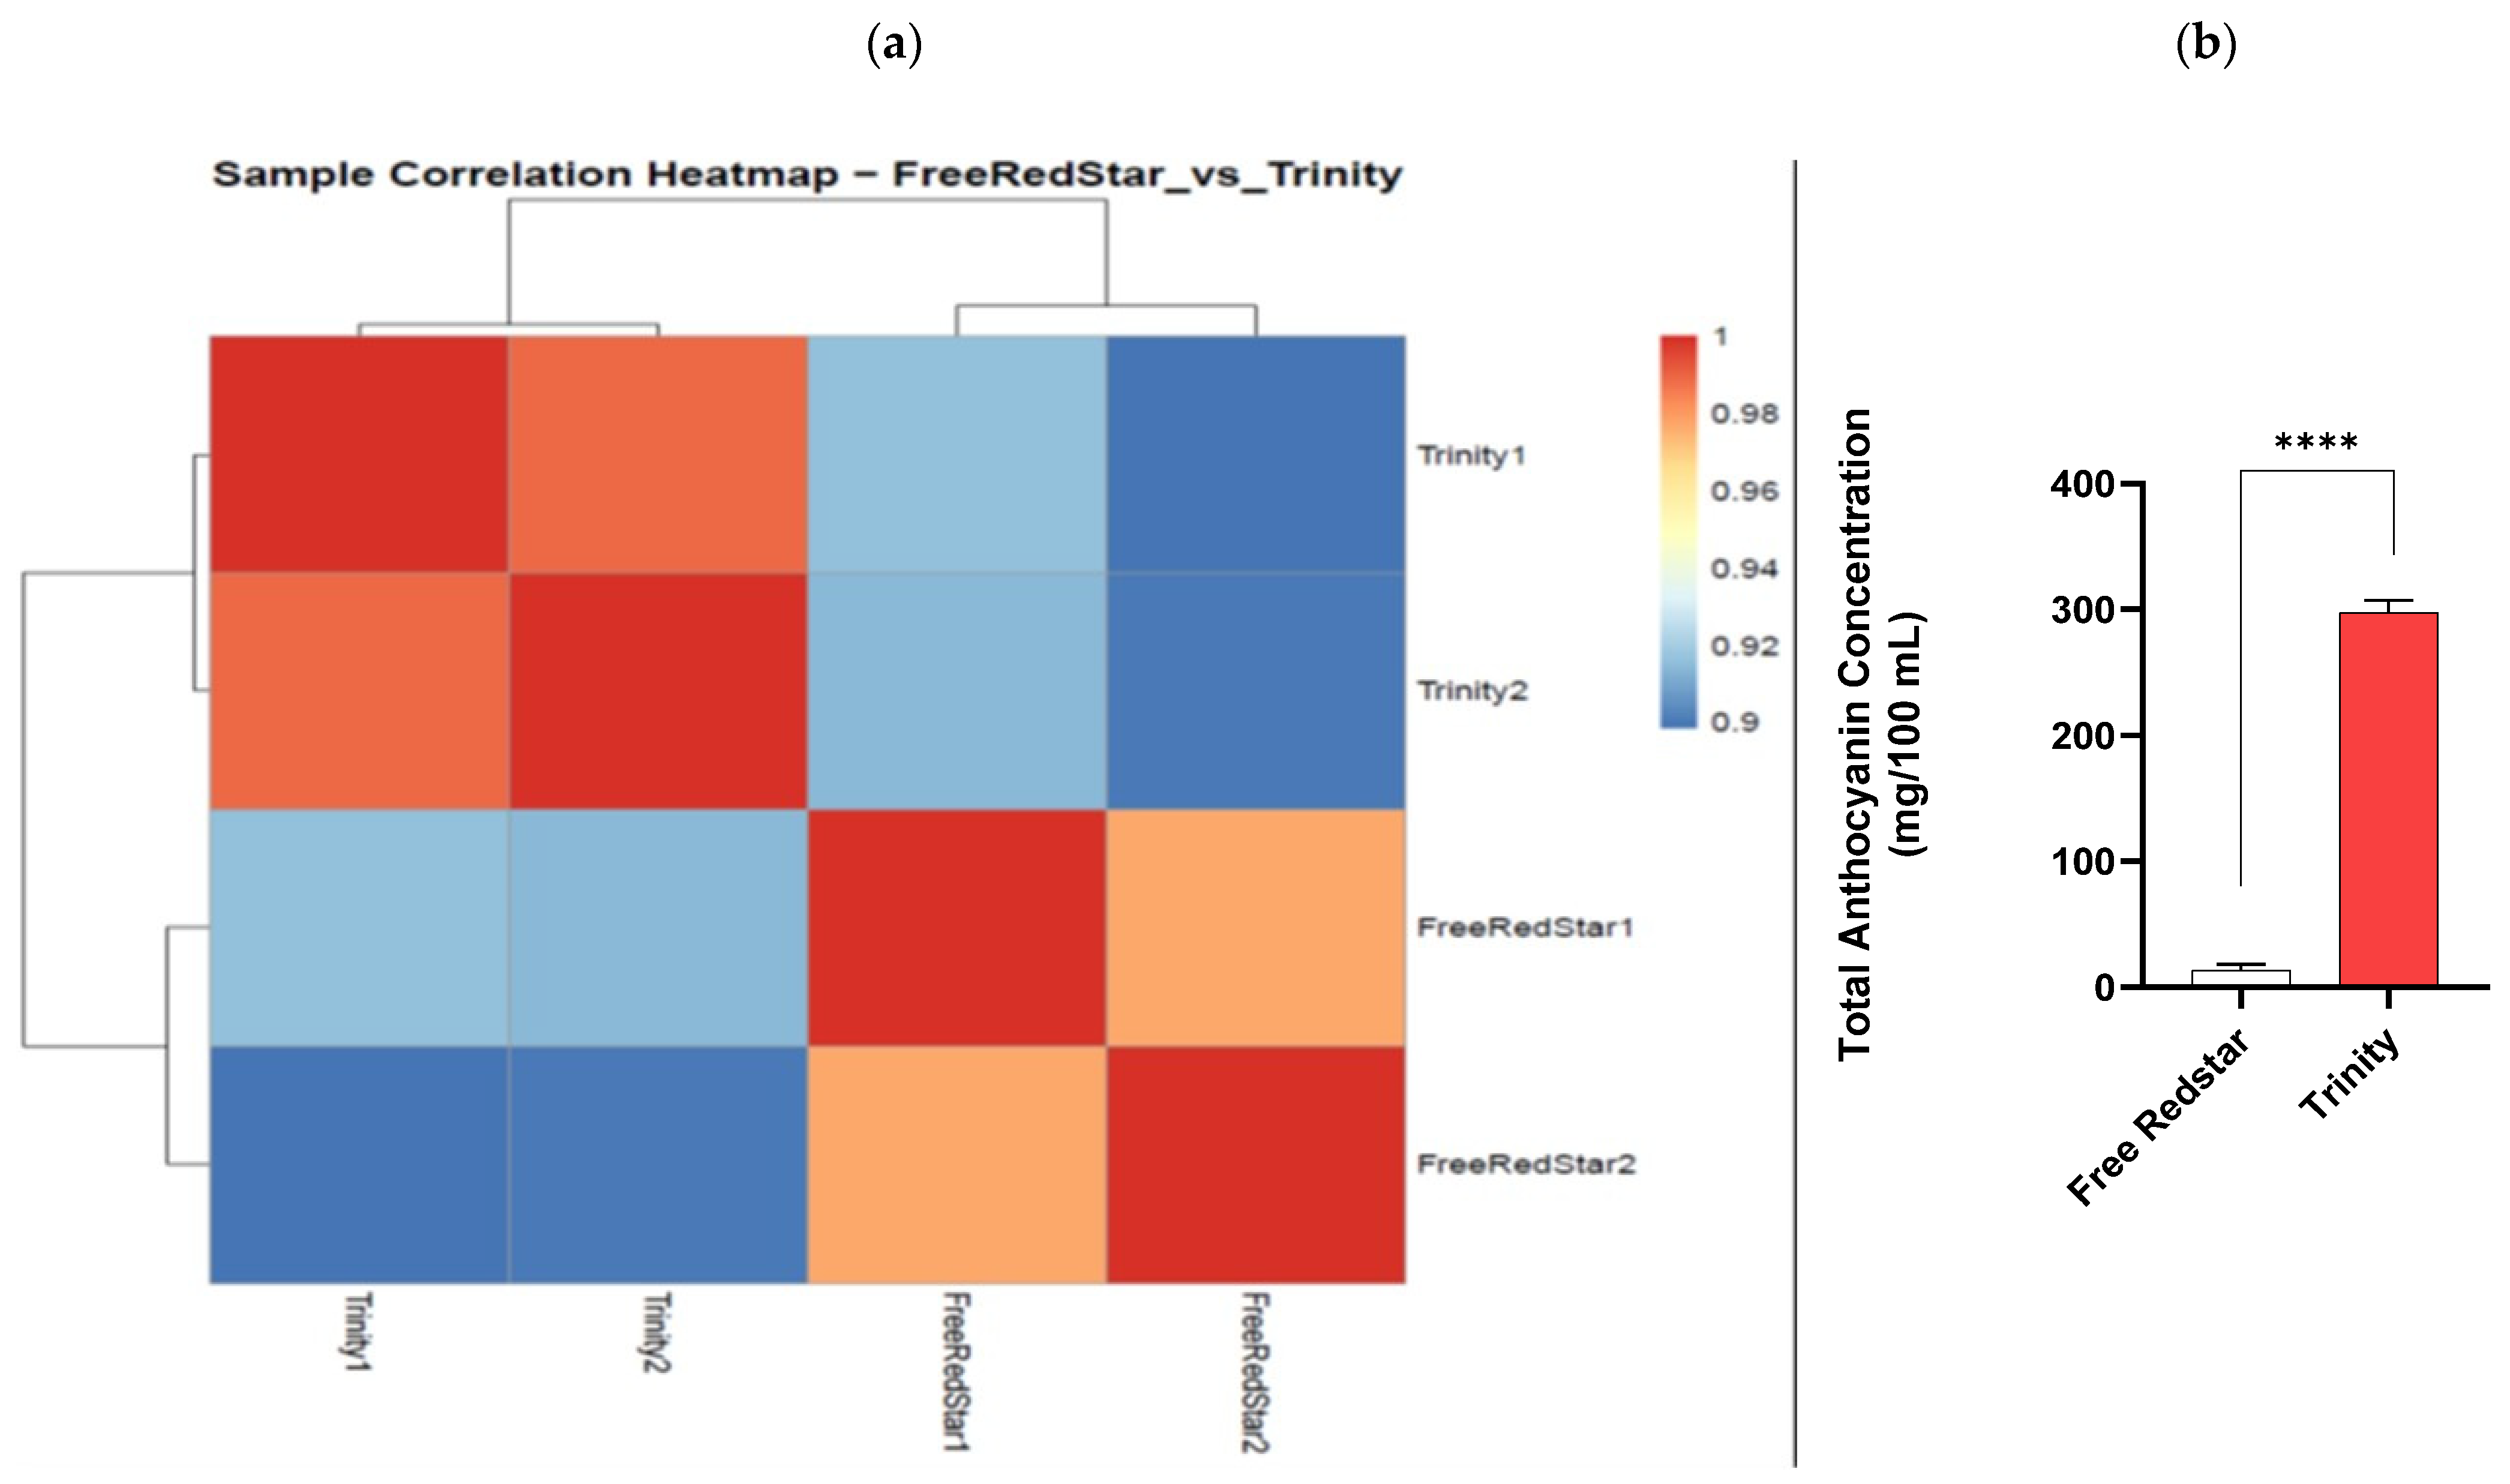
Sample-to-sample cluster heat map analysis of expression profiles, as well as the total anthocyanin concentrations in the fruit flesh ‘Free Redstar’ and ‘Trinity’, indicated that the results were consistent, and the investigated cultivars samples were clearly grouped distinctly (Pearson correlation coefficient ratio: 0.8–0.9) (Figure 2a,b).

2.3. Identification of Functional Categories of DEGs

A comparative analysis of the RNAseq layouts of ‘Trinity’ and ‘Free Redstar’ allowed us to extract differentially expressed genes (DEGs) annotated with the Malus genome. The FPKM method was used to indicate the number of fragments per kilo base length of a protein-coding gene per million sequenced fragments.
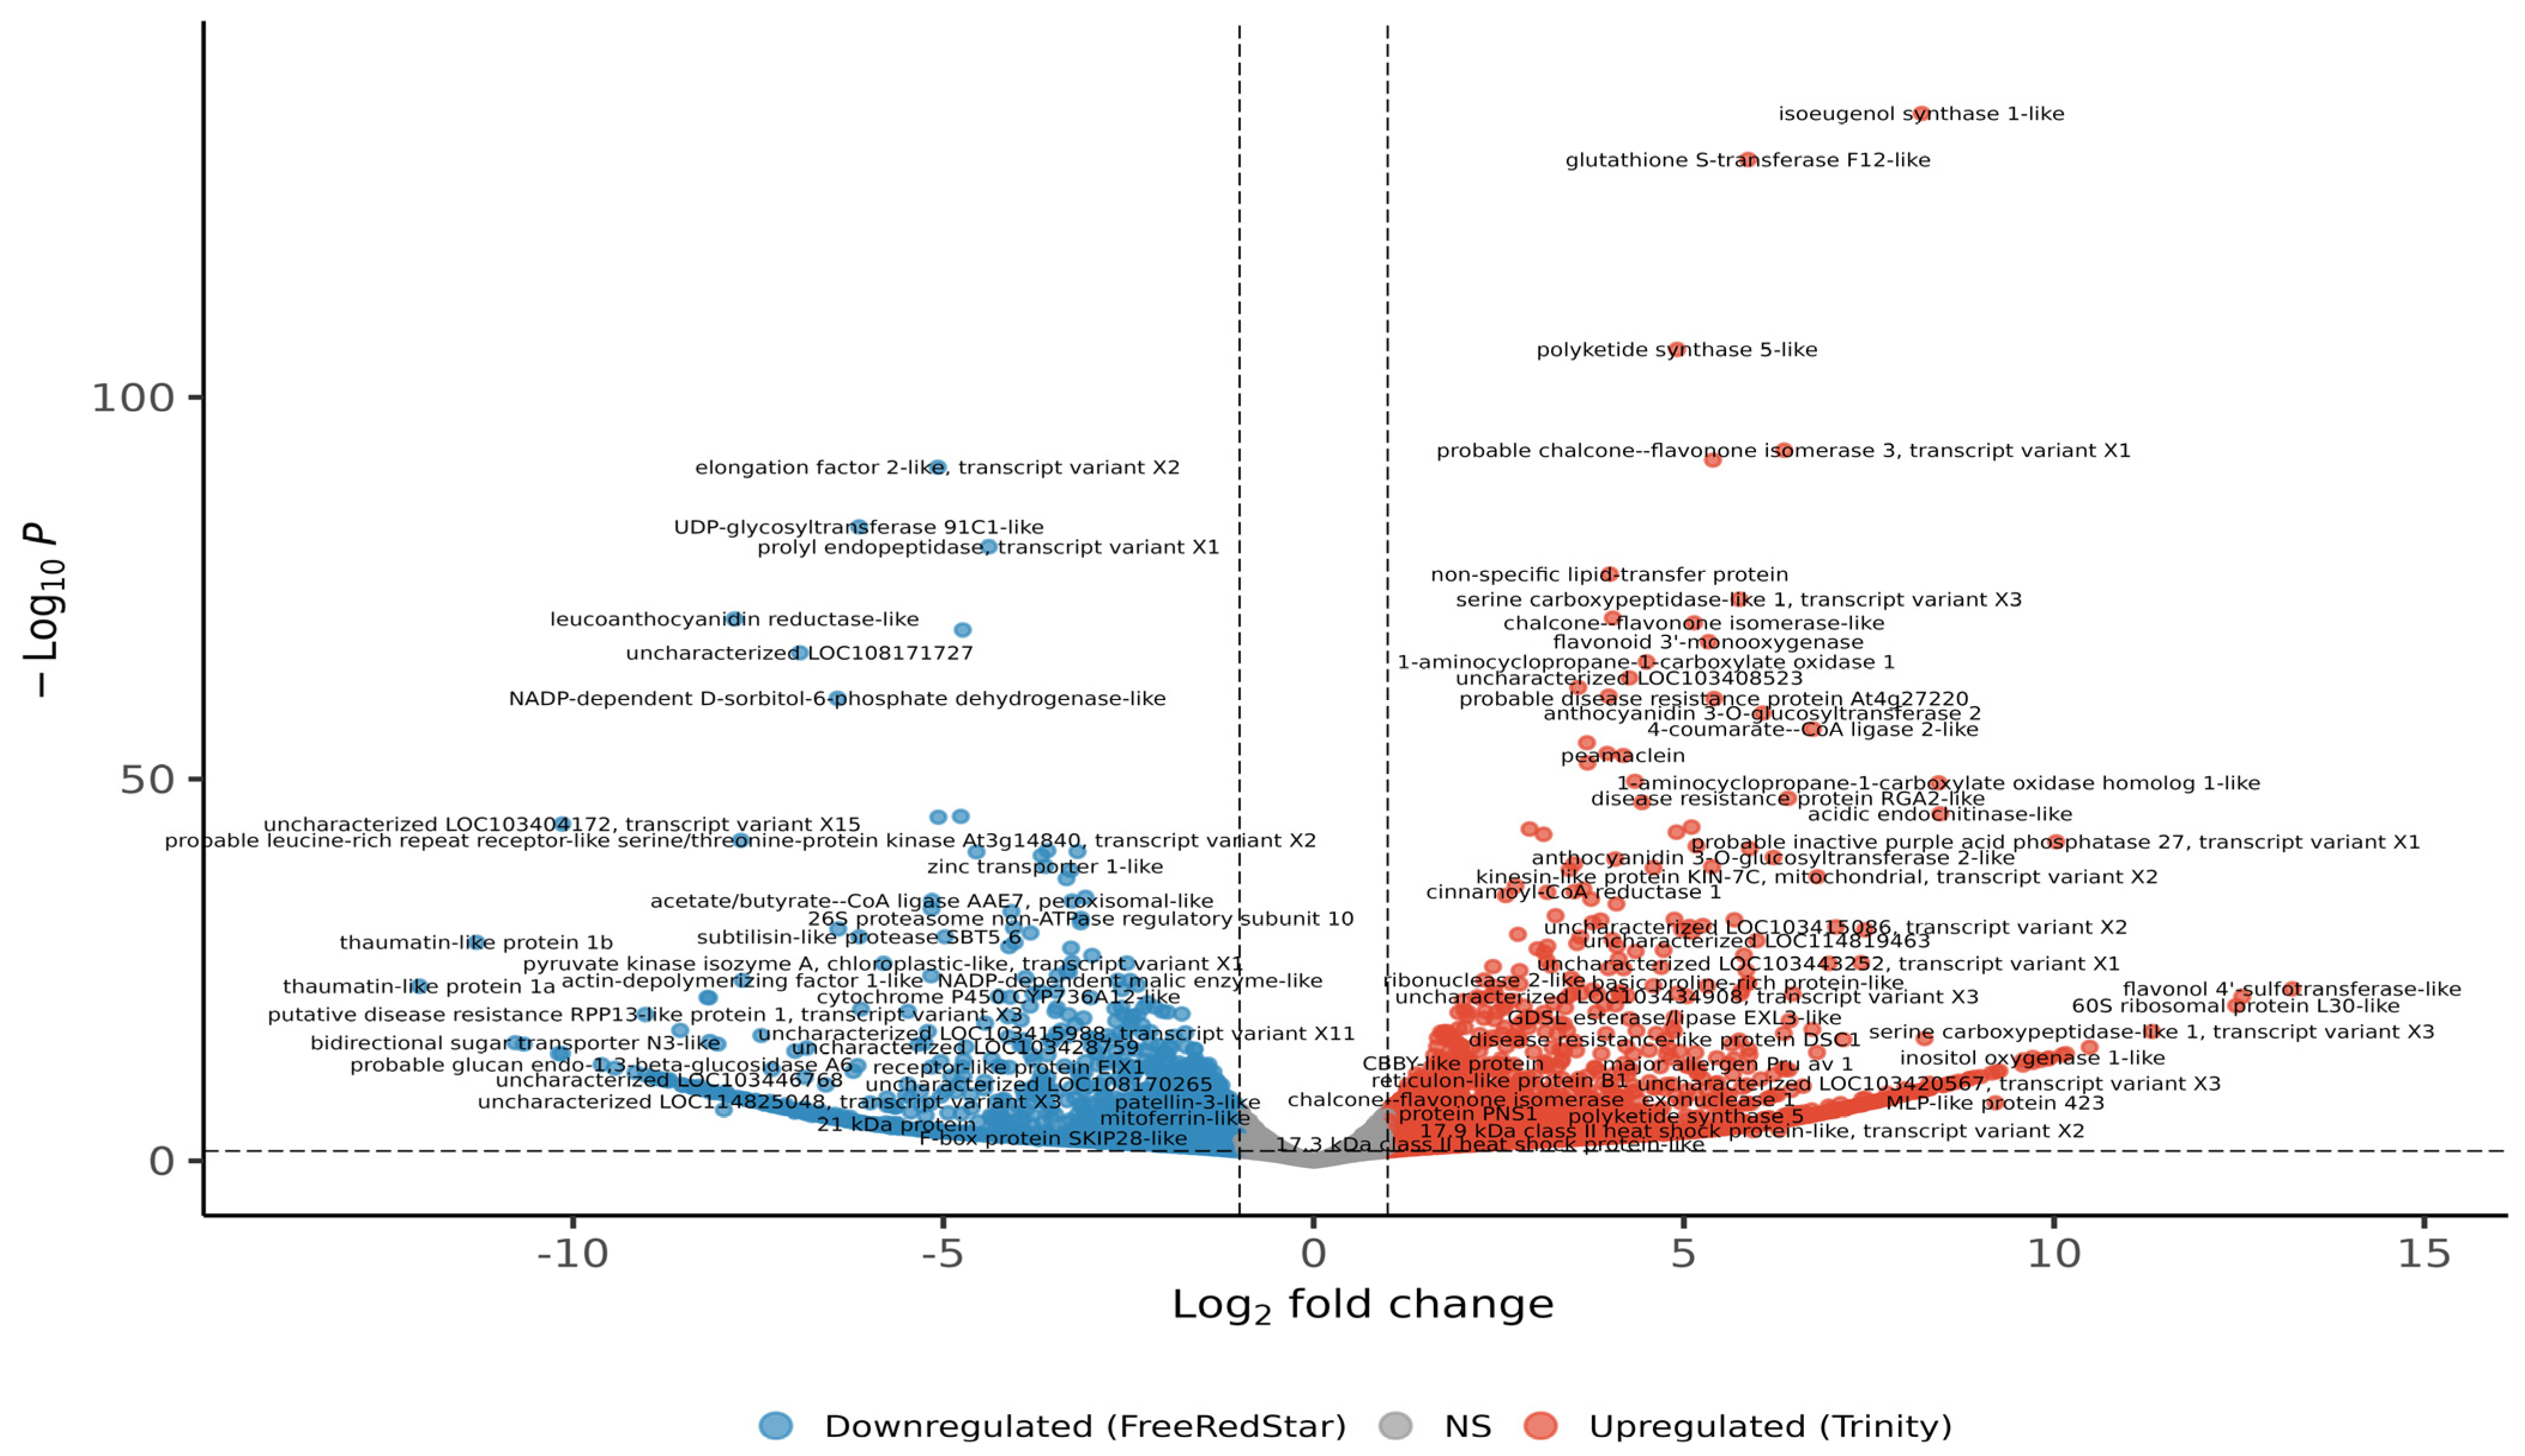
Out of the 28,308 genes quantified (Supplementary Table S2), 7065 (25%) showed differential expression at p < 0.05, including 4866 (17.2%) at p < 0.01 and 3117 (11.0%) at p < 0.001. Among these, 1153 genes were up-regulated (FC ≥ 2) and 759 were down-regulated (FC ≤ −2); a further 1458 and 1434 genes exhibited moderate changes at 1 < FC < 2 and −2 < FC < −1, respectively (Figure 3). HISAT2 achieved 77.3–86.2% overall alignment, with 68.5–74.1% of read pairs aligning concordantly once and HTSeq assigning 54.5–57.7% of read pairs to gene features (Supplementary Figure S1).
The functional categorization of DEGs allowed us to identify the two biggest groups of genes involved in general metabolism (1.065) and signal transduction (754). The other groups of genes were associated with transport (407), translation (378), transcription (309), stress responsive (308), protein modification (222), cell structure (194), hormone (107), development (30), cell division (29) and DNA repair (16). The most interesting groups of genes were involved in carbohydrate metabolism (75), lipid metabolism (57) and photosynthesis (44) (Supplementary Figure S2). The top 50 DEG annotations are presented in Supplementary Figure S3.

2.3.1. Gene Ontology Enrichment of Differentially Expressed Genes (DEGs)

GO over-representation analysis of DEGs between ‘Free Redstar’ and ‘Trinity’ assigned functions across the three GO ontologies (Biological Process, BP; Cellular Component, CC; Molecular Function, MF). We detected extensive enrichment within BP (n = 3064 terms), CC (n = 488) and MF (n = 860) (Supplementary Table S3).
In BP, representative enriched terms included flavonoid and phenylpropanoid metabolism/biosynthesis (GO:0009812; GO:0009813; GO:0009698; GO:0009699), secondary metabolic processes and their biosynthesis (GO:0019748; GO:0044550), cuticle/cutin development (GO:0042335; GO:1901957), responses to Karrikin and toxic substances with cellular detoxification (GO:0080167; GO:0097237; GO:1990748; GO:0009636; GO:0098754; GO:0098869), macromolecule and protein methylation/alkylation/arginylation (GO:0043414; GO:0006479; GO:0008213; GO:0016598), the negative regulation of endopeptidase activity (GO:0010951) and the specification of stamen identity (GO:0010097) (Supplementary Table S4; Figure S4).
CC terms were enriched for ribosomal subunits and cytosolic ribosome (GO:0044391; GO:0022626; GO:0005840), the external encapsulating structure/cell wall (GO:0030312; GO:0005618) and megasporocyte and polar nuclei (GO:0043076; GO:0043078) (Supplementary Table S5; Figure S5).
In MF, enrichment was dominated by oxidoreductase/peroxidase activities (GO:0016491; GO:0004601; GO:0016684), acyltransferase activities (GO:0016746; GO:0016747), structural constituents of the ribosome (GO:0003735; GO:0005198), enzymes of the flavonoid pathway (naringenin-chalcone synthase and phenylalanine ammonia-lyase; GO:0016210; GO:0045548), antioxidant activity (GO:0016209), DNA AP endonuclease (GO:0003906) and abscisic-acid binding (GO:0010427) (Supplementary Table S6; Figure S6).

2.3.2. KEGG Enrichment Analysis

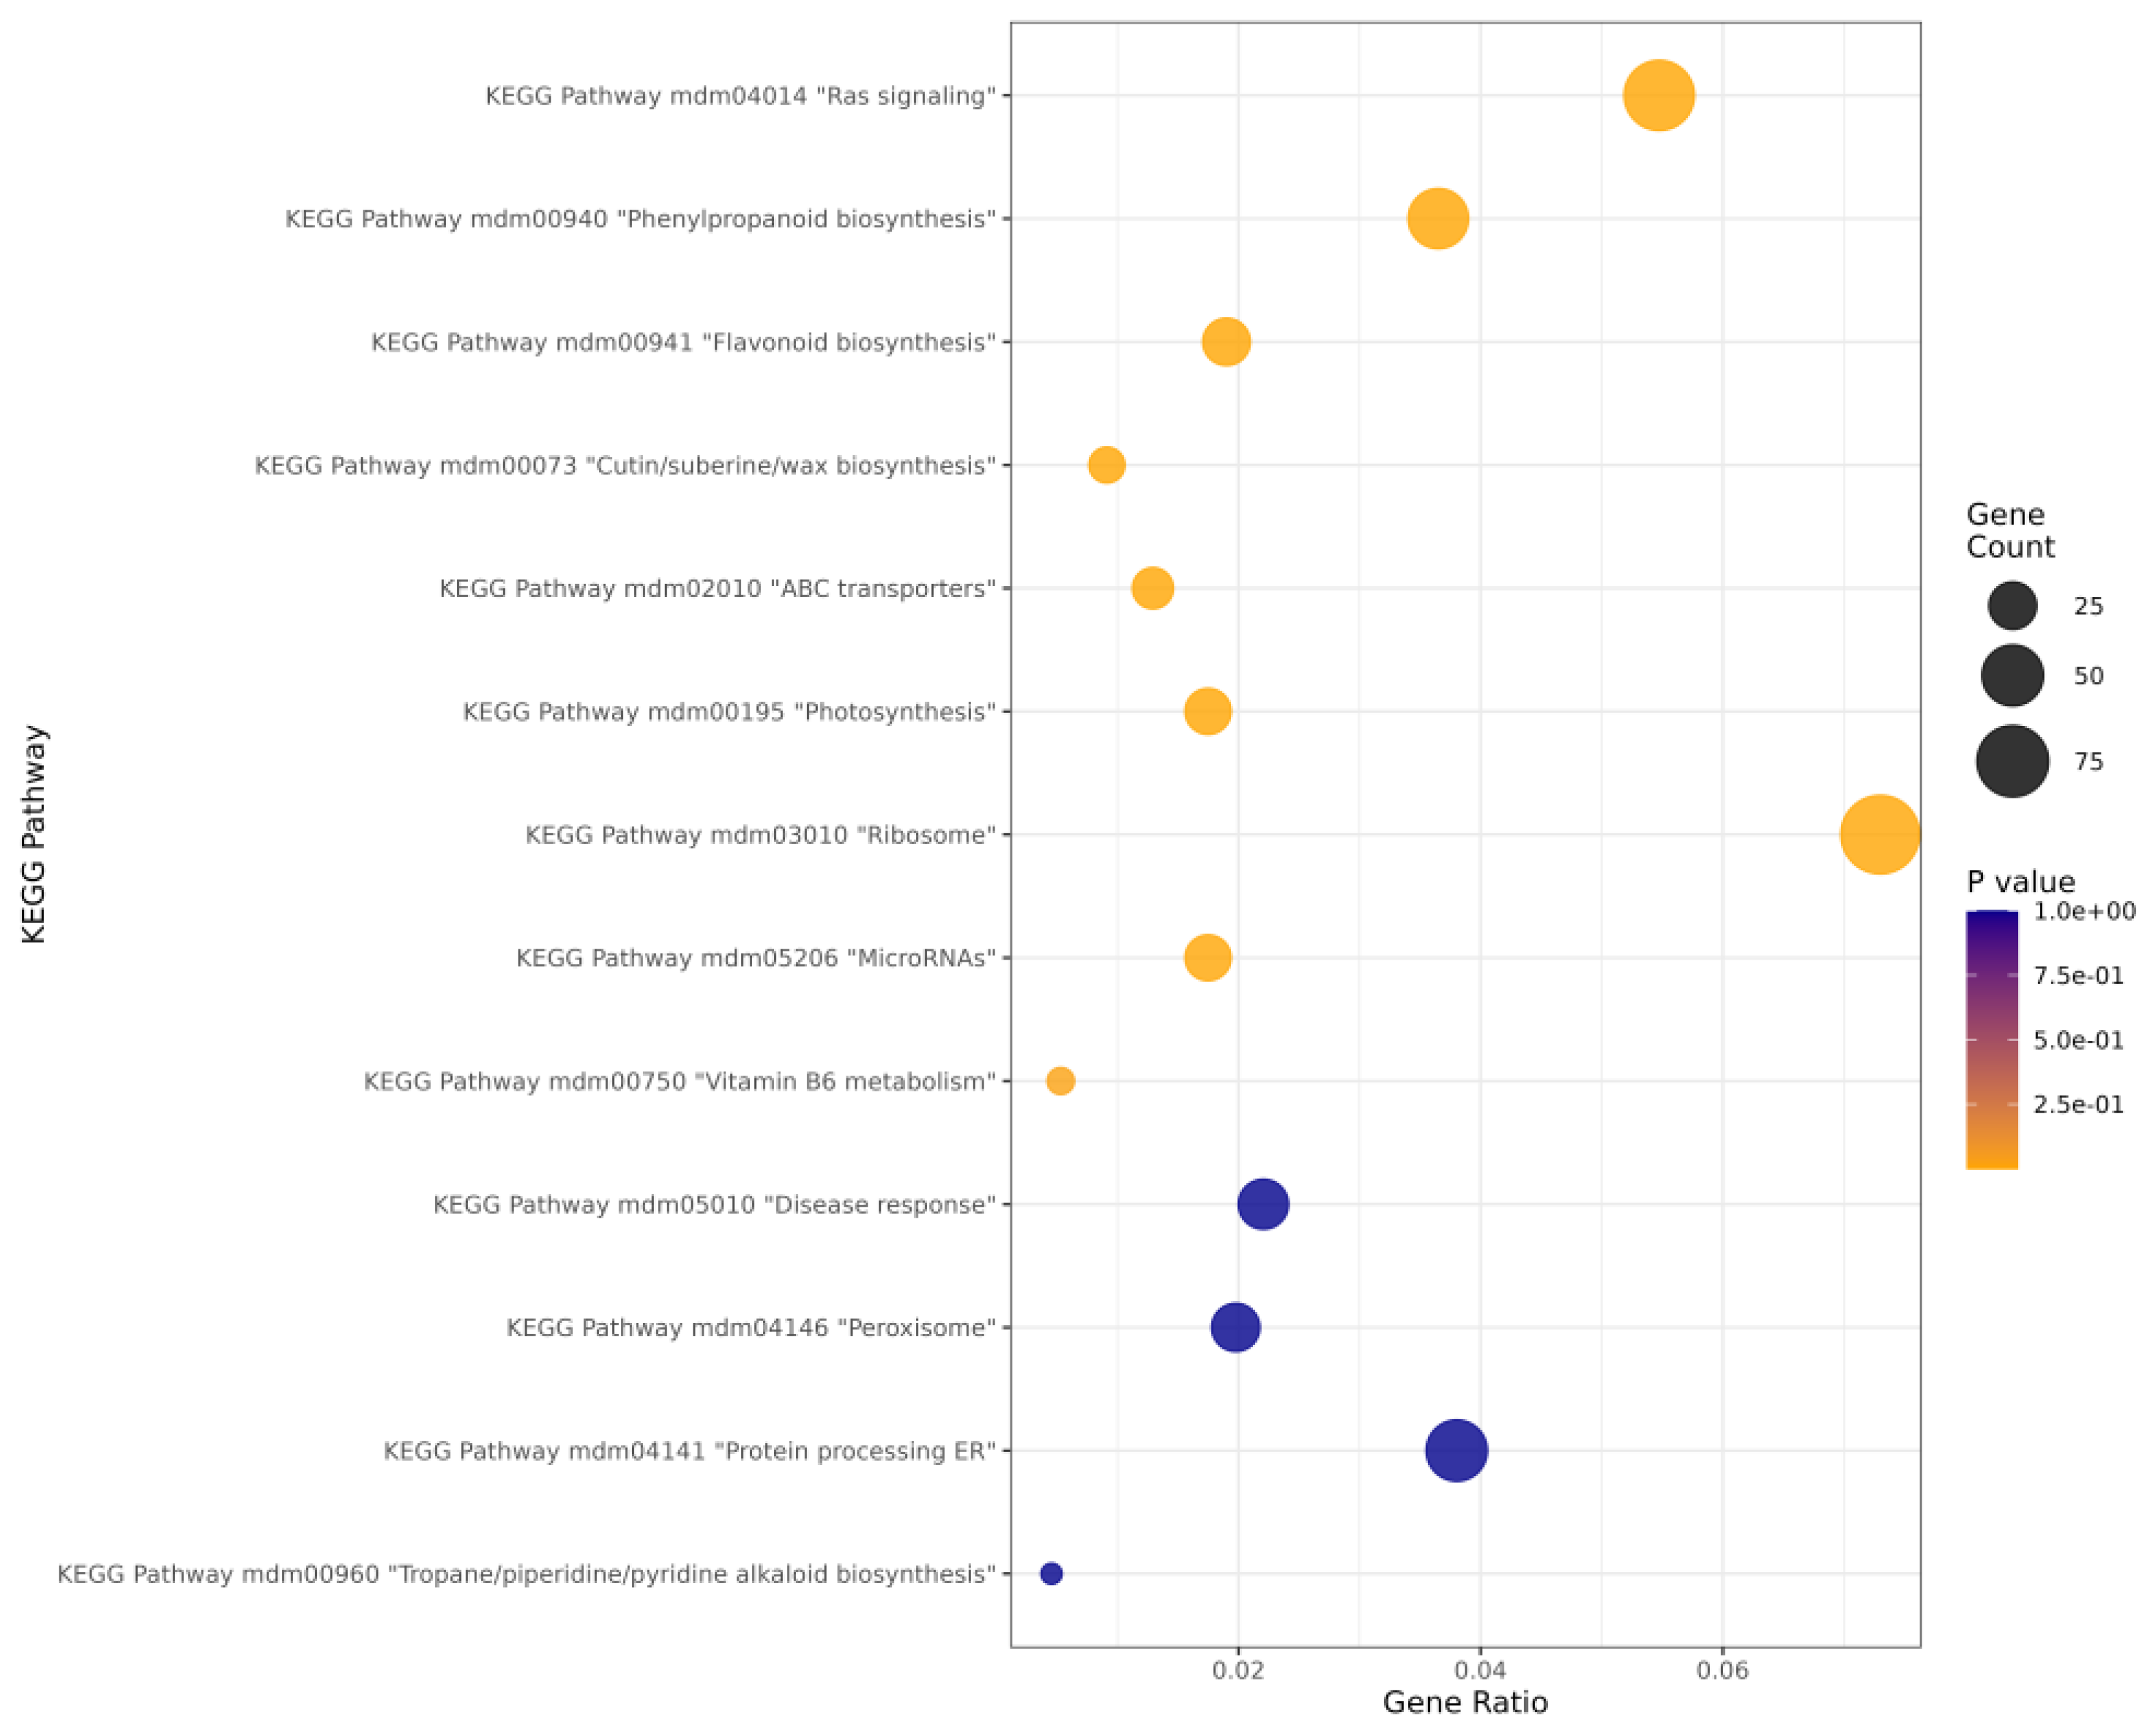
Using gene identifiers obtained after mapping the transcriptome to the Malus reference genome (Supplementary Table S2), we performed KEGG pathway over-representation analysis (Supplementary Table S7; Figure 4). Among the top 60 enriched pathways, the largest gene counts/gene ratios were observed for mdm03010 (ribosome), mdm04014 (Ras signaling), mdm00940 (phenylpropanoid biosynthesis), mdm00941 (flavonoid biosynthesis), mdm00073 (cutin/suberin/wax biosynthesis), mdm02010 (ABC transporters), mdm00195 (photosynthesis), mdm05206 (MicroRNAs), mdm00750 (Vitamin B6 metabolism), mdm05010 (disease response), mdm04146 (peroxisome), mdm04141 (protein processing in endoplasmic reticulum) and mdm00960 (tropane piperidine/pyridine alkaloid biosynthesis).
For expression profile verification, ten representative genes were selected within key enriched pathways: (i) phenylpropanoid (confirming our validation efforts) and flavonoid biosynthesis (mdm00940, mdm00941; genes: N3Dioxy, LAR1, F3Mo; (Supplementary Figures S7 and S8)); (ii) cutin/suberin/wax biosynthesis (mdm00073; genes: AlcFARed, CER1, CYP86A4, PalmTransf; (Supplementary Figure S9)); (iii) tropane/piperidine/pyridine alkaloid biosynthesis and peroxisome (mdm00960, mdm04146; genes: TropRed, CyP865B1, CytP450 (Supplementary Figures S10 and S11)).

2.4. Activity of Selected Genes Depend on Anthocyanin Accumulation

Based on the comparative transcriptome analysis of red- and white-fleshed apple fruits, we verified the activity of a set of ten genes significantly influencing anthocyanin biosynthesis.
All selected genes were validated on cDNA samples from fruits produced via hybrid genotypes derived from the cross-breeding of ‘Trinity’ and ‘Free Redstar’, varying in accordance with the total anthocyanin concentration level (indicating fruit flesh color). Selected DEGs were grouped into clusters: genes involved in flavonoid biosynthesis, wax synthesis, peroxisome and tropane/piperidine and pyridine alkaloid biosynthesis.

2.4.1. Expression Profiling of Genes Involved in Flavonoid Biosynthesis

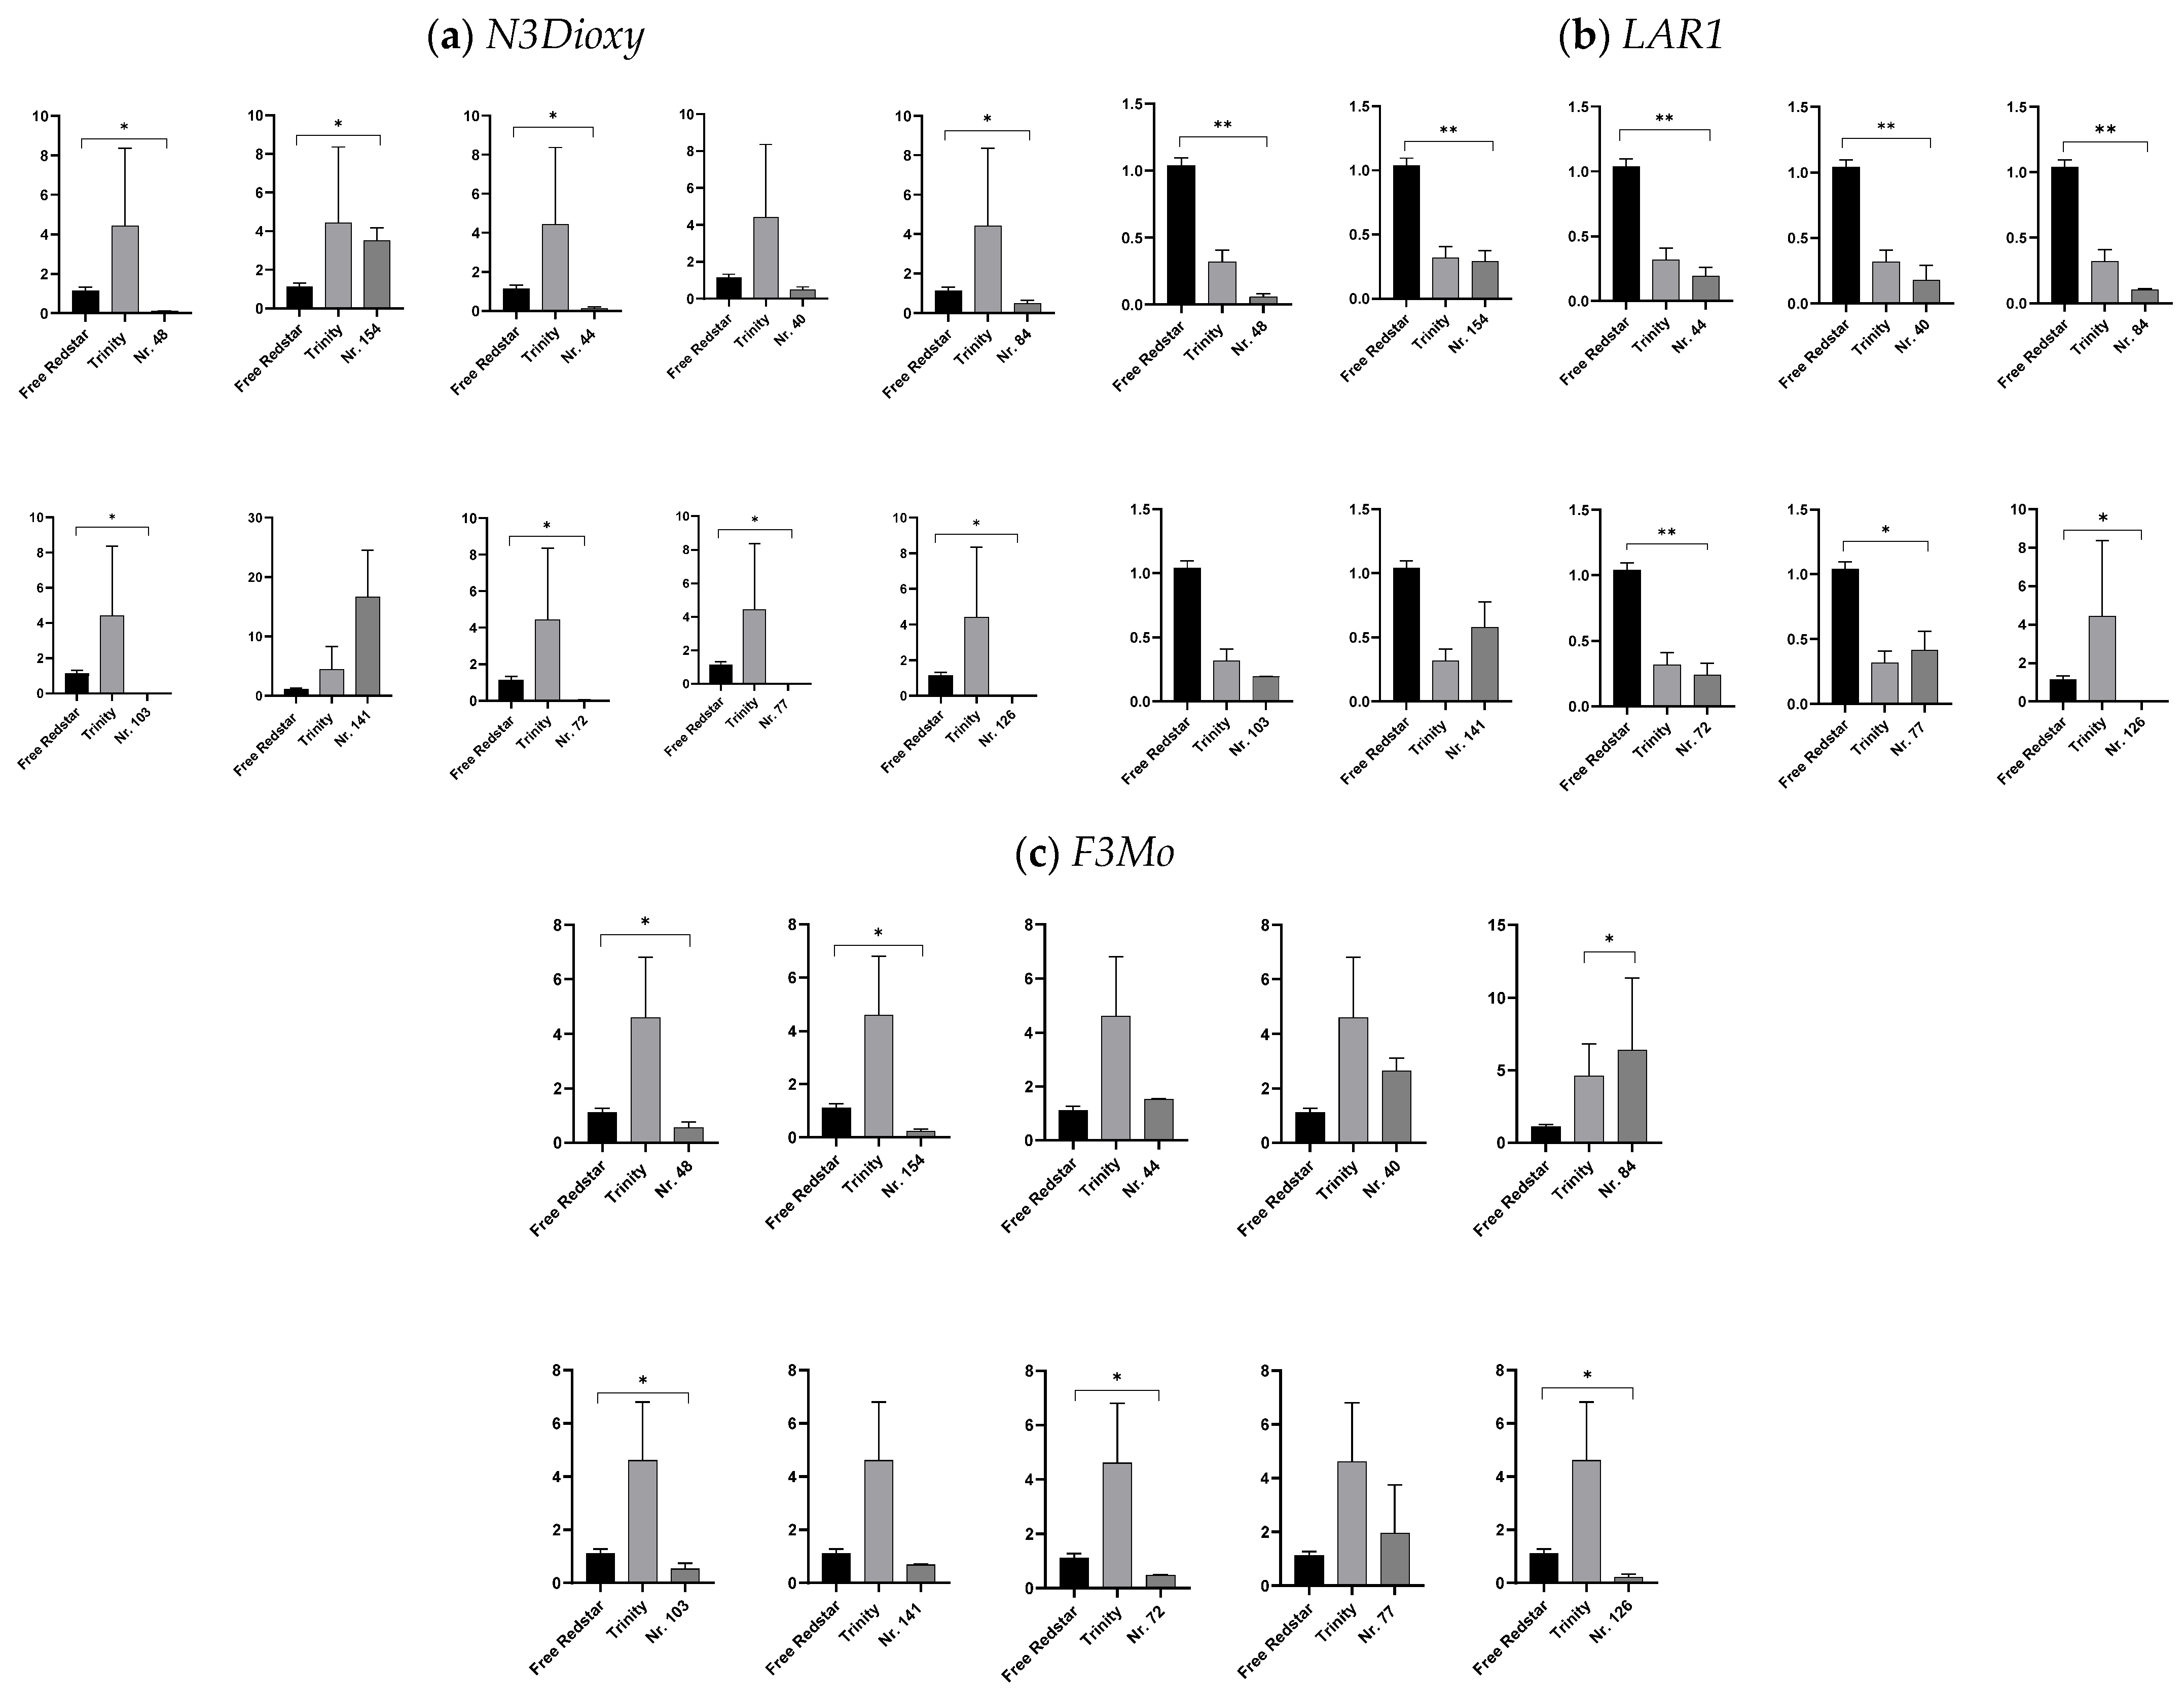
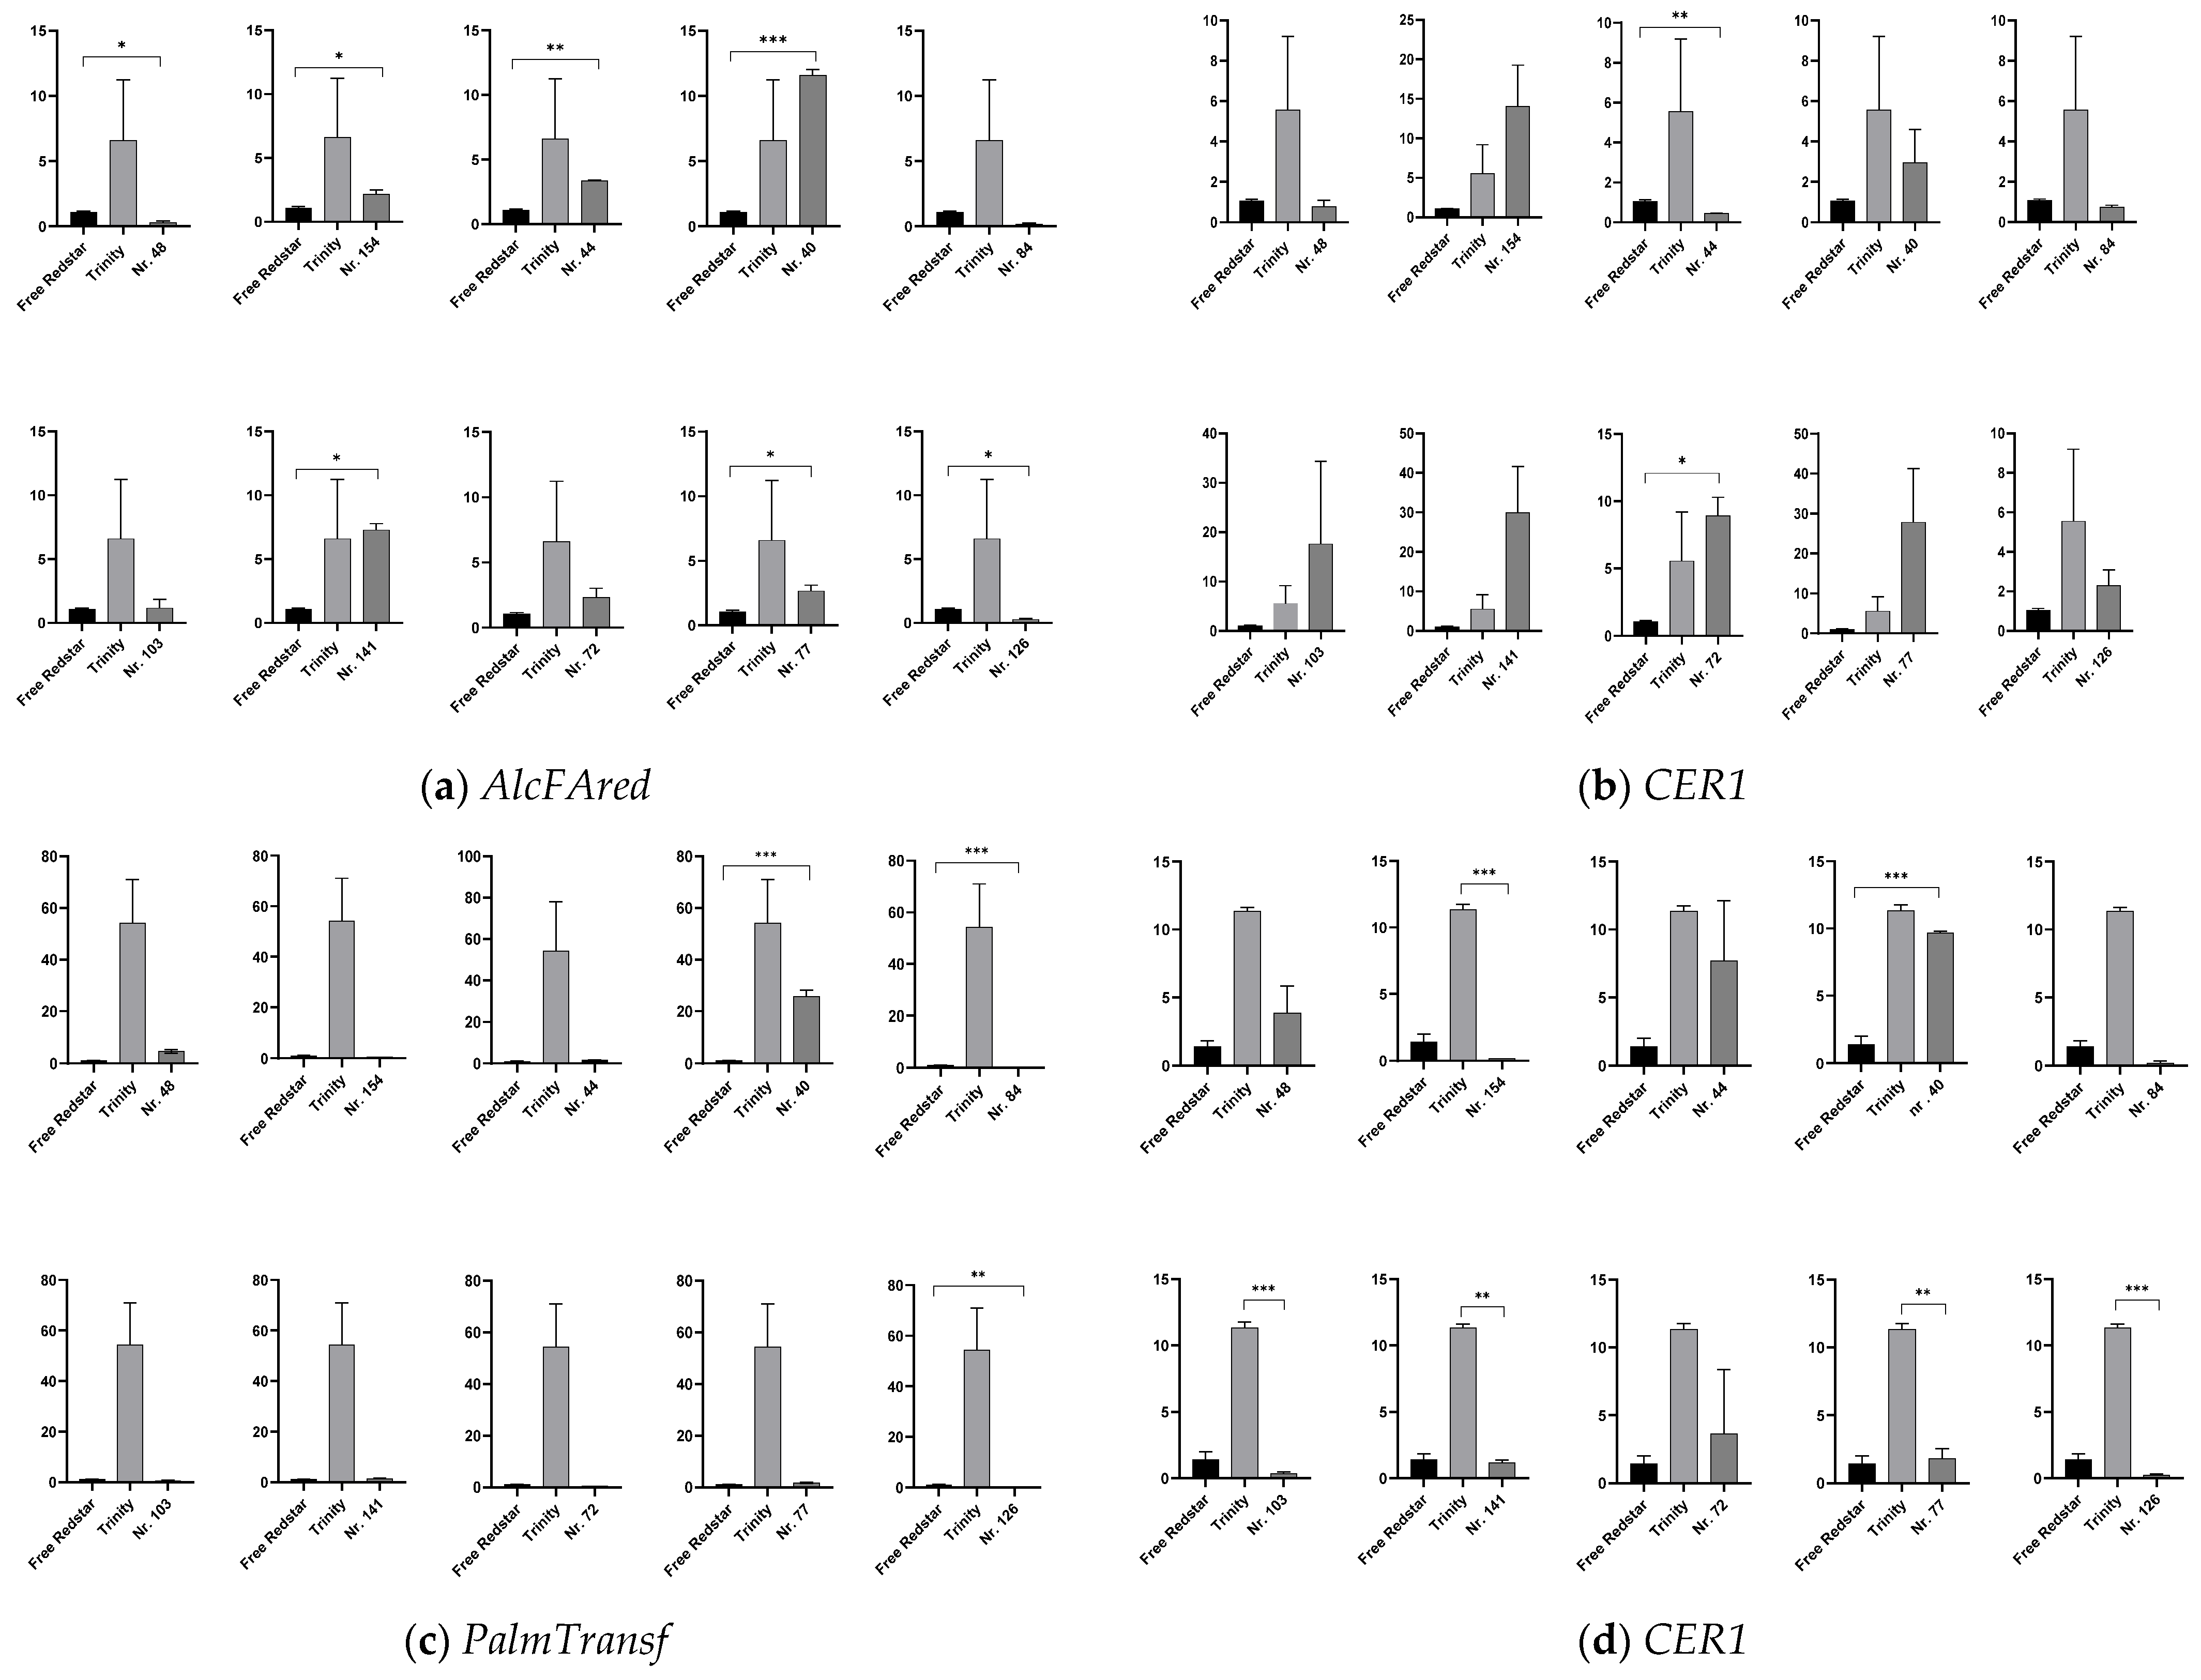
The N3Dioxy gene (naringenin-3-oxydase, EC 1.14.11.9) was significantly over-expressed in the red-fleshed ‘Trinity’ variety. In general, the activity of this oxidase gene was relatively low in the studied fruits for all genotypes. Interestingly, lower activity (relatively to ‘Trinity’) in the dark red-fleshed fruits of genotype 84 was observed for this gene. Its highest activity was noted in the fruits of genotypes 141 and 154 (with pink- and light red-fleshed fruits, respectively) (Figure 5a). The LAR1 gene (encoding leucoanthocyanidin reductase, E.C 1.17.1.3), which was selected for our study, also had significantly low activity in fruit flesh for all analyzed genotypes. As expected, since it participates in anthocyanin reduction, its activity was high in the reference samples of the white-fleshed fruits of the ‘Free Redstar’ cultivar (Figure 5b). Simultaneously, an inverse relationship was demonstrated for the F3Mo (flavonloid-3-monooxygenase, EC 1.14.13.21) gene, which was shown to be active in the red-fleshed fruits of the reference ‘Trinity’ cultivar and in the genomes of all hybrids producing fruit with red or pink flesh (Figure 5c).

2.4.2. Expression Profiling of Genes Involved in Cutin and Wax Biosynthesis

The high activity of the selected genes, designated as involved in the synthesis of the wax and long-chain fatty acid pathways (AlcFAred—alcohol-forming fatty acyl-CoA reductase EC 1.2.1.84; CER1—very-long-chain aldehyde decarbonylase CER1, EC 4.1.99.5) and generally belonging to the FA reductases, was observed in samples of red-fleshed fruits (Figure 6a,b). For the gene encoding omega-hydroxypalmitate O-feruloyl transferase (PalmTansf, 2.3.1.188), negligible correlations were found between fruit flesh color, total anthocyanin content and the number of gene transcripts. However, interestingly, the number of transcripts of this gene was generally higher only in the fruit of the reference cultivar ‘Trinity’, as well as for hybrid genotypes 40 and 48, producing red-fleshed apples (Figure 6c). For the gene CYP86A4 (recognized as FA carbonylase, CYP86A1), the highest expression was calculated for the red/pink-fleshed fruits of the genotypes 48, 40 and 44; however, the number of gene transcripts was lower in comparison to the red-fleshed fruits of the reference cultivar ‘Trinity’ (Figure 6d).

2.4.3. Expression Profiling of Genes Involved in Tropane Piperidine and Pyridine Alkaloid Biosynthesis and Peroxisome

For the genes CYP865B1 (flavonoid reductase activity) and CytP450 (oxidase activity, EC 1.1.1.206), which were mapped via the peroxisome pathway, relatively higher expression levels, in comparison to the ‘Free Redstar’ cv., were observed in red-flesh fruits of ‘Trinity’ (Figure 7a,b). Similarly, higher activity for both genes was observed in fruit samples collected from the hybrid genotypes 103 and 77, producing yellow- or pink-fleshed fruits. For TropRed (tropinone reductase gene EC 1.1.1.206 (mapped through tropane/piperidine and pyridine alkaloid biosynthesis)), we observed a significant breakdown in its activity in all the tested fruit flesh samples (Figure 7c).

2.5. Validation of the Activity of Structural Genes from the Anthocyanin Biosynthesis Pathway in Accordance with Anthocyanin Accumulation

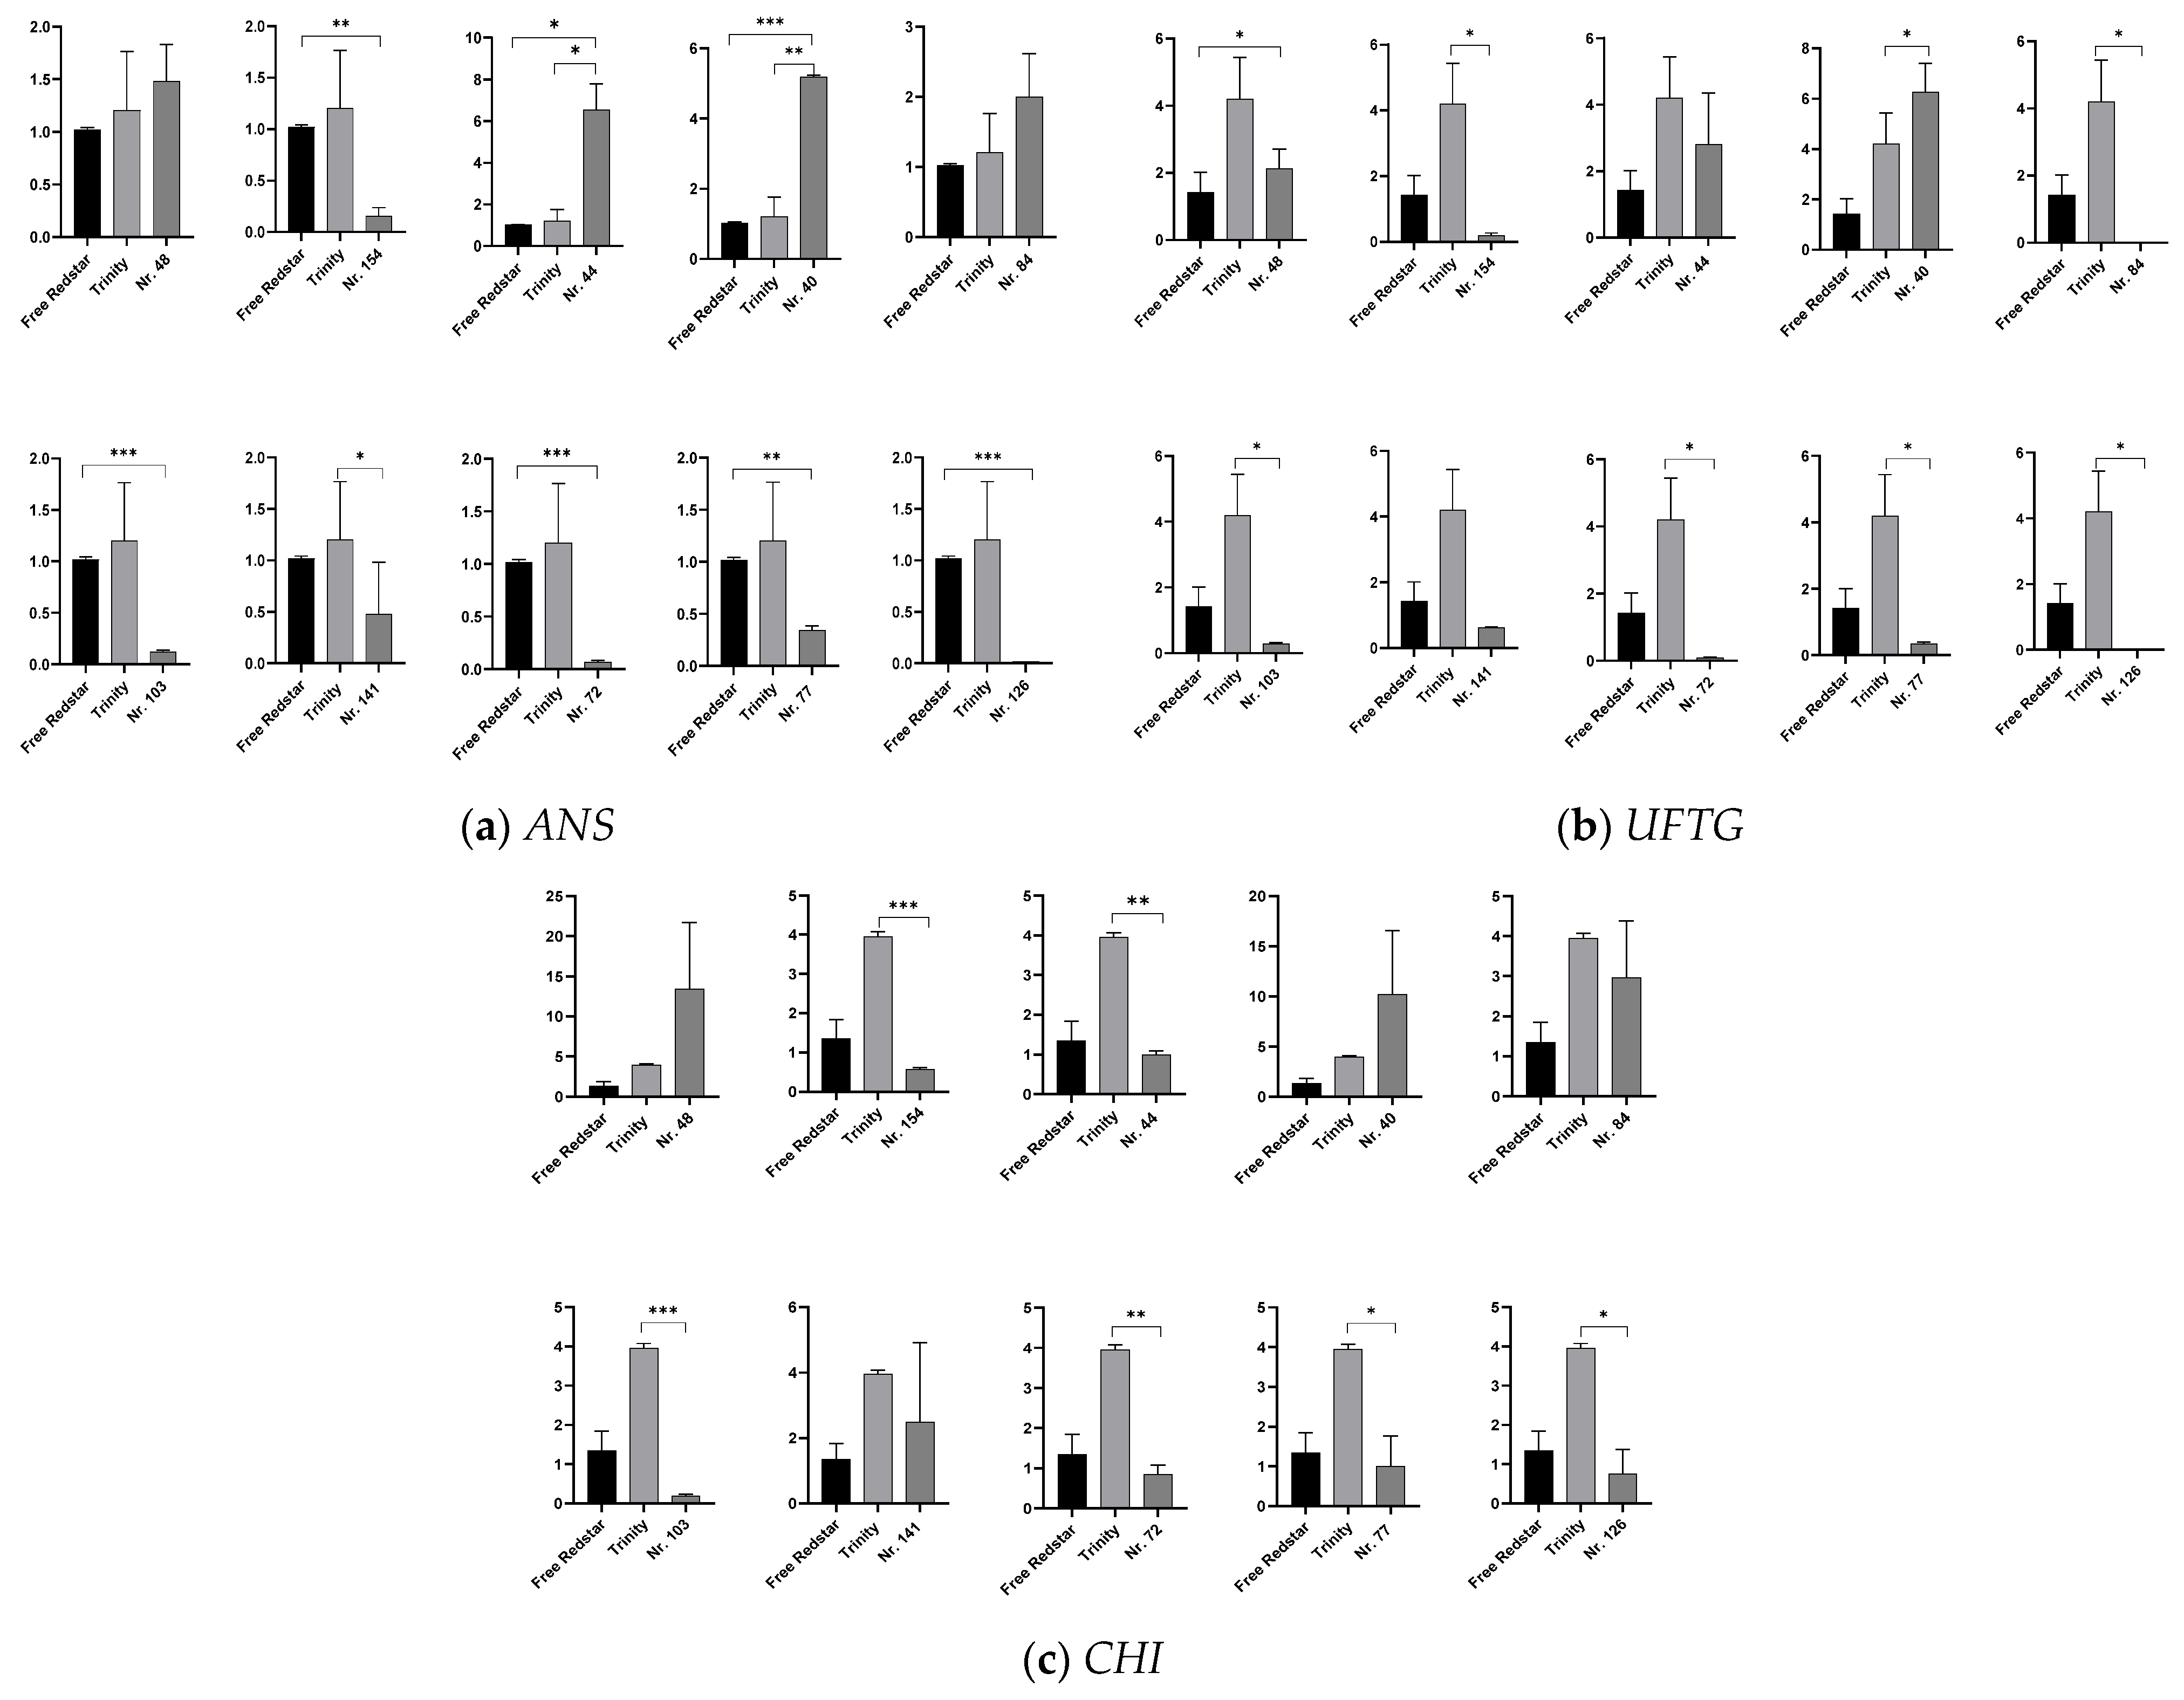
To verify the activity of the structural genes of the anthocyanin biosynthesis pathway (mdm00942) and confirm their undoubted relationship with the anthocyanin content evaluated in the analyzed fruit flesh samples, we calculated the number of transcripts of the ANS (anthocyanin synthase), CHI (chalcone isomerase) and UFGT (Flavonoid 3′-O-glucosyltransferase) genes. As expected, the relatively high activity of all structural genes was estimated for genotypes producing fruits with red or pink flesh.
Interestingly, the ANS expressions calculated for the hybrid genotypes 44, 40 and 84, producing red-fleshed fruits, was significantly higher compared to those for the red-fleshed fruits of the ‘Trinity’ cv. (Figure 8a–c).

3. Discussion

In the presented research, we have applied transcriptome analysis of ‘Trinity’ and ‘Free Redstar’ (which differ in accordance with apple fruit flesh color), which allowed us to uncover a new set of genes potentially related to flavonoid, wax (fatty acid degradation) and alkaloid biosynthesis.
In the first presented results, we have precisely verified that the plant material used for research purposes was chosen properly. Phenotypical analysis (with regard to TAC), as well as calculating the number of gene transcripts (for ANS, CHI and UFGT), confirmed high variation in the ten selected apple hybrid genotypes derived from cross-breeding the ‘Trinity’ and ‘Free Redstar’ varieties.
Through this pilot research, we have observed the significantly low activity of the ANS, CHI and UFGT structural genes (representatives of the anthocyanin biosynthesis pathway) in yellow- and white-fleshed fruits. The activity of the evaluated genes corresponded to lower total anthocyanin concentrations in the evaluated fruit samples. Similar results were described by Kondo and coworkers [66]. Based on this correspondence, the authors have highlighted the overexpression of CHS, F3H and DFR, followed by the down-regulation of ANS and UFTG, in the yellow/green skin of matured fruit of ‘Mutsu’ [67]. In general, this initial analysis confirmed the activity of the structural genes from the anthocyanin biosynthesis pathway, as well as the basic mechanisms of red-fleshed fruit, influencing the evaluated apple hybrid genotypes.
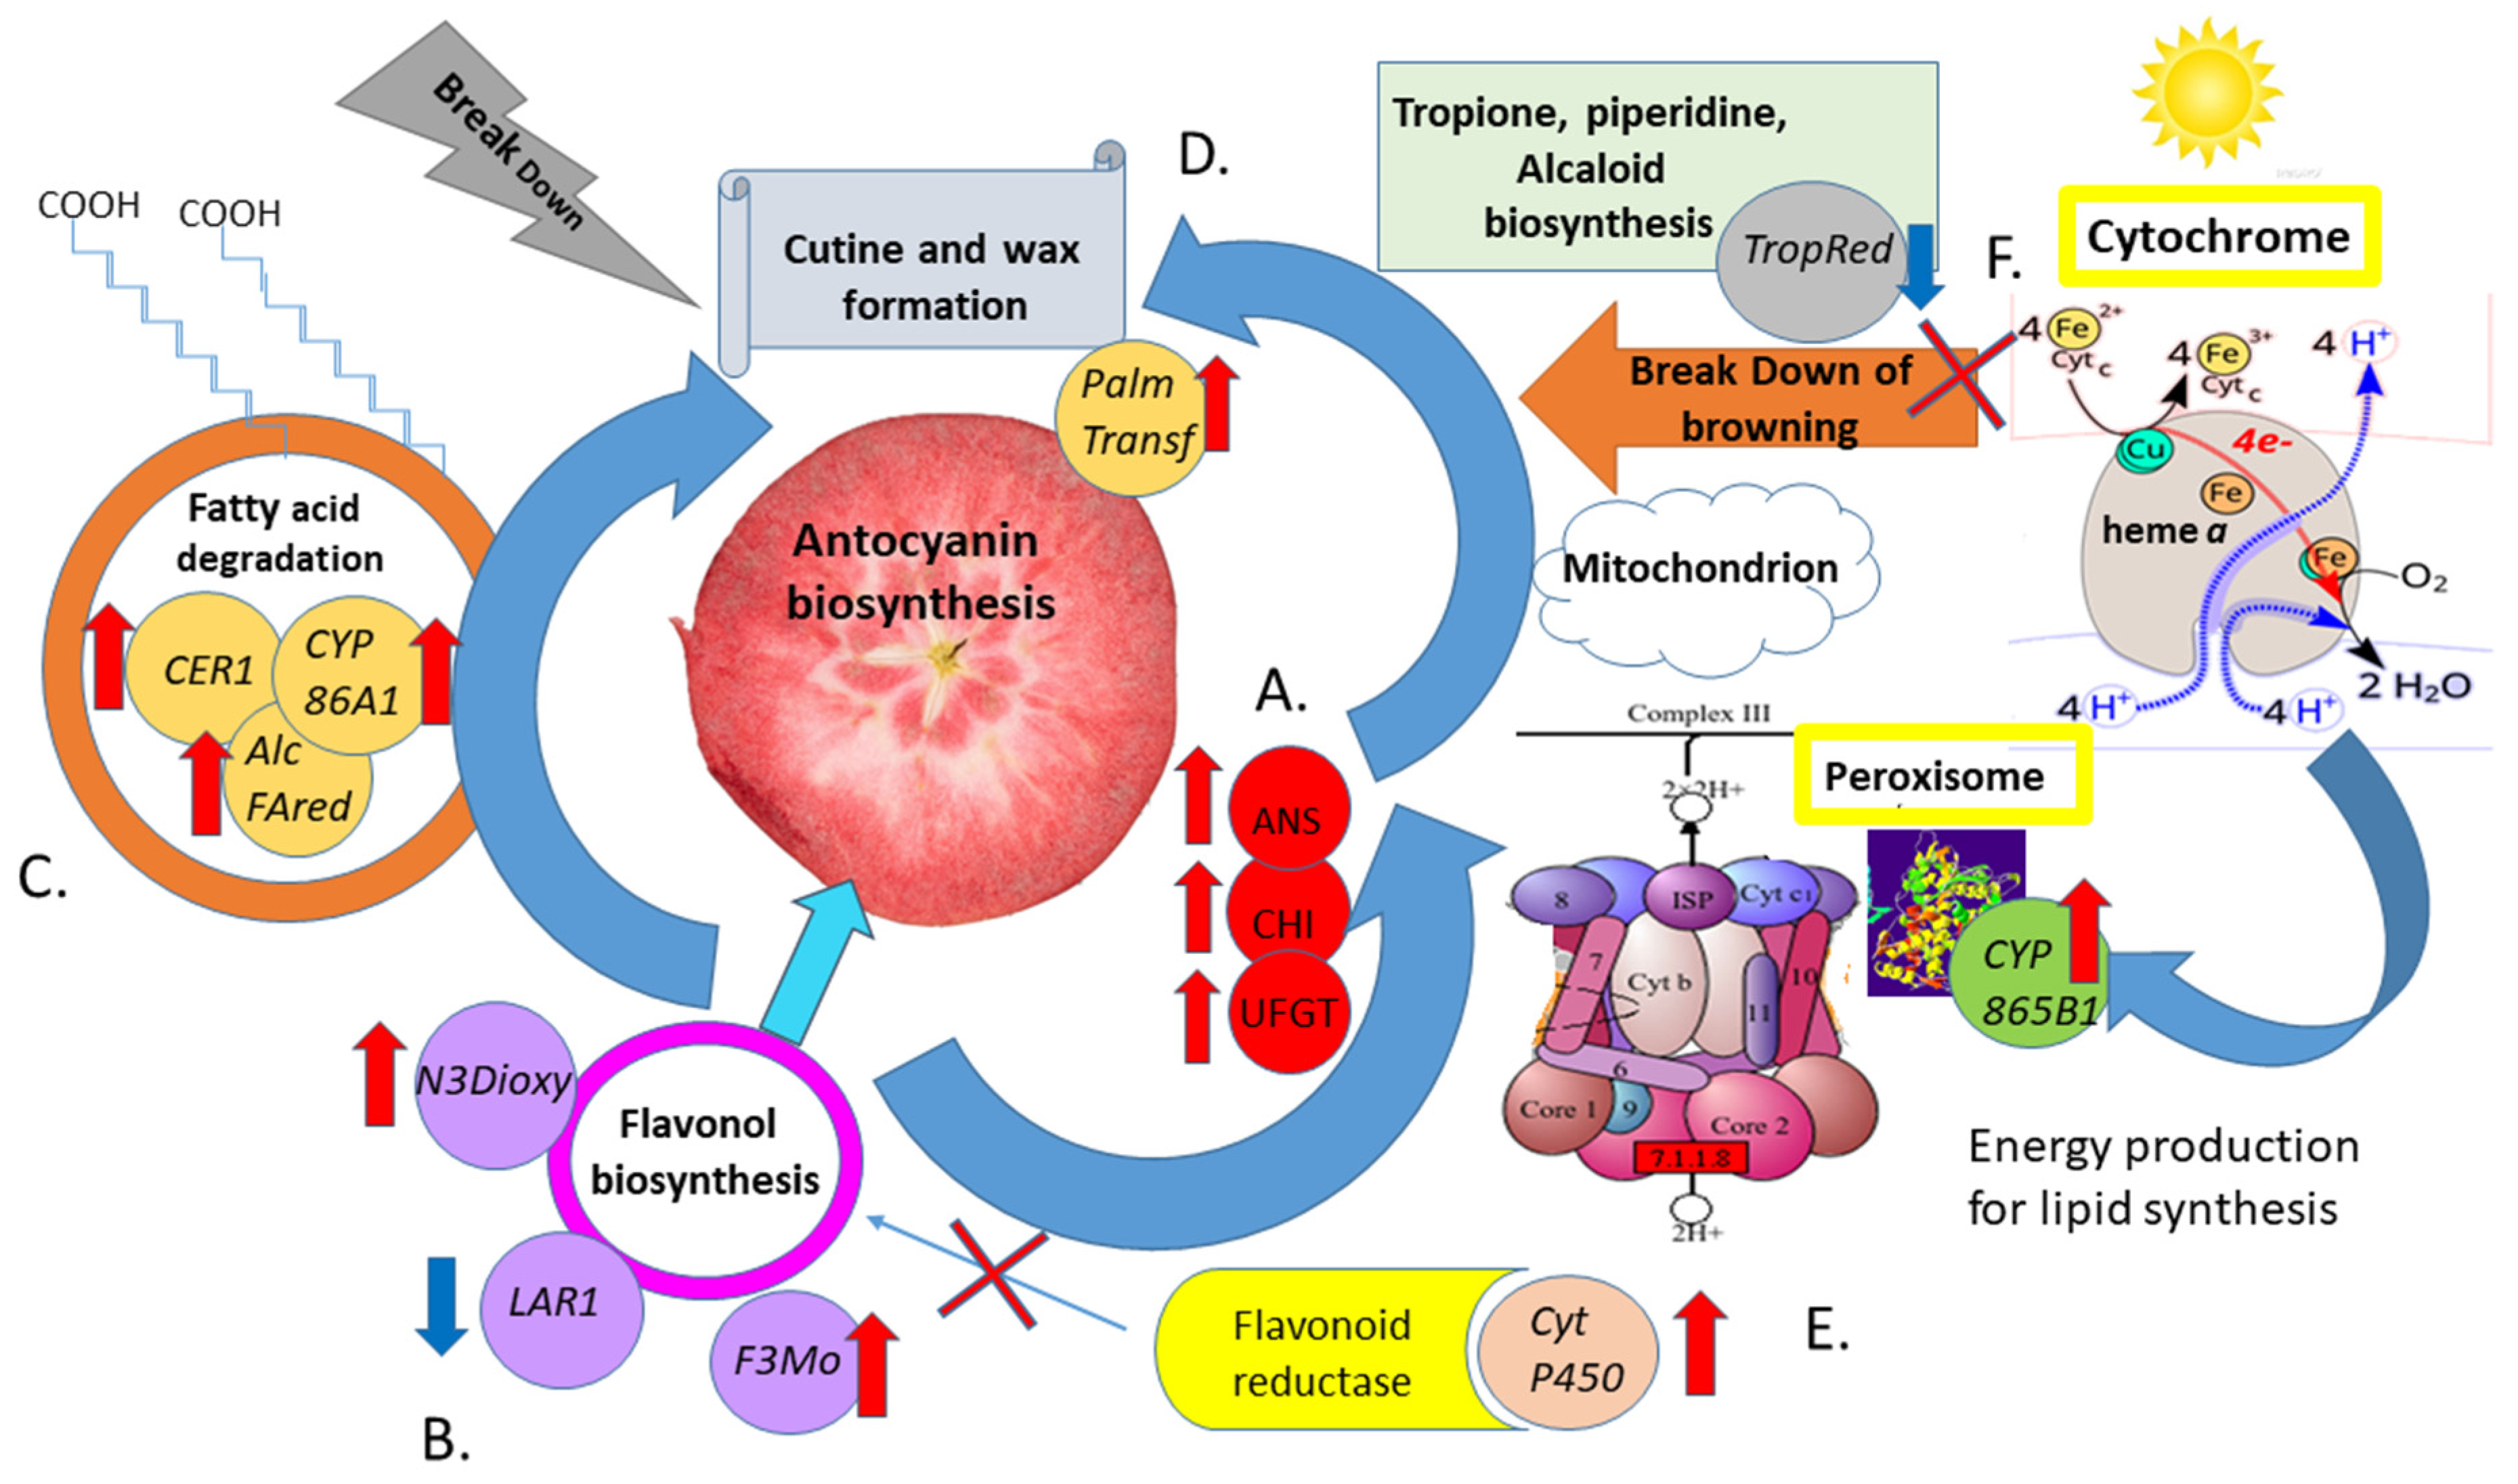
Interestedly, in our research, we have discovered ten genes potentially bridging the anthocyanin metabolism with other external pathways involved in the stimulation of their biosynthesis in apple fruit flesh. Those genes, mapped through the flavonoid biosynthesis, cutin/suberin/wax biosynthesis, tropane/piperidine/pyridine alkaloid biosynthesis and peroxisome pathways (Figure 9), have not been investigated so far.

3.1. Investigation of the Relationship of Uncovered Genes with Flavonoid and Pro-Anthocyanin Biosynthesis in Red-Fleshed Apple Fruits

Three genes—N3Dioxy (naringenin 3-dioxygenase), LAR1 (leucoanthocyanidin reductase 1) and F3Mo (flavonoid 3-monooxygenase)—mapped through the flavonoid synthesis pathway (KEGG: mdm00941) were uncovered via transcriptome comparison of red-fleshed (‘Tinity’) and white-fleshed (‘Free Redstar’) apple cultivars.
The naringenin dioxygenase gene (N3Dioxy), uncovered in our study, was identified as playing an important role in the flavonoid biosynthesis pathway. This confirmed one of the workflow mechanisms of anthocyanin accumulation, followed by flavonoid incorporation in cuticles. This phenomenon, controlled by naringenin chalcone, together with flavonone 3-hydroxylase (F3H), was first described in tomato [25] and grapes [68]. In addition, we have discovered the relationship of N3Dioxy gen with the complex role of Flavonone 3-hydoxylase (F3H), which was previously intensively studied by [69]. Its activity highlights the promotion of flavonone synthesis in the condensation of malonyl-CoA with 4-coumaroyl-CoA, followed by the formation of naringenin chalcone, catalyzed by chalcone synthase (CHS), and subsequent conversion into naringenin by chalcone flavanone isomerase (CHI) [69]. Our findings underline the role of the N3Dioxy gene as a controller of flavanone biosynthesis in anthocyanin accumulation.
Moreover, we have confirmed that the flavonone 3′-monoxygenase gene (F3Mo, up-regulated in red-fleshed apple fruits) controls flavonoid biosynthesis by promoting naringenin dioxygenase gen (N3Dioxy) to achieve the final proanthocyanin formation, thus making it the compartment of the flavone biosynthesis complex (Figure 9). These insights had not been uncovered before this study.
Discovered in this study, LAR, which encodes leucocyanidine reductase and is assigned to the flavonoid biosynthesis pathway, is another regulatory gene, pivotal in the above-mentioned complex. After investigating the transcriptome of fruits of ‘Fumei’, Huo and coworkers confirmed the same role for the LAR gene in the flavonoid pathway [70]. The authors underlined that the LAR enzyme competes with the ANS gene in the conversion of leucoanthocyanidin into catechin [71,72]. This mechanism was also postulated by Liao and coworkers, who observed undetectable levels of LAR transcripts in the fruit skin of crab apples, which consisted mainly of catechin and low concentrations of polyphenols. Their observation underlined the role of LAR in suppressing late genes in the anthocyanin biosynthesis pathway, resulting in the loss of anthocyanin [73]. In contrast, Li and coworkers detected significant levels of LAR1 and LAR2 gene transcripts in the fruit skin of ‘Fuji’ [74]. This inverse relationship between ANS and LAR activity (up-regulation of ANS and inhibition of LAR in red- and pink-fleshed fruits, Figure 5b and Figure 8a) was also observed in our study (Figure 9).

3.2. Confirmation of Contribution of External Pathway Genes to Anthocyanin Biosynthesis

Since the relationship between flavanones/anthocyanins and cutin has not yet been reported in apples, in this research, we have confirmed the complex mechanism of anthocyanin accumulation, which requires outside metabolites to be activated.
In this study, four genes—AlcFARed (alcohol forming fatty acyl-CoA reductase), CER1 (aldehyde decarbonylase), PalmTransf (omega-hydroxypalmitate O-feruloyl transferase) and CYP86A1 (fatty acid hydrolase)—mapped via the cutin and waxy biosynthesis pathways (KEGG: mdm00073); two genes—CYP865B1 and CytP450 (probably flavoprotein reductase from cytochrome P450)—mapped through the peroxisome pathway (KEGG: mdm04146); and one gene—TropRed (tropione reductase)—mapped via tropane piperidine and pyridine alkaloid biosynthesis (KEGG: mdm00960) were found to be differentially expressed in the red-fleshed fruits of the cv. ‘Trinity’.
In our study, we have observed high activity of AlcFARed, CER1, PalmTransf and CYP86A4 (recognized FA reductases, transformation of VLCFA, mapped in the cutin biosynthesis pathway (KEGG: mdm00073)) in red-fleshed apple fruits. These observations allowed us to uncover the specific relationships between significant reductions in the amount of VLCF released in fruits with higher anthocyanin contents.
While the apple cuticle is composed of very-long-chain fatty acids (VLCFAs, typically between C20–C34) derived from alkanes, alcohols, esters, aldehydes, ketones and triterpenoids [75,76], the role of these genes seems to be crucial. Those components are de novo synthesized in plastids via the catalysis of the fatty acid synthase complex (FAS) generally consisting of fatty acyl-ACP thioesterase (FAT) and fatty acid elongase (FAE). As stated by the authors, in contrast, long-chain fatty acids are disintegrated via acyl-reduction and decarboxylation pathways and mediated by fatty acid transferases [77] and fatty acid hydrolase (CYP86A) [78], as first recognized in this research.
Our observation confirm that triterpenoids are a group of molecules employed in cutin formation. They are derived from isopentenyl pyrophosphate (IPP, C5) and play a special role in plant cutin layer formation, proceeding with acetyl-CoA (energy precursor in different tissues) [61,79]. Other mechanisms are also applied in triterpenoid synthesis, such as squalene cyclization, hydroxylation, glycosylation and other structural modifications in which oxidosqualene cyclases (OSCs), cytochrome P450 monooxygenases (CYP) and glycosyltransferases (UGTs) are involved, which seem to be pivotal in cuticle formation [77]. Our data confirm these observations; thus, we have noted significant activation of CYP and CER genes in the fruits of the red-fleshed ‘Trinity’ cultivar (Figure 9).
The CER1 gene revealed in our research was assigned to the group of CER-like genes previously discovered in different species such as Arabidopsis [80], tomato [81], sweet cherry [81] and orange [82]. Trivedi and coworkers have underlined their skin-specific expression, suggesting that these genes might be responsible for the differential accumulation of very-long-chain aliphatic compounds [51]; our data underlined the initiation of their activity in apple fruit flesh. As suggested, CER genes play an important role in alkane biosynthesis, being linked to the aldehyde biosynthesis process and the VLCFA decarbonylation pathway [82,83]. FAR is another type of gene involved in fatty acid transformation (such as omega-hydroxypalmitate O-feruloyl transferase) and reductases (such as alcohol forming fatty acyl-CoA reductase) and fatty acid hydrolases, generally hampering alcohol production, which is necessary for fatty acid elongation [61,77]. The CER/FAR interaction, which was first determined for Arabidopsis, suggests that both gene types generate primary alcohols and alkanes, which are finally associated with cuticular wax formation [84,85]. Our results confirm this relationship and highlight this mechanism for the first time in red-fleshed apple fruits.
One of the main factors impacting regulatory mechanisms in plant cytochromes and peroxisomes is light. Light may determine significant and intensive connections between those important cell organelles. Since light is essential for plant growth and development, some records underline their relationship with anthocyanin biosynthesis (negatively in apple fruits). Generally, activated photons inhibit the transcription factors [86]. This mechanism has not yet been investigated, and we have found some probable connections between anthocyanins and wax biosynthesis, as well as energy accumulation.
Since the final regulation mechanisms of phenylopropanoid biosynthesis are energy-intensive, there are several standalone oxidoreductases (CYP) responsible for their molecular transformation, catalyzed in cell structures such as cytochromes and peroxisomes, which take up the secondary metabolites derived from the aromatic amino acid phenylalanine in most plants [87].
As a result of these reactions, different fatty acid conjugates, plant hormones, secondary metabolites, lignins and other protective chemicals are produced [88,89,90].
In the membranes of the endoplasmic reticulum, electrons are transferred directly from NADPH to cytochromes via the NADPH-cytP450 reductase complex of flavoproteins, anchored to one layer of the membrane by a hydrophobic chain.
For some enzymatic molecules of cytochrome P450, such as cytochrome b5 and cytb5-cytP450 reductase, flavoproteins may participate in general electron transfer in the flavonoid cycle [91]. The CytP450 gene belonging to the flavoprotein reductases discovered in our study seems to block flavonoid reductase, thus accelerating anthocyanin biosynthesis. This interaction in red-fleshed apple fruits has now been explained for the first time.
The crucial enzyme, which acts as a functional catalyst for the synthesis of intermediate 4-(1-methyl-2-pyrrolidinyl)-3-oxobutanoic acid, was finally transformed into tropinone through the catalytic activity of the cytochrome P450, which is a tropinone synthase (CYP82M3) [92], fully elucidated in belladonna flower petal pigmentation [93]. In our study, we have discovered a negative correlation between the down-regulated TropRed gene (mdm00960) and the up-regulated Cyp865B1 and CYP86A4 genes (mdm00073), leading to the activation of alkaloid biosynthesis necessary for final fatty acid elongation (Figure 9). For tropinone reductase (this enzyme has not been fully investigated, because it does not produce tropane alkaloids), we have observed negligible activity in evaluated apple red-fleshed fruits (Figure 9). This seems to be related to apple browning, caused by polyphenol oxidase (PPO) enzymes [94]. This mechanism was not observed in red-fleshed apples, underlining that red-fleshed fruits do not brown. However, this mechanism must be further investigated.
In this study, we have identified a new set of genes underlying the degree of relatedness between anthocyanin accumulation and cutin formation in the skin of ripe apple fruits.
Our results, for the first time, postulate that the fatty acid degradation process initiates in the flesh of apple fruits and depends on the relationship between anthocyanin content (which cover the color of the fruit’s flesh) and the activity of the genes regulating lipid and wax metabolism. This sheds new light on the mechanism involved, also accounting for apple storage stability. These findings suggest that red-fleshed fruits tolerate long-term storage conditions much less well than white-fleshed fruits.
Moreover, the genes identified in this study may provide a basis for developing functional molecular markers for flesh color corresponding to cuticle appearance in apples. They can also be used to monitor the studied traits and to select the most favorable new apple pre-breeding materials via marker-assisted selection (MAS).

4. Materials and Methods

4.1. Plant Material

For the RNA-seq experiment, ripe apple fruits of the red-fleshed ‘Trinity’ and white-fleshed ‘Free Redstar’ cultivars (minimum of 3 fruits per cv.) were collected from trees cultivated in an experimental orchard of the National Institute of Horticultural Research, Poland. Flesh disks (from peeled fruit), with a diameter of 2 cm and a depth of 1 cm, were dissected with a sterile blade. The samples were placed into liquid nitrogen and stored at −80 °C until RNA extraction.
The phenotypical assessment and validation of gene expression profiles was performed on a set of ten of the most perspective apple seedlings, derived via the cross-pollination of ‘Trinity’ and ‘Free Redstar’ cultivars (breeding program 2023). This set included the following genotypes: 40, 44, 48, 72, 77, 84, 103, 126, 141 and 154 (the visualization of fruit flesh color is presented in Supplementary Figure S12). For the gene expression validation of ‘Free Redstar’, a control white-fleshed fruit (flesh pigmentation control) was used.
In total, 12 fruits collected from each hybrid genotype, as well as parental forms, representing different flesh pigmentation levels resulted from trait segregation and variable anthocyanin distribution in fruit flesh.
Two collected fruits per apple genotype were used for molecular analysis, and ten fruits per apple genotype were used for phenotypical characterization. All samples were immediately placed in liquid nitrogen and stored at −80 °C until analysis.

4.2. RNA Extraction

Total RNA from collected fruits (Section 4.1) was isolated, according to the manufacturer’s protocol, using the automated King Fisher Duo Prime station (Thermofisher Scientific, Life Technologies, Singapore) and the MaMax Plant RNA Isolation Kit (Applied Biosystems, Waltham, MA, USA) with magnetic binding beads (supplied with the kit). The removal of DNA residues in RNA preparates was performed with DNase I using the Turbo DNA-free kit (Thermo Fisher Scientific, Waltham, MA, USA). The concentration and integration of isolated RNA molecules were performed using a Bioanalyzer Agilent 2100 and Expert 2100 software (Agilent Technologies, Santa Clara, CA, USA).

4.3. Transcriptome Sequencing and Differential Expression Analysis

Transcriptome sequencing was performed by Genomed S.A. (Warsaw, Poland) using the Illumina NovaSeq 500 platform, generating 150 bp paired-end reads. Initial bioinformatic processing included quality assessment with FastQC v0.11.9 and adapter trimming using Cutadapt v3.4 (quality threshold ‘q = 25’; minimum read length ‘m = 15’). Reads shorter than 20 bp were discarded after trimming to ensure compatibility with downstream alignment. Reads were aligned to the Malus domestica ‘Golden Delicious’ reference genome assembly version ASM211411v1 (https://www.ncbi.nlm.nih.gov/data-hub/genome/GCF_002114115.1/ accessed on 6 April 2025) using HISAT2 v2.2.1 with the ‘--rna-strandness RF’ option for stranded data. Gene-level quantification was performed with HTSeq using the ‘--stranded = reverse’ parameter. Differential expression analysis comparing the ‘Free Redstar’ and ‘Trinity’ cultivars was performed using DESeq2 v1.38.3 in R v4.2.1. Genes with a p < 0.05 and absolute log2 fold change > 1 were considered to be differentially expressed. Downstream analyses, including quality control, DEG identification and visualization with EnhancedVolcano v1.14.0, were implemented through custom R scripts.

4.4. Gene Annotation, GO and KEGG Enrichment Analyses

Functional annotation and gene model refinement were performed using AGAT v0.5.1 for GTF/GFF processing and unique feature ID assignment, and gffread v0.12 was used for file conversion and sequence extraction. Transcript-to-gene mappings were generated using the R package txdbmaker (Bioconductor v. 3.22) from GTF files. Protein sequences extracted from the genome annotations were screened and functionally annotated using multiple resources: NCBI (gene_info, gene2go files downloaded 1 July 2025), InterProScan v5.59-91.0 for domain identification and Gene Ontology (GO) term assignment, Pfam-A database (via hmmscan) for protein family detection and EggNOG mapper with the Viridiplantae taxonomic scope for orthology and functional annotation. KEGG pathway analysis was performed using KEGGREST for identifier mapping and Pathview v1.48.0 for pathway visualization incorporating log2 fold change information. The annotations used merged GO term sources and functional keywords across description, KEGG_Pathway and GO_terms columns to classify genes into major biological categories, including metabolism, signaling, development, DNA repair and stress response.
All downstream enrichment, visualization and figure production stages were carried out in R v4.2.1 utilizing clusterProfiler v4.16.0, GO.db v3.21.0, enrichplot v1.28.4, EnhancedVolcano, KEGGREST v1.48.1, pathview v1.48.0, ggplot2 v3.4.0, p-heatmap and ComplexHeatmap v2.12.1 to ensure reproducibility and publication quality.
Raw sequence data are available in the NCBI Sequence Read Archive (SRA) under BioProject accession PRJNA1339032.

4.5. cDNA Synthesis and qPCR Tests

Three independent fruits from each selected apple seedling were collected for total RNA (1 µg) isolation, as described in Section 4.2. The concentration and integration of isolated RNA molecules was calculated using Bioanalyzer Agilent 2100 and Expert 2100 software (Agilent Technologies, Santa Clara, CA, USA); then, the obtained RNA preparations were reverse-transcribed into cDNA using the AffinityScript QPCR cDNASynthesis Kit (Agilent, Santa Clara, CA, USA). The reverse transcription reaction, with the universal oligo-dT primer and reverse transcriptase (RT), was carried out under optimized thermal conditions, i.e., 25 °C for 5 min, 42 °C for 5 min (oligo-dT annealing), 55 °C for 15 min (reverse transcription) and 95 °C for 5 min (enzyme inactivation), using a Biometra Basic thermocycler (Biometra, Göttingen, Germany). The expression profiles of selected differentially expressed genes were estimated via qPCR tests performed with specific oligonucleotides designed within the study (Primer3plus software (https://www.bioinformatics.nl/cgi-bin/primer3plus/primer3plus.cgi, accessed on 20 June 2024)). Gene-encoding ACTIN [95] was used as a qPCR data normalizer (Table 3).
QPCRs were performed using SYBR Green fluorescent dye (Kapa SYBR qPCR kit, KapaBiosystems, San Francisco, CA, USA) through a RotorGen 6000 thermal cycler (Corbett Research, Sydney, Australia). Two pairs of specific primers, complementary to the selected target DEGs, were used in analogous reactions. The cDNA template was prepared in dilutions of the estimated concentrations, enabling the preparation of a standard amplification reaction curve. The thermal profile of a single qPCR was as follows: 95 °C for 5 min (polymerase activation), followed 40 cycles including the following steps: 95 °C for 15 s (denaturation), 60 °C for 20 s (oligonucleotide annealing) and 72 °C for 20 s (fluorescence level detection). Relative expression (fold change), normalized with regard to ACTIN, was determined using Rotor-Gene 6000 Series Software 1.7 (Corbett Research, Sydney, Australia) based on single-data-point amplification curve threshold cycles (Ct values) (2−∆∆Ct) [96]. The average value of relative expression was normalized to the white-fleshed fruit control ‘Free Redstar’ cultivar. The standard errors of the mean ± SEM and t-significance at p < 0.05, p < 0.01, p < 0.001 and p < 0.0001 between the ‘Free Redstar’ and red-fleshed cultivars were calculated separately (GraphPad Prism 10.0.3, Dotmatics, Boston, MA, USA). Relative fold change diagrams for each gene were drawn using GraphPad Prism 10.0.3.

4.6. Anthocyanin Measurements and Fruit Phenotypical Assessment

Ten peeled fruit samples (5 g of fresh mass) for each selected apple genotype (which differ in accordance with flesh coloration) were collected for total anthocyanin concentration measurements. For this purpose, the pH differential method [97,98] was used.
The fresh samples ground in liquid nitrogen were moisturized with 20 mL of pH 1.0 (25 mM KCl and 0.1 M HCl) and pH 4.5 (0.4 M CH3COONa) buffers, incubated for 20 min at room temperature and then centrifuged (7000 rpm) at 4 °C for 15 min. The absorbance of the fractionated supernatant was read at 520 and 700 nm using the spectrophotometer VIS V500 (BioSens, Warsaw, Poland). The total anthocyanin concentration (TAC) was calculated via the following formula: TAC = A   V M . Here, A = (A520 nm − A700 nm), with pH 1.0 (A520 nm–A700 nm) to pH 4.5; V = volume of extract (mL, total volume 25 mL); and M = mass of the sample (g). The calculation of anthocyanin concentrations was based on a cyanidin-3-glucoside standard solution (molar extinction coefficient = 25.965 cm−1; molecular weight = 449.2 g mol−1). The results were expressed as mg of cyaniding-3-glucoside equivalents per 100 mL of sample supernatant.

4.7. Statistical Analysis

Phenotype–genotype associations between anthocyanin content and candidate gene expression were computed via GraphPad Prism v10.0.3 using Pearson’s r. Differences in anthocyanin content were tested through two-way ANOVA with appropriate post hoc comparisons. Simple linear regression summarized dose–response trends where applicable.
Differential expression. HTSeq gene counts were analyzed using DESeq2 v1.38.3 (the Wald test). The testing universe comprised all genes retained after independent filtering. DEGs were defined as raw p < 0.05 with |log2FC| > 1. Quality control included PCA, MA and volcano plots.
Functional enrichment (ORA). clusterProfiler was used for GO (BP/CC/MF) and KEGG over-representation with the DESeq2 testing universe. Enrichment was performed at raw p < 0.05 (clusterProfiler pAdjustMethod = “none”). GO resources were integrated from GO.db and InterPro/Pfam; KEGG IDs were mapped using KEGGREST, and pathways were visualized using Pathview (log2FC overlays).
GSEA. Rank-based enrichment (gseGO, gseKEGG) used genes ranked by the DESeq2 Wald statistic; significance was set at a nominal p < 0.05 (default permutations), with normalized enrichment scores reported.
All analyses were performed using R v4.2.1. Figures were generated using ggplot2 v3.4.0, ComplexHeatmap v2.12.1, pheatmap and EnhancedVolcano v1.14.0. Unless stated otherwise, tests were two-sided and statistical significance was assessed at nominal p < 0.05 (unadjusted).

5. Conclusions

Our analysis revealed novel molecular interactions between anthocyanin biosynthesis and wax metabolism pathways in apple fruit flesh. The identification of ten key genes—N3Dioxy, LAR1 and F3Mo (flavonoid pathway); AlcFARed, CER1, PalmTransf and CYP86A4 (wax biosynthesis); and TropRed, CyP865B1 and CytP450 (alkaloid biosynthesis/peroxisome)—provides new insights into the molecular basis of flesh coloration and storage stability relationships.
The identified genes have immediate potential as molecular markers for marker-assisted selection (MAS) in red-fleshed apple breeding programs. Priority should be given to developing functional markers for CER1 and AlcFARed expression levels as predictors of storage stability, as well as the F3Mo/LAR1 ratio as an indicator of flesh color intensity. A combined marker assay should be developed for the simultaneous selection of color and storage traits.
Our findings suggest that red-fleshed varieties’ storage limitations stem from their reduced wax biosynthesis capacity. Future research should focus on developing cultivation practices to enhance CER1 and CYP86A4 expression, investigating postharvest treatments targeting wax metabolism pathways and exploring genetic modification approaches to restore wax biosynthesis in fruits with high-anthocyanin backgrounds.
Successfully addressing storage limitations could unlock significant market potential for red-fleshed apples within functional food sectors. Improved varieties would support sustainable agriculture by providing growers with premium products while delivering enhanced nutritional benefits to consumers.
Future investigations should validate these gene–trait relationships across diverse genetic backgrounds, develop high-throughput screening methods for breeding programs and explore environmental factors influencing the anthocyanin–wax metabolism balance. Integration with genomics-assisted breeding platforms will be essential for applying these molecular insights to commercial cultivar development.

Supplementary Materials

The following supporting information can be downloaded at: https://www.mdpi.com/article/10.3390/ijms262210987/s1.

Author Contributions

The individual contributions of authors were as follows: Conceptualization: S.E.K.-P. and M.L.; methodology, S.E.K.-P., A.W. and M.O.; software, M.O. and S.E.K.-P.; validation, M.O., A.W. and S.E.K.-P.; formal analysis, S.E.K.-P. and M.O.; investigation, S.E.K.-P. and M.O.; resources, M.L. and A.W.; data curation, S.E.K.-P. and M.O.; writing—S.E.K.-P.; writing—review and editing, S.E.K.-P., M.O. and A.W.; visualization, M.O. and S.E.K.-P.; supervision, S.E.K.-P.; project administration, M.L. All authors have read and agreed to the published version of the manuscript.

Funding

This research was funded by the Polish Ministry of Agriculture and Rural Development as part of basic research for biological progress in plant production—Task 50 “Phenotypic and molecular analysis of the selected segregating population of apple to produce genotypes with red flesh and improved resistance to fire blight”.

Institutional Review Board Statement

Not applicable.

Informed Consent Statement

Not applicable.

Data Availability Statement

The original contributions presented in this study are included in the article/Supplementary Materials. Further inquiries can be directed to the corresponding author.

Conflicts of Interest

The authors declare no conflicts of interest.

References

  1. Available online: https://www.fao.org/faostat/en/#search/apple%20fruits (accessed on 3 November 2025).
  2. Keller-Przybylkowicz, S.; Oskiera, M.; Liu, X.; Song, L.; Zhao, L.; Du, X.; Kruczynska, D.; Walencik, A.; Kowara, N.; Bartoszewski, G. Transcriptome Analysis of White- and Red-Fleshed Apple Fruits Uncovered Novel Genes Related to the Regulation of Anthocyanin Biosynthesis. Int. J. Mol. Sci. 2024, 25, 1778. [Google Scholar] [CrossRef] [PubMed]
  3. Chagné, D.; Carlisle, C.M.; Blond, C.; Volz, R.K.; Whitworth, C.J.; Oraguzie, N.C.; Crowhurst, R.N.; Allan, A.C.; Espley, R.V.; Hellens, R.P.; et al. Mapping a candidate gene (MdMYB10) for red flesh and foliage colour in apple. BMC Genom. 2007, 8, 212. [Google Scholar] [CrossRef] [PubMed]
  4. Chagné, D.; Krieger, C.; Rassam, M.; Sullivan, M.; Fraser, J.; André, C.; Pindo, M.; Troggio, M.; Gardiner, S.E.; Henry, R.A.; et al. QTL and candidate gene mapping for polyphenolic composition in apple fruit. BMC Plant Biol. 2012, 12, 12. [Google Scholar] [CrossRef]
  5. Volz, R.K.; Oraguzie, N.; Whitworth, C.J.; How, N.; Chagne, D.; Carlisle, C.M.; Gardiner, S. Red flesh breeding in apple: Progress and challenges. Acta Hortic. 2009, 814, 304–309. [Google Scholar] [CrossRef]
  6. Available online: https://suttonelms.org.uk/apple43.html (accessed on 20 September 2025).
  7. Wang, N.; Xu, H.; Jiang, S.; Zhang, Z.; Lu, N.; Qiu, H.; Qu, C.; Wang, Y.; Wu, S.; Chen, X. MYB12 and MYB22 play essential roles in proanthocyanidin and flavonol synthesis in red-fleshed apple (Malus sieversii f. niedzwetzkyana). Plant J. 2017, 90, 276–292. [Google Scholar] [CrossRef] [PubMed]
  8. Honda, C.; Moriya, S. Anthocyanin Biosynthesis in Apple Fruit. Hortic. J. 2018, 87, 305–314. [Google Scholar] [CrossRef]
  9. Yan, X.F.; Wang, Y.; Li, Y.M. Plant secondary metabolism and its response to environment. Acta Ecol. Sin. 2007, 6, 2554–2562. [Google Scholar]
  10. Espley, R.V.; Hellens, R.P.; Putterill, J.; Stevenson, D.E.; Kutty-Amma, S.; Allan, A.C. Red coloration in apple fruit is due to the activity of the MYB transcription factor, MdMYB10. Plant J. 2007, 49, 414–427. [Google Scholar] [CrossRef]
  11. Yang, W.; Feng, H.; Zhang, X.; Zhang, J.; Doonan, J.H.; Batchelor, W.D.; Xiong, L.; Yan, J. Crop Phenomics and High-Throughput Phenotyping: Past Decades, Current Challenges, and Future Perspectives. Mol. Plant 2020, 13, 187–214. [Google Scholar] [CrossRef]
  12. Chen, Z.; Yu, L.; Liu, W.; Zhang, J.; Wang, N.; Chen, X. Research progress of fruit color development in apple (Malus domestica Borkh.). Plant Physiol. Biochem. 2021, 162, 267–279. [Google Scholar] [CrossRef]
  13. Pinheiro, T.T.; Nishimura, D.S.; De Nadai, F.B.; Figueira, A.; Latado, R.R. Selection of reference genes for expression analyses of red-fleshed sweet orange (Citrus sinensis). Genet. Mol. Res. 2015, 14, 18440–18451. [Google Scholar] [CrossRef]
  14. Rumainum, I.; Worarad, K.; Yamaki, Y.; Yamane, K. Effects of Developmental Stages, Light, and an Auxin Polar Transport Inhibitor on the Skin and Flesh Pigmentation of Red-fleshed Peach Fruit. Hortic. J. 2016, 85, 141–147. [Google Scholar] [CrossRef]
  15. Brooks, R.M.; Olmo, H.P. The Brooks and Olmo Register of Fruit & Nut Varieties, 3rd ed.; ASHS Press: Alexandria, VA, USA, 1997. [Google Scholar]
  16. Sadilova, E.; Stintzing, F.C.; Carle, R. Anthocyanins, colour and antioxidant properties of eggplant (Solanum melongena L.) and violet pepper (Capsicum annuum L.) peel extracts. Naturforsch. C J. Biosci. 2006, 6, 527–535. [Google Scholar] [CrossRef]
  17. Sekido, K.; Hayashi, Y.; Yamada, K.; Shiratake, K.; Matsumoto, S.; Maejima, T.; Komatsu, H. Efficient Breeding System for Red-fleshed Apple Based on Linkage with S3-RNase Allele in ‘Pink Pearl’. HortScience 2010, 45, 534–537. [Google Scholar] [CrossRef]
  18. Wang, N.; Qu, C.; Jiang, S.; Chen, Z.; Xu, H.; Fang, H.; Su, M.; Zhang, J.; Wang, Y.; Liu, W.; et al. The proanthocyanidin-specific transcription factor MdMYBPA1 initiates anthocyanin synthesis under low-temperature conditions in red-fleshed apples. Plant J. 2018, 96, 39–55. [Google Scholar] [CrossRef]
  19. Wang, N.; Liu, W.; Zhang, T.; Jiang, S.; Xu, H.; Wang, Y.; Zhang, Z.; Wang, C.; Chen, X. Transcriptomic Analysis of Red-Fleshed Apples Reveals the Novel Role of MdWRKY11 in Flavonoid and Anthocyanin Biosynthesis. J. Agric. Food Chem. 2018, 66, 7076–7086. [Google Scholar] [CrossRef] [PubMed]
  20. Wang, N.; Jiang, S.; Zhang, Z.; Fang, H.; Xu, H.; Wang, Y.; Chen, X. Malus sieversii: The origin, flavonoid synthesis mechanism, and breeding of red-skinned and red-fleshed apples. Hortic. Res. 2018, 5, 70. [Google Scholar] [CrossRef]
  21. Wang, N.; Chen, X. Genetics and genomics of fruit color development in apple. In The Apple Genome; Korban, S.S., Ed.; Springer International Publishing: Cham, Switzerland, 2021; pp. 271–295. [Google Scholar]
  22. Duan, X.; Wang, K.; Tang, R.; Liu, J.; Cheng, K.; Gao, G.; Wang, Y.; Qin, G. Recent advances in biosynthesis and regulation of strawberry anthocyanins. Hortic. Res. 2025, 12, uhaf135. [Google Scholar] [CrossRef]
  23. Sun, P.; Yang, C.; Zhu, W.; Wu, J.; Lin, X.; Wang, Y.; Zhu, J.; Chen, C.; Zhou, K.; Qian, M.; et al. Metabolome, Plant Hormone, and Transcriptome Analyses Reveal the Mechanism of Spatial Accumulation Pattern of Anthocyanins in Peach Flesh. Foods 2023, 12, 2297. [Google Scholar] [CrossRef] [PubMed]
  24. Zhao, Y.; Sun, J.; Cherono, S.; An, J.P.; Allan, A.C.; Han, Y. Colorful hues: Insight into the mechanisms of anthocyanin pigmentation in fruit. Plant Physiol. 2023, 192, 1718–1732. [Google Scholar] [CrossRef] [PubMed]
  25. Heredia-Guerrero, J.A.; Domínguez, E. CHS silencing suggests a negative cross-talk between wax and flavonoid pathways in tomato fruit cuticle. Plant Signal. Behav. 2015, 10, 1019979. [Google Scholar] [CrossRef]
  26. Hu, Y.; Šmarda, P.; Liu, G.; Wang, B.; Gao, X.; Guo, Q. High-Depth Transcriptome Reveals Differences in Natural Haploid Ginkgo biloba L. Due to the Effect of Reduced Gene Dosage. Int. J. Mol. Sci. 2022, 23, 8958. [Google Scholar] [CrossRef]
  27. Honda, C.; Kotoda, N.; Wada, M.; Kondo, S.; Kobayashi, S.; Soejima, J.; Zhang, Z.; Tsuda, T.; Moriguchi, T. Anthocyanin biosynthetic genes are coordinately expressed during red coloration in apple skin. Plant Physiol. Biochem. 2002, 40, 955–962. [Google Scholar] [CrossRef]
  28. Bouillon, P.; Belin, E.; Fanciullino, A.L.; Balzergue, S.; Hanteville, S.; Letekoma, Y.; Cournol, M.; Faris, F.; Bouanich, A.; Bréard, D.; et al. Fade into you: Genetic control of pigmentation patterns in red-flesh apple (Malus domestica). Front. Plant Sci. 2025, 15, 1462545. [Google Scholar] [CrossRef]
  29. Zhao, D.; Tao, J.; Han, C.; Ge, J. Flower color diversity revealed by differential expression of flavonoid biosynthetic genes and flavonoid accumulation in herbaceous peony (Paeonia lactiflora Pall.). Mol. Biol. Rep. 2012, 39, 11263–11275. [Google Scholar] [CrossRef] [PubMed]
  30. Zhang, T.; Li, B.; Wang, Z.; Hu, D.; Zhang, X.; Zhao, B.; Wang, J. Green biosynthesis of rare DHA-phospholipids by lipase-catalyzed transesterification with edible algal oil in solvent-free system and catalytic mechanism study. Front. Bioeng. Biotechnol. 2023, 11, 1158348. [Google Scholar] [CrossRef]
  31. Espley, R.V.; Bovy, A.; Bava, C.; Jaeger, S.R.; Tomes, S.; Norling, C.; Crawford, J.; Rowan, D.; McGhie, T.K.; Brendolise, C.; et al. Analysis of genetically modified red-fleshed apples reveals effects on growth and consumer attributes. Plant Biotechnol. J. 2013, 11, 408–419. [Google Scholar] [CrossRef]
  32. Chen, C.; Li, H.; Zhang, D.; Li, P.; Ma, F. The role of anthocyanin in photoprotection and its relationship with the xanthophyll cycle and the antioxidant system in apple peel depends on the light conditions. Physiol. Plant. 2013, 149, 354–366. [Google Scholar] [CrossRef] [PubMed]
  33. Hernandez, J.M.; Heine, G.F.; Irani, N.G.; Feller, A.; Kim, M.G.; Matulnik, T.; Chandler, V.L.; Grotewold, E. Different mechanisms participate in the R-dependent activity of the R2R3 MYB transcription factor C1. J. Biol. Chem. 2004, 279, 48205–48213. [Google Scholar] [CrossRef] [PubMed]
  34. Baudry, A.; Heim, M.A.; Dubreucq, B.; Caboche, M.; Weisshaar, B.; Lepiniec, L. TT2, TT8, and TTG1 synergistically specify the expression of BANYULS and proanthocyanidin biosynthesis in Arabidopsis thaliana. Plant J. 2004, 39, 366–380. [Google Scholar] [CrossRef]
  35. Ramsay, N.A.; Glover, B.J. MYB-bHLH-WD40 protein complex and the evolution of cellular diversity. Trends Plant Sci. 2005, 10, 63–70. [Google Scholar] [CrossRef]
  36. Davies, K.M.; Schwinn, K.E.; Deroles, S.C.; Manson, D.G.; Lewis, D.H.; Bloor, S.J.; Bradley, J.M. Enhancing anthocyanin production by altering competition for substrate between flavonol synthase and dihydroflavonol 4-reductase. Euphytica 2003, 131, 259–268. [Google Scholar] [CrossRef]
  37. Winkel-Shirley, B. Biosynthesis of flavonoids and effects of stress. Curr. Opin. Plant Biol. 2002, 5, 218–223. [Google Scholar] [CrossRef]
  38. Takos, A.M.; Jaffé, F.W.; Jacob, S.R.; Bogs, J.; Robinson, S.P.; Walker, A.R. Light-induced expression of a MYB gene regulates anthocyanin biosynthesis in red apples. Plant Physiol. 2006, 142, 1216–1232. [Google Scholar] [CrossRef]
  39. Smeekens, S. Sugar-induced signal transduction in plants. Annu. Rev. Plant Physiol. Plant Mol. Biol. 2000, 51, 49–81. [Google Scholar] [CrossRef]
  40. Supriya, L.; Deepika, D.; Nyanthanglo, W.; Prodosh, G.; Kodetham, G.; Gudipalli, P.; Mehanathan, M. Sugar sensors in plants: Orchestrators of growth, stress tolerance, and hormonal crosstalk. J. Plant Physiol. 2025, 307, 154471. [Google Scholar] [CrossRef]
  41. Dooner, H.K.; Robbins, T.P.; Jorgensen, R.A. Genetic and developmental control of anthocyanin biosynthesis. Annu. Rev. Genet. 1991, 25, 173–199. [Google Scholar] [CrossRef] [PubMed]
  42. Holton, T.A.; Cornish, E.C. Genetics and Biochemistry of Anthocyanin Biosynthesis. Plant Cell 1995, 7, 1071–1083. [Google Scholar] [CrossRef] [PubMed]
  43. Vogt, T.; Jones, P. Glycosyltransferases in plant natural product synthesis: Characterization of a supergene family. Trends Plant Sci. 2000, 5, 380–386. [Google Scholar] [CrossRef]
  44. Lloyd, J.C.; Zakhleniuk, O.V. Responses of primary and secondary metabolism to sugar accumulation revealed by microarray expression analysis of the Arabidopsis mutant, pho3. J. Exp. Bot. 2004, 55, 1221–1230. [Google Scholar] [CrossRef]
  45. Teng, S.; Keurentjes, J.; Bentsink, L.; Koornneef, M.; Smeekens, S. Sucrose-specific induction of anthocyanin biosynthesis in Arabidopsis requires the MYB75/PAP1 gene. Plant Physiol. 2005, 139, 1840–1852. [Google Scholar] [CrossRef]
  46. Solfanelli, C.; Poggi, A.; Loreti, E.; Alpi, A.; Perata, P. Sucrose-specific induction of the anthocyanin biosynthetic pathway in Arabidopsis. Plant Physiol. 2006, 140, 637–646. [Google Scholar] [CrossRef]
  47. Maier, A.; Schrader, A.; Kokkelink, L.; Falke, C.; Welter, B.; Iniesto, E.; Rubio, V.; Uhrig, J.F.; Hülskamp, M.; Hoecker, U. Light and the E3 ubiquitin ligase COP1/SPA control the protein stability of the MYB transcription factors PAP1 and PAP2 involved in anthocyanin accumulation in Arabidopsis. Plant J. 2013, 74, 638–651. [Google Scholar] [CrossRef]
  48. Sivitz, A.B.; Reinders, A.; Ward, J.M. Arabidopsis sucrose transporter AtSUC1 is important for pollen germination and sucrose-induced anthocyanin accumulation. Plant Physiol. 2008, 147, 92–100. [Google Scholar] [CrossRef] [PubMed]
  49. Hu, D.G.; Sun, C.H.; Zhang, Q.Y.; An, J.P.; You, C.X.; Hao, Y.J. Glucose Sensor MdHXK1 Phosphorylates and Stabilizes MdbHLH3 to Promote Anthocyanin Biosynthesis in Apple. PLoS Genet. 2016, 12, e1006273. [Google Scholar] [CrossRef] [PubMed]
  50. Mieszczakowska-Frąc, M.; Buczek, M.; Kruczyńska, D.; Markowski, J. Cloudy red-fleshed apple juice production and quality. Pol. J. Nat. Sci. 2015, 30, 59–72. [Google Scholar]
  51. Trivedi, P.; Nguyen, N.; Hykkerud, A.L.; Häggman, H.; Martinussen, I.; Jaakola Land Karppinen, K. Developmental and Environmental Regulation of Cuticular Wax Biosynthesis in Fleshy. Fruits Front. Plant Sci. 2019, 10, 431. [Google Scholar] [CrossRef]
  52. Arrieta-Baez, D.; Perea-Flores, M.J.; Méndez-Méndez, J.; Mendoza, H.; Gómez-Patiño, M. Structural Studies of the Cutin from Two Apple Varieties: Golden Delicious and Red Delicious (Malus domestica). Molecules 2020, 25, 5955. [Google Scholar] [CrossRef]
  53. Fatland, B.L.; Nikolau, B.J.; Wurtele, E.S. Reverse Genetic Characterization of Cytosolic Acetyl-CoA Generation by ATP-Citrate Lyase in Arabidopsis. Plant Cell 2005, 17, 182–203. [Google Scholar] [CrossRef]
  54. Schwender, J.; Shachar-Hill, Y.; Ohlrogge, J.B. Mitochondrial metabolism in developing embryos of Brassica napus. J. Biol. Chem. 2006, 281, 34040–34047. [Google Scholar] [CrossRef]
  55. Sweetlove, L.J.; Beard, K.F.; Nunes-Nesi, A.; Fernie, A.R.; Ratcliffe, R.G. Not just a circle: Flux modes in the plant TCA cycle. Trends Plant Sci. 2010, 15, 462–470. [Google Scholar] [CrossRef]
  56. Akram, M. Citric Acid Cycle and Role of its Intermediates in Metabolism. Cell Biochem. Biophys. 2014, 68, 475–478. [Google Scholar] [CrossRef]
  57. Zhang, Y.; Fernie, A.R. On the role of the tricarboxylic acid cycle in plant productivity. J. Integr. Plant Biol. 2018, 60, 1199–1216. [Google Scholar] [CrossRef]
  58. Liu, Y.; Xu, R.; Gu, H.; Zhang, E.; Qu, J.; Cao, W.; Huang, X.; Yan, H.; He, J.; Cai, Z. Metabolic reprogramming in macrophage responses. Biomark. Res. 2021, 9, 1. [Google Scholar] [CrossRef]
  59. Proels, R.K.; Hückelhoven, R. Cell-wall invertases, key enzymes in the modulation of plant metabolism during defence responses. Mol. Plant Pathol. 2014, 15, 858–864. [Google Scholar] [CrossRef]
  60. Vallarino, J.G.; Yeats, T.H.; Maximova, E.; Rose, J.K.; Fernie, A.R.; Osorio, S. Postharvest changes in LIN5-down-regulated plants suggest a role for sugar deficiency in cuticle metabolism during ripening. Phytochemistry 2017, 142, 11–20. [Google Scholar] [CrossRef]
  61. Min, D.; Li, F.; Wang, J.; Fu, X.; Ali, M.; Song, Y.; Ding, J.; Li, X.; Li, M.; Yang, K.; et al. Transcriptome reveals insights into the regulatory mechanism of cuticular wax synthesis in developing apple fruit. Sci. Hortic. 2024, 328, 112891. [Google Scholar] [CrossRef]
  62. Zhao, Y.-W.; Wang, C.-K.; Huang, X.-Y.; Hu, D.-G. Genome-Wide Analysis of the Glutathione S-Transferase (GST) Genes and Functional Identification of MdGSTU12 Reveals the Involvement in the Regulation of Anthocyanin Accumulation in Apple. Genes 2021, 12, 1733. [Google Scholar] [CrossRef] [PubMed]
  63. Lu, Z.H.; Cao, H.H.; Pan, L.; Niu, L.; Wei, B.; Cui, G.C.; Wang, L.W.; Yao, J.L.; Zeng, W.F.; Wang, Z.Q. Two loss-of-function alleles of the glutathione S-transferase (GST) gene cause anthocyanin deficiency in flower and fruit skin of peach (Prunus persica). Plant J. 2021, 107, 1320–1331. [Google Scholar] [CrossRef] [PubMed]
  64. Xiang, Y.; Huang, X.Y.; Zhao, Y.W.; Wang, C.K.; Sun, Q.; Hu, D.G. Role of an ATP-binding cassette (ABC) transporter MdABCI17 in the anthocyanin accumulation of apple. Sci. Hortic. 2024, 323, 112502. [Google Scholar] [CrossRef]
  65. Zhang, X.; Liu, Y.; Ayaz, A.; Zhao, H.; Lü, S. The Plant Fatty Acyl Reductases. Int. J. Mol. Sci. 2022, 23, 16156. [Google Scholar] [CrossRef]
  66. Buhrman, K.; Aravena-Calvo, J.; Ross Zaulich, C.; Hinz, K.; Laursen, T. Anthocyanic Vacuolar Inclusions: From Biosynthesis to Storage and Possible Applications. Front. Chem. 2022, 10, 913324. [Google Scholar] [CrossRef]
  67. Kondo, S.; Hiraoka, K.; Kobayashi, S.; Honda, C.; Terahara, N. Changes in the expression of anthocyanin biosynthetic genes during apple development. J. Am. Soc. Hortic. Sci. 2002, 127, 971–997. [Google Scholar] [CrossRef]
  68. Bogs, J.; Ebadi, A.; McDavid, D.; Robinson, S.P. Identification of the flavonoid hydroxylases from grapevine and their regulation during fruit development. Plant Physiol. 2006, 140, 279–291. [Google Scholar] [CrossRef]
  69. Han, Y.; Vimolmangkang, S.; Soria-Guerra, R.E.; Rosales-Mendoza, S.; Zheng, D.; Lygin, A.V.; Korban, S.S. Ectopic expression of apple F3′H genes contributes to anthocyanin accumulation in the Arabidopsis tt7 mutant grown under nitrogen stress. Plant Physiol. 2010, 153, 806–820. [Google Scholar] [CrossRef]
  70. Huo, W.; Liu, S.; Chen, X.; Gu, T.; Wang, Z.; Xu, X.; Liu, D.; Zhang, Y.; Jiang, S. Combined analysis of lncRNAs and mRNAs associated with coloration and wax formation during ‘Fumei’ Apple development. BMC Plant Biol. 2025, 25, 498. [Google Scholar] [CrossRef] [PubMed]
  71. Abrahams, S.; Lee, E.; Walker, A.R.; Tanner, G.J.; Larkin, P.J.; Ashton, A.R. The Arabidopsis TDS4 gene encodes leucoanthocyanidin dioxygenase (LDOX) and is essential for proanthocyanidin synthesis and vacuole development. Plant J. 2003, 35, 624–636. [Google Scholar] [CrossRef]
  72. Tanner, G.J.; Francki, K.T.; Abrahams, S.; Watson, J.M.; Larkin, P.J.; Ashton, A. Proanthocyanidin biosynthesis in plants. Purification of legume leucoanthocyanidin reductase and molecular cloning of its cDNA. J. Biol. Chem. 2003, 278, 31647–33156. [Google Scholar] [CrossRef]
  73. Liao, L.; Vimolmangkang, S.; Wei, G.; Zhou, H.; Korban, S.S.; Han, Y. Molecular characterization of genes encoding leucoanthocyanidin reductase involved in proanthocyanidin biosynthesis in apple. Front. Plant Sci. 2015, 6, 243. [Google Scholar] [CrossRef]
  74. Li, H.; Tian, J.; Yao, Y.Y.; Zhang, J.; Song, T.T.; Li, K.T.; Yao, Y.C. Identification of leucoanthocyanidin reductase and anthocyanidin reductase genes involved in proanthocyanidin biosynthesis in Malus crabapple plants. Plant Physiol. Biochem. 2019, 139, 141–151. [Google Scholar] [CrossRef] [PubMed]
  75. Samuels, L.; Kunst, L.; Jetter, R. Sealing plant surfaces: Cuticular wax formation by epidermal cells. Annu. Rev. Plant Biol. 2008, 59, 683–707. [Google Scholar] [CrossRef]
  76. Wu, W.; Jiang, B.; Liu, R.; Han, Y.; Fang, X.; Mu, H.; Farag, M.A.; Simal-Gandara, J.; Prieto, M.A.; Chen, H.; et al. Structures and Functions of Cuticular Wax in Postharvest Fruit and Its Regulation: A Comprehensive Review with Future Perspectives. Engineering 2023, 23, 118–129. [Google Scholar] [CrossRef]
  77. Zhang, X.; Liu, T.; Zhu, S.; Wang, D.; Sun, S.; Xin, L. Short-term hypobaric treatment alleviates chilling injury by regulating membrane fatty acids metabolism in peach fruit. J. Food Biochem. 2022, 46, 14113. [Google Scholar] [CrossRef]
  78. Höfer, R.; Briesen, I.; Beck, M.; Pinot, F.; Schreiber, L.; Franke, R. The Arabidopsis cytochrome P450 CYP86A1 encodes a fatty acid omega-hydroxylase involved in suberin monomer biosynthesis. J. Exp. Bot. 2008, 59, 2347–2360. [Google Scholar] [CrossRef]
  79. Thimmappa, R.; Geisler, K.; Louveau, T.; O’Maille, P.; Osbourn, A. Triterpene biosynthesis in plants. Annu. Rev. Plant Biol. 2014, 65, 225–257. [Google Scholar] [CrossRef]
  80. Pascal, S.; Bernard, A.; Sorel, M.; Pervent, M.; Vile, D.; Haslam, R.P.; Napier, J.A.; Lessire, R.; Domergue, F.; Joubès, J. The Arabidopsis cer26 mutant, like the cer2 mutant, is specifically affected in the very long chain fatty acid elongation process. Plant J. 2013, 73, 733–746. [Google Scholar] [CrossRef]
  81. Leide, J.; Hildebrandt, U.; Reussing, K.; Riederer, M.; Vogg, G. The developmental pattern of tomato fruit wax accumulation and its impact on cuticular transpiration barrier properties: Effects of a deficiency in a beta-ketoacyl-coenzyme A synthase (LeCER6). Plant Physiol. 2007, 144, 1667–1679. [Google Scholar] [CrossRef] [PubMed]
  82. Alkio, M.; Jonas, U.; Sprink, T.; van Nocker, S.; Knoche, M. Identification of putative candidate genes involved in cuticle formation in Prunus avium (sweet cherry) fruit. Ann. Bot. 2012, 110, 101–112. [Google Scholar] [CrossRef] [PubMed]
  83. Wang, J.; Hao, H.; Liu, R.; Ma, Q.; Xu, J.; Chen, F.; Cheng, Y.; Deng, X. Comparative analysis of surface wax in mature fruits between Satsuma mandarin (Citrus unshiu) and ‘Newhall’ navel orange (Citrus sinensis) from the perspective of crystal morphology, chemical composition and key gene expression. Food Chem. 2014, 153, 177–185. [Google Scholar] [CrossRef]
  84. Rowland, O.; Domergue, F. Plant fatty acyl reductases: Enzymes generating fatty alcohols for protective layers with potential for industrial applications. Plant Sci. 2012, 193, 28–38. [Google Scholar] [CrossRef] [PubMed]
  85. Chai, G.; Li, C.; Xu, F.; Li, Y.; Shi, X.; Wang, Y.; Wang, Z. Three endoplasmic reticulum-associated fatty acyl-coenzyme a reductases were involved in the production of primary alcohols in hexaploid wheat (Triticum aestivum L.). BMC Plant Biol. 2017, 18, 41. [Google Scholar] [CrossRef]
  86. Liu, H.; Liu, Z.; Wu, Y.; Zheng, L.; Zhang, G. Regulatory Mechanisms of Anthocyanin Biosynthesis in Apple and Pear. Int. J. Mol. Sci. 2021, 22, 8441. [Google Scholar] [CrossRef]
  87. Deng, Y.; Lu, S. Biosynthesis and Regulation of Phenylpropanoids in Plants. Crit. Rev. Plant Sci. 2017, 36, 257–290. [Google Scholar] [CrossRef]
  88. Tang, C.; Yang, M.; Fang, Y.; Luo, Y.; Gao, S.; Xiao, X.; An, Z.; Zhou, B.; Zhang, B.; Tan, X.; et al. The rubber tree genome reveals new insights into rubber production and species adaptation. Nat. Plants 2016, 2, 16073. [Google Scholar] [CrossRef]
  89. Schuler, M.A.; Werck-Reichhart, D. Functional genomics of P450s. Annu. Rev. Plant Biol. 2003, 54, 629–667. [Google Scholar] [CrossRef] [PubMed]
  90. Chakraborty, P.; Biswas, A.; Dey, S.; Bhattacharjee, T.; Chakrabarty, S. Cytochrome P450 Gene Families: Role in Plant Secondary Metabolites Production and Plant Defense. J. Xenobiot. 2023, 13, 402–423. [Google Scholar] [CrossRef]
  91. Ayabe, S.; Akashi, T. Cytochrome P450s in flavonoid metabolism. Phytochem. Rev. 2006, 5, 271–282. [Google Scholar] [CrossRef]
  92. Hu, X.; Liu, W.; Yan, Y.; Deng, H.; Cai, Y. Tropinone reductase: A comprehensive review on its role as the key enzyme in tropane alkaloids biosynthesis. Int. J. Biol. Macromol. 2023, 253, 127377. [Google Scholar] [CrossRef] [PubMed]
  93. Bedewitz, M.A.; Jones, A.D.; D’Auria, J.C.; Barry, C.S. Tropinone synthesis via an atypical polyketide synthase and P450-mediated cyclization. Nat. Commun. 2018, 9, 5281. [Google Scholar] [CrossRef] [PubMed]
  94. Dräger, B. Tropinone reductases, enzymes at the branch point of tropane alkaloid metabolism. Phytochemistry 2006, 67, 327–337. [Google Scholar] [CrossRef] [PubMed]
  95. Xu, H.; Wang, N.; Liu, J.; Qu, C.; Wang, Y.; Jiang, S.; Lu, N.; Wang, D.; Zhang, Z.; Chen, X. The molecular mechanism underlying anthocyanin metabolism in apple using the MdMYB16 and MdbHLH33 genes. Plant Mol. Biol. 2017, 94, 149–165. [Google Scholar] [CrossRef] [PubMed]
  96. Livak, K.J.; Schmittgen, T.D. Analysis of relative gene expression data using real-time quantitative PCR and the 2(-Delta DeltaC(T)). Method. Methods 2001, 25, 402–408. [Google Scholar] [CrossRef] [PubMed]
  97. Lee, J.; Durst, R.W.; Wrolstad, R.E. Determination of total monomeric anthocyanin pigment content of fruit juices, beverages, natural colorants, and wines by the pH differential method: Collaborative study. J. AOAC Int. 2005, 88, 1269–1278. [Google Scholar] [CrossRef]
  98. Taghavi, T.; Patel, H.; Rafie, R. Comparing pH differential and methanol-based methods for anthocyanin assessments of strawberries. Food Sci. Nutr. 2021, 10, 2123–2131. [Google Scholar] [CrossRef] [PubMed]
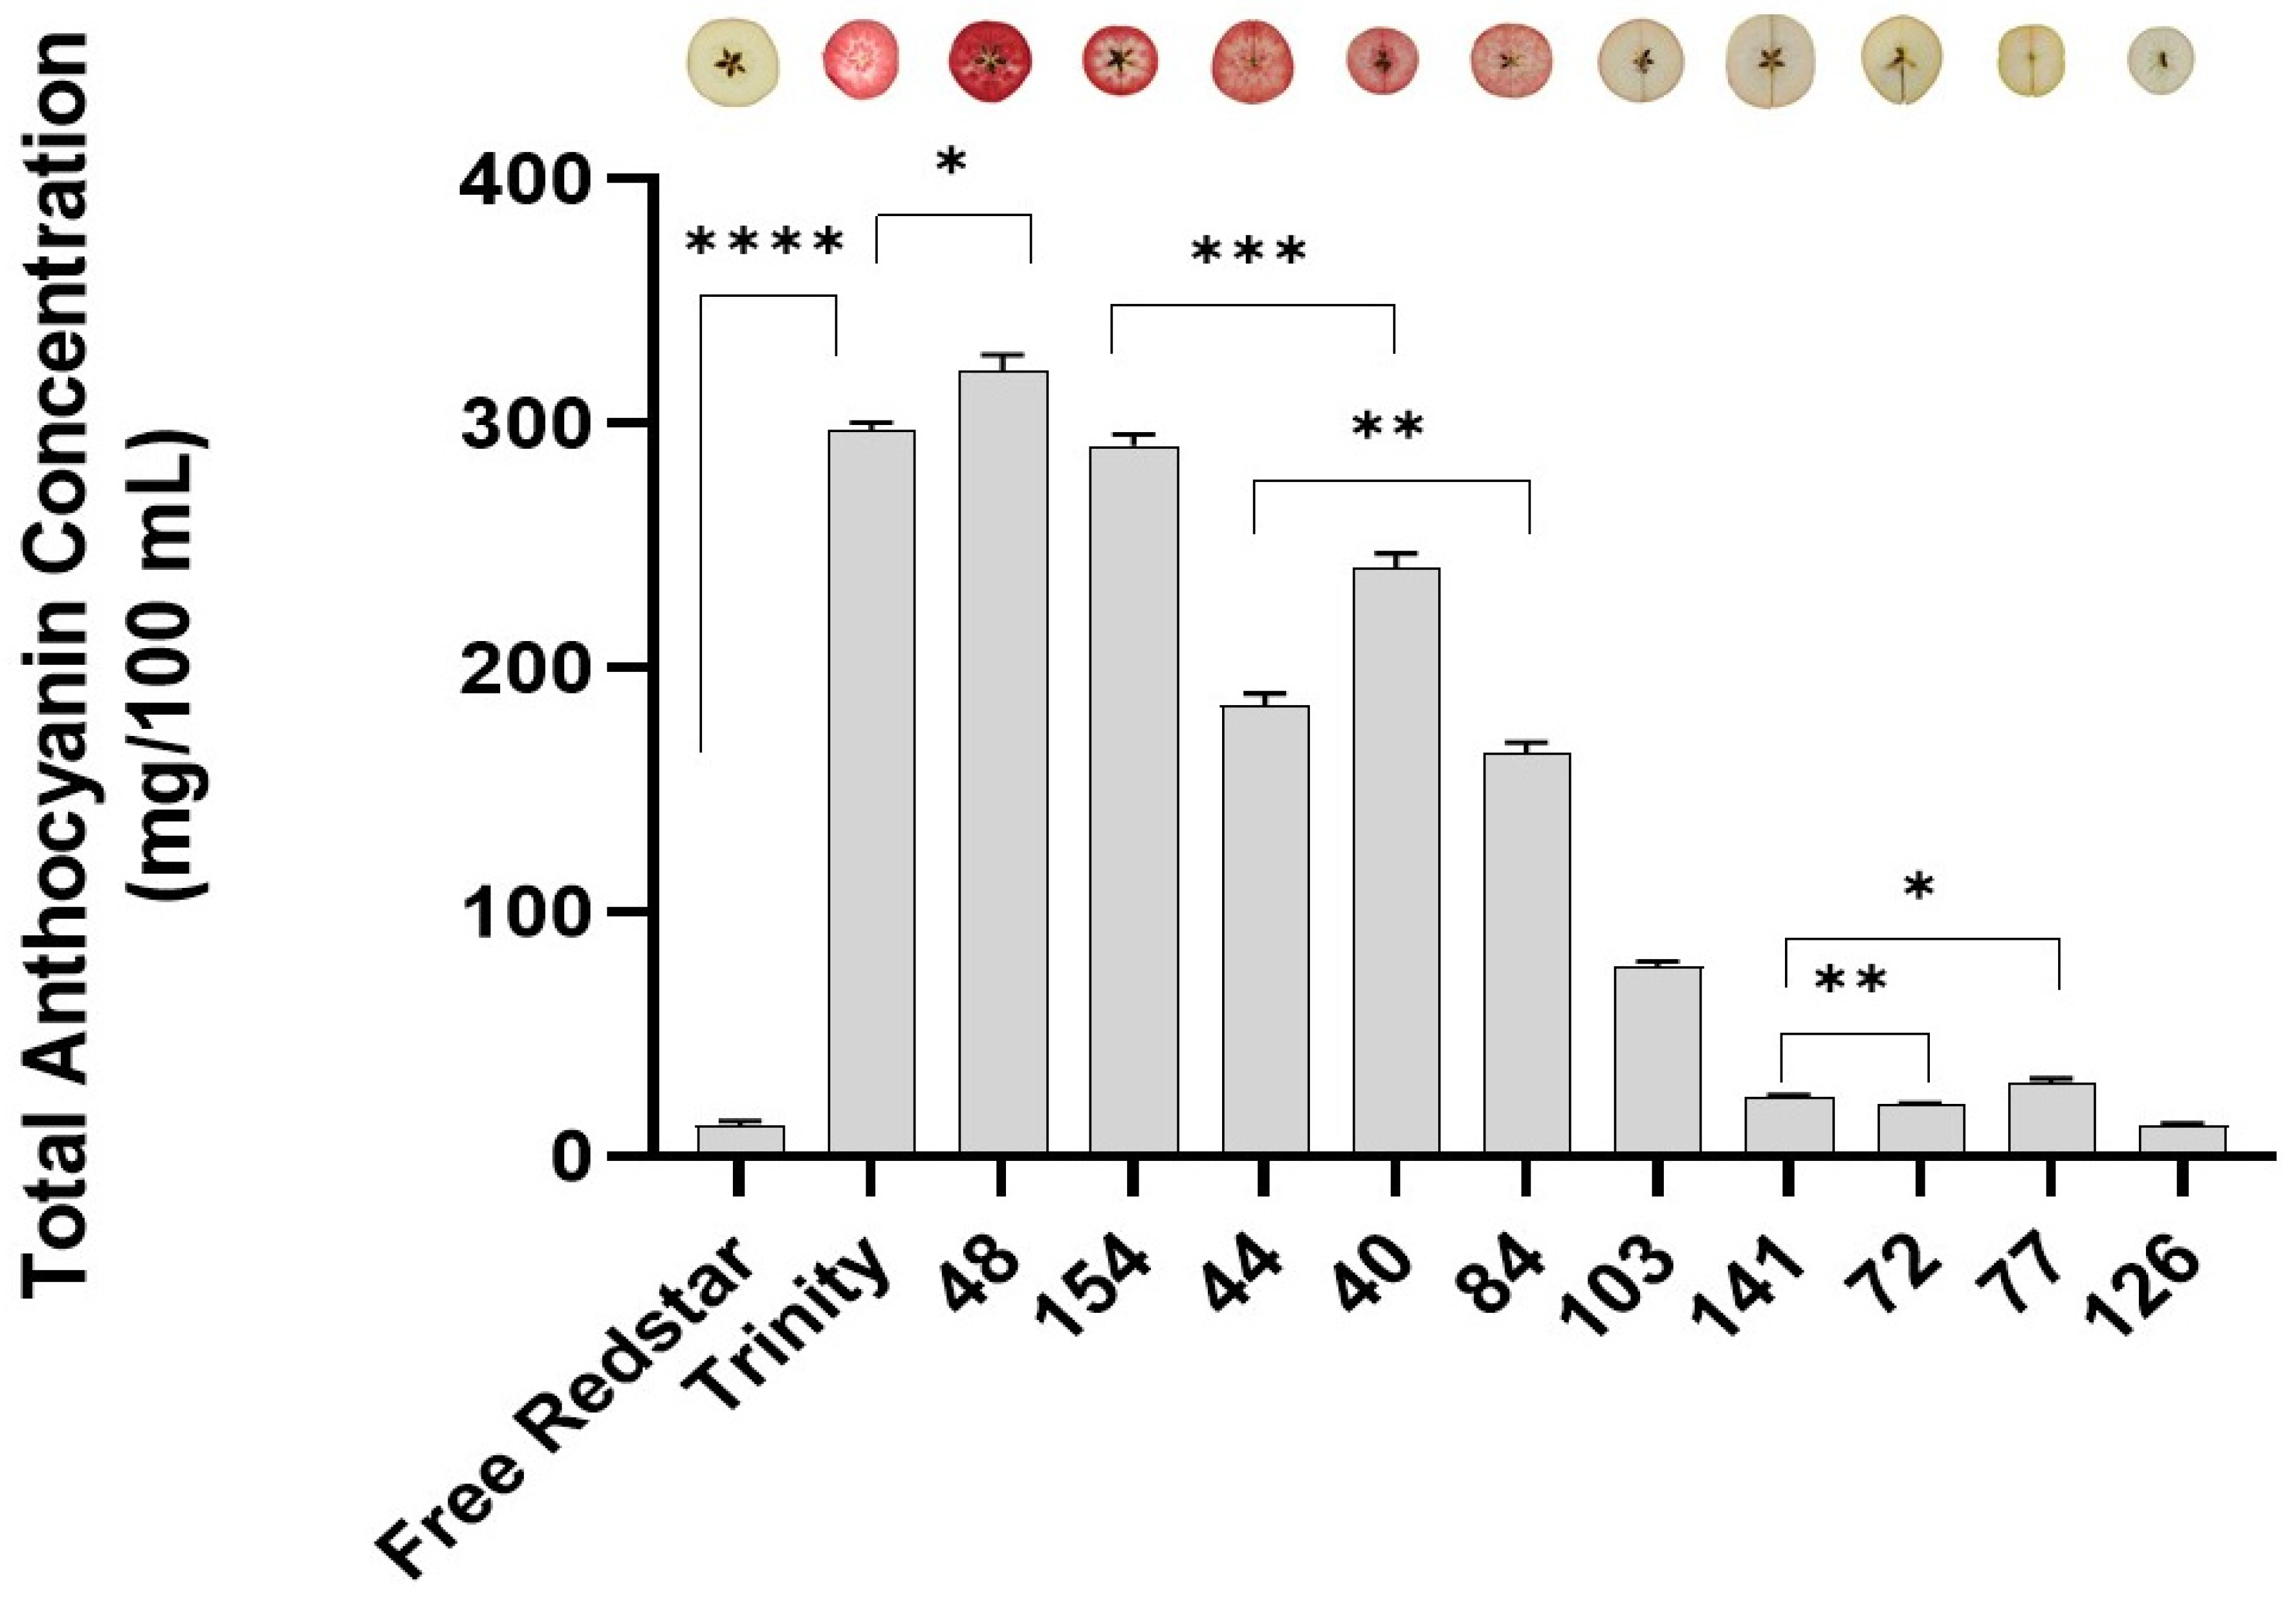
Figure 1. The total anthocyanin concentrations in the apple fruit flesh of parental and hybrid genotypes, evaluated spectrophotometrically and compared with regard to cyanidin-3-glucoside. The data are presented as the average anthocyanin concentrations with the standard error of the fruit mean (±SEM) compared to ‘Free Redstar’ white-fleshed fruit c. The t-test had significance levels of * p < 0.05, ** p < 0.01, *** p < 0.001 and **** p < 0.0001, recorded using GraphPad Prism 10.3.
Ijms 26 10987 g001
Figure 2. (a) Heat map correlation between ‘Free Redstar’ and ‘Trinity’; (b) phenotypical characteristics of total anthocyanin concentrations in white-fleshed ‘Free Redstar’ and red-fleshed ‘Trinity’ (**** p < 0.0001).
Ijms 26 10987 g002
Figure 3. Volcano plot distribution of annotated up-regulated and down-regulated DEGs.
Ijms 26 10987 g003
Figure 4. A bubble plot of the selected and most enriched KEGG pathways among DEGs; point size denotes gene count, color denotes the p-value and the x-axis denotes the gene ratio.
Ijms 26 10987 g004
Figure 5. The expression profiles of genes uncovered via NGS analysis and assigned to flavonoid biosynthesis. The data show the relative fold change in the number of transcripts of genes of interest calculated as the standard error of the mean in comparison to the reference gene 18sRNA. The data were normalized in accordance with the white-fleshed cv. ‘Free Redstar’ representing ratio 1, with the significance levels of * p < 0.05, ** p < 0.01,. The relative fold change in number of gene transcripts is designated by Y axis. (a) N3Dioxy: naringenin-3-dioxygenase; (b) LAR1: leucoanthocyanidin reductase; (c) F3Mo: flavonoid 3-monooxygenase.
Ijms 26 10987 g005
Figure 6. The expression profiles of genes uncovered via NGS analysis and assigned to cutin, suberine and wax synthesis. The data show the relative fold change in the number of transcripts of genes of interest calculated as the standard error of the mean in comparison to the reference gene 18sRNA. The data were normalized in accordance with the white-fleshed cv. ‘Free Redstar’ representing ratio 1, with significance levels of * p < 0.05, ** p < 0.01 and *** p < 0.001. The relative fold change in number of gene transcripts is designated by Y axis. (a) AlcFAred: alcohol-forming fatty acid acyl-CoA reductase; (b) CER1: aldehyde decarbonylase; (c) PalmTransf: omega-hydroxypalmitate O-feruloyl transferase; (d) CYP86A4: fatty acid hydrolase.
Ijms 26 10987 g006
Figure 7. The expression profiles of genes uncovered via NGS analysis and assigned to peroxisome and tropane piperidine and pyridine alkaloid biosynthesis. The data show the relative fold changes in the number of transcripts of genes of interest calculated as the standard error of the mean in comparison to the reference gene 18sRNA. The data were normalized in accordance with the white-fleshed cv. ‘Free Redstar’ representing ratio 1, with significance levels of * p < 0.05 and ** p < 0.01,. The relative fold change in number of gene transcripts is designated by Y axis. (a) CYP865B1: cytochrome P450 B1; (b) CytP450: cytochrome P450; (c) TropRed: tropione reductase.
Ijms 26 10987 g007
Figure 8. Expression profiling of structural genes involved in the biosynthesis of anthocyanins. The data show the relative fold changes in the number of transcripts of genes of interest calculated as the standard error of the mean in comparison to the reference gene 18sRNA. The data were normalized in accordance with the white-fleshed cv. ‘Free Redstar’ representing ratio 1, with significance levels of * p < 0.05, ** p < 0.01 and *** p < 0.001. The relative fold change in number of gene transcripts is designated by Y axis. (a) ANS: anthocyanidin synthase; (b) UFGT: flavonoid 3′-O-glucosyl transferase; (c) CHI: chalcone isomerase.
Ijms 26 10987 g008
Figure 9. A scheme of the interaction between metabolic pathways and cell organs assisting the regulation of anthocyanin accumulation in apple fruit flesh. N3Dioxy (naringenin 3-dioxygenase), LAR1 (leucoanthocyanidin reductase 1) and F3Mo (flavonoid 3-monooxygenase), AlcFARed (alcohol forming fatty acyl-CoA reductase), CER1 (very-long-chain aldehyde decarbonylase), PalmTransf (omega-hydroxypalmitate O-feruloyl transferase), CYP86A4 (fatty acid hydrolase activity), CYT865B1, CytP450 (flavoprotein reductase/oxygenase activity, from cytochrome P450) and TropRed (tropinone reductase gene). Descriptions of potential associations between the identified pathways: (A) Activation of anthocyanin biosynthetic genes and determining the red color of the flesh (mdm00940). (B) Activation of flavonoid pathway genes (mdm00941) and the deactivation of LAR1 (flavonoid reductase). (C) Activation of genes regulating VLCFA synthesis (mdm00073). (D) Activation of omega-hydroxypalmitate O-feruloyl transferase (mdm00073) and cutin formation. (E) Activation of cytochrome genes with flavonoid reductase activity—originating from the proxysome (mdm04146)—associated with the production of energy required to activate the anthocyanin and lipid synthesis pathways. (F) Deactivation of the red-ox reaction (mdm00960)—the probable effect of light on the anthocyanin degradation process—and the inhibition of the browning reaction related to anthocyanin accumulation. Red arrows indicate up regulation, blue–down regulation of genes in identified metabolic pathways.
Ijms 26 10987 g009
Table 1. The average anthocyanin concentrations measured for 10 apple fruits collected from each genotype. The standard error (SE) was calculated for ‘Free Redstar’.
CultivarAverage Anthocyanin ConcentrationSE Difference
Free Redstar9.482-
Trinity297.4723.078
48321.4036.681
154290.7234.779
44184.5565070
40241.0945.647
84164.8644643
10377.5862197
14124.4030.9361
7220.7971173
7729.9681.801
12612.4891.081
Table 2. A correlation matrix depicting the significance (t-test significance calculation levels of * p < 0.05, ** p < 0.01, *** p < 0.001, **** p < 0.0001) of variance calculated between analyzed genotypes on the basis of total anthocyanin accumulation in the fruit flesh of apples (GraphPad Prism 10.3). Stars in bold represent the lower significance, explaining bigger level of similarity in anthocyanin concentration between evaluated fruit samples.
Free RedstarTrinity481544440841031417277126
Free Redstar *****************************************
Trinity *ns********************************
48 ***********************************
154 *******************************
44 **************************
40 ************************
84 ********************
103 ****************
141 *******
72 *****
77 ****
Table 3. Oligo sequences developed in our study were used to evaluate the expression profiles of genes of interest.
Gen IDGene Acronym Used in This StudyGene FunctionOligo Sequence
3′5′
LOC103400025N3Dioxynaringenin 3-dioxygenaseggcttcatcgtgtccagtcagcctgctgctgtttgagttc
LOC103402727LAR1leucoanthocyanidin reductasegatgtggacagggctgatccagccatcgaagcactcatcc
LOC103403397CYP865B1cytochrome P450 86B1, flavoprotein reductase activitytagcagcctcttttgcgtcaatccgcaaactcgtccactt
LOC103422716Cyt450cytochrome P450 oxydase activitytagtggaggaattggcagggtggctctccaggacgtctta
LOC103428452CER1very-long-chain aldehyde decarbonylase CER1-likegacacttacctggggctacgcatctggcgattcctcctcc
LOC103437875F3Moflavonoid 3′-monooxygenasegttccccatcactctctggctcgaacctcttgtgcagctt
LOC103445140AlcFAredalcohol-forming fatty acyl-CoA reductaseagttatcatccgcccatccgtgtacagctctaccatgcgc
LOC103418919CYP86A4cytochrome P450, fatty acid hydrolase activitytcaagttactcaggccgctggagcaaccatcactcaccca
LOC103423436TropRedtropinone reductasecctaaccctattcggccaccggagtacgctagaaaccgct
LOC103404168PalmTransfomega-hydroxypalmitate O-feruloyl transferasecctcgaccaaaacattgcggatggaggagctgtcaatggc
Structural genes Kondo et al. [67]ANSanthocyanin synthasecaatttggcctcaaacacctgagcttcaacaccaagtgct
UFGTUDP:flavonoid 3-O-glycosyltransferasetccctttcactagccatgcaaggtggaggatggagtttttacc
CHIchalcone isomeraseattatctctgctgggtcagggaggagatggtcgaagga
Ref. [95] ACTINactin proteingactgtgaaactgcgaatggctcacatgaatcatcagagcaacgggca
Disclaimer/Publisher’s Note: The statements, opinions and data contained in all publications are solely those of the individual author(s) and contributor(s) and not of MDPI and/or the editor(s). MDPI and/or the editor(s) disclaim responsibility for any injury to people or property resulting from any ideas, methods, instructions or products referred to in the content.